
Characterizing Long Island’s Extreme Precipitation and Its Relationship to Tropical Cyclones


1
Department of Atmospheric, Oceanic, and Earth Sciences, George Mason University, Fairfax, VA 22030, USA
2
School of Marine and Atmospheric Sciences, Stony Brook University, Stony Brook, NY 11790, USA
*
Author to whom correspondence should be addressed.
Atmosphere 2022, 13(7), 1070; https://doi.org/10.3390/atmos13071070
Submission received: 18 May 2022
/
Revised: 14 June 2022
/
Accepted: 1 July 2022
/
Published: 6 July 2022
(This article belongs to the Special Issue Regional Changes in Landfalling Tropical Cyclones and Their Impacts)
Abstract
:Since extreme precipitation impacts society on small scales (i.e., a few kilometers and smaller, it is worthwhile to explore extreme precipitation trends in localized regions, such as Long Island (LI), New York. Its coastal location makes it vulnerable to various extreme events, such as tropical cyclones (TCs). This work aimed to quantify the extreme precipitation events on LI that are caused by TCs, as well as the percentage of TCs passing close to LI that cause extreme precipitation events. Both gauge-based and satellite-based precipitation datasets of varying resolutions (DAYMET, IMERG, and CPC) were used to understand the impact of dataset selection. Results are shown for the common time period of 2001–2020, as well as the full time periods of each dataset. DAYMET shows the highest percentage of extreme precipitation events linked to TCs for 2001–2020 (a maximum of 7.2%) and the highest number of TCs that caused extreme precipitation events (36.5%), with IMERG showing similar results. For the full and common time periods, the highest percentage of extreme precipitation events caused by TCs was found in eastern LI. TC-related extreme precipitation averaged over LI varied year to year, and amounts were dependent on the resolution of the observational dataset, but most datasets showed an increasing trend in the last 19 years that is larger than the trend in mean precipitation. Current infrastructure in the region is likely inadequately prepared for future impacts from TC-related extreme precipitation events in such a population-dense region.
1. Introduction
Extreme precipitation is a local-scale phenomena that can cause damaging impacts through flash flooding [1], mudslides, and polluted stormwater runoff [2]; therefore, it is important to understand how to predict extreme precipitation and how it will change in the future. As global atmospheric and sea surface temperatures (SSTs) rise, changes in frontal passages, extratropical cyclones, and tropical cyclones (TCs) inherently yield changes in mean and extreme precipitation patterns. In the United States, the greatest increase in mean precipitation occurred in the Northeast, which has increased by 8% since 1991 [3]. It is important to note that the Northeast is in the mid-latitude westerlies zone and experiences a continental climate, despite its proximity to the Atlantic Ocean [4]. Data from the Climate Research Unit indicates that regional warming trends for the coastal Northeast in summer and fall have been some of the highest across North America over the last 117 years. This study also indicates that rising surface air temperatures in the coastal Northeast can be attributed to SST increases in the Northwest Atlantic Shelf associated with a weakening Atlantic Meridional Overturning Circulation (AMOC), as well as atmospheric circulation changes from a positive North Atlantic Oscillation (NAO) [4]. This large-scale forcing motivates the need to understand how precipitation and the storm systems that produce precipitation in the Northeast are changing over time.
Unlike mean precipitation, extreme precipitation is not necessarily constrained by planetary energy budget requirements [5] but is driven by increasing atmospheric moisture [6] and region-specific circulation [7]. The Clausius–Clapeyron relationship provides the theoretical framework to quantify the sensitivity of precipitation extremes to surface warming with climate change. The Clausius–Clapeyron scaling estimates that atmospheric moisture will increase with surface warming at about 6–7% per °C of warming, and extreme precipitation, since it typically occurs in saturated atmospheric environments, is expected to increase at approximately this rate or even above this rate [8]. Observations show that the amount of intense precipitation from events at or above the 99th percentile increased by a statistically significant 71% from 1958 to 2007 in the Northeast, the largest increase in the U.S. [9]. This study also showed that the frequency of these 99th percentile precipitation events increased by 58% in the Northeast over the same period, also the largest increase in the U.S. It is worth noting that the majority of precipitation in the Northeast occurs as isolated 1-day events, whereas the most extreme precipitation occurs on a single day embedded in 2–5-day events, such as extratropical storms or tropical cyclone landfalls [10].
Previous studies have assigned Northeast extreme precipitation events to a variety of different weather systems. With extreme events defined as exceeding a 1- in 5-year occurrence for the years 1908–2009, frontal systems caused 47% of extreme precipitation events, with TCs at 36%, and extratropical cyclones (ETCs) at 16% [11]. Looking at meteorological fall, this study showed that TCs were responsible for 44% of extreme precipitation events, and in the month of September alone, a separate study found that TCs were responsible for 55% of extreme precipitation events (defined using the 99th percentile of daily precipitation) in the Northeast [10]. In an attempt to understand the 1996–2016 increase in Northeast extreme precipitation (relative to 1979–1995), results indicate that almost half (48%) of the post-1996 increase originated from TCs [12]. Previous studies also found significant correlations in the tropical Central and Eastern Pacific that would indicate La Nina events cause an anomalously high frequency of TCs impacting New York State [13]. In the context of global climate change, although there remains uncertainty as to how the number of TCs will change over time, practically all studies come to the consensus that their intensities will increase [14,15,16,17,18,19,20,21]. Using a Representative Concentration Pathway Scenario (RCP4.5), one specific study for the coastal Northeastern US found an increase in TC-related precipitation [22], with another study showing an increase in TC-related North Atlantic precipitation by 10–30% by the end of the century [15,23,24]. Pseudo-global warming simulations continue to show that extreme rainfall from TCs is already higher compared to if these storms had occurred under pre-industrial conditions and may intensify at greater rates than Clausius–Clapeyron scaling [24,25,26,27,28,29,30,31]. In a warming world, rain near the center of North Atlantic TCs is expected to increase as a result of slower translation speeds and storm decay [32,33]. With growing populations and infrastructure near the coast, these changes suggest worsening socioeconomic damage.
Focusing on a local scale within the Northeast, Long Island (LI) is an island located in the southeast region of New York and is one of the most densely populated regions of the U.S., with a population of 8.06 million people as of 2020 [34,35,36,37]. Studies have indicated that the proximity of coastal stations to open water, like across most of LI, can enhance the availability of water vapor and account for higher precipitation intensity at these stations [10]. Even stronger local increases in short-duration extreme rainfall intensities are attributed to convective cloud feedbacks; however, their exact role is unknown due to the local scales involved [25]. As part of the Northeast region, LI does experience TC-induced extreme precipitation events. TC-related flooding can cause billions of dollars in structural damage and is one of the deadliest aspects of TCs [38]. In the 50-year period of 1963–2012, although roughly only a quarter of deaths (27%) from TCs in the U.S. were related to rainfall-induced freshwater floods and mudslides, TCs caused the most rainfall-induced flood deaths compared to any other hazard [39]. In 2021, precipitation records were shattered throughout LI and the surrounding region, stemming from TC-related events. During Post-Tropical Depression Ida on 1 September 2021, rain fell at a rate of 3–5 inches per hour in many areas [40], with Central Park in New York City recording 3.15 inches in one hour, shattering the record set less than two weeks prior by Tropical Storm Henri of 1.94 inches in one hour [41]. In addition, the site’s one-hour rainfall, two-hour rainfall of 4.65 inches, and six-hour rainfall of 6.63 inches all qualified as 500-year storm events, indicating that they have a 0.2% chance of happening in any given year [40]. According to the National Weather Service, 1 September 2021 was the wettest day on record for LaGuardia Airport in Queens, NY, on LI, with a daily total of 6.80 inches [42]. On LI, Ida’s highest rainfall total of 9.09 inches in Glen Cove is greater than twice the area’s average monthly rainfall for September (4.12 inches) [43,44]. Impacts of these TC-induced extremes included dozens of streamgages reaching major flood stage and approaching their operational limits [40], flooded infrastructure, water rescues, and property damage. The fraction of total precipitation due to TCs for the East Coast of the U.S. is on average greater for extreme precipitation compared with annual or seasonal mean precipitation, highlighting the significance of TCs in the upper tail of precipitation distributions [45].
This work aimed to understand the relation of TCs to extreme precipitation events on LI and demonstrate the impact of observational dataset resolution on the mean and extreme precipitation spatial patterns and trends. This paper is organized into the following sections. Section 2 defines how extreme precipitation is calculated, introduces the observational precipitation datasets used for this work, and explains the methodology for relating TCs to extreme precipitation events on LI. Key results for all datasets are then discussed in Section 3. The results are summarized and compared to similar regional studies in Section 4.
2. Methodology
Considering the diversity of the world’s climate, it is difficult to choose a single definition for extreme precipitation [46]. Two common parameters for distinguishing between the various indices of extremes are how the precipitation distribution is defined and how far into the tails of the distribution the index threshold is found. Indices that characterize the far tails of the distribution are more commonly relevant to society compared with indices that characterize distribution frequency. The simple explanation is: the more extreme the event, the more likely it is to cause considerable environmental and societal damage. One common metric used to quantify extreme precipitation is the 95th percentile of the cumulative daily precipitation distribution [47], which was the definition used in this study. The 95th percentile metric has been used extensively in analysis of extreme events (e.g., [48,49,50,51]).
The four main metrics employed in this work included mean precipitation, extreme precipitation (defined as above the 95th percentile), a metric that relates extreme precipitation events to TCs and, inversely, TCs to extreme precipitation events. The domain of the study included the New York counties of Nassau, Suffolk, Queens, and Kings, which are the four counties that make up LI. It should be noted that although there appear to be gaps in precipitation coverage for parts of LI for certain datasets, this is simply a result of larger grid cells with a higher fraction of area over water or outside LI counties. All findings were explored for the common time period among the precipitation datasets of 2001–2020 as well as for the full dataset time periods (shown in the Supplemental Material). Since the purpose of this study was to highlight how the use of higher-resolution datasets is best for capturing extreme events, results provided in the original manuscript were not re-gridded. However, since comparisons between trends and precipitation amounts were made, all datasets were also re-gridded to the coarsest CPC grid using a bilinear interpolation method. All analysis was then repeated on the re-gridded datasets, and shown as supplemental material. To calculate annual mean precipitation, the daily precipitation was summed over each year (1 January through 31 December), and then the area-weighted average was calculated over the time and spatial dimensions. To calculate annual mean extremes, the 95th percentile of daily precipitation for each year was calculated at each grid point, and then averaged over the time dimension. The 95th percentile of daily precipitation was also averaged over the spatial dimension to obtain a time series of spatially averaged 95th-percentile precipitation on LI. All statistical significance was tested at the 95% confidence level using the Mann–Kendall test, which is a nonparametric form of monotonic trend regression analysis [52]. Note that while this study focused on the 95th-percentile events, the methodology can be extended to other extreme precipitation metrics as shown in Table S1 in the Supplemental Material.
To link TCs to these 95th-percentile events, a best-track dataset for TC trajectories in the North Atlantic was used to determine if a TC’s center point passed within a great circle distance of 5° from the center of LI (defined as 40.8° N, 73.1° W) on days with precipitation at or above the threshold of the 95th percentile. This event was then defined as being related to a TC. For each grid point, the total number of TC-related events was divided by the total number of 95th-percentile or above events over the same time period, which provided the percentage of 95th-percentile precipitation events related to TCs. A second method was also used for comparison, where TC tracks were separated into those that came within 5° of LI and caused a precipitation event at or above the 95th percentile, and those that came within 5° of LI that did not cause an extreme precipitation event. The number of TCs that did cause an extreme precipitation event was divided by the total numbers of TCs that passed within 5° of LI in the same time period, to find the percentage of TCs that caused extreme precipitation events.
The observational datasets used for this project are detailed below.
CPC (CPC Unified Gauge-Based Analysis of Daily Precipitation over CONUS): with a spatial resolution of 27.75 km by 27.75 km, the CPC-gauge-based dataset provides daily precipitation from 1948 to 2020. Measurement is accumulated to 12Z of the day, with temporal coverage of 1 January 1948 through 31 December 2006, with real-time (RT) analysis available after 2006 [53,54,55].
IMERG (Integrated Multi-satellitE Retrievals for GPM): IMERG Final Run is derived from the IMERG Final Half-Hourly product GPM_IMERGHH. This derived result is the final estimate of the daily accumulated precipitation. Final Run is a satellite-gauge product which is run ~3.5 months after the observational month, using both forward and backward morphing and including monthly gauge analyses to create a research-level product. IMERG Final Run has concluding calibration in which the multi-satellite half-hourly estimates are fixed such that they sum to the Final Run monthly satellite-gauge combination. IMERG is designed to intercalibrate, merge, and interpolate “all” satellite microwave precipitation estimates, together with microwave-calibrated infrared satellite estimates, and precipitation gauge analyses covering the years 2000–2021 at a spatial resolution of 10 km by 10 km. The daily accumulated data were used in this work [56].
DAYMET (Daily Surface Weather and Climatological Summaries): DAYMET uses observational data of daily maximum temperature, minimum temperature, and precipitation from ground-based meteorological stations to produce gridded estimates of weather conditions from 1980 to 2020. DAYMET has a spatial resolution of 1 km by 1 km and a daily temporal resolution [57].
HURDAT: the Atlantic Hurricane database (HURDAT2) determines the official assessment of each TC’s history using post-storm analysis of tropical cyclones by the National Hurricane Center from 1851 to 2020 [58].
3. Results
- (a)
- Mean Precipitation
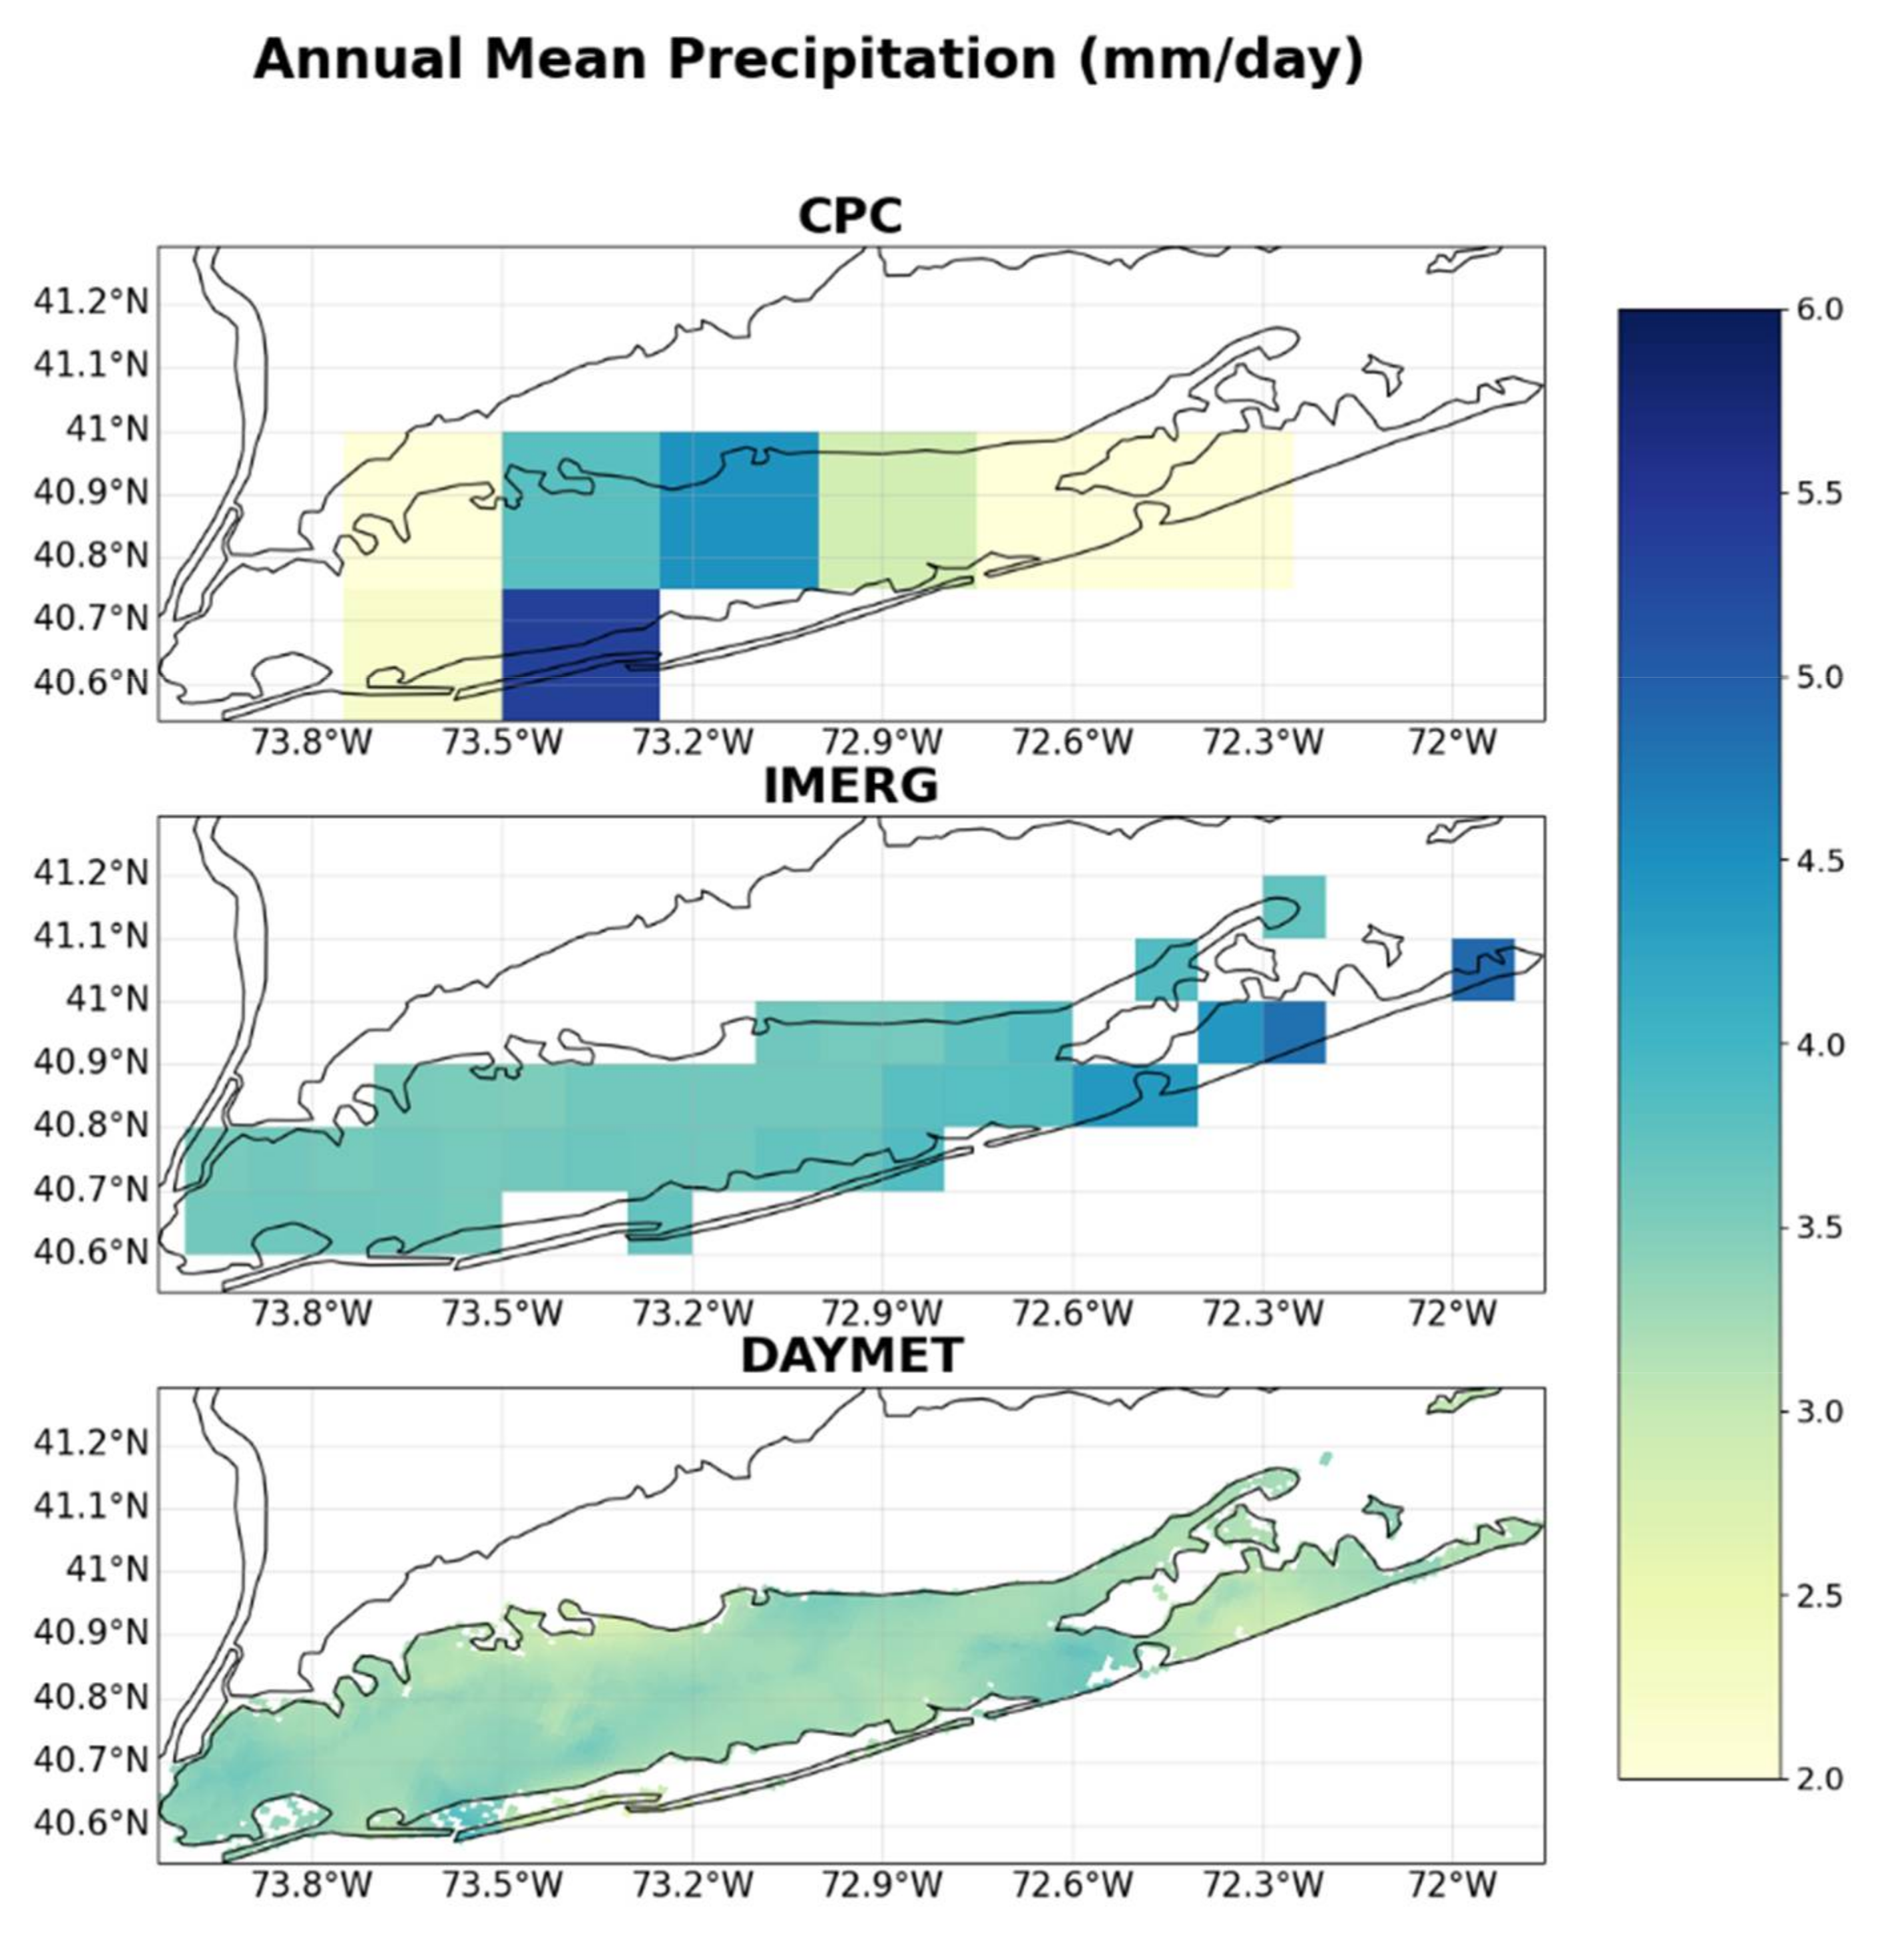
Figure 1 shows the annual average daily precipitation for 2001–2020 for all three precipitation datasets. Days that included no precipitation (i.e., 0 mm/day) were included in the calculations. CPC showed a maximum grid cell value of 5.3 mm/day and a mean grid cell value of 2.8 mm/day. Grid points outside of central LI had values of less than 2 mm/day, likely due to the coarse resolution. The finer resolution of IMERG showed spatially averaged daily precipitation of 3.8 mm/day, with higher values close to the maximum value of 4.9 mm/day on the South Fork of LI. DAYMET, the finest-resolution dataset, indicated a mean precipitation value of 3.3 mm/day, albeit with less spatial variability, across the Island. Figure S1 shows the mean precipitation fields plotted for the entire time period of each dataset, which show minimal differences compared with Figure 1. Figure S2 shows the same field plotted when all datasets were re-gridded to the coarser CPC resolution, with very similar results and patterns. The time evolution of spatially averaged precipitation using DAYMET had an increase of 0.001 mm/day per year for 2001–2020 and a 0.007 mm/day per year increase for the full time period of 1980–2020 (Figure S3). However, the trends for IMERG and CPC for 2001–2020 were decreasing at rates of −0.001 mm/day per year and −0.017 mm/day per year, respectively. Greater increasing trends were seen when the full time period was used for DAYMET and CPC, with CPC indicating a statistically significant increase of 0.010 mm/day per year at the 95% confidence interval using the Mann–Kendall test, which translates to a 0.73 mm/day increase over 73 years. All other trends for mean precipitation, including those for the common 2001–2020 time period, were not statistically significant at the 95% confidence interval. It is interesting to compare these trends when all data were first re-gridded to the coarser CPC grid spacing (Figure S4). The full time period trend for DAYMET remained quite similar; however, the trend for the common time period decreased to −0.002 mm/day per year. The decreasing trend observed in IMERG increased in magnitude to −0.005 mm/day per year. Both the DAYMET and IMERG trends remained non-statistically significant at the 95% confidence interval. From Figure 1 and Figures S1–S4, it is clear that at the local scale there was a greater impact from the dataset resolution than from the type of dataset (i.e., gauge-based versus satellite-based).
- (b)
- Extreme Precipitation
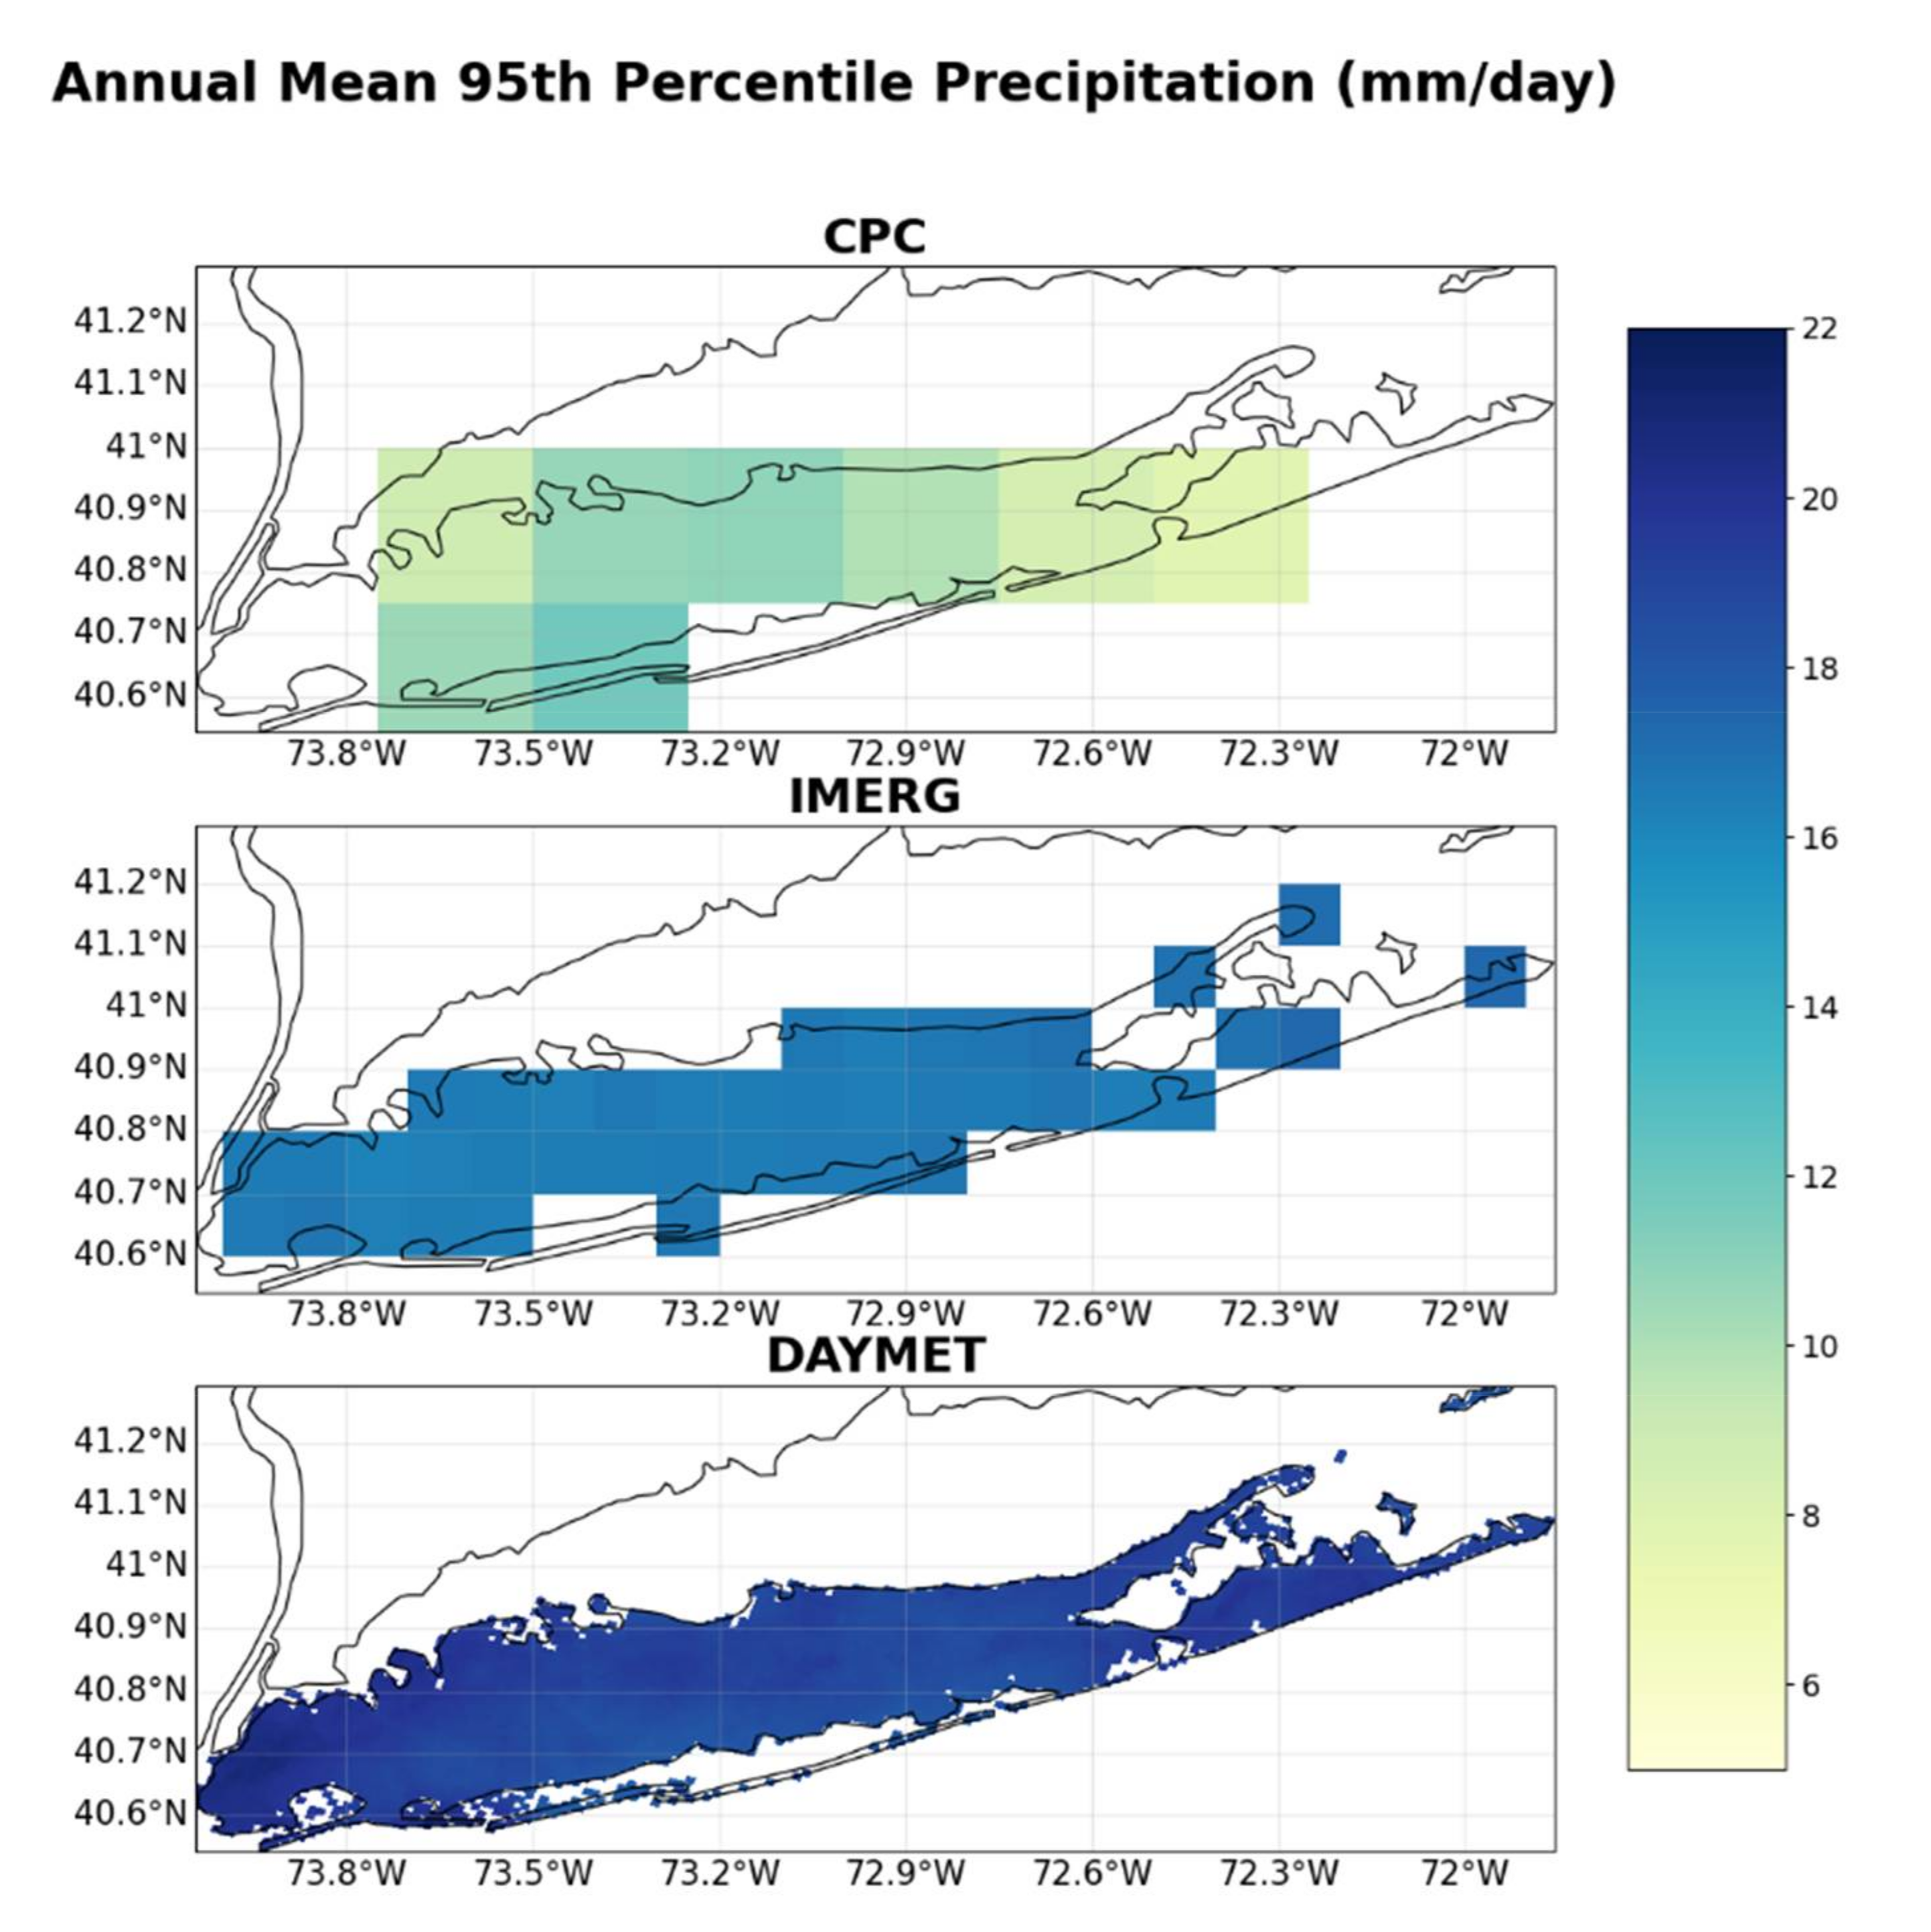
For annual mean 95th-percentile precipitation over LI for 2001–2020 (Figure 2), the patterns shown were in some cases different from the mean precipitation patterns in Figure 1. Figure 2 agrees with the expectation that the higher-resolution datasets will have higher extreme precipitation values [59,60]. The 95th-percentile precipitation for the low-resolution CPC dataset was much more spatially variable with values ranging from 5 to 12 mm/day and with higher values located in southwestern LI. The medium-resolution IMERG dataset showed much more homogeneity in values across LI, with a small range of 20–22 mm/day across LI grid points. The highest-resolution DAYMET dataset indicated a smaller range than CPC but a greater range than IMERG, with values ranging from 18 to 22 mm/day. Once again, very minimal differences were observed when the full time period was used for each dataset, as shown in Figure S5, as well as when results were re-gridded, as shown in Figure S6, and there was again more of an impact from the dataset resolution compared to the type of dataset at the LI local scale.
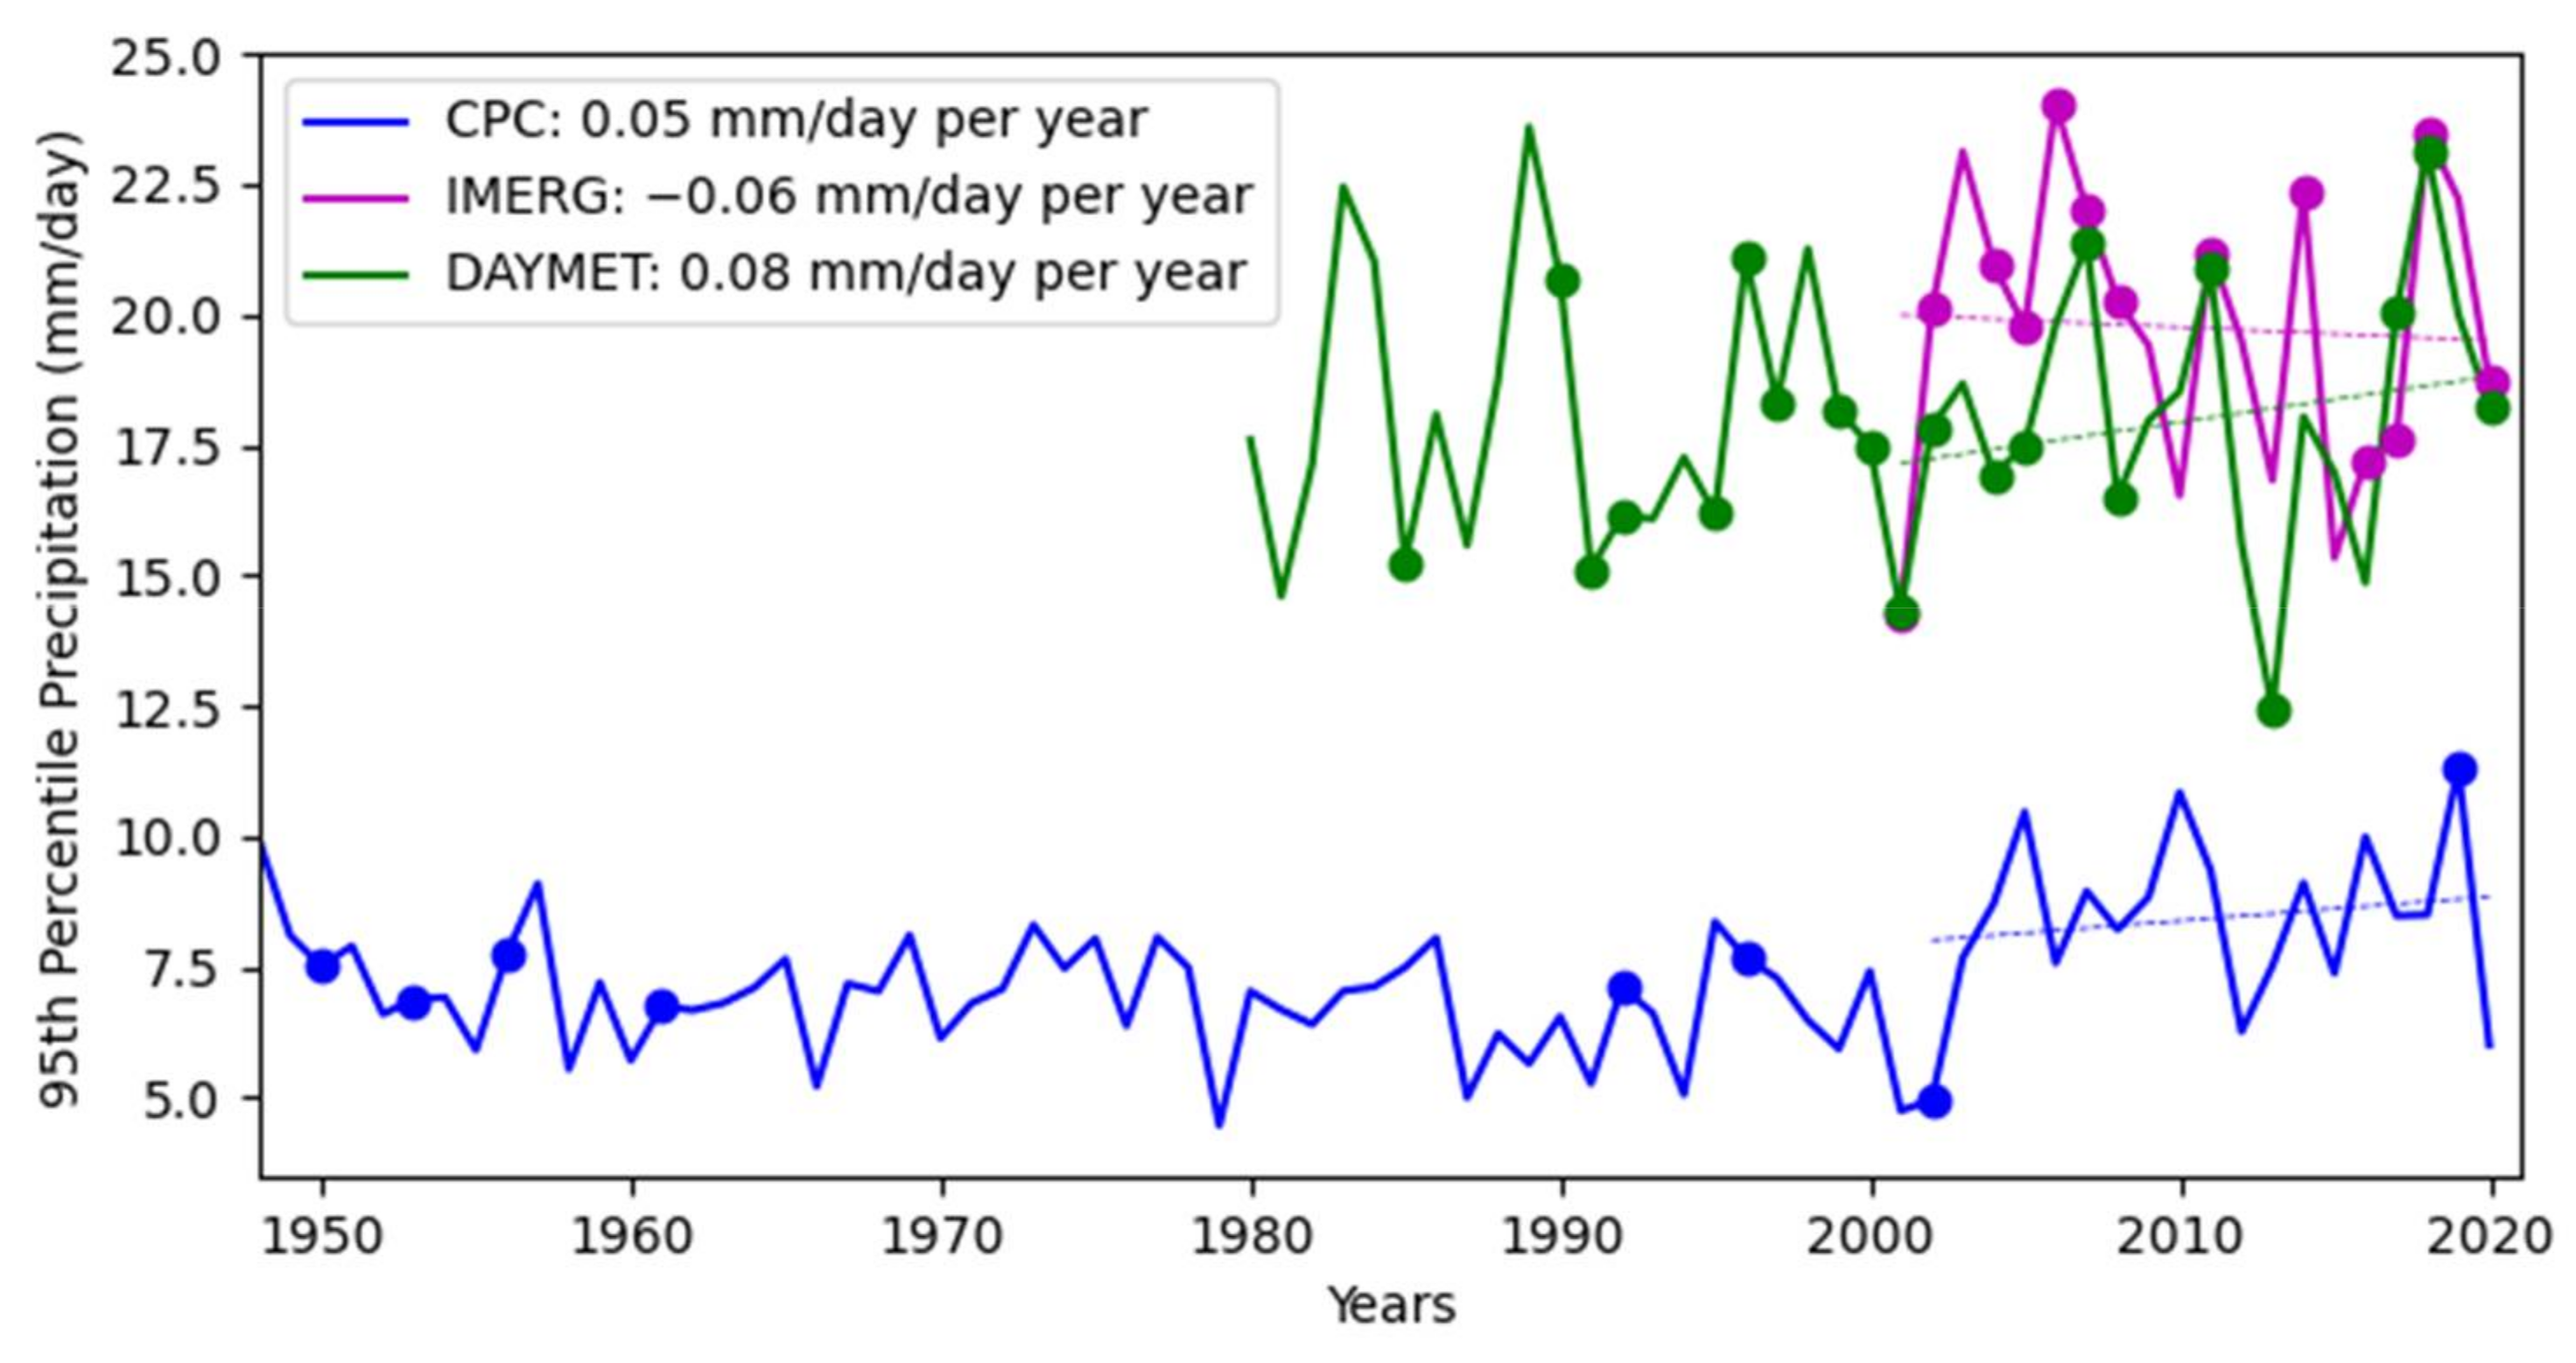
Next, the time evolution of 95th-percentile precipitation averaged over all grid points on LI is visualized (Figure 3). Some key takeaways from this time series are the increasing trends for both CPC (0.05 mm/day per year, or an increase of 0.95 mm/day in 19 years) and DAYMET (0.08 mm/day per year, or an increase of 1.52 mm/day in 19 years) for 2001–2020. IMERG, however, showed a decreasing trend over the same 19-year period of −0.06 mm/day per year (or a decrease of 1.14 mm/day in 19 years). The decreasing trend for IMERG appears to be a result of higher average 95th-percentile precipitation values found in the earlier portion of the time series, whereas calculations for DAYMET resulted in lower values for the same years. However, there were no statistically significant trends found across any of the datasets, likely owing, in part, to the short time frame investigated. When all datasets were re-gridded to the coarser CPC grid spacing in Figure S7, an increasing trend was still observed for DAYMET; however, a muted increase of 0.01 mm/day per year was observed from 2001 to 2020, with a very similar decreasing trend in IMERG of −0.07 mm/day per year. No statistical significance was found at the 95% confidence interval. A time series of 95th-percentile precipitation using the maximum magnitude of all grid cell values on LI, instead of the spatial average as in Figure 3 and Figure S7, was also explored (not shown). For 2001–2020, slight decreasing trends were found for CPC (−0.05 mm/day per year) and IMERG (−0.03 mm/day per year), with an increase trend for the highest-resolution DAYMET (0.17 mm/day per year). Though again, no trends were statistically significant at the 95% confidence interval using the Mann–Kendall test.
- (c)
- Relation of Extreme Precipitation on Long Island to TCs
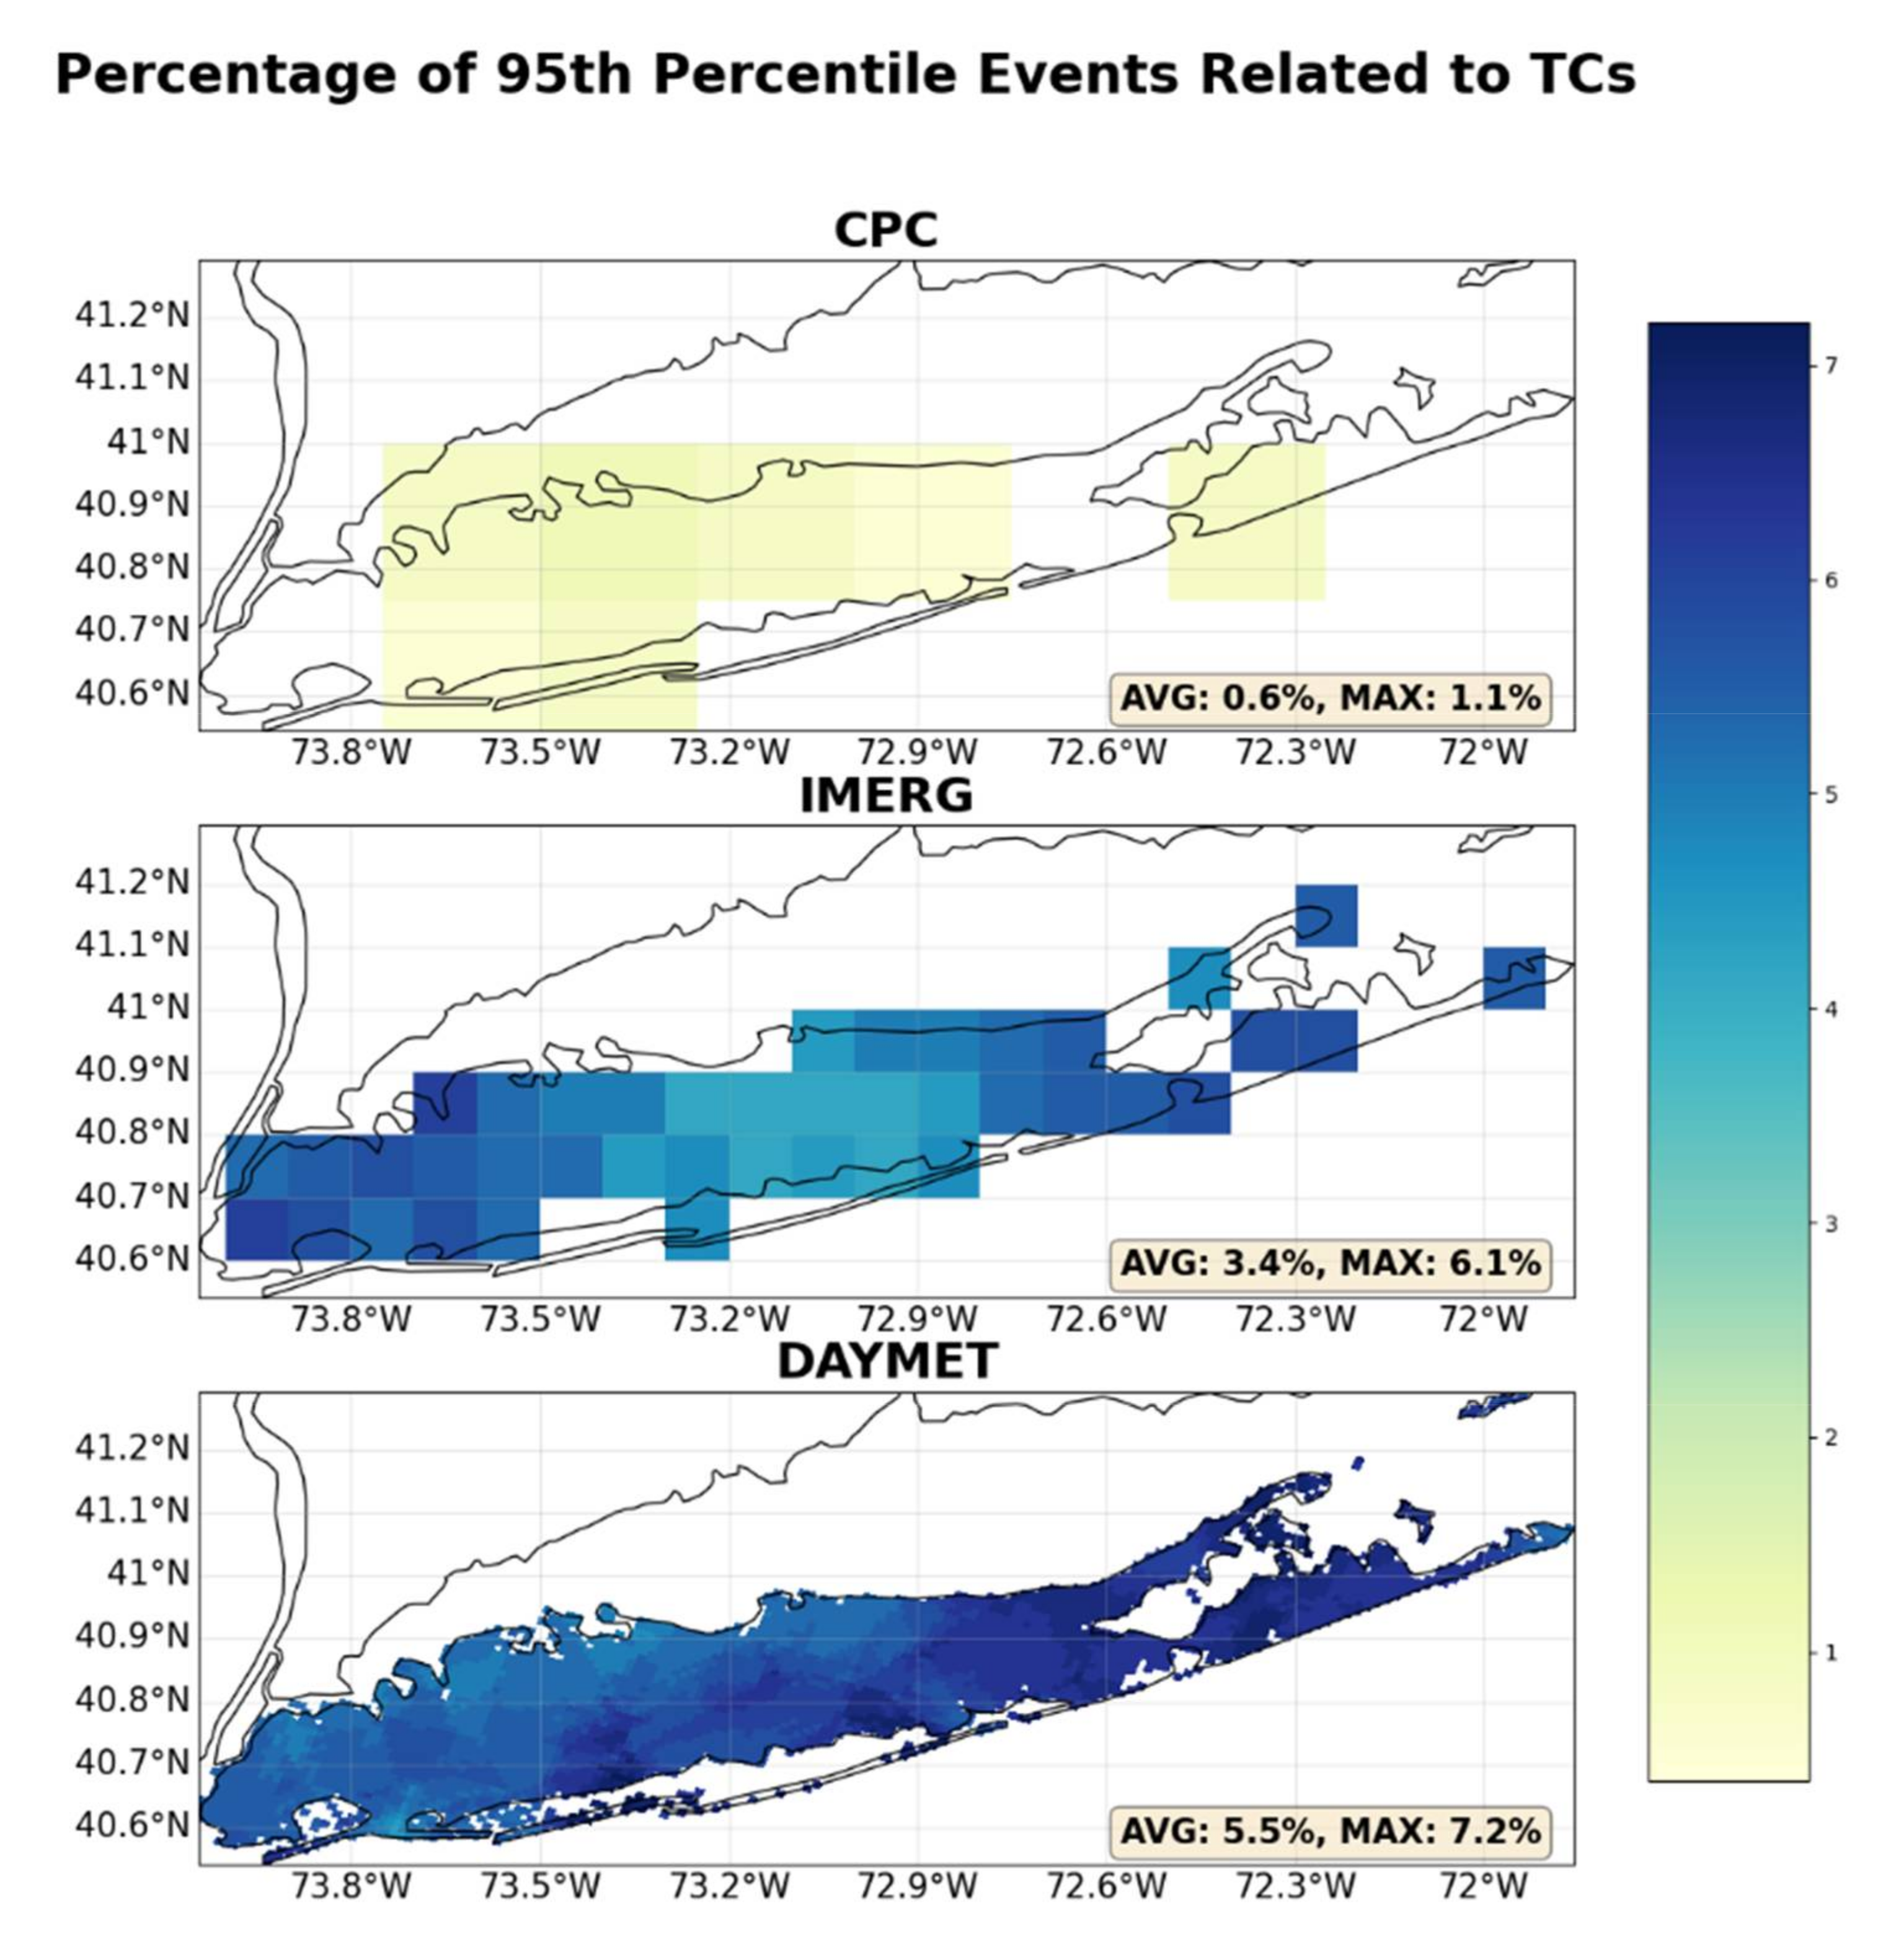
Figure 3, Figure 4 and Figure 5 shed light on the main motivation of this paper: quantifying how extreme precipitation events on LI are linked to TCs. The percentage of events at or above the 95th percentile that were related to TCs at each grid point are shown in Figure 4. The spatial average and spatial maximum values are denoted in the bottom right of each plot. For CPC, the percentages were the lowest overall and the most spatially homogeneous. IMERG and DAYMET were more similar in percentages, again demonstrating the impacts of higher resolution. For IMERG, the maximum value of 6.1% was located closer to New York City, and the spatial average was 3.4%. Higher percentages were also found in eastern LI, with the lowest values in central LI. DAYMET had maximum contributions from TCs in southwestern LI and eastern LI, with a maximum percentage of 7.2% and a spatial average of 5.5%. The local maximum in eastern LI is likely related to the recurving of TCs in this area, which is visualized in Figure 5. When all datasets were re-gridded to the CPC grid in Figure S8, it should be noted that the maximum percentages were identical, albeit with higher spatially averaged percentages. It is interesting to note that including the full time period of DAYMET (1980–2020) mutes many of the higher percentages found in the more recent common time period but still maintains the eastern LI maximum (Figure S9). This indicates that there was a higher percentage of 95th-percentile events due to TCs in the recent 19-year period, compared to the full 41 years. It would be of interest to look at any changes in translational speed and duration of these recurving TCs and how this may contribute to extreme precipitation. This point is further discussed in Section 4.
In Figure 3, dots were added to the time series on years in which at least one TC contributed to precipitation events at or above the 95th percentile. The detail that the higher-resolution datasets provide is evident, as both DAYMET and IMERG had much more frequent contributions to 95th-percentile events from TCs compared with CPC (Figure 3 and Figure 4). This pattern is best seen in the 1980–2000 period where most links to TCs in DAYMET were not observed in the CPC dataset (Figure 3). When all datasets were re-gridded to the CPC grid (Figure S7), the same pattern regarding frequency of dots was obtained, reinforcing this conclusion. Despite similar percentages overall, there do appear to be differences in which extreme precipitation events are identified as related to TCs; however, more work must be carried out to understand potential resolution sensitivities.
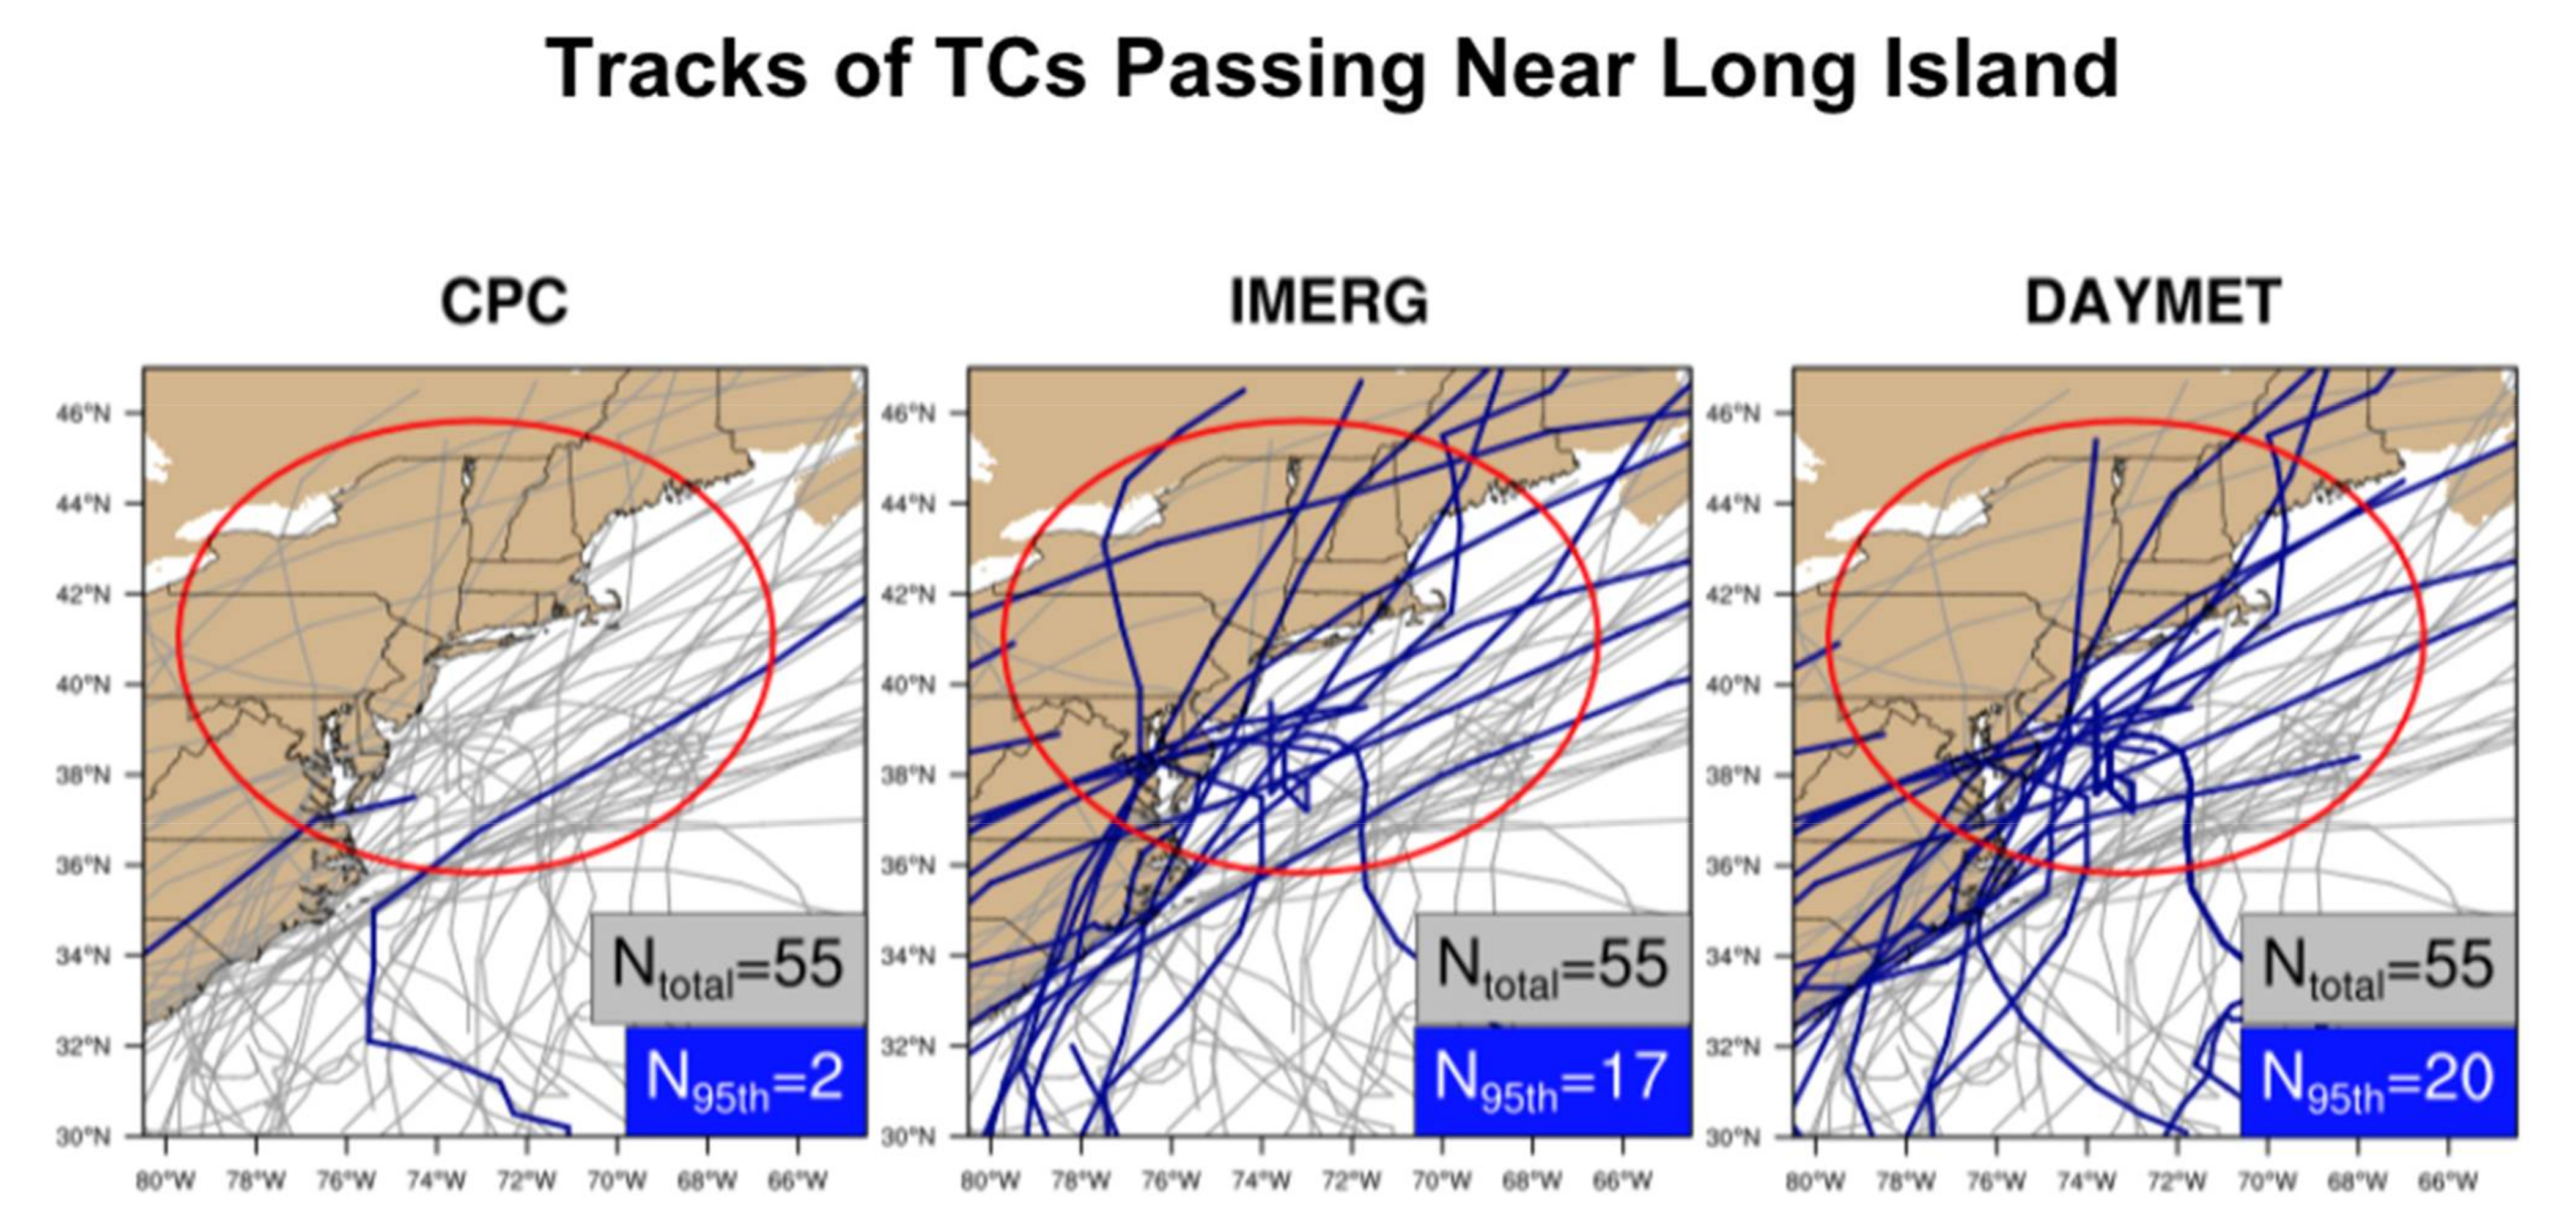
To gain more perspective on this relationship between extreme precipitation and TCs, calculations were inverted to determine the percentage of all TCs close to LI (using the 5° distance threshold) that resulted in a precipitation event at or above the spatially averaged 95th percentile. In Figure 5, all tracks of TCs that passed within this 5° distance are plotted in gray. Tracks plotted in blue indicate TCs that did contribute to a 95th-percentile event. The low-resolution CPC dataset showed only 3.6% of TCs caused a 95th-percentile event. However, the higher-resolution IMERG and DAYMET datasets had much more uniformity in their calculations, with 30.9% and 36.4% of TCs causing 95th-percentile events, respectively. When all datasets were re-gridded to the CPC grid, percentages and patterns remained similar, with 27.3% and 32.7% of TCs causing 95th-percentile events for IMERG and DAYMET, respectively (Figure S10). Although DAYMET overall had more TCs that contributed to 95th-percentile events (20 out of 55), there were a few TCs that contributed to 95th-percentile events according to IMERG that were not picked up in DAYMET (e.g., the track in central Pennsylvania and the Finger Lakes region of New York). When results were expanded to include the full dataset time periods (see Figure S11), more TCs that led to extreme precipitation events were found, but the percentages (5.2% and 34.7% for CPC and DAYMET, respectively) remained quite similar due to the related increase in TCs passing through the region.
4. Discussion and Conclusions
This paper explored the relationship between extreme precipitation and TCs for Long Island (LI), one of the most densely populated coastal regions in the U.S. Spatial analysis of annual mean daily precipitation for LI showed minimal differences for the common time period compared to the full dataset time period. DAYMET and IMERG had spatially averaged daily precipitation of 3.3 mm/day and 3.8 mm/day respectively, with CPC having a lower magnitude of 2.8 mm/day. Trends in spatially averaged mean precipitation for LI over time indicate mixed, non-statistically significant results depending on the dataset selection, as the highest-resolution DAYMET dataset indicated trends of 0.02 mm/day and 0.29 mm/day for the past 19 and 41 years, respectively (−0.04 mm/day and 0.33 mm/day for the same periods when re-gridded to the CPC grid). The only statistically significant trend found for LI was for the CPC dataset time period, with an increasing slope of 0.73 mm/day in 73 years. Anomalies of global mean precipitation had a trend over land of 0.03 mm/day per 100 years [61], so it is notable that mean precipitation trends calculated here over LI were larger.
Annual mean 95th-percentile precipitation for LI in the last 19 years had some noticeable differences depending on the dataset resolution. The highest-resolution dataset (DAYMET) had the highest values (20–22 mm/day) but the smallest range across LI, with IMERG having similar results (18–22 mm/day). The lowest-resolution dataset (CPC) had the lowest values (5–12 mm/day) but the highest range. Similar results and patterns were once again obtained after re-gridding to the coarsest CPC dataset spatial resolution. One conclusion of this analysis is that, at the LI local scale, the dataset resolution has more impact on spatial patterns compared to the dataset type (gauge-based or satellite based). This local-scale analysis also meets the expectation that higher-resolution datasets will contain higher extreme precipitation amounts, as found in previous studies [59,60]. Although the DAYMET dataset had the highest resolution, purely gauge-based datasets have their limitations. One study showed that merged analysis products (such as IMERG), using more than one satellite source and adjusted to rain gauges, are superior to single-source products [62]. Further, investigations into how spatially averaged 95th-percentile precipitation evolved over time for LI found mixed results; however, most datasets appeared to have an increasing trend in the last 19 years, higher than that for spatially averaged mean precipitation, with similar results obtained after re-gridding. However, no statistical significance was found for any of these trends.
In characterizing how extreme precipitation events on LI are related to TCs, the highest percentages of events at or above the 95th percentile related to TCs were found on the North Fork of eastern LI. We infer this is because recurving TCs are more likely to clip the east end of LI, where it juts out into the Atlantic Ocean. Since higher percentages were found for the last 19 years compared with the full dataset time periods, it can be concluded that the percentage of events at or above the 95th percentile due to TCs on LI are increasing over time. This is further visualized by the increase in the frequency of dots in the later time period in Figure 3. When calculations were flipped to determine the percentage of all TCs close to LI contributing to a 95th-percentile precipitation event (Figure 5), the general pattern continued, with the highest-resolution datasets indicating the highest percentages found. IMERG and DAYMET indicated that 30.9% and 36.4% of all TCs within 5° of LI contributed to an event at or above the 95th percentile (with 27.3% and 32.7% found, respectively for IMERG and DAYMET, after downscaling to the CPC grid in Figure S10).
This TC precipitation analysis for LI can be compared to previous studies performed for TCs in the Northeast. As mentioned in the Introduction, one study found that for extreme precipitation events in the Northeast from 1908 to 2009, about 36% were due to TCs [11]. However, a second study found that over 90% of extreme precipitation (using the 99th percentile of 6-hourly accumulated precipitation) in the midlatitudes was associated with fronts in the period 1979–2011 [63]. Another study showed that in the North Atlantic, 8% of extreme rainfall events were climatologically found to be accounted for by TCs from July to November for 1979–2005 [64]. The second and third study were found to be more consistent with the analysis performed in this work, since even the highest-resolution dataset found that at maximum, only 7.2% of extreme precipitation events on LI were due to TCs, with 92.8% originating from other sources. The results from the first study align better with this LI analysis when the metric for extreme precipitation is Rx1 day. When we repeated our analysis with the DAYMET dataset using a different extreme precipitation metric defined as the annual maximum 1-day precipitation, or Rx1 day, 36.8% of these events on LI were caused by TCs in the last 19 years, using the maximum of all data points (Table S1). When all LI grid cells were spatially averaged, our finding that 26.3% of Rx1 day events were caused by TCs also aligns with another recent study, who found that about 25% of the Rx1 day events for two stations on Long Island were TC-related for 1950–2011 [65]. Repeating analysis for Rx3 day and Rx5 day events (not shown) reduced contribution from TCs for DAYMET, which is likely a result of the relatively fast translation speeds of TCs as they combine with mid-latitude systems and transition to extratropical forms in the LI region. However, longer-duration TCs close to LI can contribute to more precipitation compared to shorter-duration TCs. It is also important to consider that LI is only a small portion of the Northeast region and therefore may have different storm-type contributions to precipitation than the Northeast as a whole.
For future work, it would be of great interest to take into consideration the antecedent soil moisture before these extreme events, since extreme flooding does not necessarily occur when the rarest precipitation extremes do, when land–atmospheric feedbacks are considered. A saturated ground greatly affects the observed flooding [25], as was the case with Post-Tropical Depression Ida. With precipitation intensity expected to increase with anthropogenic warming, proportionally more rainfall should be expected to convert to the flood hydrograph rather than being intercepted by vegetation or absorbed into soils and other catchment storages [25]. Another interesting avenue of exploration could be the impact of urbanization on flood intensity and size, as has been investigated in previous work for the Qinhuai River basin in China [66]. Some other extensions of this work include a different threshold metric, as it would be interesting to investigate how these results would change with lower or higher percentiles than the 95th. Invoking extreme value theory, a Generalized Pareto Distribution can be fit to these results to further characterize how extreme precipitation on LI is changing with time, as well as with other environmental factors such as ENSO and NAO [67,68]. With the important work being carried out to attribute wind speed and precipitation from TCs to climate change, it would be of great interest to apply this method to storms that have impacted LI. It has already been found through the hindcast attribution method that extreme rainfall was increased by about 5% in 2018′s Hurricane Florence [31], as well as by 8–18% for extreme 3 hourly rainfall amounts in 2019′s Hurricane Dorian [69]. Today’s infrastructure in many areas is designed to perform at a limit based on historical weather patterns [70]; however, with extreme precipitation events becoming more intense, and as shown in this study, found to be more related to TCs in the recent 19-year period on LI, a lot of the infrastructure is likely inadequately prepared for such changes. This is particularly a challenge for LI, which has an extremely high density of both people and infrastructure.
Supplementary Materials
The following supporting information can be downloaded at: https://www.mdpi.com/article/10.3390/atmos13071070/s1, Figure S1: Annual Mean Precipitation (mm/day); Figure S2: Annual Mean Precipitation (mm/day); Figure S3; Figure S4; Figure S5: Annual Mean 95th Percentile Precipitation (mm/day); Figure S6: Annual Mean 95th Percentile Precipitation (mm/day); Figure S7; Figure S8: Percentage of 95th Percentile Events Related to TCs; Figure S9: Percentage of 95th Percentile Events Related to TCs; Figure S10: Tracks of TCs passing Near Long Island; Figure S11: Tracks of TCs Passing Near Long Island; Table S1: Extreme Precipitation Events on Long Island, Caused by TCs
Author Contributions
Conceptualization, A.T.R. and K.A.R.; methodology, A.T.R., A.M.S. and K.A.R.; software, A.T.R. and A.M.S.; validation, A.T.R.; formal analysis, A.T.R.; investigation, A.T.R.; resources, A.T.R., A.M.S. and K.A.R.; data curation, A.T.R.; writing—original draft preparation, A.T.R.; writing—review and editing, A.T.R., A.M.S. and K.A.R.; visualization, A.T.R.; supervision, A.M.S. and K.A.R.; project administration, K.A.R.; funding acquisition, K.A.R. All authors have read and agreed to the published version of the manuscript.
Funding
This research was funded by the U.S. Department of Energy Office of Science, grant number DE-SC0016605, and National Aeronautics and Space Administration, grant number 80NSSC19K0717.
Institutional Review Board Statement
Not applicable.
Informed Consent Statement
Not applicable.
Data Availability Statement
The data for the precipitation datasets used in this study are available for download at the following links: CPC: https://psl.noaa.gov/data/gridded/data.unified.daily.conus.html (accessed on 1 June 2022). IMERG: https://gpm.nasa.gov/node/3328 (accessed on 1 June 2022). DAYMET: https://daac.ornl.gov/cgi-bin/dsviewer.pl?ds_id=1840 (accessed on 1 June 2022). The best-track TC database HURDAT can be found at this link: https://www.aoml.noaa.gov/hrd/hurdat/hurdat2.html (accessed on 1 June 2022). Any parties interested in the code used to generate figures and TC tracks should contact the authors.
Acknowledgments
The authors also acknowledge the Undergraduate Research and Creative Activities (URECA) at Stony Brook University.
Conflicts of Interest
The authors declare no conflict of interest.
References
- Moustakis, Y.; Papalexiou, S.M.; Onof, C.J.; Paschalis, A. Seasonality, Intensity, and Duration of Rainfall Extremes Change in a Warmer Climate. Earth’s Future 2021, 9, e2020EF001824. [Google Scholar] [CrossRef]
- Werbowski, L.M.; Gilbreath, A.N.; Munno, K.; Zhu, X.; Grbic, J.; Wu, T.; Sutton, R.; Sedlak, M.D.; Deshpande, A.D.; Rochman, C.M. Urban Stormwater Runoff: A Major Pathway for Anthropogenic Particles, Black Rubbery Fragments, and Other Types of Microplastics to Urban Receiving Waters. ACS EST Water 2021, 1, 1420–1428. [Google Scholar] [CrossRef]
- Walsh, J.; Wuebbles, D.; Hayhoe, K.; Kossin, J.; Kunkel, K.; Stephens, G.; Thorne, P.; Vose, R.; Wehner, M.; Willis, J.; et al. Ch. 2: Our Changing Climate. In Climate Change Impacts in the United States: The Third National Climate Assessment; Melillo, J.M., Richmond, T.C., Yohe, G.W., Eds.; U.S. Global Change Research Program Rep; Cambridge University Press: Cambridge, NY, USA, 2014; pp. 19–67. [Google Scholar] [CrossRef]
- Karmalkar, A.V.; Horton, R.M. Drivers of exceptional coastal warming in the northeastern United States. Nat. Clim. Chang. 2021, 11, 854–860. [Google Scholar] [CrossRef]
- Mitchell, J.F.B.; Wilson, C.A.; Cunnington, W.M. On Co2 climate sensitivity and model dependence of results. Q. J. R. Meteorol. Soc. 1987, 113, 293–322. [Google Scholar] [CrossRef]
- Trenberth, K.E. Conceptual Framework for Changes of Extremes of the Hydrological Cycle with Climate Change. Clim. Chang. 1999, 42, 327–339. [Google Scholar] [CrossRef]
- Pfahl, S.; O’Gorman, P.A.; Fischer, S.P.E.M. Understanding the regional pattern of projected future changes in extreme precipitation. Nat. Clim. Chang. 2017, 7, 423–427. [Google Scholar] [CrossRef]
- Martinkova, M.; Kysely, J. Overview of Observed Clausius-Clapeyron Scaling of Extreme Precipitation in Midlatitudes. Atmosphere 2020, 11, 786. [Google Scholar] [CrossRef]
- Howarth, M.E.; Thorncroft, C.D.; Bosart, L.F. Changes in Extreme Precipitation in the Northeast United States: 1979–2014. J. Hydrometeorol. 2019, 20, 673–689. Available online: https://journals.ametsoc.org/view/journals/hydr/20/4/jhm-d-18-0155_1.xml (accessed on 20 February 2022). [CrossRef]
- Agel, L.; Barlow, M.; Qian, J.-H.; Colby, F.; Douglas, E.; Eichler, T. Climatology of Daily Precipitation and Extreme Precipitation Events in the Northeast United States. J. Hydrometeorol. 2015, 16, 2537–2557. Available online: https://journals.ametsoc.org/view/journals/hydr/16/6/jhm-d-14-0147_1.xml (accessed on 14 April 2020). [CrossRef]
- Kunkel, K.E.; Easterling, D.R.; Kristovich, D.; Gleason, B.; Stoecker, L.; Smith, R. Meteorological Causes of the Secular Variations in Observed Extreme Precipitation Events for the Conterminous United States. J. Hydrometeorol. 2012, 13, 1131–1141. Available online: https://journals.ametsoc.org/view/journals/hydr/13/3/jhm-d-11-0108_1.xml (accessed on 16 June 2021). [CrossRef]
- Huang, H.; Winter, J.M.; Osterberg, E.C. Mechanisms of Abrupt Extreme Precipitation Change Over the Northeastern United States. J. Geophys. Res. Atmos. 2018, 123, 7179–7192. [Google Scholar] [CrossRef]
- Kim, H.-M.; Chang, E.K.M.; Zhang, M. Statistical–Dynamical Seasonal Forecast for Tropical Cyclones Affecting New York State. Weather Forecast. 2015, 30, 295–307. Available online: https://journals.ametsoc.org/view/journals/wefo/30/2/waf-d-14-00089_1.xml (accessed on 16 May 2022). [CrossRef]
- Bacmeister, J.T.; Reed, K.A.; Hannay, C.; Lawrence, P.; Bates, S.; Truesdale, J.E.; Rosenbloom, N.; Levy, M. Projected changes in tropical cyclone activity under future warming scenarios using a high-resolution climate model. Clim. Chang. 2016, 146, 547–560. [Google Scholar] [CrossRef]
- Gutmann, E.D.; Rasmussen, R.M.; Liu, C.; Ikeda, K.; Bruyere, C.L.; Done, J.M.; Garrè, L.; Friis-Hansen, P.; Veldore, V. Changes in Hurricanes from a 13-Yr Convection-Permitting Pseudo–Global Warming Simulation. J. Clim. 2018, 31, 3643–3657. [Google Scholar] [CrossRef]
- Kim, H.-S.; Vecchi, G.A.; Knutson, T.R.; Anderson, W.G.; Delworth, T.L.; Rosati, A.; Zeng, F.; Zhao, M. Tropical Cyclone Simulation and Response to CO2 Doubling in the GFDL CM2.5 High-Resolution Coupled Climate Model. J. Clim. 2014, 27, 8034–8054. [Google Scholar] [CrossRef]
- Knutson, T.R.; Sirutis, J.J.; Zhao, M.; Tuleya, R.E.; Bender, M.; Vecchi, G.; Villarini, G.; Chavas, D. Global Projections of Intense Tropical Cyclone Activity for the Late Twenty-First Century from Dynamical Downscaling of CMIP5/RCP4.5 Scenarios. J. Clim. 2015, 28, 7203–7224. [Google Scholar] [CrossRef] [Green Version]
- Wehner, M.; Prabhat; Reed, K.; Stone, D.; Collins, W.; Bacmeister, J. Resolution Dependence of Future Tropical Cyclone Projections of CAM5.1 in the U.S. CLIVAR Hurricane Working Group Idealized Configurations. J. Clim. 2015, 28, 3905–3925. [Google Scholar] [CrossRef]
- Bhatia, K.; Vecchi, G.; Murakami, H.; Underwood, S.; Kossin, J. Projected Response of Tropical Cyclone Intensity and Intensification in a Global Climate Model. J. Clim. 2018, 31, 8281–8303. [Google Scholar] [CrossRef]
- Emanuel, K.A. Downscaling CMIP5 climate models shows increased tropical cyclone activity over the 21st century. Proc. Natl. Acad. Sci. USA 2013, 110, 12219–12224. [Google Scholar] [CrossRef] [Green Version]
- Vecchi, G.A.; Delworth, T.L.; Murakami, H.; Underwood, S.D.; Wittenberg, A.T.; Zeng, F.; Zhang, W.; Baldwin, J.W.; Bhatia, K.T.; Cooke, W.; et al. Tropical cyclone sensitivities to CO2 doubling: Roles of atmospheric resolution, synoptic variability and background climate changes. Clim. Dyn. 2019, 53, 5999–6033. [Google Scholar] [CrossRef] [Green Version]
- Liu, M.; Vecchi, G.A.; Smith, J.A.; Murakami, H. Projection of Landfalling–Tropical Cyclone Rainfall in the Eastern United States under Anthropogenic Warming. J. Clim. 2018, 31, 7269–7286. [Google Scholar] [CrossRef]
- Knutson, T.R.; Sirutis, J.J.; Vecchi, G.A.; Garner, S.; Zhao, M.; Kim, H.-S.; Bender, M.; Tuleya, R.E.; Held, I.M.; Villarini, G. Dynamical Downscaling Projections of Twenty-First-Century Atlantic Hurricane Activity: CMIP3 and CMIP5 Model-Based Scenarios. J. Clim. 2013, 26, 6591–6617. [Google Scholar] [CrossRef]
- Patricola, C.M.; Wehner, M.F. Anthropogenic influences on major tropical cyclone events. Nature 2018, 563, 339–346. [Google Scholar] [CrossRef] [Green Version]
- Fowler, H.J.; Lenderink, G.; Prein, A.F.; Westra, S.; Allan, R.P.; Ban, N.; Barbero, R.; Berg, P.; Blenkinsop, S.; Do, H.X.; et al. Anthropogenic intensification of short-duration rainfall extremes. Nat. Rev. Earth Environ. 2021, 2, 107–122. [Google Scholar] [CrossRef]
- van Oldenborgh, G.J.; van der Wiel, K.; Sebastian, A.; Singh, R.; Arrighi, J.; Otto, F.; Haustein, K.; Li, S.; Vecchi, G.; Cullen, H. Attribution of extreme rainfall from Hurricane Harvey, August 2017. Environ. Res. Lett. 2017, 12, 124009. [Google Scholar] [CrossRef]
- Risser, M.D.; Wehner, M.F. Attributable Human-Induced Changes in the Likelihood and Magnitude of the Observed Extreme Precipitation during Hurricane Harvey. Geophys. Res. Lett. 2017, 44, 12457–12464. [Google Scholar] [CrossRef] [Green Version]
- Emanuel, K. Assessing the present and future probability of Hurricane Harvey’s rainfall. Proc. Natl. Acad. Sci. USA 2017, 114, 12681–12684. [Google Scholar] [CrossRef] [Green Version]
- Wang, S.-Y.S.; Zhao, L.; Yoon, J.-H.; Klotzbach, P.; Gillies, R.R. Quantitative attribution of climate effects on Hurricane Harvey’s extreme rainfall in Texas. Environ. Res. Lett. 2018, 13, 054014. [Google Scholar] [CrossRef]
- Trenberth, K.E.; Cheng, L.; Jacobs, P.; Zhang, Y.; Fasullo, J. Hurricane Harvey Links to Ocean Heat Content and Climate Change Adaptation. Earth’s Future 2018, 6, 730–744. [Google Scholar] [CrossRef]
- Reed, K.A.; Stansfield, A.M.; Wehner, M.F.; Zarzycki, C.M. Forecasted attribution of the human influence on Hurricane Florence. Sci. Adv. 2020, 6, eaaw9253. [Google Scholar] [CrossRef] [Green Version]
- Kossin, J.P. A global slowdown of tropical-cyclone translation speed. Nature 2018, 558, 104–107. [Google Scholar] [CrossRef] [PubMed]
- Hall, T.M.; Kossin, J.P. Hurricane stalling along the North American coast and implications for rainfall. NPJ Clim. Atmos. Sci. 2019, 2, 17. [Google Scholar] [CrossRef]
- United States Census Bureau. Suffolk County, New York. Available online: https://data.census.gov/cedsci/profile?g=0500000US36103 (accessed on 2 March 2022).
- United States Census Bureau. Nassau County, New York. Available online: https://data.census.gov/cedsci/profile?g=0500000US36059 (accessed on 2 March 2022).
- United States Census Bureau. Queens County, New York. Available online: https://data.census.gov/cedsci/profile?g=0500000US36081 (accessed on 2 March 2022).
- United States Census Bureau. Kings County, New York. Available online: https://data.census.gov/cedsci/profile?g=0500000US36047 (accessed on 2 March 2022).
- Maxwell, J.T.; Bregy, J.C.; Robeson, S.M.; Knapp, P.A.; Soulé, P.T.; Trouet, V. Recent increases in tropical cyclone precipitation extremes over the US east coast. Proc. Natl. Acad. Sci. USA 2021, 118, e2105636118. [Google Scholar] [CrossRef]
- Rappaport, E.N. Fatalities in the United States from Atlantic Tropical Cyclones: New Data and Interpretation. Bull. Am. Meteorol. Soc. 2014, 95, 341–346. Available online: https://journals.ametsoc.org/view/journals/bams/95/3/bams-d-12-00074.1.xml (accessed on 18 December 2021). [CrossRef]
- Historic Tropical Depression Ida. Northeast Regional Climate Center. Web. 2021. Available online: https://www.nrcc.cornell.edu/services/blog/2021/09/03/index.html (accessed on 7 September 2021).
- US Department of Commerce; NOAA; NESDIS. Record of Climatological Observations: NY CITY CENTRAL PARK, NY US USW00094728. National Centers for Environmental Information (NCEI). Available online: https://www.ncei.noaa.gov/access/homr/#ncdcstnid=20019453&tab=MSHR (accessed on 17 May 2022).
- US Department of Commerce; NOAA; NESDIS. Record of Climatological Observations: LaGuardia Airport, NY US USW00014732. National Centers for Environmental Information (NCEI). Available online: https://www.ncei.noaa.gov/access/homr/#ncdcstnid=20019451&tab=MSHR (accessed on 3 January 2022).
- US Department of Commerce; NOAA; National Weather Service. Final Ida Storm Total Rainfall; Public Information Statement, National Weather Service: New York, NY, USA, 2022. Available online: https://nwschat.weather.gov/p.php?pid=202109031510-KOKX-NOUS41-PNSOKX (accessed on 4 January 2022).
- National Centers for Environmental Information (NCEI) and Regional Climate Centers. Monthly Climate Normals (1991–2020)-Syosett, NY. NOWData-NOAA Online Weather Data. Available online: https://www.weather.gov/wrh/Climate?wfo=okx (accessed on 3 January 2022).
- Khouakhi, A.; Villarini, G.; Vecchi, G. Contribution of Tropical Cyclones to Rainfall at the Global Scale. J. Clim. 2017, 30, 359–372. [Google Scholar] [CrossRef]
- Pendergrass, A.G. What precipitation is extreme? Science 2018, 360, 1072–1073. [Google Scholar] [CrossRef] [PubMed]
- Zhang, X.; Alexander, L.; Hegerl, G.C.; Jones, P.; Tank, A.K.; Peterson, T.C.; Trewin, B.; Zwiers, F.W. Indices for monitoring changes in extremes based on daily temperature and precipitation data. Wires Clim. Chang. 2011, 2, 851–870. [Google Scholar] [CrossRef]
- Singh, D.; Tsiang, M.; Rajaratnam, B.; Diffenbaugh, N.S. Precipitation extremes over the continental United States in a transient, high-resolution, ensemble climate model experiment. J. Geophys. Res. Atmos. 2013, 118, 7063–7086. [Google Scholar] [CrossRef]
- Krishnamurthy, V.; Stan, C. Prediction of extreme events in precipitation and temperature over CONUS during boreal summer in the UFS coupled model. Clim. Dyn. 2022, 59, 109–125. [Google Scholar] [CrossRef]
- Sharma, K.K.; Verdon-Kidd, D.C.; Magee, A.D. A decision tree approach to identify predictors of extreme rainfall events—A case study for the Fiji Islands. Weather Clim. Extrem. 2021, 34, 100405. [Google Scholar] [CrossRef]
- Schär, C.; Ban, N.; Fischer, E.M.; Rajczak, J.; Schmidli, J.; Frei, C.; Giorgi, F.; Karl, T.R.; Kendon, E.J.; Tank, A.M.G.K.; et al. Percentile indices for assessing changes in heavy precipitation events. Clim. Chang. 2016, 137, 201–216. [Google Scholar] [CrossRef] [Green Version]
- Meals, D.W.; Spooner, J.; Dressing, S.A.; Harcum, J.B. Statistical analysis for monotonic trends, Tech Notes 6, November 2011. Developed for U.S. Environmental Protection Agency by Tetra Tech, Inc., Fairfax, VA. 2011; p. 23. Available online: https://www.epa.gov/polluted-runoff-nonpoint-source-pollution/nonpoint-source-monitoringtechnical-notes (accessed on 5 March 2021).
- Xie, P.; Chen, M.; Yang, S.; Yatagai, A.; Hayasaka, T.; Fukushima, Y.; Liu, C. A Gauge-Based Analysis of Daily Precipitation over East Asia. J. Hydrometeorol. 2007, 8, 607–626. [Google Scholar] [CrossRef]
- Chen, M.; Shi, W.; Xie, P.; Silva, V.B.S.; Kousky, V.E.; Higgins, R.W.; Janowiak, J.E. Assessing objective techniques for gauge-based analyses of global daily precipitation. J. Geophys. Res. Earth Surf. 2008, 113, D04110. [Google Scholar] [CrossRef]
- Chen, M.; Xie, P. CPC Unified Gauge-based Analysis of Global Daily Precipiation. In Proceedings of the Western Pacific Geophysics Meeting, Cairns, Australia, 29 July–1 August 2008. [Google Scholar]
- Huffman, G.J.; Stocker, E.F.; Bolvin, D.T.; Nelkin, E.J.; Tan, J. GPM IMERG Final Precipitation L3 1 Day 0.1 Degree × 0.1 Degree V06, Edited by Andrey Savtchenko; Goddard Earth Sciences Data and Information Services Center (GES DISC): Greenbelt, MD, USA, 2019. [Google Scholar] [CrossRef]
- Thornton, M.M.; Shrestha, R.; Wei, Y.; Thornton, P.E.; Kao, S.; Wilson, B.E. Daymet: Daily Surface Weather Data on a 1-km Grid for North America; Version 4; ORNL DAAC: Oak Ridge, TN, USA, 2020. [Google Scholar] [CrossRef]
- Landsea, C.; Franklin, J.; Beven, J. The Revised Atlantic Hurricane Database (HURDAT2). National Hurricane Center (NHC). May 2015. Web. Available online: https://www.nhc.noaa.gov/data/hurdat/hurdat2-format-atlantic.pdf (accessed on 2 February 2021).
- Wehner, M.F.; Reed, K.A.; Li, F.; Prabhat; Bacmeister, J.; Chen, C.-T.; Paciorek, C.; Gleckler, P.J.; Sperber, K.R.; Collins, W.D.; et al. The effect of horizontal resolution on simulation quality in the Community Atmospheric Model, CAM5.1. J. Adv. Model. Earth Syst. 2014, 6, 980–997. [Google Scholar] [CrossRef]
- Bador, M.; Boé, J.; Terray, L.; Alexander, L.V.; Baker, A.; Bellucci, A.; Haarsma, R.; Koenigk, T.; Moine, M.-P.; Lohmann, K.; et al. Impact of Higher Spatial Atmospheric Resolution on Precipitation Extremes Over Land in Global Climate Models. J. Geophys. Res. Atmos. 2020, 125, e2019JD032184. [Google Scholar] [CrossRef]
- Ren, L.; Arkin, P.; Smith, T.M.; Shen, S.S. Global precipitation trends in 1900-2005 from a reconstruction and coupled model simulations. J. Geophys. Res. Atmos. 2013, 118, 1679–1689. [Google Scholar] [CrossRef]
- Adler, R.F.; Kidd, C.; Petty, G.W.; Morissey, M.; Goodman, H.M. Intercomparison of Global Precipitation Products: The Third Precipitation Intercomparison Project (PIP–3). Bull. Am. Meteorol. Soc. 2001, 82, 1377–1396. [Google Scholar] [CrossRef]
- Catto, J.L.; Pfahl, S. The importance of fronts for extreme precipitation. J. Geophys. Res. Atmos. 2013, 118, 10791–10801. [Google Scholar] [CrossRef] [Green Version]
- Lau, K.-M.; Zhou, Y.P.; Wu, H.-T. Have tropical cyclones been feeding more extreme rainfall? J. Geophys. Res. Earth Surf. 2008, 113, D23113. [Google Scholar] [CrossRef] [Green Version]
- Dhakal, N. Changing Impacts of North Atlantic Tropical Cyclones on Extreme Precipitation Distribution across the Mid-Atlantic United States. Geosciences 2019, 9, 207. [Google Scholar] [CrossRef] [Green Version]
- Du, J.; Qian, L.; Rui, H.; Zuo, T.; Zheng, D.; Xu, Y.; Xu, C.-Y. Assessing the effects of urbanization on annual runoff and flood events using an integrated hydrological modeling system for Qinhuai River basin, China. J. Hydrol. 2012, 464–465, 127–139. [Google Scholar] [CrossRef]
- Dong, Q.; Chen, X.; Chen, T. Characteristics and Changes of Extreme Precipitation in the Yellow–Huaihe and Yangtze–Huaihe Rivers Basins, China. J. Clim. 2011, 24, 3781–3795. Available online: https://journals.ametsoc.org/view/journals/clim/24/14/2010jcli3653.1.xml (accessed on 16 May 2022). [CrossRef]
- Thiombiano, A.N.; St-Hilaire, A.; El Adlouni, S.-E.; Ouarda, T.B.M.J. Nonlinear response of precipitation to climate indices using a non-stationary Poisson-generalized Pareto model: Case study of southeastern Canada. Int. J. Clim. 2018, 38, e875–e888. [Google Scholar] [CrossRef]
- Reed, K.; Wehner, M.F.; Stansfield, A.M.; Zarzycki, C.M. Anthropogenic Influence on Hurricane Dorian’s Extreme Rainfall. Bull. Am. Meteorol. Soc. 2021, 102, S9–S15. Available online: https://journals.ametsoc.org/view/journals/bams/102/1/BAMS-D-20-0160.1.xml (accessed on 6 December 2021). [CrossRef]
- Bell, J.E.; Brown, C.L.; Conlon, K.; Herring, S.; Kunkel, K.E.; Lawrimore, J.; Luber, G.; Schreck, C.; Smith, A.; Uejio, C. Changes in extreme events and the potential impacts on human health. J. Air Waste Manag. Assoc. 2018, 68, 265–287. [Google Scholar] [CrossRef] [Green Version]
Figure 1.
Annual average daily precipitation (mm/day) over the common time period (2001–2020) for (top) CPC, (middle) IMERG, and (bottom) DAYMET.
Figure 1.
Annual average daily precipitation (mm/day) over the common time period (2001–2020) for (top) CPC, (middle) IMERG, and (bottom) DAYMET.

Figure 2.
Annual average 95th-percentile precipitation (mm/day) for the common time period (2001–2020) for (top) CPC, (middle) IMERG, and (bottom) DAYMET.
Figure 2.
Annual average 95th-percentile precipitation (mm/day) for the common time period (2001–2020) for (top) CPC, (middle) IMERG, and (bottom) DAYMET.

Figure 3.
Time evolution of 95th-percentile precipitation (mm/day) averaged over LI for (blue) CPC, (pink) IMERG, and (green) DAYMET. Regression lines are only plotted for 2001–2020. Dots on the line plots show years when at least one TC passed within a great circle distance of 5° from the center of Long Island and contributed to an extreme precipitation event.

Figure 4.
The percentage of 95th-percentile precipitation events due to TCs for the common time period (2001–2020) for (top) CPC, (middle) IMERG, and (bottom) DAYMET.
Figure 4.
The percentage of 95th-percentile precipitation events due to TCs for the common time period (2001–2020) for (top) CPC, (middle) IMERG, and (bottom) DAYMET.

Figure 5.
For 2001–2020, the blue tracks show the TCs that caused 95th-percentile precipitation events on Long Island, while the gray tracks show TCs that passed through the red circle (5° circle around the center of Long Island) but did not cause 95th-percentile precipitation events. The gray boxes show the total number of tracks that passed within the red circle, and the blue boxes show the number of tracks that contributed to 95th-percentile precipitation events (i.e., the number of blue tracks).

Publisher’s Note: MDPI stays neutral with regard to jurisdictional claims in published maps and institutional affiliations. |
© 2022 by the authors. Licensee MDPI, Basel, Switzerland. This article is an open access article distributed under the terms and conditions of the Creative Commons Attribution (CC BY) license (https://creativecommons.org/licenses/by/4.0/).
Share and Cite
MDPI and ACS Style
Reed, A.T.; Stansfield, A.M.; Reed, K.A. Characterizing Long Island’s Extreme Precipitation and Its Relationship to Tropical Cyclones. Atmosphere 2022, 13, 1070. https://doi.org/10.3390/atmos13071070
AMA Style
Reed AT, Stansfield AM, Reed KA. Characterizing Long Island’s Extreme Precipitation and Its Relationship to Tropical Cyclones. Atmosphere. 2022; 13(7):1070. https://doi.org/10.3390/atmos13071070
Chicago/Turabian StyleReed, Austin T., Alyssa M. Stansfield, and Kevin A. Reed. 2022. "Characterizing Long Island’s Extreme Precipitation and Its Relationship to Tropical Cyclones" Atmosphere 13, no. 7: 1070. https://doi.org/10.3390/atmos13071070
Note that from the first issue of 2016, this journal uses article numbers instead of page numbers. See further details here.