Article

Dry Sliding Behavior and Particulate Emissions of a SiC-graphite Composite Friction Material Paired with HVOF-Coated Counterface

by
Priyadarshini Jayashree
,
Ankur Sinha
,
Stefano Gialanella
and
Giovanni Straffelini
*
Department of Industrial Engineering, University of Trento, Via Sommarive 9, 38123 Trento, Italy
*
Author to whom correspondence should be addressed.
Atmosphere 2022, 13(2), 296; https://doi.org/10.3390/atmos13020296
Submission received: 14 January 2022 / Revised: 7 February 2022 / Accepted: 7 February 2022 / Published: 9 February 2022
(This article belongs to the Special Issue Non-exhaust particle emissions from vehicles)

Abstract

:
Dry sliding wear tests and corresponding particulate matter (PM) analysis were conducted on a newly developed SiC-graphite-based composite friction material, paired with two types of HVOF counterface/discs: WC-CoCr and WC-FeCrAlY coatings, with a conventional martensitic stainless steel counterface as a reference. The trials were conducted on a pin-on-disc testing equipment at room temperature and a constant sliding velocity and contact pressure of 7 m/s and 0.5 MPa, respectively. The coefficient of friction (CoF) curves with the uncoated disc exhibited considerable fluctuations. On the other hand, the coated discs featured an increase in the CoF at the beginning of the tests, followed by either a continuous reduction until the end of the testing duration or the attainment of a steady state regime. The pin wear and emissions with both coatings were appreciably lower when compared to the trials with the uncoated disc. The evaluation of the friction layer observed a significant contribution of the counterface for all the pairings. The PM analysis was conducted on the particles that were lying in the range of 10 μm and 2.5 μm on a scanning electron microscope (SEM), and particles from 2.5 μm and 1 μm on transmission electron microscope (TEM), with an emphasis on the particles that were detached from the pin surface and friction layer to explain the wear mechanisms for each pairing. Through this, the need for the proper selection of both friction material and counterface to avoid the emission of harmful compounds in the environment was highlighted.

1. Introduction

Particulate matter (PM) emissions that are released from braking process are the subject of several investigations in recent years. In fact, during braking, the contacting surfaces (which are typically the brake pads and brake discs) undergo wear, which leads to the production of wear fragments of different characteristics (i.e., size, mass, composition). A major portion of these wear fragments/debris (around 35–50%) become airborne PM [1]. Investigations that have been conducted on automotive brake systems revealed that most of the PM was between PM2.5 and PM10 (particles with a cutoff aerodynamic diameter of 2.5 and 10 μm, respectively) [2,3,4,5,6,7]. In the review article of Grigoratos et al. [2], it was mentioned that the predominant constituents of brake wear, which can be found in PM emissions are Fe, Cu, and Ba, amongst others; in this regard, this is interesting for source apportionment studies. Straffelini and Gialanella [8] conducted an extensive review assessment on the different types of brake pads that are being currently utilized in automobile applications. Through this study, the clear and concrete relationship between the formation and sustenance of the friction layer was observed with the trends and magnitude of the PM emissions. The PM that are released during braking is known to have hazardous consequences on human health (e.g., by inhalation or skin penetration) and the environment [4,9,10,11], including climate change, particularly from the presence of organic and inorganic carbon in PM fraction [3]. Hence, the need to reduce PM emissions, particularly from brake systems into the environment, has been considered as a critical issue of utmost concern.
Song et al. [12] have stated the strong, proportional relationship between the mass concentrations and the number of airborne PM with the wear rate of brake pads and discs. Nogueira et al. [13] demonstrated that the PM emissions mainly consist of the disrupted friction layer that is dynamically forming during the testing duration from the compaction of the wear debris, with a substantial contribution from the cast iron counterface disc. Hulskotte et al. [14] suggested the urgency of investigating the brake wear mechanisms, as the emissions that are produced from the contacting disc-pads surfaces are rich in (heavy) metals. Hence, it is imperative for researchers to reduce the system wear, especially the wear rate of the counterface disc, to limit the PM emissions that are produced during the braking action. Coated counterface discs, wherein the coatings are deposited using the high velocity oxygen fuel (HVOF) thermal spraying technique, are preferred over other alternative coating processes due to a lower porosity, higher deposition rates, lower temperature requirements for a deposition when compared to plasma coating, higher density and hardness, higher choice of coating materials, and environmental friendliness [15,16,17,18,19,20]. The materials that are deposited by the HVOF technique are cermet (ceramic-metallic) coatings, such as WC-CoCr, in which the WC hard phase is combined with a metal ductile matrix that was based on Co and Cr alloys [17,21,22,23]. These sorts of coatings are renowned for their unique combination of hardness and toughness and are, thereby, widely used for their extremely beneficial property of superior wear resistance [24,25]. Federici et al. [26] have shown that the presence of WC-CoCr coating on a steel substrate/counterface yielded attractive results when it was tested with various kinds of friction materials. It was seen that at a varying range of velocities, contact pressures, and temperatures, the WC-CoCr provided stable and permissible coefficient of friction (CoF) and appreciably lower wear when compared to an uncoated steel counterface [21,27]. However, the presence of Co in the composition of the coatings is known to be perilous to human health and the environment if it is released as PM. Therefore, Co-free coating alternatives must be utilized and optimized for braking applications. An upcoming alternative to Co-containing coatings is the HVOF-deposited WC coatings in an Fe alloy matrix [28]. Numerous constituents can also be introduced in this type of coating, thereby enhancing its properties. The addition of Al increases the wear resistance, Cr and Y lead to superior corrosion resistance, and Fe leads to the formation of FeO and Fe2O3, which are similar to a lubricating agent [28]. A version of this type of coating is WC-FeCrAlY. Similar to the WC-CoCr, studies from Menapace et al. [1], Federici et al. [23], and Bolelli et al. [28] yielded satisfactory results concerning the wear characteristics of the Fe-based coating on counterface (low system wear, permissible steady CoF, formation, and sustenance of smooth, compact, and continuous friction layer on the contacted surfaces) at a different range of testing conditions when paired with different kinds of friction material formulations.
As previously mentioned, the PM emission studies for exhaust and non-exhaust emissions in automotive applications are progressing at a steady pace. However, research on the evaluation and control of PM emissions in high intensity braking applications is still in its nascent stage. The extension of emission analysis to braking applications in racing and aerospace applications is extremely pivotal. Keeping this in mind, the present study focuses on the wear and emission characteristics of a newly developed SiC-graphite-based composite material for racing and possibly aircraft applications, paired with three types of counterface—a conventional WC-CoCr coating, a Co-free WC-FeCrAlY coating, and a reference conventional martensitic stainless steel. The SiC-graphite composite material was chosen for its capability to deliver low sensitivity to humidity, high longevity, oxidation and thermal resistance, low wear rates of system, and for being lightweight [29,30,31,32,33,34,35,36]. The wear tests were conducted on a pin-on-disc (PoD) testing equipment and the emissions were collected and analyzed using an optical particle sizer spectrometer (OPS) and impactor. The worn surfaces of the pins and discs and the collected PM/emissions were subjected to different characterization techniques to understand their nature, constituent, and composition. The novelty of the study is the unique pairing of this kind of SiC-graphite-based composite material that is intended to be utilized in high intensity braking applications with different coatings as well as the reference counterface and their subsequent in-depth evaluation of the emitted particles.

2. Materials and Methods
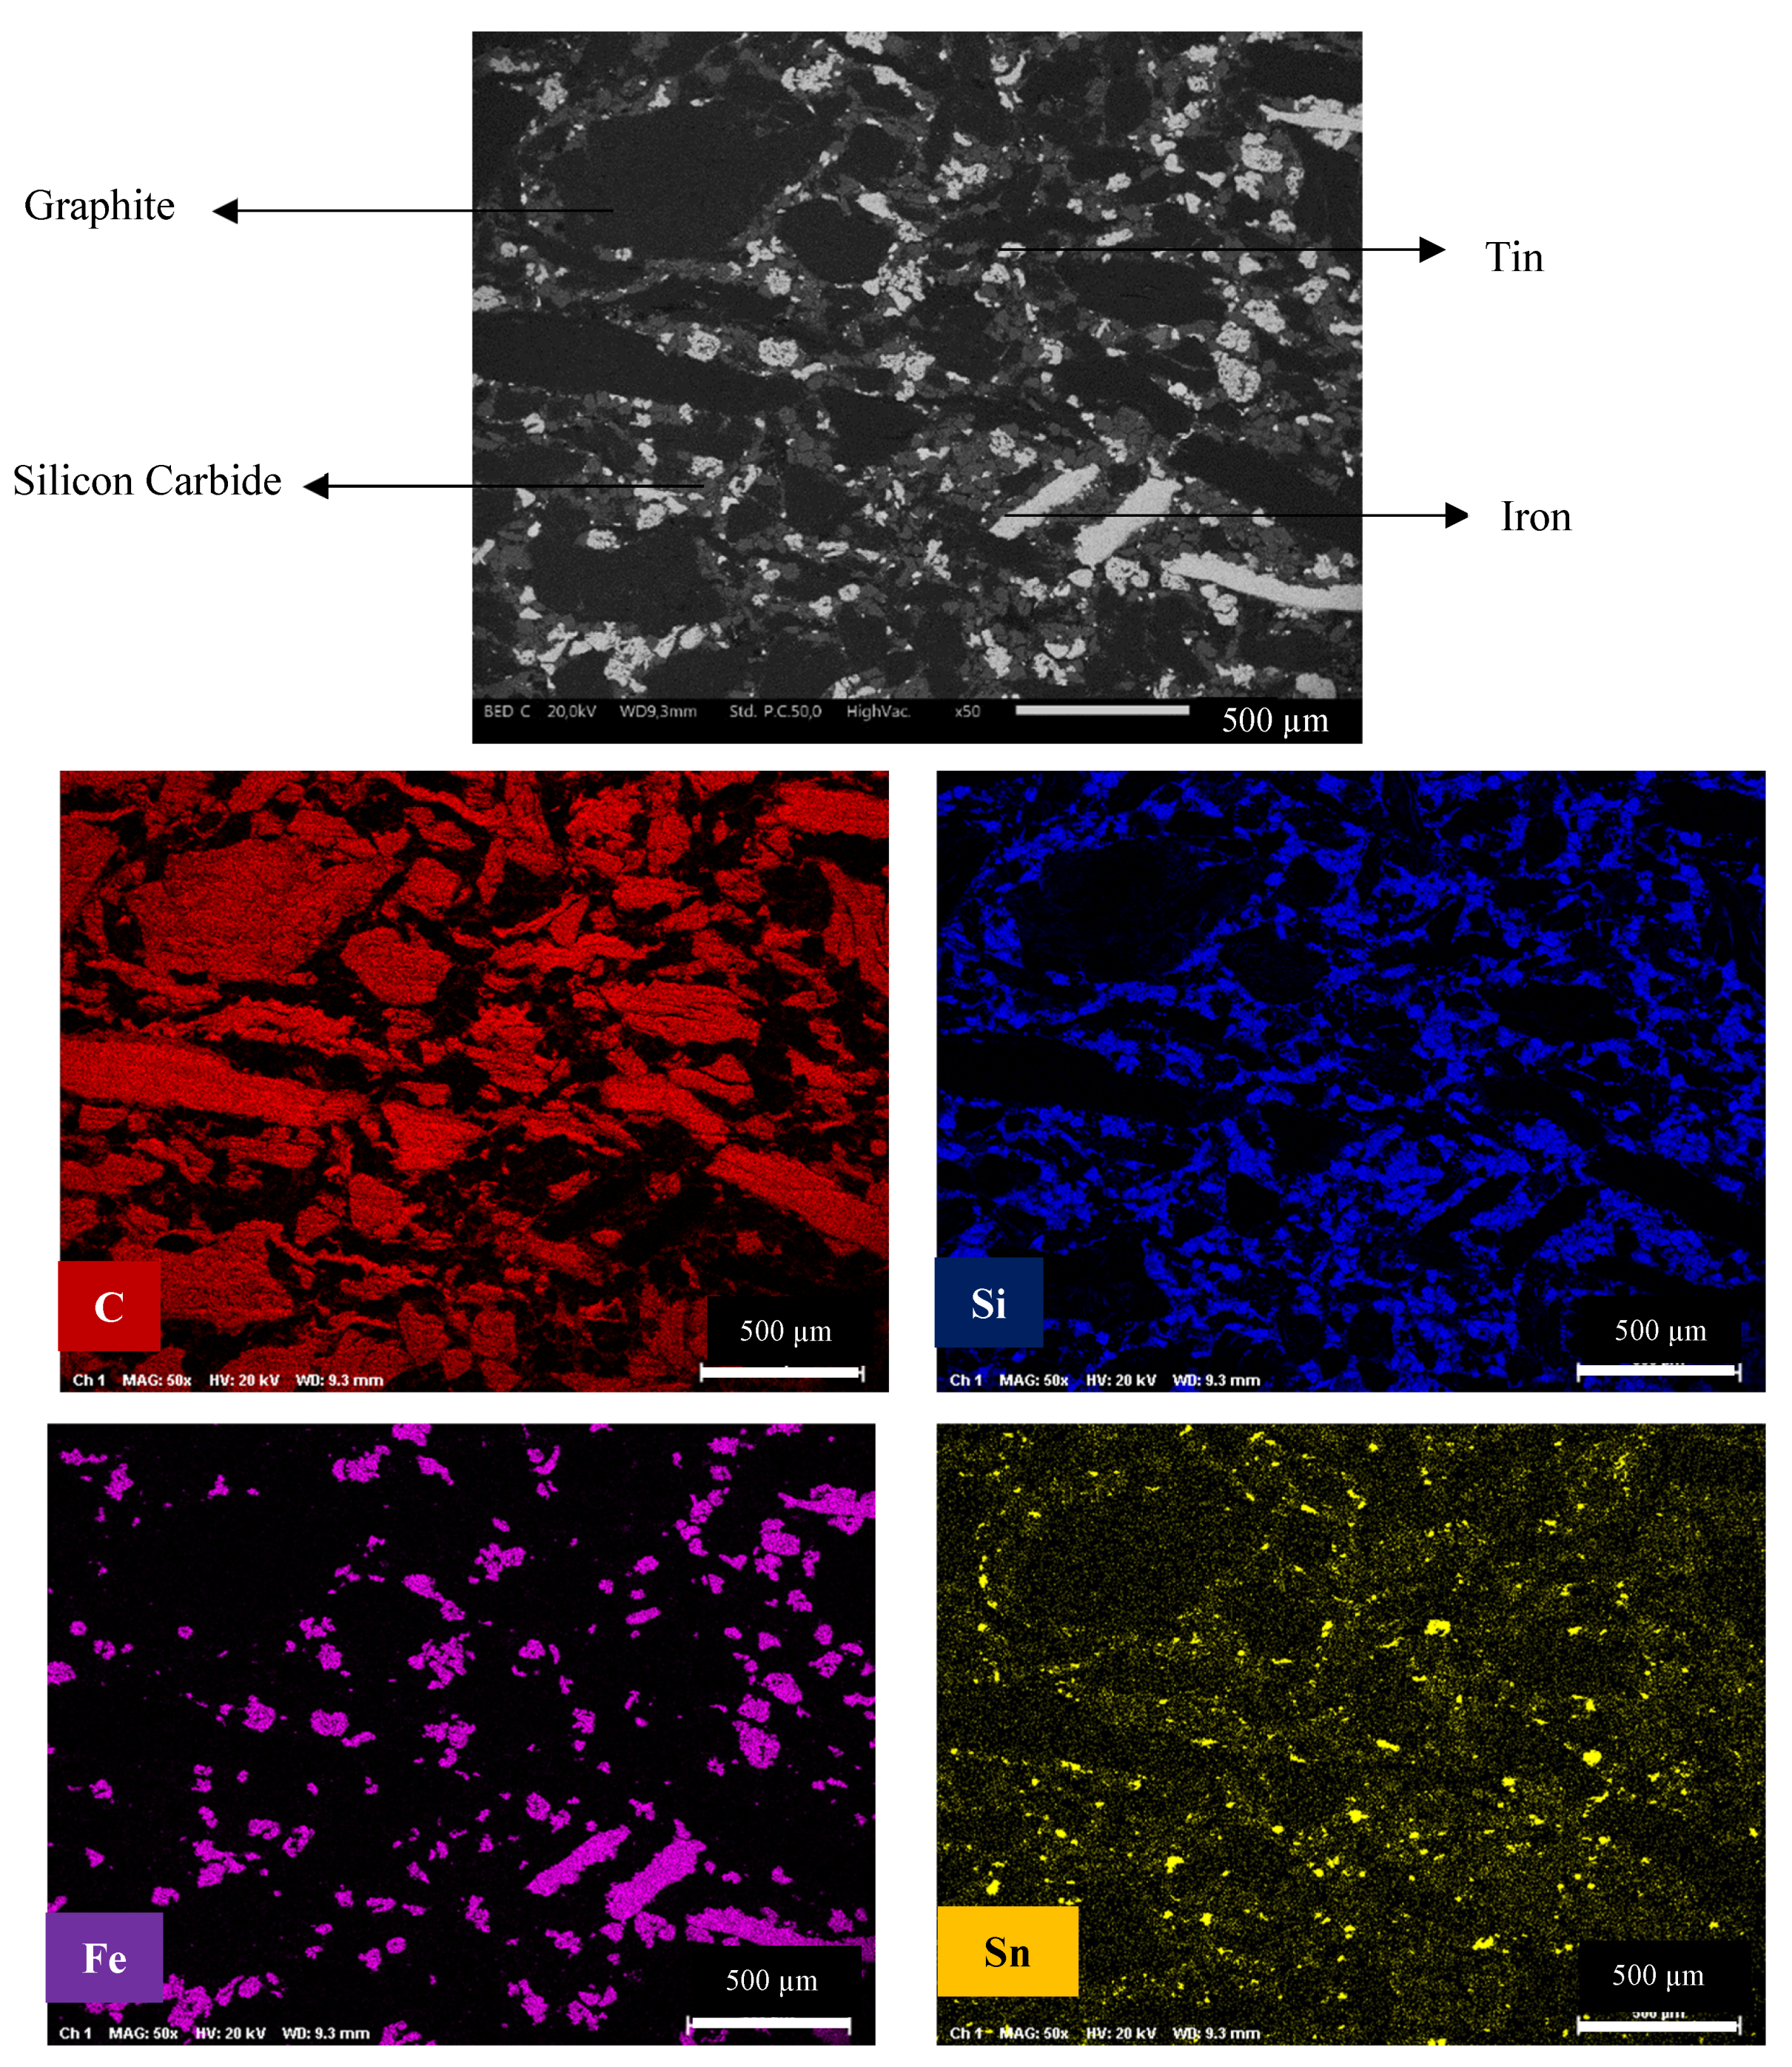
2.1. Materials

A newly developed SiC-graphite-based composite material was tested in the form of pins that were obtained from a block and produced by a brake company [37]. The pins were obtained from a production method which was kept confidential. The starting mix was hot-pressed and molded to produce the specimens. A catalyst was also introduced to achieve reticulation of the precursor during the hot-pressing stage. Subsequently, the green body was treated to pyrolysis between 400–600 °C to obtain the ceramic matrix material. Nevertheless, a presence of residual carbon was seen at the end of the production. The production process was completed with a final thickness adjustment and surface finishing. Figure 1 shows the backscattered electron (BSE) image of the cross-section and the corresponding X-ray maps of the composite friction material. The composition of the material was procured from Energy Dispersive X-ray Spectroscopy (EDXS) analysis: SiC, graphite, Sn, and Fe. Sn was added to the composite material for densification purposes. A tentative quantitative estimate of the material composition was obtained using the ImageJ software in volume percentage: graphite: 47%, SiC: 40%, Fe: 9%, and Sn: 4% [27,37].
The pins were tested against three different counterface/discs. The first two counterfaces were coatings. The first coating, WC-CoCr, was made of a mixture containing 86 wt. % of WC particles in a matrix made of a Cr-Co alloy: 10 wt. % Co and 4 wt. % Cr. A commercial WC-CoCr powder (Amperit558.074) was used. The composite feedstock was obtained from agglomeration and sintering to achieve spherical grains with an average size of 15–45 μm. The second coating was a WC-FeCrAlY cermet coating, containing 83 wt. % of WC particles, 12 wt. % of Fe, 3.5 wt. % of Cr, 1 wt. % of Al, and 0.5 wt. % of Y. The HVOF deposition technique was employed according to an established industrial protocol, verified and standardized through previous research, and is a typical method for these kinds of coatings [1,21,23]. Both the coatings were deposited onto a previously investigated martensitic stainless steel with low C and high Cr content disc substrate [38]. This substrate material was chosen for its enhanced corrosion resistance. The coating parameters that were utilized were—spraying distance of 380 mm, oxygen flux of 1000 L/min, and kerosene flux of 25 L/h. Before the deposition, the substrate was subjected to sandblasting. Figure 2 shows the cross-section of the WC-CoCr and WC-FeCrAlY coatings, whose relevant properties are listed in Table 1.
The third type of counterface disc was an uncoated, conventional martensitic stainless steel that was selected for its mechanical and wear properties, microstructure, and high hardness. The steel was subjected to heat treatment to obtain a martensitic microstructure and then stress-relieved to reach the highest hardness levels. The properties of the steel are given in Table 2. The hardness of the steel was obtained using a Vickers indenter at a load of 30 kgf, and its microstructure is shown in Figure 3. Additional information is reported in [38].

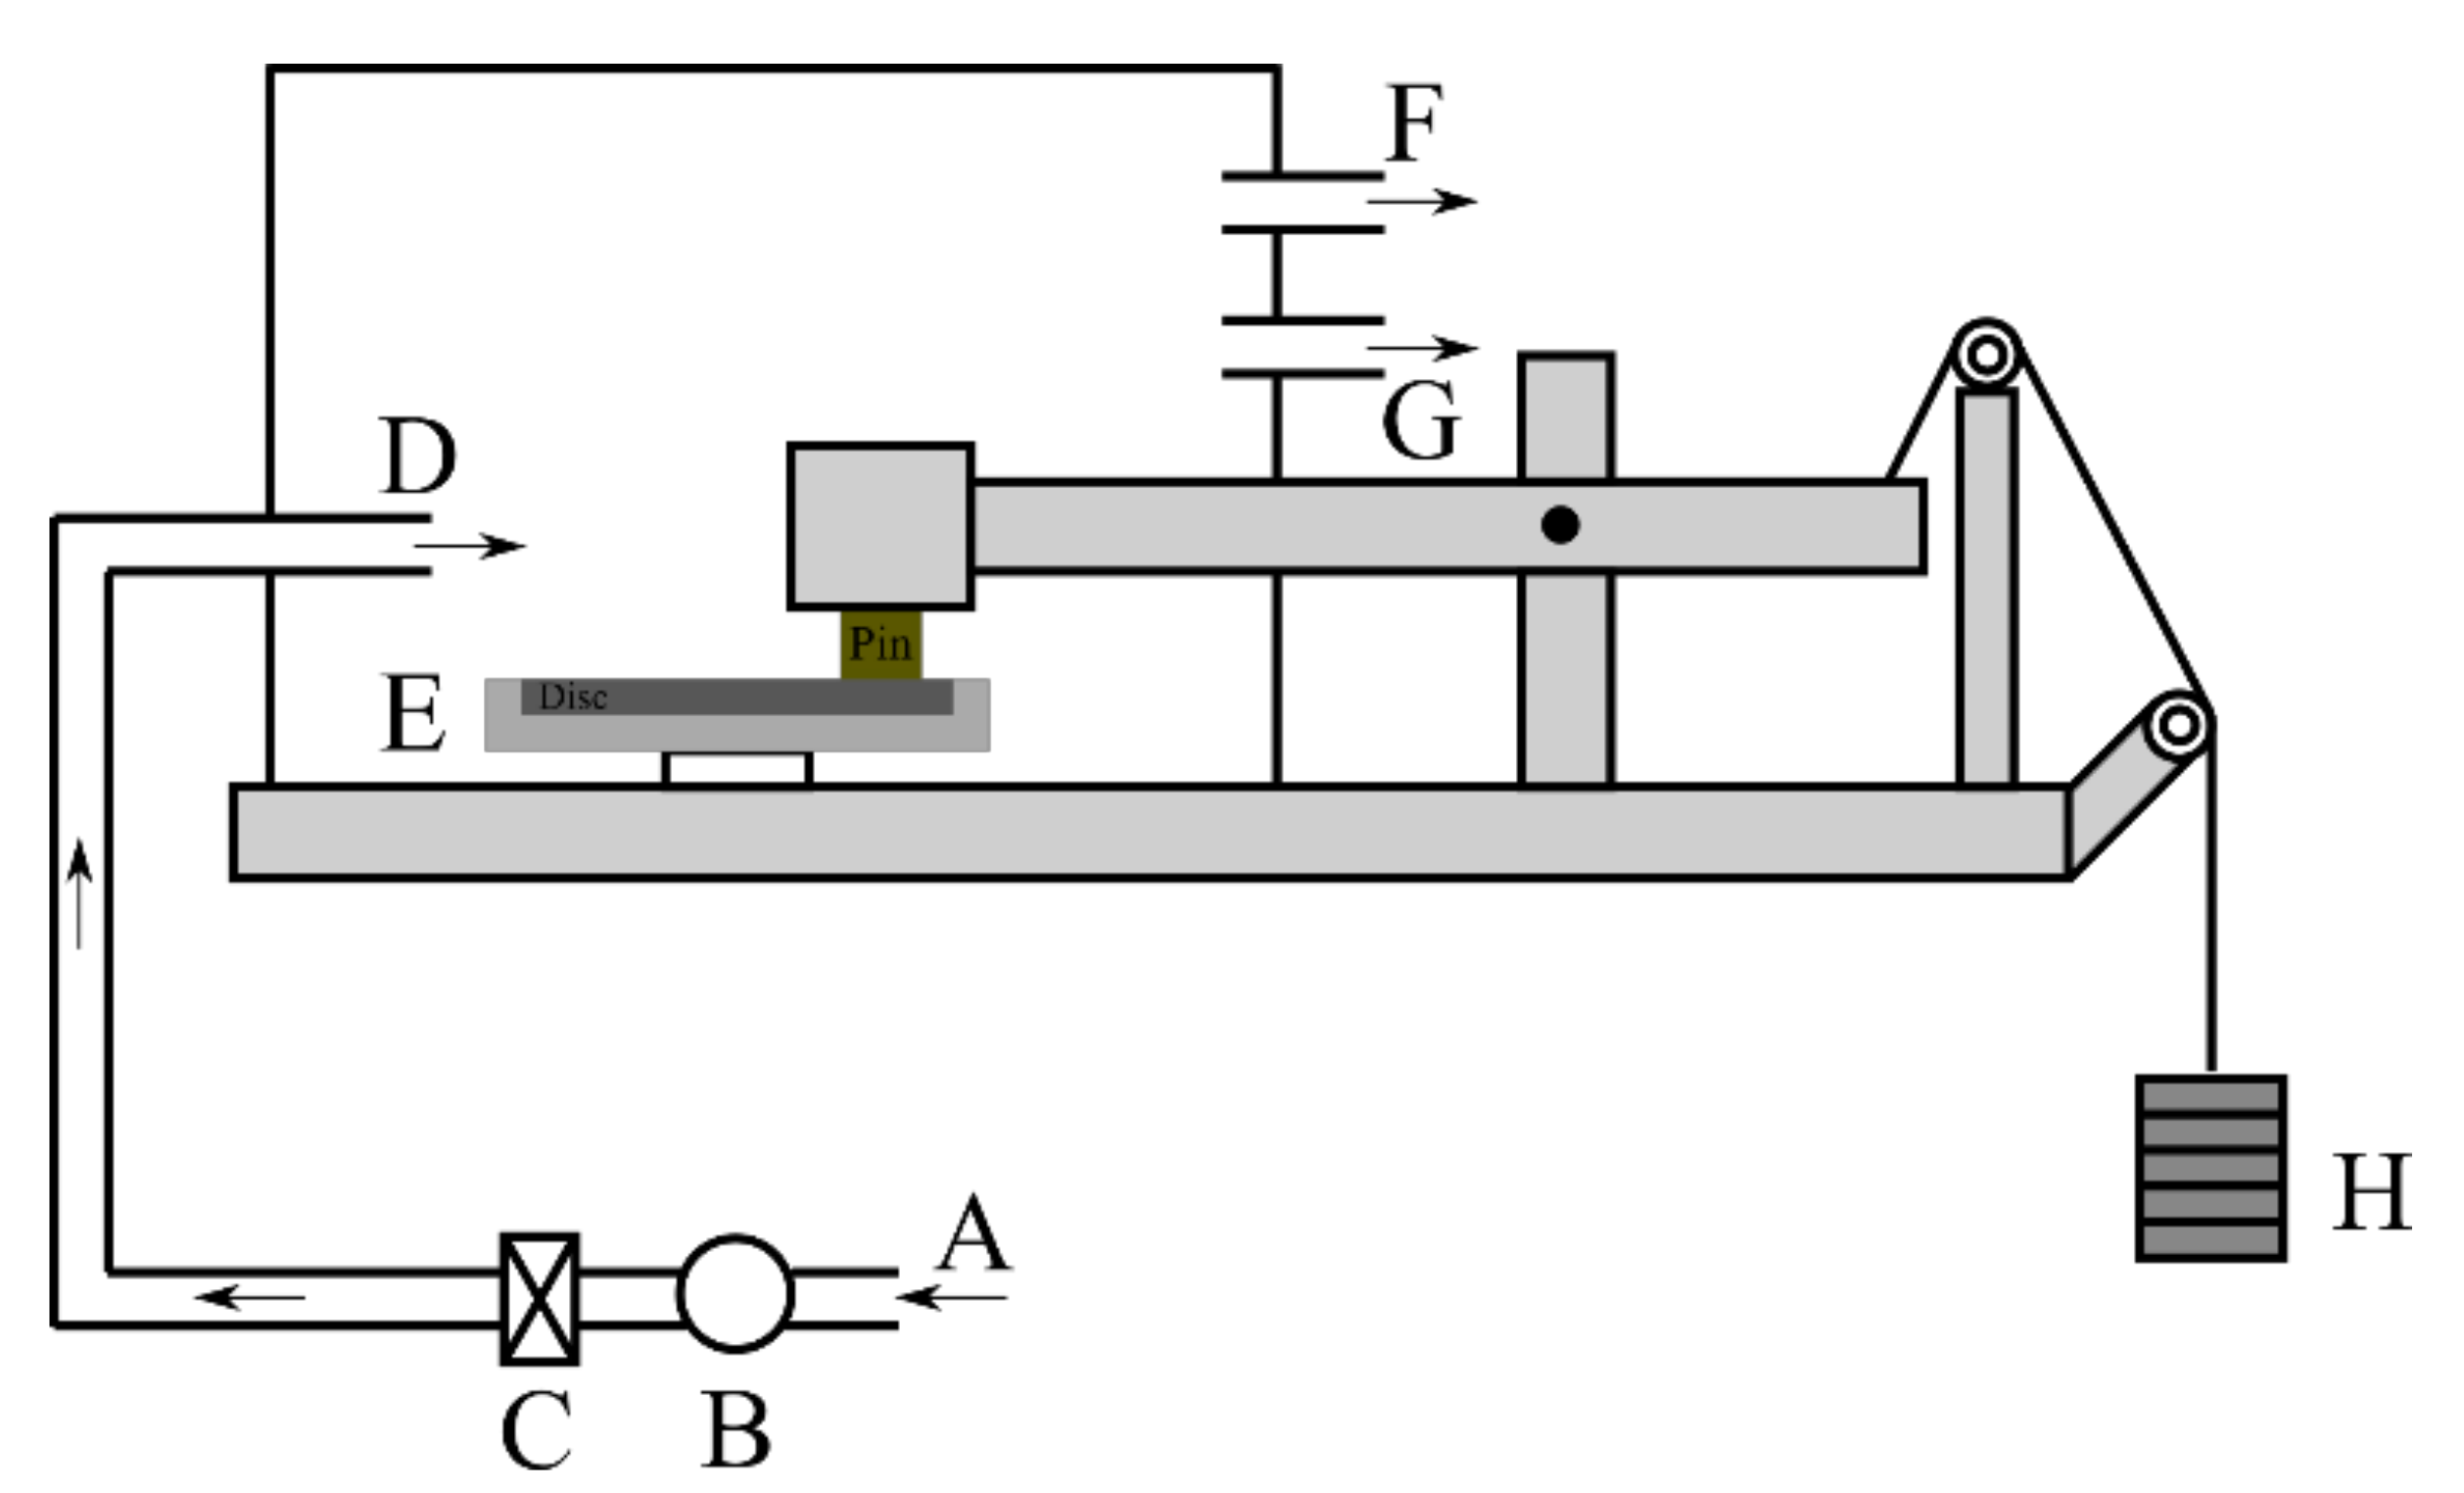
2.2. Pin-on-Disc Testing and Emitted PM Collection

The dry sliding wear tests were conducted on a pin-on-disc (PoD) testing equipment (make: Ducom, India). The pins that were tested had an average height and diameter of 9 and 10 mm, respectively. The counterface discs had a diameter and thickness of 100 and 7 mm, respectively. The tests were conducted at room/ambient temperature (RT). The relative humidity of the laboratory where the trials were conducted was not controlled, but regularly monitored, resulting in between 40 and 45%. To ensure similar and stable relative humidity, all the tests and their corresponding repetitions were conducted within 10 days. The tests were conducted at a constant load of 0.5 MPa, which amounted to 39 N. The sliding velocity that was employed was 7 m/s, corresponding to an angular speed of 1500 rpm for a wear track diameter of 80 mm. A total of three trials were conducted for all the testing conditions.
Figure 4 shows the schematic representation of the PoD testing apparatus, with the relevant attachments that were employed for particle collection. The ambient air from the laboratory (A) was taken into the apparatus by a fan (B). This air was circulated through a high-efficiency particulate air (HEPA) filter (C) to eliminate any particles/impurities, resulting in clean air being introduced inside the chamber (D). The air velocity was always maintained at 11.5 m/s. Keeping the volume of the enclosed chamber in mind, the flow rate that was employed led to an air exchange rate of 99 times/h. Before all the trials, the cleanliness of the airflow that was being introduced into the chamber was inspected, always having a background concentration of airborne particles below 10 #/cm3 [13].
To measure the particle number concentration and to further evaluate the collected emitted particles, a TSI® (TSI Incorporated, Shoreview, MN, USA) Optical Particle Sizer Spectrometer (OPS, model 3330) and a Dekati® (Dekati Ltd., Tykkitie, Finland) PM10 Impactor were utilized. The OPS and the impactor were connected to the enclosed chamber that was installed during the dry sliding tests at the sites G and F, respectively (Figure 4). The OPS measured the total particle number concentration, within the size range between 0.3 μm up to 10 μm, divided into 16 channels, with a sampling frequency of 1 Hz. The OPS was able to measure and record a particle concentration from 0 to 3000 particles/cm3, working with a self-controlled sampling flow rate of 1 l/min. To analyze the mass of the particles that were collected, the impactor was fed with an inlet flow of 9.7 l/min, and the particles were collected on aluminum foils that were set up at three different stages, corresponding to the following PM ranges: >10 μm, from 10 μm to 2.5 μm, and from 2.5 μm to 1 μm. The collecting Al-foils were weighed before and after each trial using an analytical balance with 10−4 g precision.
To attain proper friction traces and wear characteristics for the tests with the uncoated martensitic stainless steel, an optimized ‘bedding procedure’ was employed. This bedding procedure was found to be necessary for investigating brittle materials [35,39]. In this procedure, the testing duration was divided into three steps. Each step was half an hour long. The next step was only initiated when the pin and the disc would return to the room temperature testing conditions. The friction coefficient magnitude and trace were taken from the last step, whereas the pin wear was calculated from the summation of all three steps. All the steps in the test were conducted at the same testing conditions (0.5 MPa, 7 m/s, RT). The total testing duration was 90 min in 3 steps. For the tests with the coated disc, no bedding procedure was required. Instead, the tests were conducted for a continuous hour and a half long (90 min). For the emission trials with the martensitic stainless steel, the OPS and the impactor were connected to the PoD equipment for the last step/third step in the bedding procedure, and the whole testing duration was 90 min for the tests with the coated discs.
The pin wear for all the pairings was calculated by weighing the pin before and after each test through an analytical balance with a precision of 10−4 g. The specific wear coefficient of the pin (Ka) was calculated from the equation:
K a = V F × d
where:
V: wear volume loss (calculated using an average density of 3.6 g/cm3, measured as a mean value on ten pins); F: load applied; and d: sliding distance.
The disc wear was obtained through a stylus profilometer, from a transverse profile, and procured perpendicular to the wear track.

2.3. Sample Preparation of PM for SEM and TEM Analysis

The PM sample preparation followed a protocol that was described by Sinha et al. [40]. The PM that was collected on the aluminum foils from the impactor was transferred onto an acetate foil and was coated with a carbon film (through sputtering). At this step of the sample preparation, the sample could be subjected to scanning electron microscope (SEM) analysis. For transmission electron microscope (TEM) analyses, the carbon-coated acetate foil was subjected to dissolution using acetone. The leftover C film, which was floating in the acetone and containing the PM was extracted with TEM grids. The TEM evaluation was conducted on an analytical FEG scanning transmission electron microscope (STEM, make: ThermoFisher Scientific Talos F200S, USA), operated at 200 KeV, and equipped with an EDXS system with two silicon drift windowless detectors. To reduce any effects of spurious X-ray emissions, a low background sample holder was utilized [41].

2.4. Characterization of Worn Surfaces

The worn surfaces of the pins and discs were subjected to SEM (make: JEOL IT300, JEOL, Japan) analysis, which was also equipped with EDXS (make: Bruker) to understand the distribution of the alloying elements that were present on the worn surfaces. Point analysis on the friction layer and EDXS maps of the worn surfaces were conducted to obtain a close to accurate composition and constitution of the friction/transfer layer. A total of six maps of the worn surfaces were taken to obtain consistency in the results. An additional focus was provided on the maps of Fe, O, and Cr for the tests with the martensitic stainless steel and Fe, O, W, Co, and Cr for the tests with the coated discs. Additional SEM/EDS analyses were conducted on the particles in the size range of 10–2.5 μm to understand the variation in the composition of the collected particles for all the pairings.

3. Results

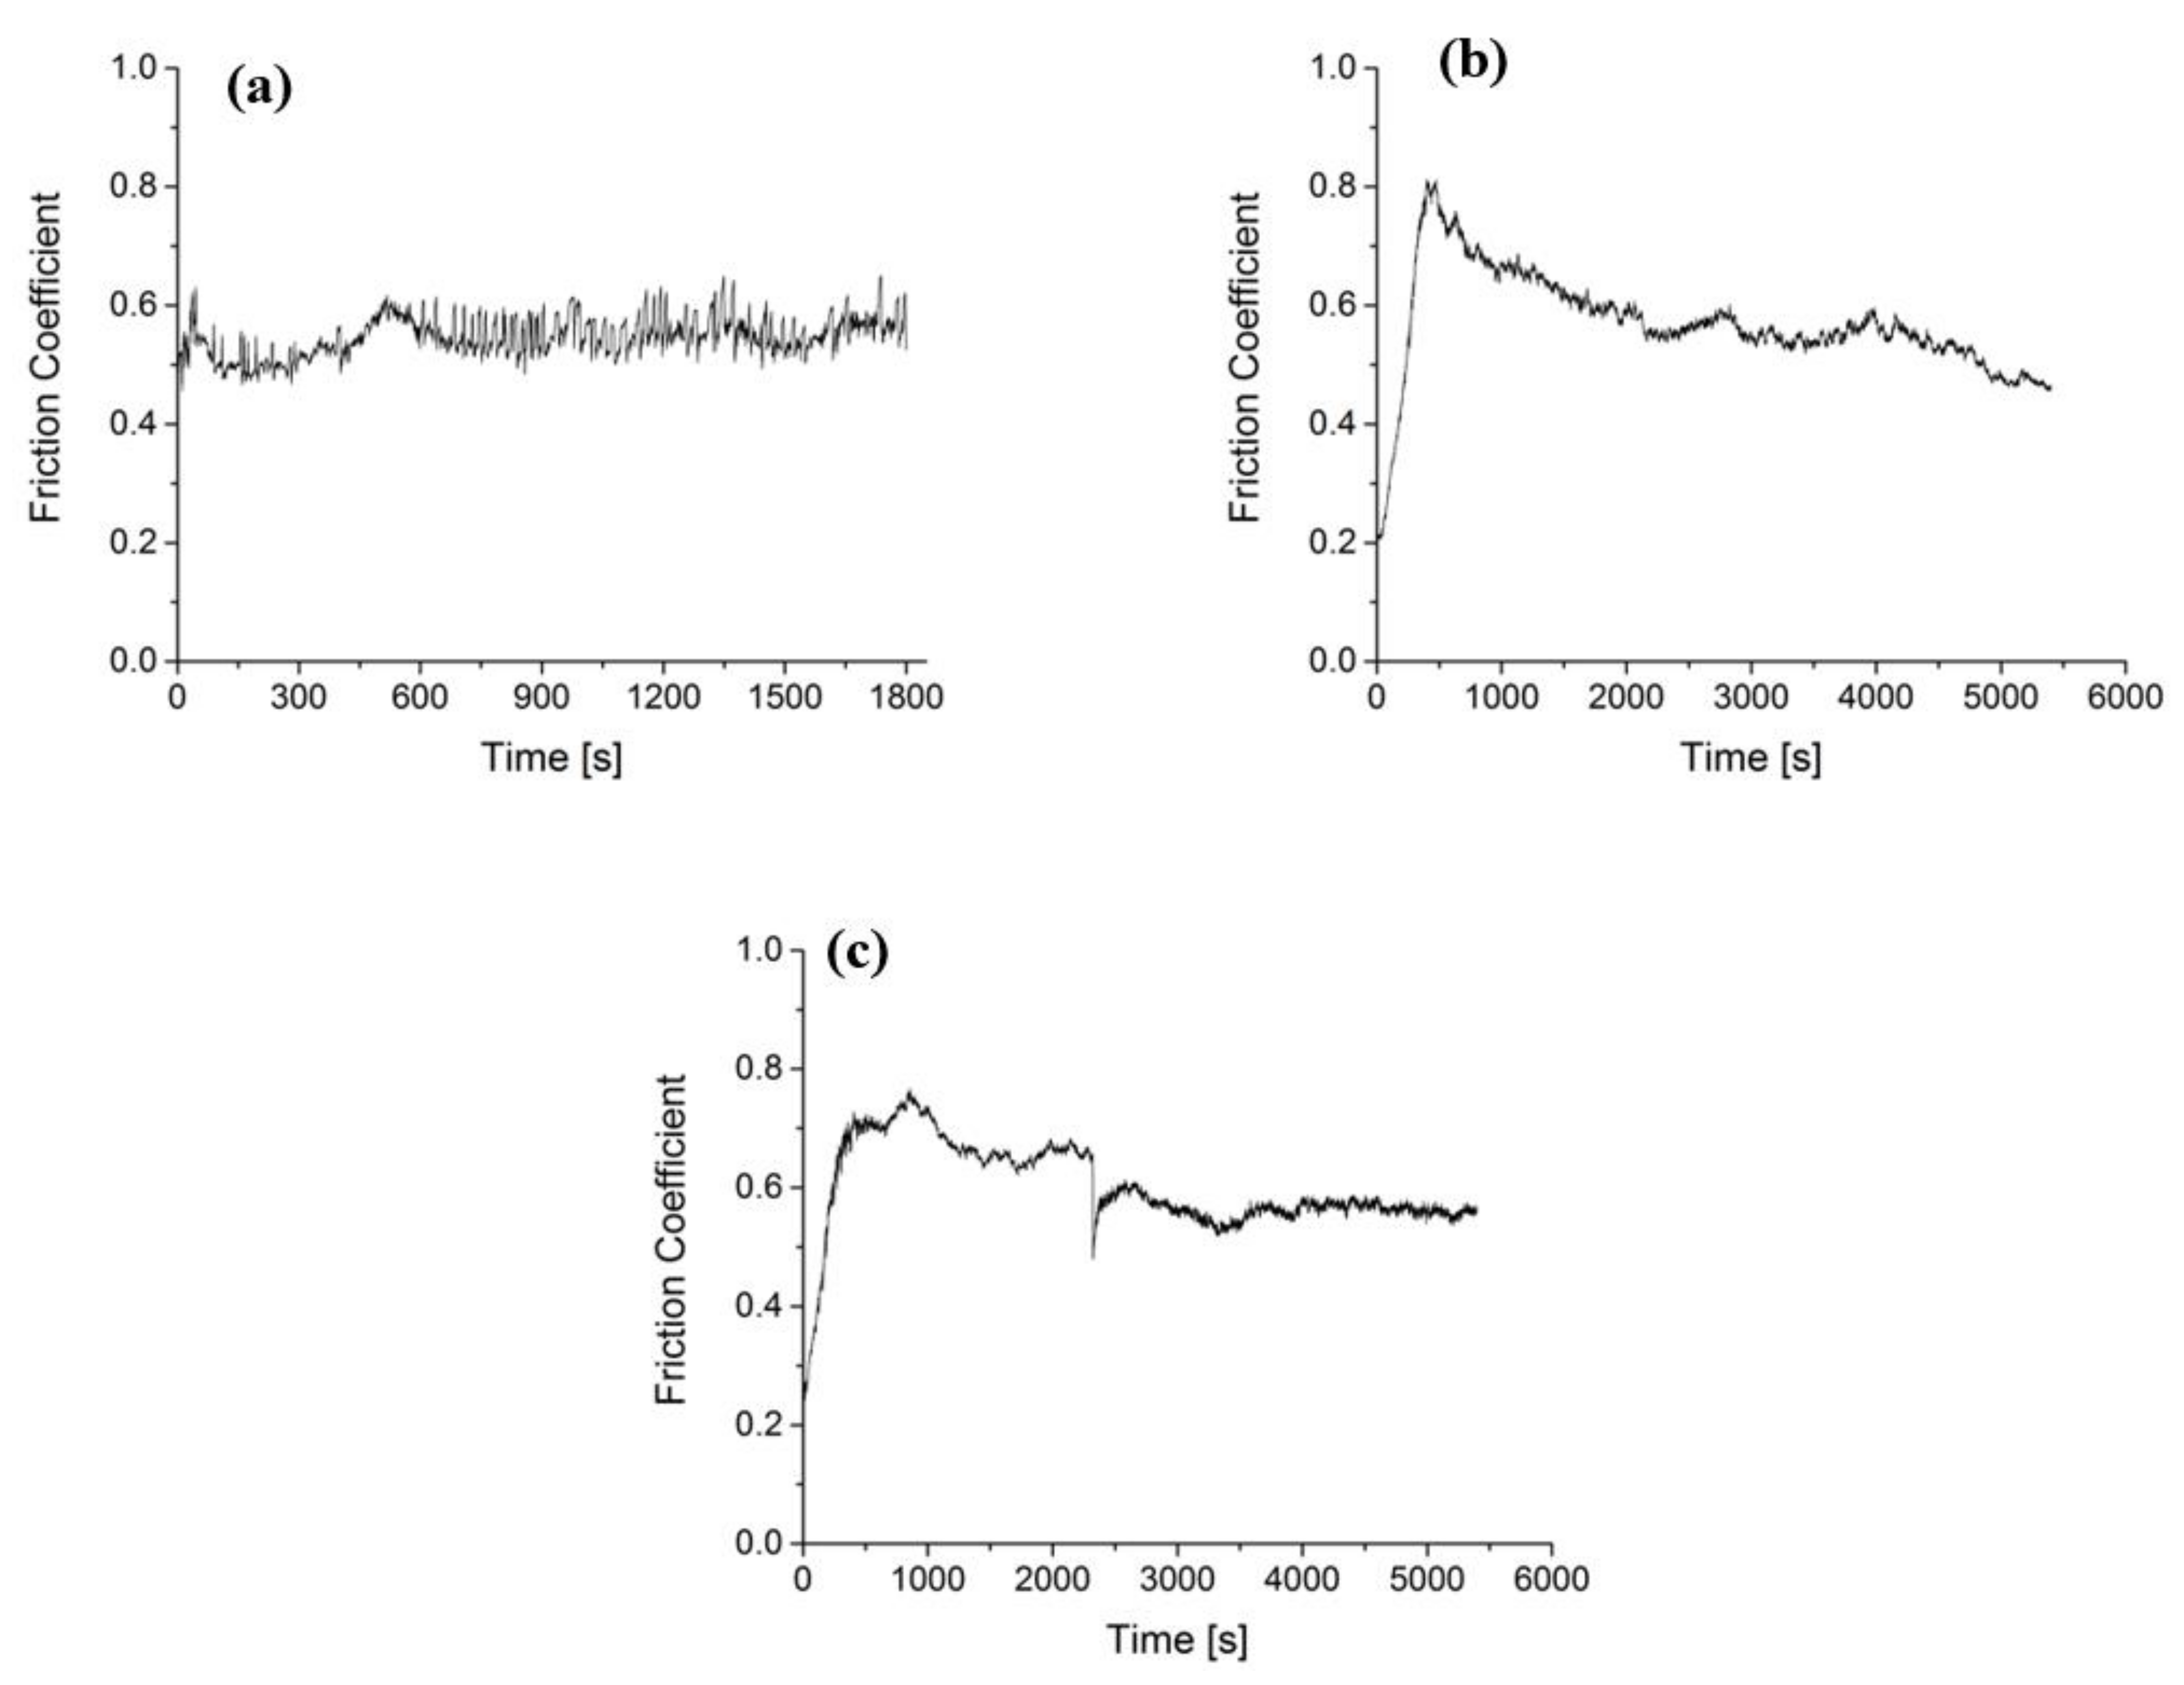
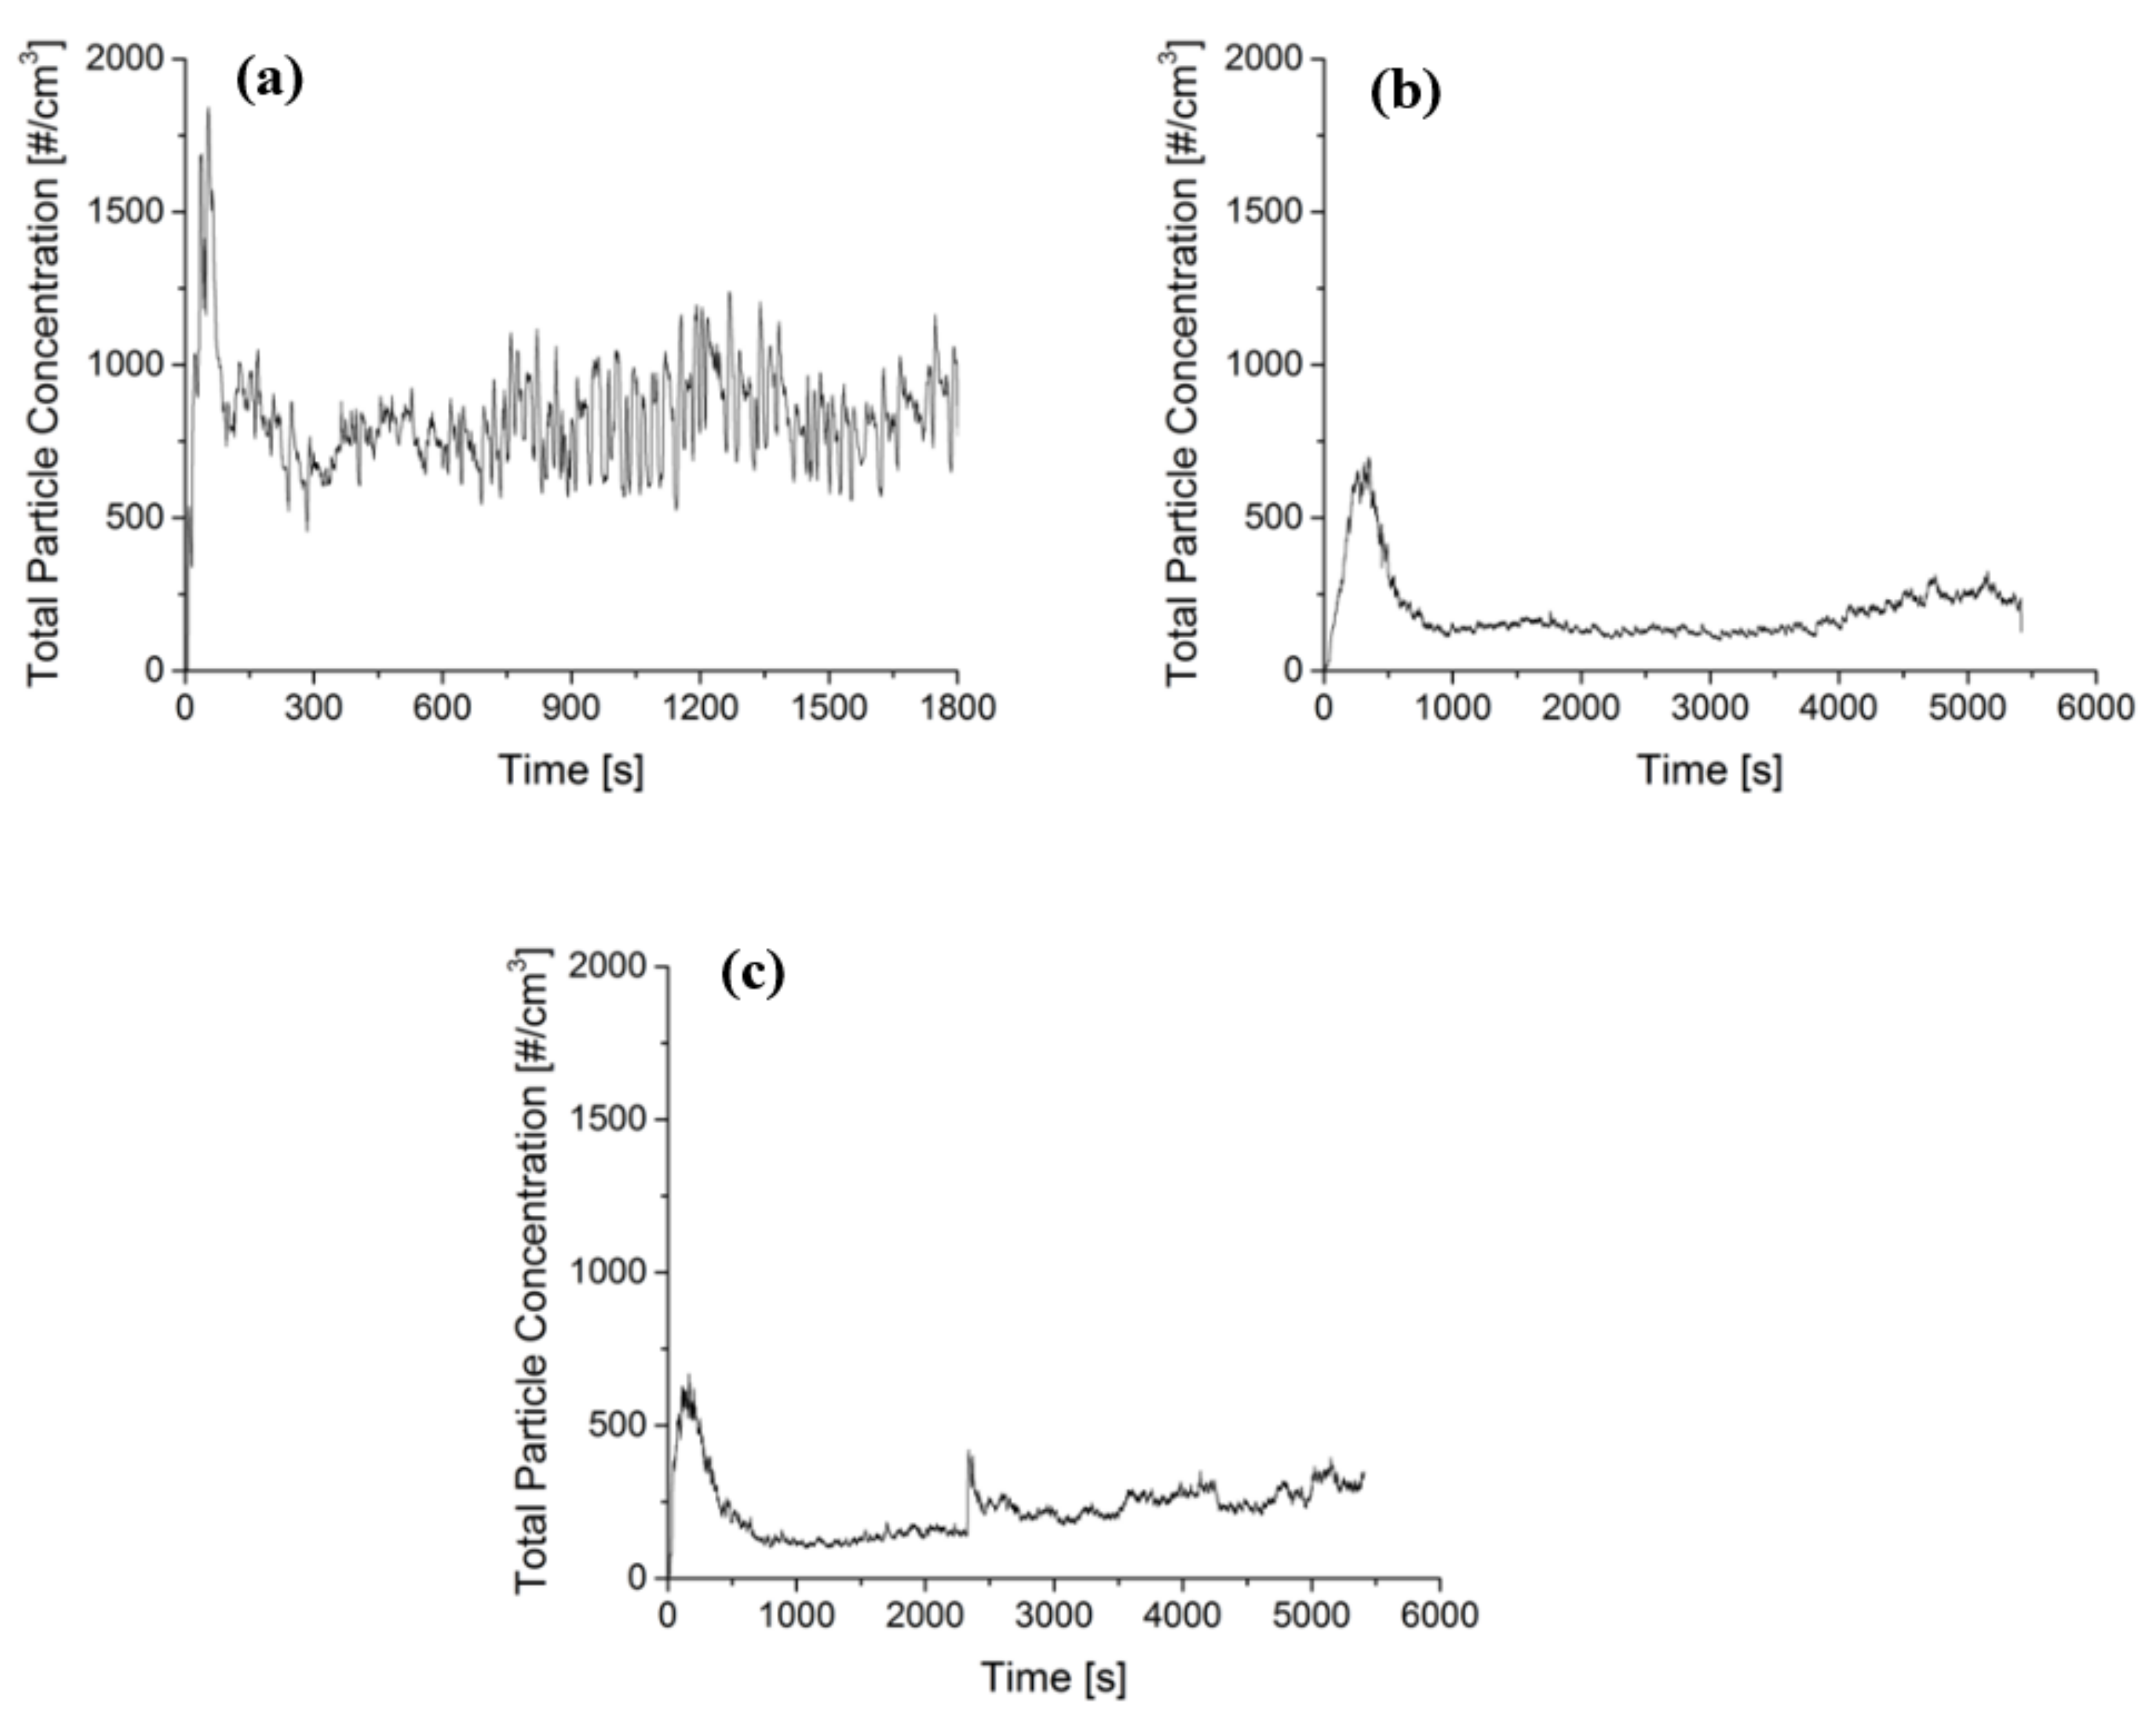
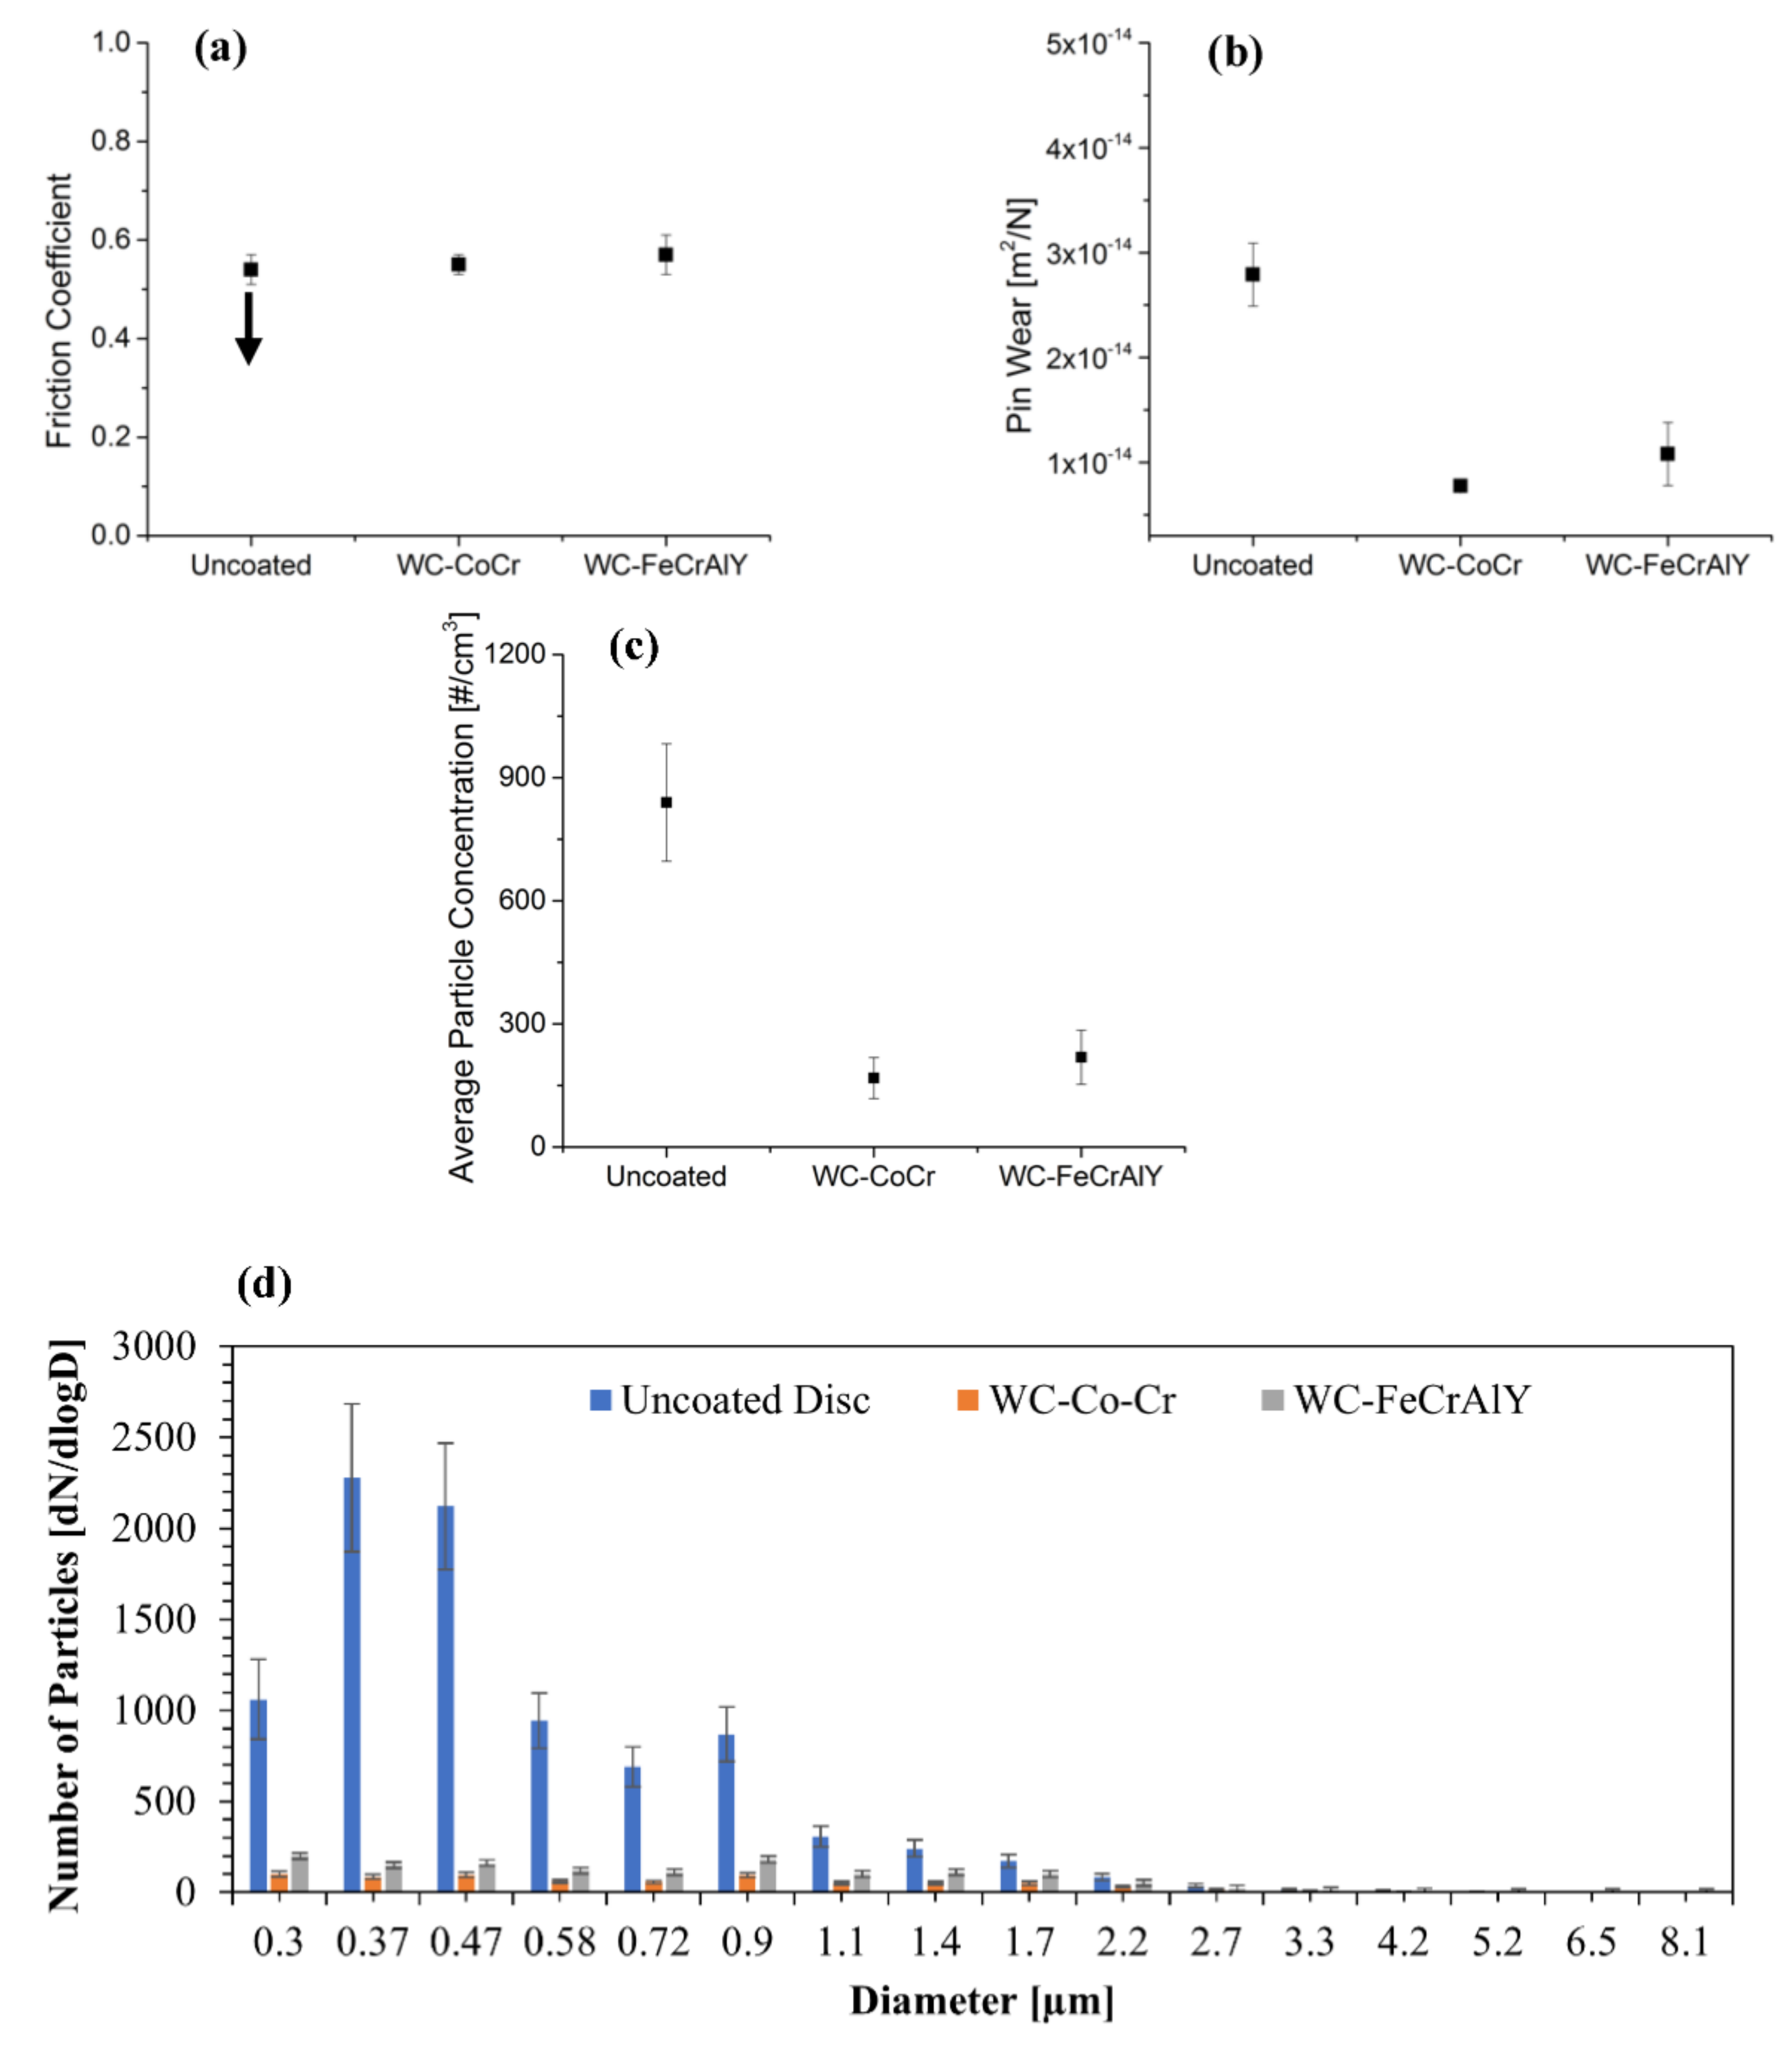
3.1. Friction, Wear, and Emission Trends

Figure 5 represents the typical friction traces of the pins paired with all three counterfaces. In the case of the uncoated disc, only the last step of the bedding procedure is shown in Figure 5a. The friction trace observed constant and considerable instability/fluctuations. Figure 5b represents the friction traces for the WC-CoCr-coated disc. In this case, an appreciable increase in the CoF magnitude can be immediately observed at the beginning of the test. As the testing duration progressed, a gradual and continuous reduction in the CoF magnitude was seen until the end of the testing duration. The last friction trace that is shown in Figure 5c belonged to the paring with WC-FeCrAlY coating. Similar to the WC-CoCr coating, this pairing also observed an appreciable increase in the friction coefficient magnitude at the beginning of the test, followed by a reduction in the CoF magnitude. Here, the CoF was reduced in the form of steps, but a steady state was reached close to 4000 s. The steady state was accompanied by an absence of high instability in the traces.
Figure 6 shows the typical emission trends with all three pairings. The emission patterns display some similarities with the corresponding friction traces in Figure 5. In the case of the emission trend for the uncoated disc in Figure 6a, similar to its friction traces, a ‘steady state’ was observed beyond approx. 750 s, accompanied by large fluctuations. For both the coated discs, the emission trends that are shown in Figure 6b for WC-CoCr-coated disc and Figure 6c for WC-FeCrAlY-coated disc, observed a spike in the emission recording at the beginning of the test, followed by a gradual reduction in the emission magnitude that was significantly lower than the values that were measured with the uncoated disc.
Figure 7 compares the steady state CoF, pin wear, and the average particle concentration of all the three tribological pairs. For the pairings that did not achieve a steady state until the end of the testing duration, the final CoF magnitude was considered for comparison. The average particle concentration was calculated from the point, wherein the emission traces reached a ‘steady state’ until the end of the testing duration. In Figure 7a, which represents the steady state CoF comparison, a downward pointing arrow is shown with the CoF magnitude of WC-CoCr, representing the absence of a steady state in the CoF and the continuous decrease in the CoF magnitude. Nevertheless, the CoF magnitudes for the three tribological systems were in the range 0.52–0.56. Figure 7b compares the pin wear of all three pairings. As expected, the highest pin wear is shown by the uncoated disc. The pin wear was just above 2 × 10⁻¹⁴ m2/N i.e., in the ‘mild to severe’ wear transition range (wear above 2 × 10⁻¹⁴ m2/N and below 10−13 m2/N). Alternatively, appreciably lower wear was observed for both the coated discs. The WC-CoCr-coated disc presented pin wear in the range of 10−15 m2/N, corresponding to a ‘very mild’ (wear below 10−14 m2/N) wear regime. The WC-FeCrAlY coating showed slightly higher pin wear when compared to the WC-CoCr coating. Nevertheless, the wear can still be classified as mild (wear below 2 × 10⁻¹⁴ m2/N and in the range of 1 × 10⁻¹⁴ m2/N) [38]. Figure 7c shows the average particle concentration for the three tribological pairings. The trend was observed to be very similar to the pin wear trends. Lastly, Figure 7d shows the particle number distribution with respect to the different OPS diameters for all the pairings. As mentioned previously, the OPS equipment had 16 channels with different diameters, as shown by the X-axis of Figure 7d. It can be noted that the maximum particles that were recorded amongst the three pairings are for the uncoated martensitic stainless steel. On the other hand, the coatings showed significantly fewer particle numbers (WC-FeCrAlY had only slightly higher recorded particle numbers compared to the WC-CoCr coating). Another interesting observation were the significant particle numbers that were noted for the channel diameters up to 2.2 µm, beyond which, the particle numbers that were recorded are quite low to negligible.
Figure 8 represents the typical disc profiles for all counterface discs. The arrows in Figures. indicate the contact length on the disc surface. The contact length in Figures. is denoted by numerous slim, downward peaks, indicating the roughness. The area outside the contact length is devoid of these peaks and appears very smooth (an instance of this can be clearly seen in Figure 8a). A significant presence of area in the negative Y-axis region is seen for the uncoated disc in Figure 8a. This downward dip in the curve signifies the disc wear. For the uncoated disc, the wear was calculated to be around 2.5 × 10⁻¹⁴ m2/N. Additionally, the roughness, in this case, appears to be quite high. For the coated discs, the scenario was a bit different. For the WC-CoCr-coated disc, Figure 8b, negligible wear was recorded and the contact length showed negligible roughness, whereas the disc profile of the WC-FeCrAlY-coating in Figure 8c showed slightly higher disc wear than the WC-CoCr-coated disc, but much lower disc wear when compared to the uncoated disc in Figure 8a. The disc wear for the WC-FeCrAlY-coating was calculated to be around 1.2 × 10⁻¹⁴ m2/N. The roughness, in this case, was higher than the WC-CoCr coating but quite lower than the uncoated disc. It is interesting to note that the pin wear and disc wear were proportional to each other and fell in the same category of wear regime, as explained using Figure 7b.

3.2. Analysis of Worn Pin Surface

Figure 9 shows the worn surfaces of the pins that were paired with all three counterfaces with the corresponding EDXS maps. Consider, first, the pairing with the uncoated martensitic stainless steel in Figure 9a–f. The worn surface can be divided into three regions. The first region under consideration is black in color. From the corresponding EDXS maps, it can be identified as the areas containing C/graphite. The second region is denoted by the dark grey region and is rich in Si. The third region is light grey in color and is predominantly made of Fe. On further inspection of other elements, oxygen is also present, confirming the presence of Fe oxides. This light grey region is known as the friction/transfer layer. Another interesting observation is the overlapping of the Cr with the Fe and O maps. From the contacting surface composition, it can be inferred that chromium is from the disc. Hence, disc transfer is contributing to some extent towards the formation of the friction layer onto the pin surface. The regions featuring the graphite particles are free from any friction layer coverage, owing to their low surface energy [38].
Figure 9g–n,o–u represent the worn surface characteristics of the pins that were paired with the WC-CoCr and WC-FeCrAlY coatings respectively. The worn pin surfaces can still be divided into three main areas—the black graphitic regions, the dark grey silicon-rich region, and the light grey region containing the friction layer. Also, in this case, the friction layer is predominantly made of Fe oxides, as indicated by the overlapping of Fe and O maps. Additionally, the presence of disc transfer can be very clearly and prominently noted from the overlapping of Fe, O, W, Cr, and Co maps (W, Co, and Cr are from the coatings) for the WC-CoCr coating and Fe, O, W, and Cr (W and Cr are from the coatings) for the WC-FeCrAlY-coated disc.
It is important to note that along with the Fe oxides, the presence of metallic Fe can also be seen on all the worn pin surfaces from the Fe maps. The presence of this metallic Fe could be attributed to disc transfer in the case of the uncoated disc, from the pin surface in the WC-CoCr coating, and a combination of pin and coating constituent in the case of the WC-FeCrAlY pairing.
Another pivotal feature to be noted here is the extension of the friction layer for the three pairings. For both coatings, we see a continuous expanse/region of deposited and extremely well compacted friction layer. The least coverage was observed for the uncoated disc, wherein the friction layer was observed to be spread all over the worn surface but in the forms of tiny patches/islands of compacted regions.
The average composition of the friction layer was evaluated from five measurements that were performed on the worn pin surfaces for each pin-disc combination (Table 3).
The friction layer, forming on the pin surface tested against the uncoated disc, was mainly made of Fe (63%) and O (25%), in agreement with the EDXS maps in Figure 9, indicating that the friction layer was made of Fe-oxides. When the coated discs were considered, in both cases, the majority constituents of the friction layer were W followed by O. The overwhelming presence of W, along with either Co and Cr (WC-CoCr) or Fe (WC-FeCrAlY) indicated the still significant role of the coating in the formation of the friction layer.

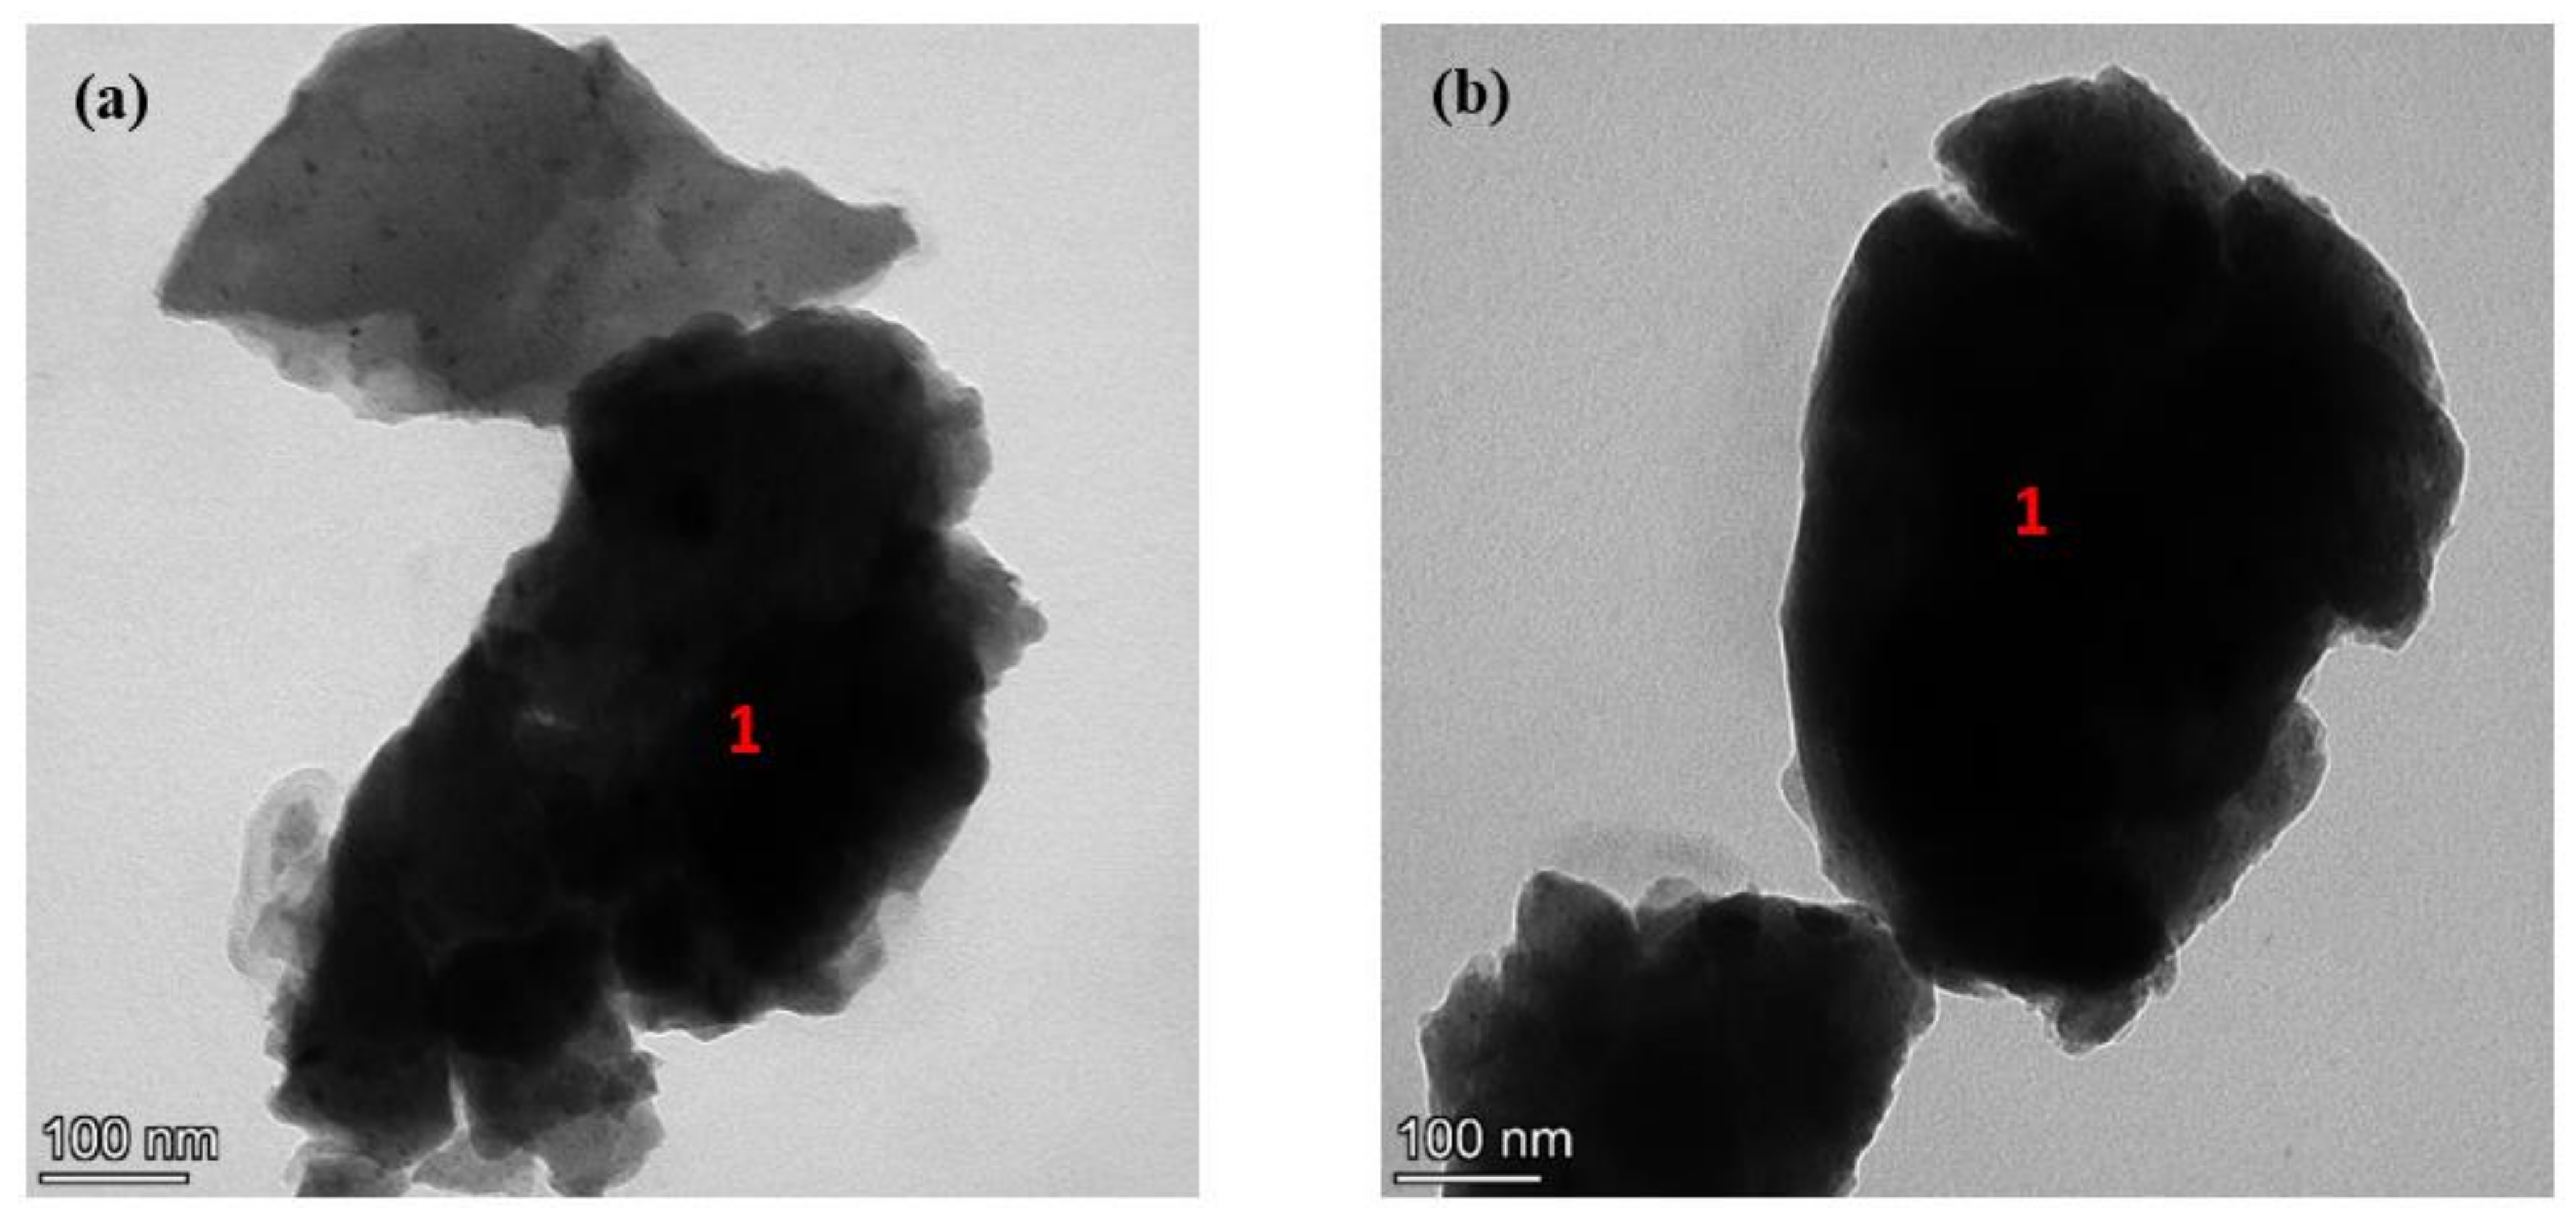
3.3. Analysis of Collected PM

The collected PM, with an average size between 10 μm and 2.5 μm, were subjected to full frame EDXS analysis. The analysis was conducted for all three tribological couplings at five different locations. Figure 10 represents the typical PM SEM images of the three pairings on which the full frame EDXS analysis was conducted to evaluate the relevant compositions (Table 4).
In the case of the uncoated disc, the major constituent of PM was Fe (40%), closely followed by C (34%), O (17%), and Cr (5%). Other constituents that were similar to Si and Sn were present in very low quantities. For the WC-CoCr coating, the main constituents were W (39%), C (25%), O (22%), and Fe (8%). For the WC-FeCrAlY coating, the primary composition was C (35%), W (24%), Fe, and O (17% each), with other pin and disc constituents in very small quantities. These results (Table 4), when compared with the outcome of the EDXS mapping of the pin surface (Figure 9) and the point analysis of the relevant friction layers that were present on the pin surface at the end of the tests (Table 3), lead to the conclusion that for all the three pairings, the constituents of the PM between the ranges of 10 and 2.5 μm were mainly made of the friction layer which was detached from the contacted surfaces during the dry sliding test and graphitic particles [1,13].
The collected PM with average size lying in between 2.5 μm and 1 μm were subjected to TEM analyses. Figure 11a represents the TEM image of a cluster of particles with the corresponding selected area electron diffraction (SAED) for the pairing with the uncoated martensitic stainless steel. The SAED patterns that were acquired in the TEM mode were indexed using Process Diffraction open-source software [42,43]. The area ‘1’ was subjected to EDXS analysis, given in Table 5. The EDXS analysis for all the pairings was also carried out on three other locations/particle clusters. The EDXS analysis indicated a high presence of Fe and O, inferring Fe oxides, followed by a marked presence of C/graphite. From Figure 9 and Table 3, it can be validated that this cluster of particles was a detached portion of the friction layer that was deposited on the contacted surface and graphite from the pin surface. The size of the particle was seen to be close to 0.1 μm.
Figure 11b,c shows the TEM images of the particles and the corresponding SAED patterns that were obtained with the PM specimens from the PoD tests with the WC-CoCr and WC-FeCrAlY coatings, respectively. The areas under consideration are also marked by ‘1’. From the EDXS analysis of the marked area in Table 5, the particle cluster that was collected from the WC-CoCr coating predominantly constituted of C/graphite and W, followed by O and Fe. On the other hand, with the WC-FeCrAlY coating pairing, the presence of high proportions of W, Fe, and O can be easily seen. It is quite interesting to note that, even in the case of the coated disc, the constituents of the EDXS analysis in Table 5 matched the constituents of Table 3 and the observation from Figure 8, indicating that the cluster of particles that were analyzed in Figure 11b,c are also detached fragments of friction layer, accompanied by graphite, which is similar to Figure 11a. Additionally, in the case of coated discs, the particle size that was evaluated was bigger than the particles that were produced from the pairing with the uncoated martensitic stainless steel. In the case of the WC-CoCr and WC-FeCrAlY coatings, the particle size was close to slightly larger than 0.4 and 0.5 μm respectively.
The SAED patterns that are shown in the inset of Figure 11a,c highlights the presence of spots along with the faint rings, indicating the presence of crystalline phases. In particular, the magnetite phase was detected, which is a major issue in environmental monitoring [44]. Additionally, in the case of wear debris from the WC-FeCrAlY pairing that is shown in Figure 11c, the presence of embedded WC particles coming from the coating material was observed. As far as the debris from the WC-CoCr-coated disc is concerned, the particle cluster that is shown in Figure 11b was too coarse to be electron transparent. The diffused diffraction pattern that is shown in the inset can be associated with the carbon film on which the particles were present, not to mention the carbonaceous components that were present in the friction material. Nevertheless, the spectroscopic information supports the presence of a high amount of W along with C in this case too, followed by O and Fe.
Though the particles that were collected in the impactor between 2.5 μm and 1 μm dimensions were predominantly made of fragments of detached friction layer and graphitic particles, the TEM analysis was also able to characterize a few other clusters of particles which had detached from the pin surface. Let us first consider the particles that were collected with the uncoated disc pairing. Figure 12 shows a particle cluster (denoted by 1), which, when subjected to EDXS analysis, was verified as SiC particles. The EDXS analysis of the cluster is shown in Table 6. The SAED pattern that is shown in the inset from the field of view of Figure 12 had an appearance that is typical of the amorphous substrate. This signifies the presence of a coarse SiC particle cluster. On the other hand, Figure 13 presents three different particle clusters that were collected during the testing of the uncoated disc-pin pairing. The EDXS analysis of the cluster is shown in Table 7. These had varying chemical compositions and could be linked with the SEM analyses of the pin worn surface that was discussed in Section 3.2. Here, again, we could find a region that was rich in graphite (brighter regions of the image), which has been marked as ‘1’, and its SAED depicting the crystalline phase has been shown in the inset. The region that is marked as ‘2’ was found to be rich in Si and C, suggesting the presence of SiC. The region marked as ‘3’ demonstrated the presence of the combination of friction layer (Fe, O, Cr) as well as the pin constituent (C/graphite, Sn, Si).
The next set of TEM analyses was conducted on the particles that were detached from the coated counterface. Figure 14a,b shows the particle cluster of the WC-CoCr and WC-FeCrAlY coating, respectively. The composition of these particles was obtained from the EDXS analysis of the area ‘1’, showing the predominant presence of coating constituents that are presented in Table 8. In both the Figures, the particle cluster size is comparatively bigger than the particle cluster that is seen in Figure 11a for the uncoated disc. Additionally, both the coating particles are quite dense, unlike Figure 11a. The particle cluster size for both the coatings was approximately to 0.2–0.3 μm.

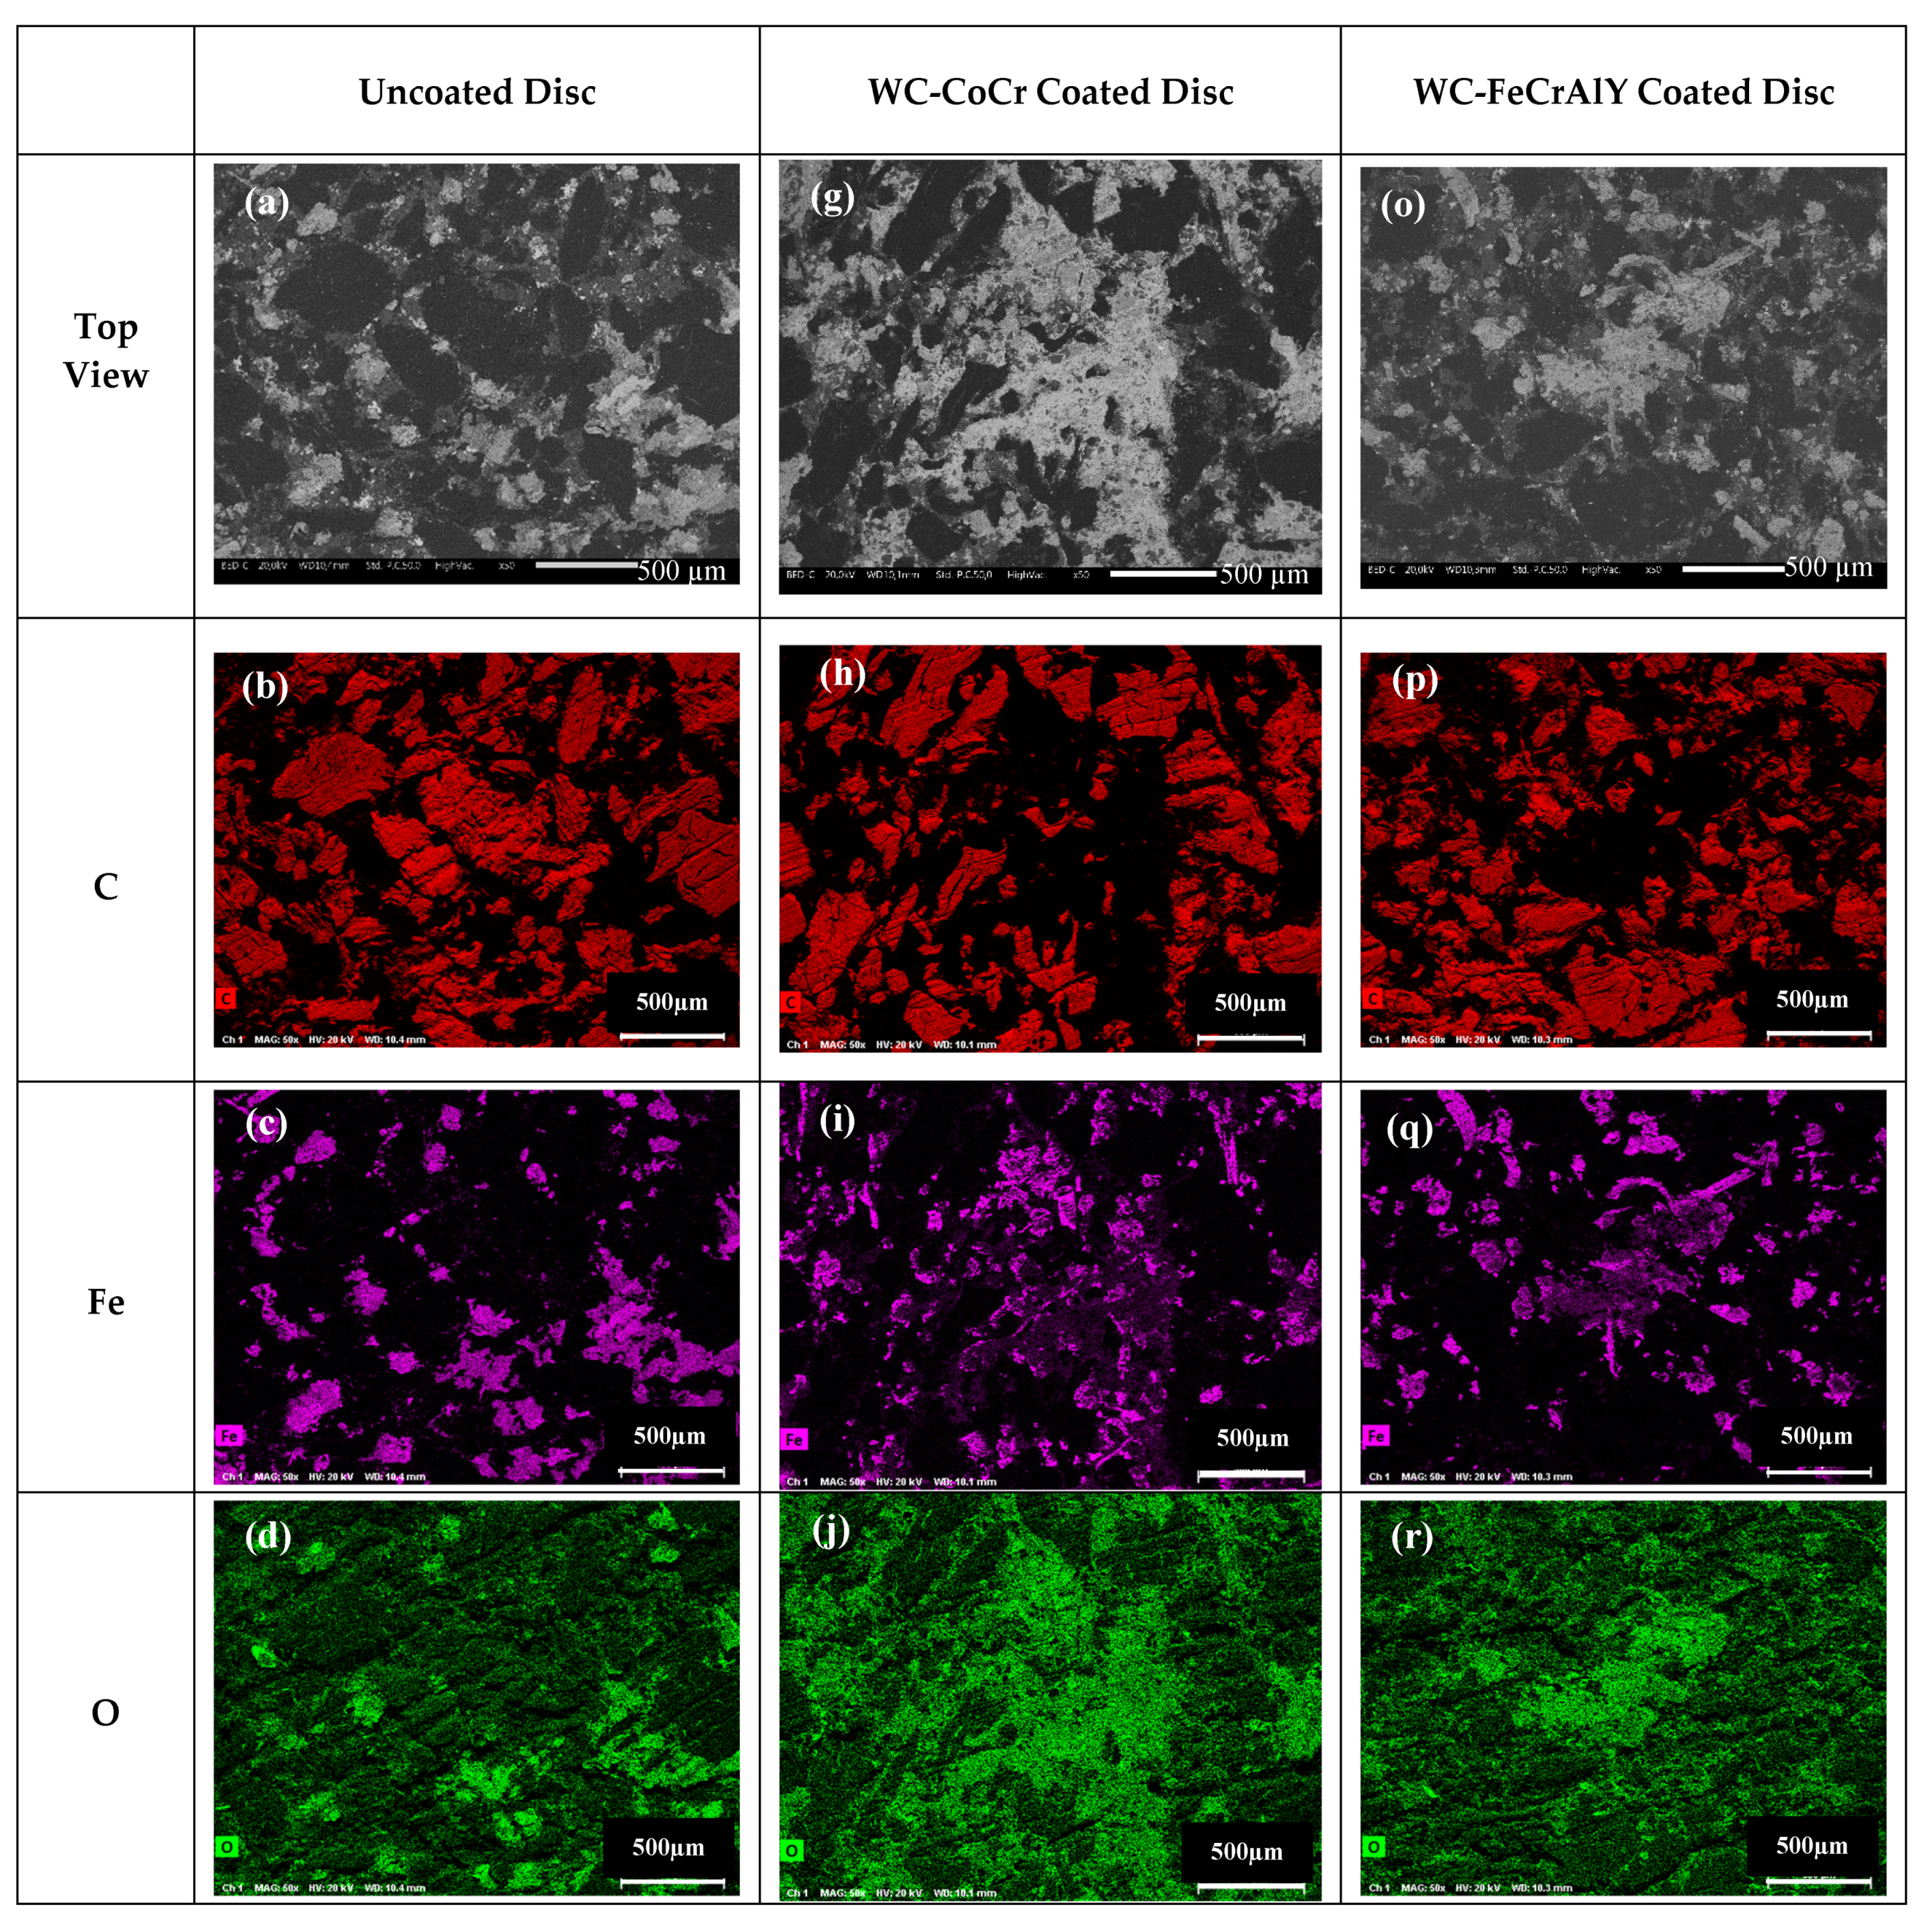
3.4. Analysis of the Worn Disc Surface

Figure 15 depicts the worn top surfaces of all the counterface discs at different magnifications. The worn surface of the uncoated martensitic stainless steel is shown in Figure 15a,b. In this case, the direction of sliding can be appreciated. On the worn surface, two distinctive regions can be seen—light and dark grey. The light grey region is the actual disc surface, without any wear debris adhesion. The dark grey regions, aligned along the direction of sliding, are due to the friction layer adherence onto the disc surface. The composition of the friction layer, as evaluated from the EDXS analysis, is shown in Table 9. The friction layer that is present on the disc surface is predominantly constituted of Fe oxides with Cr (i.e., a composition that is similar to the friction layer forming on the surface of the pin layer (Figure 9 and Table 3)). The detected silicon is a pin constituent. The Fe/O ratio can be considered for the disc counterface to get some insight into the presence of oxides that were presence on the disc surface [38]. As a rule of thumb, a ratio that is below 8 signifies the presence of a relatively thick oxide surface layer. If the ratio is above 8, it denotes metallic wear. In this case, the Fe/O ratio was 4, indicating the significant presence of an oxide layer on the surface.
Now to consider the worn coated disc surfaces. After the coating process, the surfaces are characterized by the presence of pores/valleys [16]. The worn coating surface of the WC-CoCr counterface is shown in Figure 15c,d. As already found in [21,27], a great extent of the valleys being filled can be easily observed. An EDXS point analysis was conducted in the regions containing these debris-filled pores and the results are tabulated in Table 9. The valleys were mainly filled with coating constituent—oxides of W, Co, and Cr, along with some pin constituents that were similar to Fe and Si. The Fe/O ratio, in this case, was 0.36, indicating a prevailing presence of iron oxides. The worn WC-FeCrAlY surface is shown in Figure 15e,f. Its surface, that resulted from the EDXS analyses (Table 9), turned out to be mainly covered with coating constituents, e.g., W, O, Fe, Cr, and Al. A minor concentration of Si was also observed. The Fe/O ratio, equal to 1.27, confirmed the higher oxide layer coverage than the uncoated disc, but slightly lower than on the WC-CoCr coating surface.

4. Discussion

4.1. Coefficient of Friction

During dry sliding tests, in brittle materials such as the SiC-graphite composite that was evaluated in this investigation, the ‘running in’ stage might be lengthy, along with difficulty in reaching a long steady state in the friction traces. Hence, in the case of the pairing with the uncoated martensitic stainless steel, a ‘bedding procedure’ was required to achieve a steady state in the CoF traces, for which, an hour of ‘run in’ (steps 1 and 2) was conducted.
The brittle nature of the pin explains its CoF trends and magnitude with the uncoated disc. In Figure 5a, considerable fluctuations in the friction traces were observed. This can be attributed to the dynamic formation and removal of the friction layer from the contacting surfaces. Furthermore, the brittleness of the pin composition also made it rather difficult to form and sustain a compact and extended friction layer over its surface (as seen in Figure 9a), even with the high transfer from the abrasive wear of the uncoated disc surface in Figure 15a,b.
Consider now the CoF curves and the magnitude of the pin with the coatings. In the beginning, from the friction curves in Figure 5b,c, the CoF magnitude was close to 0.2, which is due to the interaction of the coating with the ceramic constituents of the pin, resulting in low adhesion. As the testing duration progresses, an increase in the CoF magnitude is observed due to the material transfer onto the contacting surfaces, followed by a decrease in the magnitude. This decrease in the CoF magnitude and trend is ascribed to the oxidation of the friction layer, as can be seen from the maps in Figure 9 and Figure 15, and Table 3 and Table 9 [23,45,46]. The stabilization of the CoF traces in the case of WC-FeCrAlY coating could additionally be attributed to the deposition and sustenance of the friction layer on the coating surfaces, as shown in Figure 15c–f. As seen in Figure 2, the deposited coatings constitute porosity in the cross-section, which is also present on the surfaces. The porosities act as a reservoir for the storing of debris, entrapping any detached constituents from the contacted surfaces. The prolonged presence of this friction layer on the coated surfaces (unlike in the case of the uncoated disc) assisted in the attainment of steady state in the CoF curves for the coatings without the need of a bedding procedure. However, even after the formation of a well compacted friction layer, a steady state was not observed in the case of the WC-CoCr coating. This is attributed to the relationship between the work of adhesion and contact temperature on the main phases in the friction layer, which influences the CoF trends and magnitude. The peak was obtained when the contact temperature was the highest. Here, the surface energy of the compounds that are present in the friction layer reduces, resulting in a decrease in the CoF magnitude. In this way, the friction layer imbibes the properties of a lubricant. However, the decrease in the CoF magnitude leads to a decrease in the contact temperature, which subsequently increases the work of adhesion. Once the work of adhesion increases, the CoF also varies/increases with respect to it. Due to this, in the case of WC-CoCr coating, the CoF trend never observed a ‘steady state’.

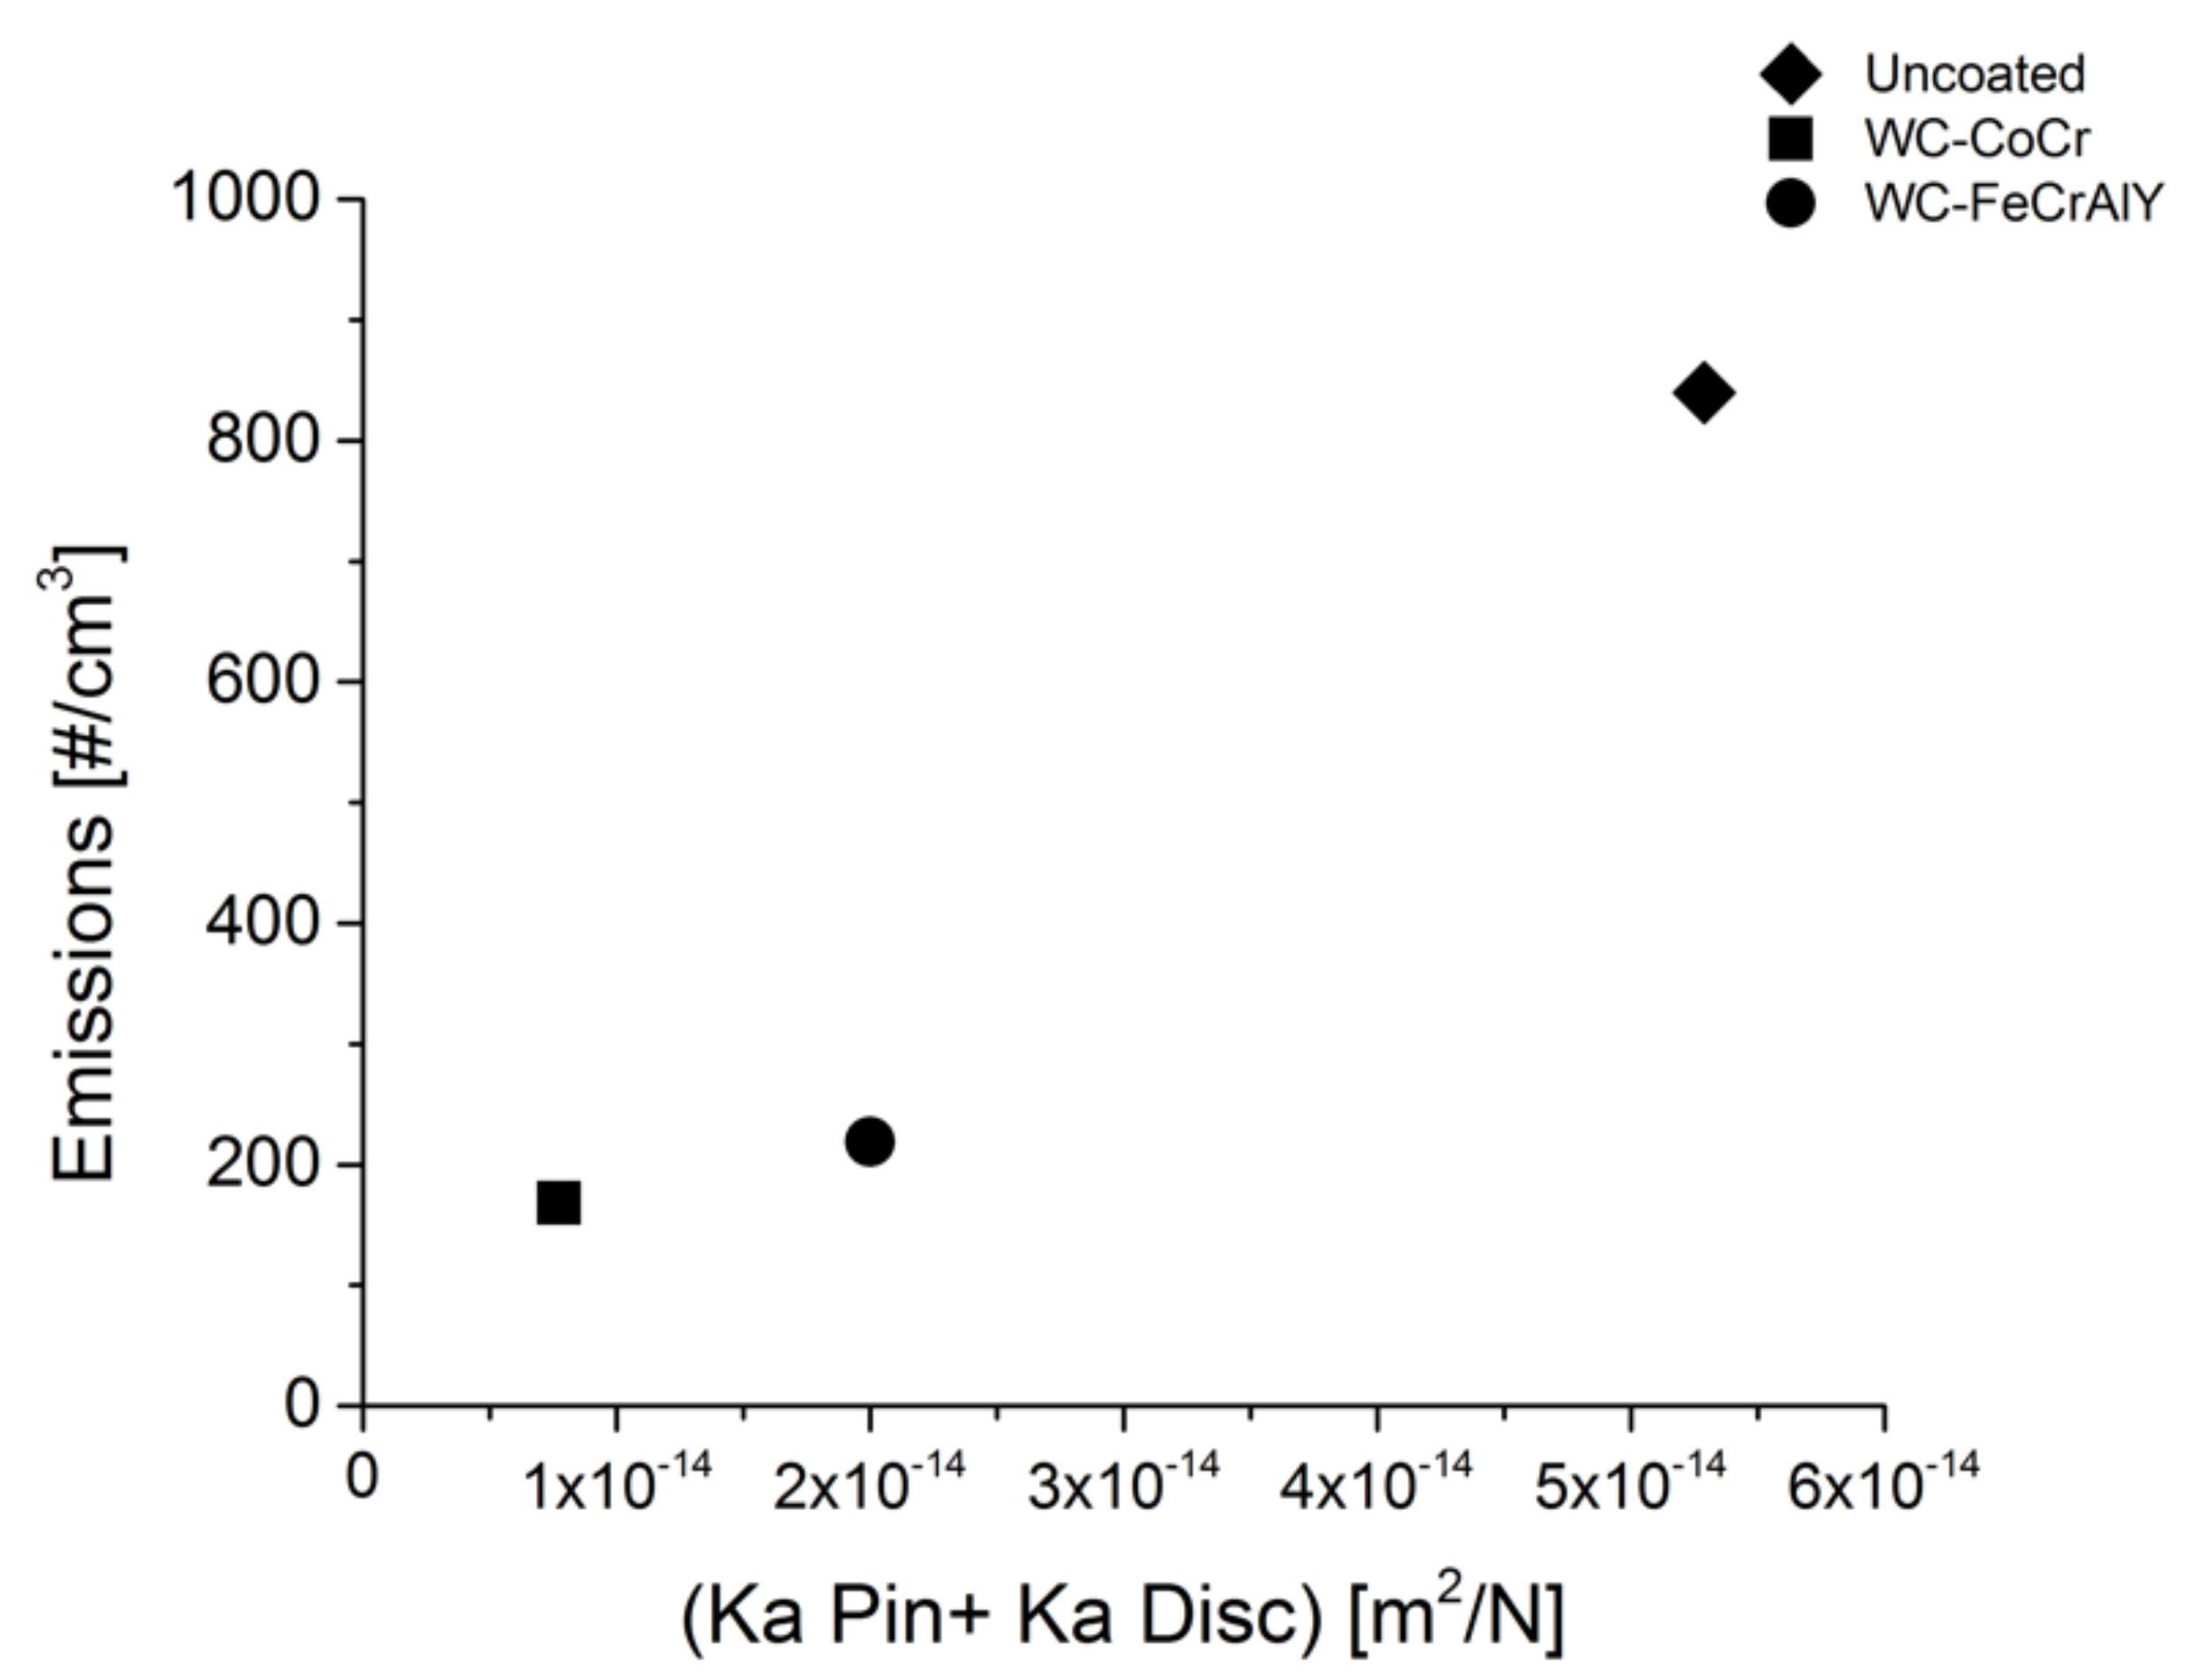
4.2. Wear and Emission Trends and Magnitude and Their Relationship

Figure 16 presents the relationship between the emission and the corresponding total wear rate of the pin and disc for all the three pairings that were considered in the present study. Concerning the pin pairing with the uncoated disc, the brittle nature of the pin material led to the dynamic formation and disruption of the deposited friction layer on the pin and disc surfaces. Due to the absence of a sustained and extended friction layer, the pin observed comparatively higher wear (Figure 7b). The corresponding high emissions of the system were due to the periodic removal of the friction layer (as seen in Figure 7c). This agrees with Figure 16, where the uncoated counterface presents the highest magnitude in the relationship (the higher the wear, the higher the emissions of a system).
Along with the presence of the friction layer, the TEM analysis with the uncoated disc pairing also recorded the presence of SiC and graphite, which could be due to the brittle detachment from the pin surface. As seen from Figure 9, SiC and graphite do not take part in the formation of the friction layer. Hence, the TEM analysis did not observe any other constituents that were attached to the SiC and graphite particles. Lastly, the hard and brittle pin constituents resulted in the abrasive wear of the uncoated disc surface (as seen in Figure 15a–c), leading to elevated disc wear (shown in Figure 8a), which is also a further contributor to the increase in the emissions of the system.
For the coatings, both pin wear and emissions were appreciably lower than the uncoated counterface. Firstly, from Figure 8b,c, the wear rates of the coated discs were shown to be significantly lower than the uncoated counterface. This is due to the high hardness of the coatings. The same can be said of the pin wear rate when paired with the coatings rather than with the uncoated disc, due to the formation, sustenance, and extension of a friction layer (Figure 9). Such a friction layer on the pin surface may form thanks to the excellent and strong interfacial adhesion of WC from the coating onto the Fe on the pin surface, which is also demonstrated by Li et al. [47] and Yang et al. [48]. From a previous investigation [37], it was observed that the friction layer on the pin surface would always deposit on an iron fiber/particle. Additionally, from Figure 9 and Table 3, it was shown that the friction layer on the pin surface was made of iron oxides and coating constituents, such as W, Co, Cr, and Al, in the first place. Due to the interfacial adhesion, the WC from the coating along with other disc constituents ‘clung’ to the Fe fibers/particles on the pin surface, forming a compact and extended friction layer, which may resist longer during the PoD tests. Due to the presence of a continuous friction layer (both on the pins and the coated discs) and the high hardness of the coatings, the wear of the system is low, which directly reflects on the lower emission rates (Figure 16). Lastly, similar to the uncoated disc, the TEM analysis showed the presence of a detached friction layer from the contacted surfaces, accompanied by a few fragments of the coatings.
Concerning the environmental compatibility, the WC-CoCr coatings provide desirable wear properties (low pin and disc wear, emissions) amongst all the pairings. However, the presence of cobalt in the airborne emissions (Table 4 and Table 5) is worrisome for the possible impact on health and the environment. In this regard, the WC-FeCrAlY coating, which is devoid of any harmful constituents, is an interesting alternative; it has only slightly higher wear and emission trends. Furthermore, this coating has a strongly preferable wear behavior and characteristics when compared to the uncoated disc.

5. Conclusions

A newly developed SiC-graphite-based composite friction material was subjected to a dry sliding wear test on PoD using three types of counterface discs to evaluate and compare their emission and wear characteristics:
  • The tests with the uncoated martensitic stainless steel exhibited considerable fluctuations in the CoF. This was attributed to the constant formation and disruption of the friction layer due to the predominantly brittle nature of the pin constituents. The continuous disruption of the friction layer also resulted in elevated wear and system emissions.
  • Due to the high hardness of the coatings, the coated discs exhibited very low/negligible wear. The excellent adhesion of WC with the Fe on the pin surface led to the formation of a compact and extended friction layer, which was difficult to disrupt. Additionally, the pores/valleys on the coating surface accommodated a sustained friction layer. The extended presence of the friction layer led to low pin wear and emissions when compared to the uncoated disc.
  • The origin of the emitted particles from the periodic disruption of the friction layer was proven based on the analytical data, demonstrating the compatibility of the composition of the collected PM with that of the friction layer forming on the pin surface.
  • Keeping in mind the tribological behavior, as well as concerns towards the protection of the environment, the pairing with the WC-FeCrAlY coating was the most suitable alternative for high intensity braking applications, as it provided comparable wear characteristics as the WC-CoCr coating and very low pin wear and emissions when compared to the uncoated discs. Furthermore, the absence of harmful agents such as Co (unlike WC-CoCr coating) ensures the required environmental friendliness in the pairings for braking applications, which are being actively sought after. This observation calls for further study and analysis through specific dynamometric bench tests to obtain additional data regarding the braking behavior of the most promising friction couple (with WC-FeCrAlY coating).

Author Contributions

Conceptualization, G.S. and S.G.; methodology, P.J., A.S., S.G. and G.S.; software, P.J. and A.S.; validation, P.J., A.S. and G.S.; formal analysis, P.J.; investigation, P.J.; resources, S.G.; data curation, P.J.; writing—original draft preparation, P.J. and A.S.; writing—review and editing, S.G. and G.S.; visualization, G.S.; supervision, G.S.; project administration, G.S. All authors have read and agreed to the published version of the manuscript.

Funding

This research received no external funding.

Institutional Review Board Statement

Not applicable.

Informed Consent Statement

Not applicable.

Data Availability Statement

Not applicable.

Acknowledgments

This research has been conducted in the framework of the Project: “Reducing Vehicular Non-Exhaust Emissions” financed by the Italian Ministry of the University within the Department of Excellence scheme. The authors gratefully acknowledge the contribution of Ing. Simone Turani of Brembo, Italy for helpful discussions and for providing the pin specimens.

Conflicts of Interest

The authors declare no conflict of interest.

References

  1. Menapace, C.; Mancini, A.; Federici, M.; Straffelini, G.; Gialanella, S. Characterization of airborne wear debris produced by brake pads pressed against HVOF-coated discs. Friction 2019, 8, 421–432. [Google Scholar] [CrossRef] [Green Version]
  2. Grigoratos, T.; Martini, G. Brake wear particle emissions: A review. Environ. Sci. Pollut. Res. 2014, 22, 2491–2504. [Google Scholar] [CrossRef] [PubMed] [Green Version]
  3. Alemani, M.; Wahlström, J.; Olofsson, U. On the influence of car brake system parameters on particulate matter emissions. Wear 2018, 396–397, 67–74. [Google Scholar] [CrossRef]
  4. Verma, P.C.; Menapace, L.; Bonfanti, A.; Ciudin, R.; Gialanella, S.; Straffelini, G. Braking pad-disc system: Wear mechanisms and formation of wear fragments. Wear 2014, 322–323, 251–258. [Google Scholar] [CrossRef]
  5. Nosko, O.; Olofsson, U. Quantification of ultrafine airborne particulate matter generated by the wear of car brake materials. Wear 2017, 374–375, 92–96. [Google Scholar] [CrossRef]
  6. Westerlund, K.G.; Johansson, C. Emissions of metals and particulate matter due to wear of brake linings in Stockholm. Adv. Air Pollut. 2002, 11, 793–802. [Google Scholar] [CrossRef]
  7. Garg, B.D.; Cadle, S.H.; Mulawa, P.A.; Groblicki, P.J.; Laroo, C.; Parr, G.A. Brake Wear Particulate Matter Emissions. Environ. Sci. Technol. 2000, 34, 4463–4469. [Google Scholar] [CrossRef]
  8. Straffelini, G.; Gialanella, S. Airborne particulate matter from brake systems: An assessment of the relevant tribological formation mechanisms. Wear 2021, 478–479, 203883. [Google Scholar] [CrossRef]
  9. Verma, P.C.; Alemani, M.; Gialanella, S.; Lutterotti, L.; Olofsson, U.; Straffelini, G. Wear debris from brake system materials: A multi-analytical characterization approach. Tribol. Int. 2015, 94, 249–259. [Google Scholar] [CrossRef]
  10. Hagino, H.; Oyama, M.; Sasaki, S. Airborne brake wear particle emission due to braking and accelerating. Wear 2015, 334–335, 44–48. [Google Scholar] [CrossRef]
  11. Tarasiuk, W.; Golak, K.; Tsybrii, Y.; Nosko, O. Correlations between the wear of car brake friction materials and airborne wear particle emissions. Wear 2020, 456–457, 203361. [Google Scholar] [CrossRef]
  12. Song, W.; Park, J.; Choi, J.; Lee, J.J.; Jang, H. Effects of reinforcing fibers on airborne particle emissions from brake pads. Wear 2021, 484–485, 203996. [Google Scholar] [CrossRef]
  13. Nogueira, A.P.G.; Carlevaris, D.; Menapace, C.; Straffelini, G. Tribological and Emission Behavior of Novel Friction Materials. Atmosphere 2020, 11, 1050. [Google Scholar] [CrossRef]
  14. Hulskotte, J.H.J.; Roskam, G.D.; van der Gon, H.A.C.D. Elemental composition of current automotive braking materials and derived air emission factors. Atmos. Environ. 2014, 99, 436–445. [Google Scholar] [CrossRef]
  15. Pulsford, J.; Venturi, F.; Pala, Z.; Kamnis, S.; Hussain, T. Application of HVOF WC-Co-Cr coatings on the internal surface of small cylinders: Effect of internal diameter on the wear resistance. Wear 2019, 432–433, 202965. [Google Scholar] [CrossRef]
  16. Federici, M.; Menapace, C.; Moscatelli, A.; Gialanella, S.; Straffelini, G. Effect of roughness on the wear behavior of HVOF coatings dry sliding against a friction material. Wear 2016, 368–369, 326–334. [Google Scholar] [CrossRef]
  17. Voyer, J.; Marple, B.R. Sliding wear behavior of high velocity oxy-fuel and high power plasma spray-processed tungsten carbide-based cermet coatings. Wear 1999, 225–229, 135–145. [Google Scholar] [CrossRef]
  18. Thakur, L.; Arora, N.; Jayaganthan, R.; Sood, R. An investigation on erosion behavior of HVOF sprayed WC–CoCr coatings. Appl. Surf. Sci. 2011, 258, 1225–1234. [Google Scholar] [CrossRef]
  19. Lee, C.W.; Han, J.H.; Yoon, J.; Shin, M.C.; Kwun, S.I. A study on powder mixing for high fracture toughness and wear resistance of WC–Co–Cr coatings sprayed by HVOF. Surf. Coat. Technol. 2010, 204, 2223–2229. [Google Scholar] [CrossRef]
  20. Picas, J.A.; Punset, M.; Baile, M.T.; Martín, E.; Forn, A. Properties of WC-CoCr Based Coatings Deposited by Different HVOF Thermal Spray Processes. Plasma Process. Polym. 2009, 6, S948–S953. [Google Scholar] [CrossRef]
  21. Jayashree, P.; Turani, S.; Straffelini, G. Dry sliding behavior of HVOF WC-CoCr coated counterface against Cu-Sn and SiC-graphite composite materials. Surf. Coat. Technol. 2020, 397, 125977. [Google Scholar] [CrossRef]
  22. Prabhu, T.R.; Varma, V.K.; Vedantam, S. Effect of SiC volume fraction and size on dry sliding wear of Fe/SiC/graphite hybrid composites for high sliding speed applications. Wear 2014, 309, 1–10. [Google Scholar] [CrossRef]
  23. Federici, M.; Menapace, C.; Mancini, A.; Straffelini, G.; Gialanella, S. Pin-on-disc study of dry sliding behavior of Co-free HVOF-coated disc tested against different friction materials. Friction 2021, 9, 1242–1258. [Google Scholar] [CrossRef]
  24. Berger, L.-M. Application of hardmetals as thermal spray coatings. Int. J. Refract. Met. Hard Mater. 2015, 49, 350–364. [Google Scholar] [CrossRef]
  25. Ghabchi, A.; Sampath, S.; Holmberg, K.; Varis, T. Damage mechanisms and cracking behavior of thermal sprayed WC–CoCr coating under scratch testing. Wear 2014, 313, 97–105. [Google Scholar] [CrossRef]
  26. Federici, M.; Straffelini, G.; Gialanella, S. Pin-on-Disc Testing of Low-Metallic Friction Material Sliding Against HVOF Coated Cast Iron: Modelling of the Contact Temperature Evolution. Tribol. Lett. 2017, 65, 121. [Google Scholar] [CrossRef] [Green Version]
  27. Jayashree, P.; Turani, S.; Straffelini, G. Effect of velocity and temperature on the dry sliding behavior of a SiC-Graphite composite against WC-CoCr and WC-FeCrAlY HVOF coatings. Wear 2020, 464–465, 203553. [Google Scholar] [CrossRef]
  28. Bolelli, G.; Börner, T.; Bozza, F.; Cannillo, V.; Cirillo, G.; Lusvarghi, L. Cermet coatings with Fe-based matrix as alternative to WC–CoCr: Mechanical and tribological behaviours. Surf. Coat. Technol. 2012, 206, 4079–4094. [Google Scholar] [CrossRef]
  29. Zhou, X.; Zhu, D.; Xie, Q.; Luo, F.; Zhou, W. Friction and wear properties of C/C–SiC braking composites. Ceram. Int. 2012, 38, 2467–2473. [Google Scholar] [CrossRef]
  30. Li, Z.; Xiao, P.; Zhang, B.-G.; Li, Y.; Lu, Y.-H. Preparation and tribological properties of C/C–SiC brake composites modified by in situ grown carbon nanofibers. Ceram. Int. 2015, 41, 11733–11740. [Google Scholar] [CrossRef]
  31. Shi, Q.; Xiao, P. Effect of pyrolytic carbon content on microstructure and tribological properties of C/C–SiC brake composites fabricated by isothermal chemical vapor infiltration. Solid State Sci. 2012, 14, 26–34. [Google Scholar] [CrossRef]
  32. Langhof, N.; Rabenstein, M.; Rosenlöcher, J.; Hackenschmidt, R.; Krenkel, W.; Rieg, F. Full-ceramic brake systems for high performance friction applications. J. Eur. Ceram. Soc. 2016, 36, 3823–3832. [Google Scholar] [CrossRef]
  33. Zhou, Y.; Hirao, K.; Yamauchi, Y.; Kanzaki, S. Tribological Properties of Silicon Carbide and Silicon Carbide—Graphite composite ceramics in sliding contact. J. Am. Ceram. Soc. 2003, 86, 991–1002. [Google Scholar] [CrossRef]
  34. Sharma, S.K.; Kumar, B.V.M.; Kim, Y.-W. Tribological Behavior of Silicon Carbide Ceramics—A Review. J. Korean Ceram. Soc. 2016, 53, 581–596. [Google Scholar] [CrossRef] [Green Version]
  35. Jahanmir, S. Wear transitions and tribochemical reactions in ceramics. Proc. Inst. Mech. Eng. Part J J. Eng. Tribol. 2002, 216, 371–385. [Google Scholar] [CrossRef]
  36. Lafon-Placette, S.; Delbé, K.; Denape, J.; Ferrato, M. Tribological characterization of silicon carbide and carbon materials. J. Eur. Ceram. Soc. 2015, 35, 1147–1159. [Google Scholar] [CrossRef] [Green Version]
  37. Jayashree, P.; Turani, S.; Straffelini, G. Effect of temperature and sliding speed on the dry sliding behavior of a SiC-graphite composite against martensitic steel. Wear 2020, 450–451, 203242. [Google Scholar] [CrossRef]
  38. Jayashree, P.; Federici, M.; Bresciani, L.; Turani, S.; Sicigliano, R.; Straffelini, G. Effect of Steel Counterface on the Dry Sliding Behaviour of a Cu-Based Metal Matrix Composite. Tribol. Lett. 2018, 66, 123. [Google Scholar] [CrossRef]
  39. Jayashree, P.; Turani, S.; Straffelini, G. Effect of testing conditions on the dry sliding behavior of a Cu-Based refractory composite material. Tribol. Int. 2019, 140, 105850. [Google Scholar] [CrossRef]
  40. Sinha, A.; Ischia, G.; Straffelini, G.; Gialanella, S. A new sample preparation protocol for SEM and TEM particulate matter analysis. Ultramicroscopy 2021, 230, 113365. [Google Scholar] [CrossRef]
  41. Cavallo, G.; Ischia, G.; Zorzin, R.; Gialanella, S. Experimental analysis on natural heated goethite from ponte di Veja (Mt Lessini, NE Italy). J. Archaeol. Sci. Rep. 2021, 36, 102871. [Google Scholar] [CrossRef]
  42. Lábár, J.L. Consistent indexing of a (set of) single crystal SAED pattern(s) with the ProcessDiffraction program. Ultramicroscopy 2005, 103, 237–249. [Google Scholar] [CrossRef] [PubMed]
  43. Lábár, J.L. Electron Diffraction Based Analysis of Phase Fractions and Texture in Nanocrystalline Thin Films, Part I: Principles. Microsc. Microanal. 2008, 14, 287–295. [Google Scholar] [CrossRef]
  44. Zhang, Q.; Lu, D.; Wang, D.; Yang, X.; Zuo, P.; Yang, H.; Fu, Q.; Liu, Q.; Jiang, G. Separation and Tracing of Anthropogenic Magnetite Nanoparticles in the Urban Atmosphere. Environ. Sci. Technol. 2020, 54, 9274–9284. [Google Scholar] [CrossRef]
  45. Straffelini, G.; Federici, M. HVOF Cermet Coatings to Improve Sliding Wear Resistance in Engineering Systems. Coatings 2020, 10, 886. [Google Scholar] [CrossRef]
  46. Federici, M.; Perricone, G.; Gialanella, S.; Straffelini, G. Sliding Behaviour of Friction Material against Cermet Coatings: Pin-on-Disc Study of the Running-in Stage. Tribol. Lett. 2018, 66, 53. [Google Scholar] [CrossRef]
  47. Li, Y.; Gao, Y.; Xiao, B.; Min, T.; Ma, S.; Yi, D. Theoretical calculations on the adhesion, stability, electronic structure, and bonding of Fe/WC interface. Appl. Surf. Sci. 2011, 257, 5671–5678. [Google Scholar] [CrossRef]
  48. Yang, G.; Liu, Y.; Hang, Z.; Xi, N.; Fu, H.; Chen, H. Adhesion at cerium doped metal-ceramic α-Fe/WC interface: A first-principles calculation. J. Rare Earths 2019, 37, 773–780. [Google Scholar] [CrossRef]
Figure 1. SEM BSE image of the cross-section of the SiC-graphite composite material. The corresponding maps are also shown.
Atmosphere 13 00296 g001
Figure 2. SEM BSE image of the cross-section of the (a) WC-CoCr and (b) WC-FeCrAlY coating.
Atmosphere 13 00296 g002
Figure 3. Microstructure of the conventional martensitic stainless steel that was obtained from an optical microscope. Microetchant: Kalling I (100 mL: 33 mL distilled water, 33 mL ethanol 96%, 33 mL HCl 32%, 1.5 g Copper (II) chloride).
Atmosphere 13 00296 g003
Figure 4. Schematics of the testing apparatus (A) ambient air, (B) fan, (C) HEPA filter, (D) air introduced in the chamber, (E) disc/counterface, (F) air outlet to the Impactor, (G) air outlet to the OPS, and (H) weights.
Atmosphere 13 00296 g004
Figure 5. Friction traces that were obtained from pairings with (a) uncoated martensitic stainless steel; (b) WC-CoCr coating; and (c) WC-FeCrAlY coating.
Atmosphere 13 00296 g005
Figure 6. Emission traces that were obtained from pairings with (a) uncoated martensitic stainless steel; (b) WC-CoCr coating; and (c) WC-FeCrAlY coating.
Atmosphere 13 00296 g006
Figure 7. Comparison of (a) CoF, the downward pointing arrow for the WC-CoCr coating represents the absence of the achievement of steady state in CoF and the continuous decrease in the CoF magnitude until the end of the testing duration; (b) Pin wear; (c) Average particle concentration with all pairings; and (d) The particle number distribution with respect to the different OPS channel diameters for all three pairings.
Atmosphere 13 00296 g007
Figure 8. Comparison of the disc profiles of (a) uncoated martensitic stainless steel; (b) WC-CoCr-coated disc; and (c) WC-FeCrAlY-coated disc. The arrows indicate the contact length.
Atmosphere 13 00296 g008
Figure 9. Worn top view and corresponding EDXS maps of the pin surface after pin on disc (PoD) testing with (af) the uncoated disc, (gn) the WC-CoCr-coated disc, and (ou) the WC-FeCrAlY-coated disc.
Atmosphere 13 00296 g009aAtmosphere 13 00296 g009b
Figure 10. SEM images of the PM in the range of 10–2.5 μm for the (a) uncoated martensitic stainless steel, (b) the WC-CoCr coating, and (c) the WC-FeCrAlY coating.
Atmosphere 13 00296 g010
Figure 11. Bright field TEM images of a cluster of collected particles that were paired with (a) conventional martensitic stainless steel, (b) the WC-CoCr coating, and (c) the WC-FeCrAlY coating. The inset in each Figure shows the SAED of each field of view. All the diffraction pattern insets have a scale of 5 nm−1.
Atmosphere 13 00296 g011
Figure 12. TEM images of a cluster of particles containing SiC. Inset scale: 5 nm−1.
Atmosphere 13 00296 g012
Figure 13. TEM images of a cluster of particles containing Graphite (1), SiC (2), and detached pin constituents with attached friction layer (3). Inset scale: 5 nm−1.
Atmosphere 13 00296 g013
Figure 14. TEM images of a cluster of particles that were collected from the counterface (a), the WC-CoCr coating, and (b) the WC-FeCrAlY coating.
Atmosphere 13 00296 g014
Figure 15. Worn top view at different magnifications of the counterface (a,b) the uncoated disc, (c,d) the WC-CoCr-coated disc, and (e,f), the WC-FeCrAlY-coated disc.
Atmosphere 13 00296 g015
Figure 16. Relationship between the emissions and (Ka pin + Ka disc) for all the three pairings.
Atmosphere 13 00296 g016
Table 1. The properties of the coatings (WC-CoCr and WC-FeCrAlY).
PropertiesWC-CoCrWC-FeCrAlY
Microhardness (HV0.3)1130 ± 901130 ± 89
Surface roughness Ra (μm)1.0 ± 0.41.0 ± 0.4
Carbide phases (wt. %)WC—46 ± 8
W2C—54 ± 9
WC—100 ± 13
Density (kg/m3)13,0009000
Coating thickness (μm)7070
Table 2. The composition and properties of the conventional martensitic stainless steel.
European StandardChemical Composition, wt. %Hardness
[HV 30]
Thermal Conductivity (W/mK)Specific Heat (J/gK)
CMnSiCrMoPS
X46Cr130.450.80.813-0.030.03342300.46
Table 3. The average composition of the friction layers that were present on the worn pin surface.
ElementUncoated Disc
wt. %
WC-CoCr Coating
wt. %
WC-FeCrAlY Coating
wt. %
Carbon3.4 ± 0.83.8 ± 0.43.2 ± 0.9
Iron63 ± 411.4 ± 227.1 ± 4
Oxygen25.1 ± 323 ± 422.2 ± 5
Silicon2.8 ± 0.4-8.3 ± 3
Tin1.1 ± 0.11.2 ± 0.22.8 ± 0.5
Chromium4.7 ± 1.22.1 ± 0.51.3 ± 0.2
Tungsten-51.5 ± 633.9 ± 5
Cobalt-6.5 ± 2-
Aluminum--0.7 ± 0.08
Table 4. Full frame EDXS analysis of the PM for all the pairings.
ElementUncoated Disc
wt. %
WC-CoCr Coating
wt. %
WC-FeCrAlY Coating
wt. %
Carbon34 ± 325 ± 234.8 ± 5
Iron40 ± 47.6 ± 216.6 ± 2.5
Oxygen17 ± 321.6 ± 417.1 ± 3
Silicon2.9 ± 0.82.9 ± 0.82.8 ± 0.9
Tin0.8 ± 0.10.7 ± 0.12.4 ± 0.9
Chromium5 ± 11.6 ± 0.51.4 ± 0.3
Tungsten-39 ± 624 ± 4
Cobalt-4 ± 1-
Aluminum--0.5 ± 0.4
Table 5. EDXS analysis of the particles that were shown in Figure 11 at the regions marked by ‘1’.
ElementUncoated Disc
Mass %
WC-CoCr Coating
Mass %
WC-FeCrAlY Coating
Mass %
Carbon29 ± 236 ± 510 ± 2
Iron38 ± 2.58 ± 346 ± 5
Oxygen23 ± 413 ± 415 ± 3
Silicon3 ± 0.5--
Tin1 ± 0.31 ± 0.32 ± 0.3
Chromium5 ± 12 ± 0.82 ± 0.8
Tungsten-35 ± 624 ± 3
Cobalt-5 ± 1.5-
Aluminum--1 ± 0.2
Table 6. EDXS analysis of the particle cluster that is shown in Figure 12 at the regions that are marked by ‘1’.
ElementArea 1
Mass %
Carbon60
Oxygen21
Silicon19
Table 7. EDXS analysis of the particles that are shown in Figure 13 at the regions that are marked by ‘1, 2, and 3’.
ElementArea 1
Mass %
Area 2
Mass %
Area 3
Mass %
Carbon992362
Oxygen1266
Silicon-523
Iron-0.125
Chromium--3
Tin--1
Table 8. EDXS analysis of the particles that are shown in Figure 14 at the regions that are marked by ‘1’.
ElementWC-CoCr
Mass %
WC-FeCrAlY
Mass %
Tungsten6262
Cobalt8-
Chromium33
Aluminum-1
Oxygen179
Iron1024
Yttrium-1
Table 9. Composition of the friction layer that was deposited onto the worn disc surface during the PoD tests.
ElementUncoated Disc
wt. %
WC-CoCr Coating
wt. %
WC-FeCrAlY Coating
wt. %
Carbon3.5 ± 15 ± 25 ± 2
Iron68.5 ± 7.54 ± 214 ± 4
Oxygen17.1 ± 211 ± 511 ± 3
Silicon1.5 ± 0.41.2 ± 0.353 ± 1
Chromium11 ± 34.2 ± 23 ± 0.8
Tungsten-66.1 ± 863 ± 5
Cobalt-8.8 ± 3-
Aluminum--1 ± 0.04
Publisher’s Note: MDPI stays neutral with regard to jurisdictional claims in published maps and institutional affiliations.

