Does Increasing Model Resolution Improve the Real-Time Forecasts of Western North Pacific Tropical Cyclones?


Department of Urban & Environmental Engineering, Ulsan National Institute of Science and Technology, Ulsan 44919, Korea
*
Author to whom correspondence should be addressed.
Atmosphere 2021, 12(6), 776; https://doi.org/10.3390/atmos12060776
Submission received: 5 May 2021
/
Revised: 10 June 2021
/
Accepted: 11 June 2021
/
Published: 16 June 2021
(This article belongs to the Section Meteorology)
Abstract
:In this study, the general impact of high-resolution moving nesting domains on tropical cyclone (TC) intensity and track forecasts was verified, for a total of 107 forecast cases of 33 TCs, using the Weather Research and Forecasting (WRF) model. The experiment, with a coarse resolution of 12 km, could not significantly capture the intensification process, especially for maximum intensities (>60 m s−1). The intense TCs were better predicted by experiments using a moving nesting domain with a horizontal resolution of 4 km. The forecast errors for maximum wind speed and minimum sea-level pressure decreased in the experiment with higher resolution; the forecast of lifetime maximum intensity was improved. For the track forecast, the experiment with a coarser resolution tended to simulate TC tracks deviating rightward to the TC motions in the best-track data; this erroneous deflection was reduced in the experiment with a higher resolution. In particular, the track forecast in the experiment with a higher resolution improved more frequently for intense TCs that were generally distributed at relatively lower latitudes among the test cases. The sensitivity of the track forecast to the model resolution was relatively significant for lower-latitude TCs. On the other hand, the track forecasts of TCs moving to the mid-latitudes, which were primarily influenced by large-scale features, were not sensitive to the resolution.
1. Introduction
Tropical cyclones (TCs) are severe natural disasters characterized by low pressure, high winds, and heavy rainfall. The socio-economic damage caused by TCs is critical and has steadily increased because of social development and an increase in population density [1,2]. The coastal area of the western North Pacific (WNP) experiences extensive damage due to having the highest number of TCs, and the high population density in the area. Accurate prediction of the TC track and its intensity will help prepare for them in advance and, thus, prevent severe damage.
Global operational TC forecast centers use the numerical weather prediction (NWP) model to forecast the TC characteristics such as track and intensity. Therefore, the prediction accuracy of the NWP model is closely related to property damage and casualties. In the past several decades, the track forecast skill of operational NWP models has steadily improved, with a mean error of less than 200 km at a lead time of 72 h [3]. However, NWP models still have significant errors, i.e., >400 km in a five-day forecast. With the growing demand for accurate medium-range forecasts, the predictability of the NWP model must be verified and improved to minimize damage.
Studying the horizontal resolution for TC forecasting is instrumental in improving the predictability of the forecast model. Increasing the model resolution affects the mesoscale phenomenon simulation of the TC forecast model, and is effective in enhancing the predictability of TC intensity. Chen et al. [4] showed that the horizontal resolution should be ~1 km to resolve the eye and eyewall structures. Davis et al. [5] showed that the inner-core structure was sensitive to the model resolution. The minimum sea level pressure (MSLP) and maximum wind speed (MWS) were better simulated when the horizontal resolution increased to 1.33 km. However, increasing the horizontal resolution does not always enhance the simulated TC intensity because some higher resolution features tend to weaken the TCs [6]. Many studies have shown that increasing the horizontal resolution often enhances the simulated TC intensity, but also impacts the simulated TC track [7,8,9].
Our previous study [10] suggested that increasing the model resolution, underestimated by a model with a horizontal grid spacing of 12 km, was required to improve the TC intensity forecasts over the WNP. Therefore, in this study, we increased the horizontal model resolution to 4 km using the moving nesting technique and verified the impact of higher model resolution on the TC intensity forecast. In addition, because only the higher resolution domain covers the TC core region, the track variation caused by the difference in the synoptic field can be minimized. Therefore, the impact of the TC core dynamics on forecasting the TC track was investigated.
2. Model Configuration and Experiments
We used the Weather Research and Forecasting (WRF) model version 4.0.0 to verify the impact of the high-resolution moving nesting domains on the TC track and intensity forecast [11]. Multiple two-way nesting domains with different horizontal grid spacings were used, with the outer domain of 12 km grid spacing and the vortex following the inner domain of 4 km grid spacing. We conducted two experiments: the first with only the outer domain (hereafter 1DM) and the second with the vortex following the inner domain along with the outer domain (hereafter 2DM). The numbers of outer domain grids were 421 and 371 for the west–east and south–north, respectively. Similar to Cha and Wang [12] and Moon et al. [10], we designed a different location of the domain for each case to improve the efficiency of computing resources. Considering the five-day migration of TCs, the center of the outer domain was designated at 10° NW of the observed TC center when the initial TC center was below 20° N, and 10° N when the initial TC center was north of 20° N. Owing to the change in the domain center for each forecast, the domain was able to cover the entire track of the simulated TCs for five days. The number of inner domain grids was 301 for both west–east and south–north. The domain contained 35 vertical levels, from the surface to the top of the atmosphere at 50 hPa, with sigma coordinates. All simulations lasted for 120 h from the model initiation.
TC vortex initialization methods were not applied in this study, in order to focus on the impact of increasing the model resolution. The physical parameterization schemes used were the Yonsei University planetary boundary layer scheme [13,14], WRF single-moment six-class microphysics scheme [15], Kain-Fritsch cumulus parameterization scheme [16], Dudhia short-wave radiation scheme [17], rapid radiative transfer model long-wave radiation scheme [18], and NOAH land surface model [19]. The cumulus parameterization scheme was turned off for the inner domain to explicitly resolve convection. We conducted 107 forecasts of 33 TCs formed over the WNP from 2013 to 2017 (Table 1). The cases that maintained an intensity stronger than that of a five-day tropical storm were chosen as test cases.
Real-time global analysis data and forecast data from the Global Forecast System (GFS) of the National Centers for Environmental Prediction (NCEP) were used to provide the initial and boundary conditions for the WRF model with a grid spacing of 0.5° (http://nomads.ncep.noaa.gov, accessed on 10 June 2021). The GFS real-time forecast is available every six hours. These 6-hourly forecast data were used as the initial and boundary forcing data through the WRF pre-processing system (WPS), and the model sea surface temperature was updated using the GFS.
The track and intensity were verified using the best-track data of the Joint Typhoon Warning Center (JTWC) (https://www.metoc.navy.mil/jtwc/jtwc, accessed on 10 June 2021). The TC center was located by identifying the point of minimum pressure in the sea level pressure field [20]. The MWS was defined as the highest wind speed within a radius of 500 km from the TC center. Track error (km) was defined as the great circle distance between the TC center of the best track data and the simulated center [21,22], calculated as follows:
where and are the longitude and latitude of the TC center in the best track data and and are longitude and latitude of the simulated TC center. The lifetime maximum intensity (LMI), used in the analysis is defined as the strongest MWS during the forecast. The track error was decomposed into along-track and cross-track biases, relative to the actual motion of the TC. They are defined as components of the residual vector, either perpendicular (cross-track) or parallel (along-track) to the transition direction of the TC. A positive cross-track bias indicates that the simulated TC is located on the right side of the best track, while a positive along-track bias implies that the simulated TC moves faster than the best track.
3. Results
3.1. Impact on TC Intensity Forecast
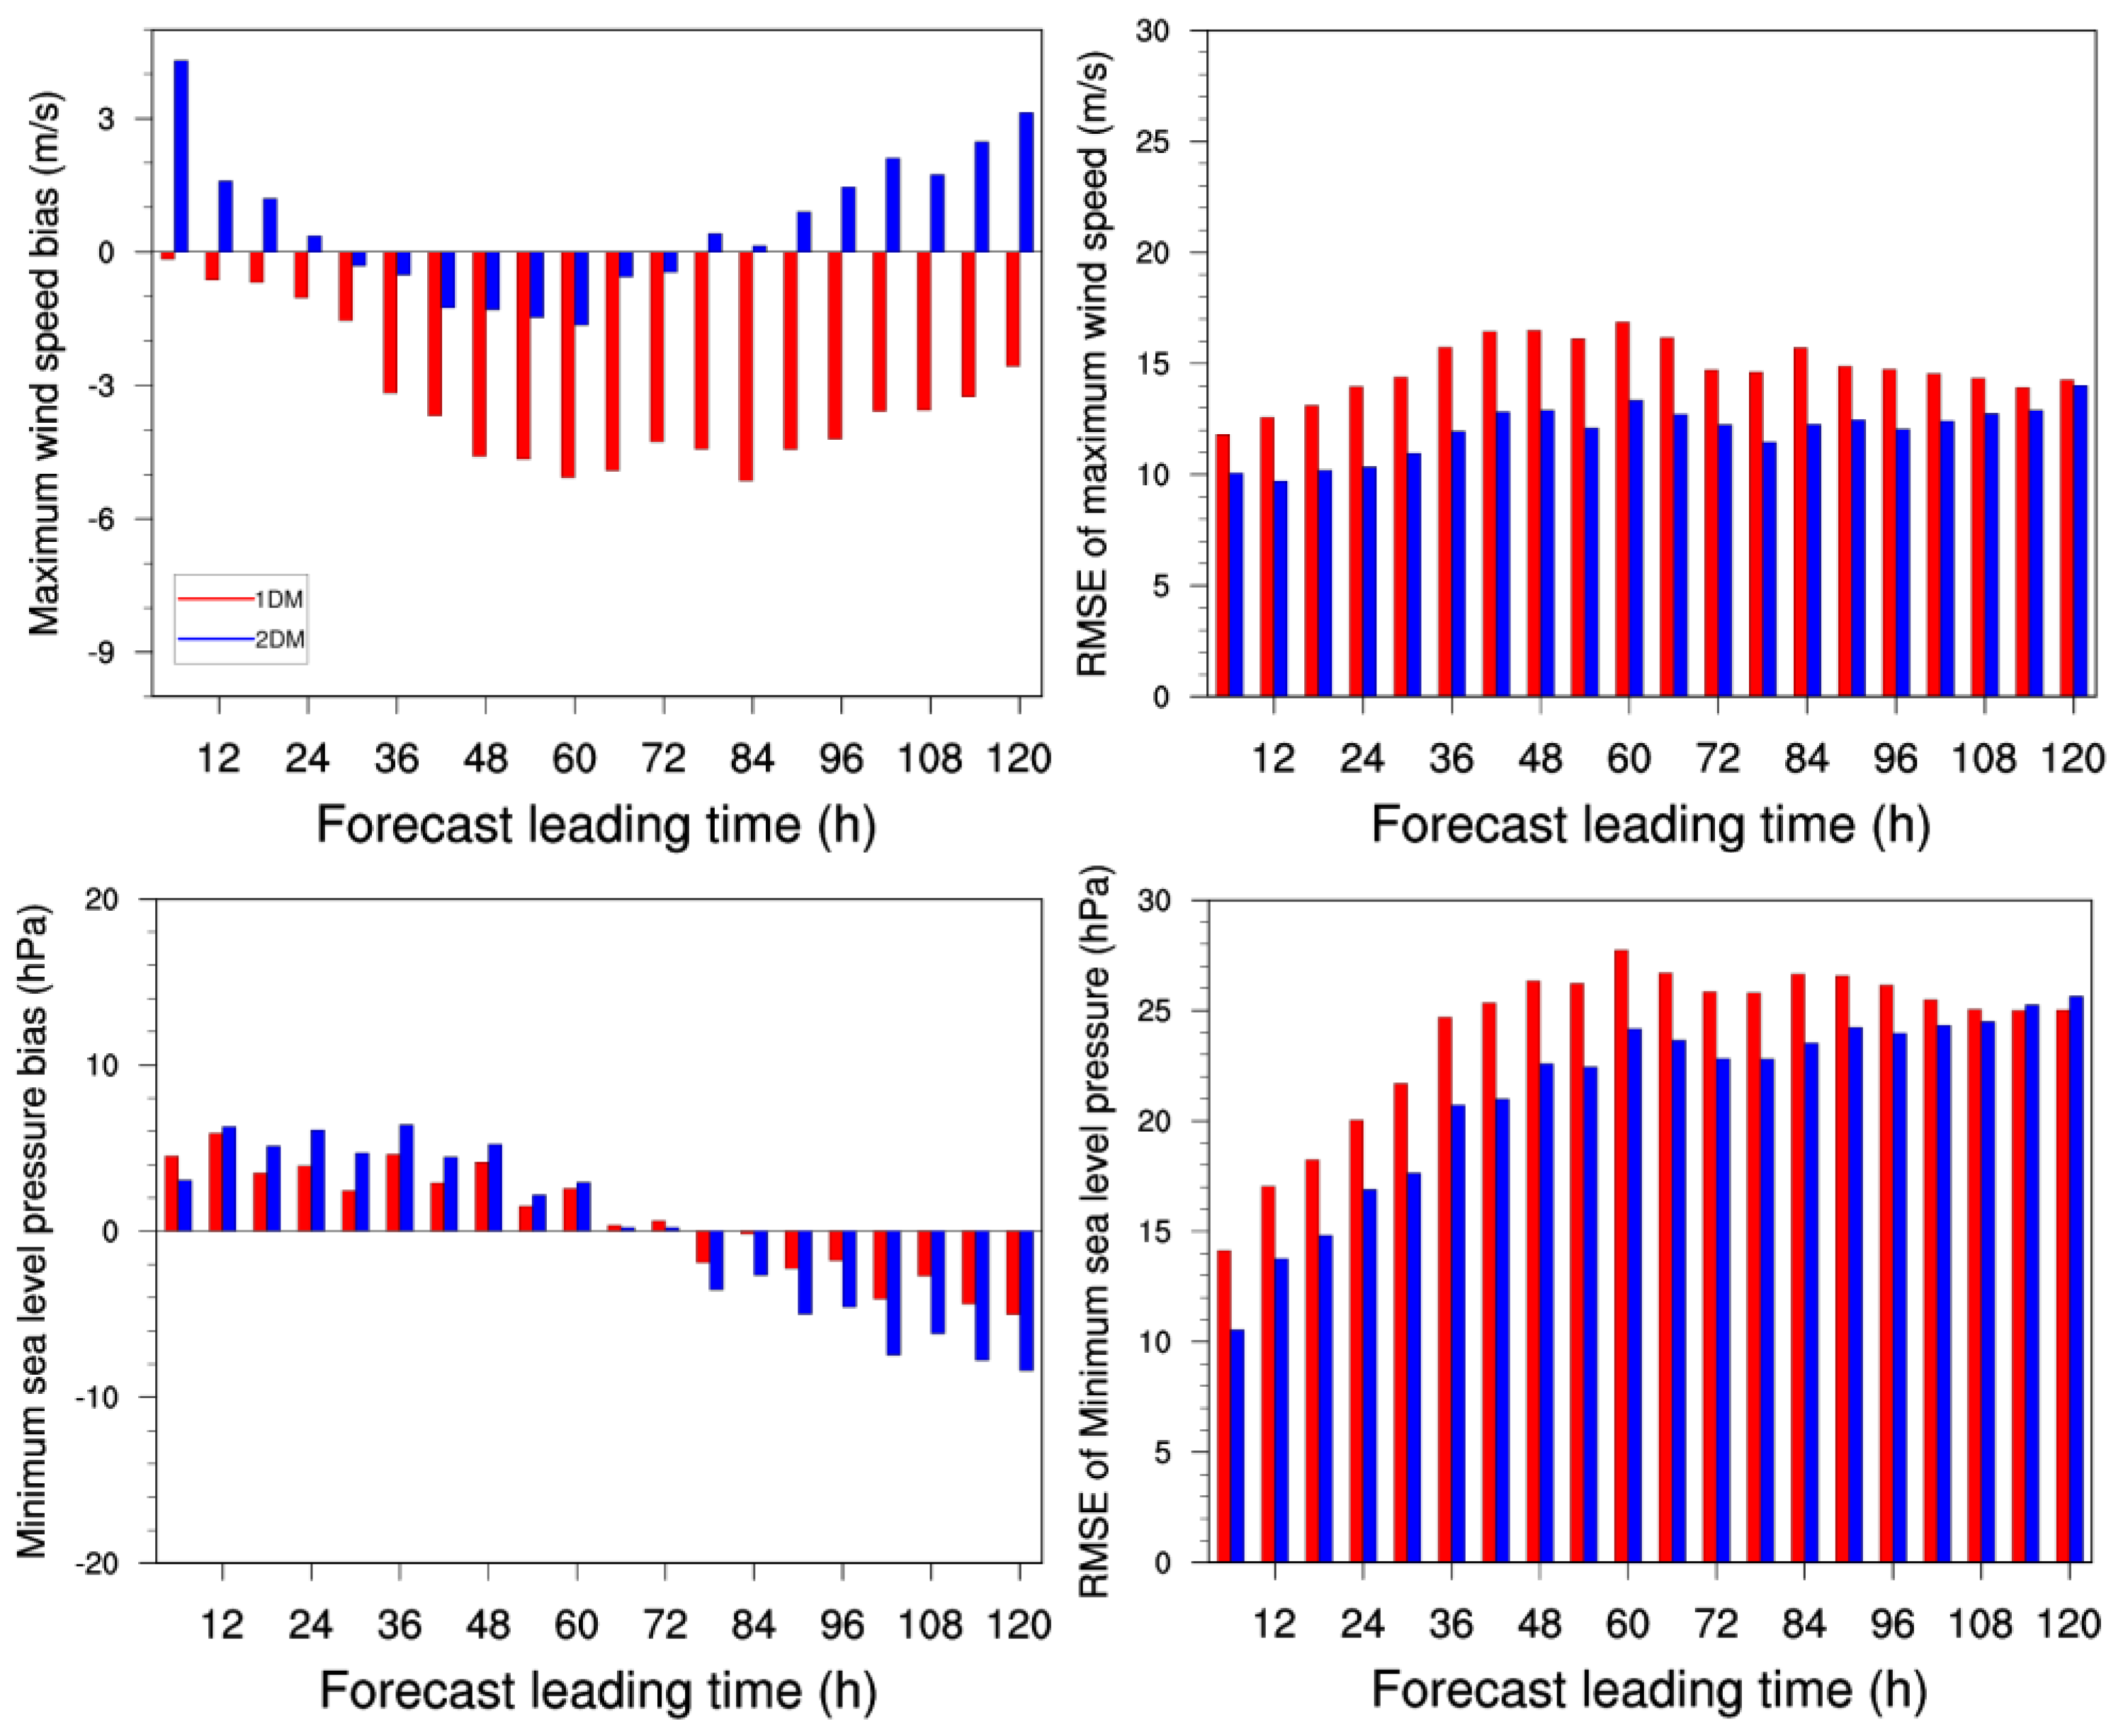
In Figure 1, we analyzed the forecast errors of TC intensity, i.e., MSLP and MWS for the 1DM and 2DM experiments. The 1DM experiment generally underestimates the MWS, while the MWS bias for the 2DM experiment was notably reduced. In many cases, the bias for 2DM minimized in the middle of the forecast time when the TCs intensified. However, the 2DM experiment tends to overestimate the MWS at the late forecast time. The cooling effect from TC-ocean interaction is not considered in the 2DM experiment because of the absence of an ocean model. Therefore, the decaying process is not properly reproduced in it. There was a sudden increase in the wind speed at the initial time of the 2DM experiment. This initial shock could be due to the conversion of the 0.5° GFS forecast data to a 4 km horizontal resolution grid, indicating that the initialization is necessary for a high-resolution TC forecast with the regional model. Both experiments simulated the MSLP with biases not exceeding 10 hPa. They overestimated the MSLP at the early forecast time, but underestimated it at the late forecast time. For MWS and MSLP, the root mean square errors (RMSEs) of the 2DM experiment were smaller than those of the 1DM experiment. For the 2DM experiment, the five-day mean RMSE of the MWS and MSLP were reduced by 19% and 11%, respectively, as compared to that for the 1DM experiment. Therefore, these results clarify that increasing the horizontal resolution intensifies the TCs, and is advantageous for the intensity forecast.
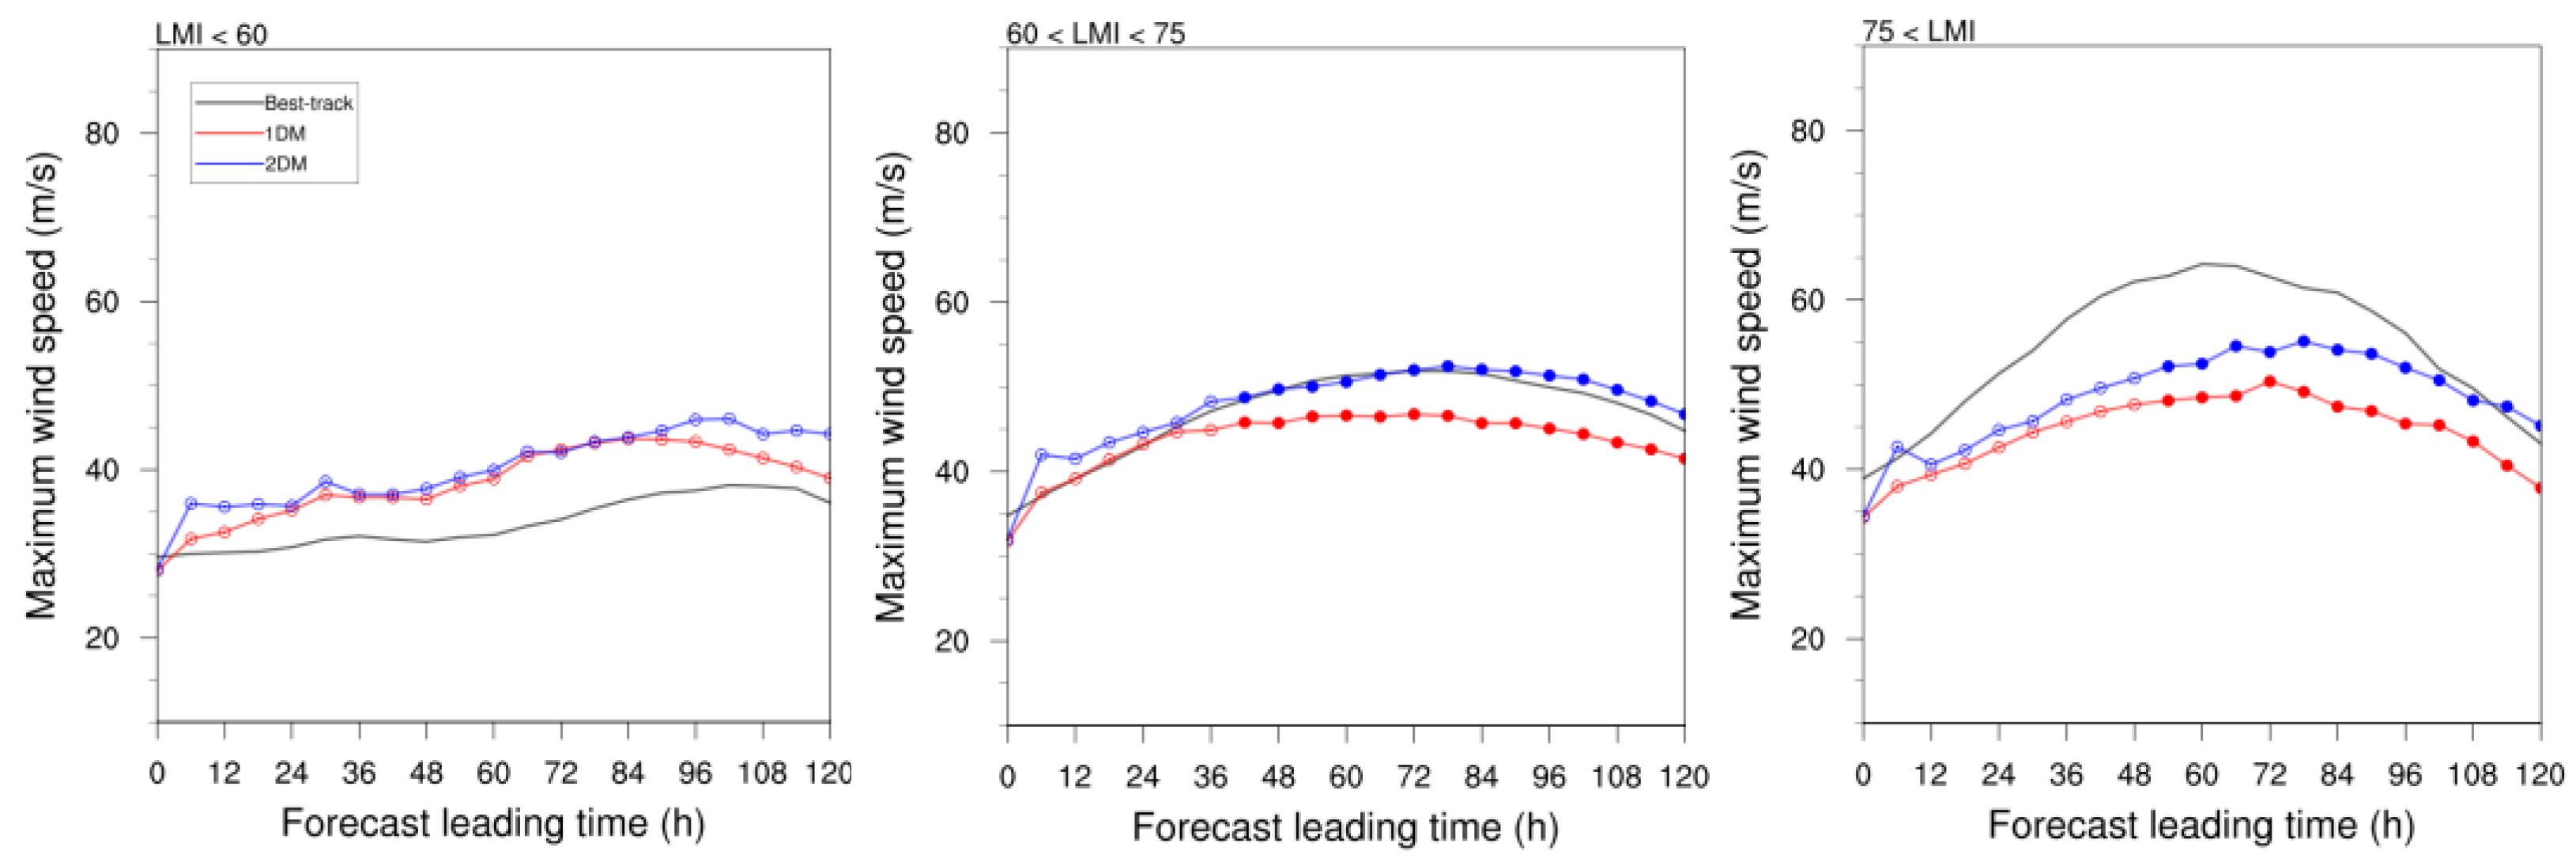
The impact of increasing the model resolution on the TC intensity forecasts can differ depending on the intensity of the TC. Therefore, we classified all TCs into three categories according to the LMI (LMI < 60 m s−1, 60 m s−1 < LMI < 75 m s−1, and 75 m s−1 < LMI) and compared the MWS forecasts for each category (Figure 2). The number of cases for weak (LMI < 60 m s−1), moderate (60 m s−1 < LMI < 75 m s−1), and strong (75 m s−1 < LMI) categories was 24, 61, and 28, respectively. Both the 1DM and 2DM experiments tend to overestimate the MWS for the weak TCs. For the moderate TCs, the 2DM experiment realistically reproduced the TC intensity, while the 1DM experiment was incapable of properly capturing them. For the strong TCs both the 1DM and 2DM experiments tend to underestimate the intensity, but the 2DM experiment more reasonably captured the intensifications of TCs. This indicates that a 12 km horizontal grid spacing is not sufficient to simulate the strongest TCs, and higher resolution has an advantage in intensity forecasting, especially for the intense TCs. However, for weak TCs, a higher model resolution can increase the intensity error because of the overestimation of wind speed.
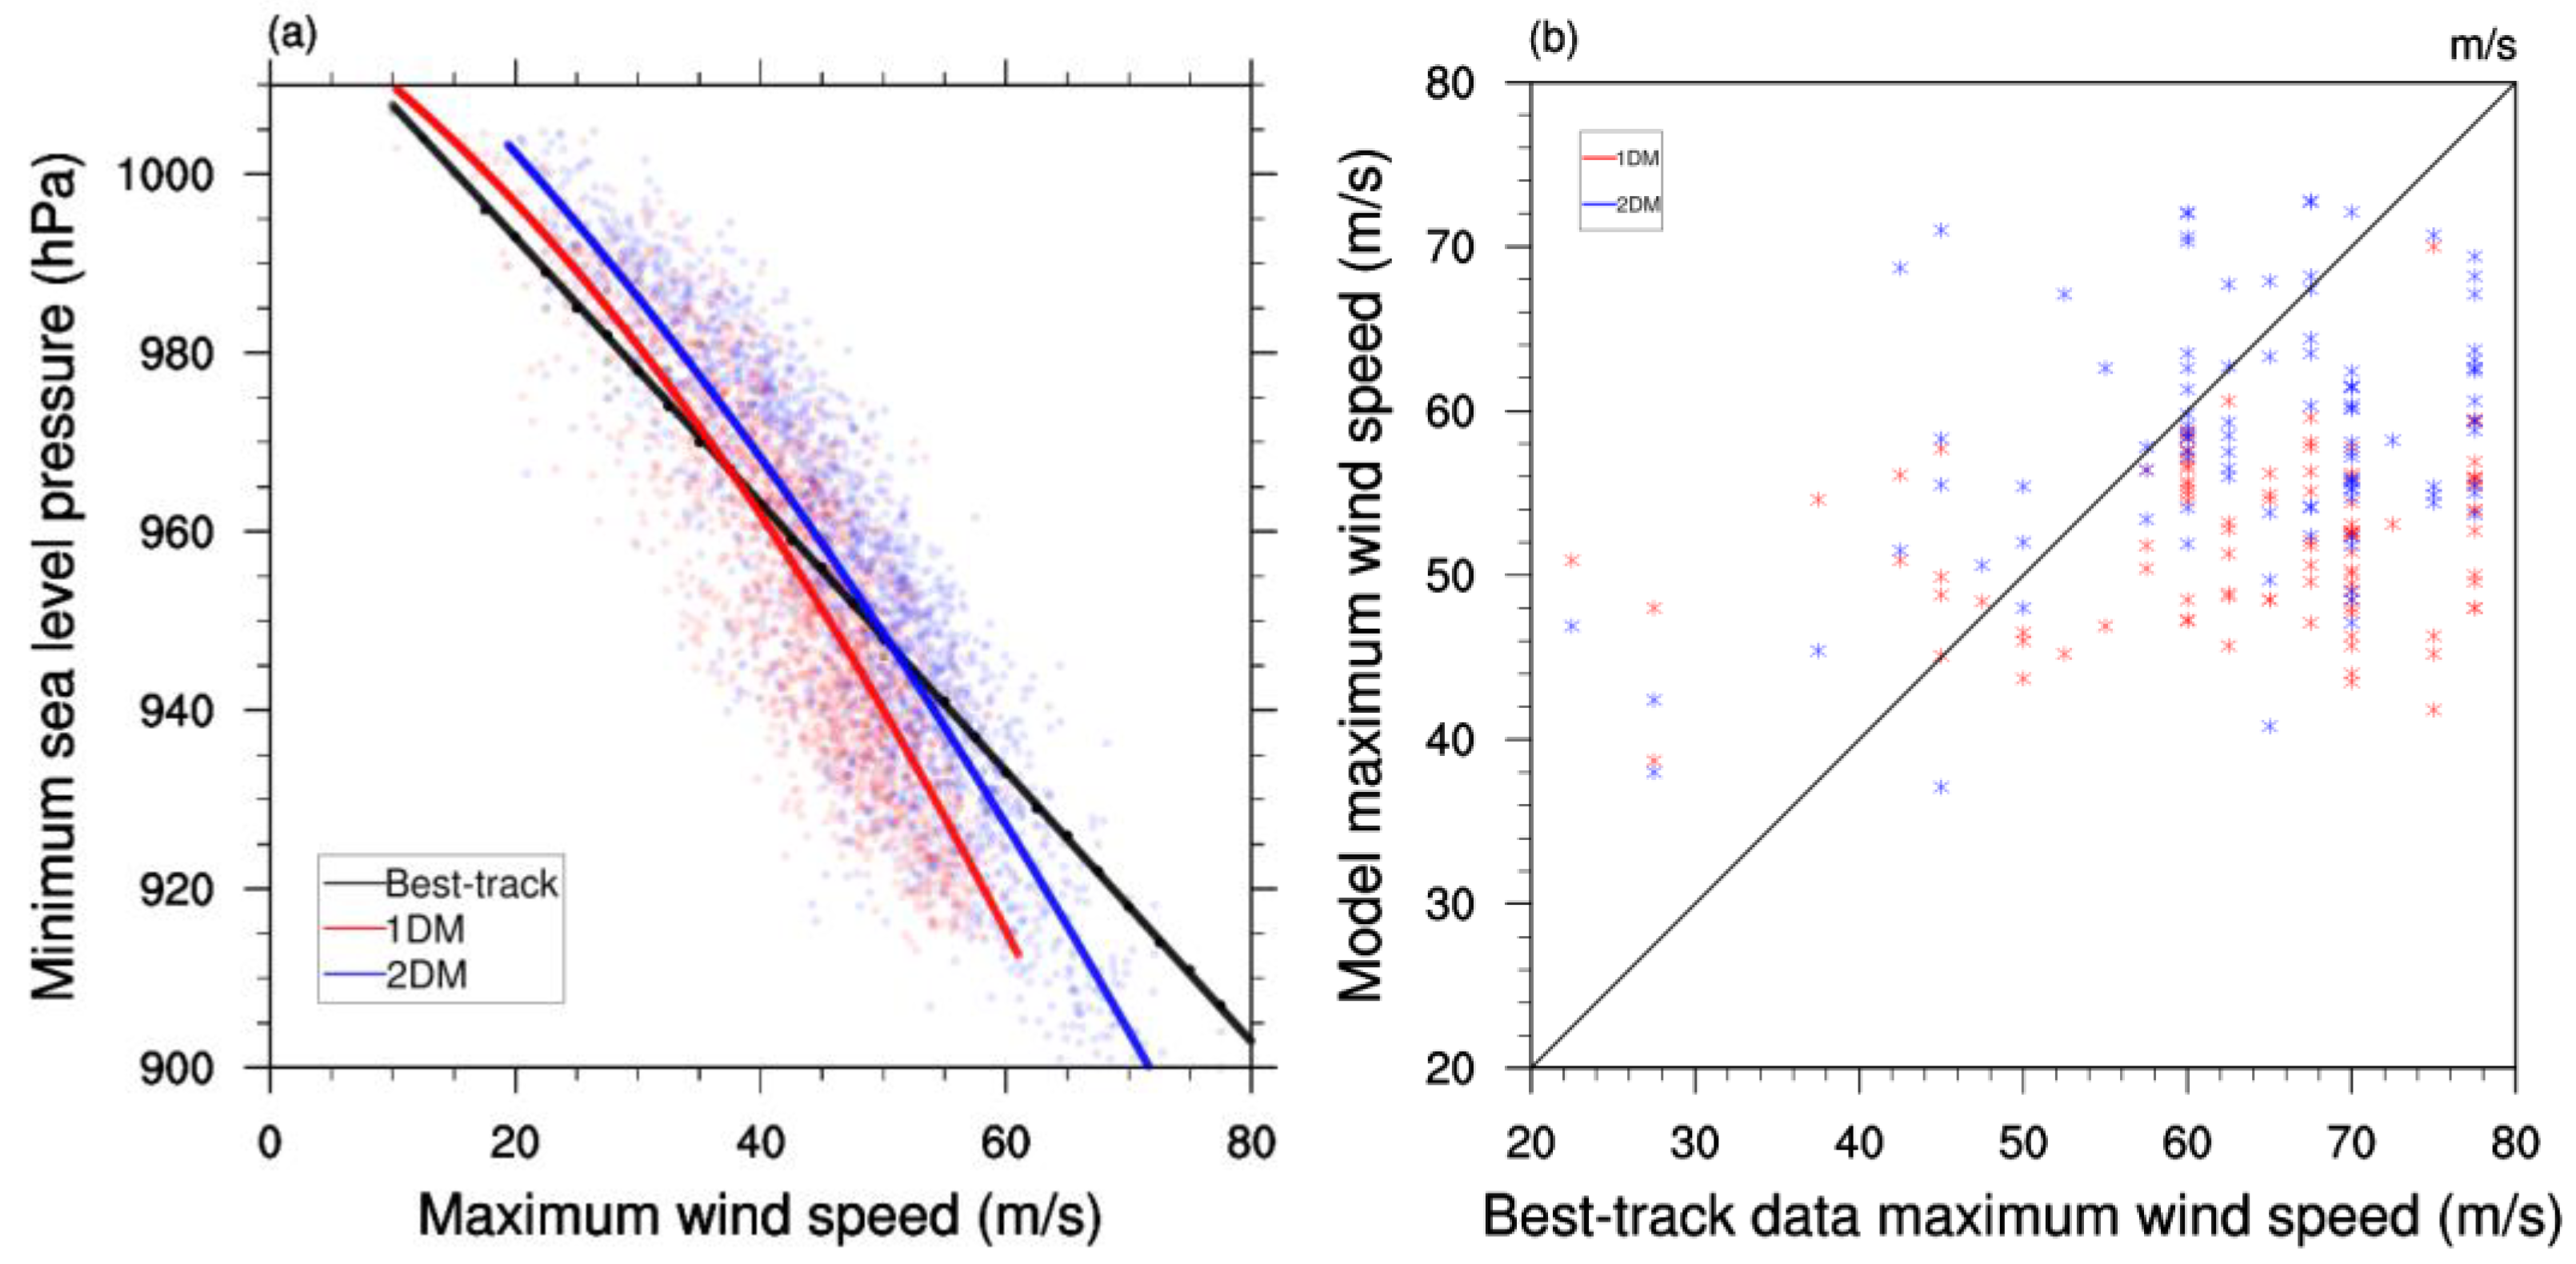
To examine the impact of higher model resolution on individual intensity forecasts, the wind-pressure relationship and the simulation of LMI were analyzed. Figure 3a shows the relationship between the MWS and MSLP in the 1DM and 2DM experiments. The 1DM experiment cannot correctly capture the relationship between the MWS and MSLP for intense TCs; it tends to significantly underestimate the ratio of MWS to MSLP compared to the best-track data. Contrastingly, the 2DM experiment significantly improves the relationship; both the MSLP and MWS for intense TCs are simulated to be relatively similar to the best-track data. In particular, MSLP lower than 920 hPa and MWS faster than 60 m s−1, which were not simulated in the 1DM experiment, were captured in the 2DM experiment. However, for weak TCs, MWS tends to be more strongly simulated than MSLP, and can be associated with the overestimation of weak TC intensity (Figure 2). In addition, increasing the model resolution can improve the LMI forecast. The 1DM experiment cannot simulate TCs with wind speeds faster than 60 m s−1, indicating a significant underestimation of LMIs for intense TCs (Figure 3b). In contrast, the LMI forecast was overall improved in the 2DM experiment. The mean LMI bias for 1DM and 2DM experiments is −12.5 m s−1 and −6.3 m s−1, respectively. In particular, TCs with an LMI >60 m s−1 were realistically captured.
3.2. Impact on TC Track Forecast
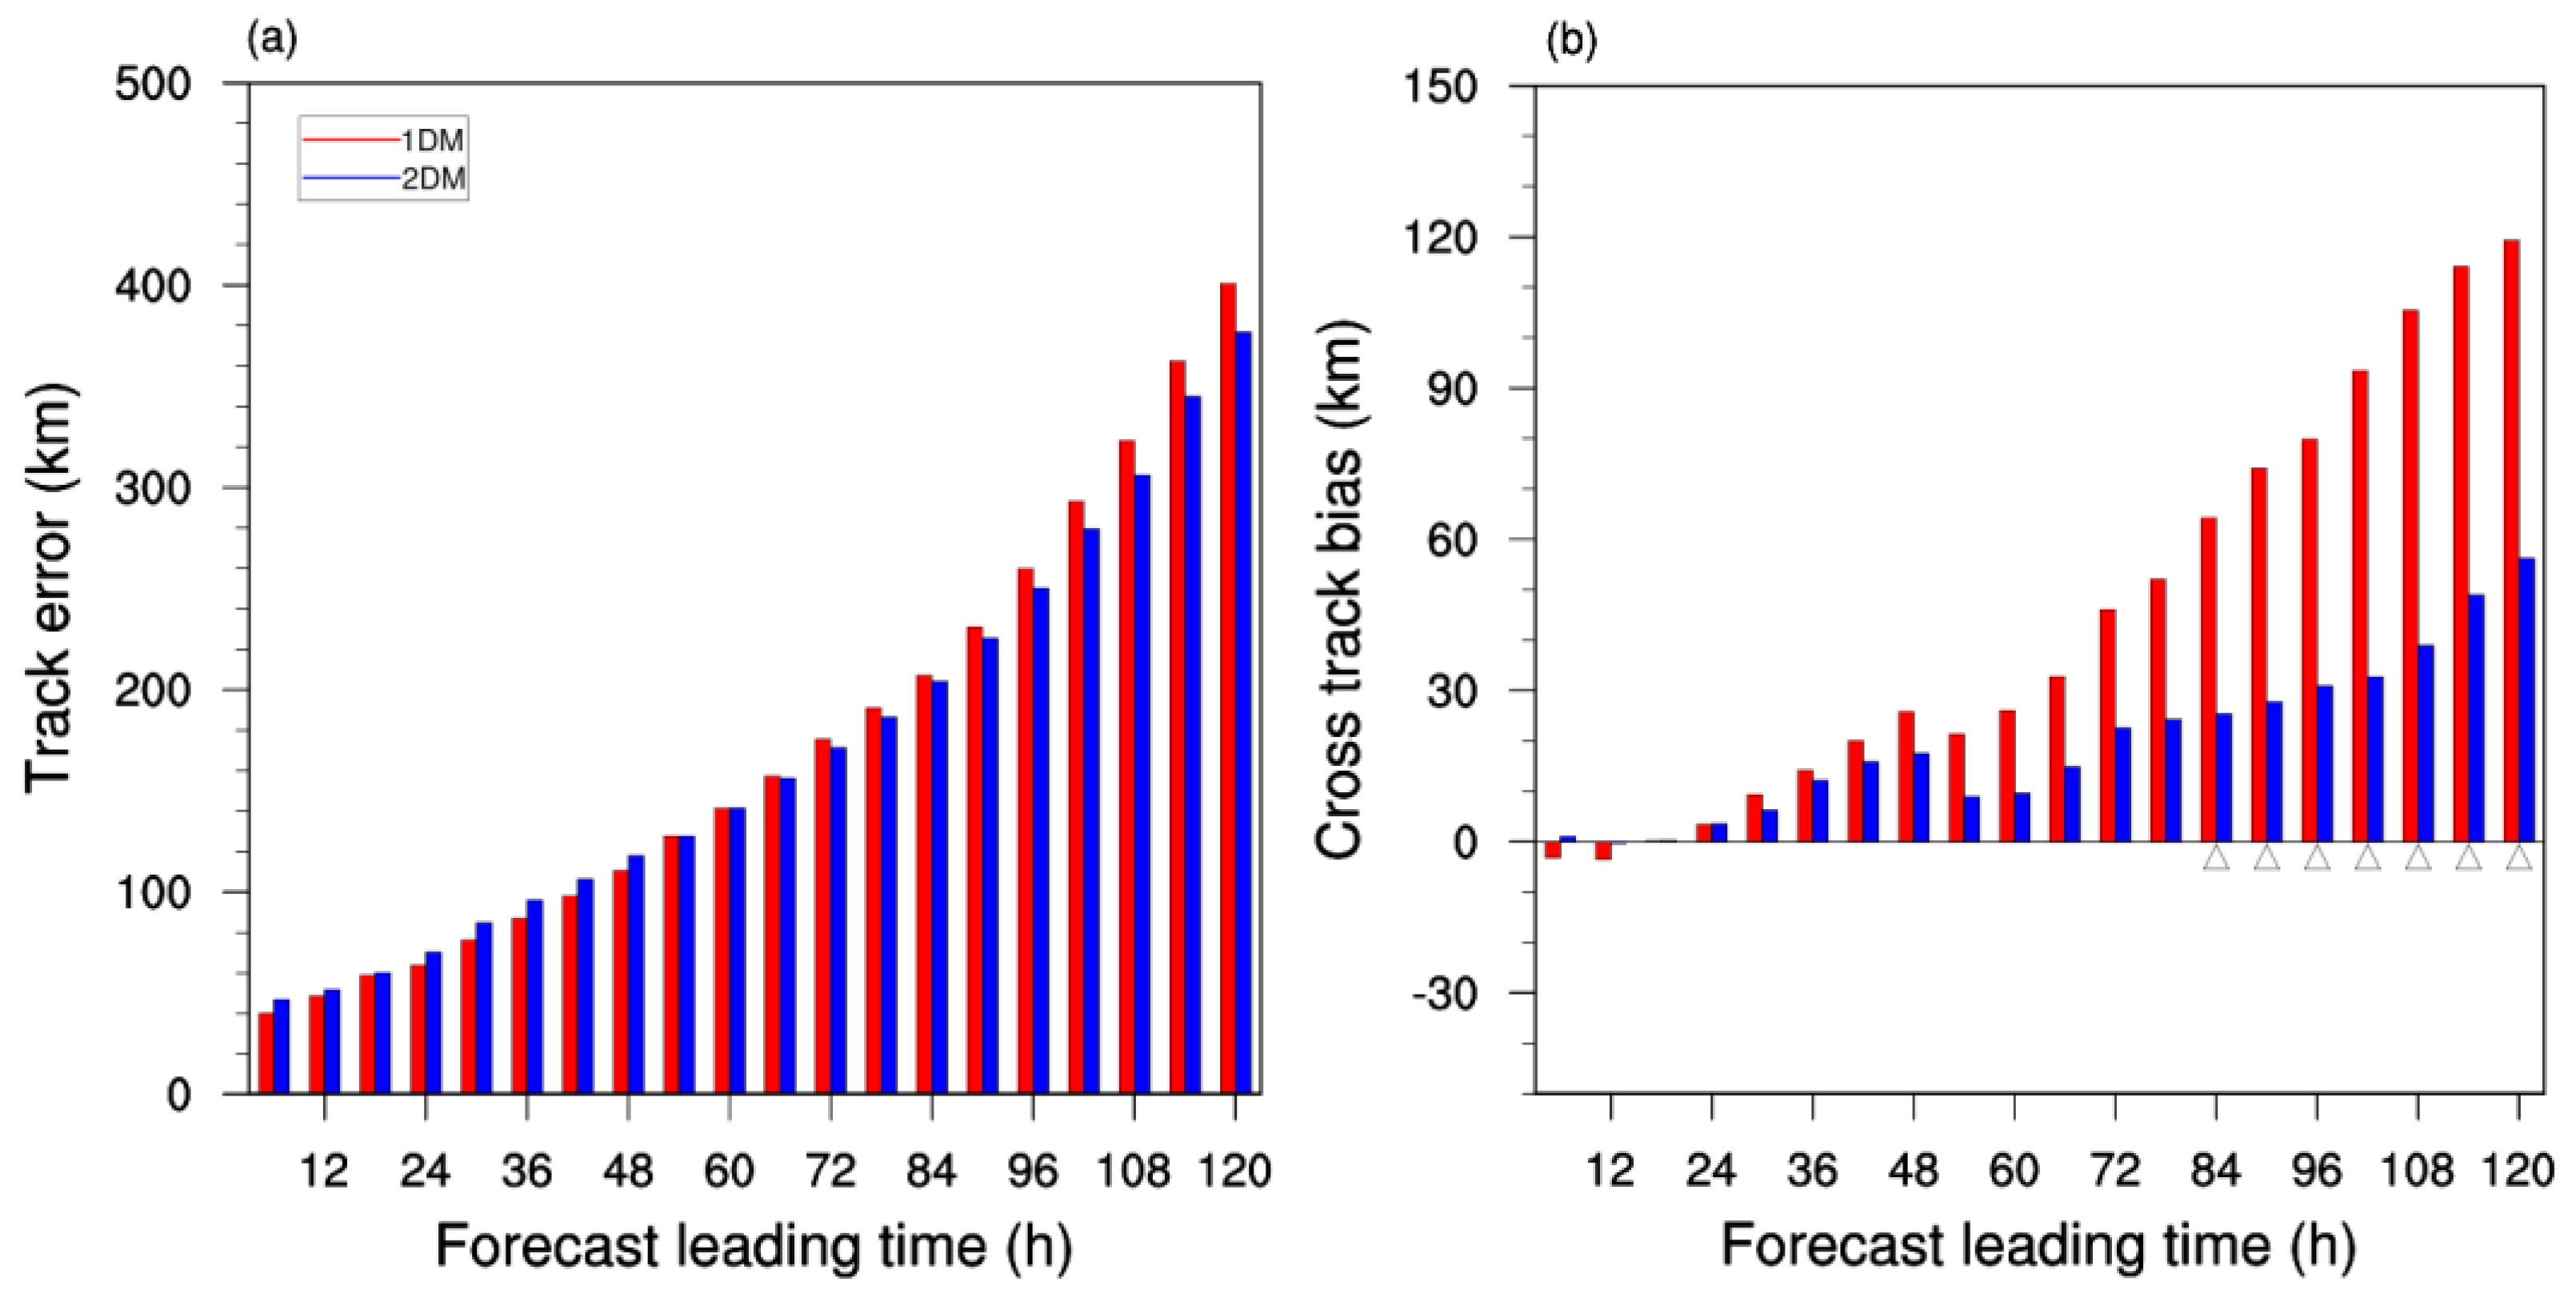
Figure 4a shows the mean track errors for the 1DM and 2DM experiments. Since the two experiments differ only in the resolution of the TC core region, there is no significant difference in the environmental field. Therefore, the mean track errors of the two experiments were similar. However, after 72 h, the error of the 2DM experiment was smaller than that of the 1DM experiment. The mean track error at 120 h was 381 km for the 2DM experiment, which was approximately 5% less than that for the 1DM experiment. To further examine the impact of increasing the resolution on the TC track forecast, the track error was decomposed into along-track and cross-track biases. The difference between the two experiments was not significant (not shown) for the along-track bias while the cross-track bias showed significant differences (Figure 4b). For the 1DM experiment, simulated TC tracks generally deflected rightward, resulting in a mean cross-track bias of 108 km at 120 h forecast lead time. A decrease in the rightward deflection of the TC tracks was observed in the 2DM experiment. Thus, the cross-track bias was reduced to 48 km at 120 h forecast lead time. As a result, the decrease in the track error of the 2DM experiment was primarily associated with the reduced cross-track bias.
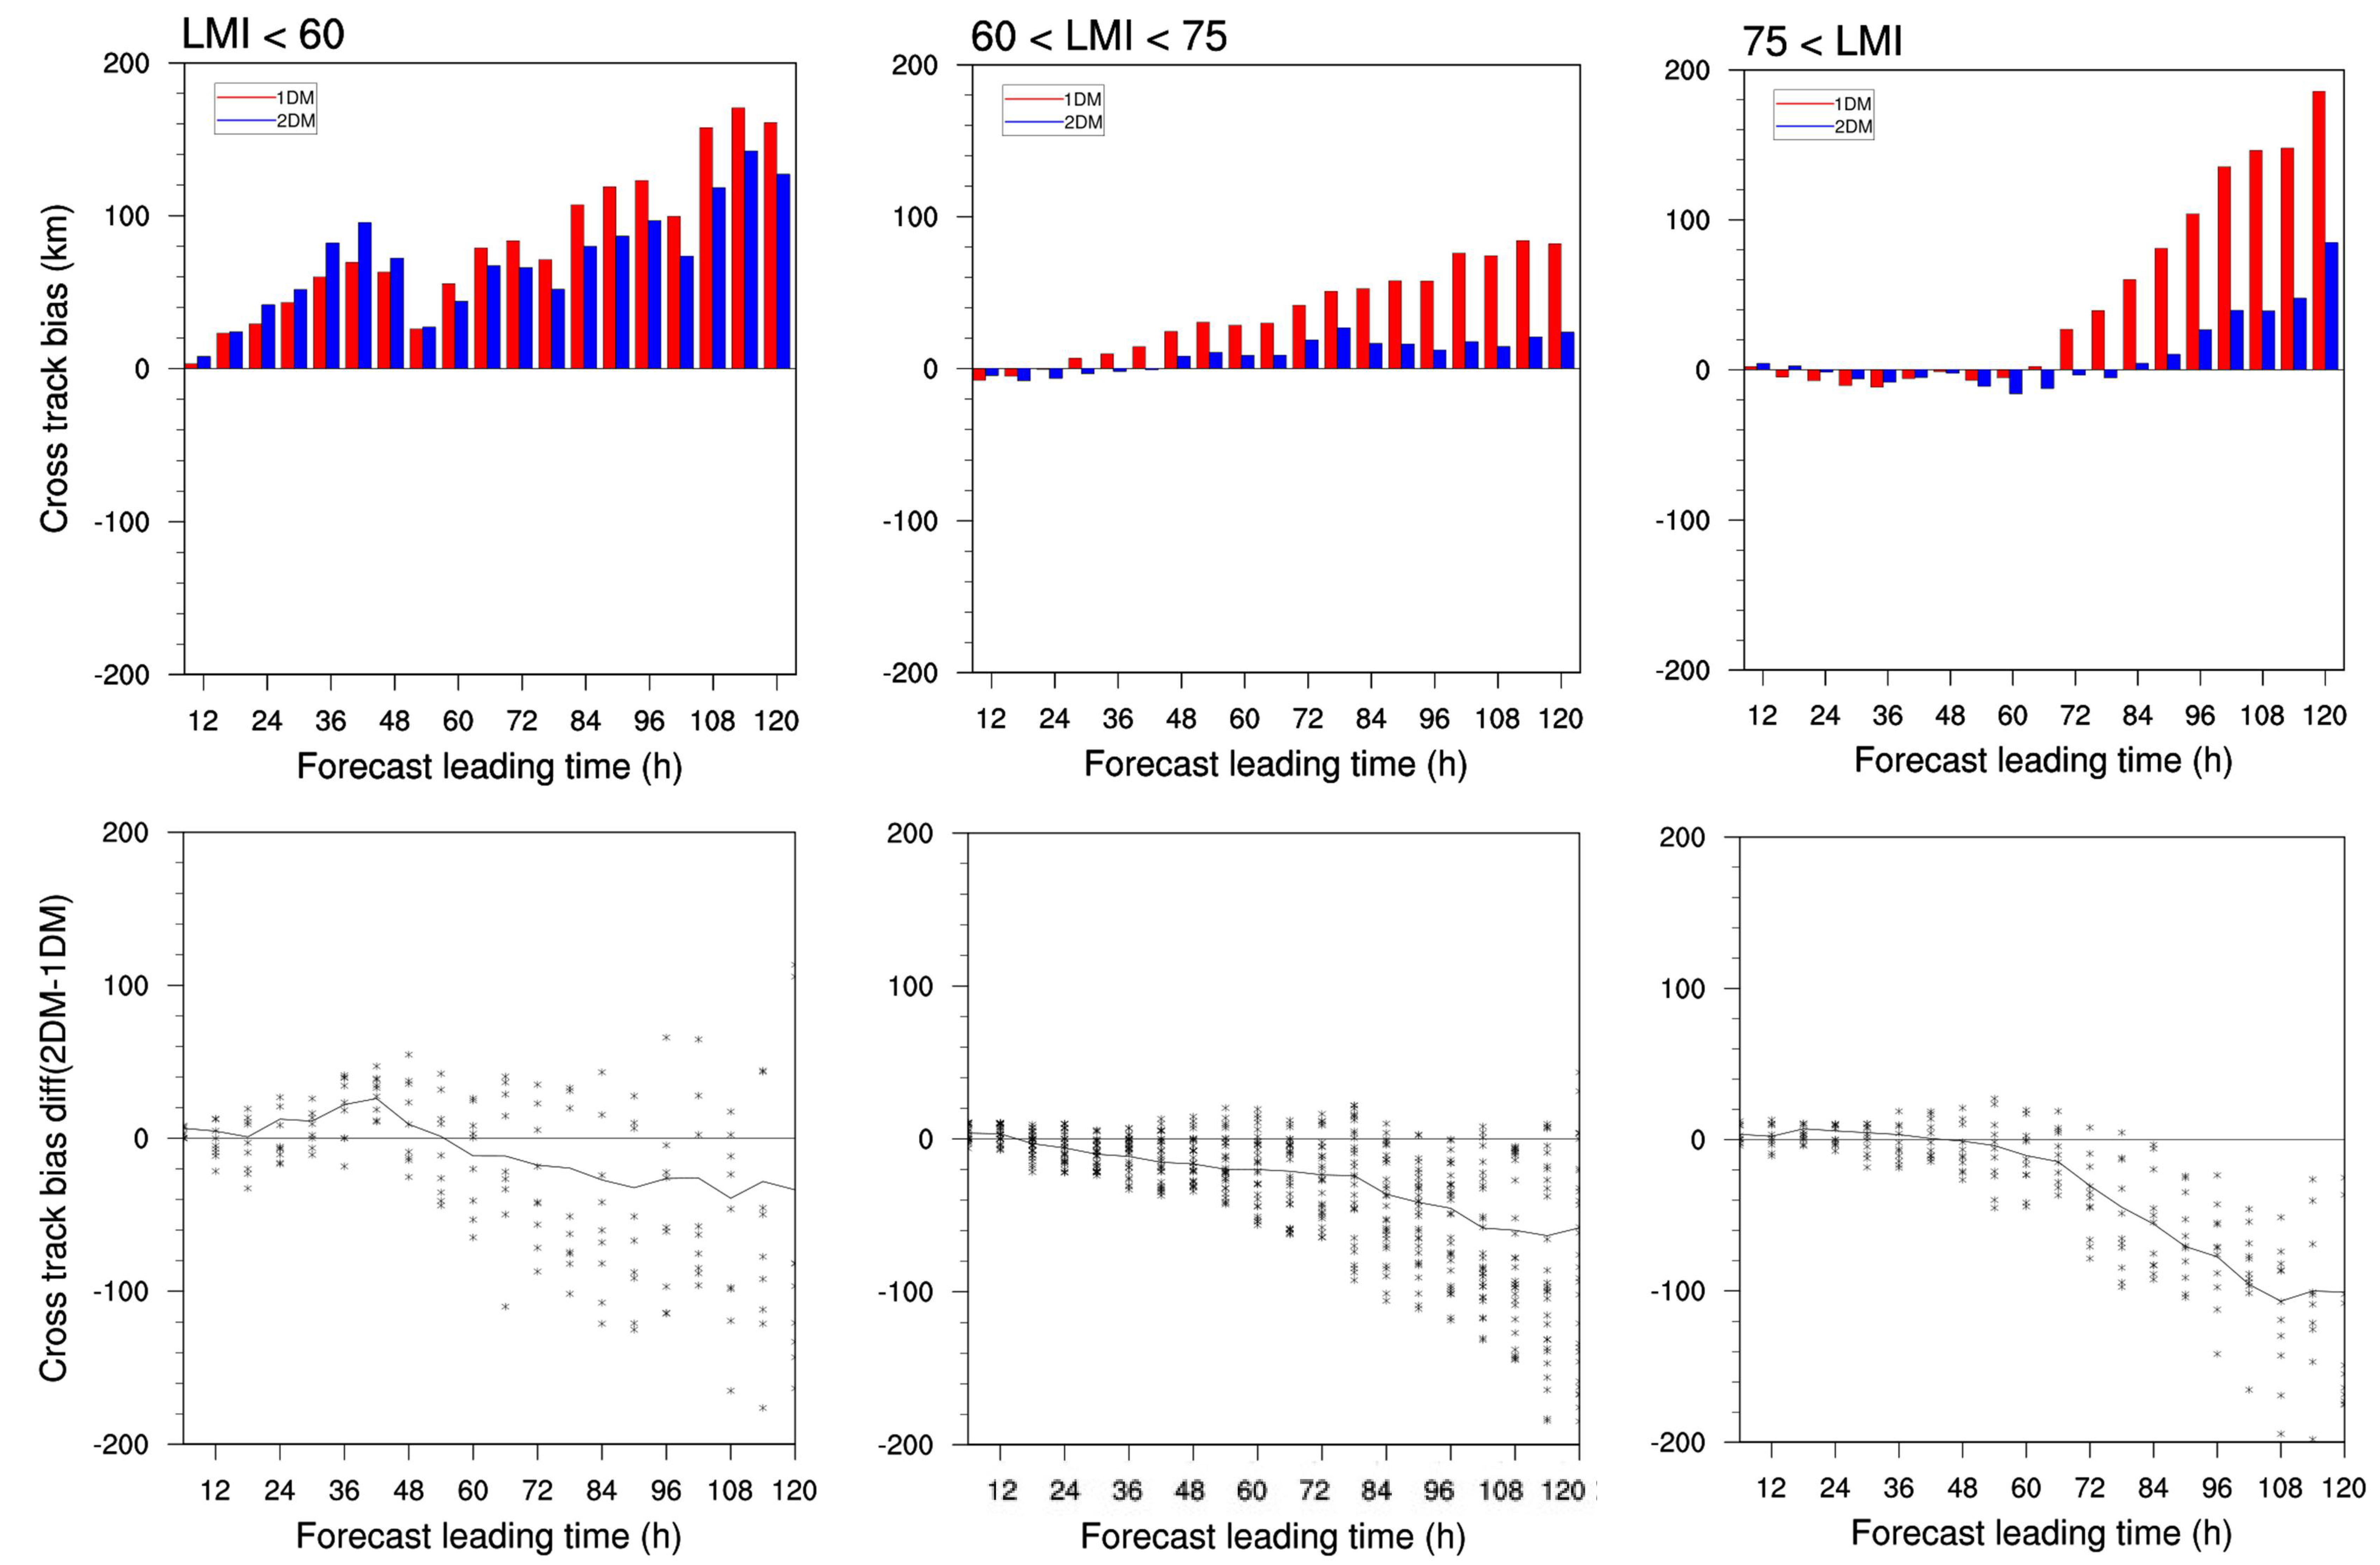
To further investigate the improvement of forecasting the TC track by increasing the model resolution, we analyzed cross-track biases for the three intensity categories (Figure 5). The difference in the cross-track bias became more noticeable with increase in the TC intensity. For relatively weak TCs (LMI <60 m s−1), both the 1DM and 2DM experiments tend to deflect the TC tracks rightward of the best-track data. The differences in cross-track bias for relatively weak TCs are not significant because both the experiments have similar intensity forecasts for them (see Figure 2). However, for TCs with LMI stronger than 60 m s−1, the TC track showed a significant decrease in its rightward deflection. In particular, for the strongest TCs, most TC tracks simulated in the 2DM experiment shifted more towards the left compared to those in the 1DM experiment. After three days, the mean cross-track bias generally improved since the tendency to deflect rightward decreased in the 2DM experiment. This implies that improving the simulation of TC core dynamics, by increasing model resolution, can improve TC track forecasting, particularly for intense TCs.
To find out why increasing the model resolution improves the TC track, we divided all TCs into two groups according to the difference in cross-track bias between the two experiments. The leftward shift (LS) includes the upper 25% cases with a high tendency to deflect the TC track leftward in the 2DM experiment compared to the 1DM experiment, and the non-LS includes the lower 25% cases at a 120 h forecast lead time. The overall intensity of the LS TCs is stronger than that of the non-LS TCs; the mean LMIs of LS TCs and non-LS TCs are 67.4 m s−1 and 61.2 m s−1, respectively. In addition, the mean latitude of LS TCs is 16.1° N, which is lower than the 19.3° N of non-LS TCs. The mean cross-track bias for the lower-latitude TCs, with five-day mean center latitude below 20° N, is −105.8 km, while that for the higher-latitude TCs, with five-day mean center latitude above 20° N, is 17.4 km. Therefore, the tendency of the TC tracks to deviate leftward in the 2DM experiment is higher for the intense TCs located in the lower latitudes, indicating that the improvement of the TC track by increasing model resolution can depend on the location and intensity of the TC.
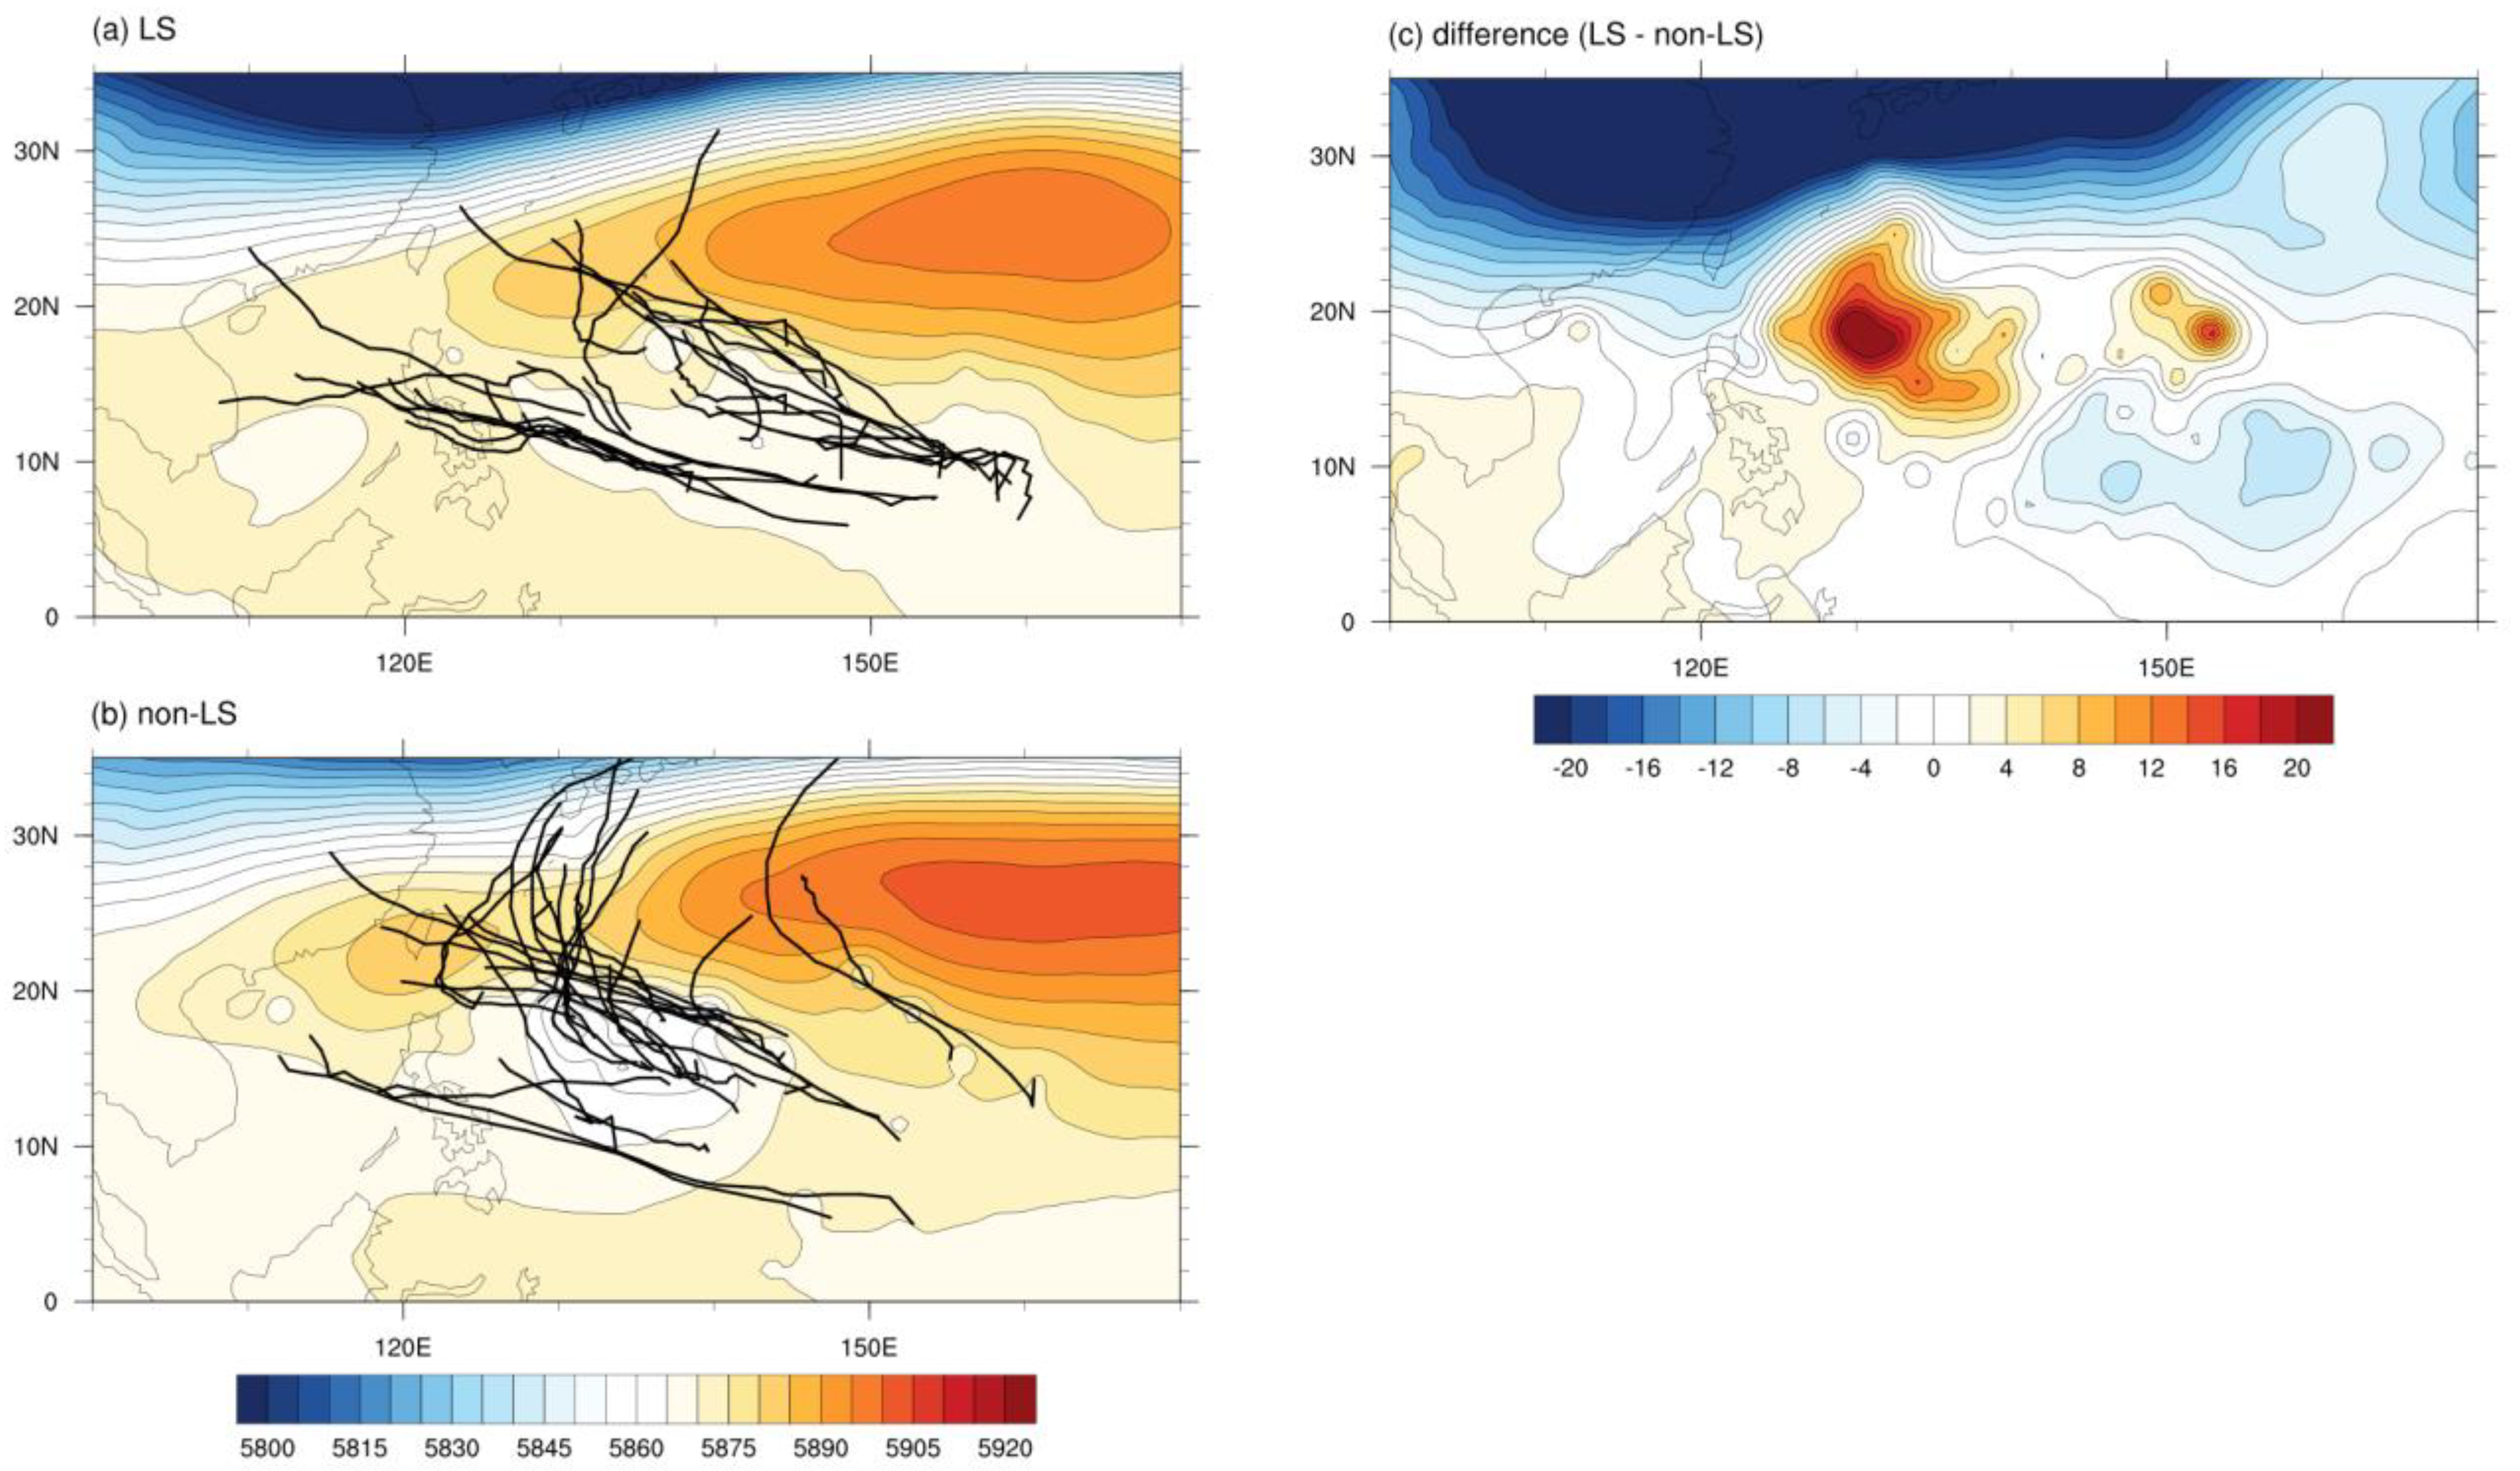
Figure 6 shows the composite of the 500 hPa geopotential height for the two groups. For non-LS TCs, the strong western North Pacific subtropical high (WNPSH) is in a favorable location for the recurving of the TC. Therefore, the performance of the WNPSH simulation is critical in determining the accuracy of the TC track forecasts, but the difference in the core region resolution does not have a significant impact on the forecast of the synoptic fields. In contrast, for the LS TCs, the WNPSH is expanded westward, making most TCs move straight without recurving. Moon et al. [10] showed that the predictability of the 500 hPa geopotential height was better when the TC was active at lower latitudes than at mid-latitudes. Although the track forecast of the TC is primarily affected by its surrounding environmental fields, this study shows that it can also be affected by its core dynamics. The sensitivity to the resolution appears to be more significant in the case of lower-latitude TCs compared to mid-latitude TCs, due to the higher accuracy of the environmental field. On the contrary, track forecasts of the TCs moving to the mid-latitudes, which were primarily influenced by large-scale features such as the WNPSH or mid-latitude trough, were, relatively, not sensitive to the resolution.
4. Discussion
In this study, 12–4 km moving nesting experiments were conducted to understand the effect of increasing the model resolution on the five-day forecasts of TCs over the WNP. The 12 km single domain experiments did not properly reproduce the MWS, and, strong wind speeds faster than 60 m s−1 were not captured using the 12 km horizontal grid spacing. However, the simulations of TC intensification improved in 12–4 km moving nesting experiments. The RMSEs of MWS and MSLP were reduced, and the wind-pressure relationship was improved in the 2DM experiment. The 1DM experiment tended to simulate rightward-biased TC tracks compared to the actual TC track in the track forecast. The tendency to deflect the TC track rightward decreased for intense TCs in the 2DM experiment, and was associated with an improved intensity forecast for the intense TCs. The reduction in cross-track bias was especially significant for the intense TCs located at lower latitudes. The TCs moving toward mid-latitudes seemed to be more affected by the prediction of the surrounding environmental field. The TCs in lower latitudes were more sensitive to the intensity forecast because the accuracy of the environmental field prediction was relatively high, and intensity forecasts were better than those for the mid-latitude TCs.
Previous studies on the relationship between the model resolution and the TC forecasts did not thoroughly examine the impact of model resolution on track forecasts. This study identified the biases in the TC forecasts that are longer than three days, and verified that the bias is decreased through the high-resolution domain in the TC core region. Owing to the limitation of computing resources in this study, a 4 km grid spacing was employed for the moving nesting domain, but more distinct results could be obtained by increasing the model resolution to less than 2 km. Since this study dealt with a large number of cases, only general results were analyzed using mean values. For a detailed analysis, we plan to conduct further research on the individual TC cases.
It is unclear how improvement in the intensity forecast affects the TC track forecast. Previous research [23,24] suggested that the leftward motion of TCs might be partially related to beta-related effects in a baroclinic atmosphere. By comparing the beta- and f-plane experiments, it was observed that the beta-related effect could lead to leftward motion [25]. Therefore, it is possible that a better representation of the beta-related effect using higher resolution could improve the track forecast. In addition, Yamada et al. [26] showed that a better representation of storm-scale processes, associated with convective heating asymmetry, could improve the forecast of TC motion. Identifying this relationship could advance the understanding of TCs and reduce the TC forecast error.
Author Contributions
Conceptualization, J.M. and D.-H.C.; data curation, J.M.; funding acquisition, D.-H.C.; investigation, J.M.; methodology, J.M. and D.-H.C.; supervision, D.-H.C.; validation, J.P. and D.-H.C.; visualization, J.M.; writing—original draft, J.M.; writing—review and editing, J.M., J.P. and D.-H.C. All authors have read and agreed to the published version of the manuscript.
Funding
This research was supported by Next-Generation Information Computing Development Program through the National Research Foundation of Korea (NRF) funded by the Ministry of Science, ICT (NRF-2016M3C4A7952637). This work was funded by the Ulsan National Institute of Science and Technology (Grant No. 1.210045.01).
Institutional Review Board Statement
Not applicable.
Informed Consent Statement
Not applicable.
Data Availability Statement
The Global Forecast System (GFS) forecast and analysis data for this study were taken from the National Oceanic and Atmospheric Administration’s National Operational Model Archive and Distribution System (NOMADS; information online at http://nomads.ncep.noaa.gov, accessed on 10 June 2021).
Conflicts of Interest
The authors declare no conflict of interest.
References
- Pielke, R.A., Jr.; Gratz, J.; Landsea, C.W.; Collins, D.; Saunders, M.A.; Musulin, R. Normalized hurricane damage in the United States: 1900–2005. Nat. Hazards Rev. 2008, 9, 29–42. [Google Scholar] [CrossRef]
- Zhang, Q.; Wu, L.; Liu, Q. Tropical cyclone damages in China 1983–2006. Bull. Am. Meteorol. Soc. 2009, 90, 489–496. [Google Scholar] [CrossRef] [Green Version]
- Chen, G.; Zhang, X.; Bai, L.; Wan, R. Verification of tropical cyclone operational forecast in 2018. In Proceedings of the ESCAP/WMO Typhoon Committee, Guangzhou, China, 26 February 2019. [Google Scholar]
- Chen, S.S.; Price, J.F.; Zhao, W.; Donelan, M.A.; Walsh, E.J. The CBLAST-Hurricane program and the next-generation fully coupled atmosphere–wave–ocean models for hurricane research and prediction. Bull. Am. Meteorol. Soc. 2007, 88, 311–318. [Google Scholar] [CrossRef]
- Davis, C.; Wang, W.; Chen, S.S.; Chen, Y.; Corbosiero, K.; DeMaria, M.; Dudhia, J.; Holland, G.; Klemp, J.; Michalakes, J.; et al. Prediction of Landfalling Hurricanes with the Advanced Hurricane WRF Model. Mon. Weather Rev. 2008, 136, 1990–2005. [Google Scholar] [CrossRef] [Green Version]
- Fierro, A.O.; Rogers, R.F.; Marks, F.D.; Nolan, D.S. The impact of horizontal grid spacing on the microphysical and kinematic structures of strong tropical cyclones simulated with the WRF-ARW model. Mon. Weather Rev. 2009, 137, 3717–3743. [Google Scholar] [CrossRef]
- Gentry, M.S.; Lackmann, G.M. Sensitivity of simulated tropical cyclone structure and intensity to horizontal resolution. Mon. Weather Rev. 2010, 138, 688–704. [Google Scholar] [CrossRef] [Green Version]
- Gopalakrishnan, S.G.; Marks, F., Jr.; Zhang, X.; Bao, J.-W.; Yeh, K.-S.; Atlas, R. The experimental HWRF system: A study on the influence of horizontal resolution on the structure and intensity changes in tropical cyclones using an idealized framework. Mon. Weather Rev. 2011, 139, 1762–1784. [Google Scholar] [CrossRef]
- Jin, H.; Peng, M.S.; Jin, Y.; Doyle, J.D. An evaluation of the impact of horizontal resolution on tropical cyclone predictions using COAMPS-TC. Weather Forecast. 2014, 29, 252–270. [Google Scholar] [CrossRef]
- Moon, J.; Cha, D.H.; Lee, M.; Kim, J. Impact of Spectral Nudging on Real-Time Tropical Cyclone Forecast. J. Geophys. Res. Atmos. 2018, 123, 12647–12660. [Google Scholar] [CrossRef]
- Skamarock, W.C.; Klemp, J.B.; Dudhia, J.; Gill, D.O.; Barker, D.M.; Wang, W.; Powers, J.G. A Description of the Advaned Research WRF Version 3. NCAR Technical Note-475+ STR; University Corporation for Atmospheric Research: Boulder, CO, USA, 2008. [Google Scholar]
- Cha, D.-H.; Wang, Y. A dynamical initialization scheme for real-time forecasts of tropical cyclones using the WRF model. Mon. Weather Rev. 2013, 141, 964–986. [Google Scholar] [CrossRef]
- Hong, S.-Y.; Noh, Y.; Dudhia, J. A new vertical diffusion package with an explicit treatment of entrainment processes. Mon. Weather Rev. 2006, 134, 2318–2341. [Google Scholar] [CrossRef] [Green Version]
- Noh, Y.; Cheon, W.; Hong, S.; Raasch, S. Improvement of the K-profile model for the planetary boundary layer based on large eddy simulation data. Bound.-Layer Meteorol. 2003, 107, 401–427. [Google Scholar] [CrossRef] [Green Version]
- Hong, S.-Y.; Lim, J.-O.J. The WRF single-moment 6-class microphysics scheme (WSM6). Asia-Pac. J. Atmos. Sci. 2006, 42, 129–151. [Google Scholar]
- Kain, J.S. The Kain–Fritsch convective parameterization: An update. J. Appl. Meteorol. 2004, 43, 170–181. [Google Scholar] [CrossRef] [Green Version]
- Dudhia, J. Numerical study of convection observed during the winter monsoon experiment using a mesoscale two-dimensional model. J. Atmos. Sci. 1989, 46, 3077–3107. [Google Scholar] [CrossRef]
- Mlawer, E.J.; Taubman, S.J.; Brown, P.D.; Iacono, M.J.; Clough, S.A. Radiative transfer for inhomogeneous atmospheres: RRTM, a validated correlated-k model for the longwave. J. Geophys. Res. Atmos. 1997, 102, 16663–16682. [Google Scholar] [CrossRef] [Green Version]
- Chen, F.; Dudhia, J. Coupling an advanced land surface–hydrology model with the Penn State–NCAR MM5 modeling system. Part I: Model implementation and sensitivity. Mon. Weather Rev. 2001, 129, 569–585. [Google Scholar] [CrossRef] [Green Version]
- Feser, F.; von Storch, H. A dynamical downscaling case study for typhoons in Southeast Asia using a regional climate model. Mon. Weather Rev. 2008, 136, 1806–1815. [Google Scholar] [CrossRef]
- Neumann, C.J.; Pelissier, J.M. Models for the prediction of tropical cyclone motion over the North Atlantic: An operational evaluation. Mon. Weather Rev. 1981, 109, 522–538. [Google Scholar]
- Powell, M.D.; Aberson, S.D. Accuracy of United States tropical cyclone landfall forecasts in the Atlantic basin (1976–2000). Bull. Am. Meteorol. Soc. 2001, 82, 2749–2768. [Google Scholar] [CrossRef]
- Chan, J.C.; Williams, R. Analytical and numerical studies of the beta-effect in tropical cyclone motion. Part I: Zero mean flow. J. Atmos. Sci. 1987, 44, 1257–1265. [Google Scholar] [CrossRef] [Green Version]
- Gray, W.M. Tropical Cyclone Propagation; Colorado State University Fort Collins Department of Atmospheric Science: Fort collins, CO, USA, 1994; p. 38. [Google Scholar]
- Park, J.; Cha, D.H.; Lee, M.K.; Moon, J.; Hahm, S.J.; Noh, K.; Chan, J.C.; Bell, M. Impact of cloud microphysics schemes on tropical cyclone forecast over the western North Pacific. J. Geophys. Res. Atmos. 2020, 125, e2019JD032288. [Google Scholar] [CrossRef]
- Yamada, H.; Nasuno, T.; Yanase, W.; Satoh, M. Role of the vertical structure of a simulated tropical cyclone in its motion: A case study of Typhoon Fengshen (2008). SOLA 2016, 12, 203–208. [Google Scholar] [CrossRef] [Green Version]
Figure 1.
Bias (left) and RMSE (right) of the maximum wind speed (MWS) and minimum sea level pressure (MSLP) for the 1DM and 2DM experiments.
Figure 1.
Bias (left) and RMSE (right) of the maximum wind speed (MWS) and minimum sea level pressure (MSLP) for the 1DM and 2DM experiments.

Figure 2.
Time series of mean maximum wind speed forecast for TCs with three categories of intensity. The closed (opened) circle means that the difference between 1DM and 2DM is significant (not significant) at a 90% confidence level.
Figure 2.
Time series of mean maximum wind speed forecast for TCs with three categories of intensity. The closed (opened) circle means that the difference between 1DM and 2DM is significant (not significant) at a 90% confidence level.

Figure 3.
(a) Wind-pressure relationship of 1DM (red) and 2DM (blue) experiments with JTWC best track data (black). The solid lines show the second-order polynomial fit for each data set. (b) Scatter plot of LMI simulated by 1DM (red) and 2DM (blue) experiments as a function of LMI from the best-track data.

Figure 4.
Absolute track error (a) and cross-track bias (b) averaged for the 107 forecasts listed in Table 1. The triangles denote that the difference is significant at a 90% confidence level.
Figure 4.
Absolute track error (a) and cross-track bias (b) averaged for the 107 forecasts listed in Table 1. The triangles denote that the difference is significant at a 90% confidence level.

Figure 5.
Mean cross-track biases (top) and scatter plots of differences between two experiments (bottom) for TCs with three intensity categories (LMI < 60 m s−1, 60 m s−1 < LMI < 75 m s−1, and 75 m s−1 < LMI).
Figure 5.
Mean cross-track biases (top) and scatter plots of differences between two experiments (bottom) for TCs with three intensity categories (LMI < 60 m s−1, 60 m s−1 < LMI < 75 m s−1, and 75 m s−1 < LMI).

Figure 6.
Composite geopotential height (gpm) at 500 hPa for (a) the LS TCs, (b) the non-LS TCs, and (c) their difference. The solid lines are the TC tracks of each group simulated from 2DM experiments.
Figure 6.
Composite geopotential height (gpm) at 500 hPa for (a) the LS TCs, (b) the non-LS TCs, and (c) their difference. The solid lines are the TC tracks of each group simulated from 2DM experiments.


Table 1.
Forecast details and initial times for the 33 TCs, which occurred from 2013 to 2017. The interval of forecast initial time is 24 h.
Table 1.
Forecast details and initial times for the 33 TCs, which occurred from 2013 to 2017. The interval of forecast initial time is 24 h.
| TC Number | TC Name | Forecast Initial Time (Interval of 24 h) | Number of Cases |
|---|---|---|---|
| 1307 | SOULIK | 0000 UTC 8 Jul 2013 | 1 |
| 1311 | UTOR | 0000 UTC 10 Aug 2013 | 1 |
| 1324 | NARI | 0000 UTC 10 Oct 2013 | 1 |
| 1326 | FRANCISCO | 0000 UTC 17 Oct 2013–0000 UTC 19 Oct 2013 | 3 |
| 1328 | LEKIMA | 0000 UTC 21 Oct 2013 | 1 |
| 1331 | HAIYAN | 0000 UTC 4 Nov 2013–0000 UTC 6 Nov 2013 | 3 |
| 1408 | NEOGURI | 0000 UTC 4 Jul 2014–0000 UTC 5 Jul 2014 | 2 |
| 1409 | RAMMASUN | 0000 UTC 13 Jul 2014–0000 UTC 14 Jul 2014 | 2 |
| 1411 | HALONG | 0000 UTC 29 Jul 2014–0000 UTC 5 Aug 2014 | 8 |
| 1418 | PHANFONE | 0000 UTC 29 Sep 2014–0000 UTC 1 Oct 2014 | 3 |
| 1419 | VONGFONG | 0000 UTC 3 Oct 2014–0000 UTC 8 Oct 2014 | 6 |
| 1420 | NURI | 0000 UTC 1 Nov 2014 | 1 |
| 1422 | HAGUPIT | 0000 UTC 2 Dec 2014–0000 UTC 5 Dec 2014 | 4 |
| 1504 | MAYSAK | 0000 UTC 28 Mar 2015–0000 UTC 30 Mar 2015 | 3 |
| 1506 | NOUL | 0000 UTC 5 May 2015–0000 UTC 6 May 2015 | 2 |
| 1507 | DOLPHIN | 0000 UTC 9 May 2015–0000 UTC 11 May 2015 | 3 |
| 1509 | CHAN-HOM | 0000 UTC 1 Jul 2015–0000 UTC 7 Jul 2015 | 7 |
| 1511 | NANGKA | 0000 UTC 5 Jul 2015–0000 UTC 12 Jul 2015 | 8 |
| 1513 | SOUDELOR | 0000 UTC 31 Jul 2015–0000 UTC 4 Aug 2015 | 5 |
| 1516 | GONI | 0000 UTC 15 Aug 2015–0000 UTC 20 Aug 2015 | 6 |
| 1517 | ATSANI | 0000 UTC 15 Aug 2015–0000 UTC 19 Aug 2015 | 5 |
| 1520 | KROVANH | 0000 UTC 16 Sep 2015 | 1 |
| 1521 | DUJUAN | 0000 UTC 24 Sep 2015 | 1 |
| 1524 | KOPPU | 0000 UTC 14 Oct 2015 | 1 |
| 1525 | CHAMPI | 0000 UTC 16 Oct 2015–0000 UTC 19 Oct 2015 | 4 |
| 1527 | IN-FA | 0000 UTC 18 Nov 2015–0000 UTC 21 Nov 2015 | 4 |
| 1602 | NEPARTAK | 0000 UTC 4 Jul 2016 | 1 |
| 1608 | CONSON | 0000 UTC 9 Aug 2016 | 1 |
| 1616 | MERANTI | 0000 UTC 10 Sep 2016 | 1 |
| 1618 | MALAKAS | 0000 UTC 12 Sep 2016–0000 UTC 15 Sep 2016 | 4 |
| 1707 | NORU | 0000 UTC 25 Jul 2017–0000 UTC 2 Aug 2017 | 9 |
| 1720 | TALIM | 0000 UTC 10 Sep 2017–0000 UTC 12 Sep 2017 | 3 |
| 1725 | LAN | 0000 UTC 16 Oct 2017–0000 UTC 17 Oct 2017 | 2 |
| Total | 107 | ||
Publisher’s Note: MDPI stays neutral with regard to jurisdictional claims in published maps and institutional affiliations. |
© 2021 by the authors. Licensee MDPI, Basel, Switzerland. This article is an open access article distributed under the terms and conditions of the Creative Commons Attribution (CC BY) license (https://creativecommons.org/licenses/by/4.0/).
Share and Cite
MDPI and ACS Style
Moon, J.; Park, J.; Cha, D.-H. Does Increasing Model Resolution Improve the Real-Time Forecasts of Western North Pacific Tropical Cyclones? Atmosphere 2021, 12, 776. https://doi.org/10.3390/atmos12060776
AMA Style
Moon J, Park J, Cha D-H. Does Increasing Model Resolution Improve the Real-Time Forecasts of Western North Pacific Tropical Cyclones? Atmosphere. 2021; 12(6):776. https://doi.org/10.3390/atmos12060776
Chicago/Turabian StyleMoon, Jihong, Jinyoung Park, and Dong-Hyun Cha. 2021. "Does Increasing Model Resolution Improve the Real-Time Forecasts of Western North Pacific Tropical Cyclones?" Atmosphere 12, no. 6: 776. https://doi.org/10.3390/atmos12060776
Note that from the first issue of 2016, this journal uses article numbers instead of page numbers. See further details here.