
The Italian National Air Pollution Control Programme: Air Quality, Health Impact and Cost Assessment

 , ,
, ,
Abstract
:1. Introduction
2. Materials and Methods
2.1. Integrated Assessment Model for Impacts of Air Quality: National Integrated Model to Support International Negotiation on the Atmospheric Pollution (MINNI)
2.2. NAPCP Scenarios Modeling
2.3. Health Impact Assessment
2.4. Cost Assessment
3. Results
3.1. Emission Reductions
3.2. Air-Quality Improvement
3.3. Health Impact
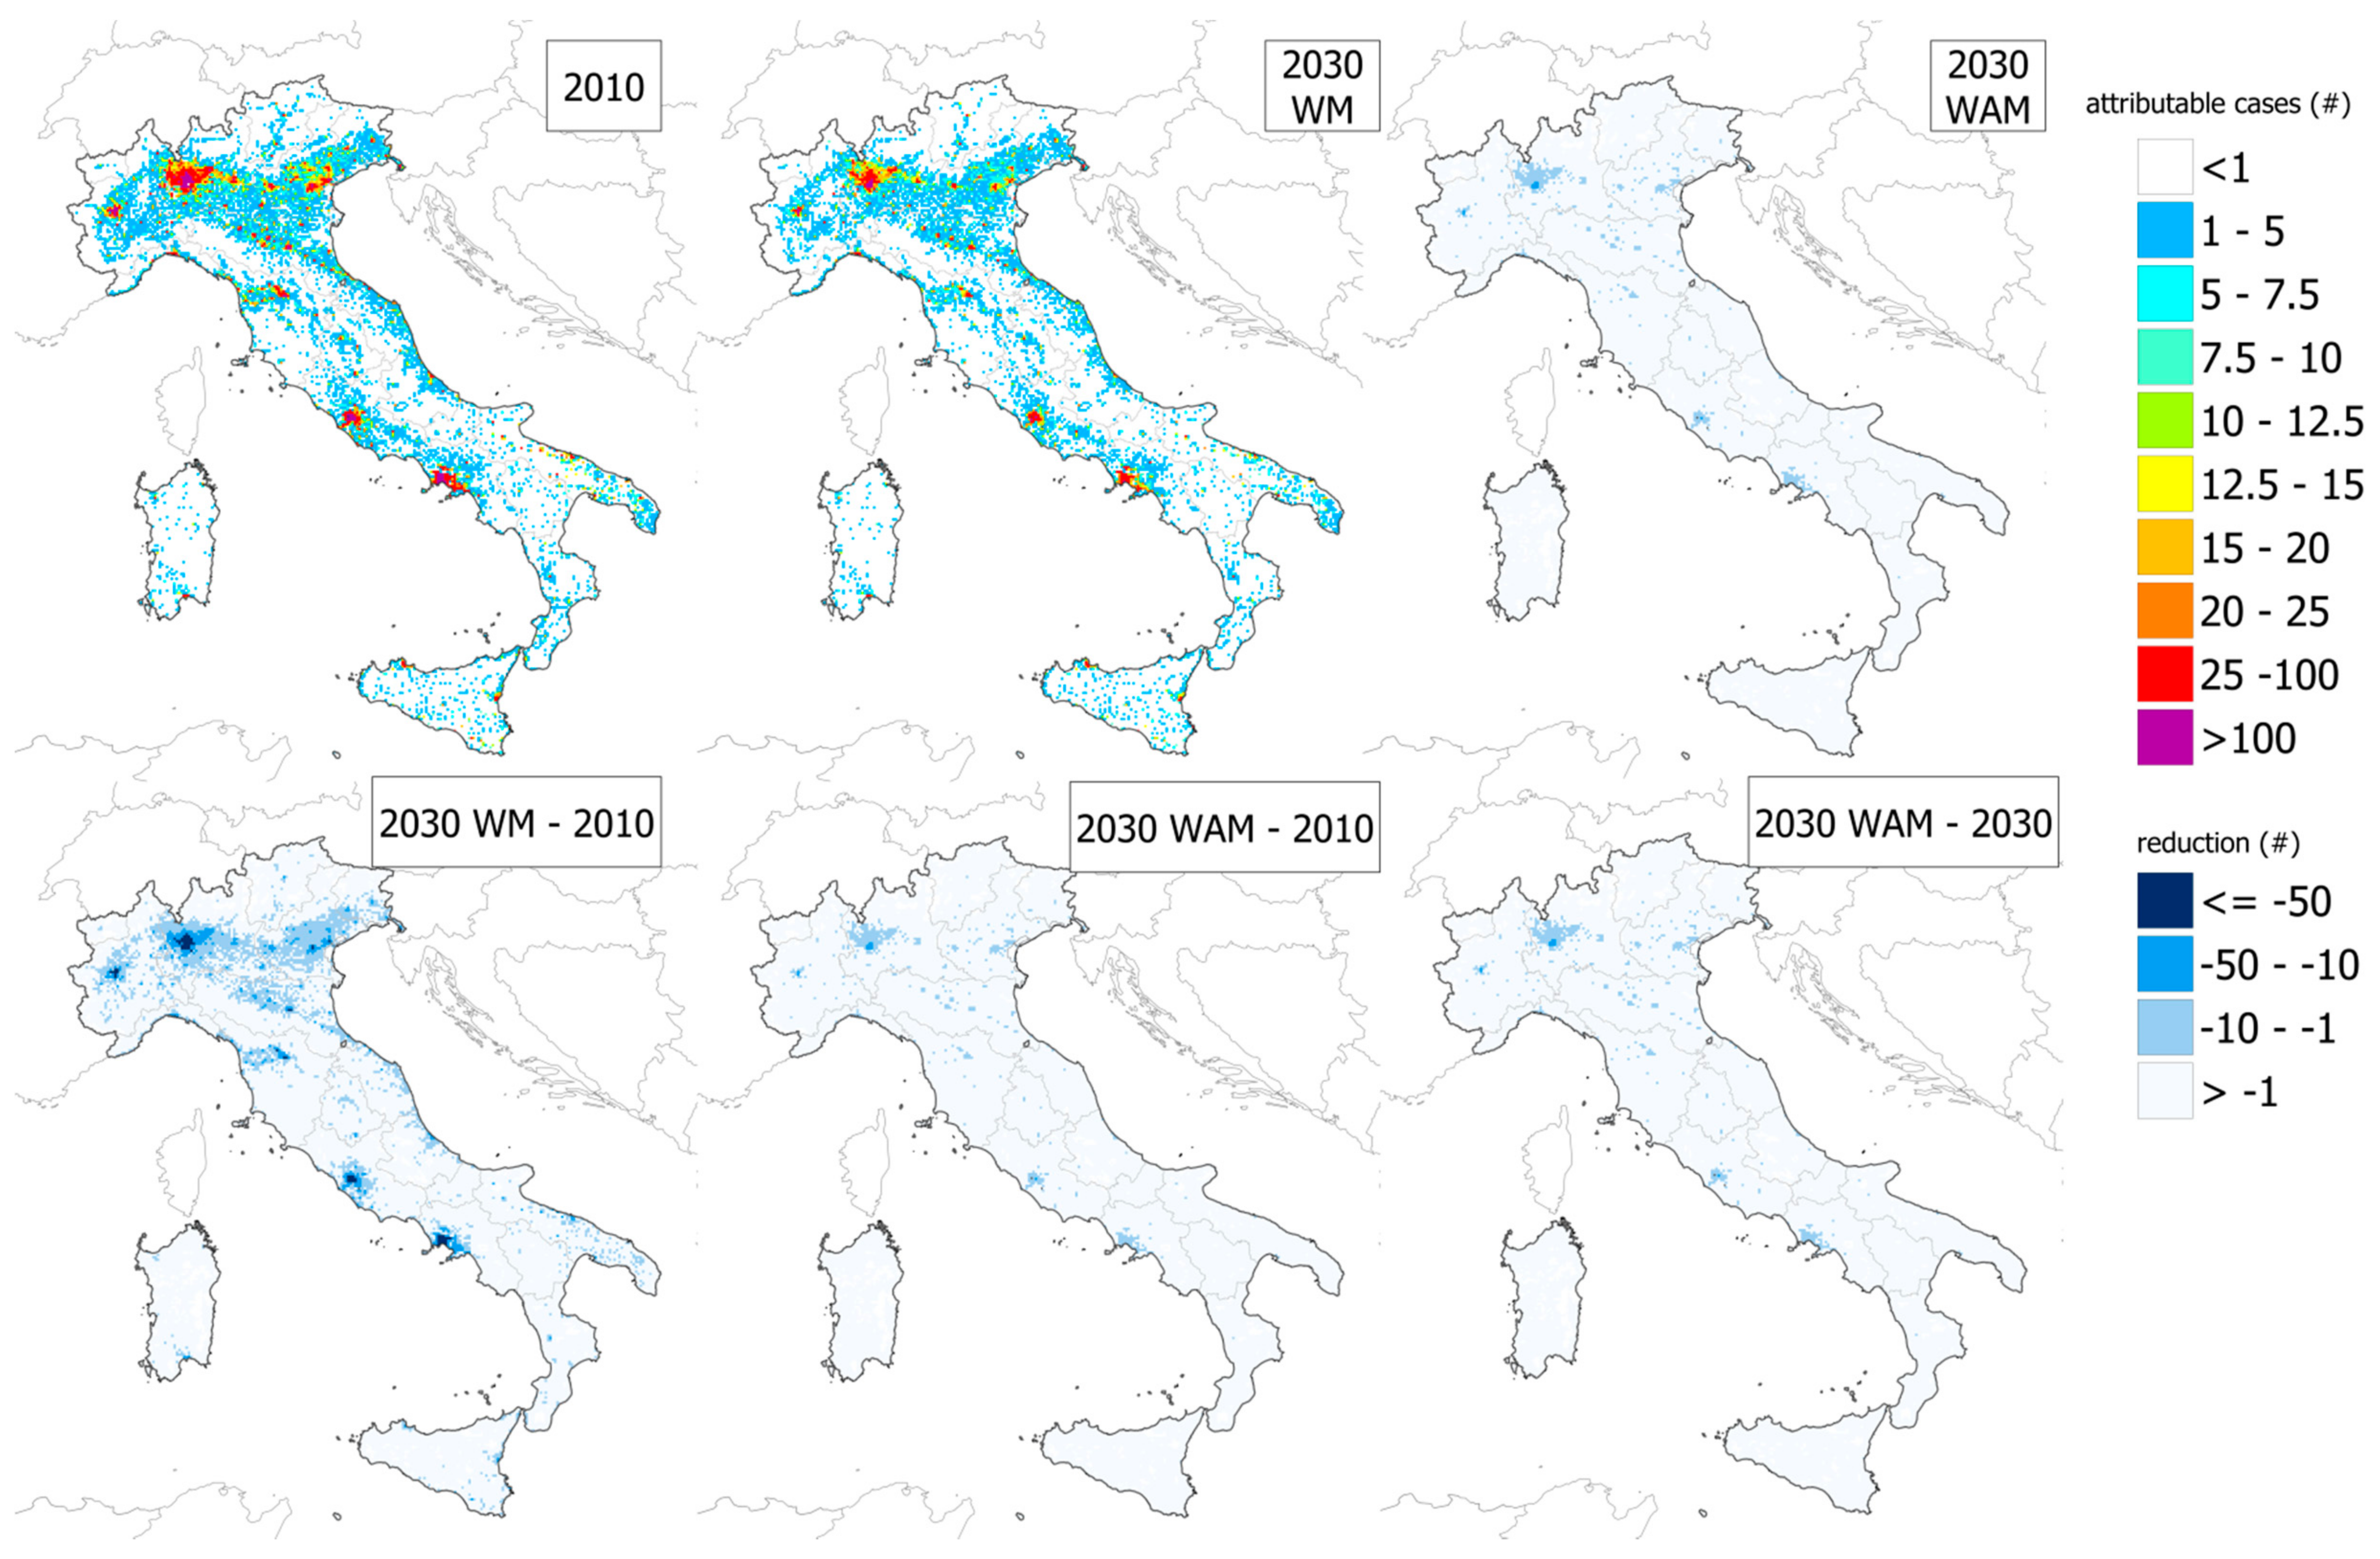
3.3.1. Mortality
3.3.2. Mortality Rate
3.4. Costs
4. Discussion
5. Conclusions
Supplementary Materials
Author Contributions
Funding
Institutional Review Board Statement
Informed Consent Statement
Data Availability Statement
Acknowledgments
Conflicts of Interest
References
- European Commission. Directive 2016/2284 of the European Parliament and of the Council of 14 December 2016 on the Reduction of National Emissions of Certain Atmospheric Pollutants, Amending Directive 2003/35/EC and Repealing Directive 2001/81/EC. Off. J. Eur. Union 2016, L344, 1–31. [Google Scholar]
- European Commission. Communication from the Commission—Guidance for the development of National Air Pollution Control Programmes under Directive (EU) 2016/2284 of the European Parliament and of the Council on the reduction of national emissions of certain atmospheric pollutants. Off. J. Eur. Union 2019, C77, 1–33. [Google Scholar]
- Kuklinska, K.; Wolska, L.; Namiesnik, W. Air quality policy in the U.S. and the EU—A review. Atmos. Poll. Res. 2015, 6, 129–137. [Google Scholar] [CrossRef]
- Powell, R.J.; Wharton, L.M. Development of the Canadian Clean Air Act. J. Air Pollut. Control Assoc. 1982, 32, 62–65. [Google Scholar] [CrossRef]
- Siciliano, B.; Dantas, G.; da Silva, C.M.; Arbilla, G. The updated Brazilian National Air Quality Standards: A critical review. J. Braz. Chem. Soc. 2020, 31, 523–535. [Google Scholar] [CrossRef]
- Hernandez, R.A. Prevention and control of air pollution in China: A research agenda for science and technology studies. SAPIENS 2015, 8. [Google Scholar]
- Chen, C.; Fang, J.-L.; Shi, W.-Y.; Li, T.-T.; Shi, X.-M. Clean air actions and health plans in China. Chin. Med. J. 2020, 133, 1609–1611. [Google Scholar] [CrossRef]
- National Clean Air Programme. Available online: http://moef.gov.in/wp-content/uploads/2019/05/NCAP_Report.pdf (accessed on 26 August 2020).
- Miranda, A.; Silveira, C.; Ferreira, J.; Monteiro, A.; Lopes, D.; Relvas, H.; Borrego, C.; Roebeling, P. Current air quality plans in Europe designed to support air quality management policies. Atmos. Poll. Res. 2015, 6, 434–443. [Google Scholar] [CrossRef] [Green Version]
- Yu, H.; Stuart, A.L. Impacts of compact growth and electric vehicles on future air quality and urban exposures may be mixed. Sci. Tot. Environ. 2017, 576, 148–158. [Google Scholar] [CrossRef] [Green Version]
- Zhan, J.; Wang, M.; Liu, Y.; Feng, C.; Gan, T.; Li, L.; Ou, R.; Ding, H. Impact of the ‘13th Five-Year Plan’ policy on air quality in Pearl River Delta, China: A case study of Haizhu District in Guangzhou City using WRF-Chem. Appl. Sci. 2020, 10, 5276. [Google Scholar] [CrossRef]
- Sarigiannis, D.A.; Kontoroupis, P.; Nikolaki, S.; Gotti, A.; Chapizanis, D.; Karakitsios, S. Benefits on public health from transport-related greenhouse gas mitigation policies in Southeastern European cities. Sci. Tot. Environ. 2020, 579, 1427–1438. [Google Scholar] [CrossRef] [PubMed]
- Lee, Y.; Shindell, D.T.; Faluvegi, G.; Pinder, R.W. Potential impact of a US climate policy and air quality regulations on future air quality and climate change. Atmos. Chem. Phys. 2016, 16, 5323–5342. [Google Scholar] [CrossRef] [Green Version]
- Lam, Y.F. Climate Change and Air Quality in Southeastern China: Hong Kong Study. In Climate Change and Air Pollution; Akhtar, R., Palagiano, C., Eds.; Springer: Cham, Switzerland, 2018; pp. 181–196. [Google Scholar] [CrossRef]
- Markandya, A.; Sampedro, J.; Smith, S.J.; Van Dingenen, R.; Pizarro-Irizar, C.; Arto, I.; González-Eguino, M. Health co-benefits from air pollution and mitigation costs of the Paris Agreement: A modelling study. Lancet Planet. Health 2018, 2, e126–e133. [Google Scholar] [CrossRef] [Green Version]
- Izquierdo, R.; García Dos Santos, S.; Borge, R.; Paz, D.D.L.; Sarigiannis, D.; Gotti, A.; Boldo, E. Health impact assessment by the implementation of Madrid City air-quality plan in 2020. Environ. Res. 2020, 183, 109021. [Google Scholar] [CrossRef]
- Kinney, P.L. Interactions of Climate Change, Air Pollution, and Human Health. Curr. Environ. Health Rep. 2018, 5, 179–186. [Google Scholar] [CrossRef]
- Ferreira, J.; Lopes, D.; Coelho, S.; Monteiro, A.; Lopes, M.; Jardim, D.; Marques, F.; Boavida, F.; Miranda, A. Using air quality modelling and emission projections as a support to the first air pollution control program under NEC directive targets for 2030. WIT Trans. Ecol. Environ. 2019, 236, 247–255. [Google Scholar] [CrossRef] [Green Version]
- Schucht, S.; Real, E.; Couvidat, F.; Rouil, L.; Brignon, J.-M.; Allemand, N.; Le Clercq, G.; Fayolle, D. Economic analysis of health impacts in the National Air Pollution Control Programme. Environ. Risques Sante 2019, 17, 393–400. [Google Scholar] [CrossRef]
- Wang, S.; Xing, J.; Zhao, B.; Jang, C.; Hao, J. Effectiveness of national air pollution control policies on the air quality in metropolitan areas of China. J. Environ. Sci. 2014, 26, 13–22. [Google Scholar] [CrossRef]
- Ancona, C.; Golini, M.N.; Ciancarella, L.; Demaria, M.; Badaloni, C.; Cesaroni, G.; Cadum, E.; Forastirere, F. Health Impact Assessment Of PM2.5 And NO2 In Italy. The VIIAS National Study. ISEE Conf. Abstr. 2015, 1, 1912. [Google Scholar] [CrossRef]
- D’Elia, I.; Piersanti, A.; Briganti, G.; Cappelletti, A.; Ciancarella, L.; Peschi, E. Evaluation of mitigation measures for air quality in Italy in 2020 and 2030. Atmos. Poll. Res. 2018, 9, 977–988. [Google Scholar] [CrossRef]
- Raffaelli, K.; Deserti, M.; Stortini, M.; Amorati, R.; Vasconi, M.; Giovannini, G. Improving Air Quality in the Po Valley, Italy: Some Results by the LIFE-IP-PREPAIR Project. Atmosphere 2020, 11, 429. [Google Scholar] [CrossRef] [Green Version]
- De Angelis, E.; Carnevale, C.; Turrini, E.; Volta, M. Source apportionment and integrated assessment modelling for air quality planning. Electronics 2020, 9, 1098. [Google Scholar] [CrossRef]
- Bert, F.; Lo Moro, G.; Gualano, M.R.; Siliquini, R. Health impact assessment in Italy: It is time to act. Public Health 2020, 185, 223. [Google Scholar] [CrossRef] [PubMed]
- Reduction of National Emissions—National Air Pollution Control Programmes. Available online: https://ec.europa.eu/environment/air/reduction/NAPCP.htm (accessed on 26 August 2020).
- D’Elia, I.; Bencardino, M.; Ciancarella, L.; Contaldi, M.; Vialetto, G. Technical and Non-Technical Measures for air pollution emission reduction: The integrated assessment of the regional Air Quality Management Plans through the Italian national model. Atmos. Environ. 2009, 43, 6182–6189. [Google Scholar] [CrossRef]
- Mircea, M.; Ciancarella, L.; Briganti, G.; Calori, G.; Cappelletti, A.; Cionni, I.; Costa, M.; Cremona, G.; D’Isidoro, M.; Finardi, S.; et al. Assessment of the AMS-MINNI system capabilities to predict air quality over Italy for the calendar year 2005. Atmos. Environ. 2014, 84, 178–188. [Google Scholar] [CrossRef]
- Ciucci, A.; D’Elia, I.; Wagner, F.; Sander, R.; Ciancarella, L.; Zanini, G.; Schöpp, W. Cost-effective reductions of PM2.5 concentrations and exposure in Italy. Atmos. Environ. 2016, 140, 84–93. [Google Scholar] [CrossRef] [Green Version]
- Silibello, C.; Calori, G.; Brusasca, G.; Giudici, A.; Angelino, E.; Fossati, G.; Peroni, E.; Buganza, E. Modelling of PM10 concentrations over Milano urban area using two aerosol modules. Environ. Modell. Softw. 2008, 23, 333–343. [Google Scholar] [CrossRef]
- Kukkonen, J.; Olsson, T.; Schultz, D.M.; Baklanov, A.; Klein, T.; Miranda, A.I.; Monteiro, A.; Hirtl, M.; Tarvainen, V.; Boy, M.; et al. A review of operational, regional-scale, chemical weather forecasting models in Europe. Atmos. Chem. Phys. 2012, 12, 1–87. [Google Scholar] [CrossRef] [Green Version]
- European Commission (EC). Directive 2008/50/EC of the European Parliament and of the Council of 21 May 2008 on ambient air quality and cleaner air for Europe (The Framework Directive). Off. J. Eur. Union 2008, 152, 1–44. [Google Scholar]
- Iannone, F.; Ambrosino, F.; Bracco, G.; De Rosa, M.; Funel, A.; Guarnieri, G.; Migliori, S.; Palombi, F.; Ponti, G.; Santomauro, G.; et al. CRESCO ENEA HPC clusters: A working example of a multifabric GPFS Spectrum Scale layout. In Proceedings of the International Conference on High Performance Computing & Simulation (HPCS), Dublin, Ireland, 15–19 July 2019; pp. 1051–1052. [Google Scholar] [CrossRef]
- RSE. Decarbonizzazione DELL’ECONOMIA Italiana. Scenari di Sviluppo del SISTEMA Energetico Nazionale; RSE Colloquia; RSE: Milan, Italy, 2017; Volume 4, ISBN 978-88-907527-6-6. (In Italian) [Google Scholar]
- NES. Strategia Energetica Nazionale. Available online: https://www.mise.gov.it/images/stories/documenti/Testo-integrale-SEN-2017.pdf (accessed on 31 January 2021). (In Italian)
- Loulou, R.; Goldstein, G.; Noble, K. Documentation for the MARKAL Family of Models. 2004. Available online: https://iea-etsap.org/MrklDoc-I_StdMARKAL.pdf (accessed on 31 January 2021).
- Loulou, R.; Remne, U.; Kanudia, A.; Lehtila, A.; Goldstein, G. Documentation for the TIMES Model—PART I. 2005. Available online: https://iea-etsap.org/docs/TIMESDoc-Intro.pdf (accessed on 31 January 2021).
- ISPRA. Scenari di Consumi Elettrici al 2050. In Technical Report 213/2015; ISPRA: Rome, Italy, 2015; ISBN 978-88-448-0706-5. (In Italian) [Google Scholar]
- ISPRA. Italian Emission Inventory 1990–2016 Informative Inventory Report 2018. In Technical Report; ISPRA: Rome, Italy, 2018; ISBN 978-88-448-0891-4. [Google Scholar]
- ISPRA. Italian Emission Inventory 1990–2017 Informative Inventory Report 2019. In Technical Report; ISPRA: Rome, Italy, 2019; ISBN 978-88-448-0952-2. [Google Scholar]
- DRAFT National Air Pollution Control Programme. 2019. Available online: https://ec.europa.eu/environment/air/pdf/reduction_napcp/IT%20draft%20NAPCP%201April19%20EN.pdf (accessed on 3 December 2020).
- Carslaw, D.C.; Ropkins, K. Openair—An R package for air quality data analysis. Environ. Modell. Softw. 2012, 27–28, 52–61. [Google Scholar] [CrossRef]
- Orru, H.; Andersson, C.; Ebi, K.L.; Langner, J.; Astro, C.; Forsberg, B. Impact of climate change on ozone-related mortality and morbidity in Europe. Eur. Respir. J. 2013, 41, 285–294. [Google Scholar] [CrossRef] [PubMed] [Green Version]
- Pope, C.A., III; Coleman, H.; Pond, Z.A.; Burnett, R.T. Fine particulate air pollution and human mortality: 25+ years of cohort studies. Environ. Res. 2020, 183, 108924. [Google Scholar] [CrossRef] [PubMed]
- WHO Regional Office for Europe. Meeting Report on Methods and Tools for Assessing the Health Risks of Air Pollution at Local, National and International Level; WHO Regional Office for Europe: Bonn, Germany, 12–13 May 2014; Available online: https://www.euro.who.int/__data/assets/pdf_file/0010/263629/WHO-Expert-Meeting-Methods-and-tools-for-assessing-the-health-risks-of-air-pollution-at-local,-national-and-international-level.pdf?ua=1 (accessed on 30 November 2020).
- Hamra, G.B.; Guha, N.; Cohen, A.; Laden, F.; Raaschou-Nielsen, O.; Samet, J.M.; Vineis, P.; Forastiere, F.; Saldiva, P.; Yorifuji, T.; et al. Outdoor particulate matter exposure and lung cancer: A systematic review and meta-analysis. Environ. Health Persp. 2014, 122, 906–911. [Google Scholar] [CrossRef] [PubMed] [Green Version]
- Hoek, G.; Krishnan, R.M.; Beelen, R.; Peters, A.; Ostro, B.; Brunekreef, B.; Kaufman, J.D. Long-term air pollution exposure and cardio-respiratory mortality: A review. Environ. Health 2013, 12, 43. [Google Scholar] [CrossRef] [PubMed] [Green Version]
- Jerrett, M.; Burnett, R.T.; Pope, C.A.; Ito, K.; Thurston, G.; Krewski, D.; Shi, Y.; Calle, E.; Thun, M. Long-term ozone exposure and mortality. N. Engl. J. Med. 2009, 360, 1085–1095. [Google Scholar] [CrossRef] [Green Version]
- Scarinzi, C.; Gandini, M.; Demaria, M.; Berti, G.; Carnà, P.; Spadea, T.; Bande, S.; Piersanti, A.; Ciancarella, L.; Costa, G.; et al. Long Term Effects of Air Pollution on Mortality. Results from the Italian Cohort in the LIFE MED HISS Project (LIFE12 ENV/IT/000834). In Proceedings of the 28th Conference of the International Society for Environmental Epidemiology, Rome, Italy, 1–4 September 2016; Abstract Number: P2-316. Available online: http://www.medhiss.eu/sites/default/files/pdf03.pdf (accessed on 30 November 2020).
- Holland, M. Cost-Benefit Analysis of Final Policy Scenarios for the EU Clean Air Package; Version 2; IIASA TSAP Report #11, Version 2a; The International Institute for Applied Systems Analysis: Laxemburg, Austria, 2014. [Google Scholar]
- DeBruyn, S.; Bijleveld, M.; de Graaff, L.; Schep, E.; Schroten, A.; Vergeer, R.; Ahdou, S. Environmental Prices Handbook EU28 Version: Methods and Numbers for Valuation of Environmental Impacts; CE Delft: Delft, The Netherlands, 2018; Available online: https://www.cedelft.eu/en/publications/2191/environmental-prices-handbook-eu28-version (accessed on 31 January 2021).
- Eurostat, Gross Domestic Product (GDP) at Current Market Prices by NUTS2 Regions. Available online: https://appsso.eurostat.ec.europa.eu/nui/show.do?dataset=nama_10r_2gdp&lang=en (accessed on 23 November 2020).
- De Bruyn, S.; de Vries, J. Health Costs of Air Pollution in European Cities and the Linkage with Transport; CE Delft: Delft, The Netherlands, 2020; Available online: https://www.cedelft.eu/en/publications/2534/health-costs-of-air-pollution-in-european-cities-and-the-linkage-with-transport (accessed on 31 January 2021).
- World Atlas, Maps of Italy. Available online: https://www.worldatlas.com/upload/4d/00/f0/regions-of-italy-map.png (accessed on 22 December 2020).
- Le Quéré, C.; Jackson, R.B.; Jones, M.W.; Smith, A.J.P.; Abernethy, S.; Andrew, R.M.; De-Gol, A.J.; Willis, D.R.; Shan, Y.; Canadell, J.G.; et al. Temporary reduction in daily global CO2 emissions during the COVID-19 forced confinement. Nat. Clim. Chang. 2020, 10, 647–653. [Google Scholar] [CrossRef]
- Colette, A.; Granier, C.; Hodnebrog, Ø.; Jakobs, H.; Maurizi, A.; Nyiri, A.; Rao, S.; Amann, M.; Bessagnet, B.; D’Angiola, A.; et al. Future air quality in Europe: A multi-model assessment of projected exposure to ozone. Atmos. Chem. Phys. 2012, 12, 10613–10630. [Google Scholar] [CrossRef] [Green Version]
- Rieder, H.E.; Fiore, A.M.; Horowitz, L.W.; Naik, V. Projecting policy-relevant metrics for high April-Septembertime ozone pollution events over the eastern United States due to climate and emission changes during the 21st century. J. Geophys. Res. Atmos. 2015, 120, 784–800. [Google Scholar] [CrossRef] [Green Version]
- Chen, K.; Fiore, A.M.; Chen, R.; Jiang, L.; Jones, B.; Schneider, A.; Peters, A.; Bi, J.; Kan, H.; Kinney, P.L. Future ozone-related acute excess mortality under climate and population change scenarios in China: A modeling study. PLoS Med. 2018, 15, e1002598. [Google Scholar] [CrossRef]
- Von Schneidemesser, E.; Driscoll, C.; Rieder, H.E.; Schiferl, L.D. How will air quality effects on human health, crops and ecosystems change in the future? Phil. Trans. R. Soc. A 2020, 378, 20190330. [Google Scholar] [CrossRef]
- Jiang, J.; Aksoyoglu, S.; Ciarelli, G.; Baltensperger, U.; Prévôt, A.S.H. Changes in ozone and PM2.5 in Europe during the period of 1990–2030: Role of reductions in land and ship emissions. Sci. Tot. Environ. 2020, 741, 140467. [Google Scholar] [CrossRef] [PubMed]
- Zhao, J.; Zhang, Y.; Patton, A.P.; Ma, W.; Kan, H.; Wu, L.; Fung, F.; Wang, S.; Ding, D.; Walker, K. Projection of ship emissions and their impact on air quality in 2030 in Yangtze River delta, China. Environ. Pollut. 2020, 263, 114643. [Google Scholar] [CrossRef]
- EEA. Air Quality in Europe—2014 Report. In EEA Report 5/2014; Publications office of the European Union: Luxembourg, 2014. [Google Scholar] [CrossRef]
- Piersanti, A.; Ancona, C.; Berti, G.; Cadum, E.; Ciancarella, L.; D’Elia, I.; Forastiere, F.; Righini, G. Health impact of air pollution on Italy: Main findings of VIIAS and MED HISS projects. Environmental Modelling and Software for Supporting a Sustainable Future. In Proceedings of the 8th International Congress on Environmental Modelling and Software, iEMSs, Toulouse, France, 10–14 July 2016; Volume 1, pp. 295–300. [Google Scholar]
- Carugno, M.; Consonni, D.; Bertazzi, P.A.; Biggeri, A.; Baccini, M. Air pollution exposure, cause-specific deaths and hospitalizations in a highly polluted Italian region. Environ. Pollut. 2017, 227, 280–286. [Google Scholar] [CrossRef] [PubMed]
- Kukkonen, J.; Savolahti, M.; Palamarchuk, Y.; Lanki, T.; Nurmi, V.; Paunu, V.-V.; Kamgas, L.; Sofiev, M.; Karppinen, A.; Maragkidou, A.; et al. Modelling of the public health costs of fine particulate matter and results for Finland in 2015. Atmos. Chem. Phys. 2020, 9371–9391. [Google Scholar] [CrossRef]
- Sofia, D.; Gioiella, F.; Lotrecchiano, N.; Giuliano, A. Cost-benefit analysis to support decarbonization scenario for 2030: A case study in Italy. Energy Policy 2020, 137, 111137. [Google Scholar] [CrossRef]


| Sector | Name | Description |
|---|---|---|
| Power plants | Coal phase–out | Gradual phasing–out of coal power plants to be completed by 2025 |
| Residential/Services sector | Replacement of biomass systems | Renewal of old biomass heating systems with efficient and low–emission technologies |
| Residential/Services sector | Energy efficiency in buildings | Tighten minimum standards for building (for example, Nearly Zero Energy Buildings) |
| Transport | Public transport promotion | Promote public transportation to reduce private transport and renew bus fleet |
| Transport | Electric vehicles | Increase the spread of electric vehicles for private urban mobility |
| Transport | Renew fleet for freight vehicles | Promote the use of methane/liquefied natural gas (LNG)–powered heavy duty trucks. Promote the use of LNG in maritime transport |
| Agriculture | Incorporate fertilizers | Incorporate urea–based fertilizers |
| Agriculture | Ban on new waste lagoons | Ban on constructing new waste lagoons |
| Agriculture | Slurry | Measures to reduce spread slurry and its incorporation |
| Agriculture | Spreading of solid manure | Incorporation of manure distributed on the surface |
| Pollutant Metric | Range of Concentration | Mortality Cause | ICD-10 Codes | RR (95% CI) per 10 μg/m3 | Reference(s) |
|---|---|---|---|---|---|
| PM2.5 annual mean | All | All-natural causes | A00–R99 | 1.066 (1.040–1.093) | [45] |
| Cardiovascular diseases | I00–I99 | 1.10 (1.05–1.15) | [45] | ||
| Respiratory diseases | J00–J99 | 1.10 (0.98–1.24) | [45] | ||
| Lung cancer | C32–C34 | 1.09 (1.04–1.14) | [45,46] | ||
| NO2 annual mean | All | All-natural causes | A00–R99 | 1.055 (1.031–1.080) | [47] |
| O3 April–September mean of MDA8 * | >70 μg/m3 | Respiratory diseases | J00–J99 | 1.014 (1.005–1.024) | [48] |
| Pollutant Metric | Range of Concentration | Mortality Cause | ICD-10 Codes | RR (95% CI) per 10 μg/m3 | Reference |
|---|---|---|---|---|---|
| PM2.5 annual mean | All | All–natural causes | A00–R99 | 1.03 (1.02–1.05) | [49] |
| Cardiovascular diseases | I00–I99 | 1.03 (1.00–1.06) | |||
| Respiratory diseases | J00–J99 | 1.04 (0.96–1.13) | |||
| Lung cancer | C32–C34 | 1.17 (1.09–1.24) | |||
| NO2 annual mean | All | All–natural causes | A00–R99 | 1.02 (1.00–1.03) |
| Outcome | Age Group | Adjusted Reference Value (EU28) (€2010) | Adjusted Value for Italy (€2010) | Reference Value (€2005) |
|---|---|---|---|---|
| Premature deaths (value of a year of life lost) | >30 years | 62,633/144,371 | 88,930/204,986 | 57,000/133,000 [50] |
| Income elasticity is 0.8 for adjustment | ||||
| Year 2005 | Year 2010 | |||
|---|---|---|---|---|
| Pollutant | GAINS-Italy vs. INV_sub2017 | GAINS-Italy vs. INV_sub2018 | GAINS-Italy vs. INV_sub2017 | GAINS-Italy vs. INV_sub2018 |
| SO2 | −3.65% | −3.85% | −4.11% | −4.41% |
| NOX | −1.19% | −4.83% | 2.30% | −0.23% |
| PM2.5 | 6.19% | 1.52% | 4.03% | 0.75% |
| NMVOC | −0.78% | −8.65% | 0.09% | −10.25% |
| NH3 | 1.25% | 0.62% | 0.45% | 1.03% |
| SO2 Emissions | ||||||
| Sector | 2010 (kt/yr) | 2030 WM (kt/yr) | 2030 WM–2010 (%) | 2030 WAM (kt/yr) | 2030 WAM–2010 (%) | WAM–WM (%) |
| Stationary Sources | 169.95 | 90.77 | −47% | 69.09 | −59% | −24% |
| Civil | 7.84 | 5.23 | −33% | 5.22 | −33% | 0% |
| Road Transport | 0.68 | 0.57 | −15% | 0.44 | −35% | −23% |
| Off–Road Transport | 0.40 | 0.43 | 6% | 0.42 | 6% | 0% |
| Maritime | 29.17 | 10.59 | −64% | 3.33 | −89% | −69% |
| Waste | 0.38 | 0.38 | 0% | 0.38 | 0% | 0% |
| TOTAL | 208.41 | 107.96 | −48% | 78.88 | −62% | −27% |
| NOx Emissions | ||||||
| Sector | 2010 (kt/yr) | 2030 WM (kt/yr) | 2030 WM–2010 (%) | 2030 WAM (kt/yr) | 2030 WAM–2010 (%) | WAM–WM (%) |
| Stationary Sources | 235.40 | 145.58 | −38% | 127.92 | −46% | −12% |
| Civil | 66.41 | 53.87 | −19% | 43.28 | −35% | −20% |
| Road Transport | 485.52 | 151.34 | −69% | 126.70 | −74% | −16% |
| Off–Road Transport | 81.85 | 30.07 | −63% | 29.52 | −64% | −2% |
| Maritime | 98.43 | 75.14 | −24% | 37.98 | −61% | −49% |
| Waste | 1.20 | 1.20 | 0% | 1.20 | 0% | 0% |
| TOTAL | 968.80 | 457.20 | −53% | 366.59 | −62% | −20% |
| PM2.5 emissions | ||||||
| Sector | 2010 (kt/yr) | 2030 WM (kt/yr) | 2030 WM–2010 (%) | 2030 WAM (kt/yr) | 2030 WAM–2010 (%) | WAM–WM (%) |
| Stationary Sources | 22.82 | 14.84 | −35% | 14.03 | −39% | −5% |
| Civil | 113.52 | 69.17 | –39% | 61.00 | –46% | –12% |
| Road Transport | 27.58 | 6.45 | −77% | 5.34 | −81% | −17% |
| Off–Road Transport | 14.32 | 8.80 | −39% | 3.73 | −74% | −58% |
| Other Sources | 17.87 | 18.35 | 3% | 18.24 | 2% | −1% |
| TOTAL | 196.11 | 117.61 | −40% | 102.33 | −48% | −13% |
| NMVOC emissions | ||||||
| Sector | 2010 (kt/yr) | 2030 WM (kt/yr) | 2030 WM–2010 (%) | 2030 WAM (kt/yr) | 2030 WAM–2010 (%) | WAM–WM (%) |
| Stationary Sources | 85.07 | 72.60 | −15% | 66.35 | −22% | −9% |
| Civil | 183.44 | 106.37 | −42% | 93.13 | −49% | −12% |
| Solvent Use | 394.03 | 372.98 | −5% | 331.32 | −16% | −11% |
| Road Transport | 190.94 | 86.15 | −55% | 52.43 | −73% | −39% |
| Off−Road Transport | 83.71 | 26.47 | −68% | 21.32 | −75% | −19% |
| Other | 63.20 | 58.18 | −8% | 45.82 | −28% | −21% |
| TOTAL | 1000.39 | 722.75 | −28% | 610.37 | −39% | −16% |
| NH3 emissions | ||||||
| Sector | 2010 (kt/yr) | 2030 WM (kt/yr) | 2030 WM–2010 (%) | 2030 WAM (kt/yr) | 2030 WAM –2010 (%) | WAM–WM (%) |
| Livestock | 313.14 | 297.26 | −5% | 289.96 | −7% | −2% |
| Fertilizer Use | 50.32 | 63.78 | 27% | 46.85 | −7% | −27% |
| Transport and Other Sectors | 24.97 | 17.11 | −31% | 17.69 | −29% | 3% |
| TOTAL | 388.43 | 378.15 | −3% | 354.50 | −9% | −6% |
| 2030 Emission Reductions Respect to the Base Year 2005 | |||
|---|---|---|---|
| Pollutant | NECD Target | 2030_WM | 2030_WAM |
| SO2 | −71% | −73% | −80% |
| NOX | −65% | −63% | −70% |
| PM2.5 | −40% | −33% | −42% |
| NMVOC | −46% | −43% | −50% |
| NH3 | −16% | −11% | −17% |
| Pollutant Metric | Health Outcome | 2010 (min–max) | 2030 WM (min–max) | 2030 WM–2010 (%) | 2030 WAM (min–max) | 2030 WAM– 2010 (%) | WAM–WM (%) |
|---|---|---|---|---|---|---|---|
| PM2.5 annual mean | Mortality all–natural causes | 58,867 (35,379–83,670) | 37,335 (22,608–52,656) | −37% | 34,666 (21,013–48,840) | −41% | −7% |
| Mortality cardiovascular diseases | 46,960 (22,936–72,106) | 26,817 (13,392–40,277) | −43% | 22,847 (11,427–34,264) | −51% | −15% | |
| Mortality respiratory diseases | 7396 (0–18,948) | 4223 (0–10,173) | −43% | 3598 (0–8632) | −51% | −15% | |
| Mortality lung cancer | 4040 (1753–6436) | 2337 (1037–3642) | −42% | 2168 (964–3372) | −46% | −7% | |
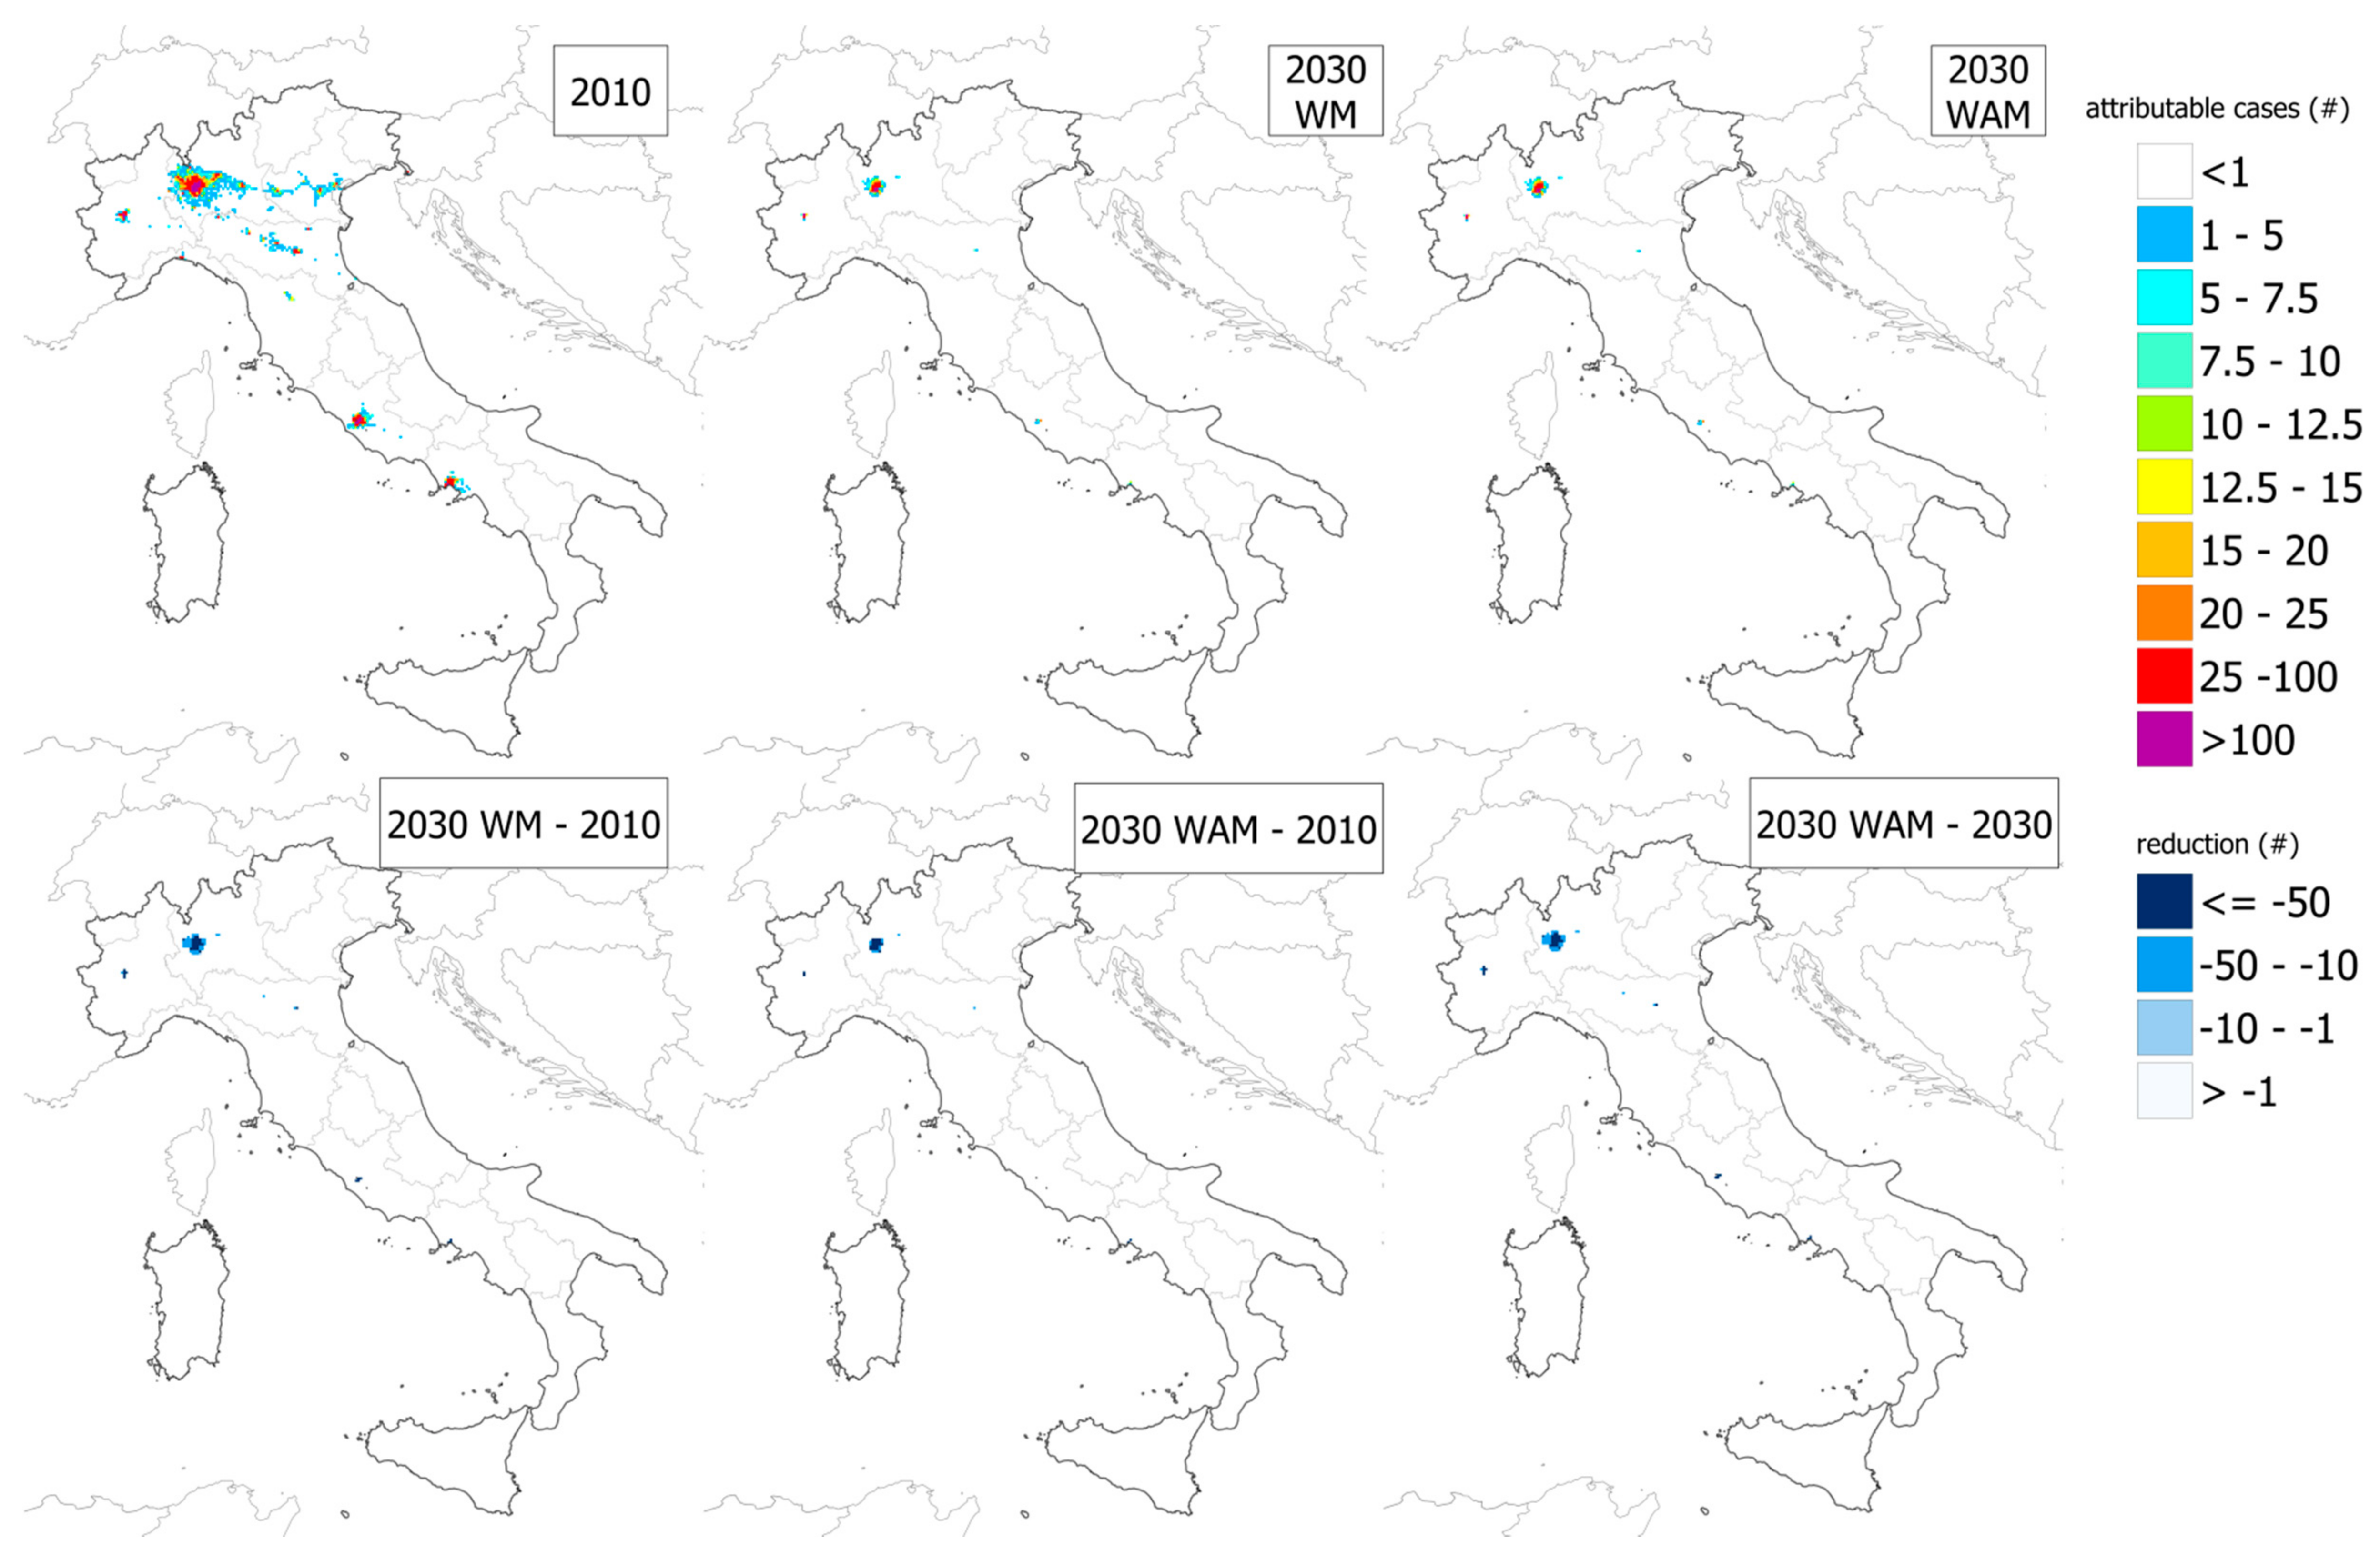
| NO2 annual mean | Mortality all–natural causes | 11,769 (6566–17,301) | 1727 (972–2513) | −85% | 793 (449–1149) | −93% | −53% |
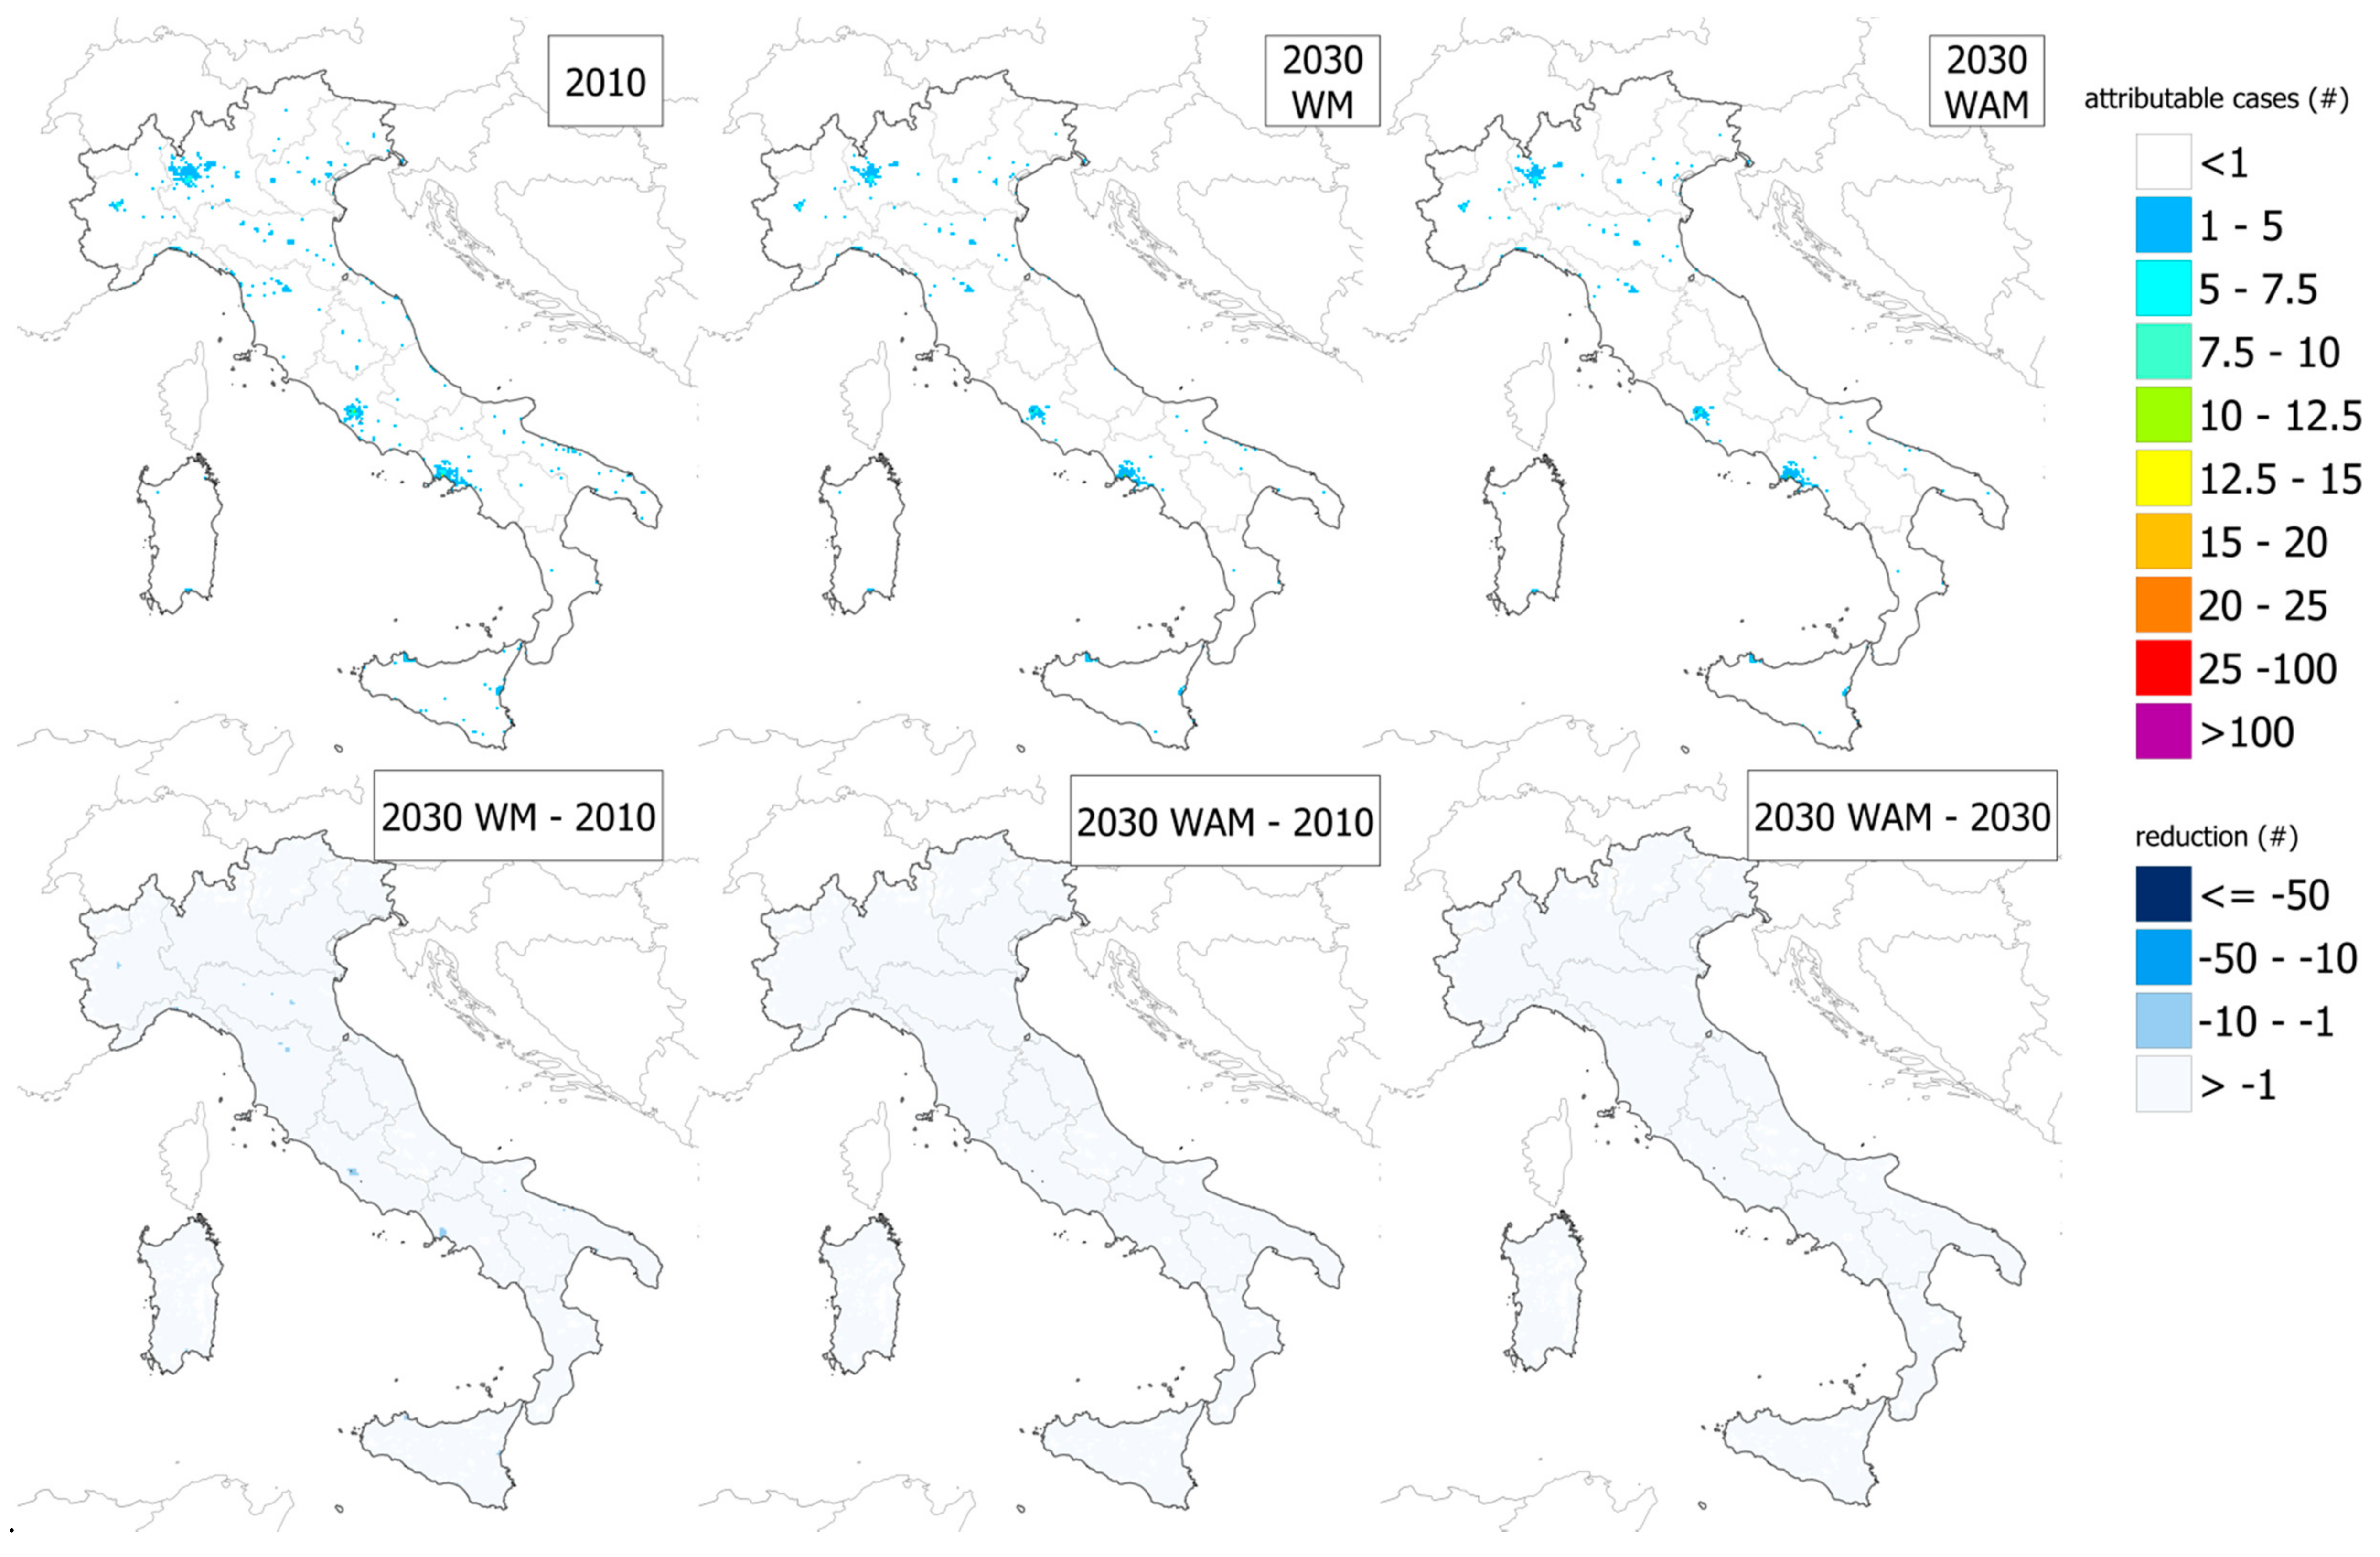
| O3 April–September mean of MDA8 | Mortality respiratory diseases | 2692 (945–4702) | 1851 (654–3211) | −31% | 1725 (610–2990) | −36% | −7% |
| Pollutant Metric | Health Outcome | 2010 (min–max) | 2030 WM (min–max) | 2030 WM–2010 (%) | 2030 WAM (min–max) | 2030 WAM–2010 (%) | WAM–WM (%) |
|---|---|---|---|---|---|---|---|
| PM2.5 annual mean | Mortality all-natural causes | 26,448 (17,574−44,367) | 16,950 (11,296–28,269) | −36% | 15,760 (10,508–26,264) | −40% | −7% |
| Mortality cardiovascular diseases | 13,633 (0–27,653) | 8031 (0–16,074) | −41% | 6857 (0–13,711) | −50% | −15% | |
| Mortality respiratory diseases | 2876 (0–9751) | 1687 (0–5495) | −41% | 1439 (0–4677) | −50% | −15% | |
| Mortality lung cancer | 7927 (4040–11,568) | 4427 (2337–6266) | −44% | 4095 (2168–5780 | −48% | −7% | |
| NO2 annual mean | Mortality all-natural causes | 4216 (0–6351) | 627 (0–941) | −85% | 299 (0–447) | −93% | −52% |
| Pollutant Metric | Health Outcome | 2010 | 2030 WM | 2030 WM–2010 (%) | 2030 WAM | 2030 WAM–2010 (%) | WAM–WM (%) |
|---|---|---|---|---|---|---|---|
| PM2.5 annual mean | Mortality all-natural causes | 7.25 | 4.73 | −35% | 4.43 | −39% | −6% |
| Mortality cardiovascular diseases | 4.53 | 3.16 | −30% | 2.96 | −35% | −7% | |
| Mortality respiratory diseases | 0.71 | 0.50 | −30% | 0.47 | −35% | −6% | |
| Mortality lung cancer | 0.43 | 0.30 | −30% | 0.28 | −34% | −7% | |
| NO2 annual mean | Mortality all-natural causes | 3.34 | 2.47 | −26% | 2.05 | −39% | −17% |
| O3 April–September mean of MDA8 | Mortality respiratory diseases | 0.40 | 0.26 | −36% | 0.24 | −40% | −7% |
| Regions | Benefits 2030 WM–2010(mln €) | Additional Benefits WAM–WM (mln €) | 2030 WM–2010 % of GDP2010 | WAM–WM % of GDP2010 |
|---|---|---|---|---|
| Abruzzo | 350 (205–506) | 44 (26–64) | 1.14% | 0.14% |
| Basilicata | 83 (49–119) | 7 (4–10) | 0.74% | 0.06% |
| Calabria | 242 (142–349) | 22 (13–32) | 0.73% | 0.07% |
| Campania | 2122 (1227–3079) | 157 (92–227) | 2.06% | 0.15% |
| Emilia–Romagna | 2617 (1510–3814) | 311 (183–449) | 1.90% | 0.23% |
| Friuli-Venezia Giulia | 510 (297–741) | 60 (35–86) | 1.46% | 0.17% |
| Lazio | 4163 (2388–6056) | 310 (180–448) | 2.22% | 0.17% |
| Liguria | 638 (371–924) | 73 (43–105) | 1.38% | 0.16% |
| Lombardia | 11,925 (6773–17,575) | 1697 (973–2472) | 3.41% | 0.49% |
| Marche | 465 (272–674) | 53 (31–77) | 1.18% | 0.14% |
| Molise | 59 (35–85) | 6 (3–8) | 0.88% | 0.09% |
| Piemonte | 2382 (1377–3461) | 364 (212–524) | 1.91% | 0.29% |
| Puglia | 667 (389–964) | 50 (29–72) | 0.95% | 0.07% |
| Sardegna | 250 (147–361) | 16 (10–24) | 0.76% | 0.05% |
| Sicilia | 663 (386–960) | 36 (20–53) | 0.75% | 0.04% |
| Toscana | 1210 (705–1753) | 149 (88–215) | 1.15% | 0.14% |
| Trentino-Alto Adige | 187 (110–269) | 21 (13–30) | 0.98% | 0.11% |
| Umbria | 250 (146–362) | 32 (19–46) | 1.13% | 0.15% |
| Valle D’Aosta | 21 (12–30) | 3 (2–4) | 0.44% | 0.06% |
| Veneto | 2944 (1705–4293) | 354 (208–512) | 2.06% | 0.25% |
| ITALY | 29,691 (17,088–43,320) | 3415 (1981–4947) | 1.84% | 0.21% |
Publisher’s Note: MDPI stays neutral with regard to jurisdictional claims in published maps and institutional affiliations. |
© 2021 by the authors. Licensee MDPI, Basel, Switzerland. This article is an open access article distributed under the terms and conditions of the Creative Commons Attribution (CC BY) license (http://creativecommons.org/licenses/by/4.0/).
Share and Cite
Piersanti, A.; D’Elia, I.; Gualtieri, M.; Briganti, G.; Cappelletti, A.; Zanini, G.; Ciancarella, L. The Italian National Air Pollution Control Programme: Air Quality, Health Impact and Cost Assessment. Atmosphere 2021, 12, 196. https://doi.org/10.3390/atmos12020196
Piersanti A, D’Elia I, Gualtieri M, Briganti G, Cappelletti A, Zanini G, Ciancarella L. The Italian National Air Pollution Control Programme: Air Quality, Health Impact and Cost Assessment. Atmosphere. 2021; 12(2):196. https://doi.org/10.3390/atmos12020196
Chicago/Turabian StylePiersanti, Antonio, Ilaria D’Elia, Maurizio Gualtieri, Gino Briganti, Andrea Cappelletti, Gabriele Zanini, and Luisella Ciancarella. 2021. "The Italian National Air Pollution Control Programme: Air Quality, Health Impact and Cost Assessment" Atmosphere 12, no. 2: 196. https://doi.org/10.3390/atmos12020196