Article

Analysis of Atmospheric Aerosol Optical Properties in the Northeast Brazilian Atmosphere with Remote Sensing Data from MODIS and CALIOP/CALIPSO Satellites, AERONET Photometers and a Ground-Based Lidar

by
Aline M. de Oliveira
1,*,
Cristina T. Souza
2,
Nara P. M. de Oliveira
1,
Aline K. S. Melo
1,
Fabio J. S. Lopes
3,4,
Eduardo Landulfo
4,
Hendrik Elbern
5 and
Judith J. Hoelzemann
2,*
1
Graduate Program in Climate Sciences, Federal University of Rio Grande do Norte (PPGCC/CCET/UFRN), Natal - RN 59078-900, Brazil
2
Department of Atmospheric and Climate Sciences, Federal University of Rio Grande do Norte (DCAC/CCET/UFRN), Natal - RN 59078-900, Brazil
3
Environmental Science Department, Institute of Environmental, Chemical and Pharmaceutical Science, Federal University of São Paulo, Rua São Nicolau, 210, Centro, Diadema, São Paulo 09913-030, Brazil
4
Center for Lasers and Applications, Nuclear and Energy Research Institute-IPEN, São Paulo 05508-000, Brazil
5
Rhenish Institute for Environmental Research, University of Cologne (RIU), 50923 Köln, Germany
*
Authors to whom correspondence should be addressed.
Atmosphere 2019, 10(10), 594; https://doi.org/10.3390/atmos10100594
Submission received: 6 August 2019 / Revised: 27 August 2019 / Accepted: 29 August 2019 / Published: 2 October 2019
(This article belongs to the Special Issue Remote Sensing of Aerosols)

Abstract

:
A 12-year analysis, from 2005 to 2016, of atmospheric aerosol optical properties focusing for the first time on Northeast Brazil (NEB) was performed based on four different remote sensing datasets: the Moderate Resolution Imaging Spectroradiometer (MODIS), the Aerosol Robotic Network (AERONET), the Cloud-Aerosol LIDAR with Orthogonal Polarization (CALIOP) and a ground-based Lidar from Natal. We evaluated and identified distinct aerosol types, considering Aerosol Optical Depth (AOD) and Angström Exponent (AE). All analyses show that over the NEB, a low aerosol scenario prevails, while there are two distinct seasons of more elevated AOD that occur every year, from August to October and January to March. According to MODIS, AOD values ranges from 0.04 to 0.52 over the region with a mean of 0.20 and occasionally isolated outliers of up to 1.21. Aerosol types were identified as sea spray, biomass burning, and dust aerosols mostly transported from tropical Africa. Three case studies on days with elevated AOD were performed. All cases identified the same aerosol types and modeled HYSPLIT backward trajectories confirmed their source-dependent origins. This analysis is motivated by the implementation of an atmospheric chemistry model with an advanced data assimilation system that will use the observational database over NEB with the model to overcome high uncertainties in the model results induced by still unvalidated emission inventories.

1. Introduction

Atmospheric aerosols are one of the main sources of uncertainties when describing atmospheric chemistry and physics [1]. The diversity of aerosol types, their different formation, aging and removal processes, along with challenging measurement limitations burden modelling efforts with critical uncertainties. These uncertainties result from the highly variable presence of different aerosol types with distinct physical and optical properties in the NEB atmosphere and how they interact and influence e.g., cloud formation, precipitation, the radiation budget, dynamics, biogeochemical and chemical processes, and consequently, affect global climate [2,3,4,5] as well as the reliability of global and regional climate simulations. The variability of aerosols is a result of the aerosol’s manifold natural and anthropogenic emission sources, or, in case of secondary aerosols, the not yet fully understood chemical formation processes [6,7,8]. Main emission sources include soil erosion and mineral dust, volcanoes, vegetation, oceans, vegetation fires and other combustion processes, such as those from industrial and transport activities [9,10,11]. Aerosols influence air quality locally as well as remotely. Their intercontinental transport can lead to changes in chemical properties of the entire lower and middle atmosphere. Moreover, it can enhance pollution in regions where emission rates are either generally low or contribute on top of local emissions. As an example, in South America, biomass burning aerosols from the central part of the continent (mainly Brazil and Bolivia) are frequently advected towards the south and then east during the dry season from June to October each year [12,13]. Since the beginning of 2019 deforestation in the Amazon and associated fires in central South America have dramatically risen [14]. Very recently, in South America, biomass burning emissions from the central part of the continent (mainly Brazil and Bolivia) are frequently advected towards the south and then east during the dry season from June to October each year [9]. Since the beginning of 2019 deforestation in the Amazon and associated fires in central South America have dramatically risen [10]. Very recently, from 18 to 20 August 2019, biomass burning aerosols were transported in an unprecedented amount over most of the southeast and south of Brasil, reaching the population of the main cities such as São Paulo in the region on 19 August. Around 15 local time (18 UTC) the sky turned black, extinguishing almost completely the sun light by an interaction, yet to be better investigated, of the very intense smoke haze from the North / Northwest and clouds arriving with an antarctic cold front from the South [15].
Also, on an intercontinental scale, biomass-burning aerosols and mineral dust are transported regularly from Africa to Central and South America [4,16,17]. Mineral dust is not only considered the major aerosol component over the globe, but also one of the most important aerosol types in the atmosphere [18,19], as well as the major contributor to aerosol mass and optical depth. The impact on atmospheric dynamics occurs by both direct and semi-direct effects, altering radiation, cloud coverage, precipitation patterns, in general cloud optical properties and microphysics [20,21], as well as they are considered to play an important role in some of the biogeochemical cycles [22]. They can also interact with ice clouds. Globally, the Saharan desert is the main source of mineral dust. Part of the mineral dust emissions is advected to many different regions such as Europe, India and the Americas, during distinct seasons of the year [23].
The aerosol transport from Africa to the Americas has been studied since the 1970s [24], and efforts remain ongoing considering aerosol influences on the climate of the Americas [25,26,27]. However, dust aerosols influence climate change and their full consequences are as yet not sufficiently well understood. The aerosol dust from African is a source of natural fertilizer in the Amazon Basin [28]. The transport of dust aerosols to Latin America occurs seasonally, largely modulated by a northward shift of the Inter-Tropical Convergence Zone (ITCZ), during late austral winter and a southward shift in spring [27,29,30]. According to [27], around 100 Tg of desert dust leaves Africa every year and travels towards the Caribbean and southeastern USA and Central America during the austral summer months. 30 Tg cross the 60º W longitude during winter months, and 13 Tg are deposited in the Amazon basin, serving as an important nutrient for the rainforest. Another fraction of this dust moves to lower latitudes in South America, reaching Northeast Brazil (NEB) while depending on the southward movement of the ITCZ position to be able to cross the 5° S latitude. Along with dust, biomass burning aerosols from fires in the sub-Sahelian region that occur on an annual regular basis from December to February each year, are also advected towards South America contributing to the annual enhancement of the aerosol loading during this time of the year [31]. Additionally, emissions from vegetation fires from southern hemispheric Africa may reach Brazil during the respective fire season from July to September each year. The main meteorological systems controlling this transport are the west African monsoon circulation, the low-level jet, and eastern African jets in higher altitudes [32].
In this context, characterization of the large spatial and temporal features of aerosols is still a challenge, especially in areas where there are poor or no datasets of in-situ measurements. To fill those gaps, until more local data become available, this paper shows a twelve-year analysis, from 2005 to 2016, of the optical properties of aerosols in the atmosphere of NEB, based on the analysis of Aerosol Optical Depth (AOD) and Angström Exponent (AE) from different types of remote sensing techniques. We aim to combine remote sensing data in a synergistic way, making use of their specific and complementary potentials. In order to identify and quantify different aerosols types in NEB we use data from the Moderate Resolution Imaging Spectroradiometer (MODIS) on board the AQUA and TERRA satellites during the period from 2005 to 2014. MODIS data were used due to its high spatial coverage, and data quantity [33,34]. Cloud-Aerosol LIDAR with Orthogonal Polarization (CALIOP) data, on board of the Cloud-Aerosol Lidar and Infrared Pathfinder Satellite Observation (CALIPSO), from 2007 to 2016 were used to validate the Lidar Ratio from CALIOP with data from a sun photometer of the Aerosol Robotic Network (AERONET) located in Petrolina in the state of Pernambuco (PE) [35]. Also, CALIPSO data collected within a radius of 120 km around Natal were used to obtain an AOD characterization in that area [36,37,38]. The whole methodology of the CALIPSO data analysis was based on the CALIPSO lidar ratio algorithm evaluated in Brazil by [39]. Another goal of this paper is to compare the found results of this data base with data obtained from our ground-based Lidar system called DUSTER, installed in the city of Natal and operating since 2016. By the analyses of this study we aim to support the identification of aerosol types by combining the specific strengths of different instrumentation techniques while mitigating their weaknesses for data assimilation purposes. This paper is divided as follows: Section 2 presents the methodology applied to analyze the different satellite measurements. In Section 3 we show the results of the analyses from MODIS in the entire region of NEB. The analyses of CALIPSO in the cities of Petrolina and Natal, and the DUSTER/Lidar analyses in the city of Natal are shown in case studies followed by the conclusions in Section 4.

2. Methodology

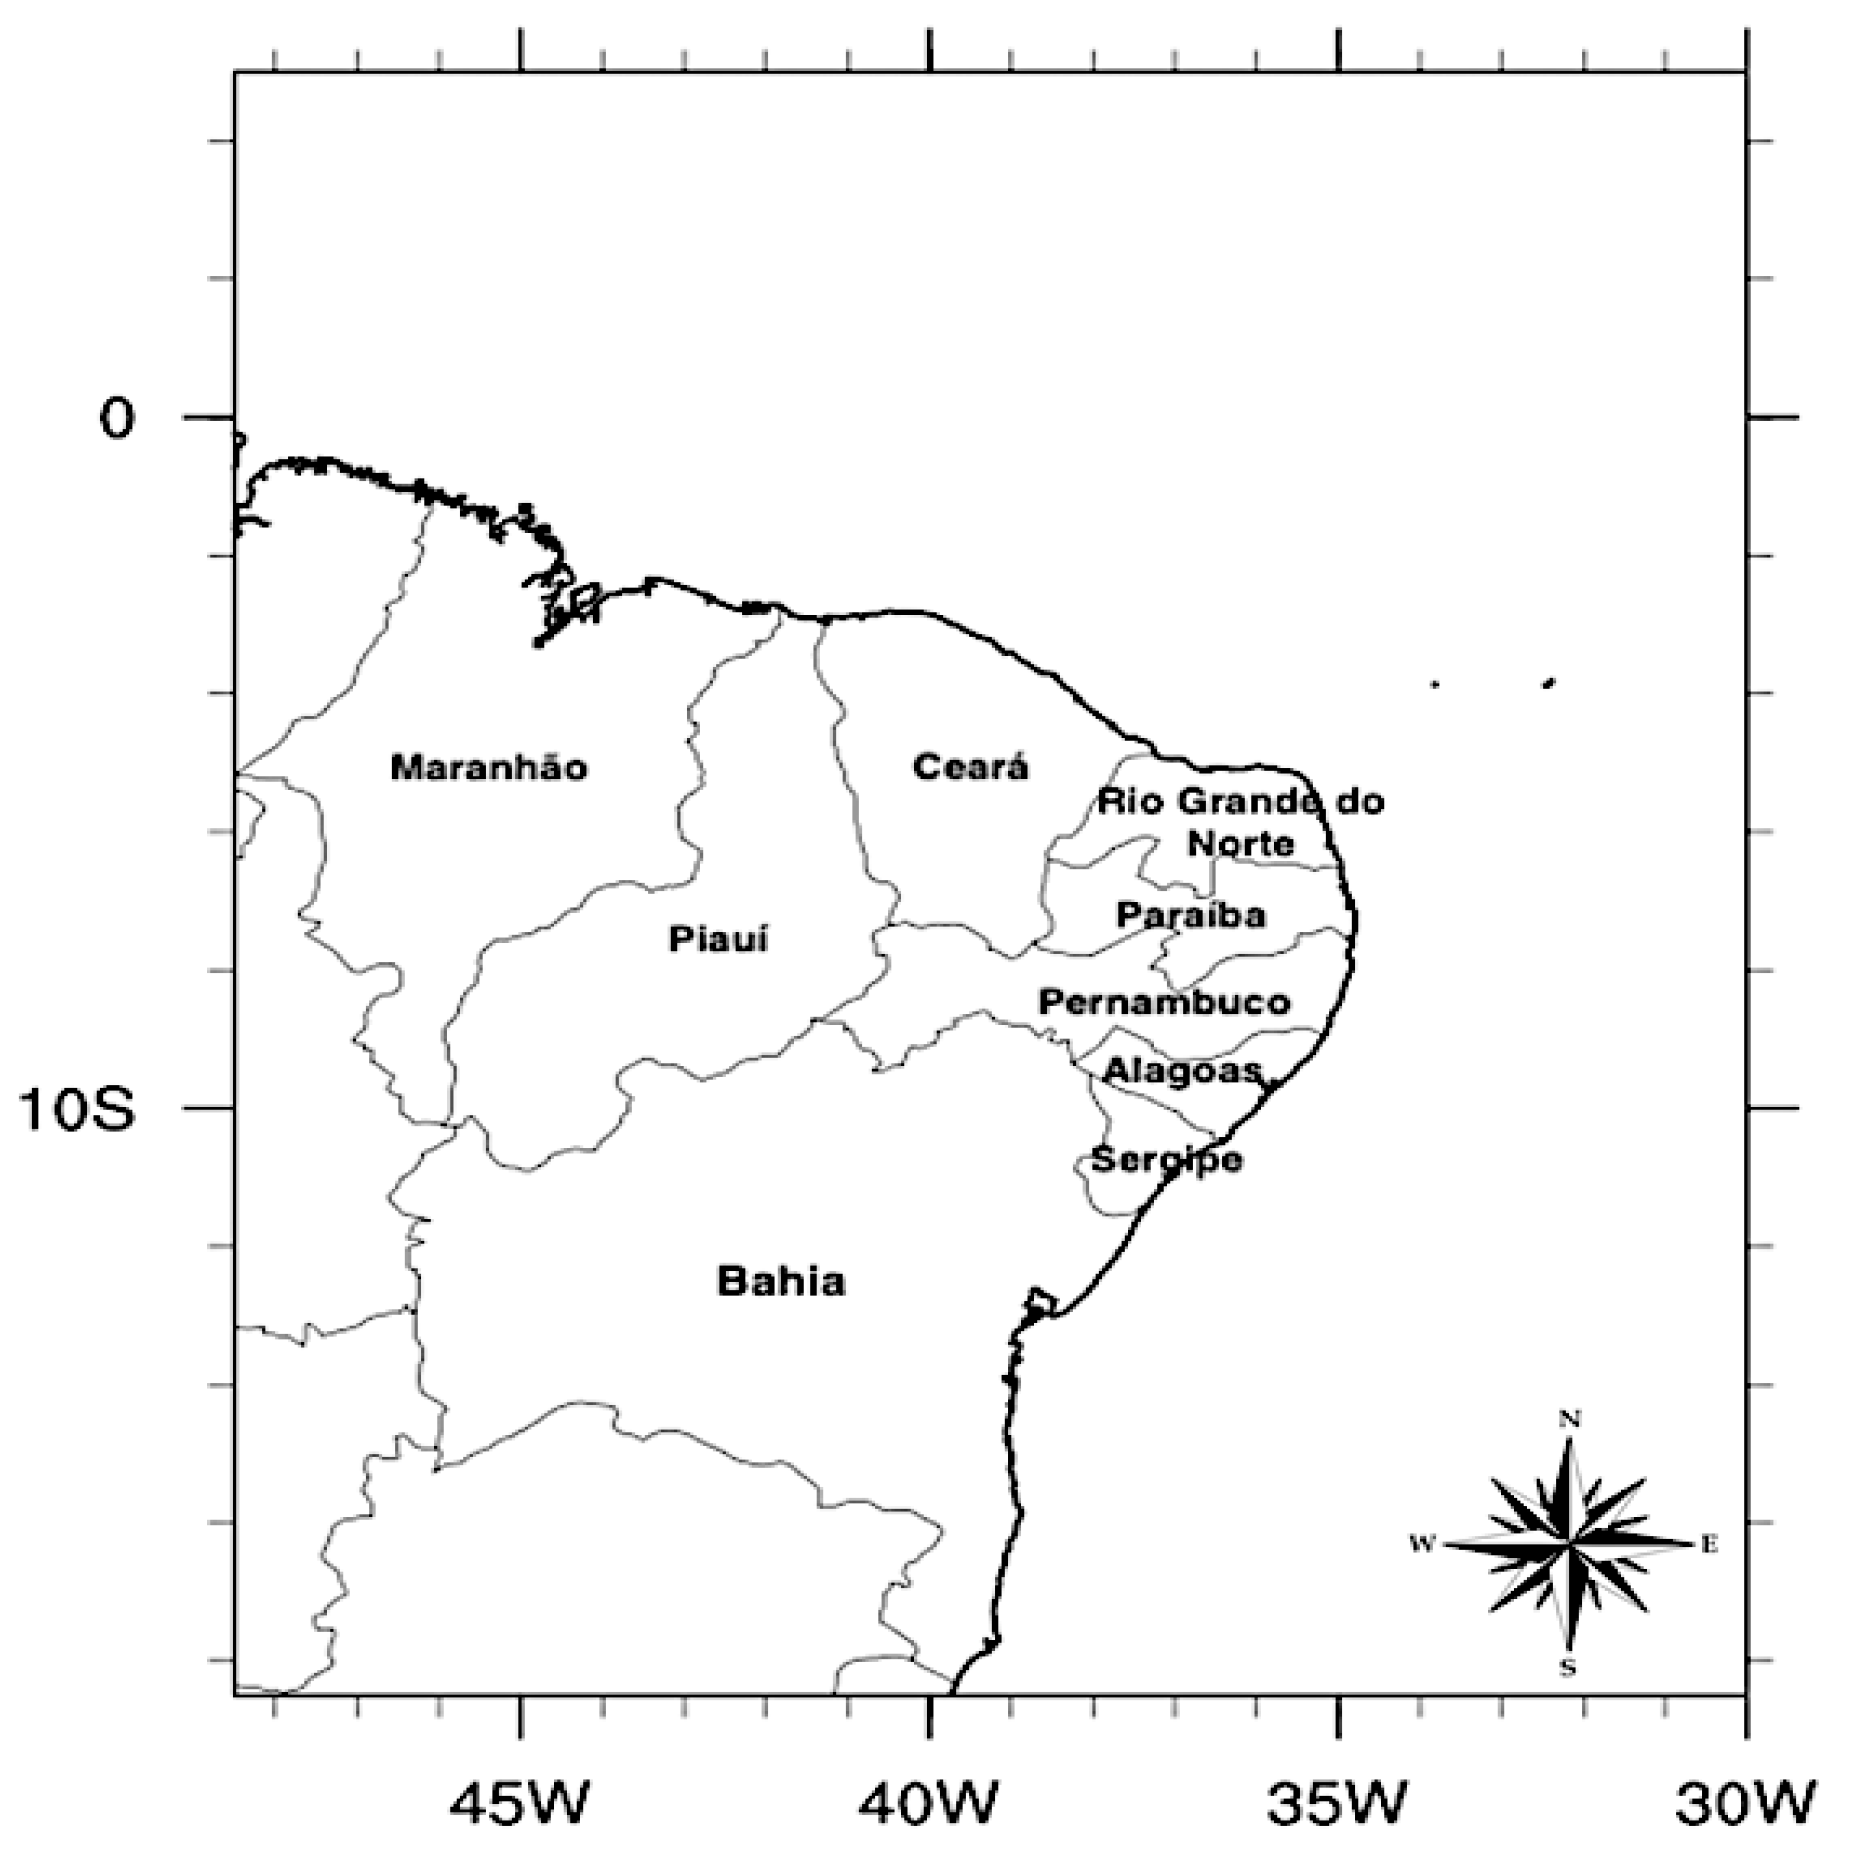
2.1. Description of the Region and Local Datasets

Northeast Brazil (NEB) is one of the five major Brazilian regions, with an extension of nearly 1.6 million km2 and almost 57 million inhabitants, representing over one third of the country’s population. NEB comprises nine states: Alagoas, Bahia, Ceará, Maranhão, Paraíba, Piauí, Pernambuco, Rio Grande do Norte and Sergipe [40]. The NEB atmosphere is influenced by aerosols and gases emitted locally as well as transported from other regions. The main meteorological systems that influence the region, and consequently the atmospheric aerosol loading, are the Inter-tropical Convergence Zone (ITCZ), onshore and offshore sea breezes, instability lines (IL), as well as westerly waves, among others [41]. Figure 1 shows the area of Northeast Brazil and the aerosol inflow region. We used four different datasets in our study:
The MODerate resolution Imaging Spectroradiometer (MODIS) is one of the EOS (Earth Observing System) satellite sensors that circulates in a polar orbit onboard of the two satellites TERRA and AQUA. MODIS has a spectral range of 36 channels or bands and a relative spatial resolution (1 km or less depending on the band). It observes a swath of approximately 2,330 km wide and covers between 14 and 15 orbits per day. The data is composed by 1,354 by 2,030 pixels at a nominal 1 km resolution (near nadir). MODIS data is organized in five levels, from raw observations (Level 0) to primary geophysical observations, designated as Level 2 (L2). The L2 aerosol product is known as MOD04 (TERRA) and MYD04 (AQUA). A latitude–longitude grid of 10 × 10 km2 at nadir spatial resolution was considered and includes the closest 6 hourly meteorological analyses from Global Data Assimilation Model (GDAS) [42]. The operational MODIS aerosol retrievals are separated in three algorithms that consider assumptions about the Earth’s surface and the aerosols types above these surfaces. Two of those algorithms were developed for vegetated land surfaces and remote oceans regions. We selected the corrected and combined land and ocean product from MODIS called Optical_Depth_Land_And_Ocean (AOD) at 0.55 micron. This product contains only AOD values for the filtered, quantitatively useful retrievals over dark targets (dark in visible and longer wavelengths). For more detailed explanation on the product and MODIS data the reader is referred to [42].
Aerosol information was derived from both MODIS instruments on board the AQUA and TERRA satellites from the US National Aeronautics and Space Administration (NASA) during a period of 10 years (from 2005 to 2014), to make best use of all available data and allow a characterization of the dominant aerosol type present in the atmosphere. Since the region is large, an analysis using solely data at one location (for instance, from the AERONET site at Petrolina-PE), would not provide a reliable characterization. Also, the satellite overpasses occur in different periods: AQUA crosses the NEB during the afternoon and TERRA during the morning accounting for diurnal variations due to eventual specific anthropogenic aerosol emission or formation activities or cloud coverage in the region. The dataset was used for NEB (Figure 1) to quantify the aerosols in the region, characterize the periods in the year with higher aerosol loading and achieve a better understanding of inter-annual variability as well as the predominant particle types over the region.
The AERONET (Aerosol Robotic NETwork) is a federation of ground-based remote sensing aerosol networks established by NASA and the french Centre National de la Recherche Scientifique (CNRS), meanwhile expanded by different collaborators. The network provides a long-term, continuous and readily accessible public domain database of aerosol optical, microphysical and radiative properties for aerosol research, characterization, satellite validation among others (https://aeronet.gsfc.nasa.gov/). AERONET measurements are site specific, as the instruments are fixed, with retrievals in intervals of up to 15 min during the daylight period. Those measurements provide data in three different processing levels, from level 1.0 (raw data) to level 2.0 (quality-assured data). In this paper we selected the level 1.5 (automated cloud–screened data), because level 2.0 data are not available until the year 2014 and would thus not cover the analyzed full ten-year period.
The Cloud-Aerosol Lidar and Infrared Pathfinder Satellite Observation (CALIPSO) satellite combines an active lidar instrument with passive infrared and visible images that provides vertical structure and properties of thin cloud and aerosols all over the globe. It was launched on April 2006 and flies in a 705 km sun-synchronous polar orbit with an equator-crossing time of about 13:30 local solar time, covering the whole globe in a repeat cycle of 16 days. The data are composed of calibrated and geolocated profiles of the attenuated backscatter signal and available in two wavelengths, 1064 nm and 532 nm. We selected level 2 data, derived from level 1 data, that includes aerosols and clouds profiles. CALIPSO algorithms have a scheme to classify aerosols, in six different types of aerosols as dust, biomass burning, clean continental, polluted continental, marine and polluted dust [43,44,45].
From the four operating Lidars in Brazil, one is located in Northeast Brazil, in the city of Natal and is the most recently installed (since 2016). The DUSTER, as it is called, is part of the Latin American Lidar Network (LALINET) and is the only depolarization Lidar system in the country operating since the beginning of 2016, intended mainly to detect and identify aerosol dust layers from the Saharan Desert advected across the Atlantic Ocean. Those observations occur in coordination with a sun photometer (CIMEL Ce318 radiometer included in RIMA-AERONET (Red Ibérica de Medida fotométrica de Aerosoles), deployed in Natal) and with CALIPSO satellite overpasses [46]. The system was designed to create a database of African dust transportation, and to characterize optical aerosol properties. These data can be assimilated by chemical and radiative models [47]. The DUSTER system has four channels: 1064 nm, parallel 532 nm (||), perpendicular 532 nm (⊥) and 355 nm, coupled with a Cassegranian Carbon Plastic telescope of 300 mm. The laser emits at wavelengths of 1064 nm, 532 nm and 355 nm, with energy per pulse of about 300 mJ, 150 mJ and 90 mJ, respectively. The detection box has an Avalanche Photodiode (APD) for 1064 nm radiation detection and 3 photomultipliers, for both polarizations at 532 nm and 355 nm. The signal is digitized by a transient recorder operating in analog and photon counting modes (Licel [47]. A paper describing the DUSTER/Lidar system of Natal in detail is currently in preparation.

2.2. Characterization of Aerosol Types in NEB

Aerosols have different optical and microphysical properties. The importance of their impact consists of understanding their effects in the atmosphere. To characterize the aerosol type, AOD combined with the Angstrom Exponent (AE) was analyzed, since AOD provides information on the aerosol attenuation characteristics and AE of the predominant aerosol sizes [48,49]. The classification was referenced by [49,50,51], as shown in Table 1.

2.3. Analyses over Two Distinct Cities in the NEB Region

So far there are two different cities in the NEB region that measure atmospheric aerosol data on an operational basis: the coastal city of Natal in the state of Rio Grande do Norte, located at the northeastern most point of South America and Petrolina, located 870 km southwest of Natal, about 700 km off the coast. Both cities have emission sources of different aerosol types. Natal is a seaside city with evidence of dust emissions throughout the year. Due to the economy, the main emission sources in Petrolina are result of industrial pollution and biomass-burning derivatives from agricultural activities that occur regularly in the region.
In Natal AOD at 532 nm (level 2 data) derived from the CALIOP/Lidar on board of the CALIPSO satellite was analyzed. Two datasets from CALIOP were considered: level 1B (attenuated total backscattered data) and level 2 (provides information about aerosols layers, cloud aerosols types, extinction profiles and backscattering). The satellite overpasses occur in Natal during night (around 04:00 UTC) and early afternoon (16:00 UTC) in a frequency of approximately 16 days. DUSTER data were considered only when CALIPSO overpasses coincided with radii of influence under 120 km from the Lidar location in Natal. [52] suggests that to have a strong correlation between CALIPSO and Lidar data, it is necessary to consider intervals of up to 3 h and distances up to 60 km. An eligible correlation is considered in the interval of 6 h with distances up to 120 km [53]. This distance was obtained from the CALIPSO OVERpass Locator Algorithm (COVERLAI) by [54], adapted to the region. According to [54] and [55], the correlation between instrument measurements on board of satellites and those that are ground-based decreases by 20% at distances above 200 km, and by 10% at distances up to 140 km, within an hour of difference. Besides the analysis of AOD and Lidar Ration (LR), backscatter profiles from DUSTER/Lidar and from CALIOP were compared, only when the smallest distance between the satellite footprint and the DUSTER (around 60 km), was observed.
Petrolina is located at the western part of the state of Pernambuco, approximately 700 km from the coast. Petrolina is the only city with consolidated AERONET data in NEB, since 1993. The CIMEL sun photometer in Natal was only installed in 2016, therefore an analysis of AOD and AE derived from the sun photometer in Petrolina was performed, in the period from 2007 to 2016. Both parameters are interpolated at 532 nm. Furthermore, a comparison between AERONET and CALIOP data was made to validate the information given by the satellite.
During the analyzed period (2007–2016), 614 satellite passages were obtained (during the day, because all the satellites from the A-train constellation are located at a 705 km orbit and cross the equator, approximately at 1:30 (in the morning and night). A distance (or radius of influence) from 120 km between the satellite footprint and the AERONET station was defined to obtain representative and comparable data pairs. During the analyzed period, out of the 614 CALIOP overpasses, only 177 were considered for two reasons: (1) availability of AERONET data; and (2) not all the overpasses were inside the radius of influence of the satellite. In order to distinguish aerosol layers from clouds an evaluation of the quality and degree of reliability of CALIPSO data was applied. From the 177 days, we selected only those in which AERONET data and CALIOP overpasses coincided, and those that were within the criteria from the Cloud-Aerosol Discrimination Score (CAD). The selection criteria based on CAD considered values in the interval of –50 and –100, for cloud data profiles with 5 km resolution. As a result, 54 measurements without cloud contamination were considered for analyses.

3. Results and Discussion

This section describes the general findings of the 10-year analysis from 2005–2014 of MODIS AOD over the whole NEB region, describing inter-annual and intra-annual variations in the time series, defining the seasons of more elevated AOD, mean, median, and minimum and maximum values. In addition to MODIS, AOD datasets available in the cities of Natal/RN and Petrolina/PE from 2007–2016 are analyzed for CALIOP/CALIPSO and AERONET AOD in the case of Petrolina.

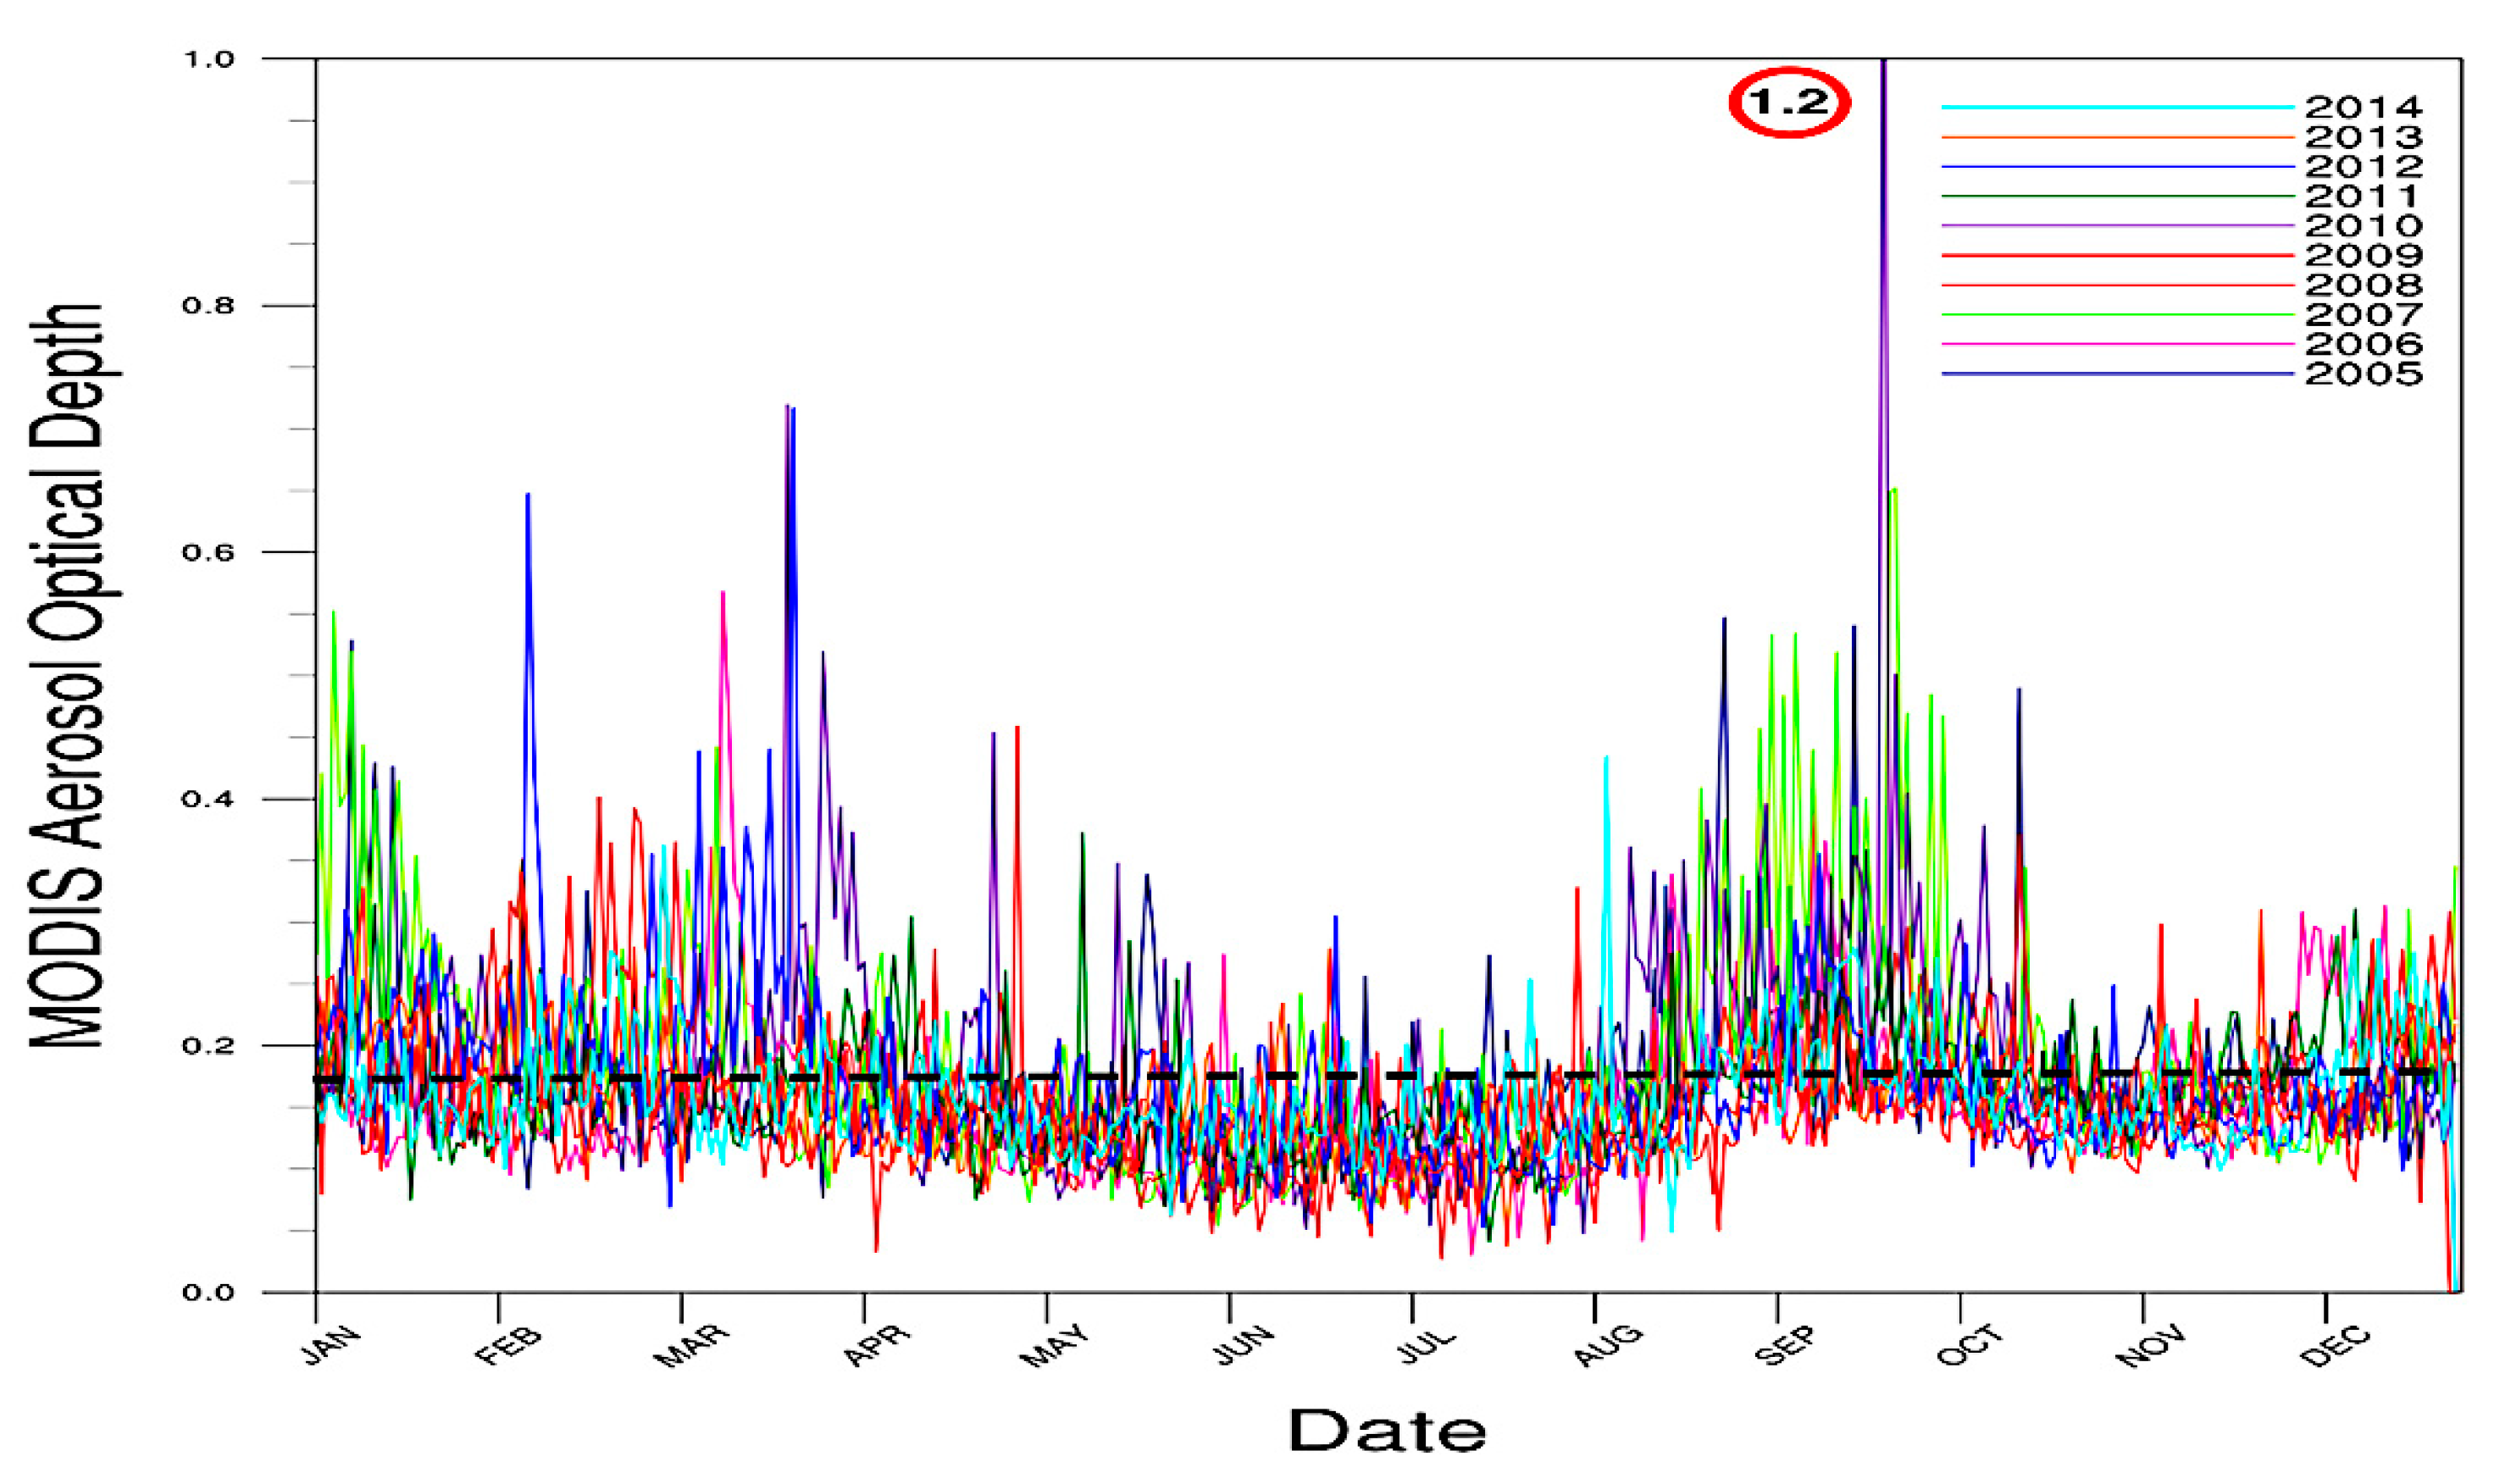
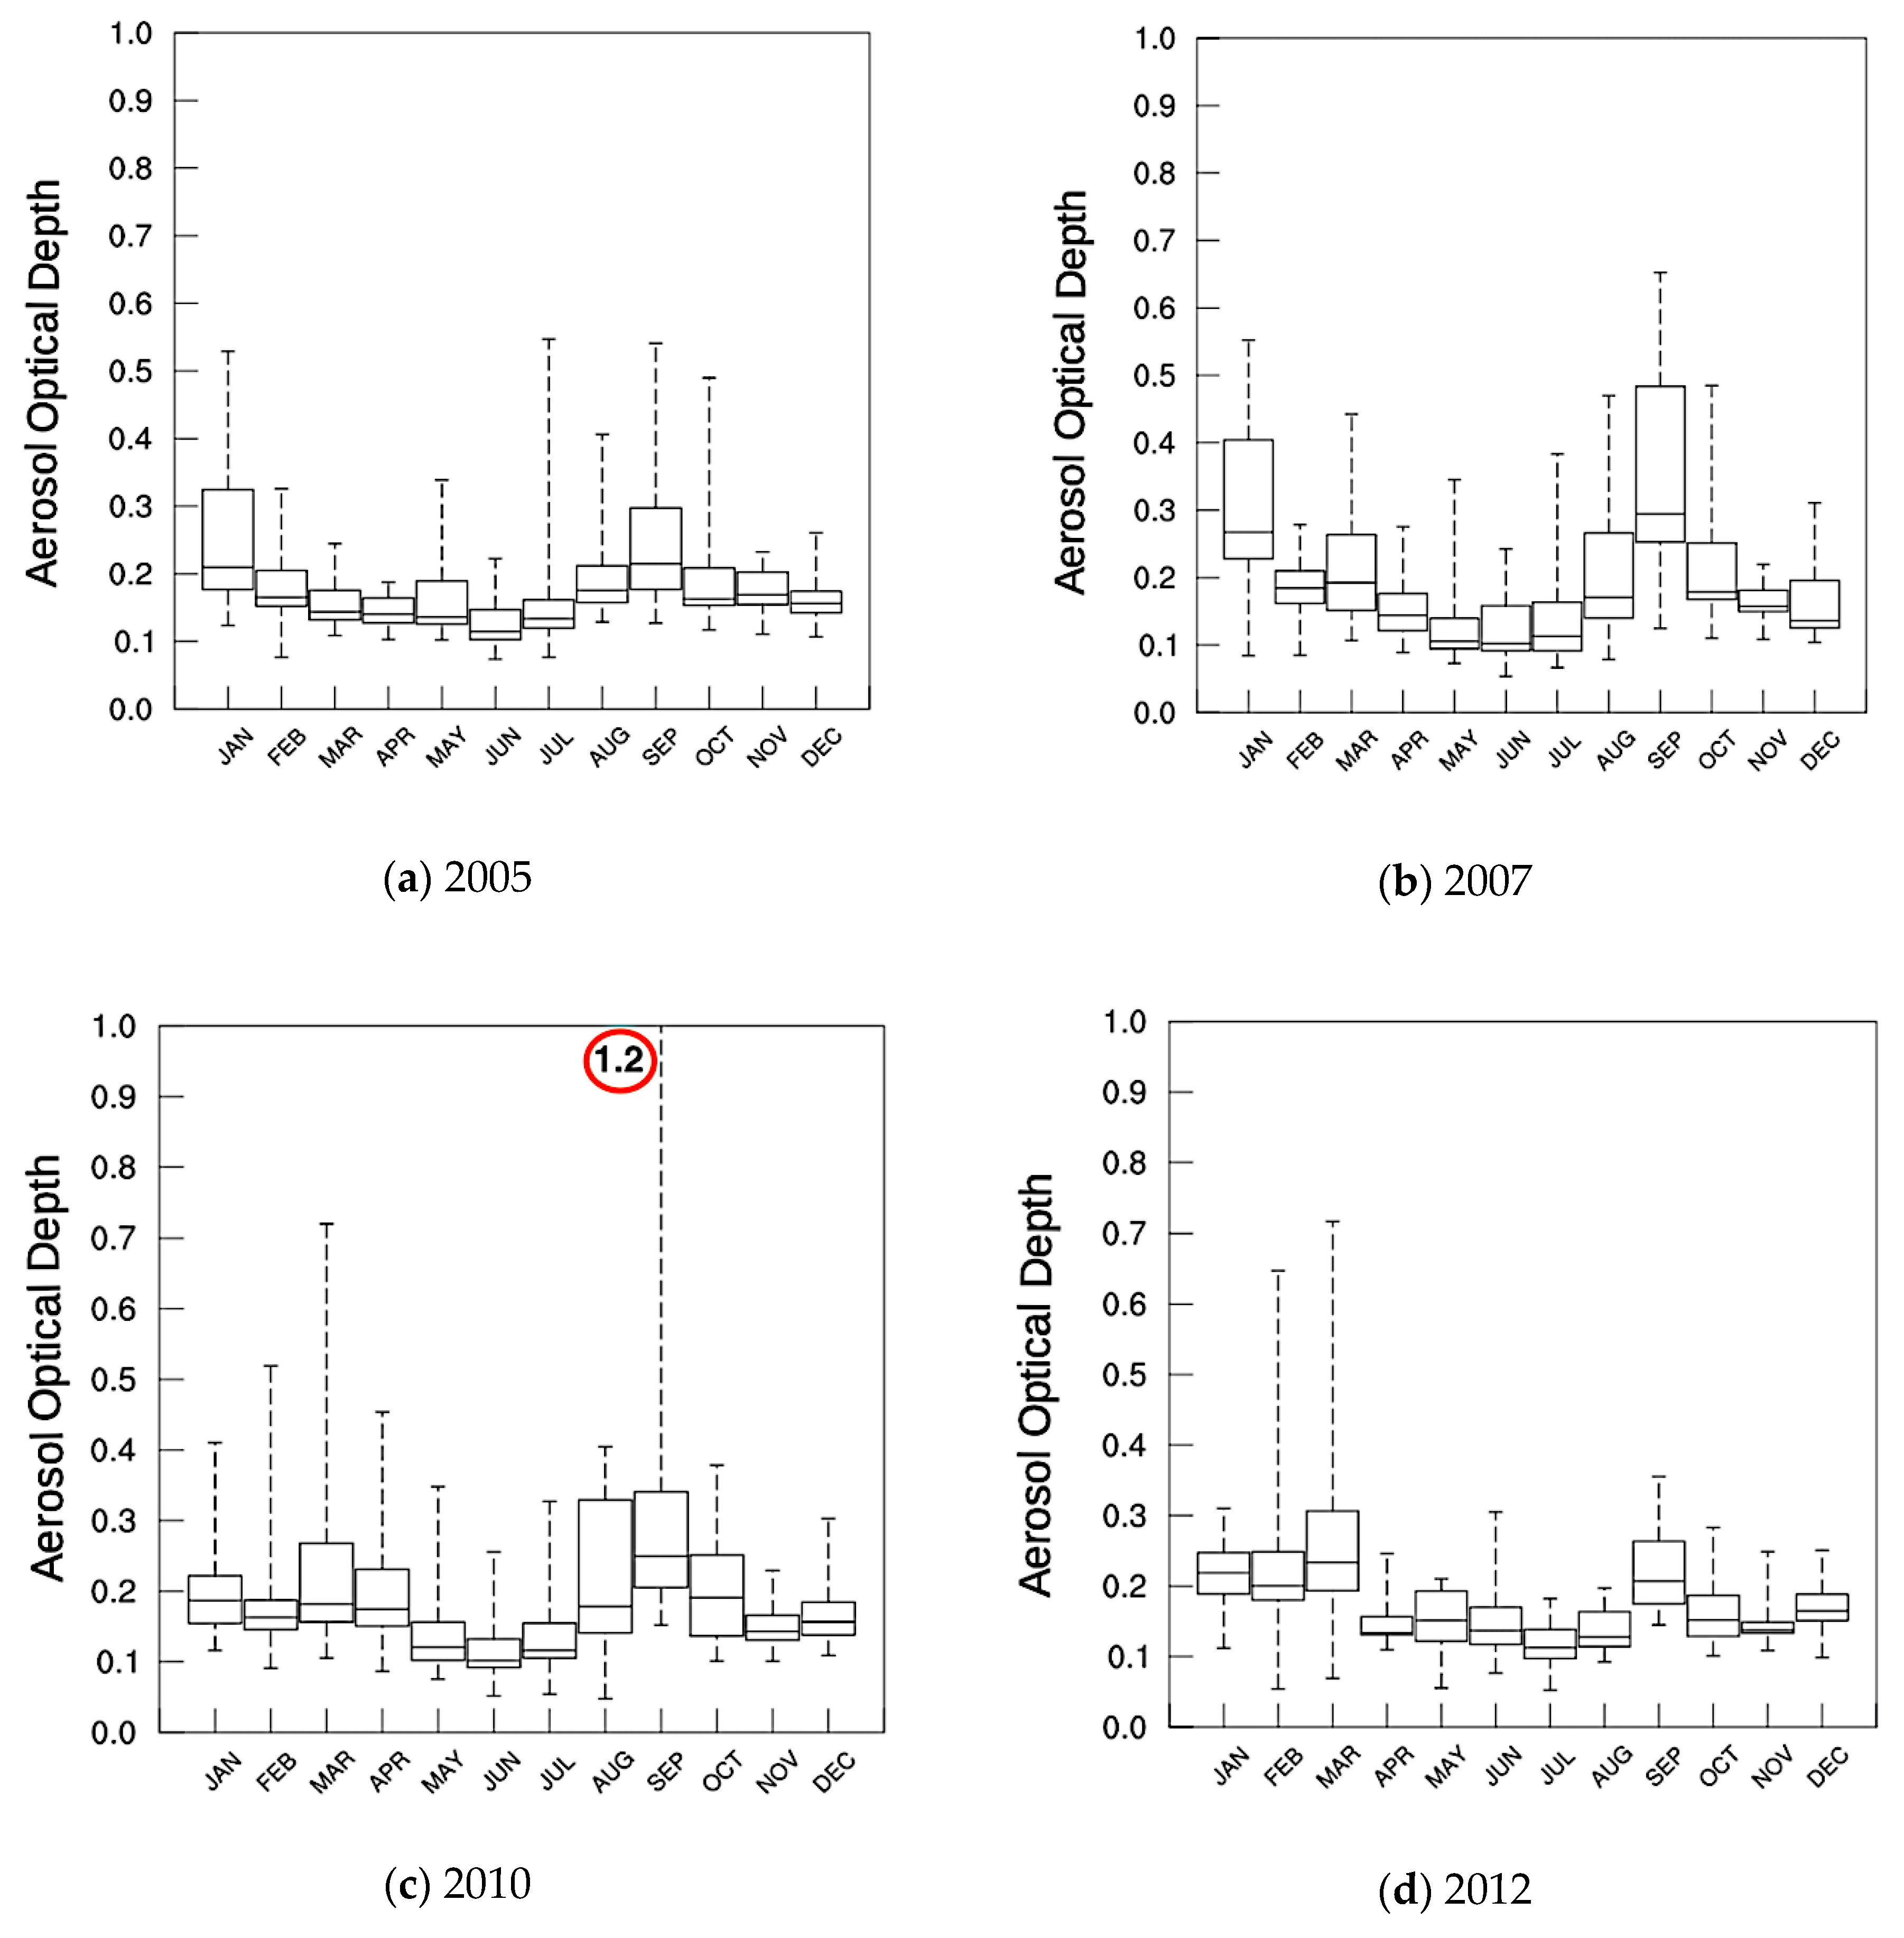
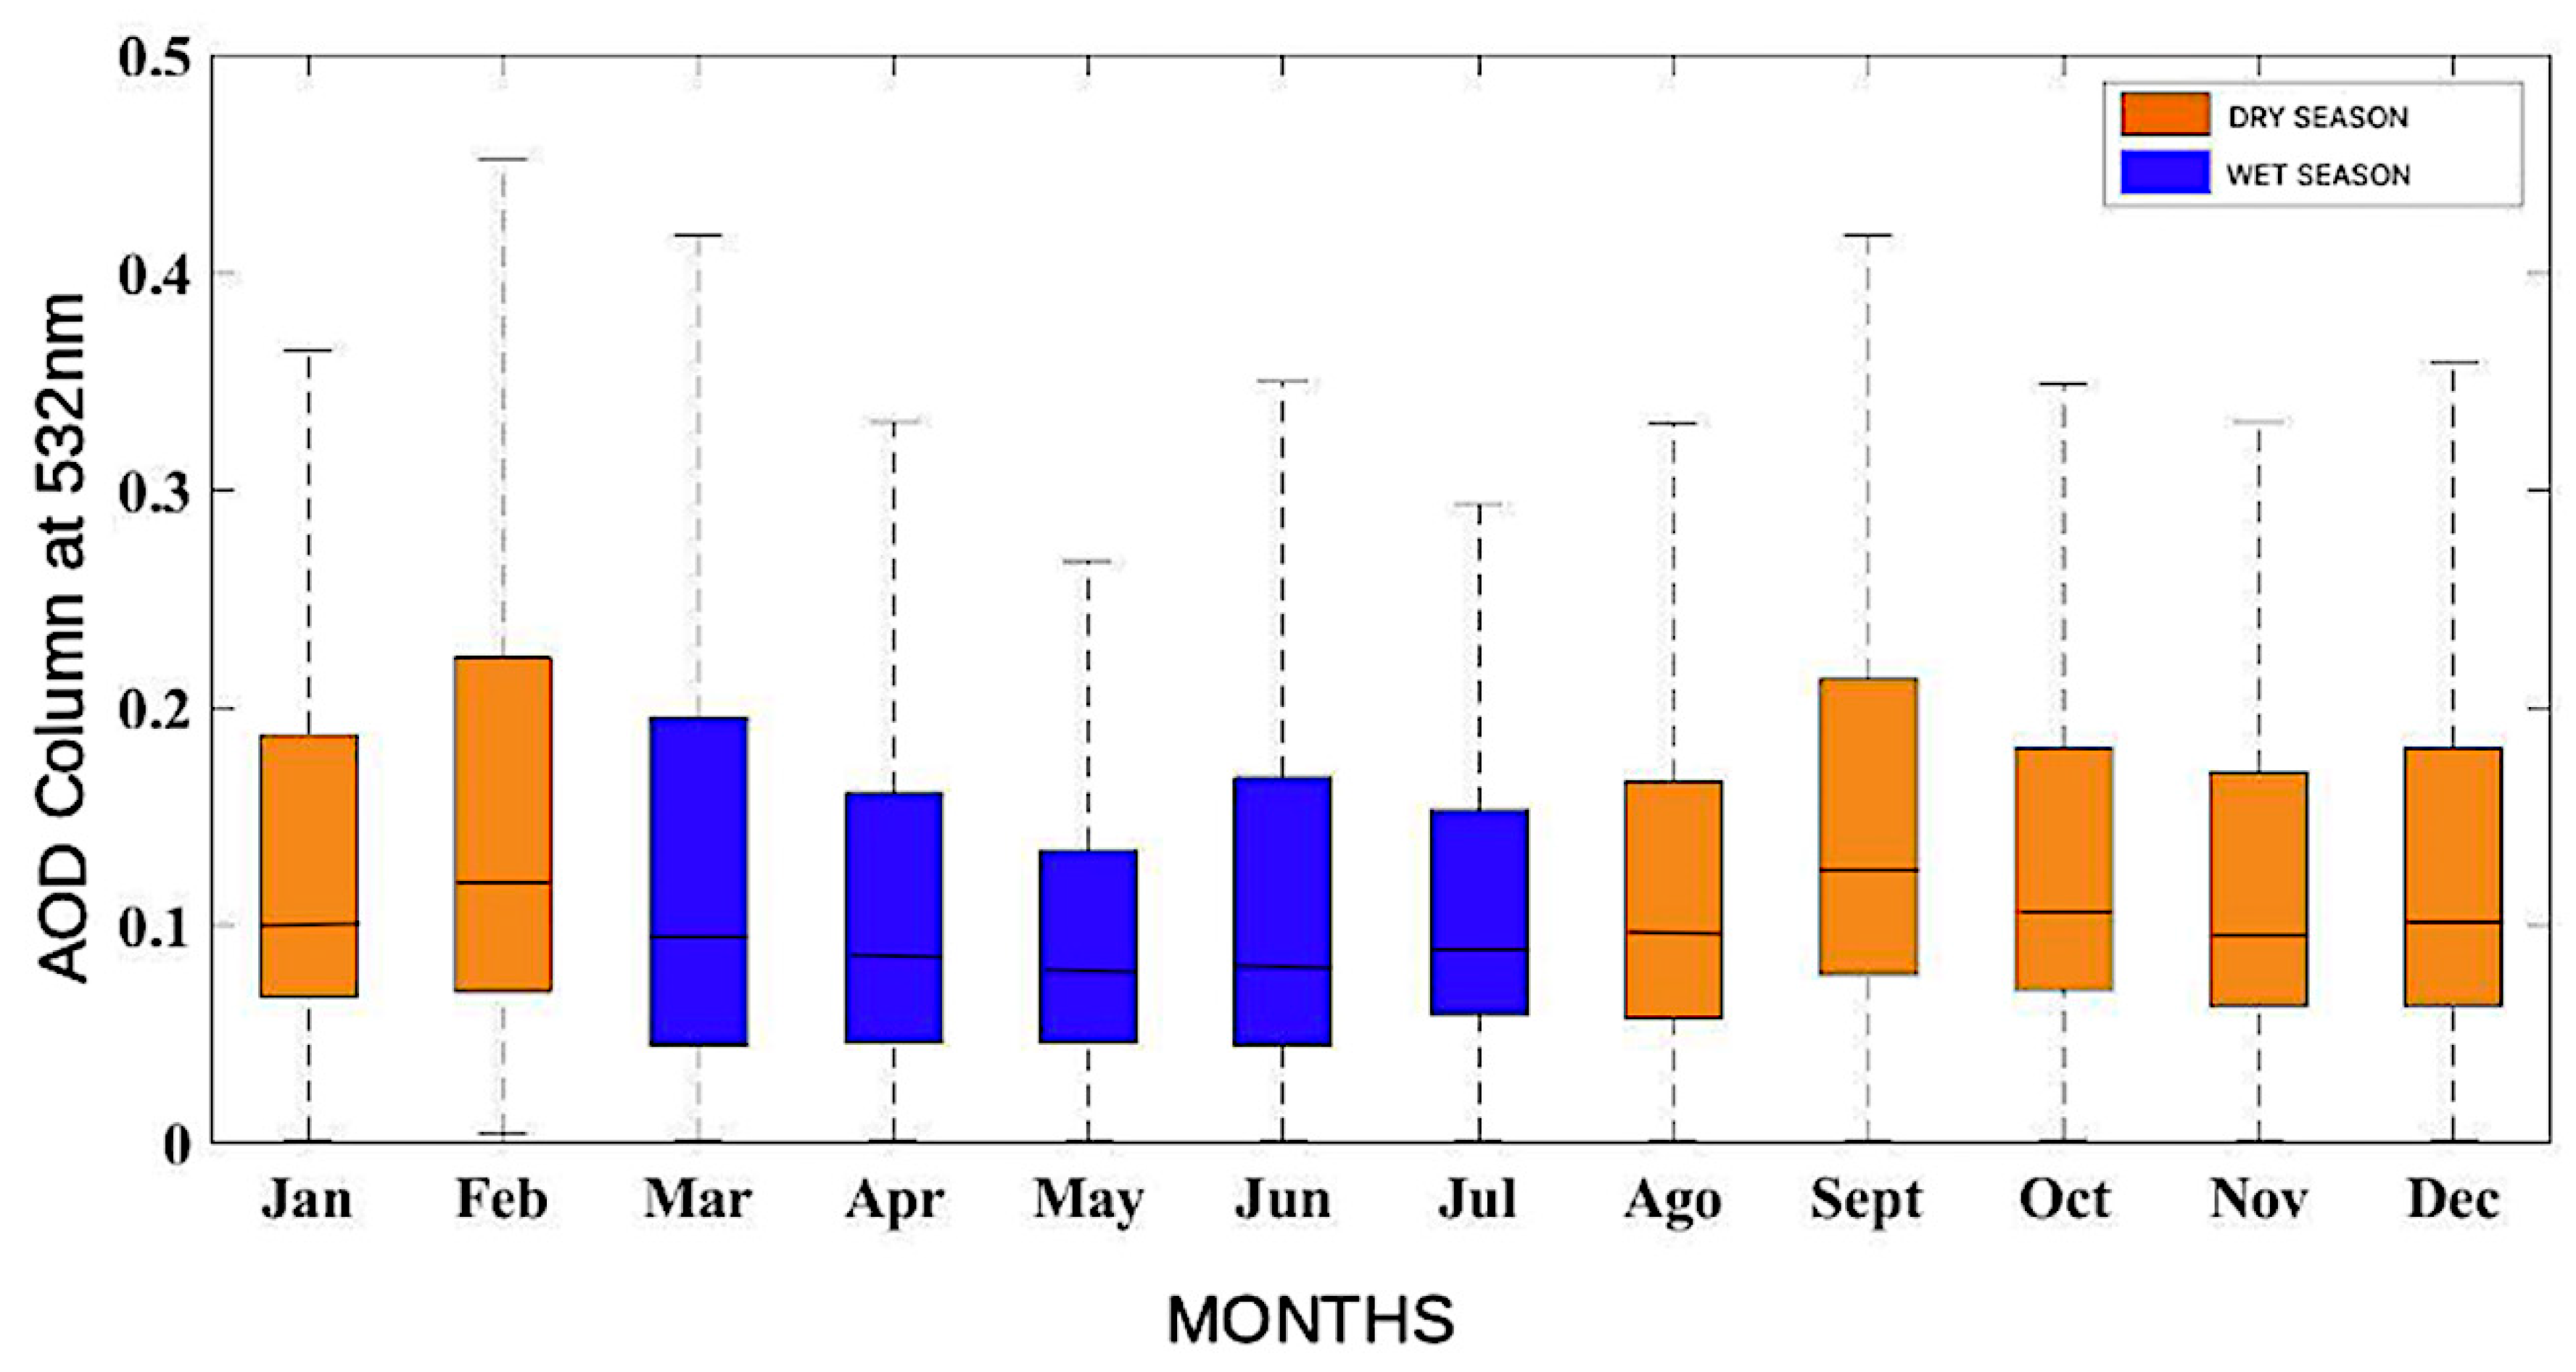
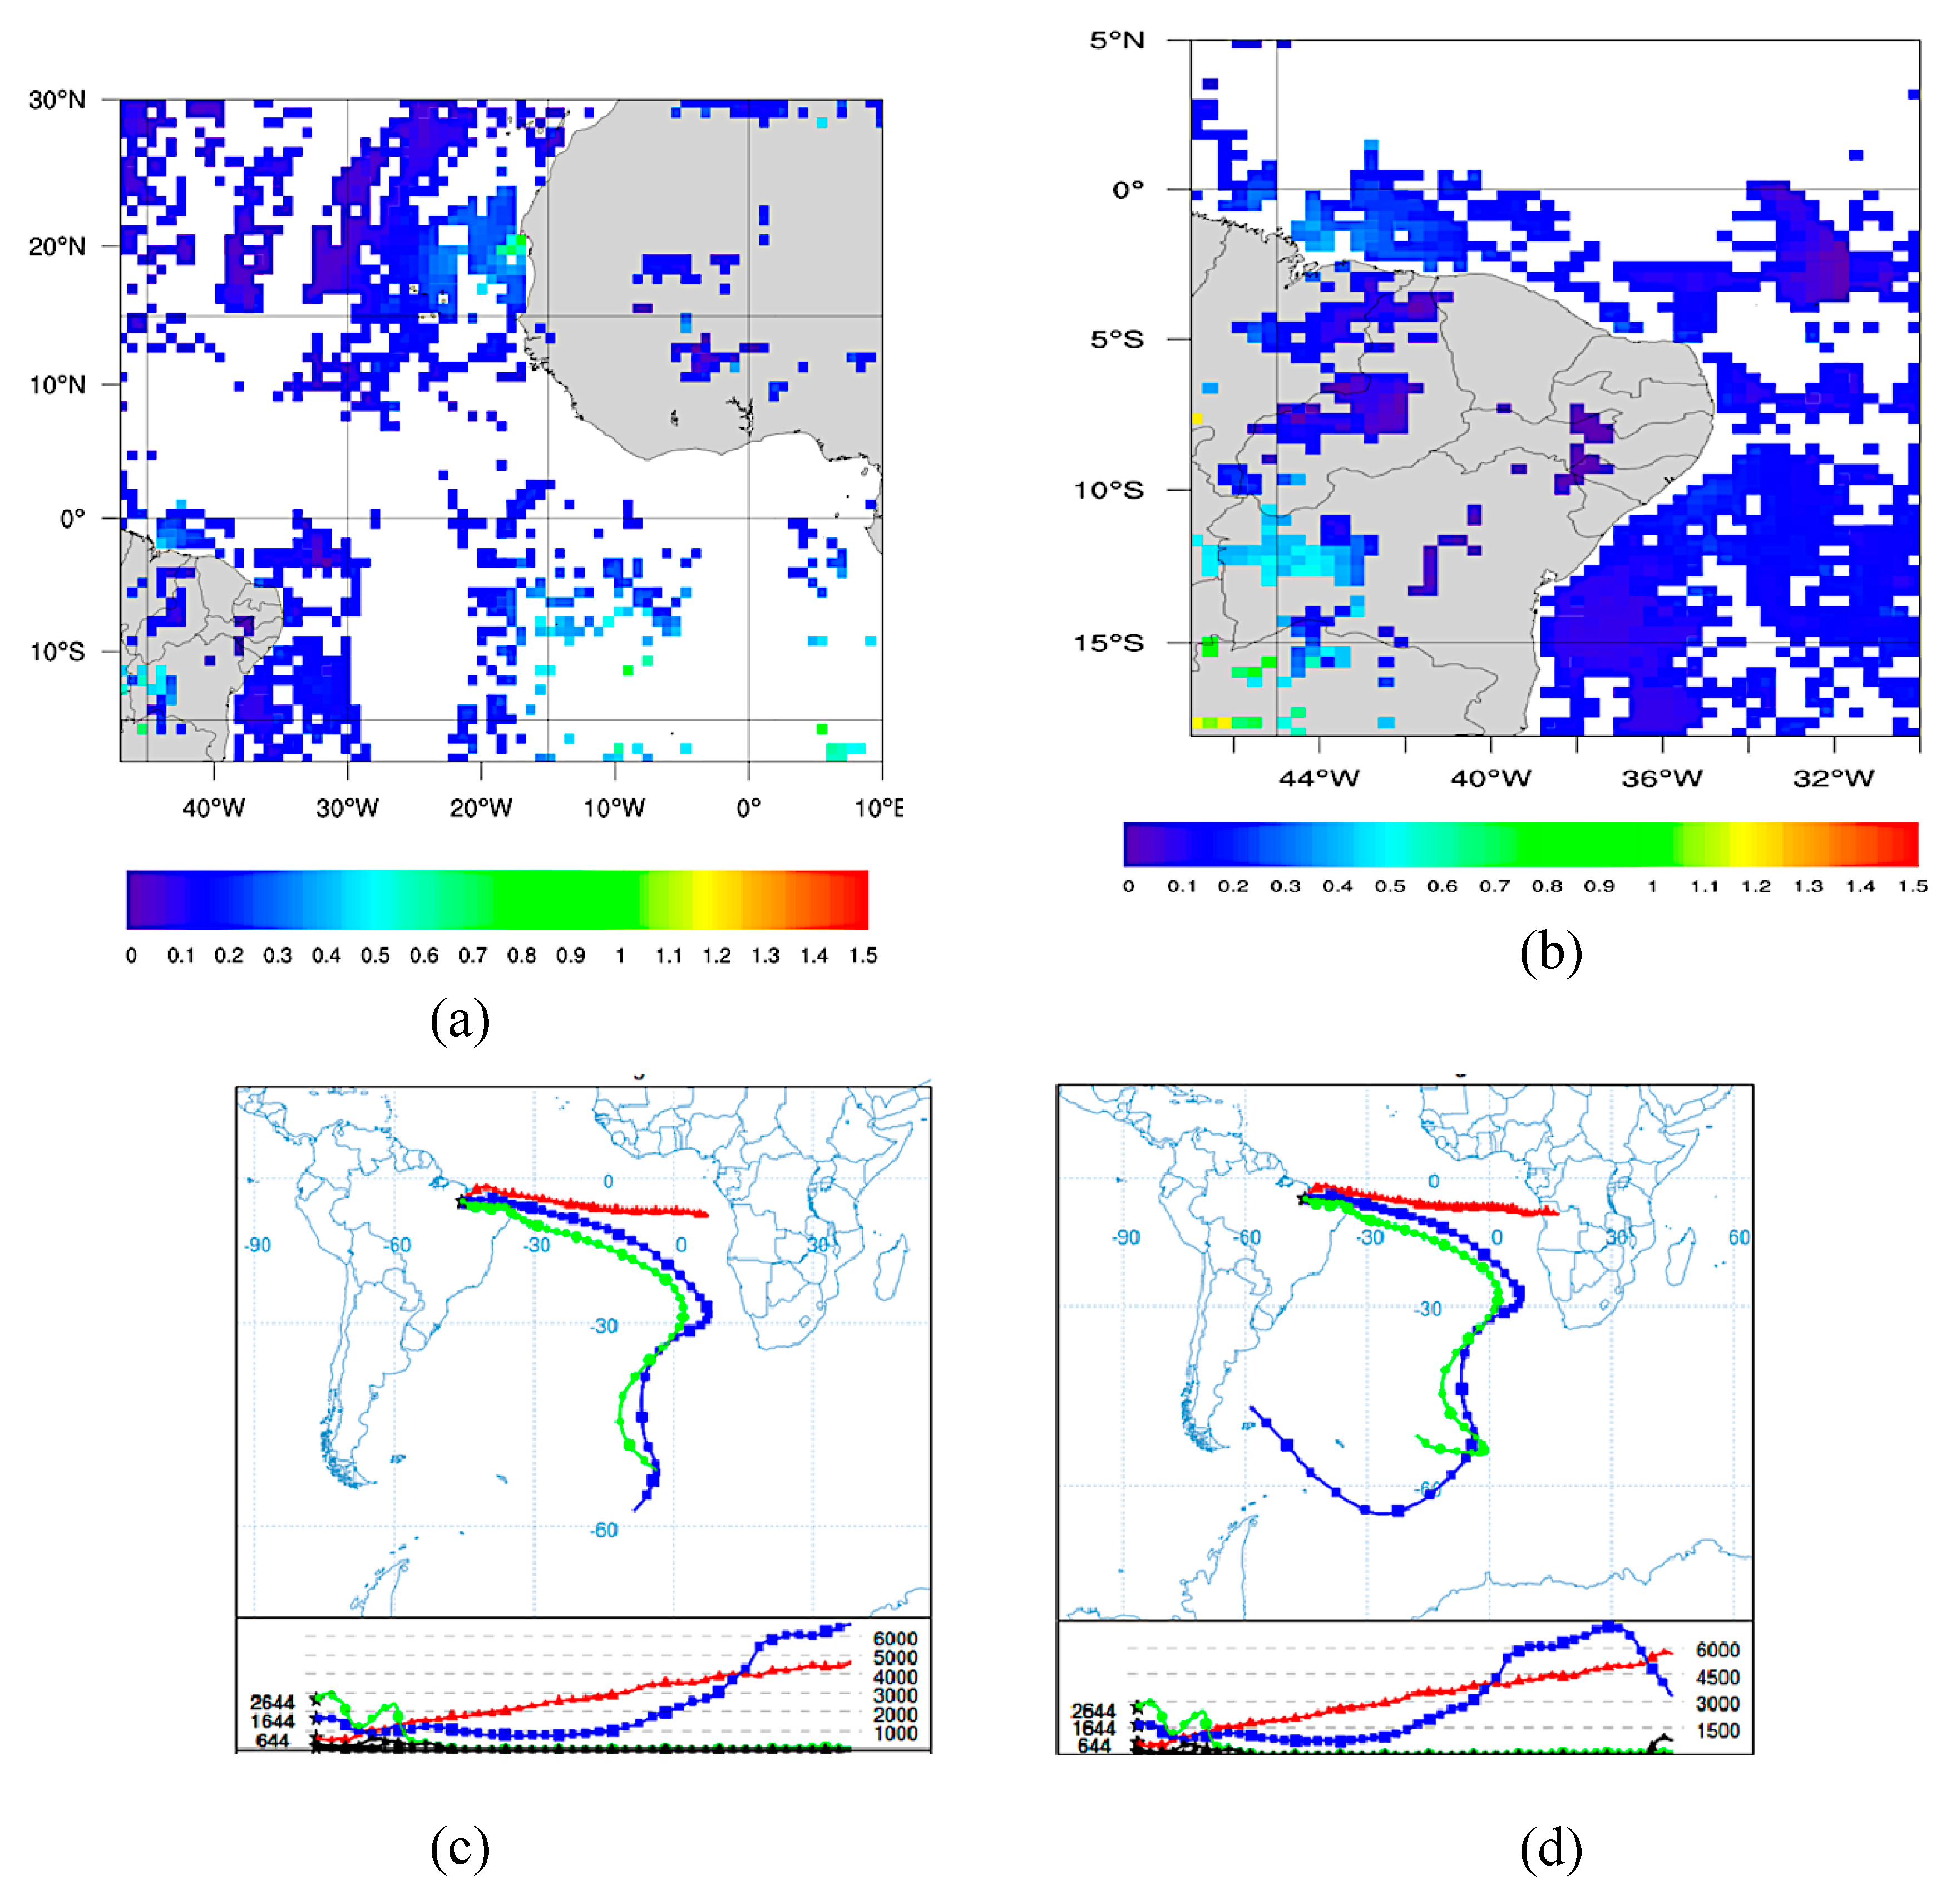
3.1. Aerosol Loading over Northeast Brazil

Figure 2 shows the daily averaged time series from both TERRA and AQUA MODIS Aerosol Optical Depth for each year of the ten-year period from 2005–2014. During the whole period the years with the most elevated AOD values were 2005, 2007, 2010 and 2012. All these years showed elevated values of AOD during some months, that are being referred to as typical periods in this paper (Figure 3). Figure 2 reveals that, visually, most of the AOD daily averages in NEB are characterized by low values, ranging from about 0.1–0.3, which indicates that NEB is a region with low amounts of atmospheric aerosols during most part of the year. Using all of the MODIS AOD dataset from 2005 to 2014, the mean AOD is calculated at 0.20, the lowest AOD found during this period was 0.04 and the maximum value that was reached was 0.52. The detection limit of MODIS is reported as 0.03–0.05 [56].
The low values are in accordance with [57], where the authors performed a characterization of AOD in all regions in the world, and indicated that South America, in general, has mostly low AOD values, except during the South American main biomass burning season (from July to October). The NEB is not affected by these emissions, due to the typical atmospheric circulation patterns. However, it is possible to observe two typical periods with an enhancement of AOD, during the first and second half of the years that is repeated during every year of the analyzed period. The first period or AOD season occurs from January to March and corresponds to the season when dust aerosols from the Saharan desert are more frequently advected to South America [56]. This indicates that some dust layers may be transported over NEB, enhancing AOD values. According to literature, during austral summer (December to April), the ITCZ is generally in its southernmost position [21]. This change of the circulation patterns is the main reason that aerosols are transported from Africa to South America [47]. The study by [19], with MODIS data from 2001 to 2003, revealed that during austral winter, a large fraction of smoke transported to the Americas is also composed by dust, resulting in AOD values of 0.3 in Cape Verde, in the middle of the Atlantic Ocean, half-way to South America. AOD values slightly reduce to 0.22 when reaching the coast of South America. [23] performed an analysis of long-range transported aerosols from Africa to the Amazon, based on LIDAR (Light Detection and Ranging) observations during February 2008, in which AOD values ranged from 0.1 to 0.4. The values found in that study, as well as the period of the years observed, are in accordance with the AOD values presented in our study.
The second AOD season was found during the second half of all analyzed years, from August to October. In September 2010, a day with a particularly high AOD peak was observed and is explored in a specific case study further on. This pattern can be explained by the fact that NEB has an extended coastal region, and during this time of the year, high intensity onshore winds, transport great amounts of sea spray [22]. Additionally, in the same period in southern hemispheric Africa, the biomass burning season occurs from June to October in that part of the continent, moving from the equator southwards with time and peaking in terms of emissions usually in September. During this period large amount of biomass burning and dust aerosols are emitted into the atmosphere and transported to other regions of the planet. Plenty of studies consider the long-range transported aerosols from Africa to South America, and how those enhance AOD in specific regions, such as in the Amazon. Some of these studies show that during the transport to the Caribbean and Amazon, some of the dust plumes pass over the NEB, but none of them specifically studied this region yet. [47] used LIDAR data and showed that some of the aerosols plumes from the African continent reached NEB, on 1 June 2016, in the coastal city of Natal. They observed a plume of pure dust, polluted dust and marine aerosols in the atmosphere of Natal that was originated from Africa. The plume was confirmed by CALIPSO images. [22] and [23], and more recently [58] and [59], show that aerosols emitted in southern hemispheric Africa, during the fire season from June to October, travels towards South America. The second peak with elevated AOD values, coincide with the months when this transport occurs, which can be one of the reasons for the atypically high values observed throughout the years. In addition, the results found in this paper agree with those found by [47].
Figure 3a–d represents the box plot analyses for four years of the analyzed period: 2005, 2007, 2010 and 2012. These years, among all, yielded the most elevated AOD values. The box plots deliver more detailed information on the variability of the dataset. They represent the data range between the quartile 1 (Q1–25%) and quartile 3 (Q3–75%). The first three months of the years, correspond to the so called “window of opportunity”—the typical period that occurs when desert dust from Africa is advected to the Americas [47] that, along with locally emitted aerosols (for instance: local sand/dust, urban pollution, marine and biomass-burning), is responsible for the enhancement of AOD in the NEB region. These are the months of the dry season in NEB, which can also lead to an enhancement of aerosol loading, due to precipitation and wind intensity decrease.
NEB is a region in Brazil with a unique biome called Caatinga, which is a type of wooded savanna vegetation consisting mainly of small, thorny trees that shed their leaves seasonally. The Caatinga occupies 10% of the Brazilian territory and is the main biome of the NEB states. The westernmost part of NEB is covered with another type of biome called Cerrado that occupies 20% of the Brazilian territory, has a similar vegetation as the Caatinga and both are called “Brazilian Savannas”. The Cerrado occupies the western part of the states of Maranhão, Bahia and Piauí. Mainly the Cerrado but also the Caatinga are characterized by exploitive use of the soil, such as cutting and burning agriculture [60] emitting considerable amounts of aerosols into the atmosphere every year, further enhancing the aerosol loading in NEB. According to the INPE/QUEIMADAS websit [14] that monitors biomass burning activity in Brazil, there are two main seasons when biomass burning activities increase within NEB. One is in January, when the highest biomass burning activities occurs in the region. And the second one occurs from July to October. These activities happen especially in the western part of NEB, mostly in the Cerrado, in the states of Maranhão, Bahia and Piauí. This pattern was observed during all years of the analyzed period. These fires are likely the main reasons for the higher AOD in the region. Even considering that the aerosols originating from Africa reach NEB and contribute to the enhancement of AOD (such as in September 2010), the probability is low that only intercontinental aerosols contribute significantly to the loading.

3.2. Analyses of the Cities Natal and Petrolina from 2007 to 2016

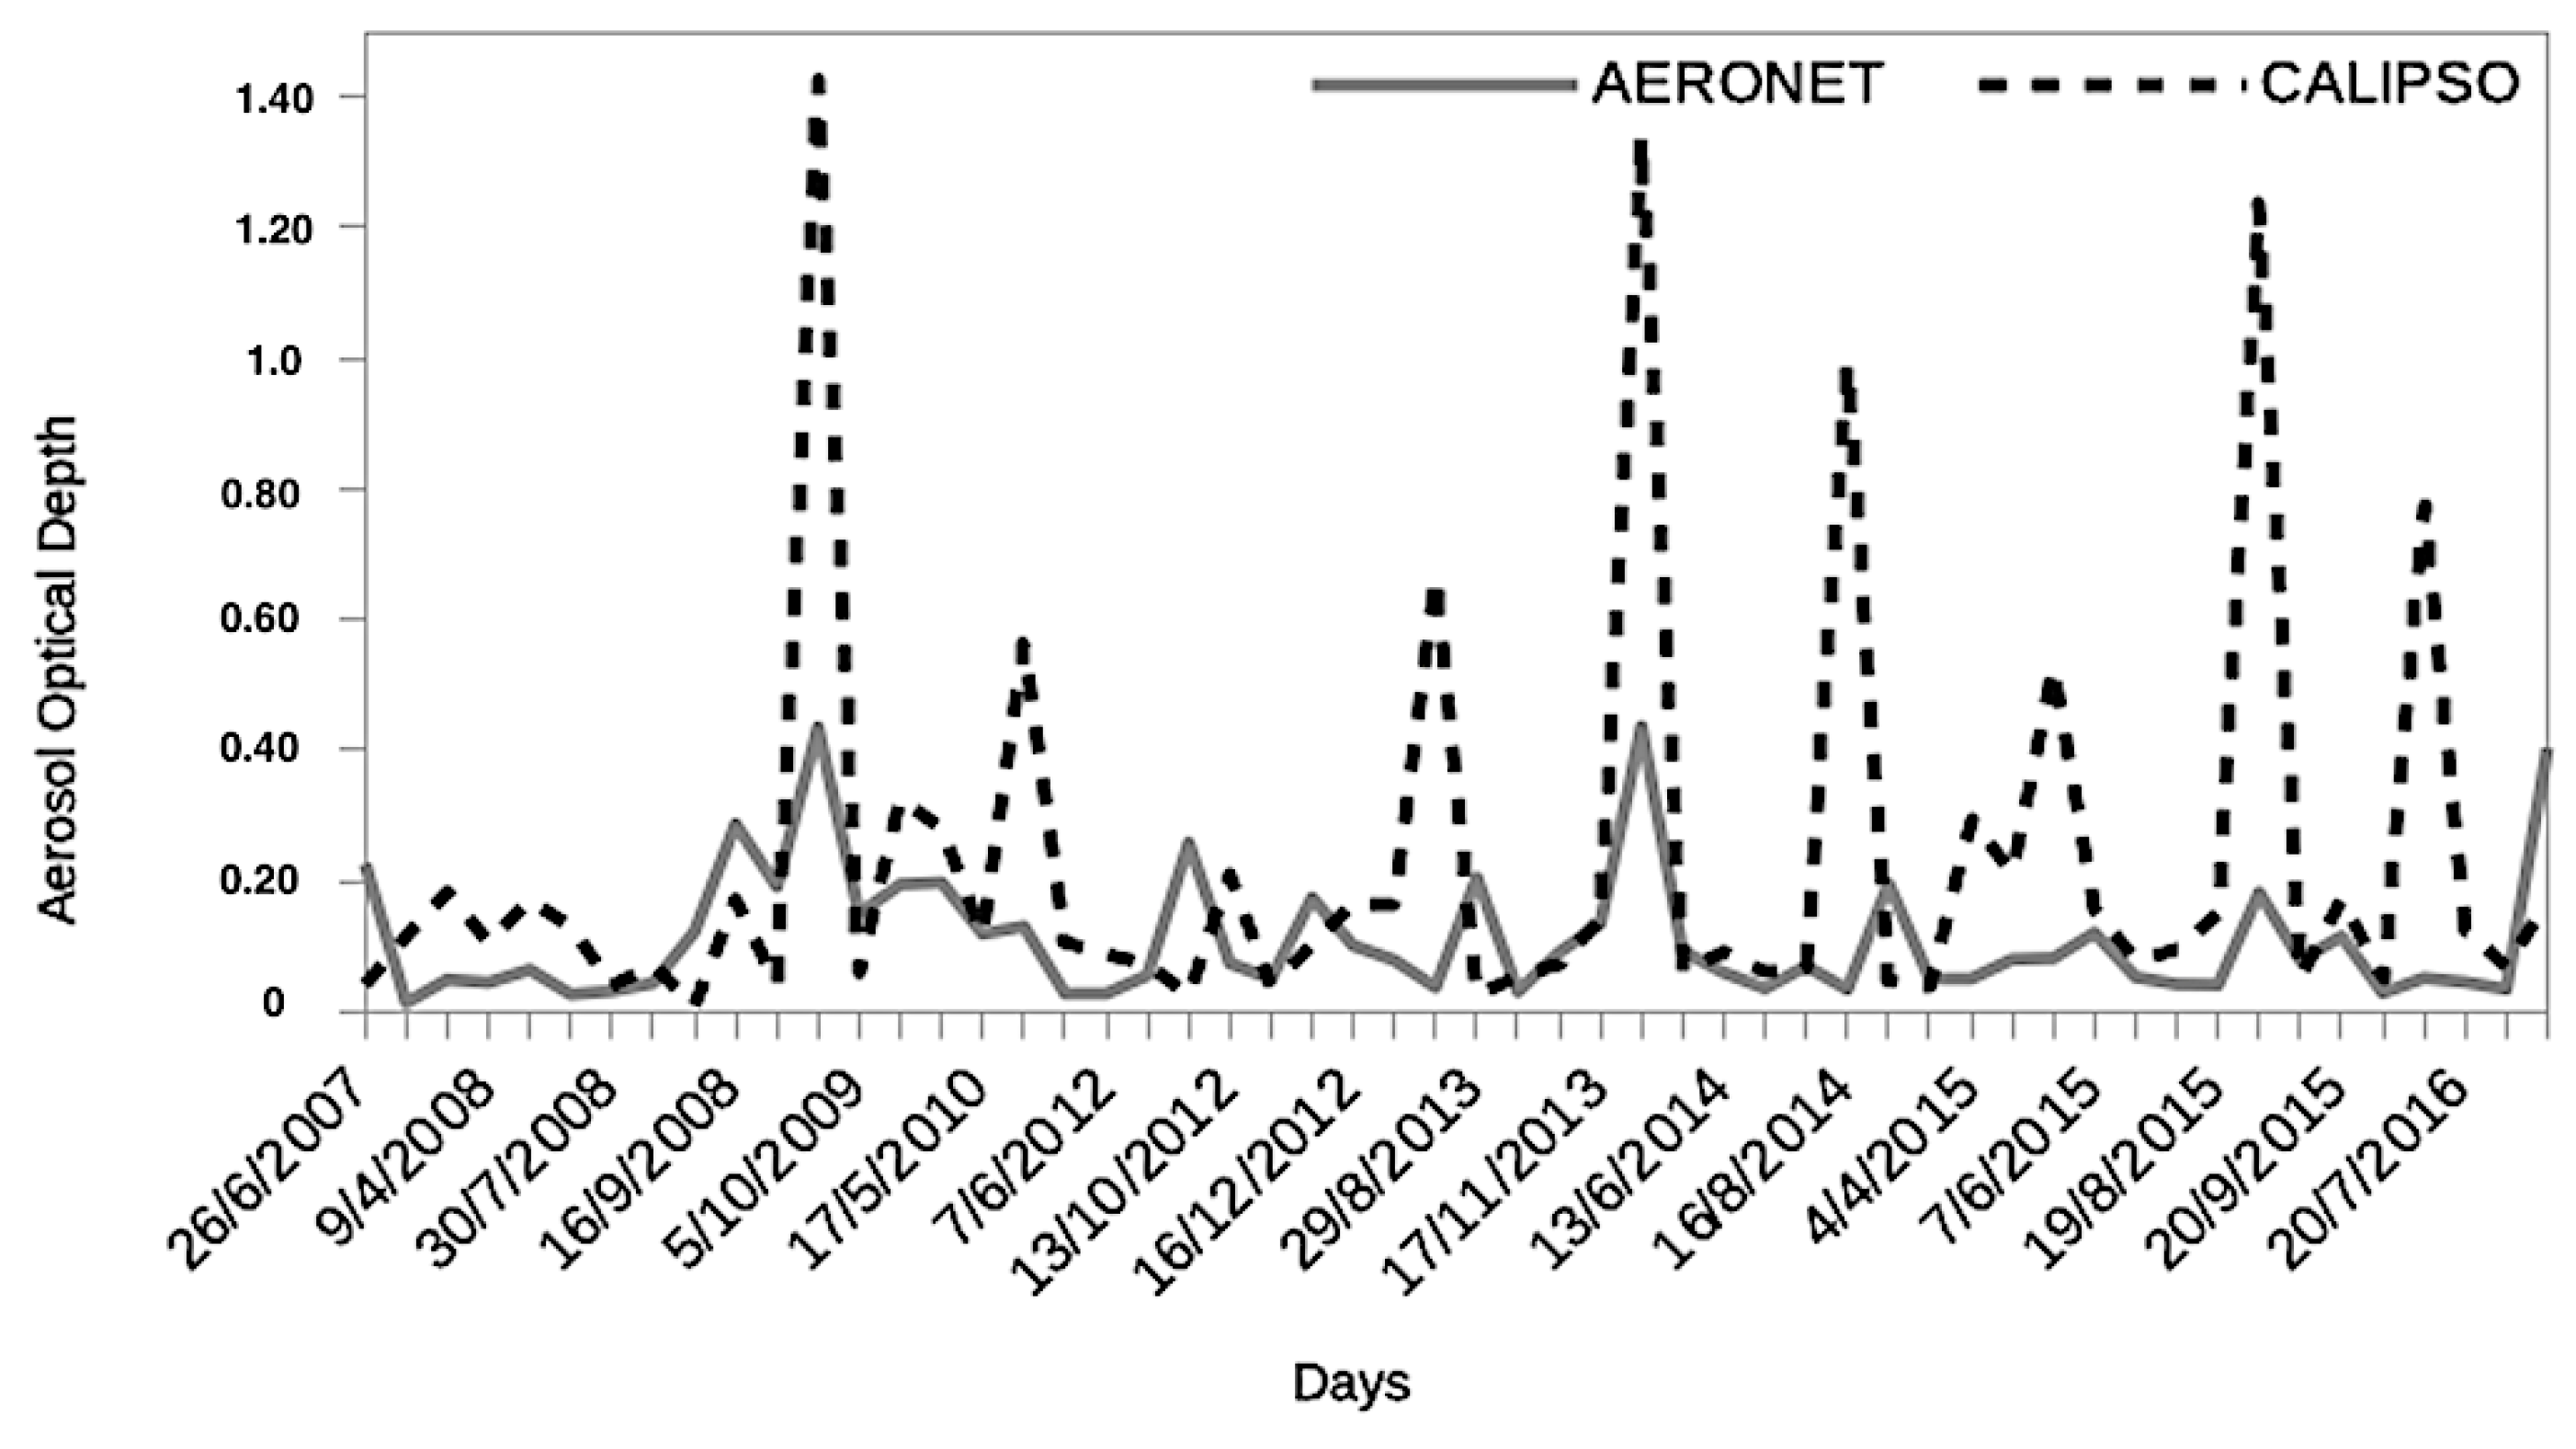
3.2.1. CALIPSO, MODIS, and AERONET AOD Time Series Analysis in Natal-RN

Figure 4 presents the time series of the monthly average AOD from CALIOP/CALIPSO for the period from 2007 to 2016, in the city of Natal. In total, the mean AOD of the original complete time series is 0.09, ranging from 0.02 to 0.96. The detection limit of CALIOP is reported as 0.02–0.04 [56].
In the figure, it is possible to observe that Natal exhibits low aerosol loading, during all the years, with monthly mean values between 0.08 and 0.10 during most of the months. Differently from the whole NEB (Figure 2), it is possible to observe a slight enhancement of the AOD from March to July in Natal, especially in the years of 2007, 2008 and 2010. One fact that might explain the enhancement during this period is the transport of dust aerosols from the Saharan desert that sometimes may also happen occasionally outside the “window of opportunity” which usually occurs from December through February as shown by [47]. Those latter typical seasons are enabled by the southern shift of the ITCZ. By this shift, the region is under the influence of circulation patterns that are similar as those observed in the Caribbean [47], enhancing the precipitation over NEB. The DUSTER/Lidar was installed in Natal in 2016 to further investigate the impact of this phenomenon on the NEB.
The highest monthly mean AOD from CALIPSO observed during the analyzed period was 0.16 and occurred in June 2008. The monthly average variation of CALIPSO AOD at 532 nm represented by box plot analysis can be found in Figure 5, for the whole period from 2007 to 2016 of CALIPSO data, correlated with the dry (August to February) and wet (March to July) season in Natal, represented by the orange and blue boxes, respectively. It is possible to observe that in Natal the behavior of the AOD is similar to the data in the whole NEB region, as shown in Figure 3. In general, the AOD around the city is considered low, with medians (Q2) ranging from 0.08 to 0.13, according to CALIPSO data. Natal is a coastal city, with high intensity onshore trade winds during most of the year that are responsible for advection of aerosols towards the inner part of the state. This meteorological pattern might be responsible for the low aerosol loading observed by CALIPSO, despite the metropolitan area of Natal with all kind of urban emissions, apart from natural emissions by surrounding sand dunes and the sea breeze. We considered CALIPSO data in a radius of 120 km centered in the city of Natal, leading to consideration of measurements far outside the metropolitan area of Natal, including the ocean. However, the number of overpasses within this radius is low, about at maximum 8 per month, apart from frequent cloud contamination due to the abundance of low cumulus clouds, especially close to the coast.
During the wet season, the AOD median ranged from 0.20 to 0.50, with its maximum of 0.42 in March (represented by the upper flag in Figure 5). In the months of the dry season, the monthly variation of AOD ranged from 0.08 to 0.50, with the maximum monthly mean of 0.46 (February). The minimum values are very similar, very close to 0.02 for all months of the period, represented by the bottom flag. The third quartile (Q3) also corroborates the slight enhancement of AOD during the dry season, compared to the wet season. Comparing CALIPSO with MODIS (Figure 3), it is possible to observe the same feature, in terms of AOD variability throughout each year. Both satellite products show that during the wet season, there is a decline of AOD, for the whole NEB region including Natal. This inter-comparison is important as it shows that although the satellites use different measurements techniques and wavelengths, the patterns observed by both methods are consistent.

3.2.2. CALIPSO and AERONET AOD Time Series Analysis in Petrolina-PE

Figure 6 represents the AOD time series of AERONET and CALIPSO for terms of comparison for the city of Petrolina, from 2007 to 2016. The Wilcoxon non-parametric statistical test was used to analyze these time series. By this test a significance level of 5%, a statistical difference between AERONET and CALIPSO was evidenced. AOD from CALIPSO showed an average of 0.24 ± 0.03 while AERONET AOD yielded a lower average of 0.11 ± 0.01 (0.01 is the detection range of AERONET data [56]). The significantly higher values observed by CALIPSO, occurred during the same months as those observed by MODIS during the months of May, August, September and October 2014. The difference between both datasets is clear: While CALIPSO shows AOD values near 1.4, in some cases, the maximum values detected by AERONET are around 0.4. The difference between the data might be explained by the fact that the satellite footprint from CALIPSO captures more information about aerosols than the sun photometer. Therefore, we assume that the estimates of AERONET are missing out part of the aerosols, while CALIPSO takes into consideration all the information regarding aerosols in the total atmospheric column, following [52]. Such as in Natal, CALIPSO AOD was taken into account with a radius of 120 km around Petrolina. Therefore, differences might in addition be correlated with the large spatial variability of the aerosols within the boundary layer [60,61].
The scatter plot between AOD and AE at 532 nm, of the AERONET data in Petrolina is shown in Figure 7. Data from AERONET were interpolated from 500 nm to 532 nm, to be able to directly compare the sun photometer results and the data derived from CALIPSO at the same wavelength. It is possible to observe that most of the AOD values range between 0.01 and 0.32, and AE between 0.0 and 1.6. This indicates that the main aerosol type in Petrolina’s atmosphere is characterized as marine (AOD < 0.15 and AE < 0.60). Although Petrolina is a city far from the coast, the wind configuration in NEB is responsible for the advection of marine aerosols and gases towards the inner part of the state. Mixtures of dust and pollution with AOD between 0.06 and 0.55 and AE from 0.06 to 0.85, pure smoke (AOD ≤ 1.10 and AE > 1.50) and pure dust (AOD > 0.40 and AE < 0.50) were found, according to the classification shown in Table 1. Those events are featured by a very turbid atmosphere, resulting in low AE owing to the extinction by the larger dust particles [43]. The same pattern was observed in the entire NEB.
The AERONET site in Petrolina is located at a rural area outside the city, near the border of the state of Bahia, which is one of the most industrialized states in NEB, with many automobile factories, oil refineries, amongst others. Those industries emit plenty of aerosols into the atmosphere, and along with the predominant meteorological systems in the region plenty of the emissions are transported to Petrolina, enhancing the aerosol loading at the AERONET site. Also, local agricultural activities may be responsible for the dust suspension which enhances the aerosol loading over the region [50]. Consequently, plenty of the detected dust events are influenced by local processes in Pernambuco, since it is a semi-arid region and is also impacted by the state’s industries. Additionally, local biomass burning emissions may impact the atmospheric aerosol loading.

3.3. Case Studies

Three days with interesting data aspects were chosen for three case studies (CS-1, CS-2, and CS-3) to achieve a deeper insight into the regionally occurring processes. For this purpose, three days were chosen to identify the responsible aerosol source region and -attribution. Case study CS-1 investigates long-range transport across the Atlantic over the NEB in general, based on MODIS data on 27 September 2010 (Section 3.3.1.). Case study CS-2 investigates, on 6 December 2016, how the aerosol backscatter profiles of the ground-based DUSTER/Lidar in Natal/RN and CALIOP/CALIPSO compare (Section 3.3.2). Finally, case study CS-3 focuses on the city of Petrolina, comparing AERONET and CALIOP/CALIPSO AOD on 1 November 2007 (Section 3.3.3).

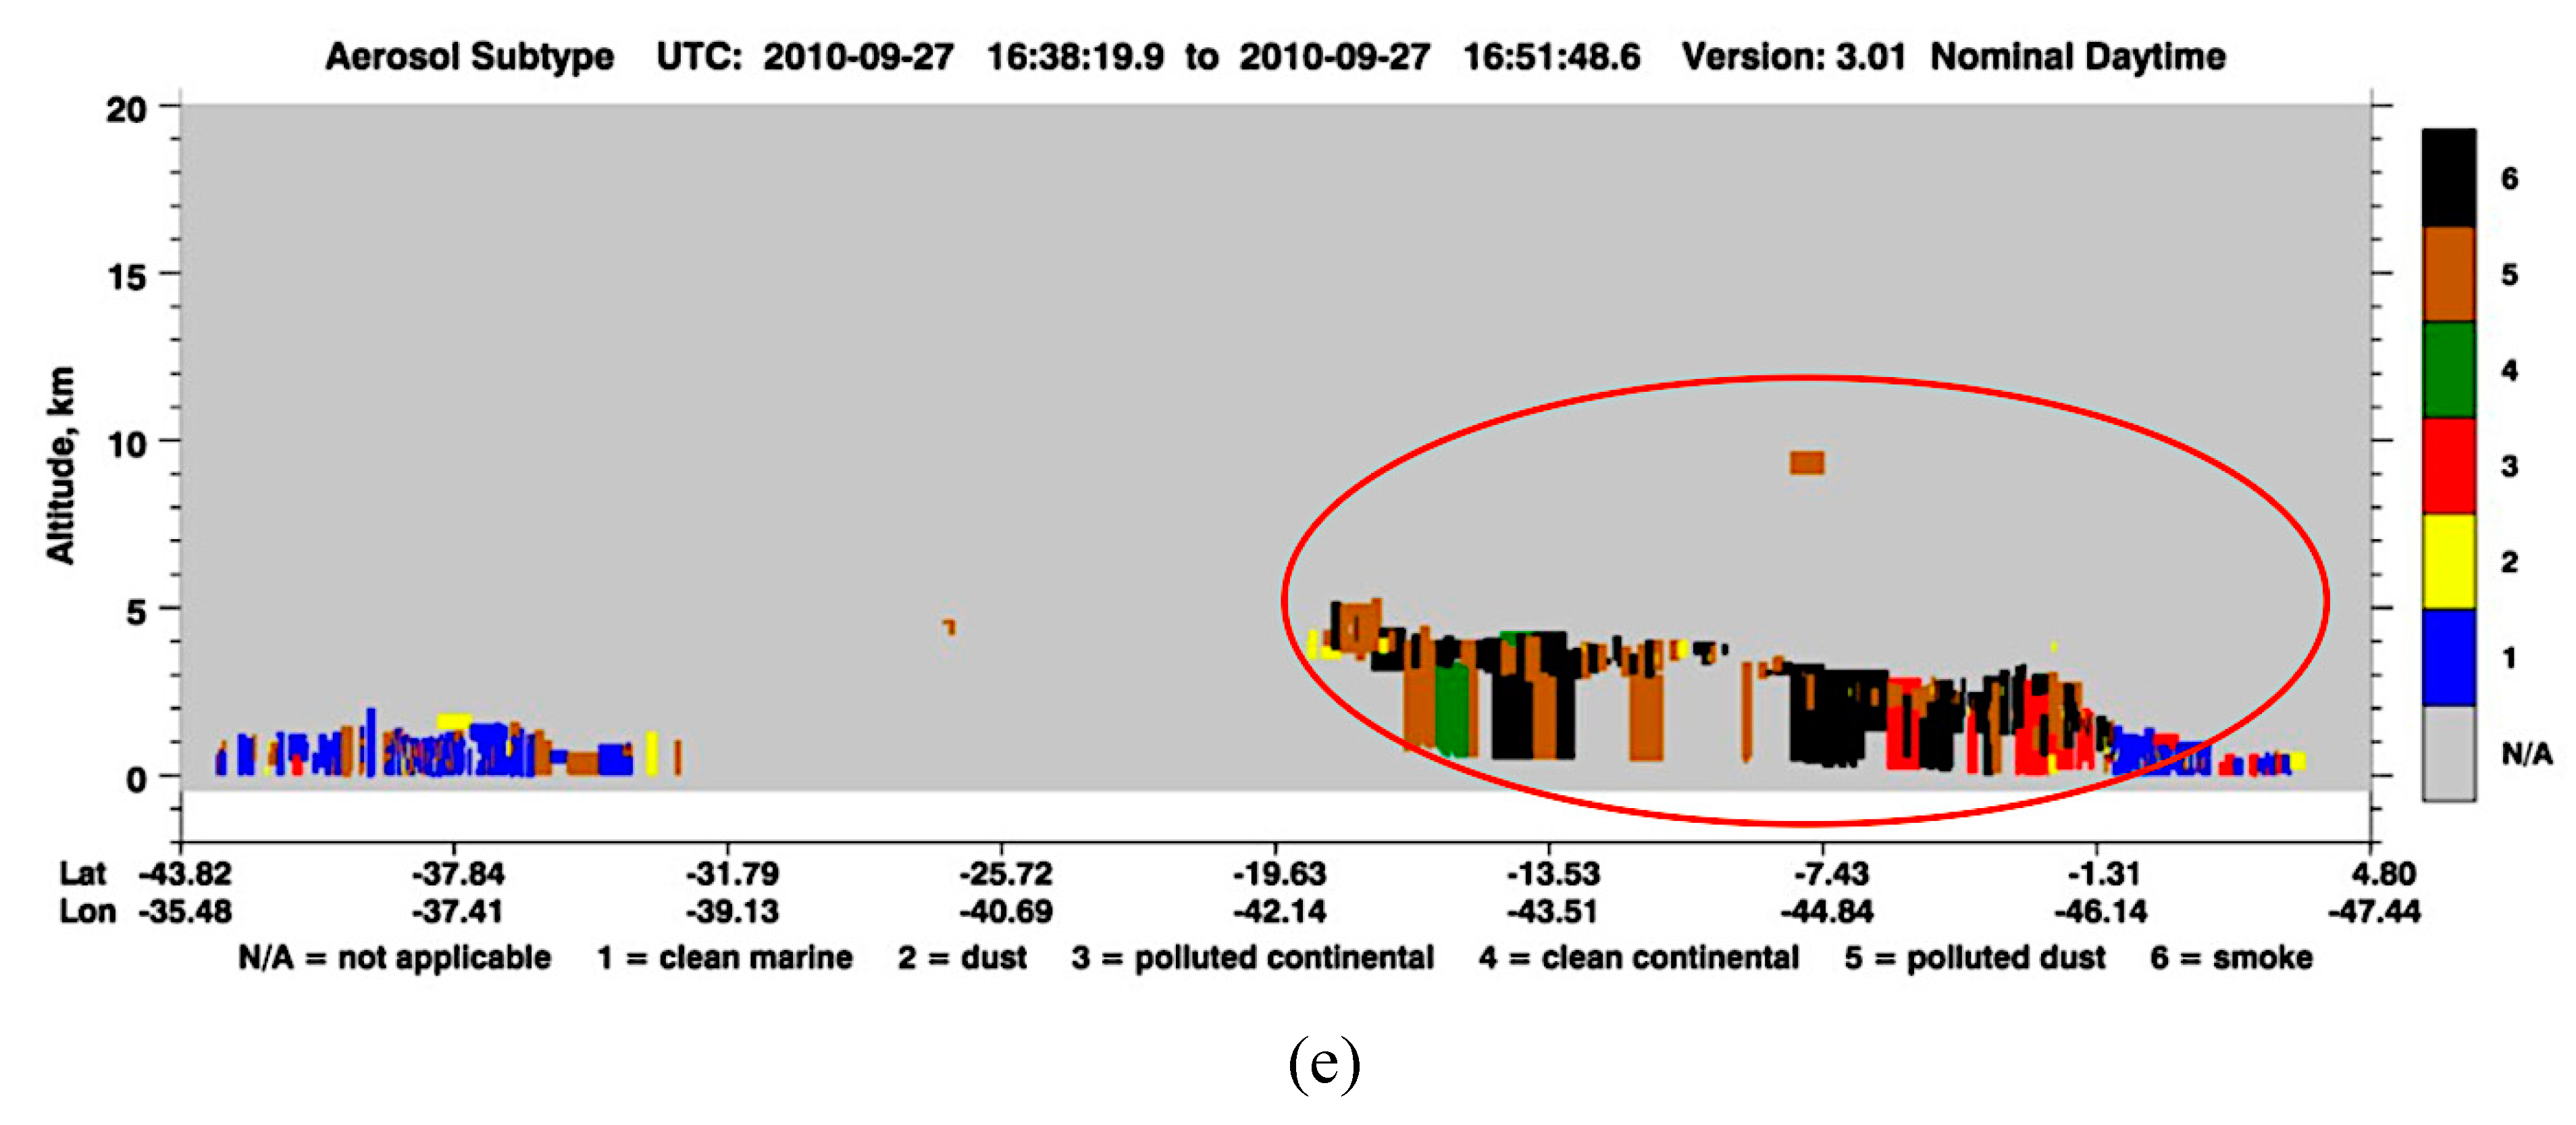
3.3.1. CS-1: Long-range Transport of Saharan Dust over Northeast Brazil

Over the whole NEB region, the day 27 September 2010 was selected for the first case study CS-1 using AOD from MODIS/TERRA and AQUA and CALIOP/CALIPSO data. The results of this case study are shown in Figure 8a–e. It is possible to see an elevated aerosol plume in the MODIS AOD product. In Figure 8a it is possible to observe the aerosol plume crossing the northern part of the Atlantic towards Central America. Although this first plume does not reach the NEB, it is possible to observe a second plume in the southwestern part of the region (around 10E and 17W) with high AOD, ranging from 0.45 to 0.75. By the time this plume reaches the coast of Brazil, AOD has reduced to 0.20 by atmospheric cleaning processes. In Figure 8b, that includes the NEB, it is possible to observe AOD ranging from 0.01 to 0.30, in most of the region. One of the features that we observe in this study is that the MODIS AOD product has a low amount of AOD pixels over land in the region, especially in locations with low AOD values. Also, the global algorithm that detects AOD over land, in some continental areas of the world, is not suitable for regions with low aerosol loading, which was visible in all observed cases [32,33]. Close to the boundary of the domain, in the state of Maranhão (between −10S and 5S), it is possible to observe a pixel with AOD of 1.2, as could be seen in Figure 2. This is the only pixel with such an elevated AOD value in the whole area, therefore we can affirm that the enhancement occurred due to locally emitted aerosols. The area in its vicinity is characterized by arid soil, and Caatinga biome, with frequent biomass burning activities that might be the reason for the local AOD enhancement. Regardless of the high AOD found in Figure 8a, we cannot exclude the fact that some of the aerosols present in NEB are due to long-range transported aerosols, that may aid increasing the aerosol loading in the region. To further investigate this, we performed three simulations with the HYSPLIT model (Hybrid Single-Particle Lagrangian Integrated Trajectory model) [62,63] considering backward trajectories of 10 and 12 days, all ending on 30 September 2010. We considered three height levels, 500 m (red line), 1500 m (blue line) and 2500 m (green line) in the simulations. The 500 m backward trajectory, shows that the aerosols originated from the ocean and reached the south American continent in the NEB after five days (not shown), suggesting that the particles found in Figure 8b, are also advected from the ocean. Possibly, due to deposition processes, not all the particles reach the interior of NEB, but those that do, will influence the AOD in the region.
CALIPSO aerosol classification was used to identify the aerosol types present in NEB during the study. The aerosol subtypes include dust, biomass burning, clean continental, polluted continental, marine and polluted dust. Figure 8d shows a CALIPSO aerosol subtype image for 27 September 2010, in which it is possible to observe in the orange circle, the presence of all 6 aerosol types within the first 5 km of the atmosphere. According to the figure, the predominant aerosol type is polluted dust. It is also possible to observe a small fraction of clean continental aerosols, clean marine and polluted continental and a very small fraction of pure dust. In the area close to the highest AOD pixel, mentioned before the CALIPSO aerosol subtypes were identified mostly as smoke, polluted continental and polluted dust. The identified aerosol types by CALIPSO corroborate that aerosols from biomass burning were most likely responsible for the enhancement of the AOD in the region.

3.3.2. Second Case Study (CS-2) over Natal/RN

The second case study (CS-2) refers to the city of Natal. DUSTER/LIDAR data are collected and processed to observe the backscatter profiles in Natal since 2016. For case study CS-2 these profiles were compared to level 1 data from CALIPSO on 6 December 2016, with 81 km distance between the satellite footprint and the DUSTER.
Figure 9 corresponds to the DUSTER and its backscatter profiles at 335nm (a), 532nm (b) and 1064nm (c). It shows the aerosol layer detected by DUSTER (yellow/green in Figure 9a, white in Figure 9b, and located between 1–3 km height in accordance with the same observation by CALIPSO (Figure 9d—the red circle represents the region of Rio Grande do Norte), represented by yellow/red plumes at the same altitude. A challenge of measurements in the Natal atmosphere is the frequent presence of low clouds, as shown by the white lines between 1–2 km altitude. The presence of such clouds is common in the region and might be responsible for enhancing the AOD detected by the satellite as well as interfering with the DUSTER signal. Figure 9e shows Figure 9e shows the backward trajectories calculated by the HYSPLIT model which are based on reanalysis data from the Global Data Assimilation System (GDAS). From the simulations it is possible to observe transport of air masses from west Africa between 2–3 km altitude, which were responsible for the presence of the dust aerosols in the atmosphere of Natal. It is also possible to observe an unusually high dust aerosol layer in 15 km height, as shown by the CALIPSO aerosol subtype classification (Figure 9f). The air masses observed in 15 km height, detected by CALIPSO originated from the northern part of Brazil according to HYSPLIT, and correspond to inter-seasonal air masses associated to transport patterns related to the South Atlantic Convergence Zone [47].

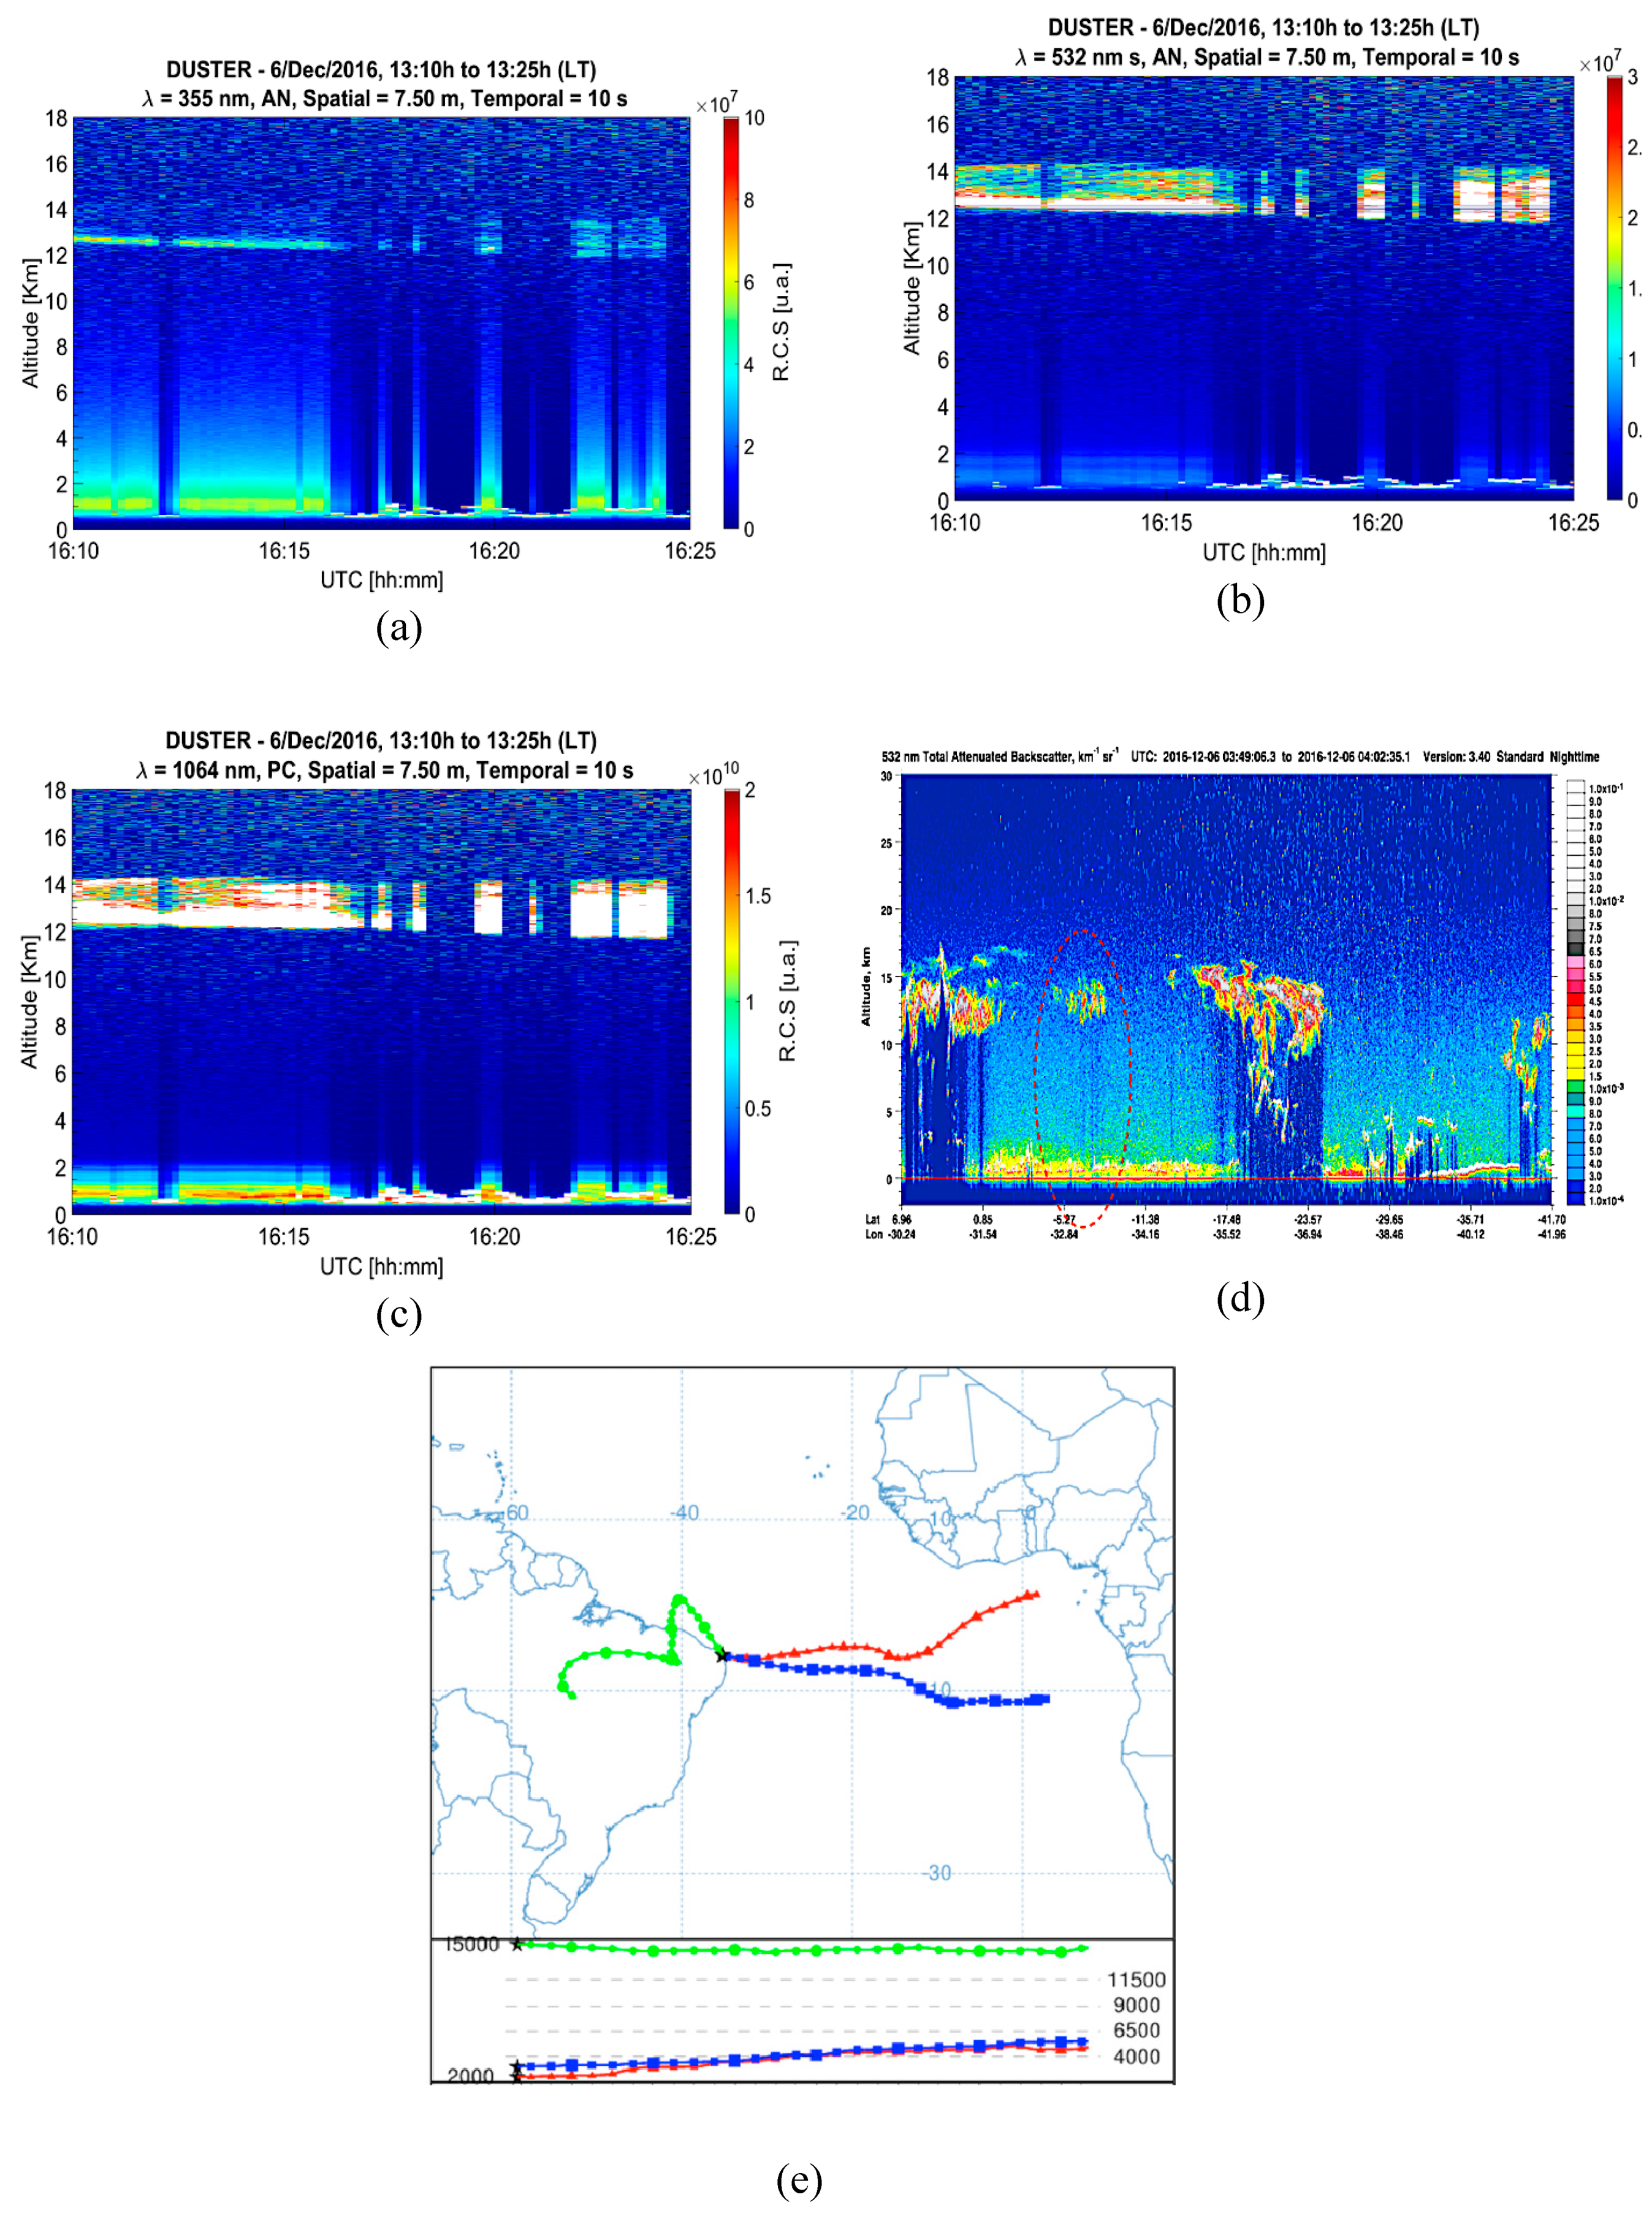
3.3.3. Third Case Study (CS-3) over Petrolina

The third case study focuses on November 1, 2007, where the satellite overpass at Petrolina (with a surface projection distance of 48 km) coincided with the measurements of the sun photometer. On this day, the sun photometer presented an AOD of 0.12 and AE of 0.93 that, combined with the attenuated backscatter integrated coefficient, indicated the presence of dust aerosols in Petrolina at about 1–3 km height. Those aerosols can be seen by the backscatter profile at 532 nm from CALIPSO, within the red circle (Figure 10a). The attenuated backscatter coefficient from CALIPSO shows, by its aerosol subtype, the presence of a dust layer (highlighted by the red mark), among marine and polluted aerosols in Petrolina (Figure 10b). The AERONET/PETROLINA site is located at a rural area, where the main production is from the agricultural sector. Thus, it is possible that the identified dust aerosols are locally emitted. The HYSPLIT backward trajectories (Figure 10c) show that air masses originate from the Atlantic Ocean and advect aerosols from Africa to Petrolina.

4. Conclusions

This study comprises a combination of different remote sensing aerosol databases and analyses to contribute to our understanding of the occurrences, types, and behavior of aerosols over Northeast Brazil (NEB). In general, it is possible to conclude primarily from the analysis of the 10-year MODIS dataset (2005–2014) over NEB that the region has a general feature of low aerosol loading during all the years, with MODIS daily mean AOD of 0.20, ranging from 0.04 to 0.52, with most peaks around 0.3 and much less above this value. The different AOD products are consistent and show the same behavior. However, the inter-comparison of AOD from AERONET and CALIOP/CALIPSO data in Petrolina show that the AOD measured by the AERONET sun-photometer was systematically about 60% lower than the AOD derived from CALIOP/CALIPSO retrievals. We assume that the estimates of AERONET are missing out part of the aerosols, while CALIPSO takes into consideration all the information regarding aerosols in the total atmospheric column, following [52].
During all the period of MODIS AOD data we observed two well defined regular seasons, with a light AOD enhancement. One of these periods generally occurs early in the year, from January to March, while the second one occurs in the second half, from August to October. During the first AOD season most particles originate from the Sahara and are advected towards South and Central America, due to the southward shift of the Inter-Tropical Convergence Zone (ITCZ).
Another fact that explains the AOD increase are certainly activities in the region related to biomass burning, semi-artisanal ceramics production and sugar cane burning activities. These activities occur predominantly in, but are not restricted to, the states of Maranhão, Piauí and Bahia. A similar situation occurs in the second elevated AOD duration. During that time, there are intensive biomass burning activities taking place in southern hemispheric Africa during the dry season. Meteorological systems, such as the west African monsoon circulation, low level jets and the eastern African jets, are responsible for aerosol transport towards the Americas, including the NEB region, as could be seen in the case studies.
In all the presented case studies (CS-1, CS-2 and CS-3), it was possible to observe that long-range transported aerosols contribute regularly to the aerosol patterns in the region. We analyzed data from three distinct measurement techniques, which all showed the same behavior. The MODIS case study (CS-1) showed that an increase of AOD values occurred due to a locally emitted event in the state of Maranhão. However, it also showed, by means of the backwards trajectories and the CALIPSO subtype, that aerosols originated from southern hemispheric Africa. The second case study (CS-2) using data from the DUSTER/Lidar located in Natal, indicated the presence of a dust layer in 15 km altitude, transported from southern hemispheric Africa, which was also confirmed by the HYSPLIT backwards trajectories. The AERONET/CALIPSO case study (CS-3) showed that the values observed by the Petrolina site, characterized the aerosols on 1 November 2007 as dust, which was also confirmed by the trajectories and aerosol subtype classification. All the case studies presented a low aerosol loading over the region and intercontinentally transported aerosols from Africa or the Atlantic.
The found minimum AOD values by MODIS, CALIOP/CALIPSO, as well as AERONET in our study were all in the same order and identical or very close to their reported detections limits (0.03, 0.02, and 0.01, respectively) [56]. It is evident from the MODIS AOD time series analysis, that the data are very scarce over the NEB and Southern Atlantic. Part of this may be explained by cloud coverage, and thus contamination that hampers the retrieval. However, according to [56], the detection limit of MODIS may be one of the reasons: since aerosol loading is generally low over the NEB region, many values may be filled with the Retrieval Fill Value (RFV), such as investigated for CALIOP/CALIPSO by [56]. This study proposed a better algorithm for the CALIOP AOD product that substantially improved the number of available AOD measurements. The same could be investigated for the other AOD products. Additionally, a regionalization of the global MODIS AOD algorithm to optimize for the atmospheric conditions of NEB would most probably improve the product.
In resume, the aerosols from the Northeast Brazilian region cannot be considered as having a large impact on South America on a continental scale, as our results confirm. Rather, in the context of the constant uncontrolled and largely unplanned growth of urban areas in the region, land-use and land-use change, as well as long and medium range transport of aerosols are of great interest and contribute to the enhancement of aerosols and trace gases in the atmosphere.
The main goal of this study was to prepare and analyze a large aerosol database that will be continuously expanded for the purpose of advanced data assimilation and analyses with regional atmospheric chemistry models over the NEB region. The database will aid to compensate the high uncertainties in the presently available emission inventories for the region. Therefore, it is crucial to understand how this specific observational data is representative for the region to assure that future model simulation will in fact be improved by using information from the variety of available observations. Future studies will aim at a more comprehensive analyses of the satellite data over the whole region with the additional exploration of product suites from the next generation of satellites, such as ESA’s Sentinel-5 products of aerosols and trace gases.

Author Contributions

Conceptualization, A.M.d.O., C.T.S., H.E., J.J.H.; methodology, A.M.d.O., C.T.S., H.E., F.J.S.L., J.J.H.; software, C.T.S., F.J.S.L.; validation, A.M.d.O., C.T.S., F.J.S.L.; formal analysis, A.M.d.O., C.T.S., N.P.M.d.O., A.K.S.M., investigation, A.M.d.O., C.T.S., N.P.M.d.O., A.K.S.M.; resources, F.J.S.L., E.L., H.E., J.J.H.; data curation, A.M.d.O., N.P.M.d.O., A.K.S.M., F.J.S.L., E.L., J.J.H.; writing—original draft preparation, A.M.d.O., writing—review and editing, A.M.d.O., C.T.S., F.J.S.L., H.E., J.J.H.; visualization, A.M.d.O., N.P.M.d.O., A.K.S.M., J.J.H.; supervision, F.J.S.L., H.E., J.J.H.; project administration, A.M.d.O., J.J.H.; funding acquisition, A.M.d.O., C.T.S., N.P.M.d.O., A.K.S.M., E.L., J.J.H.

Funding

This research was funded by CNPq /MCTI – National Council for Science and Technology (Conselho Nacional de Pesquisa) of the Brazilian Ministry of Science, Technology and Innovation, via the research project, grant number 472706/2012-8 and via the Science Without Borders Program, grant number 40030-2015. The research work of five of the authors was financed by scholarships: CNPq also funded the postdoc scholarship of Fabio J. S. Lopes with its PDJ (Pós-Doutorado Júnior) support under grant number 150716/2017-6. CAPES/MEC - Coordination for the Improvement of Higher Education Personnel (Coordenação de Aperfeiçoamento de Pessoal de Nível Superior) of the Brazilian Ministry of Education through scholarships awarded through the Graduate-Program in Climate Sciences (PPGCC/UFRN) to the first four authors: Aline M. de Oliveira (PhD scholarship and an 8 months scholarship of the international exchange program Doutorado-Sanduiche), Cristina T. Souza (PNPD postdoc of the Programa Nacional de Pós Doutorado), Nara P. M. de Oliveira (Master scholarship) and Aline K. S. Melo (Master scholarship).

Acknowledgments

The authors gratefully acknowledge the NOAA Air Resources Laboratory (ARL) for the provision of the HYSPLIT transport and dispersion model and READY website (http://www.ready.noaa.gov) used in this publication. We thank MSc. Marcos Paulo A. da Silva and MSc.Daniel Camilo F. S. Oliveira, former students of PPGCC/UFRN, for their support in preparing some of the figures, post-processing of DUSTER/Lidar data from Natal and CALLIOP/Lidar data, as well as measurements of the AERONET sun photometers, respectively. Both also provided support in the related discussions of these data. We also gratefully acknowledge the two anonymous reviewers who contributed substantially to improve our paper.

Conflicts of Interest

The authors declare no conflicts of interest.

References

  1. Andreae, M.O.; Crutzen, P.J. Atmospheric Aerosols: Biogeochemical Sources and Role in Atmospheric Chemistry. Science 1997, 276, 1052–1058. [Google Scholar] [CrossRef] [Green Version]
  2. Andreae, M.O.; Merlet, P. Emission of trace gases and aerosols from biomass burning. Glob. Biogeochem. Cycles 2001, 15, 955–966. [Google Scholar] [CrossRef] [Green Version]
  3. Gonçalves, W.A.; Machado, L.A.T.; Kirstetter, P.E. Influence of biomass aerosol on precipitation over the Central Amazon. Atmos. Chem. Phys. 2015, 15, 6789–6800. [Google Scholar] [CrossRef]
  4. Li, J.; Posfai, M.; Hoobs, P.; Buseck, P. Individual aerosol particles from biomass burning in southern Africa: 2. Compositions and aging of inorganic particles. J. Geophys. Res. 2003, 108, 13. [Google Scholar] [CrossRef]
  5. Wallace, J.M.; Hobbs, P.V. Atmospheric Science: An Introductory Survey, 2nd ed.; Academic Press: Cambridge, UK, 2006; pp. 1–483. [Google Scholar]
  6. Charlson, R.J.; Shwartz, E.S.; Hales, J.M.; Cess, R.D.; Coakley, J.R.; Hansen, J.E.; Hofmann, D.J. Climate Forcing by Anthropogenic Aerosols. Science 1992, 5043, 423–430. [Google Scholar] [CrossRef]
  7. Streets, D.G.; Yan, F.; Chin, M.; Diehl, T.; Mahowald, N.; Schultz, M.; Wild, M.; Wu, Y.; Yu, C. Anthropogenic and natural contributions to regional trends in aerosol optical depth. J. Geophys. Res. 2009, 114, 1980–2006. [Google Scholar] [CrossRef]
  8. Highwood, E.J.; Wilcox, L.; Dunstone, N. The influence of anthropogenic aerosol on multi-Decadal variations of historical global climate. Environ. Res. Lett. 2013, 8, 1748–9326. [Google Scholar] [CrossRef]
  9. Kaufman, Y.J.; Tanré, D.; Boucher, O.A. A satellite view of aerosols in the climate system. Nature 2002, 419, 215. [Google Scholar] [CrossRef]
  10. Lohmann, U. Global indirect aerosol effects: A review. Atmos. Chem. Phys. 2005, 5, 1680–7324. [Google Scholar] [CrossRef]
  11. Kroll, J.H.; Seinfeld, J.H. Chemistry of secondary organic aerosol: Formation and evolution of low-Volatility organics in the atmosphere. Atmos. Environ. 2008, 42, 3593–3624. [Google Scholar] [CrossRef]
  12. Lopes, F.J.; Moreira, G.A.; Rodrigues, P.F.; Guerrero-Rascado, J.L.; Andrade, M.F.; Landulfo, E. Lidar measurements of tropospheric aerosol and water vapor profiles during the winter season campaigns over the metropolitan area of Sao Paulo, Brazil. Tech. Meas. Atmos. Remote Sens. 2014, 9246. [Google Scholar] [CrossRef]
  13. Andreae, M.O.; Artaxo, P.; Fisher, H.; Freitas, S.R.; Grégorie, J.M.; Hansel, A.; Hoor, P.; Kormann, R.; Krejci, L.L.; Leiliveld, J.; et al. Transport of biomass burning smoke to the upper troposphere by deep convection in the equatorial region. Geophys. Res. Lett. 2001, 28, 951–954. [Google Scholar] [CrossRef] [Green Version]
  14. INPE—Instituto Nacional de Pesquisas Espaciais. Available online: http://queimadas.dgi.inpe.br/queimadas/portal (accessed on 21 August 2019).
  15. FAPESP—Fundação de Amparo à Pesquisa do Estado de São Paulo. Available online: http://agencia.fapesp.br/pesquisadores-descrevem-trajetoria-do-rio-de-fumaca-que-escureceu-sao-paulo/31280/ (accessed on 21 August 2019).
  16. Dentener, F.; Kinne, S.; Bond, T.; Boucher, O.; Cofala, J.; Generoso, S.; Ginoux, P.; Gong, S.; Hoelzemann, J.J.; Ito, A.; et al. Emissions of primary aerosol and precursor gases in the years 2000 and 1750 prescribed data-Sets for AeroCom. Atmos. Chem. Phys. 2006, 6, 4321–4344. [Google Scholar] [CrossRef]
  17. Van der Werf, G.R.; Randerson, J.T.; Collatz, G.J.; Giglio, L. Carbon emissions from fires in tropical and subtropical ecosystems. Glob. Chang. Biol. 2003, 9, 547–562. [Google Scholar] [CrossRef] [Green Version]
  18. Carboni, E.; Thomas, G.E.; Sayer, A.M.; Siddan, R.; Poulsen, C.A.; Grainger, R.G.; Ahn, C.; Antoine, D.; Bevans, S.; Braak, R.; et al. Intercomparison of desert dust optical depth from satellite measurements. Atmos. Meas. Tech. 2012, 5, 1973–2002. [Google Scholar] [CrossRef] [Green Version]
  19. Mahowald, N.; Samuel, A.; Jasper, F.K.; Engelstaeder, S.; Scanza, R.; Ward, S.D.; Flanner, M.G. The size distribution of desert dust aerosols and its impact on the Earth system. Aeolian Res. 2014, 15, 53–71. [Google Scholar] [CrossRef] [Green Version]
  20. Ben-Ami, Y.; Koren, I.; Rudich, Y.; Artaxo, P.; Martin, S.T.; Andreae, M.O. Transport of North African dust fromt he Bodélé depression to the Amazon Basin: A case study. Atmos. Chem. Phys. 2010, 10, 7533–7544. [Google Scholar] [CrossRef]
  21. Papayannis, A.; Mamouri, R.E.; Amiridis, V.; Kazadsis, S. Systematic lidar observations of Saharan dust layers over Athens, Greece in the frame of EARLINET project (2004–2006). Ann. Geophys. 2009, 27, 3611–3620. [Google Scholar] [CrossRef]
  22. Ridley, D.A.; Heald, C.L.; Kok, J.F.; Zhao, C. An observationally constrained estimate of global dust aerosol optical depth. Atmos. Chem. Phys. 2016, 16, 15097–15117. [Google Scholar] [CrossRef] [Green Version]
  23. Yu, H.; Dickinson, R.; Chin, M.; Kaufmann, Y.J. Annual cycle of global distributions of aerosol optical depth from integration of MODIS retrievals and GOCART model simulations. J. Geophys. Res. 2003, 108, 1–13. [Google Scholar] [CrossRef]
  24. Prospero, J.M.; Glaccum, R.A.; NEES, R.T. Atmospheric transport of soil dust from African to South America. Nature 1972, 289, 570–572. [Google Scholar] [CrossRef]
  25. Pérez, C.; Nickovic, S.; Baldasano, J.M.; Sicard, M.; Rocadenbosch, F.; Cachorro, E.V. A long Saharan dust event over the western Mediterranean: Lidar, Sun photometer observations, and regional dust modeling. J. Geophys. Res. 2006, 111, 1–16. [Google Scholar] [CrossRef]
  26. Guerrero-Rascado, J.L.; Olmo, F.J.; Avilés-Rodríguez, I.; Navas-Guzmán, F.; Pérez-Ramírez, D.; Lyamani, H.; Alados Arboledas, L. Extreme Saharan dust event over the southern Iberian Peninsula in september 2007: Active and passive remote sensing from surface and satellite. Atmos. Chem. Phys. 2009, 9, 8453–8469. [Google Scholar] [CrossRef]
  27. Kaufman, Y.J.; Boucher, O.; Tanré, D.; Chin, M.; Remer, L.A.; Takemura, T. Aerosol anthropogenic component estimated from satellite data. Geophys. Res. Lett. 2005, 32, 1–4. [Google Scholar] [CrossRef]
  28. Barkley, A.E.; Prospero, J.M.; Mahowald, N.; Hamilton, D.S.; Popendorf, K.J.; Oehlert, A.M.; Pourmand, A.G.; Panechou-Pulcherie, K.; Blackwelder, P.; Gston, C.J. African biomass burning is a substantial source of phosphorus deposition to the Amazon, Tropical Atlantic Ocean, and Southern Ocean. Proc. Natl. Acad. Sci. USA 2019, 116, 16216–16221. [Google Scholar] [CrossRef] [Green Version]
  29. Ansmann, A.; Baars, H.; Müller, D.; Althausen, D.; Engelmann, R.; Pauliquevis, T. Dust and smoke transport from Africa to South America: Lidar profiling over Cape Verde and the Amazon rainforest. Geophys. Res. Lett. 2009, 36, 1–5. [Google Scholar] [CrossRef]
  30. Wang, Q.; Saturno, J.; Xuguang, C.; Walter, D.; Lavric, J.V.; Moran-Zuloaga, D.; Ditas, F.; Pöhlker, C.; Brito, J.; Carbone, S.; et al. Modeling investigation of light-Absorbing aerosols in the Amazon Basin during the wet season. Atmos. Chem. Phys. 2016, 16, 14775–14794. [Google Scholar] [CrossRef]
  31. Williams, J.E.; Weele, M.; Velthoven, P.F.J.; Scheele, M.P.; Liousse, C.; Werf, G.R. The Impact of Uncertainties in African Biomass Burning Emission Estimates on Modeling Global Air Quality, Long Range Transport and Tropospheric Chemical Lifetimes. Atmosphere 2012, 3, 132–163. [Google Scholar] [CrossRef] [Green Version]
  32. Gomes, F. A Influência dos Aerossóis na Dinâmica da Monção Oeste Africana: Efeito Direto. Master’s Thesis, Instituto Nacional de Pesquisas Espaciais—INPE, São José dos Campos, Brazil, 2009. [Google Scholar]
  33. Levy, R.C.; Remer, L.A.; Martins, J.V.; Kaufman, Y.J.; Plana-Fattori, A.; Redemann, J.; Wenny, B. Evaluation of the modis aerosol retrievals over ocean and land during CLAMS. J. Atmos. Sci. 2005, 62, 974–992. [Google Scholar] [CrossRef]
  34. Remer, L.A.; Tanré, Y.J.K.D.; Mattoo, S.; Chu, D.A.; Martins, J.V.; Li, R.R.; Ichoku, C.; Levy, R.C.; Kleidman, R.G.; Eck, T.F.; et al. The MODIS aerosol algorithm, products, and validation. J. Atmos. Sci. 2005, 62, 947–973. [Google Scholar] [CrossRef]
  35. de Oliveira, N.P.M. Avaliação da Razão Lidar do Satélite CALIPSO utilizando a Profundidade Óptica dos Aerossóis obtidos por um fotômetro solar da rede AERONET em Petrolina/PE, Brasil. Master’s Thesis, Universidade Federal do Rio Grande do Norte, Natal, Brazil, 2018. [Google Scholar]
  36. Winker, D.M.; Vaughan, A.M.; Omar, A.; Hu, Y.; Powell, K.A.; Liu, Z.; Hunt, W.H.; Young, S.A. Overview of the CALIPSO mission and CALIOP data processing algorithms. J. Atmos. Ocean. Technol. 2009, 26, 2310–2323. [Google Scholar] [CrossRef]
  37. Omar, A.H.; Winker, D.M.; Kittaka, C.; Vaughan, M.A.; Liu, Z.; Hu, Y.; Trepte, C.R.; Rogers, R.R.; Ferrare, R.A.; Lee, K.; et al. The CALIPSO automated aerosol classification and Lidar Ratio Selection Algorithm. J. Atmos. Ocean. Technol. 1994, 26, 1994–2014. [Google Scholar] [CrossRef]
  38. Melo, K.A.S. Análise das propriedades ópticas dos aerossóis na atmosfera sobre Natal/RN a partir de dados dos sistemas CALIPSO e DUSTER. Master’s Thesis, Universidade Federal do Rio Grande do Norte, Natal, Brazil, 2018. [Google Scholar]
  39. Lopes, F.J.S.; Landulfo, E.; Vaughan, M.A. Evaluating CALIPSO’s 532 nm lidar ratio selection algorithm using AERONET sun photometers in Brazil. Atmos. Meas. Tech. 2013, 6, 3281–3299. [Google Scholar] [CrossRef]
  40. IBGE—Instituto Brasileiro de Geografia e Estatística. Available online: https://www.ibge.gov.br/estatisticas-novoportal/por-cidade-estado estatisticas.html?t=destaques&c=2408102 (accessed on 25 August 2018).
  41. da Silva, K.; dos Santos, C.S.; da Silva, M.M.; Alves, B.J.M.; Barbosa, A.B.; Freire, C.O.; Alcântara, C.; Sombra, S.S. Estudo dos Padrões de Ventos Offshore no Litoral do Ceará Utilizando Dados Estimados pelo Produto de Satélites BSW. Rev. Brasil. Meteorol. 2017, 32, 579–690. [Google Scholar] [CrossRef]
  42. Levy, R.C.; Mattoo, S.; Munchak, L.A.; Remer, L.A.; Sayer, A.M.; Pataditas, F.; Hsu, N.C. The Collection 6 MODIS aerosol products over land and ocean. Atmos. Meas. Tech. 2013, 6, 2989–3034. [Google Scholar] [CrossRef] [Green Version]
  43. Holben, B.N.; Tanré, D.; Smirnov, A.; Eck, T.F.; Slutsker, I.; Abuhassan, N.; Newcom, W.W.; Schafer, J.S.; Chatenet, B.; Kaufman, Y.; et al. An emerging ground-Based aerosol climatology: Aerosol optical depth from AERONET. J. Geophys. Res. 2001, 106, 12067–12097. [Google Scholar] [CrossRef]
  44. Thomason, L.W.; Pitts, M.C.; Winker, D.M. CALIPSO observations of stratospheric aerosols: A preliminar assessment. Atmos. Chem. Phys. 2007, 7, 5283–5290. [Google Scholar] [CrossRef]
  45. Camilo, D.F.S.O. Propriedades ópticas de aerossóis na atmosfera de Natal/RN por meio de um fotômetro solar da rede AERONET. Master’s Thesis, Universidade Federal do Rio Grande do Norte, Natal, Brazil, 2019. [Google Scholar]
  46. Landulfo, E.; Lopes, F.; Montilla, H.; Guedes, G.A.; Hoelzemann, J.J.; Fernandez, J.H.; Arboledas, L.; Rascado, J.L. DUSTER lidar: Transatlantic transport of aerosol particles from the Sahara and other sources: First results from the recently installed lidar and sunphotometer in Natal/Brazil. Tech. Meas. Atmos. Remote. Sens. XII 2016, 10006. [Google Scholar] [CrossRef]
  47. Eck, T.F.; Reid, J.S.; O’Neill, N.T.; Schafer, J.S.; Dubovik, O.; Smirnov, A.; Yamasoe, M.A.; Artaxo, P. High aerosol optical depth biomass burning events: A comparison of optical proprieties for different source regions. Geophys. Res. Lett. 2003, 30, 1–4. [Google Scholar] [CrossRef]
  48. Schuster, G.L.; Dubovik, O.; Holben, B.N. The Angstrom Exponent and Bimodal Aerosol Size Distributions. J. Geophys. Res. 2016, 11, 1–14. [Google Scholar] [CrossRef]
  49. Toledano, C.; Cachorro, V.E.; Berjon, A.; De Frutos, A.M.; Sorribas, M.; De la Morena, B.A.; Goloub, P. Aerosol optical depth and Ångström exponent climatology at El Arenosillo AERONET site (Huelva, Spain). Q. J. R. Meteorol. Soc. 2007, 133, 795–807. [Google Scholar] [CrossRef]
  50. Vergaz, R.; Cachorro, V.E.; Frutos, A.M.; Sorribas, M.; de la Morena, B.A.; Goloub, P. Columnar characteristics of aerosols by spectroradiometer measurements in the maritime area of the Cadiz Gulf (Spain). Int. J. Climatol. 2005, 25, 1781–1804. [Google Scholar] [CrossRef]
  51. Anderson, T.; Charlson, R.; Winker, D.; Ogren, J.; Holmen, K. Mesoscale variations of tropospheric aerosols. J. Atmos. Sci. 2003, 60, 119–136. [Google Scholar] [CrossRef]
  52. Hoelzemann, J.J.; Longo, K.; Fonseca, R.; Rosário, N.M.E.; Elbern, H.; Freitas, S.; Pires, C. Regional representativity of AERONET observation sites during the biomass burning season in South America determined by correlation studies with MODIS Aerosol Optical Depth. J. Geophys. Res. 2009, 114, 1–20. [Google Scholar] [CrossRef]
  53. Kovacs, T. Comparing MODIS and AERONET aerosol optical depth at varying separationdistances to assess ground-Based validation strategies for spaceborne Lidar. J. Geophys. Res. 2006, 111, 24203. [Google Scholar] [CrossRef]
  54. Lopes, F.J.S. Validação dos dados do satélite CALIPSO utilizando um sistema Lidar de retroespalhamento elástico e fotômetro solar da rede AERONET. Ph.D. Thesis, Instituto de pesquisas Energéticas e Nucleares, Universidade de São Paulo, São Paulo, Brazil, 2011. [Google Scholar]
  55. Yu, H.; Chin, M.; Yuan, T.; Bian, H.; Remer, L.A.; Prospero, J.M.; Omar, A.; Winker, D.; Yang, Y.; Zhang, Y.; et al. The fertilizing role of African dust in the Amazon rainforest: A first multiyear assessment based on data from Cloud-Aerosol Lidar and Infrared Pathfinder Satellite Observations. Geophys. Res. Lett. 2015, 42, 1984–1991. [Google Scholar] [CrossRef]
  56. Toth, T.D.; Campbell, J.R.; Reid, J.S.; Tackett, J.L.; Vaughan, M.A.; Zhang, J.; Marquis, J.W. Minimum aerosol layer detection sensitivities and their subsequent impacts on aerosol optical thickness retrievals in CALIPSO level 2 data products. Atmos. Meas. Tech. 2018, 11, 499–514. [Google Scholar] [CrossRef] [Green Version]
  57. Rocha-Lima, A.; Martins, V.; Remer, L.A.; Todd, M.; Marshm, J.H.; Engelstaedter, S.; Ryder, C.; Cavazos-Guerra, C.; Artaxo, P.; Colarco, P.; et al. A detailed characterization of the Saharan dust collected during the Fennec campaign in 2011: In situ ground-Based and laboratory measurements. Atmos. Chem. Phys. 2018, 18, 1023–1043. [Google Scholar] [CrossRef]
  58. Moran-Zuloaga, D.; Florian, D.; Walter, D.; Saturno, J.; Brito, J.; Carbone, S.; Chi, X.; de Angelis, H.; Baars, H.; Godoi, R.H.M.; et al. Long-Term study on coarse mode aerosols in the Amazon rain forest with the frequent intrusion of Saharan dust plumes. Atmos. Chem. Phys. 2018, 18, 10055–10088. [Google Scholar] [CrossRef]
  59. Leal, I.; da Silva, J.; Tabarelli, M.; Lancher, M. Mudando o curso da conservação da biodiversidade na Caatinga do Nordeste do Brasil. Megadiversidade 2005, 1, 1–8. [Google Scholar]
  60. Mamouri, R.E.; Amiridis, V.; Papayannis, A.; Giannakaki, E.; Tsaknakis, G.; Bali, D.S. Validation of CALIPSO space-Borne-Derived attenuated backscatter coefficient profiles using a ground-Based lidar in Athens, Greece. Atmos. Meas. Tech. 2009, 2, 513–522. [Google Scholar] [CrossRef]
  61. Mona, L.; Pappalardo, G.; Amodeo, A.; D’Amico, G.; Madonna, F.; Boselli, A.; Giunta, A.; Russo, F.; Cuomo, V. One year of CNR-IMAA multi-Wavelength Raman Lidar measurements in coincidence with CALIPSO overpasses: Level 1 products comparison. Atmos. Chem. Phys. 2009, 9, 7213–7228. [Google Scholar] [CrossRef]
  62. Stein, A.F.; Draxler, R.R.; Rolph, G.D.; Stunder, B.J.B.; Cohen, M.D.; Ngan, F. NOAA’s HYSPLIT atmospheric transport and dispersion modeling system. Bull. Am. Meteorol. Soc. 2015, 96, 2059–2077. [Google Scholar] [CrossRef]
  63. Rolph, G.; Stein, A.; Stunder, B. Real-Time Environmental Applications and Display sYstem: READY. Environ. Model. Softw. 2017, 95, 210–228. [Google Scholar] [CrossRef]
Figure 1. Northeastern Brazil and atmospheric aerosol inflow region. Scale 1 : 300 000.
Atmosphere 10 00594 g001
Figure 2. Aerosol Optical Depth daily averaged time series derived from the MODIS instrument aboard TERRA and AQUA satellites for the period of 2005 to 2014. Different colors represent the individual years, while the black line is the median of all annual time series.
Atmosphere 10 00594 g002
Figure 3. Box plot of MODIS TERRA and AQUA Aerosol Optical Depth for 2005 (a), 2007 (b), 2010 (c) and 2012 (d). The bottom part of the boxes corresponds to the first quartile (Q1), the line in the middle, the median (Q2) and the third quartile (Q3) is represented by the upper part. The flags on each box, correspond to the minimum and maximum values found.
Atmosphere 10 00594 g003
Figure 4. Monthly averaged AOD time series derived from CALIOP/CALIPSO data for the city of Natal, in the period from 2007 to 2016, each year represented by a different color. The black line represents the monthly mean of all years during the period.
Atmosphere 10 00594 g004
Figure 5. Box plot of the monthly AOD variation from CALIOP/CALIPSO Lidar data at 532 nm in Natal, for the period of 2007 to 2016. The dry season (August to February) is depicted in orange, while the wet season (March to July) is represented in blue.
Atmosphere 10 00594 g005
Figure 6. AOD time series from the AERONET sun photometer (solid line) and CALIPSO (dotted line) for the city of Petrolina, from 2007 to 2016.
Atmosphere 10 00594 g006
Figure 7. Scatter plot of Aerosol Optical Depth versus Angström Exponent for the period from 2007 to 2016 at Petrolina-PE. The colored boxes represent the different aerosol types found at the AERONET site.
Atmosphere 10 00594 g007
Figure 8. Case study CS-1 on 27 September 2010. MODIS AOD at 550 nm derived from AQUA and TERRA satellites. (a) Northwest Africa, the Atlantic Ocean and NEB, (b) NEB, (c) and (d) show the 10 and 12-day simulations of HYSPLIT backwards trajectories, respectively, ending over the state of Maranhão on 30 September 2010 at 13UTC. The red backward trajectory corresponds to 500 m, blue to 1500 m and green to 2500 m height. (e) presents the aerosol subtype for September 27 displaying the presence of (1) clean marine (in blue), (2) dust (in yellow), (3) polluted continental (in red), (4) clean continental (in green), (5) polluted dust (in brown) and (6) smoke (in black) aerosols.
Atmosphere 10 00594 g008aAtmosphere 10 00594 g008b
Figure 9. Case study CS-2 on 6 December 2016. (a) Backscatter profile at 355nm (a), 532 nm, and (b) 1064 nm (c) from DUSTER/LIDAR; (d) Backscatter profiles at 532 nm from CALIOP/LIDAR; (e) 7-day simulations of the backwards trajectories from HYSPLIT; (f) aerosol subtype from CALIPSO, displaying the (1) marine (in blue), (2) dust (in yellow), (3) polluted continental/smoke (in orange), (4) clean continental (in green), (5) polluted dust (in brown), (6) elevated smoke (in black), (7) dusty marine (in light blue), (8) PSC (in white), (9) volcanic ash (in gray), (10) sulfate/other (in dark gray) aerosols.
Atmosphere 10 00594 g009aAtmosphere 10 00594 g009b
Figure 10. Case study CS-3 on 1 November 2007 at Petrolina/PE. (a) Total attenuated backscatter at 532 nm from CALIOP/CALIPSO. (b) Aerosol subtype from CALIOP/CALIPSO displaying the presence of (1) clean marine (in blue), (2) dust (in yellow), (3) polluted continental (in red), (4) clean continental (in green), (5) polluted dust (in brown) and (6) smoke (in black) aerosols (c) 10-day simulations of the backwards trajectories from HYSPLIT.
Atmosphere 10 00594 g010
Table 1. Characterization of aerosol type by combination of Aerosol Optical Depth and Angstrom Exponent according to [49,50,51].
Aerosol TypeAODAE
Biomass burning>0.35 up to 1.5>1.5
Continental0.2–0.35>1.05
Desert dust>0.4 up to 1.2<0.5
Marine>0.15<0.6
Pollution + dust>0.06<0.8

