Article

Independent Aridity and Drought Pieces of Evidence Based on Meteorological Data and Tree Ring Data in Southeast Banat, Vojvodina, Serbia

1
Chair for Physical Geography, Faculty of Science, University of Novi Sad, Trg Dositeja Obradovića 3, 21000 Novi Sad, Serbia
2
Key Laboratory of Cenozoic Geology and Environment, Institute of Geology and Geophysics, Chinese Academy of Sciences, Beijing 100029, China
3
CAS Center for Excellence in Life and Paleoenvironment, Beijing 100044, China
4
University of Chinese Academy of Sciences, Beijing 100049, China
5
Research Group for Terrestrial Paleoclimates, Max Planck Institute for Chemistry, Hahn Meitner Weg 1, 55128 Mainz, Germany
6
Serbian Academy of Sciences and Arts, Knez Mihajlova 35, 11000 Belgrade, Serbia
*
Author to whom correspondence should be addressed.
Atmosphere 2019, 10(10), 586; https://doi.org/10.3390/atmos10100586
Submission received: 16 August 2019 / Revised: 9 September 2019 / Accepted: 14 September 2019 / Published: 27 September 2019
(This article belongs to the Special Issue Meteorological and Hydrological Droughts)

Abstract

:
In this study, aridity data and tree ring data were collected in Northern Serbia, in Southeast (SE) Banat, a subregion within Vojvodina, and Vojvodina at large. They were each investigated independently. The De Martonne Aridity Index and the Forestry Aridity Index are derived from examining the relationship between precipitation and surface air temperature data sets sourced from seven meteorological stations in SE Banat, and from 10 meteorological stations located in Vojvodina as a whole. Vojvodina is a large territory and used as the control area, for the period 1949–2017. The Palmer Drought Severity Index was derived for the period 1927–2016, for both SE Banat and the totality of Vojvodina. The results of the Tree Ring Width Index were obtained from samples collected in or around the villages of Vlajkovac and Šušara, both located in SE Banat, for the period 1927–2017. These tree ring records were compared with three previous aridity and drought indices, and the meteorological data on the surface air temperature and the precipitation, with the objective being to evaluate the response of tree growth to climate dynamics in the SE Banat subregion. It was noted that the significant positive temperature trends recorded in both areas were too insufficient to trigger any trends in aridity or the Tree Ring Width Index, as neither displayed any change. Instead, it appears that these climatic parameters only changed in response to the precipitation trend, which remained unchanged during the investigated period, rather than in response to the temperature trend. It appears that the forest vegetation in the investigated areas was not affected significantly by climate change in response to the dominant temperature increase.

1. Introduction

In recent decades, the issues of climate variability and/or climate change have been the focus of many scientific studies. Global climate change, caused by natural processes as well as anthropogenic factors, is a major environmental issue that may have a significant impact on the world over the course of the 21st century [1,2,3,4]. Governments, the scientific community, the media, and people all over the world have been paying more and more attention to recent trends in global climate change [5]. Temperature change [6], precipitation change [7] and the rate of these changes are some of the most important drivers of climate change. It seems to be more useful to analyze temperature and precipitation simultaneously, which is most similar to their impact on climate. Parameters in which there is a mathematical quotient/ratio of precipitation (or values of air humidity) and temperature are known as aridity indices and are used as a measure of aridity. According to the American Meteorological Society [8], aridity is the degree to which a climate lacks effective, life-promoting moisture, or, in the climate sense of the term, aridity is the opposite of humidity. Furthermore, the higher the values of the aridity indices in any given region, the greater the water resource variability [9]. Therefore, aridity indices are not only important as an indicator of plant growth but could also be regarded as good indicators of climate changes, and can be used to estimate changes in runoff [10].
The most renowned aridity parameter is the De Martonne [11], (DM), Aridity Index. This index can be calculated for different time scales, such as months, seasons and years. The DM index is used worldwide in order to identify the dry/humid climate conditions of any given region or regions [9,12,13,14,15,16], and provides a satisfactory description of the climate regions and climatic changes in the territory of Serbia, for the period 1949–2015 as well [17,18,19]. Similar to the DM index, the Pinna [20] combinative aridity index can be calculated using the annual amount of precipitation and the mean annual surface temperature. However, unlike the DM index, it only provides the annual aridity. This index is also quite widely used and can be found in the previously cited references. However, some scientists prefer to identify aridity conditions employing indices based on (potential or reference) evapotranspiration, calculated using different formulas [21,22,23,24,25,26]. For instance, for the classification of continental and oceanic climates, the Johansson [27] continentality index and the Kerner [28] oceanity index are used [9,12,15].
There is also a class of aridity indices that are based on relevant data associated with vegetation processes. One of the oldest of these is the Emberger [29] index, which is obtained by tracking the mean annual precipitation as well as the mean temperature of both the coldest and hottest months. The FAO (Food and Agriculture Organization) [30] aridity index is the ratio between the total annual precipitation and potential evapotranspiration. One of the most recent indices of the vegetative class is the Forestry Aridity Index (FAI), published by Führer [31]. The FAI is specifically designed to describe aridity conditions in Hungary, and was later successfully applied to the Vojvodina region in Northern Serbia [32]. The Palmer Drought Severity Index (PDSI) [22] was also utilized in this study. The PDSI has been widely used to evaluate the hydro climatic status of many areas [33]. In addition, the tree ring width has been used in evaluating regional aridity in Serbia and surrounding areas [34,35]. In the present study, we also used a Tree Ring Width Index (TRWI) series in the investigated regions. We examine the relationship between tree ring width and local climatic parameters, in order to evaluate the efficacy of the TRWI in evaluating the aridity.
In this study, the focus will be on two types of approach. In the first approach, aridity will be explored through the following values: the DM Aridity Index, and the FAI, all obtained from meteorological data from the investigated regions of the larger Vojvodina, and of Southeastern (SE) Banat, for the period 1949–2017, and PDSI for both of the investigated regions for the period 1927–2016. In the second approach, the TRWI value will be explored using sample data from SE Banat for the period 1927–2017. The differing test periods for the different applied indexes are determined by the maximum length of time series data for each reference index. The results of these two groups of investigations will be compared with the surface air temperature and precipitation data. Overall, the obtained results can be considered representative, as they can be an indicator for recent climate changes in both Southeast Banat and Vojvodina, as well as for the wider, relatively uniform geomorphologic area located in central Europe known as the Carpathian (Pannonian) Basin (CB). Correspondingly, these results may prove to be particularly useful in evaluating the impact of climate change on forest vegetation, given that, in the analyzed period of 1949–2017, there exist more than two, 30-year climatic cycles. Finally, the characteristics of recent aridity/drought are interpreted in the context of paleoclimatic and paleoenvironmental phenomena, during the Late Pleistocene, in the investigated region.

2. Study Area and Data
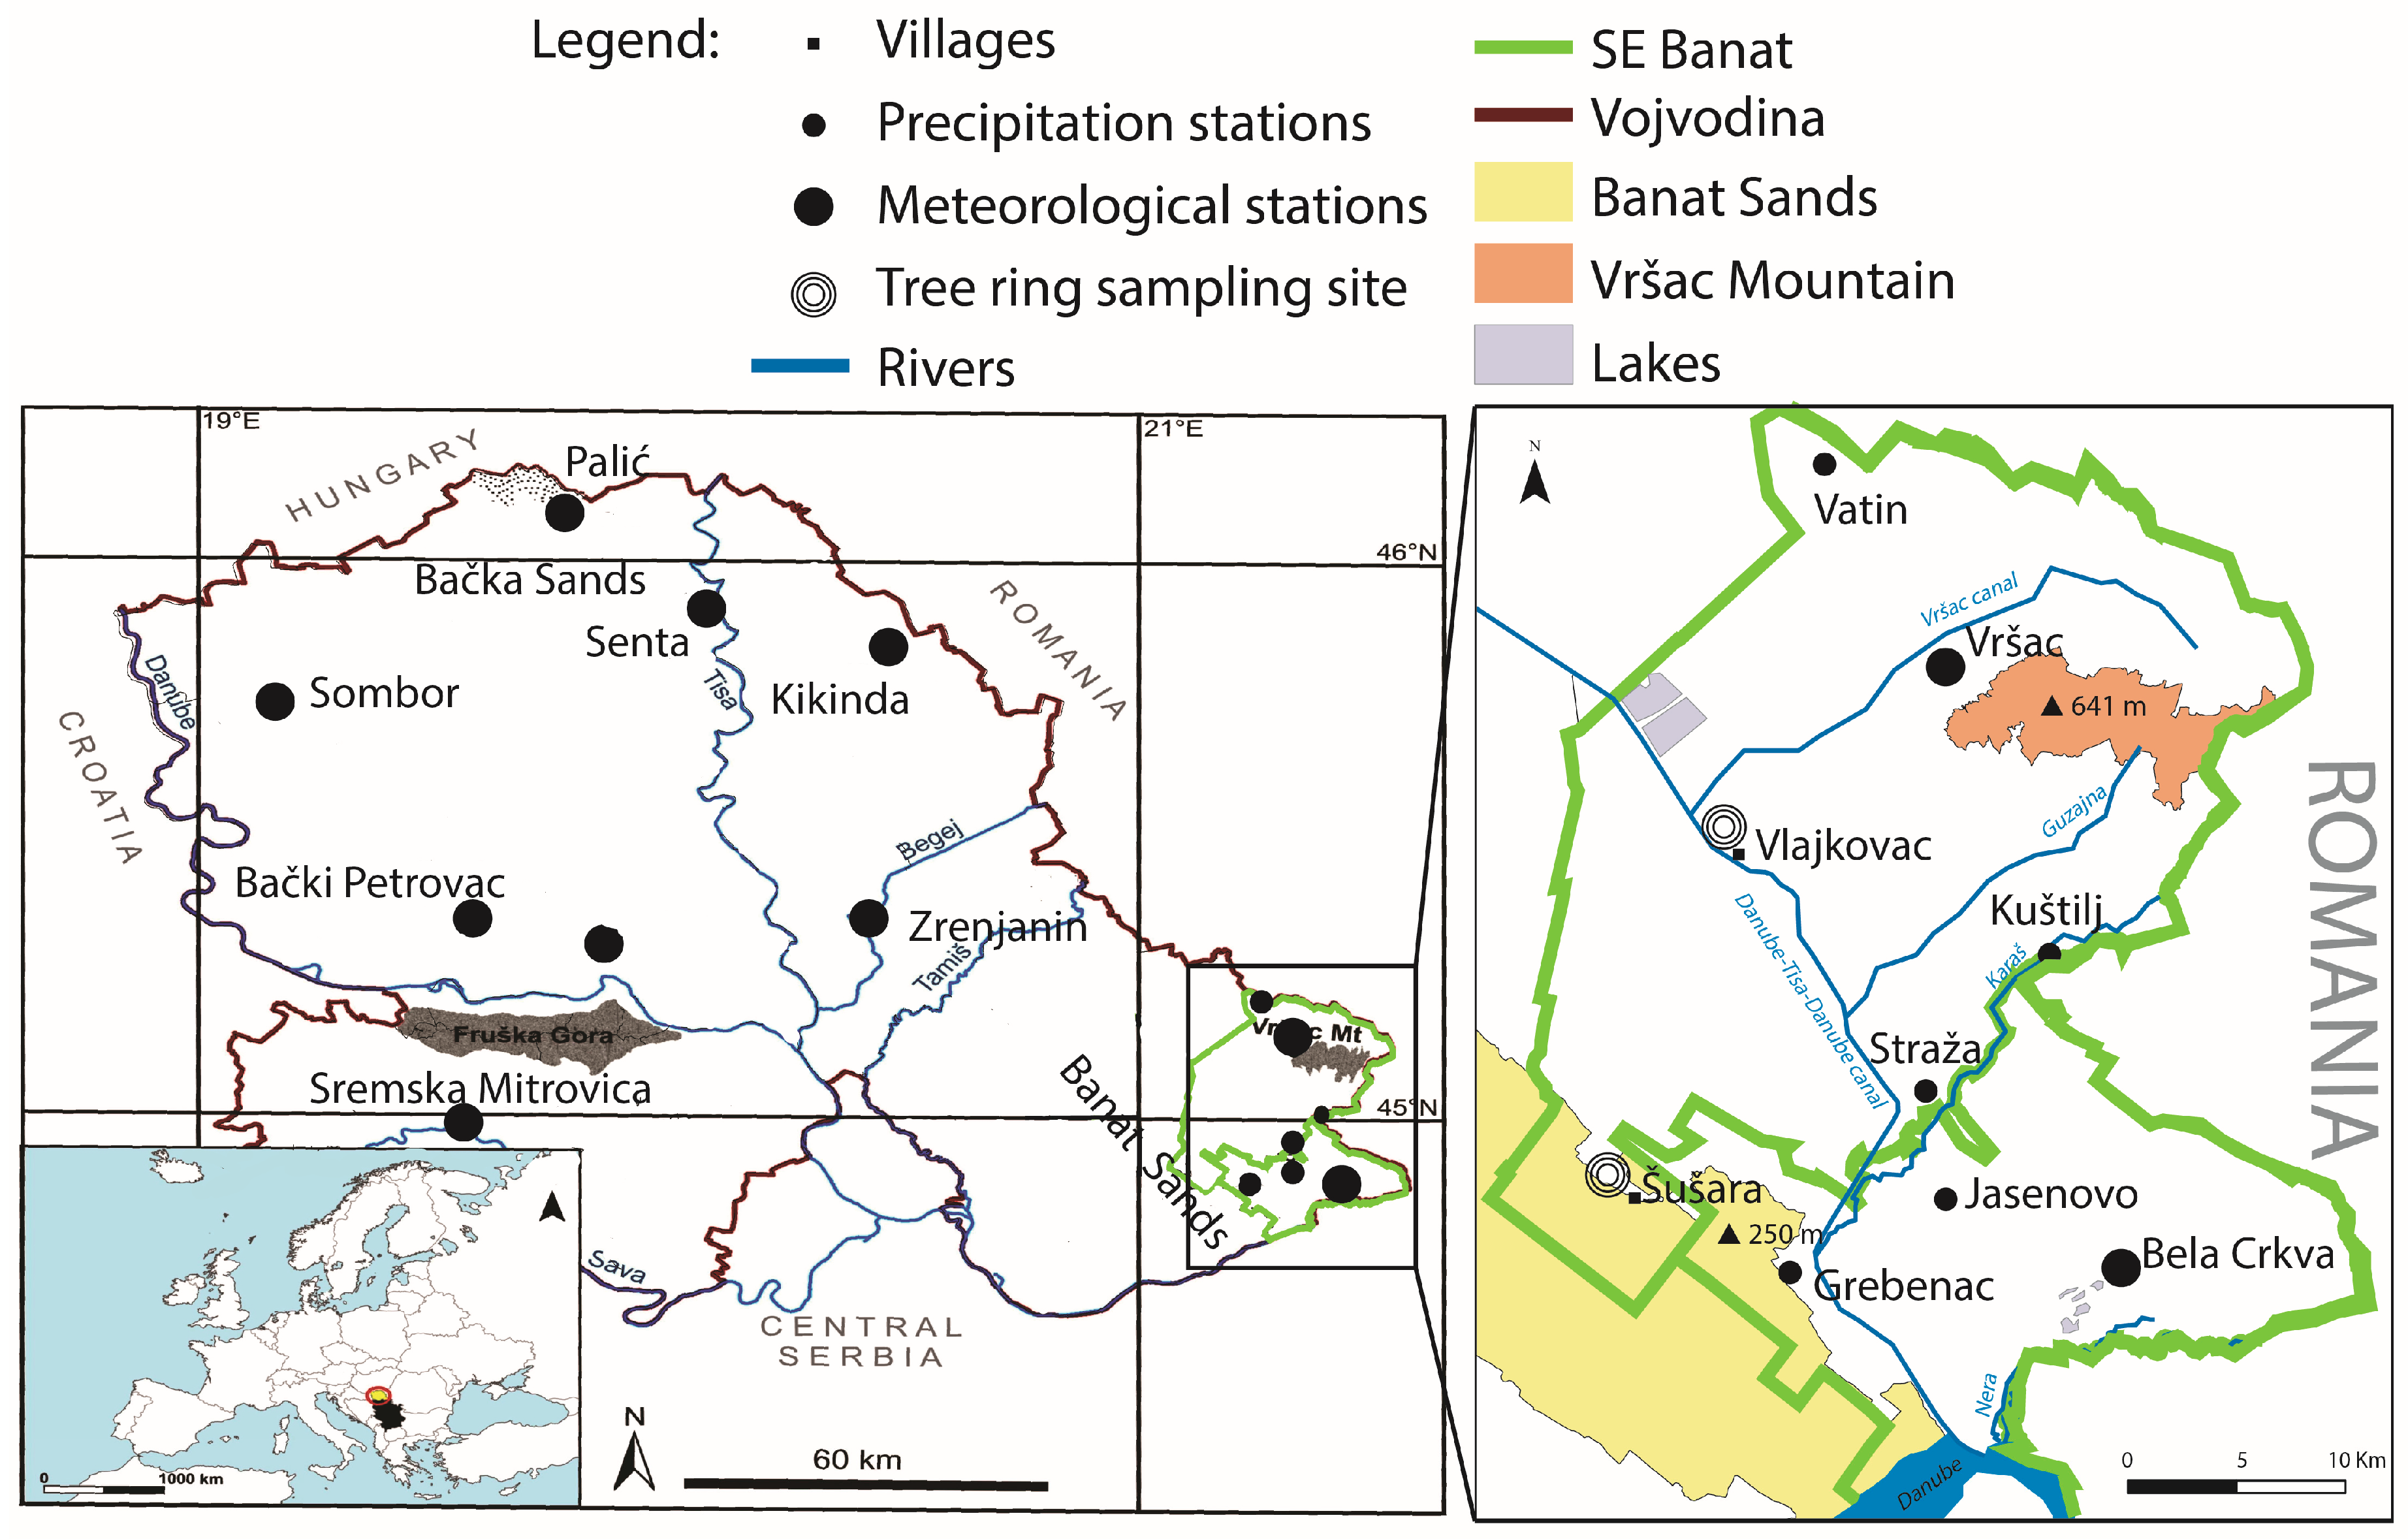
2.1. Study Area

In this study, SE Banat (1153 km2) is the primary research area. This subregion is represented with two municipalities: Bela Crkva (353 km2) and Vršac (800 km2). The research areais situated in the southeastern part of Vojvodina (21,506 km2), and encompass the Danube, Sava, Tisa, Karaš, and Nera rivers (Figure 1).
Vojvodina is a lowland region where more than 60% of the area is covered by loess and loess-like sediments [36]. The loess–palaeosol sequences situated there appear to be the most detailed archive of Middle and Late Pleistocene climatic and environmental fluctuations on the European continent [37,38,39]. The most distinctive landforms in the Vojvodina region are two mountains: Fruška Gora Mountain (539 m above mean sea level (AMSL)), situated between the Danube and Sava rivers, and the Vršac Mountains (641 m AMSL), located in the southeastern area of the region. Other significant geomorphological features include two sandy terrains: Banatska Peščara (Banat Sands, 250 m AMSL) in the southeast, and Bačka Peščara (Bačka Sands, 134 m AMSL) in the north, as well as lower areas and alluvial plains. Forests only comprise about 7% of Vojvodina and exist mainly in the mountains and terrains situated along river banks, while agricultural land occupies about 84% of the territory [40].
The climate of Vojvodina is moderate continental, with cold winters, and hot and humid summers. A wide range of extreme temperatures and a very irregular distribution of precipitation per month led to different values of calculated aridity types [17]. The climate diversity of Vojvodina is mainly the result of surface wind blowing from opposite directions: NW when it is cold and humid, and SE when it is warm and dry [40,41]. The mean annual surface air temperature and the mean annual amount of precipitation are approximately 11.3 °C and 607.3 mm (see Section 4.1.5); [42,43,44], respectively.
Southeast Banat is the eastern subregion of Vojvodina, and possesses some distinctive geophysical characteristics. This area includes the highest altitude (Vršac Mountain) in Vojvodina as well as the lowest altitude (67–68 m AMSL) in the CB, which was found in the alluvial plain of the Nera and Karaš rivers. Furthermore, almost 20–30% of the area of Banatska Peščara is represented in this territory. Further south, SE Banat extends to the Danube, where the river is widest (3–7 km), while to the east, this area extends to the Nera river. The Danube and Nera rivers are the only mountain rivers located in Vojvodina, and they also form a natural, national border with Romania. It should be noted that the hydro-system Danube–Tisa–Danube [45] contributes to the greater hydrological diversity of SE Banat. Forests comprise about 20% [46] of SE Banat and mostly occur on Vršac Mountain, the sandy terrain of Banatska Peščara and on the alluvial plains of the rivers.
The climate of SE Banat is very much comparable to the climate of several other parts of the Vojvodina region, but with some distinctive differences. The values of the mean annual surface air temperature (11.7 °C), and the mean annual precipitation (652.4 mm) are higher than in Vojvodina as a whole (see Section 4.1.5), while the mean annual aridity is almost the same (see Section 4.1.1) in both the SE Banat subregion and Vojvodina as a whole. In SE Banat, there is also a higher frequency of the unique, dry, southeastern wind phenomenon known locally as a Košava, which occurs, on average, 129 days annually, while, in the rest of Vojvodina, it occurs at a lower rate of about 105 days annually [40].

2.2. Data

In this study, data from 15 meteorological stations were used (Figure 1), for the period 1949–2017. The following ten stations: Bački Petrovac, Bela Crkva, Kikinda, Palić, Rimski Šančevi, Senta, Sombor, Sremska Mitrovica, Vršac, and Zrenjanin were used for the territory of Vojvodina, while, for the subregion of SE Banat, the stations of Vršac and Bela Crkva, as well as the stations of Grebenac, Jasenovo, Kuštilj, Straža, and Vatin, were used.These stations are databases operated by the Republic Hydrometeorological Service of Serbia [47]. Data sets from each station were processed and analyzed in order to obtain the mean monthly values of surface air temperatures (Tm) and the monthly amount of precipitation (Pm). Correspondingly, the time series of Tm and Pm were used to calculate new time series for the aridity indices, and to analyze the trends in all time series. Prior to this analysis, the data homogeneity of the meteorological stations was examined using the Alexandersson test [48]. This test relies on the assumption that the difference/ratio between temperature/precipitation amounts at the station being tested and the reference series remains relatively constant over time. The correlation coefficients between the candidate stations and the reference stations were above 0.7, due to the relatively low and uniform flat terrain of the area being studied. The homogeneity analysis showed that the time series of the data for all the stations were homogeneous.
We also used the PDSI data network, developed by Dai et al. [49]. The PDSI network is basedon meteorological records of global land areas on a 2.5° × 2.5° grid points available at the National Center for Atmospheric Research [50]. The gridded PDSI values were extracted for the entire period 1927–2016 from a nearby grid point, which is closest to our tree ring sampling sites (Vlajkovac: 21.20° E, 45.07° N, and Šušara: 21.14° E, 44.94° N, Figure 1). It should be noted that the selected PDSI point can be considered representative for both regions, with SE Banat as the main area of investigation and Vojvodina as the control area.
In SE Banat, tree ring samples were collected (14–18 August 2018) in the villages of Vlajkovac and Šušara and their surroundings (Figure 1). We extracted 23 increment cores from 12 oak trees using an increment borer at chest height. At the sampling sites, the sandy and chernozem soil had good soil water conditions and abundant organic matter, resulting in a high canopy density.

3. Methods

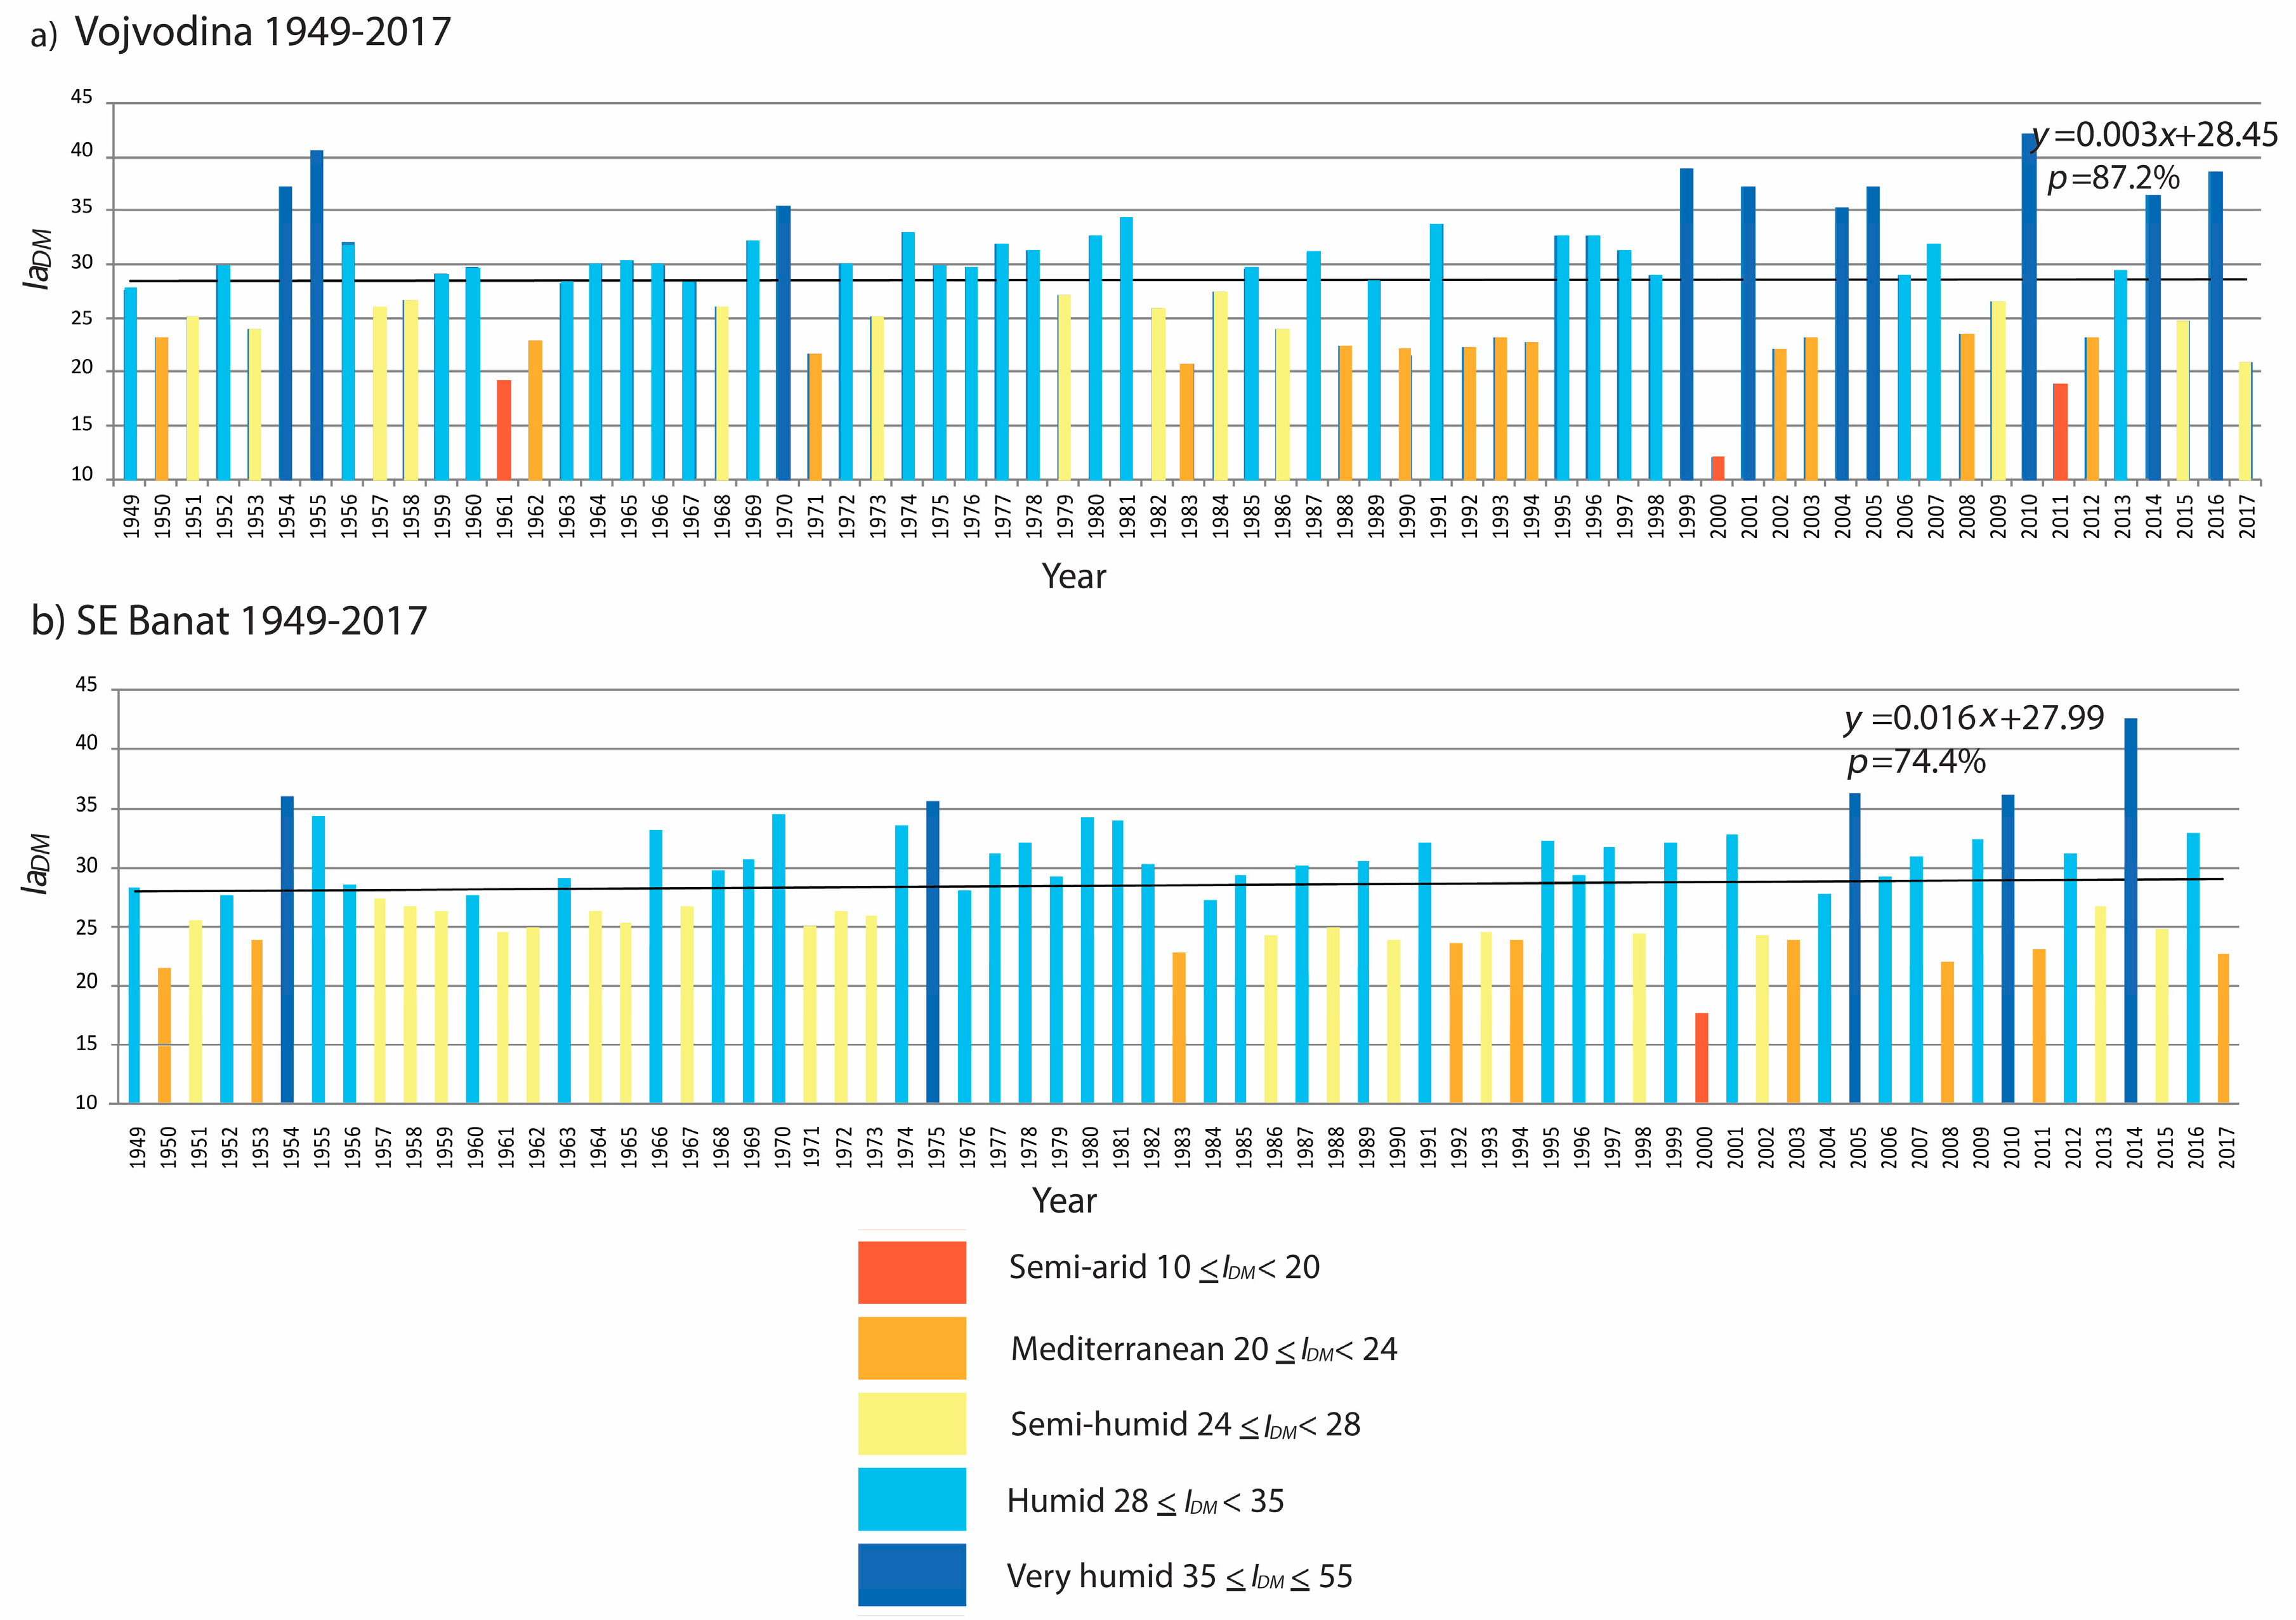
3.1. The De Martonne Aridity Index

It has been almost a century since the French climatologist De Martonne created the DM Aridity Index. It has been used in many countries, including Greece [12], Turkey [9], Romania [13], Iran [51], Spain [14], as well as Serbia [17,18,19].
The annual and monthly values of the DM Aridity Index, IaDM and ImDM, can be represented by the following equations, respectively:
I a D M = P a T a + C ,
I m D M = P m T m + C ,
where Pa and Pm are the annual and monthly amounts of precipitation, Ta and Tm are the mean annual and monthly surface air temperatures, and C = 10 °C is De Martonne’s constant.
The classification of the De Martonne aridity climate is given in Table 1, with a total of seven types of aridity classes. As is evident, the humidity rises with an increase in the values of IaDM and ImDM, and vice versa. Using Equations (1) and (2), we supplemented the database with the time series of IaDM and ImDM for each meteorological station.
According to the Dictionary of Statistical Terms [52], an index is a number formed from the ratio of aggregate values in the given period, to the aggregate values in the base period. If this definition is applied to IaDM and ImDM, according to Equations (1) and (2), we see that the IaDM and ImDM represent numbers that provide the ratio of precipitation and temperatures in an annual or monthly period. Therefore, IaDM and ImDM have dimensions of mm/°C. Hence, it is a physical value that is not a non-dimensional number, as it has been implicitly suggested in most scientific papers related to the DM Aridity Index. In this study, the numerical values of IaDM and ImDM will be presented in the usual manner without the mentioning of dimensions.

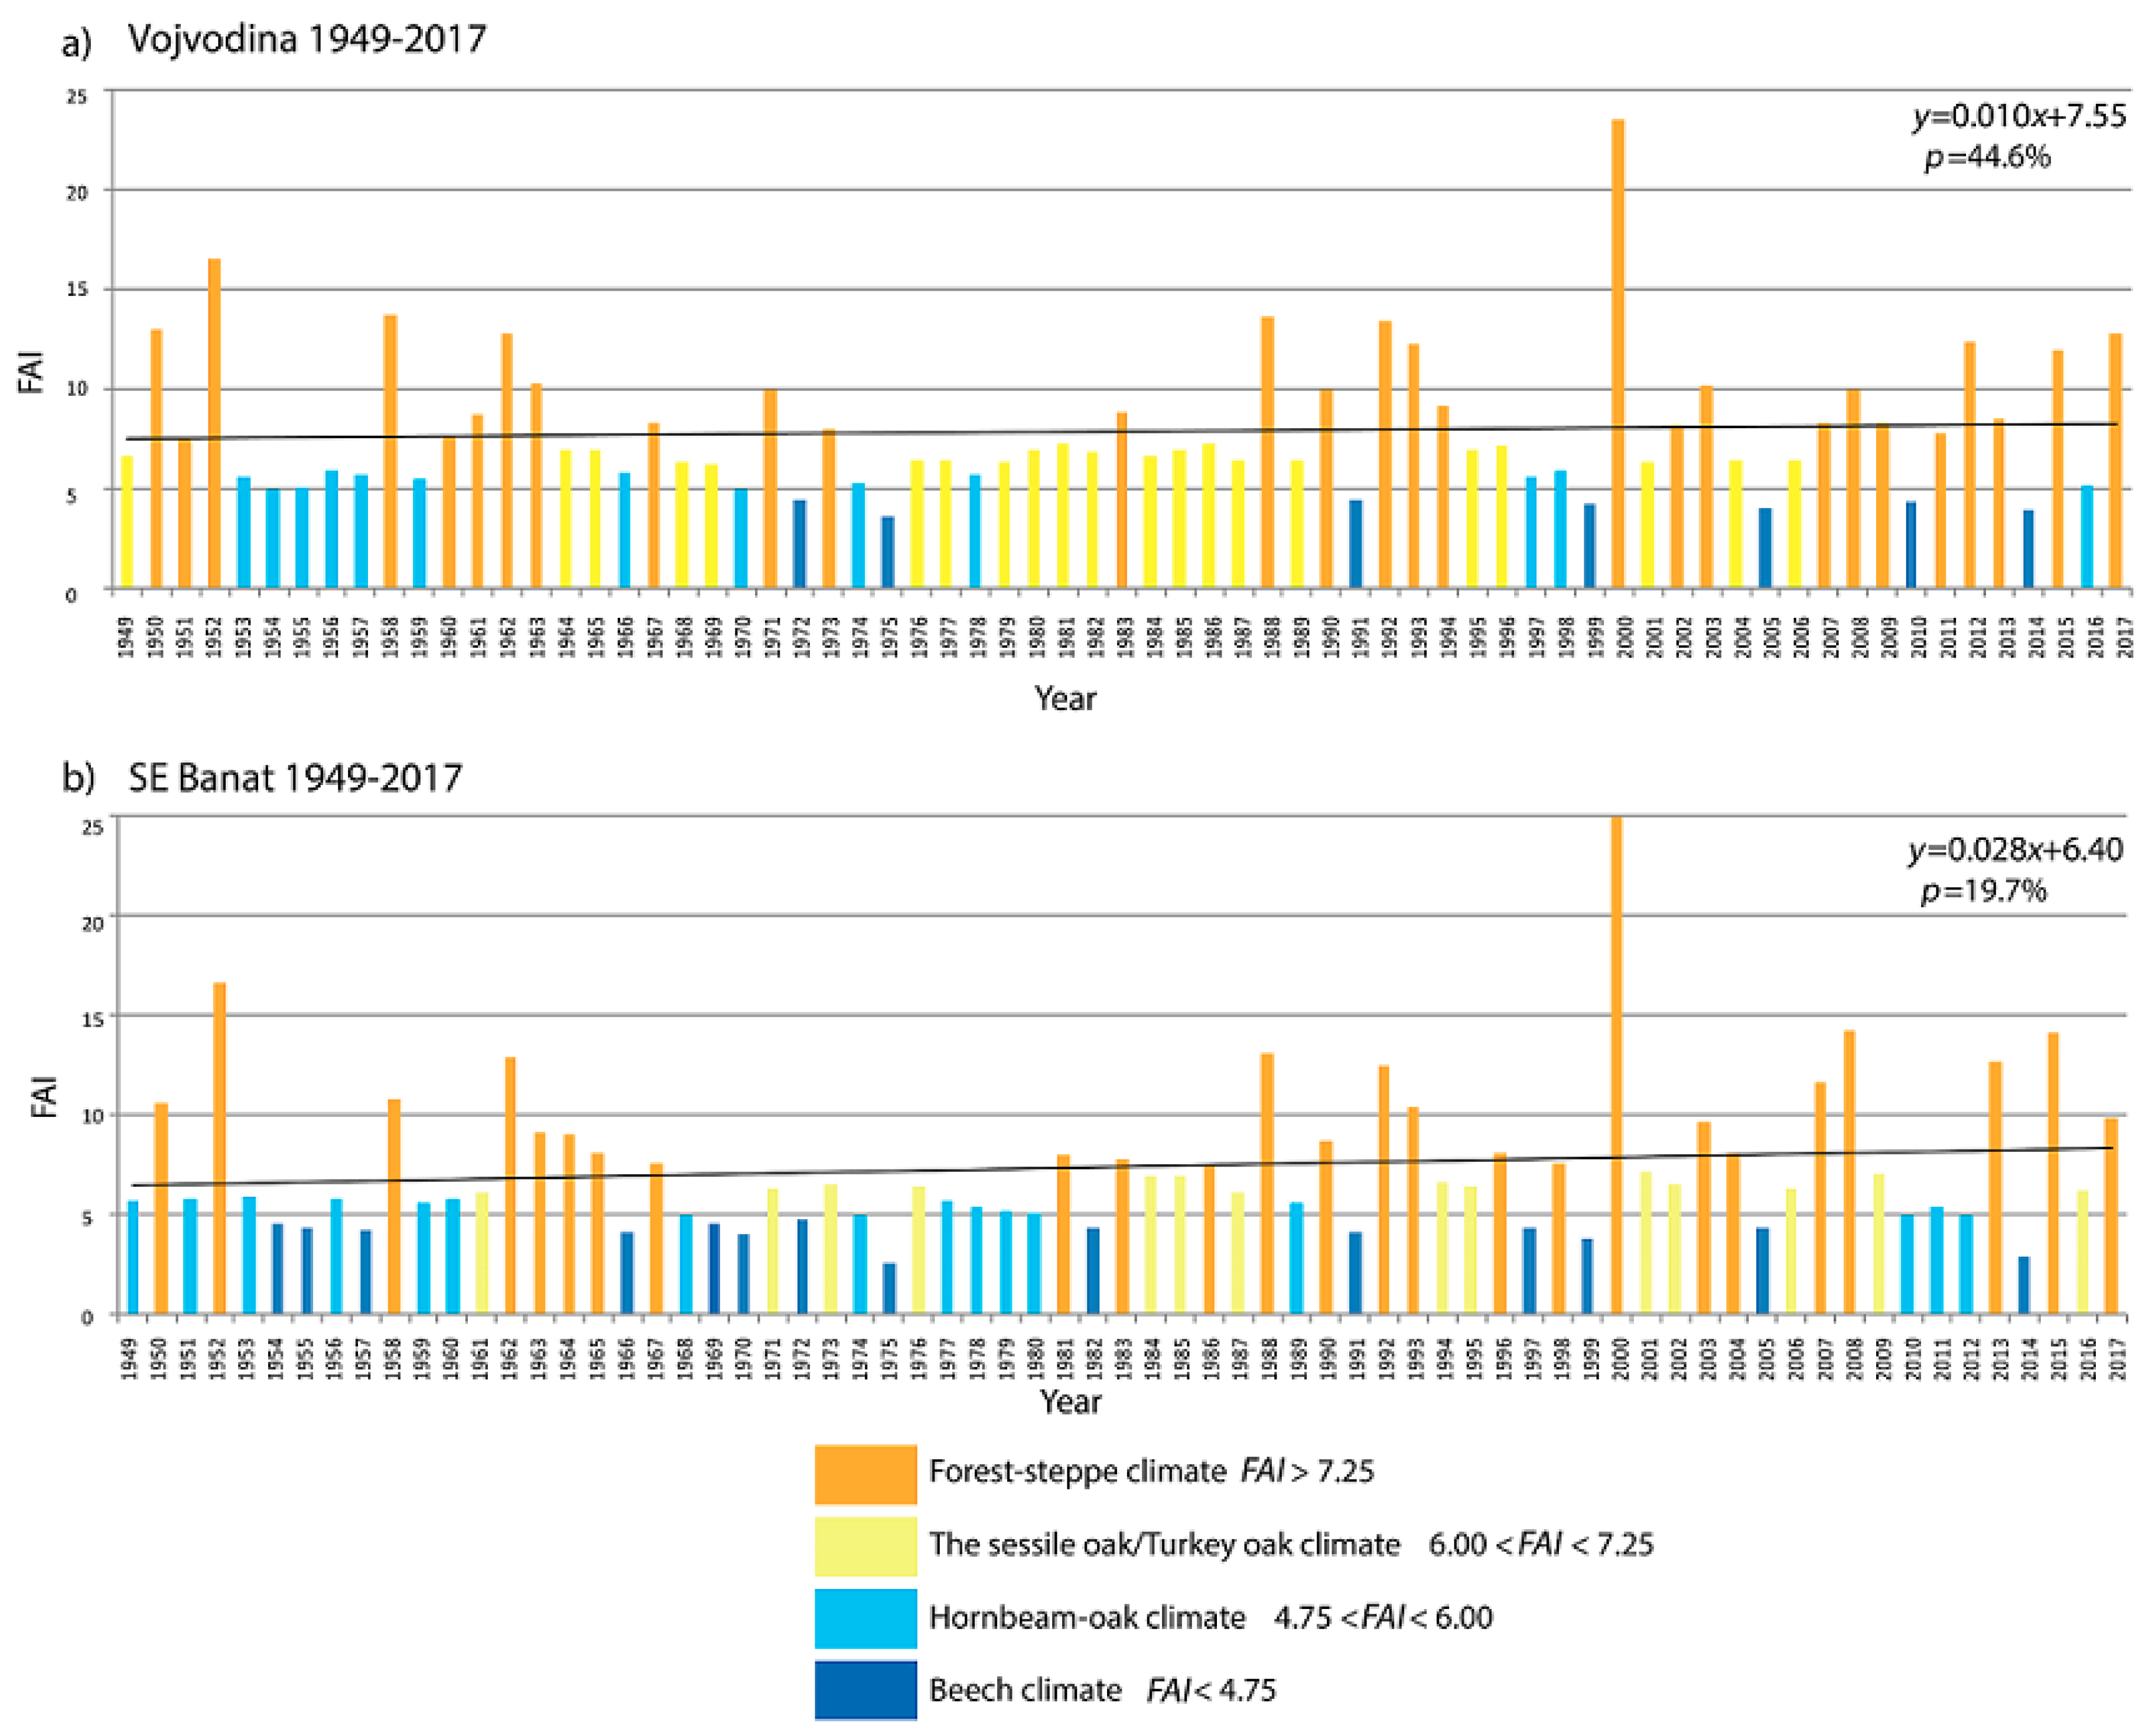
3.2. Forestry Aridity Index

The annual value of the Forestry Aridity Index, FAI, by Führer et al. [31] is defined as
F A I =   C g × T V I I V I I I ( P V V I I + P V I I V I I I ) ,
where T V I I   V I I I is the average temperature in July and August in °C, P V V I I is the precipitation total in the period from May to July, and P V I I V I I I is the precipitation total for the period of July–August, both in mm, and Cg = 100 mm/°C is the constant. By introducing the constant Cg with dimensions [33], FAI lost its dimensions and became a “true” index, i.e., a non-dimensional number. With this modification in the dimensions of the constant, Cg, the FAI has a better physical basis, and the interpretation of the results will not change.
The FAI and the average weather conditions of four different climate categories, as applied in forestry practice, are shown in Table 2. Unlike the De Martonne Aridity Index, in this case, humidity rises with a decrease in the value of FAI and vice versa. Using Equation (3), we supplemented the database with the time series of FAI for each meteorological station.
In [32], it is shown that the lowest FAI values (high humidity) are spread throughout SE Banat, where the largest forest area in the Vojvodina region is found. It seems that the FAI can be a very good tool for presenting climate conditions during annual forest growth, something particularly important for those involved in forestry and agriculture.

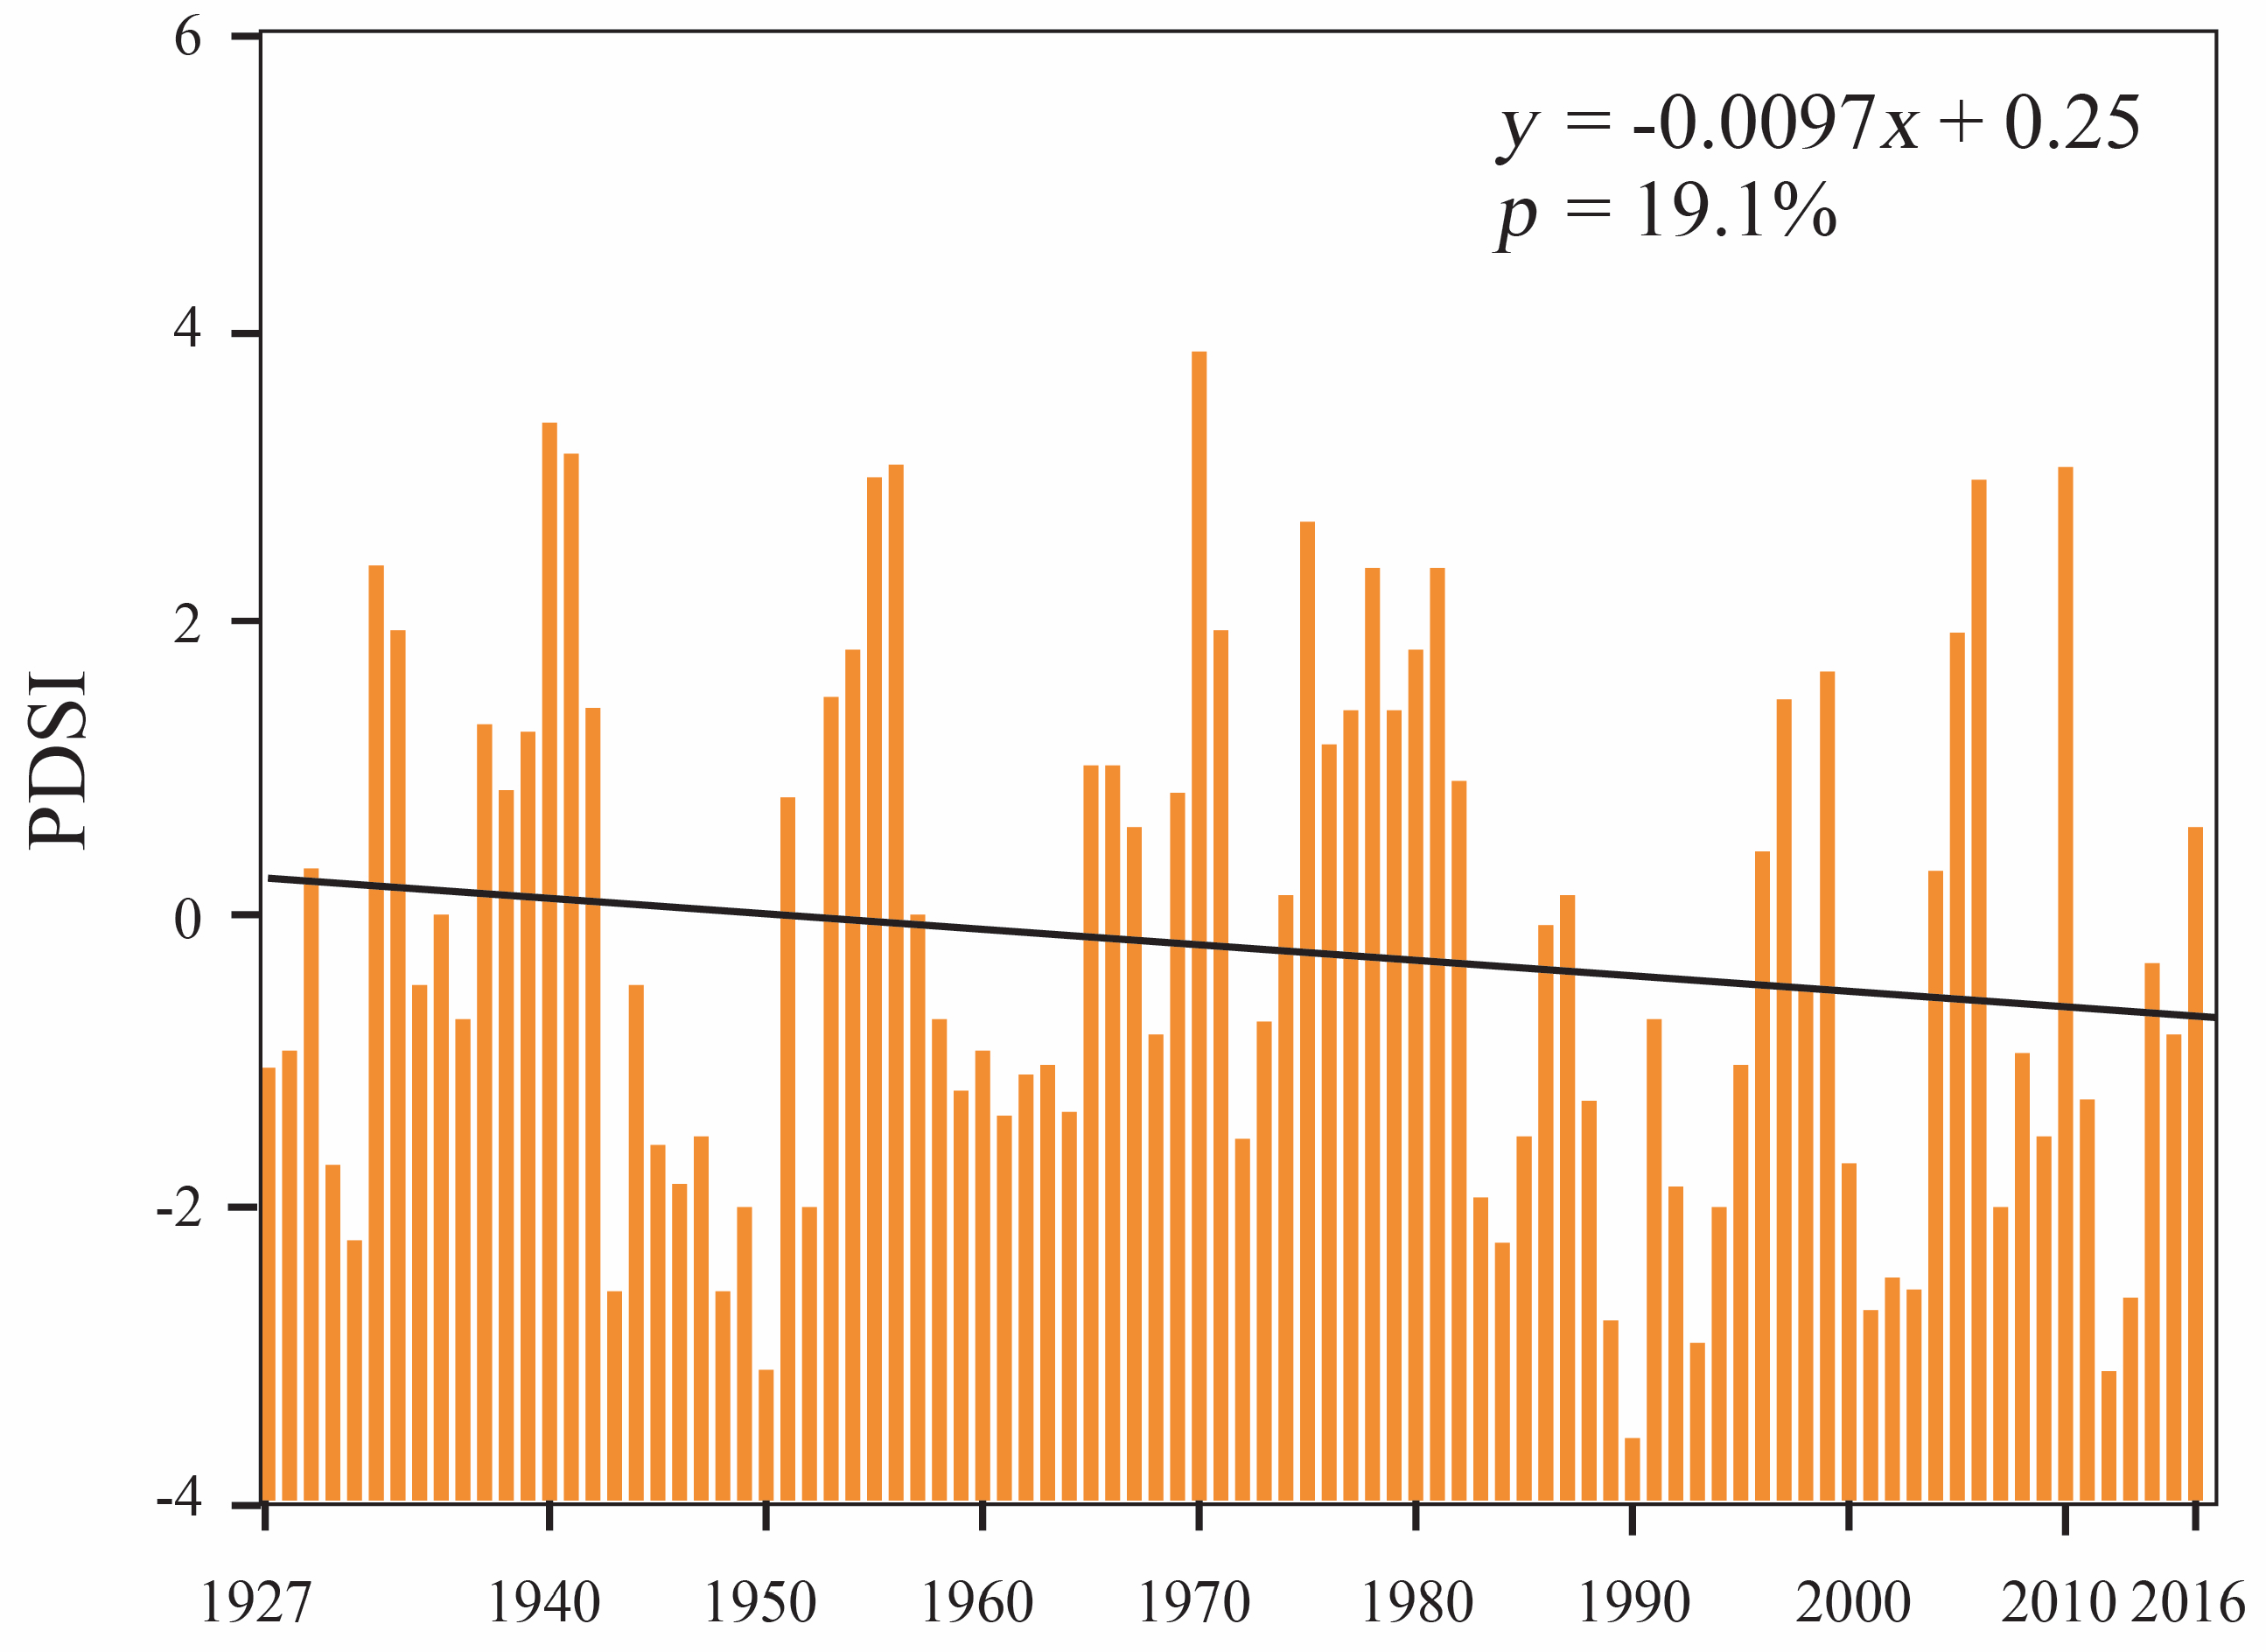
3.3. The Palmer Drought Severity Index

The Palmer Drought Severity Index, PDSI, is a drought index based on a soil water balance equation [22], which measures the balance between moisture demand (evapotranspiration being driven by temperature) and moisture supply (precipitation). Values being taken into account in the calculation of the PDSI include monthly precipitation, potential, and actual evapotranspiration, infiltration of water into a given soil zone and runoff. The related equation is as follows:
X t   =   p   × X t 1 + q   × Z t ,
where Xt and Xt-1 are PDSI values for the actual and previous month, respectively. The p (0.897) and q (1/3) are coefficients or duration factors, demonstrating how sensitive the PDSI is to the monthly moisture anomaly Zt and how much autocorrelation the PDSI has. The detailed calculation of PDSI can be found in Palmer [22] and Dai [53].

3.4. The Tree Ring Width Index

After air-drying and sanding, the tree ring samples were processed following standard dendrochronological practices [54]. After rigorous cross-dating, the tree ring widths were measured under a binocular stereoscope using a LINTAB 6 measuring table (Rinntech, Heidelberg, Germany; the precision of 0.01 mm), after which we checked the quality of the cross-dating using the COFECHA method [55]. The measurements taken showed that there were no missing rings in the tree ring samples. The tree ring width measurements were standardized by detrending, in order to remove the effects of biological growth trends (e.g., the juvenile effect) as well as other low-frequency variations that result from stand dynamics. All series were conservatively detrended using a negative exponential function or a linear regression function with a negative slope. All detrended series were averaged to produce the final chronology by calculating bi-weighted, robust means to reduce the influence of outliers [56]. Variance stabilization was applied to minimize the effect of differences in the sample size over time, following the methods of Osborn et al. [57]. The standardization of ring-width data and the construction of the chronology were performed using ARSTAN (AutoRegressive STANdardization) method [56]. The reliability of the chronology was evaluated via the inter-series correlation coefficient (Rbar) and the expressed population signal (EPS) [58]. Both Rbar and EPS were computed for a 30-year period, with a 15-year lag. In order to determine the most reliable period within the chronology, we used a threshold of EPS > 0.85 [58]. To retain more of the low-frequency climatic information, we used the standard chronology to detect the tree growth responses to climate parameters.
The statistical characteristics of our standardized chronology are summarized in Table 3. Beginning in 1920, the EPS value for ring width was greater than 0.85. The mean inter-series correlation coefficient was 0.40, indicating a sensitive measurement series where the tree ring samples contained a high degree of common climatic signals [59], and can therefore provide useful information on climate change in the location being studied.

3.5. Data Analysis

For data analysis, (a) the linear trend, as an indicator of the recent change in values, was used, (b) as an indicator of the link of different values, the correlation coefficient was used, and (c) in some cases, to determine their similarity, time series were directly graphically compared.
For analyzing the trends of the IaDM, FAI, PDSI, and TRWI, as well as the mean annual surface air temperatures, Ta, and the annual amount of precipitation, Pa, three statistical approaches were used. These are: (i) the tendency (trend) equation, (ii) the Mann–Kendall (MK) test, and (iii) the trend magnitude.
The tendency (trend) equation was calculated and plotted for each time series using linear interpolation [60]. This approach yields results, on the basis of the slope and the coefficient direction of the trend equation, which are simple to interpret, both analytically and graphically. In this kind of interpretation, where the slope (and the coefficient direction of the trend equation) is greater than zero, less than zero or equal to zero, the sign of the trend is positive (increasing), negative (decreasing) or there is no trend (no change), respectively.
The MK test is used [61,62,63,64] for estimating all trends. According to the MK test, two hypotheses were tested: the null hypothesis, H0, that there is no trend in the time series; and the alternative hypothesis, Ha, that there is a significant trend in the time series, for a given α significance level [65]. Probability, p, was calculated in percentages [42,43,66,67] in order to determine the level of confidence in the hypothesis. If the computed value p is lower than the chosen significance level α (e.g., α = 5%), then H0 (there is no trend) should be rejected, and the Ha (there is a significant trend) should be accepted. In cases where p is greater than the significance level α, H0 (there is no trend) cannot be rejected.
MK tests are used widely in the environmental sciences, assisting in measurements and analyses of temperature, precipitation, sunshine hours, cloud cover, relative humidity and wind speed [68]; temperature and precipitation [66]; precipitation [69]; extreme temperatures [42,43,67,70]; hail [71,72,73,74]; aridity [17,18,19,32,75]; evapotranspiration [76]; and atmospheric deposition [77]. MK tests are simple, robust, and can cope with missing values. The MK test is a non-parametric test that does not provide explicit information on the statistical significance of the parametric approach of linear regression trends.
Trend magnitude is defined as the difference in values between the beginning and ending of a period for which a trend equation is being calculated, and that has been obtained through the use of a linear trend equation [42,43]. With regards to the trend magnitude, we noted the following: the trend magnitude increases with the increase of this difference in values, and, conversely, decreases with the decrease of this difference in values. Likewise, the sign of the difference can determine the trend sign, for when the difference is greater than zero, less than zero, or equal to zero, the sign of the trend is negative (decrease), positive (increase), or there is no trend (no change).
Here, the magnitude trend will not be used for direct trend estimation but will instead be used to estimate the influence of the trend magnitudes of temperature and precipitation on the aridity trend.

3.6. Software

The mean surface air temperatures, amount of precipitation, DM aridity indices, trend equations, and linear trend lines were computed and plotted for each time series, using the program Microsoft Excel (v. 2010, Seattle, WA, USA). Results were interpolated and mapped by Kriging method, using the ArcMap. For calculating the probability, p, and hypothesis testing, XLSTAT’s statistical analysis software was used [78].

4. Results

4.1. Annual Distributions and Trends

4.1.1. The De Martonne Aridity Index

The distribution of the mean annual De Martonne Aridity Index, IaDM, and its trend for the Vojvodina region and SE Banat region, during the period 1949–2017, are presented in Figure 2.
The graphs and equations in Figure 2a,b shows that the IaDM trends are positive. As both values of p (87.2% and 74.4%) are greater than α (5%), H0 (there is no trend) cannot be rejected according to the MK test. The risks of rejecting H0 while it is true are 87.2% and 74.4%. The presented values, when referencing the mean annual De Martonne Aridity Index, IaDM, suggest that there are no changes in aridity in Vojvodina and SE Banat in the investigated period 1949–2017.
It should be noted that the minimum values of the IaDM for both the Vojvodina (12.70) territory and SE Banat (17.73) subregion were reached in 2000, while the maximum values for the Vojvodina territory (42.22) and SE Banat (42.68) subregion were reached in 2010 and 2014, respectively. It appears that, at the beginning of the 21st century, there existed a greater variation in aridity than in the previous century. All maximum and minimum values were recorded in this century, and so it appears that a semi-arid climate existed only in Vojvodina during the last century (1961).
The mean values of the IaDM for Vojvodina and SE Banat are 28.55 and 28.56, respectively. Therefore, in both territories, the mean type of aridity climate is humid, but quite close to semi-humid, as the value of 28 is used to distinguish these two types.

4.1.2. The Forestry Aridity Index

The distribution of the mean annual Forestry Aridity Index, FAI, and its trend for Vojvodina and SE Banat, for the period 1949–2017, are presented in Figure 3.
Yet again, we can see that both FAI trends are positive. As both values of p (44.6% for Vojvodina and 19.7% for SE Banat) are greater than α (5%), H0 (there is no trend) cannot be rejected. The presented values, when referencing the mean annual Forestry Aridity Index, FAI, suggests that there are no aridity changes in Vojvodina and SE Banat in the investigated period 1949–2017.
It should be noted that extreme values of the FAI for both the Vojvodina territory and the SE Banat subregion (maximums being 23.30 and 24.90, and minimums being 3.73 and 2.45) were reached in the same years, 2000 and 1975, respectively.

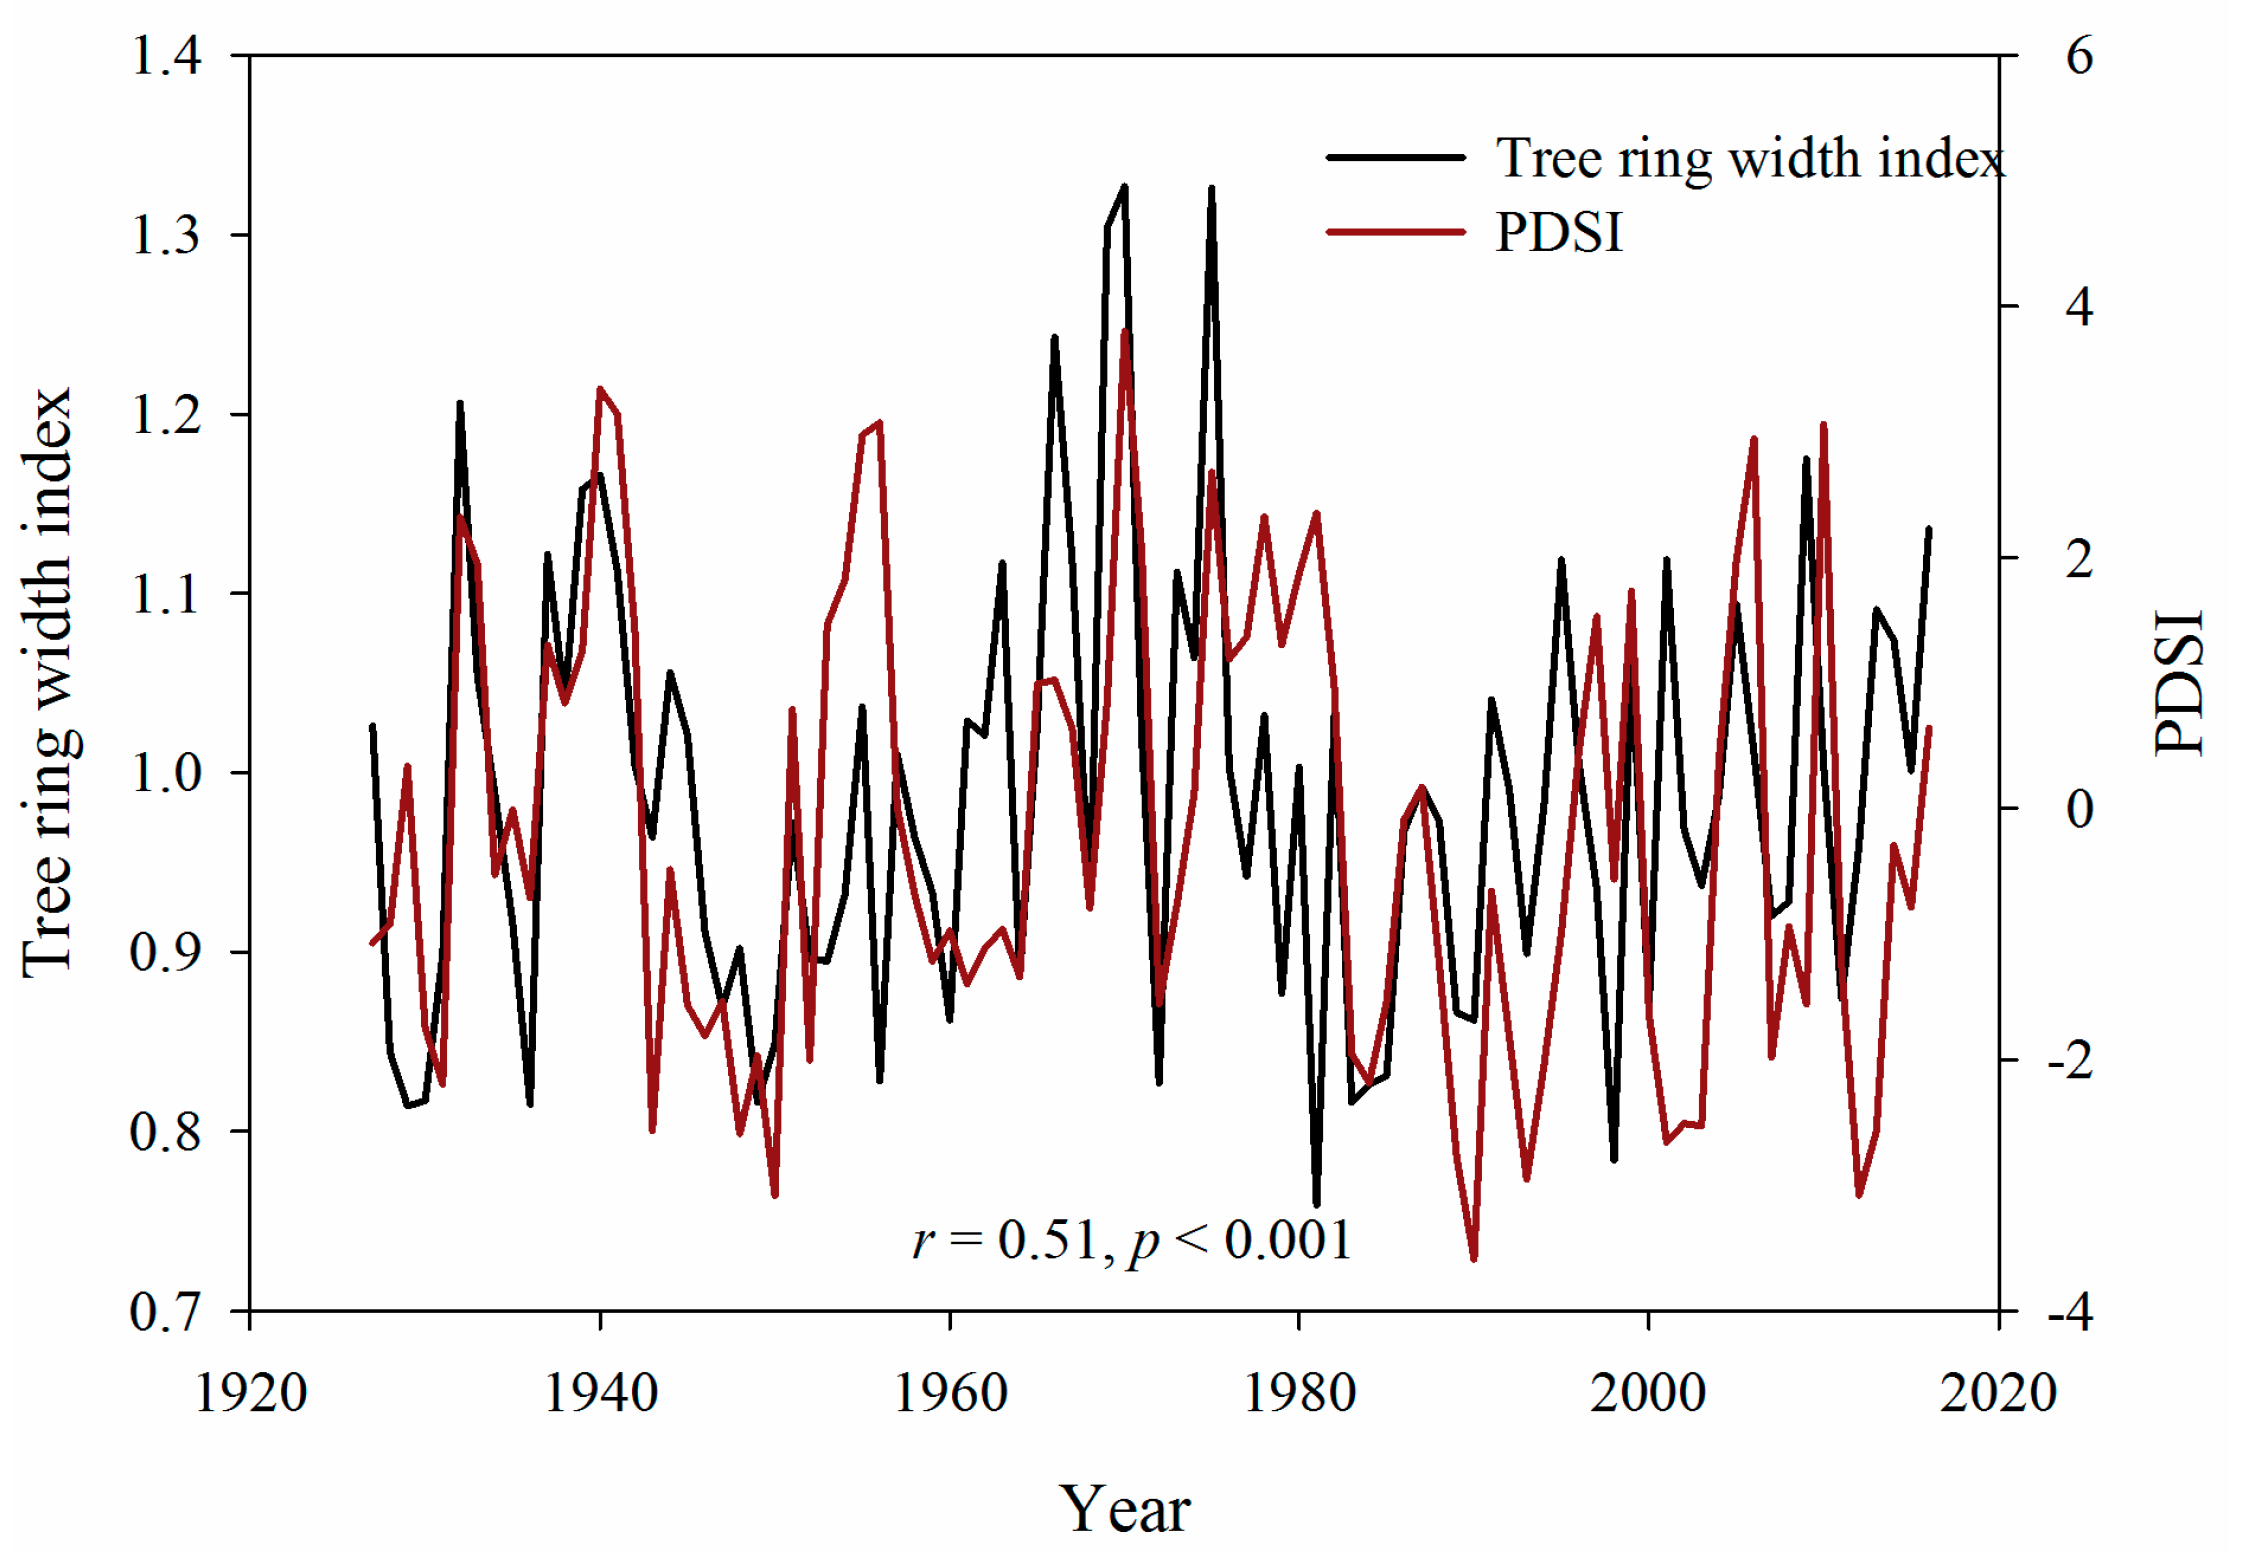
4.1.3. The Palmer Drought Severity Index

The distribution and trend of the Palmer Drought Severity Index, PDSI, for the lat–long point (21° E, 45° N), representing the regions of SE Banat and Vojvodina in the period 1927–2016 are presented in Figure 4.
As indicated, the PDSI trend is negative. Since the computed probability value p of PDSI (19.1%) is higher than the significance level, α (5%), H0 (there is no trend) should be accepted. It indicates that there is no significant PDSI trend for SE Banat and Vojvodina.
The average value of PDSI is approximately 0.0. Around this value, the annual values within the extremes that were recorded in 1970 (PDSImax~4.00) and 1990 (PDSImin~–3.75), seemingly vary chaotically.

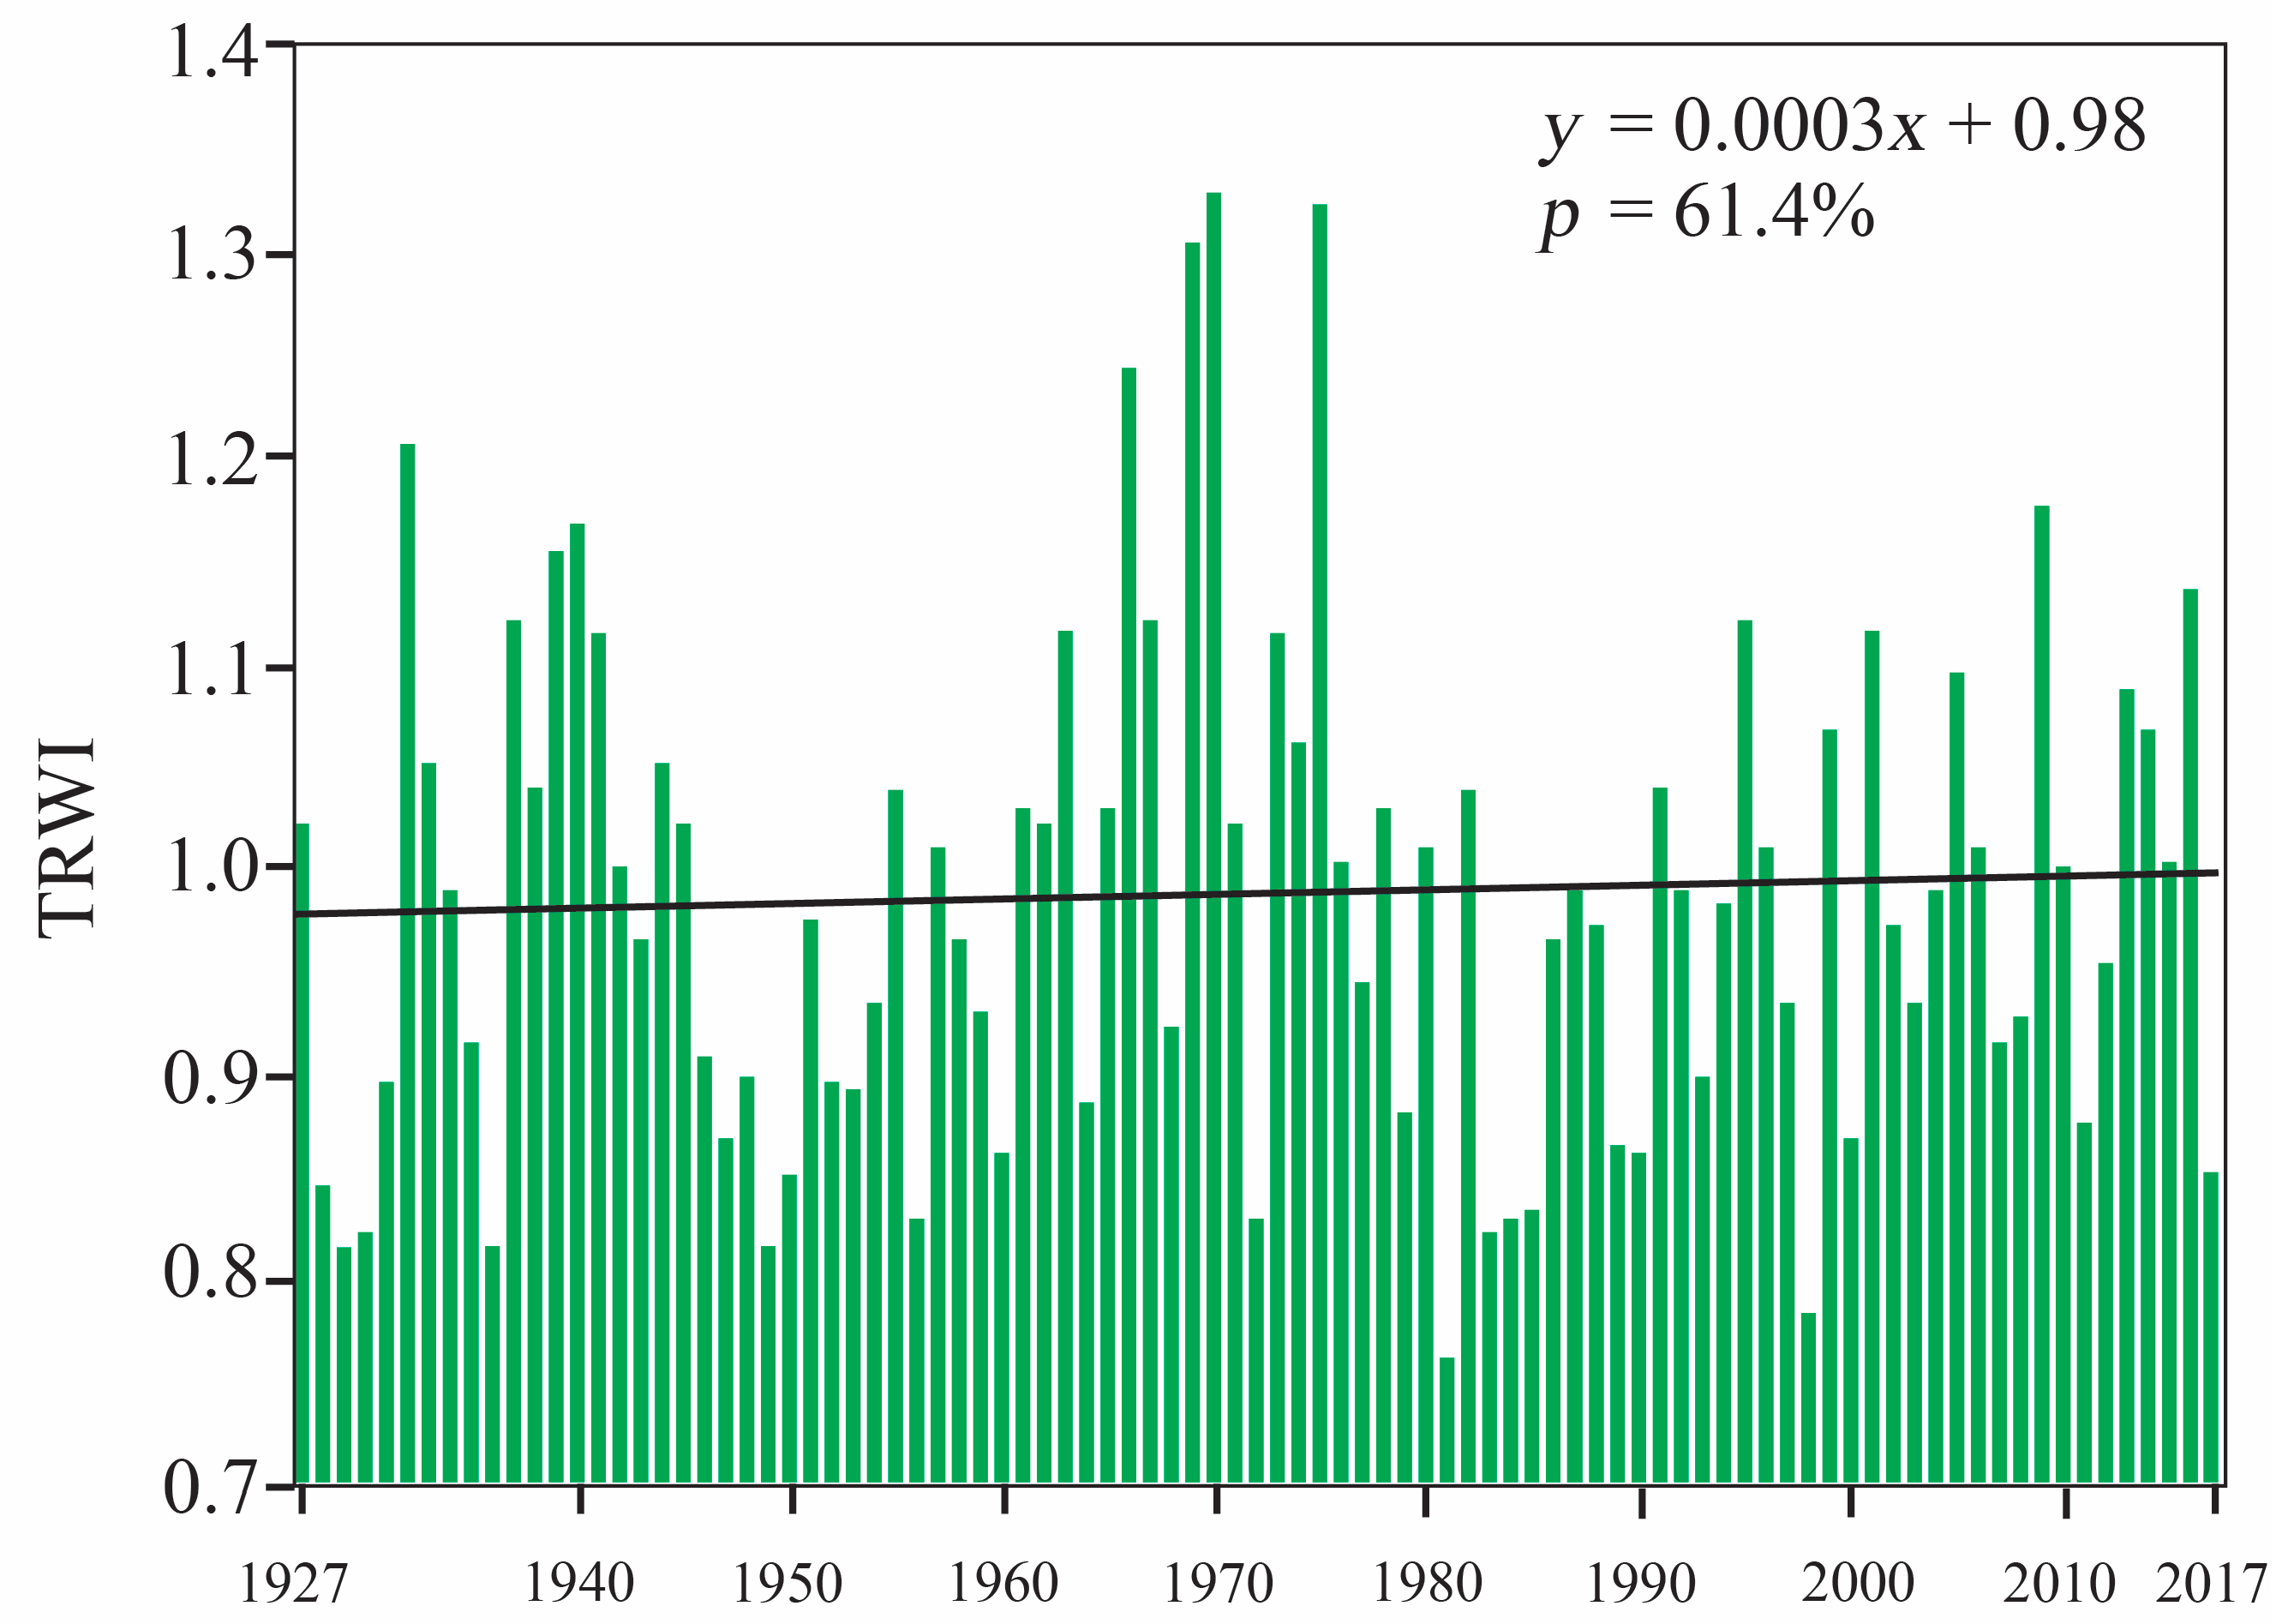
4.1.4. The Tree Ring Width Index

The annual distribution and trend of the Tree Ring Width Index, TRWI, for SE Banat, in the period 1927–2017, are presented in Figure 5.
The results suggest that the TRWI trend is positive. The computed probability values p of TRWI is 61.4%, which is higher than the significance level, α (5%). Therefore, H0 (there is no trend) should be accepted. The values indicate that there is no significant TRWI trend for SE Banat.
The annual values of TRWI oscillate around the mean value (~1.00) ranging from ~0.75 to ~1.34, while marked increases in TRWI values are observed in the 1960s and 1970s.

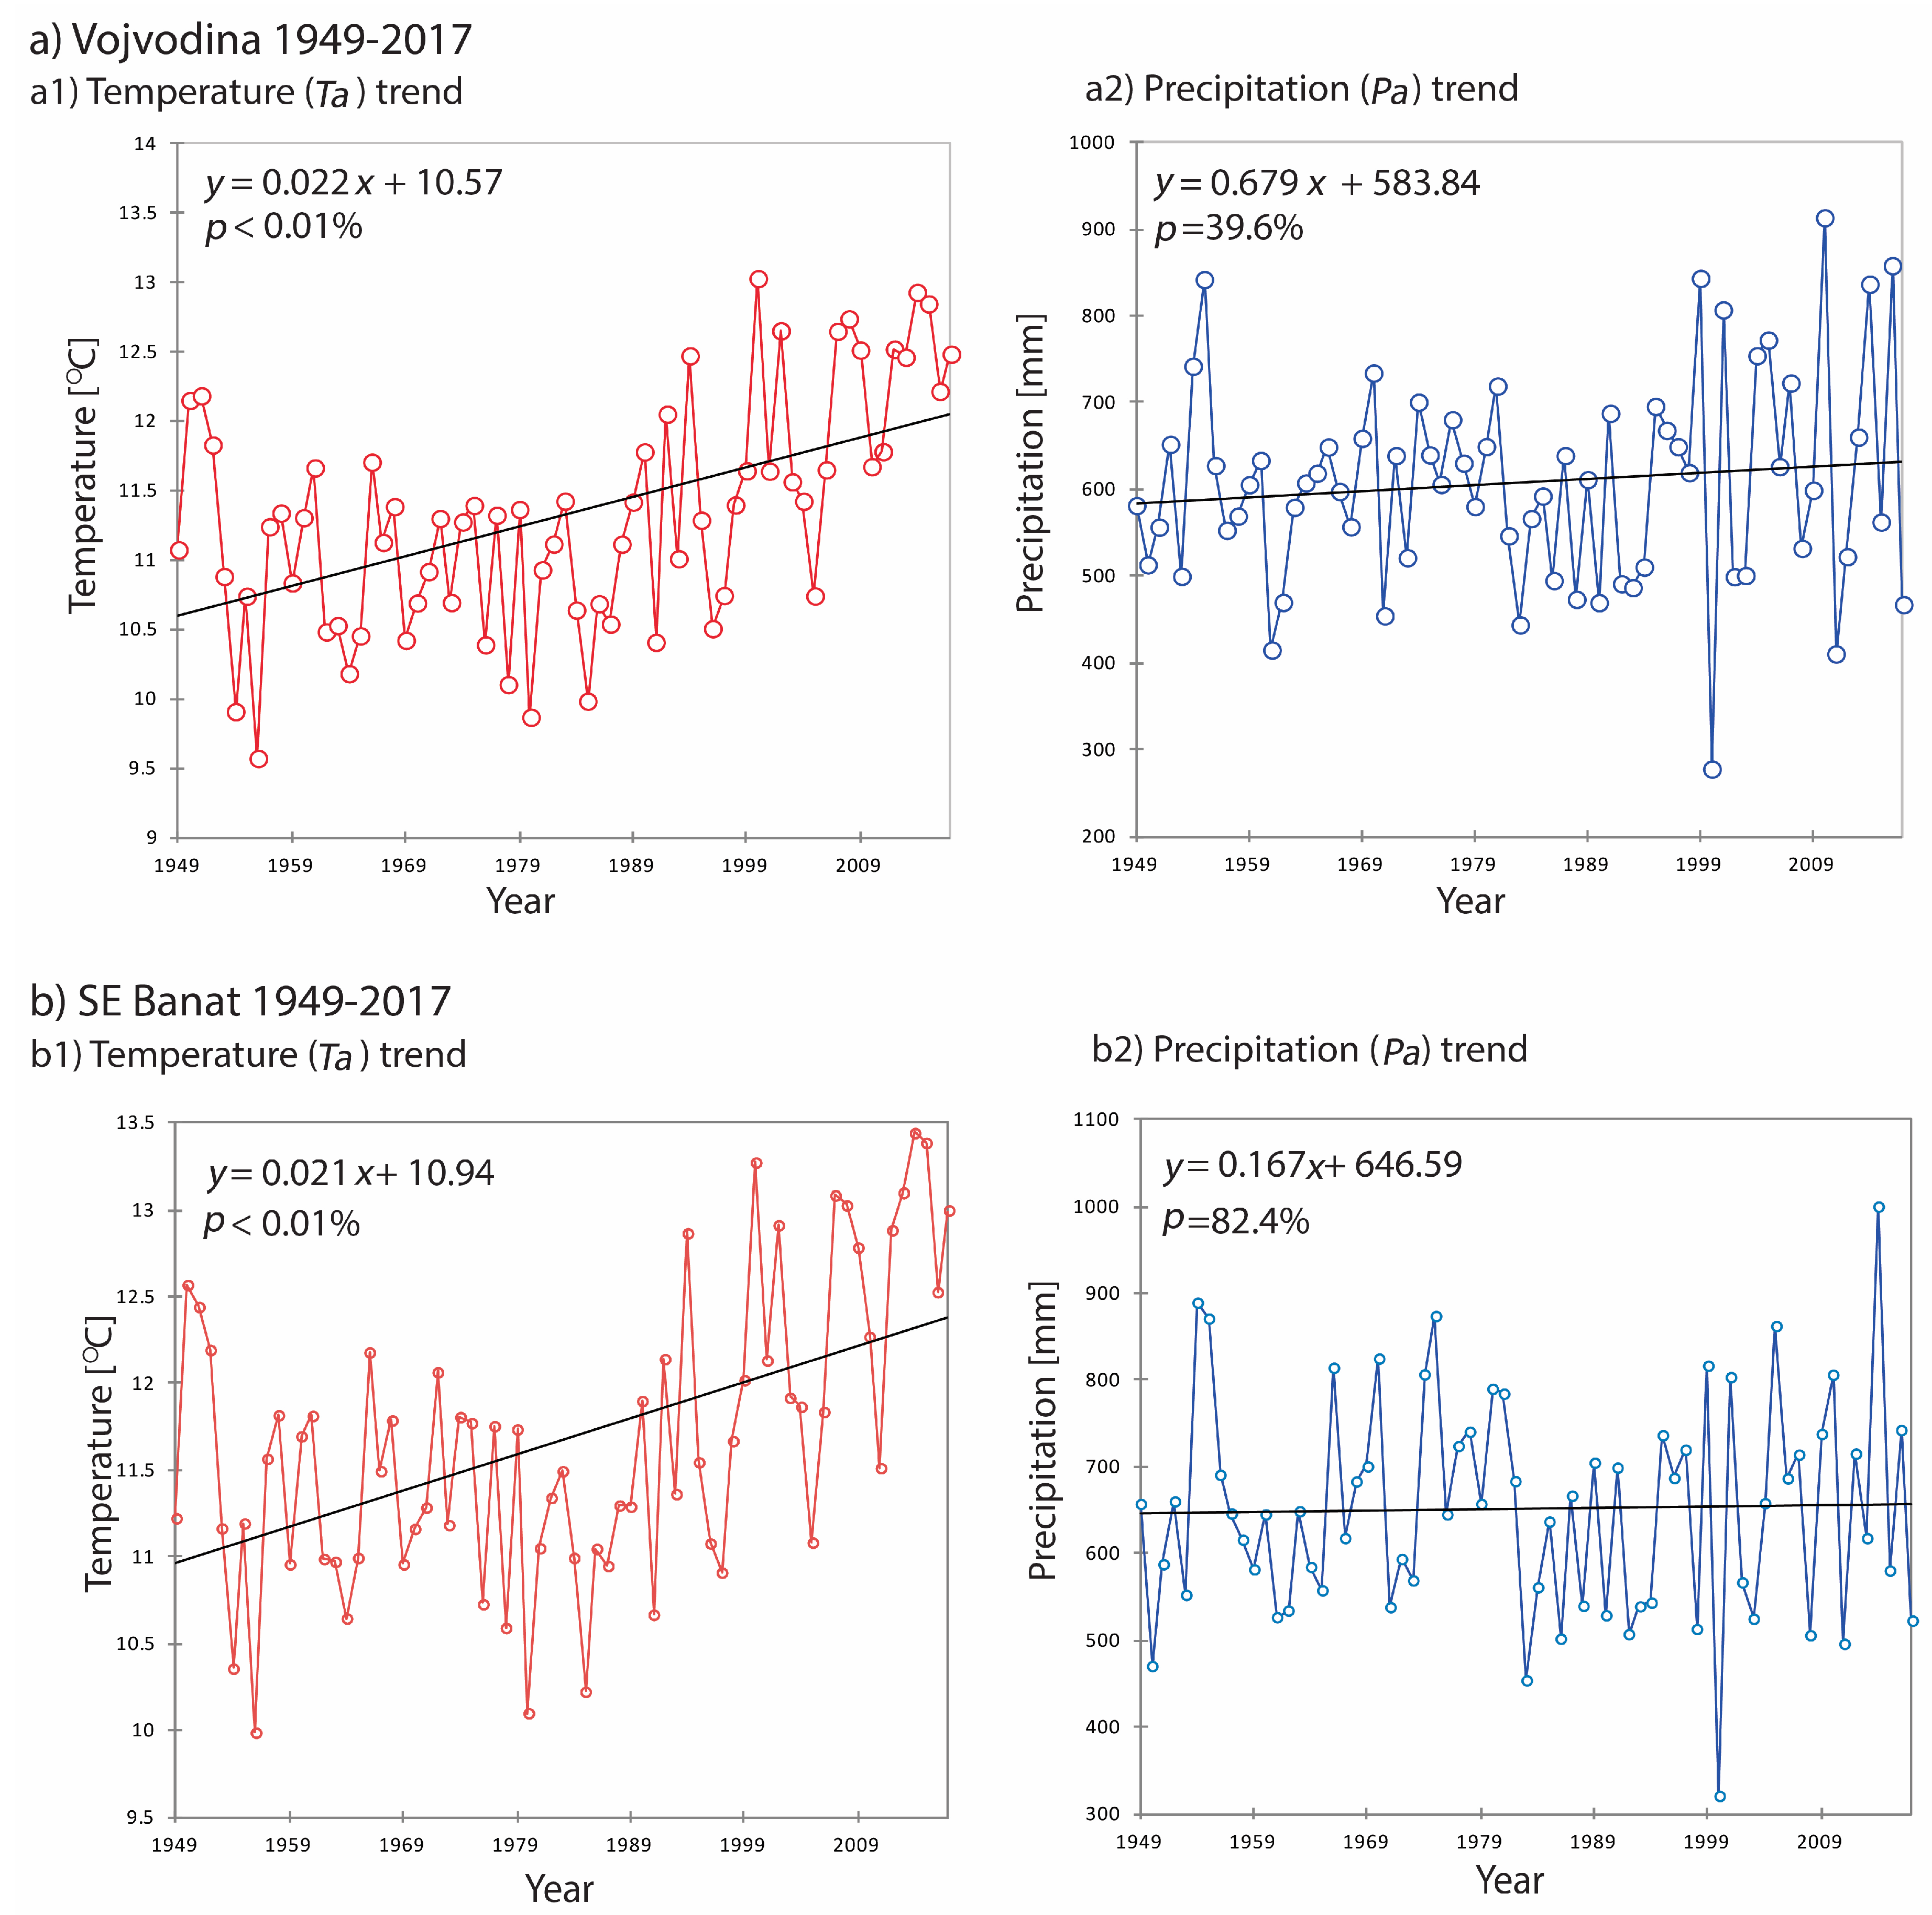
4.1.5. Temperature and Precipitation

The distribution of the mean annual temperature, Ta, and the mean annual amount of precipitation, Pa, for Vojvodina and the SE Banat, in the period 1949–2017, are presented in Figure 6.
Figure 6(a1,b1) shows that Ta trends are positive. Since the computed probability values p of the Ta for Vojvodina (0.01%) and SE Banat (0.01%) are lower than the significance level, α (5%), Ha (there is a significant trend) should be accepted. In accordance with the MK tests, Ta trends in Vojvodina and SE Banat are declared as significant positive trends.
Figure 6(a2,b2) shows that Pa trends are positive. As values p of Pa for Vojvodina (39.6%) and SE Banat (82.4%) are higher than α (5%), H0 (there is no trend) cannot be rejected. The results of the MK tests, when considering the mean annual amount of precipitation, Pa, suggest that there are no trends in precipitation in Vojvodina and SE Banat, in the period 1949–2017.
It should be noted that lowest values of the Ta for Vojvodina (9.6 °C) and SE Banat (9.9 °C) territories were reached in 1956, while the highest values of the Ta for Vojvodina (13.0 °C) and SE Banat (13.4) were reached in 2010 and 2014, respectively. The mean values of the Ta for Vojvodina and SE Banat are 11.3 °C and 11.7 °C during the period 1949–2017, respectively.
However, in both Vojvodina and SE Banat, in the instrumental period 1949–2017, significant positive temperature trends and an increase in temperatures by 1.5 °C and 1.4 °C, respectively, were calculated. These values were obtained on the basis of the definition of the trend magnitude.
The minimum and maximum of Pa, for the territory of Vojvodina, occurred in the years 2000 (278.1 mm) and 2010 (913.7 mm), respectively, while in SE Banat extreme values of Pa were reached in the years 2000 (321.0 mm) and 2014 (100.5 mm). The mean values of Pa for Vojvodina and SE Banat are 607.3 mm and 652.4 mm.

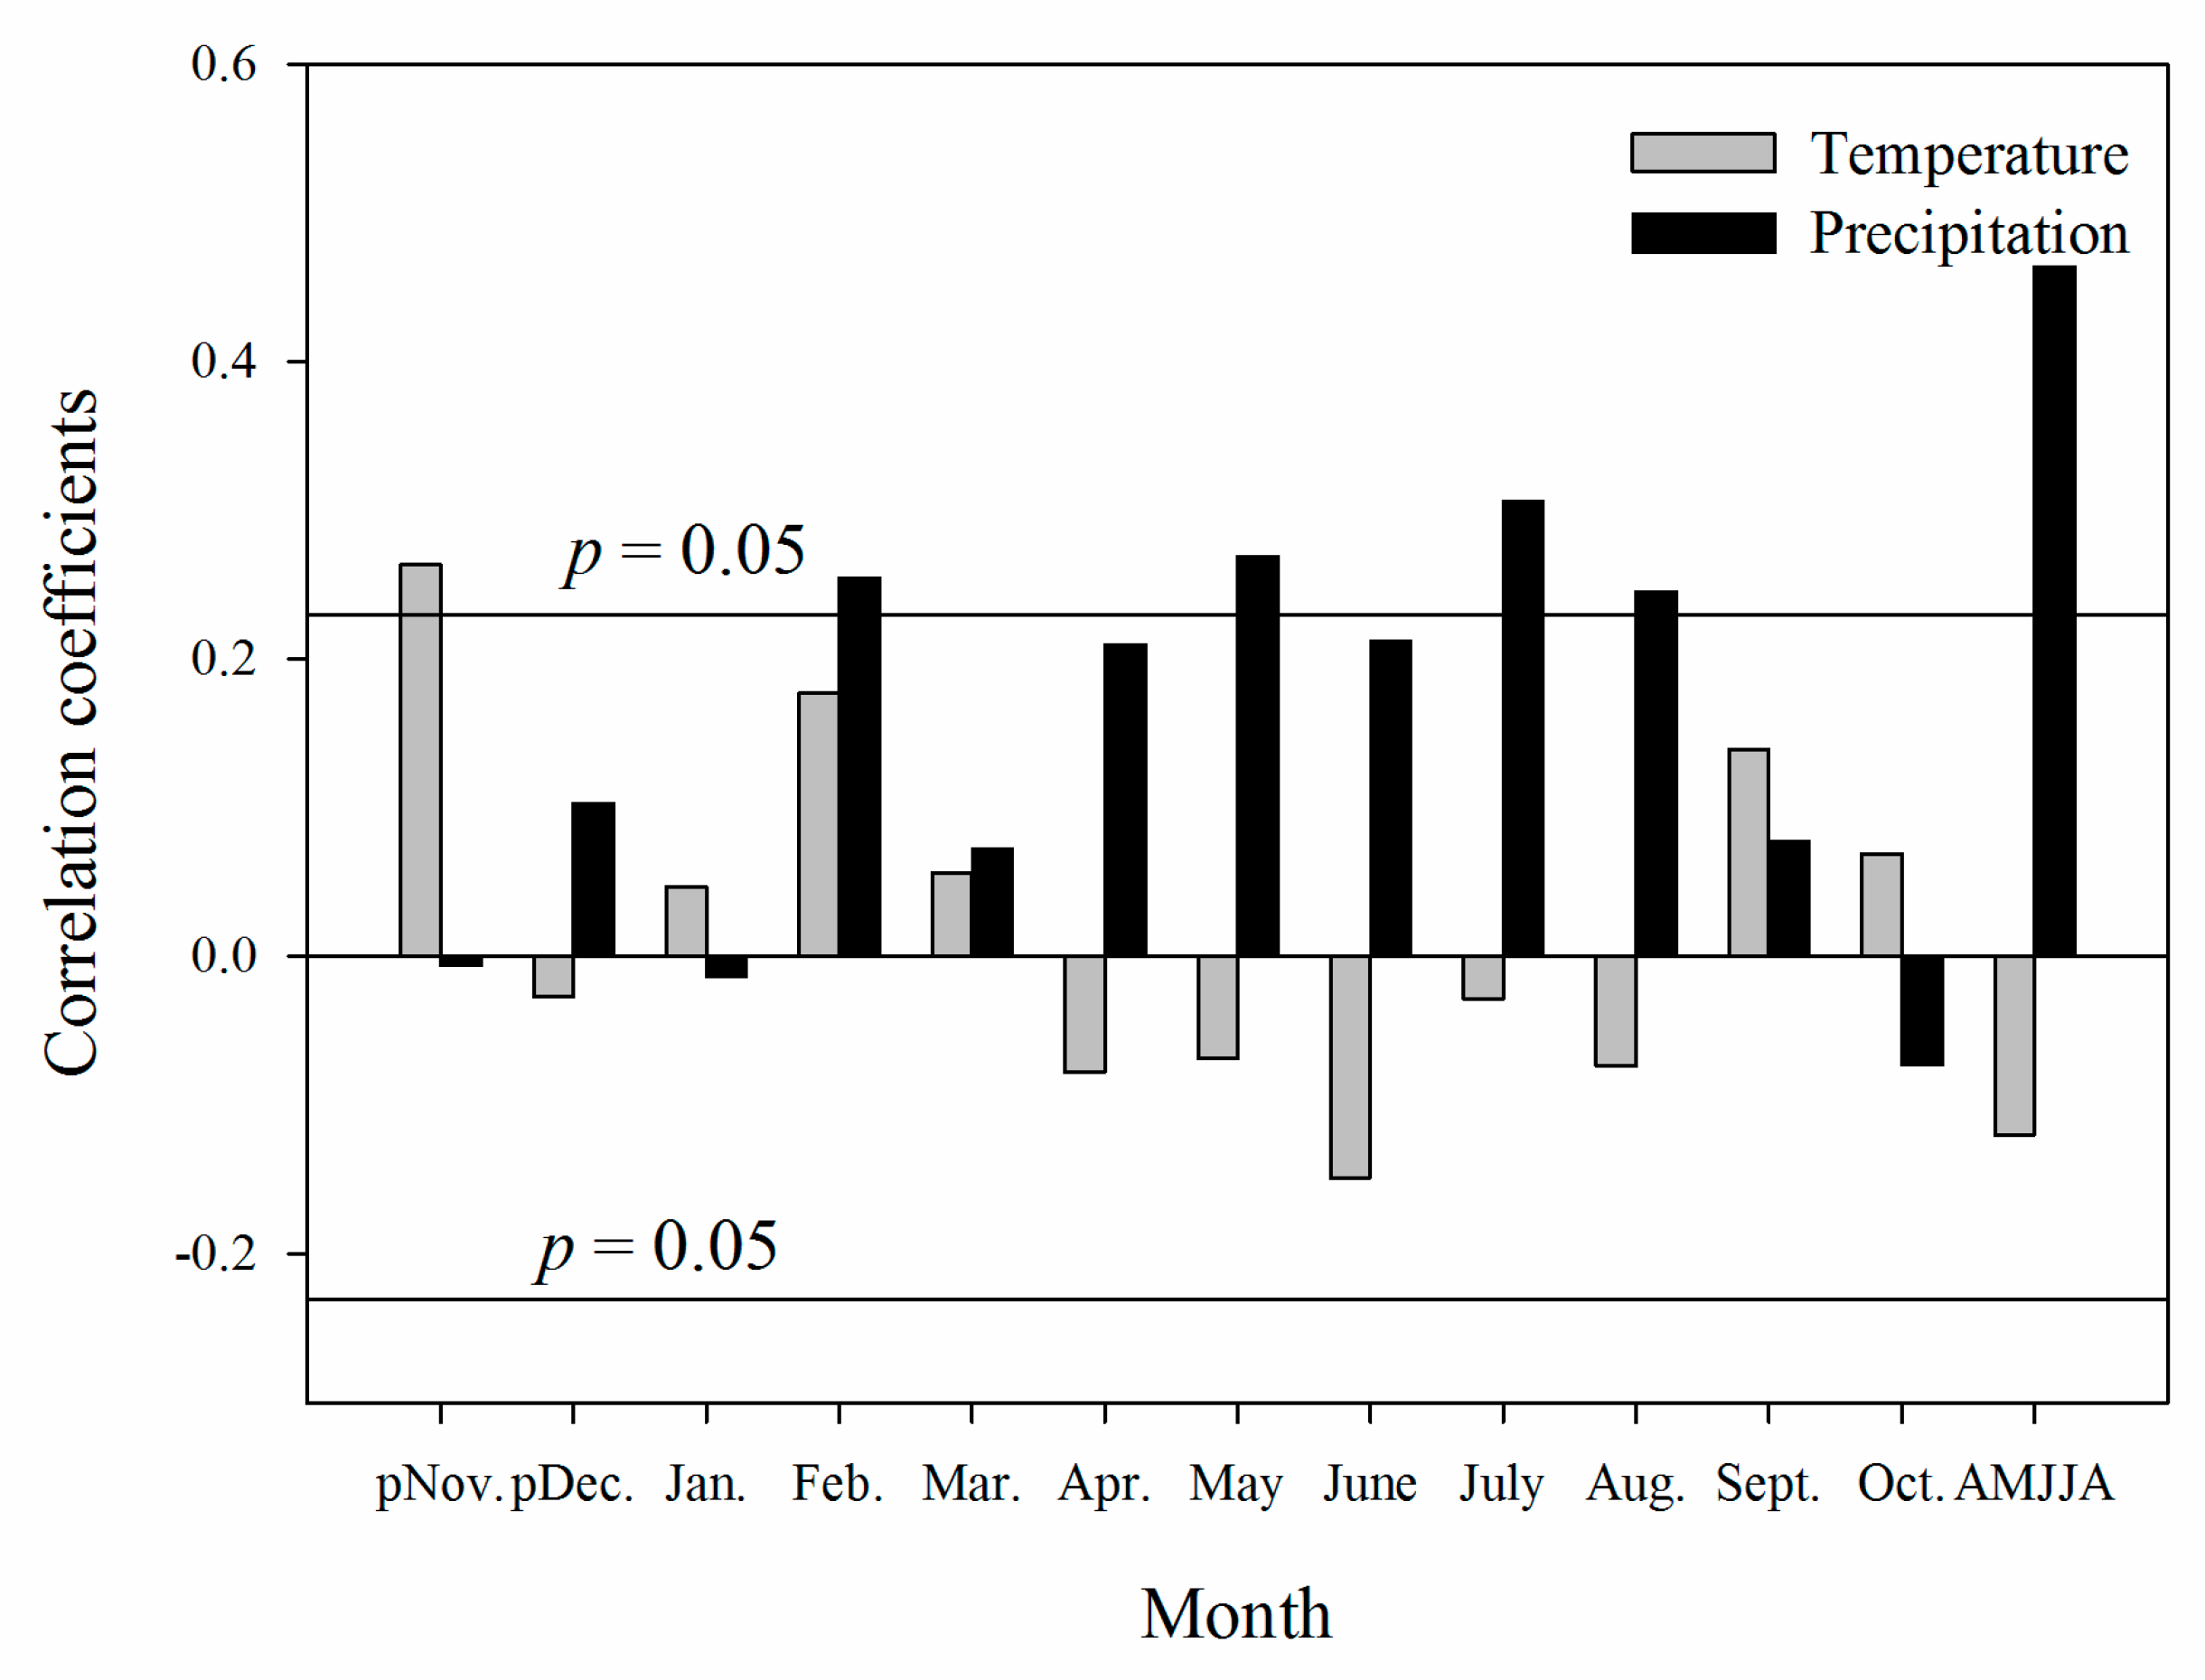
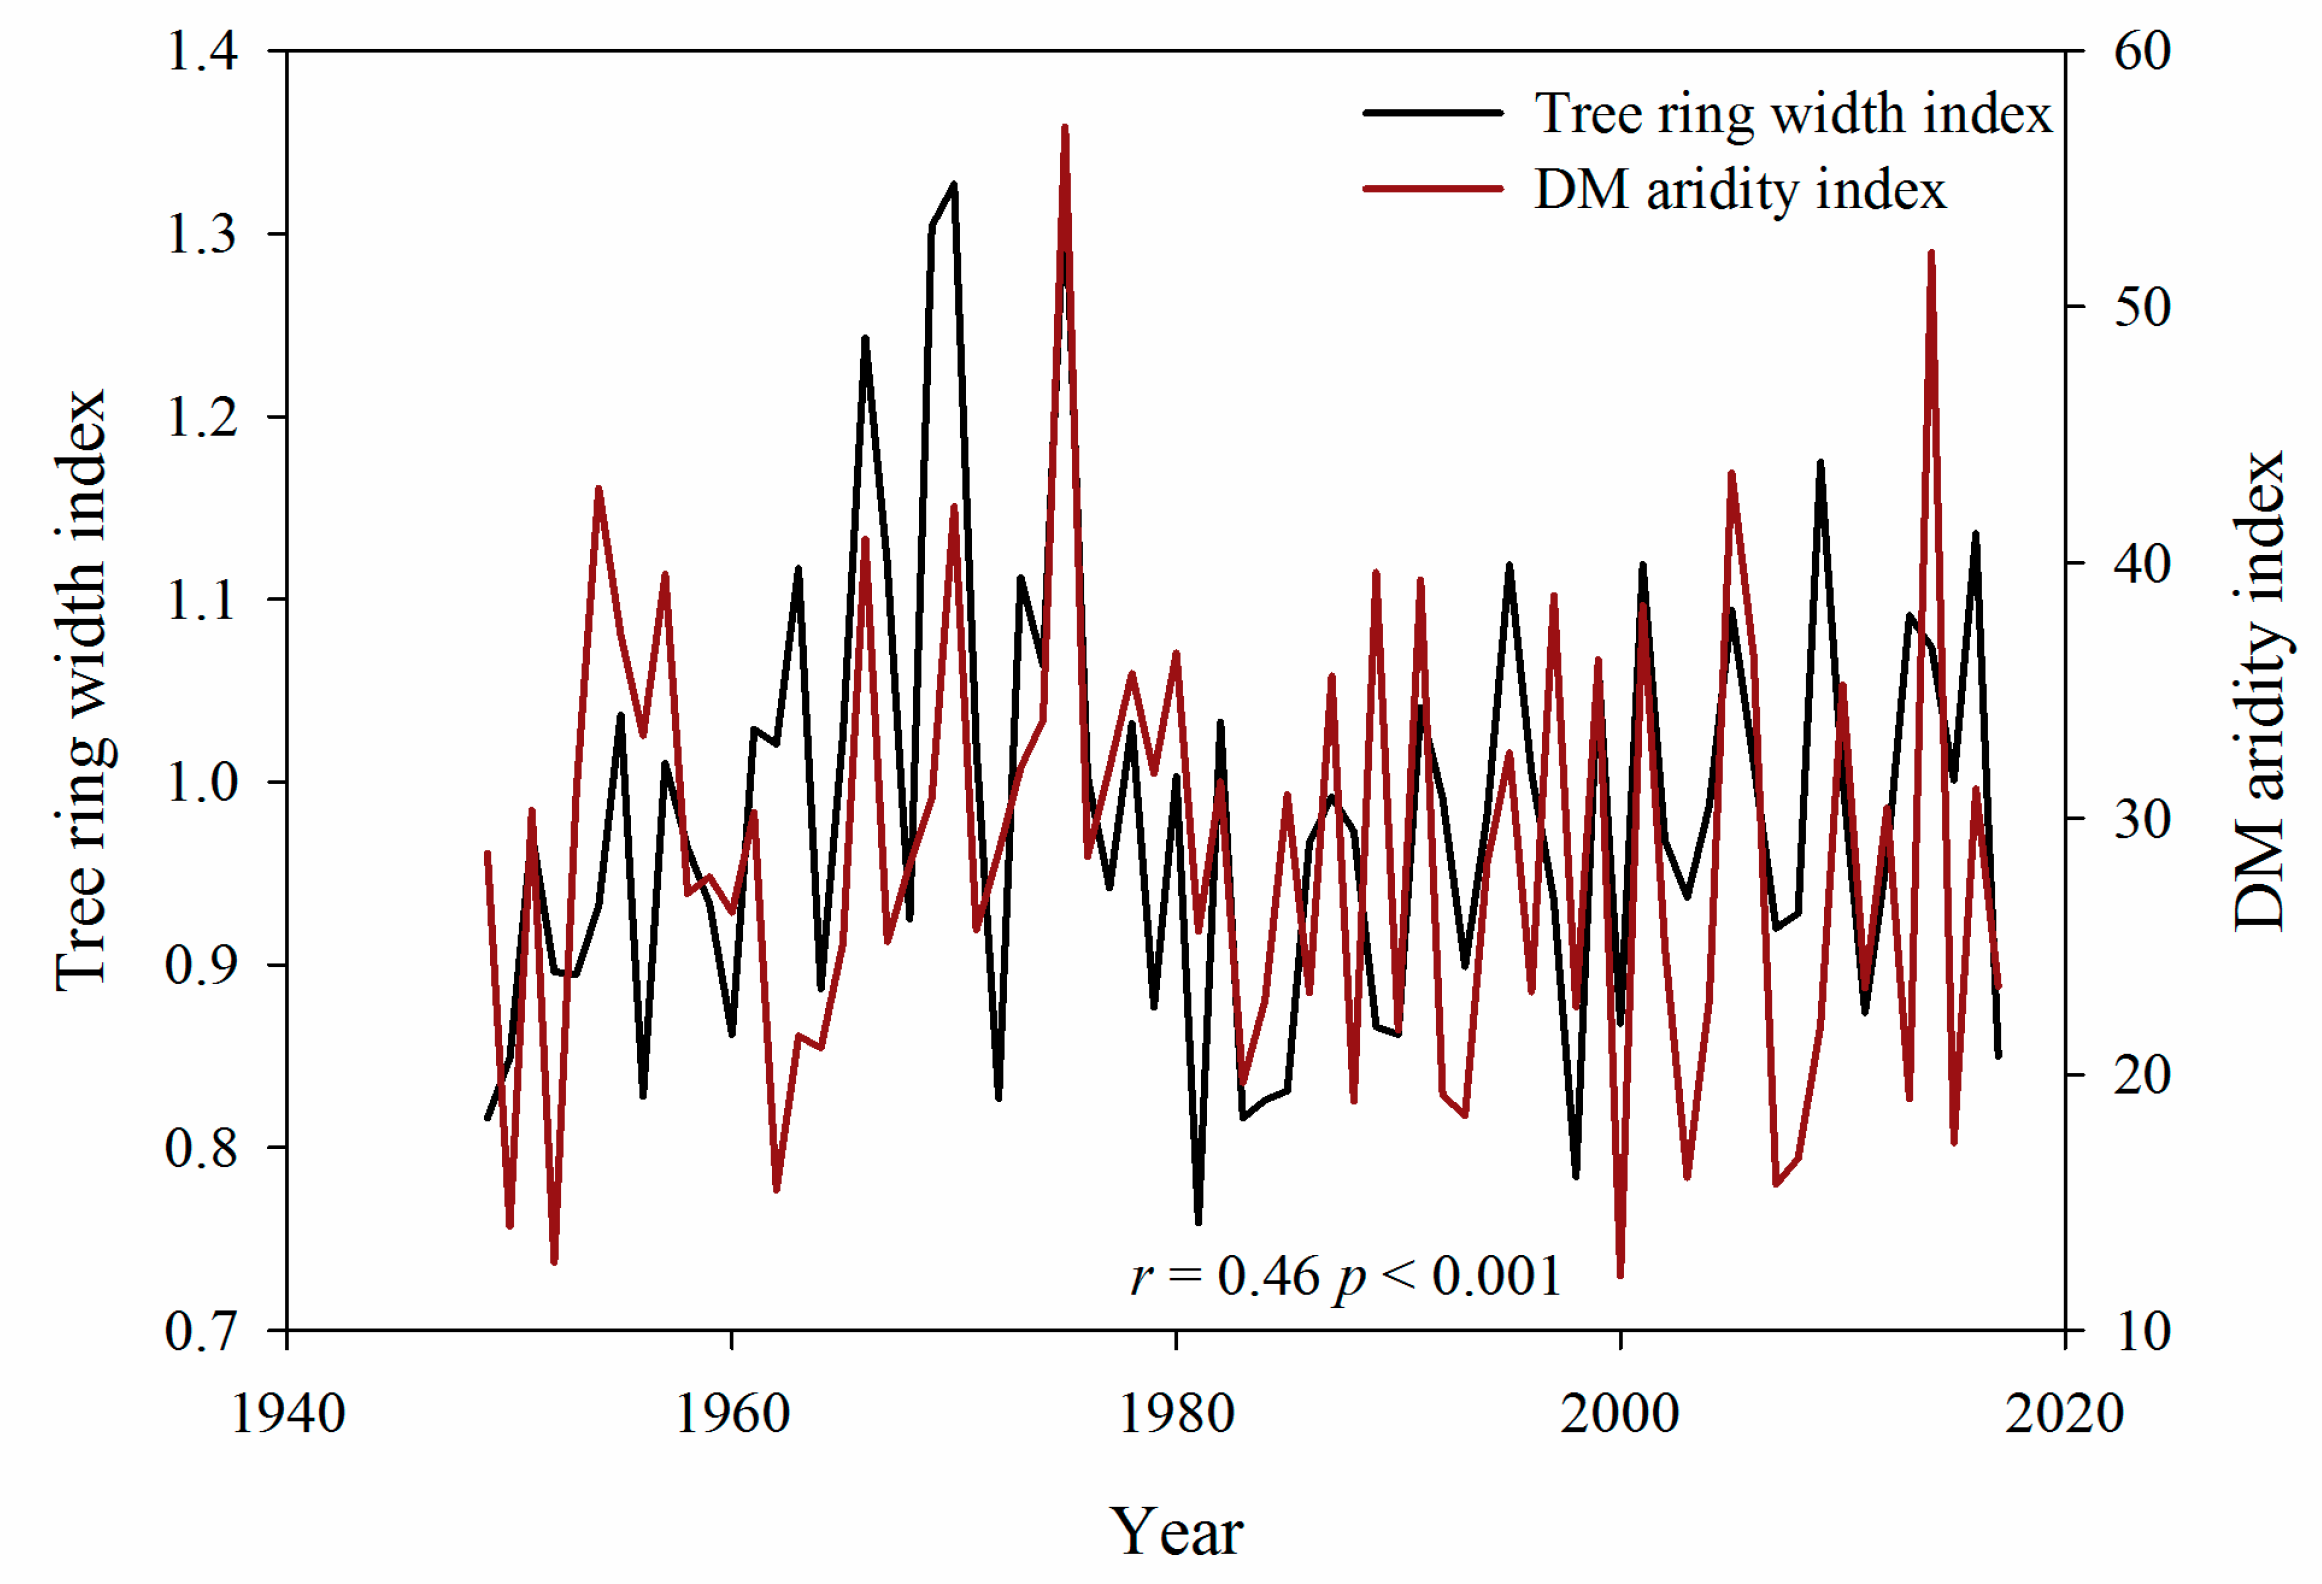
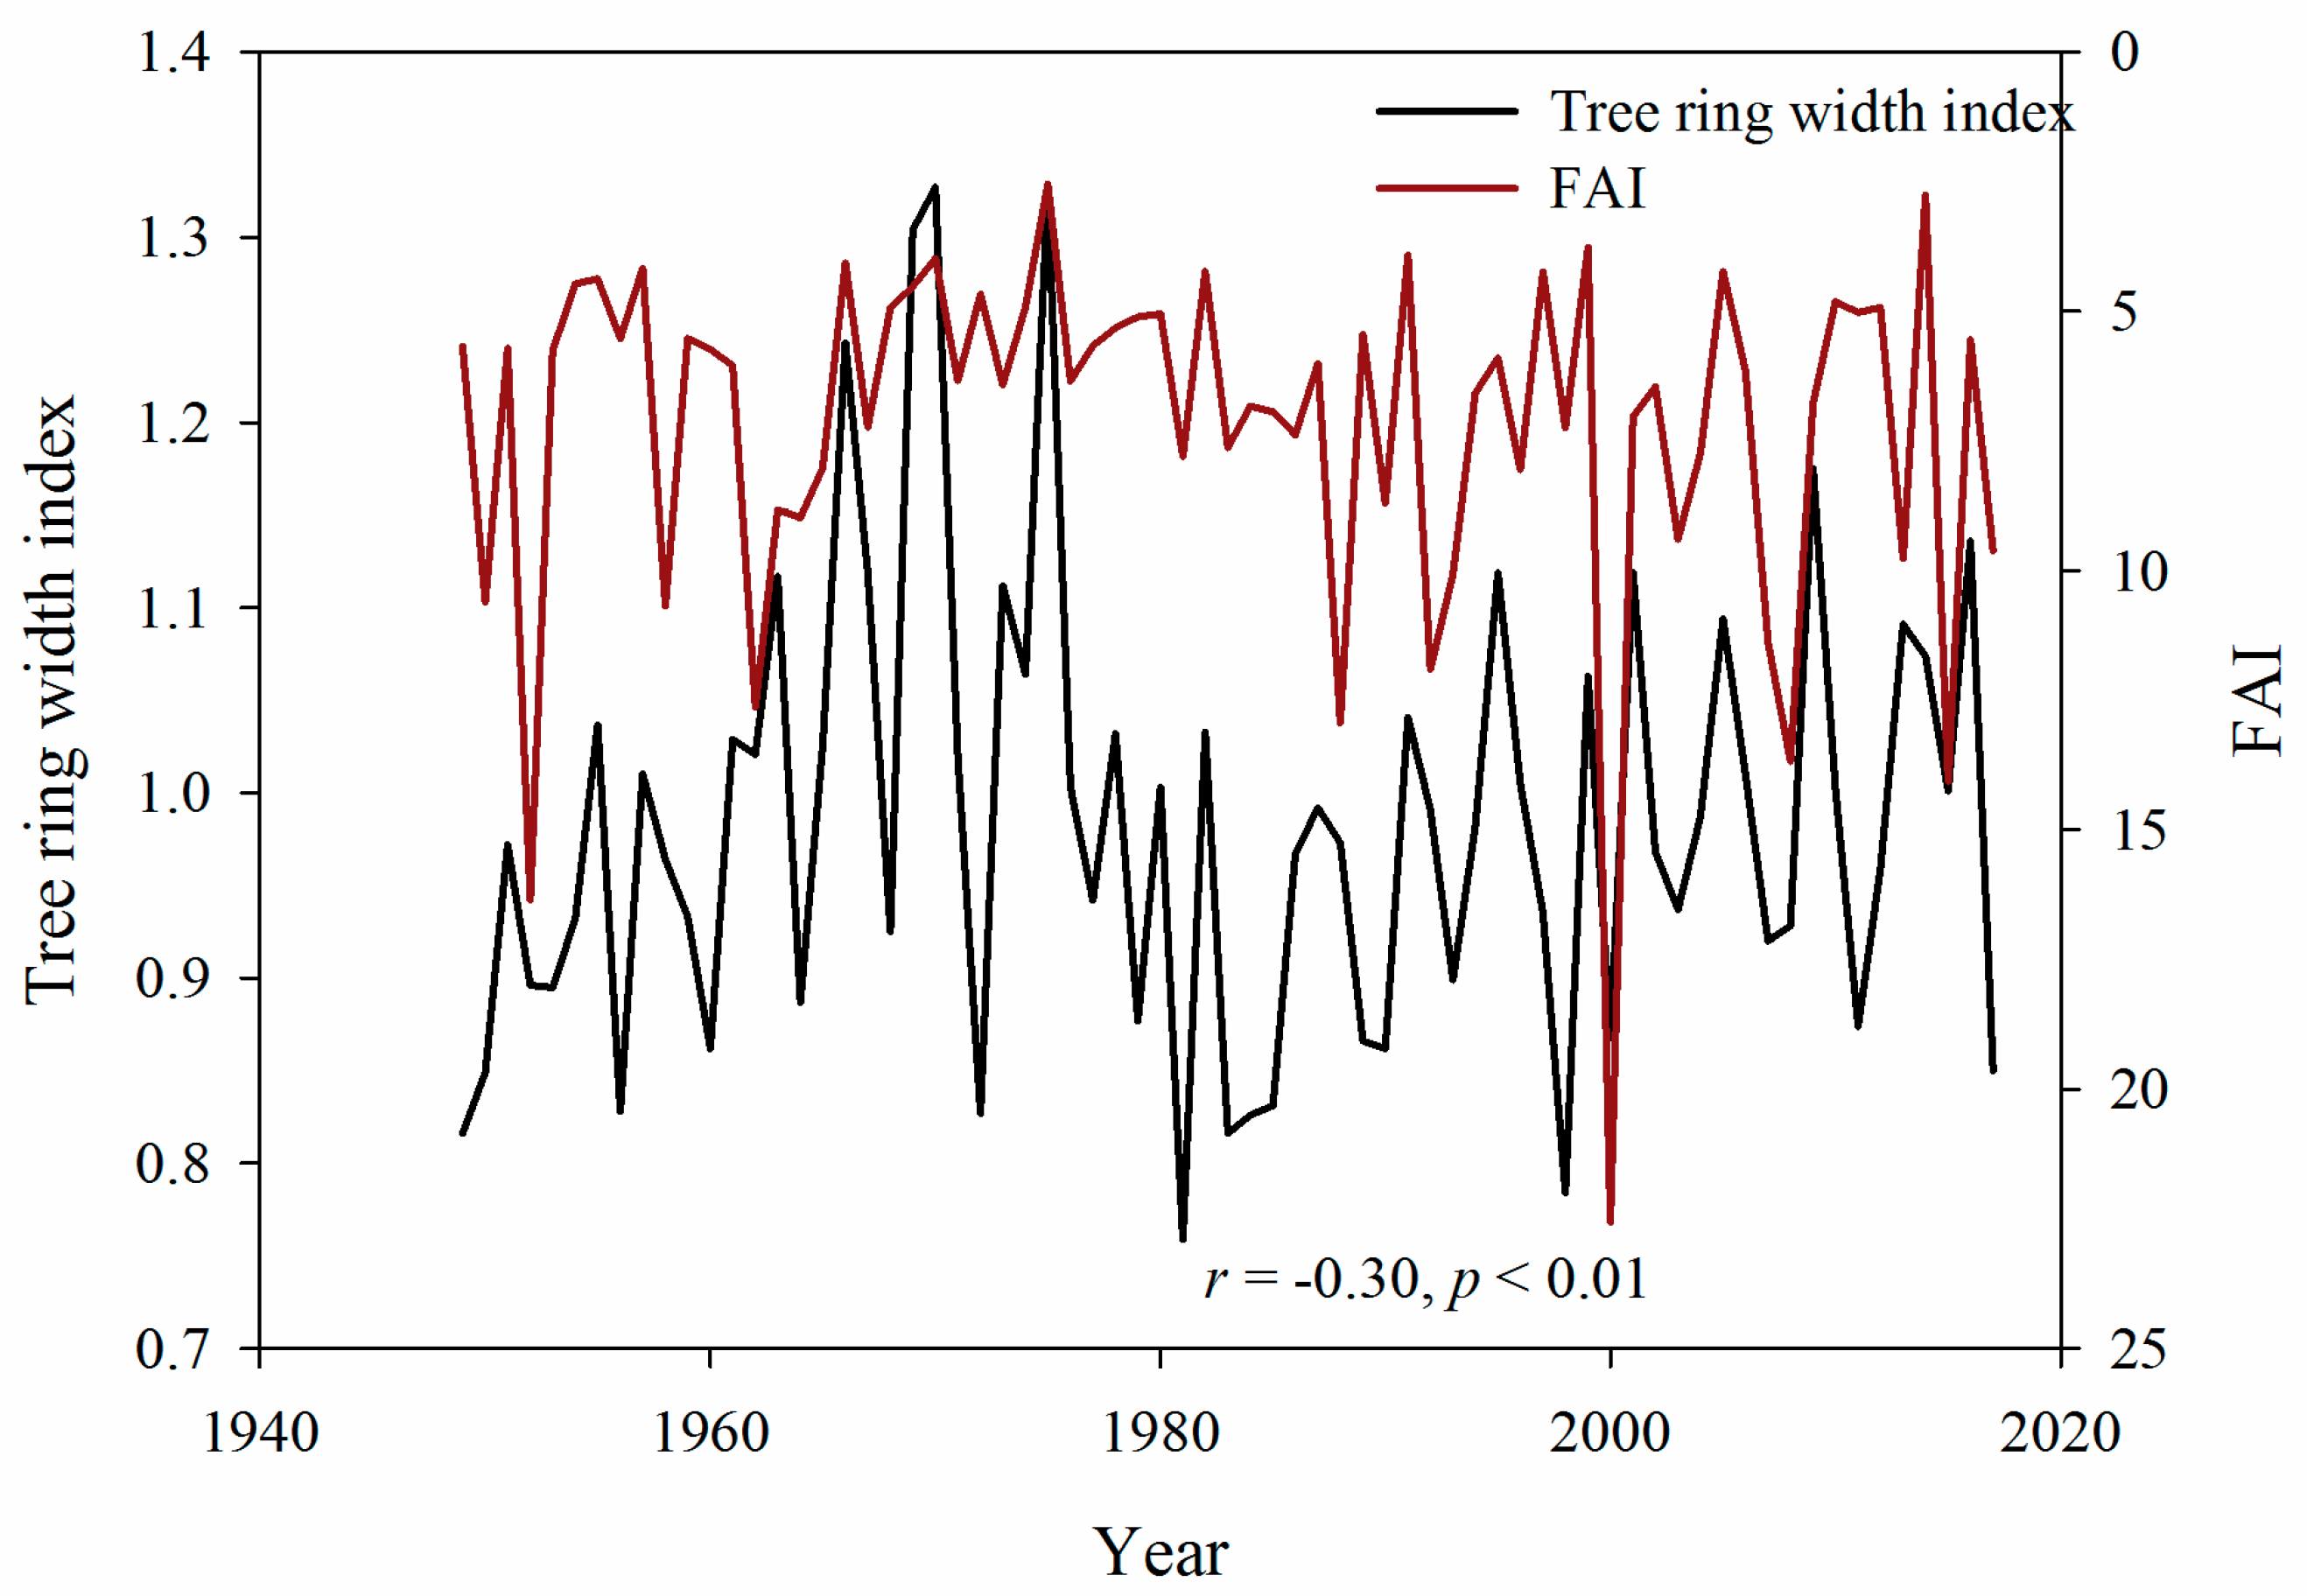
4.2. Correlation Analysis

In order to evaluate the response of tree ring width to the measured temperature and precipitation quantities, as well as calculated climate variables (aridity) from SE Banat, correlation coefficients were calculated. The results indicate that the dominant factor in annual radial growth was increased seasonal precipitation, which is in accordance with the statistically significant positive correlation between tree ring width and precipitation (Figure 7). The mean precipitation from April to August had the strongest influence on radial growth (r = 0.53, p < 0.0001), but there was no significant correlation with temperature (Figure 7).
The TRWI shows a satisfactory correlation between the PDSI (r = 0.51, p < 0.001, Figure 8) and the ImDM (r = 0.46, p < 0.001, Figure 9), from April to August, suggesting that the linear dependence reflected by the index is relatively high, despite the index values being the result of highly nonlinear processes, while the TRWI shows negative and weak correlation with FAI (r = –0.30, p < 0.010) (Figure 10).
However, the TRWI shows a significant correlation with the ImDM and the PDSI, during the April–August period (Figure 8 and Figure 9). The FAI highlights the temperature [31,32], while the ImDM highlights the precipitation [17]. When considering the significant negative correlations between the TRWI and the precipitation, it follows that the response of the TRWI to the ImDM is higher than to the FAI.
A visual comparison of the TRWI values with the PDSI (Figure 8) and the DM Aridity Index (Figure 9), both during the April–August period, and the FAI (Figure 10), shows significant similarities. Extreme “spikes” and changes between them overlap somewhere.

5. Discussion

In this study, tree ring, meteorological, and aridity data were investigated independently in Southeast Banat, during the period 1927–2017. Tree ring samples were extracted (23 increment cores) from 12 oak trees in two locations in SE Banat. From these samples, the Tree Ring Width Index, or TRWI, was calculated and analyzed. The mean annual surface air temperature, Ta, and the mean annual amount of precipitation, Pa, were analyzed from seven meteorological stations in SE Banat, for the period 1949–2017. Using the same meteorological data, the DM aridity index and the Forestry Aridity Index, or FAI, were derived and analyzed. In addition to the above-mentioned indices, the Palmer Drought Severity Index, or PDSI, is assumed as an independent index from a grid point that belongs to the SE Banat territory. This data was analyzed for the period 1927–2016.
As a control territory for benchmarking the climate parameters of SE Banat, the larger territory of Vojvodina was chosen. Both territories have almost identical geomorphological and climatological characteristics. In the case of Vojvodina, only the TRWI parameter was not available. The DM Aridity Index, FAI, Ta, and, Pa were all counted as original data based on the meteorological data from 10 meteorological stations, in the period 1949–2017. The PDSI had the same value as it did in SE Banat.
Table 4 shows that, of the six analyzed climatic parameters for SE Banat, only the temperature had a positive trend in the period 1949–2017, while the other five parameters displayed no trend. Moreover, the TRWI and the PDSI displayed no trend for the periods 1927–2017 and 1927–2016, respectively, which is almost 20 years longer than the period during which the meteorological data were being recorded. The control territory of Vojvodina shows the same results. The five climatic parameters showed no trend in four cases, and only in the case of temperature could a trend be determined.
As seen in Table 4, in both areas, significant trends in temperature, as well as an increase in temperature reaching 11.3 °C and 11.7 °C were recorded. Trends in precipitation were not recorded, and there were no trends in the DM Aridity Index, the FAI, or the PDSI either.
Taking trend equations into account, with their coefficients of linear regression, as well as taking into account the MK test results, it can be concluded that trends of the IaDM and the FAI are negligibly small, recording values of nearly zero and showcasing that there are basically no trends. Considering the IaDM and the FAI in this manner, it seems that there is no change in aridity in Vojvodina for the period 1949–2017. In Hrnjak et al. [17], very similar results in aridity trends with the De Martonne’s aridity index and the Pinna combinative index were obtained, for the territory of Vojvodina, for the period 1949–2006. Very similar results in aridity trends for the previous two indices have been obtained for other Serbian regions, namely Kosovo and Metohija [18] and Central Serbia [19], where it has also been found that there is no trend. The same result, but without the FAI trend, in Vojvodina was obtained for the period 1949–2006 [32].

6. Conclusions

It appears that the change in aridity/drought trends cannot be the result of only a change in temperature trends. The change in temperature trends is not enough, in and of itself, to trigger a change in the aridity trend. It appears that some critical values in the temperature trend and/or the precipitation trend are existing, potentially leading to a change in the aridity trend. At this point, we were not able to identify these values with absolute certainty, and so it remains for future research. Unlike the temperature, which shows variability in trends, the aridity did not show any change in trends.
The previous statement affirms that the TRWI’s behavior is a useful independent indicator of climate change in the SE Banat region. This climatic parameter indicates a slight dependence on temperature. The TRWI does not exhibit any sensitivity to temperature change, showing poor correlation with it, while at the same time displaying significant correlation with precipitation. This suggests that a change in rainfall trend might cause changes in the aridity trend, another thing that should be more closely investigated in the future. Forest vegetation seems to be more susceptible to changes in rainfall trends, rather than changes in temperature trends. This is a testament to the significance of existing vegetation playing a major role in reducing climate extremes and ensuring that the climate is less susceptible to fluctuation.
Conclusions comparable to the ones reached in this study can be found in various paleoclimate studies [36], suggesting that aridity in the investigated region is not characteristic only for the recent climate, but was also common in past geological periods. Many analyzed paleoclimatic proxies related to the last glacial loess also report a periodic [36,79,80] or even continuous presence of arid climate conditions [81,82,83].

Author Contributions

M.B.G., Q.H., S.B.M., and Z.G. conceived and designed the study; W.A., C.X., M.B.G., S.B.M., and F.Y. performed the tree ring data sampling; W.A., C.X., F.Y., and Q.H. performed laboratory measurements and analyzes; M.B.G., W.A., C.X., M.G.R., and G.G. processed and graphically presented the data; M.B.G., W.A., M.G.R., G.G., and Z.P. analyzed the data; M.B.G., Z.P., W.A., C.X., and S.B.M. wrote the paper.

Funding

This study is funded by the First Program of the Chinese-Serbian Developing Projects, the National Key R&D Program of China, the Project of the Serbian Ministry of Education, the Natural Science Foundation of China, and the Chinese Academy of Sciences.

Acknowledgments

This study is supported by the First Program of the Chinese-Serbian Developing Projects (Project title: “A Comparative Study of Past Climate Change in the East Asian Monsoon Region and the Westerly Zone Using Multiple Timescales”). Additionally, the investigations presented here were supported by the National Key R&D Program of China (Grant No. 2017YFE0112800), Project 176020 of the Serbian Ministry of Education, the Natural Science Foundation of China (41690114, 41888101) and the Chinese Academy of Sciences (CAS) Pioneer Hundred Talents Program. The authors are grateful for the support of Valentina Janc and Joži Dani. The authors appreciate the suggestions of the anonymous reviewers that led to improvements in the paper.

Conflicts of Interest

The authors declare no conflict of interest. The founding sponsors had no role in the design of the study; in the collection, analyses, or interpretation of data; in the writing of the manuscript, and in the decision to publish the results.

References

  1. Hulme, M.; Barrow, E.M.; Arnell, N.W.; Harrisson, P.A.; Johns, T.C.; Downing, T.E. Relative impacts of human-induced climate change and natural climate variability. Nature 1999, 397, 688–691. [Google Scholar] [CrossRef]
  2. Kenny, G.J.; Ye, W.; Flux, T.; Warrick, R.A. Climate variations and New Zealand agriculture: The CLIMPACTS system and issues of spatial and temporal scale. Environ. Int. 2001, 27, 189–194. [Google Scholar] [CrossRef]
  3. Baltas, E.; Mimikou, M. Climate change impacts on the water supply of Thessaloniki. Int. J. Water Resour. Dev. 2005, 21, 341–353. [Google Scholar] [CrossRef]
  4. Intergovernmental Panel on Climate Change (IPCC). Global Warming of 1.5 °C; World Meteorological Organization: Geneva, Switzerland, 2018. [Google Scholar]
  5. Gavrilov, M.B.; Marković, S.B.; Mladjan, D.; Zarić, M.; Pešić, A.; Janc, N.; Todorović, N. Global Warning—Between the Myth and Reality. In Proceedings of the International Scientific Conference “Archibald Reiss Days”, Zemun, Serbia, 10–11 March 2016; Kolarić, D., Ed.; Academy of Criminalistic And Police Studies: Belgrade, Serbia, 2016. [Google Scholar]
  6. Climatic Research Unit. Global Average Temperature Change 1856–2003. Available online: https://crudata.uea.ac.uk/cru/data/temperature/ (accessed on 6 March 2012).
  7. Diaz, H.F.; Bradley, R.; Eischeid, J.K. Precipitation fluctuation over global land areas since the late 1800s. J. Geophys. Res. 1989, 94, 1195–1210. [Google Scholar] [CrossRef]
  8. American Meteorological Society, Glossary of Meteorology. Available online: http://glossary.ametsoc.org/wiki/Aridity (accessed on 15 September 2019).
  9. Deniz, A.; Toros, H.; Incecik, S. Spatial variations of climate indices in Turkey. Int. J. Climatol. 2011, 3, 394–403. [Google Scholar] [CrossRef]
  10. Arora, V.K. The use of the aridity index to assess climate change effect on annual runoff. J. Hydrol. 2002, 265, 164–177. [Google Scholar] [CrossRef]
  11. De Martonne, E. Traité de géographie physique, Vol. I: Notions generales, climat, hydrographie. Geogr. Rev. 1925, 15, 336–337. [Google Scholar] [CrossRef]
  12. Baltas, E. Spatial distribution of climatic indices in northern Greece. Meteorol. Appl. 2007, 14, 69–78. [Google Scholar] [CrossRef]
  13. Croitoru, А.Е.; Piticar, А.; Imbroane, А.М.; Burada, D.C. Spatiotemporal distribution of aridity indices based on temperature and precipitation in the extra-Carpathian regions of Romania. Theor. Appl. Climatol. 2013, 112, 597–607. [Google Scholar] [CrossRef]
  14. Moral, F.J.; Paniagua, L.L.; Rebollo, F.J.; García-Martín, A. Spatial analysis of the annual and seasonal aridity trends in Extremadura, southwestern Spain. Theor. Appl. Climatol. 2017, 130, 917–932. [Google Scholar] [CrossRef]
  15. Nistor, M.M. Spatial distribution of climate indices in the Emilia-Romagna region. Meteorol. Appl. 2016, 23, 304–313. [Google Scholar] [CrossRef] [Green Version]
  16. Gebremedhin, M.A.; Hailu Kahsay, G.H.; Fanta, H.G. Assessment of spatial distribution of aridity indices in Raya valley, northern Ethiopia. Appl. Water Sci. 2018, 8, 217–224. [Google Scholar] [CrossRef]
  17. Hrnjak, I.; Lukić, T.; Gavrilov, M.B.; Marković, S.B.; Unkašević, M.; Tošić, I. Aridity in Vojvodina, Serbia. Theor. Appl. Climatol. 2014, 115, 323–332. [Google Scholar] [CrossRef]
  18. Bačević, N.; Vukoičić, D.; Nikolić, M.; Janc, N.; Milentijević, N.; Gavrilov, M.B. Aridity in Kosovo and Metohija, Serbia. Carpathian J. Earth Environ. Sci. 2017, 12, 563–570. [Google Scholar]
  19. Radaković, M.G.; Tošić, I.; Bačević, N.; Mladjan, D.; Gavrilov, M.B.; Marković, S.B. The analysis of aridity in Central Serbia from 1949 to 2015. Theor.Appl. Climatol. 2018, 133, 887–898. [Google Scholar] [CrossRef]
  20. Zambakas, J. General Climatology; Department of Geology, National & Kapodistrian University of Athens: Athens, Greece, 1992. [Google Scholar]
  21. Thornthwaite, C.W. An approach toward a rational classification of climate. Geogr. Rev. 1948, 38, 55–94. [Google Scholar] [CrossRef]
  22. Palmer, W.C. Meteorological Drought; U.S. Department of Commerce: Washington, DC, USA, 1965.
  23. Ben-Gai, T.; Bitan, A.; Manes, A.; Alpert, P. Long-term changes in annual rainfall patterns in southern Israel. Theor. Appl. Climatol. 1994, 49, 59–67. [Google Scholar] [CrossRef]
  24. Cook, E.R.; Woodhouse, C.A.; Mark, E.C.; Meko, D.M.; Stahle, D.W. Long-term aridity changes in the western United States. Science 2004, 306, 1015–1018. [Google Scholar] [CrossRef] [PubMed]
  25. Wu, S.; Yin, Y.; Zheng, D.; Yang, Q. Moisture conditions and climate trends in China during the period 1971–2000. Int. J. Climatol. 2006, 26, 193–206. [Google Scholar] [CrossRef]
  26. Tabari, H.; Aghajanloo, M.-B. Temporal pattern of monthly aridity index in Iran with considering precipitation and evapotranspiration trends. Int. J. Climatol. 2013, 33, 396–409. [Google Scholar] [CrossRef]
  27. Johansson, O.V. Die Hauptcharakteristika des jahrlichen Temperaturganges. Gerlands Beitr. Z. J. Geophys. 1931, 33, 406–428. [Google Scholar]
  28. Kerner, F.V. Thermoisodromen, Versuch einer kartographischen Darstellung des jahrlichen Ganges der Lufttemperatur; Geographische Gesellschaft: Österreich, Wien, 1905. [Google Scholar]
  29. Emberger, E. Sur une formule climatique et ses applications en botanique. La Météorologie 1932, 92, 423–432. [Google Scholar]
  30. Food and Agriculture Organization of the United Nations. World Map of Desertification; United Nations: Rome, Italy, 1977. [Google Scholar]
  31. Führer, E.; Horvath, L.; Jagodics, A.; Machon, A.; Szabados, I. Application of new aridity index in Hungarian forestry practice. Időjárás 2011, 115, 205–216. [Google Scholar]
  32. Gavrilov, M.B.; Lukić, T.; Janc, N.; Basarin, B.; Marković, S.B. Forestry Aridity Index in Vojvodina, North Serbia. Open Geosci. 2019, 11, 367–377. [Google Scholar] [CrossRef]
  33. Alley, W. The Palmer Drought Severity Index: Limitations and Assumptions. J. Clim. Appl. Meteorol. 1984, 23, 1100–1109. [Google Scholar] [CrossRef] [Green Version]
  34. Cufar, K.; Grabner, M.; Morgás, A.; Martínez del Castillo, E.; Merela, M.; De Luis, M. Common climatic signals affecting oak tree-ring growth in SE Central Europe. Trees 2014, 28, 1267–1277. [Google Scholar] [CrossRef]
  35. Stojanović, D.; Levanič, T.; Matović, B.; Bravo-Oviedo, A. Climate change impact on a mixed lowland oak stand in Serbia. Ann. Silvic. Res. 2015, 39, 94–99. [Google Scholar]
  36. Marković, S.B.; Bokhorst, M.; Vandenberghe, J.; Oches, E.A.; Zöller, L.; McCoy, W.D.; Gaudenyi, T.; Jovanović, M.; Hambach, U.; Machalett, B. Late Pleistocene loess-paleosol sequences in the Vojvodina region, North Serbia. J. Quat. Sci. 2008, 23, 73–84. [Google Scholar] [CrossRef]
  37. Marković, S.B.; Hambach, U.; Catto, N.; Jovanović, M.; Buggle, B.; Machalett, B.; Zöller, L.; Glaser, B.; Frechen, M. The middle and late Pleistocene loess-paleosol sequences at Batajanica, Vojvodina, Serbia. Quat. Int. 2009, 198, 255–266. [Google Scholar]
  38. Marković, S.B.; Hambach, U.; Stevens, T.; Kukla, G.J.; Heller, F.; William, D.; McCoy, W.D.; Oches, E.A.; Buggle, B.; Zöller, L. The last million years recorded at the Stari Slankamen loess-palaeosol sequence: Revised chronostratigraphy and long-term environmental trends. Quat. Sci. Rev. 2011, 30, 1142–1154. [Google Scholar] [CrossRef]
  39. Marković, S.B.; Stevens, T.; Kukla, G.J.; Hambach, U.; Fitzsimmons, K.E.; Gibbard, P.; Buggle, B.; Zech, M.; Guo, Z.T.; Hao, Q.Z.; et al. The Danube loess stratigraphy—New steps towards the development of a pan-European loess stratigraphic model. Earth Sci. Rev. 2015, 148, 228–258. [Google Scholar] [CrossRef]
  40. Gavrilov, M.B.; Marković, S.B.; Schaetzl, R.J.; Tošić, I.A.; Zeeden, C.; Obreht, I.; Sipos, G.; Ruman, A.; Putniković, S.; Emunds, K.; et al. Prevailing surface winds in Northern Serbia in the recent and past time periods; modern- and past dust deposition. Aeolian Res. 2018, 31, 117–129. [Google Scholar] [CrossRef] [Green Version]
  41. Tošić, I.; Gavrilov, M.B.; Marković, S.B.; Ruman, A.; Putniković, S. Seasonal prevailing surface winds in Northern Serbia. Theor. Appl. Climatol. 2018, 131, 1273–1284. [Google Scholar] [CrossRef]
  42. Gavrilov, M.B.; Marković, S.B.; Korać, V.; Jarad, A. The analysis of temperature trends in Vojvodina (Serbia) from 1949 to 2006. Therm. Sci. 2015, 19, 339–350. [Google Scholar] [CrossRef]
  43. Gavrilov, M.B.; Tošić, I.; Marković, S.B.; Unkašević, M.; Petrović, P. The analysis of annual and seasonal temperature trends using the Mann-Kendall test in Vojvodina, Serbia. Időjárás 2016, 120, 183–198. [Google Scholar]
  44. Tošić, I.; Hrnjak, I.; Gavrilov, M.B.; Unkašević, M.; Marković, S.B.; Lukić, T. Annual and seasonal variability of precipitation in Vojvodina, Serbia. Theor. Appl. Climatol. 2014, 117, 331–341. [Google Scholar] [CrossRef]
  45. Milovanov, D. Hydrosystem Danube-Tisa-Danube; Water Management: Novi Sad, Serbia, 1972. (In Serbian)
  46. Javno preduzeće za gazdovanje šumama, VOJVODINAŠUME, Šumsko gazdinstvo “BANAT” Pančevo. Available online: http://www.banatsume.rs/ (accessed on 1 May 2019).
  47. RHMZ-RepubličkiHidrometeorološkizavodSrbijeKnezaVišeslava 66 Beograd. Available online: http://www.hidmet.gov.rs/ (accessed on 17 March 2019).
  48. Alexandersson, H. A homogeneity test applied to precipitation data. J. Climatol. 1986, 6, 661–675. [Google Scholar] [CrossRef]
  49. Dai, A.; Trenberth, K.E.; Qian, T. A global dataset of Palmer Drought Severity Index for 1870–2002: Relationship with soil moisture and effects of surface warming. J. Hydrometeorol. 2004, 5, 1117–1130. [Google Scholar] [CrossRef]
  50. Palmer Drought Severity Index (PDSI) | NCAR - Climate Data Guide. Available online: http://www.cgd.ucar.edu/cas/catalog/climind/pdsi.html (accessed on 22 May 2019).
  51. Tabari, H.; Talaee, P.H.; Nadoushani, S.M.; Willems, P.; Marchetto, A. A survey of temperature and precipitation based aridity indices in Iran. Quat. Int. 2014, 345, 158–166. [Google Scholar] [CrossRef]
  52. Marriott, F.H.C. Dictionary of Statistical Terms; International Statistical Institute by Longman Scientific and Technical &Wiley: New York, NY, USA, 2002. [Google Scholar]
  53. Dai, A. Characteristics and trends in various forms of the Palmer Drought Severity Index during 1900–2008. J. Geophys. Res. 2011, 116, D12115. [Google Scholar] [CrossRef]
  54. Stokes, M.A.; Smiley, T.L. An Introduction to Tree-Ring Dating; The University of Arizona Press: Tucson, AZ, USA, 1996. [Google Scholar]
  55. Holmes, R.L. Computer-assisted quality control in tree-ring dating and measurement. Tree-Ring Bull. 1983, 43, 69–78. [Google Scholar]
  56. Cook, E.R. A Time-Series Analysis Approach to Tree-Ring Standardization. Ph.D. Thesis, University of Arizona, Tucson, AZ, USA, 1985. [Google Scholar]
  57. Osborn, T.J.; Briffa, K.R.; Jones, P.D. Adjusting variance for sample-size in tree-ring chronologies and other regional-mean time series. Dendrochronologia 1997, 15, 89–99. [Google Scholar]
  58. Wigley, T.M.L.; Briffa, K.R.; Jones, P.D. On the average value of correlated time series, with applications in dendroclimatology and hydrometeorology. J. Clim. Appl. Meteorol. 1984, 23, 201–213. [Google Scholar] [CrossRef]
  59. Grissino-Mayer, H.D. Evaluating crossdating accuracy: A manual and tutorial for the computer program COFECHA. Tree-Ring Res. 2001, 57, 205–221. [Google Scholar]
  60. Draper, N.R.; Smith, H. Applied Regression Analysis; John Wiley and Sons: New York, NY, USA, 1966. [Google Scholar]
  61. Kendall, M.G. New Measure of Rank Correlation. Biometrika 1938, 30, 81–93. [Google Scholar] [CrossRef]
  62. Kendall, M.G. Rank Correlation Methods, 4th ed.; Charles Griffin: London, England, 1975. [Google Scholar]
  63. Mann, H.B. Non-parametric Tests Against Trend. Econometrica 1945, 13, 245–259. [Google Scholar] [CrossRef]
  64. Gilbert, R.O. Statistical Methods for Environmental Pollution Monitoring; Van Nostrand Reinhold Company Inc.: New York, NY, USA, 1987. [Google Scholar]
  65. Onoz, B.; Bayazit, M. The Power of Statistical Tests for Trend Detection. Turkish J. Engineer. Environ. Sci. 2003, 27, 247–251. [Google Scholar]
  66. Karmeshu, N. Trend Detection in Annual Temperature & precipitation Using the Mann Kendall Test—A Case Study to Assess Climate Change on Select States in the Northeastern United States. Master’s Thesis, University of Pennsylvania, Philadelphia, PA, USA, 2012. [Google Scholar]
  67. Gavrilov, M.B.; Marković, S.B.; Janc, N.; Nikolić, M.; Valjarević, A.; Komac, B.; Zorn, M.; Punišić, M.; Bačević, N. Assessing average annual air temperature trends using the Mann–Kendall test in Kosovo. Acta Geogr. Slov. 2018, 58, 7–25. [Google Scholar] [CrossRef]
  68. Marin, L.; Birsan, M.V.; Bojariu, R.; Dumitrescu, A.; Micu, D.M.; Manea, A. An Overview of annual climatic changes in Romania: Trends in air temperature, precipiutation, sunshine hours, cloud cover, relative humidity nd wind speed duration the 1961–2013 period. Carpathian J. Earth Environ. Sci. 2014, 9, 253–258. [Google Scholar]
  69. Çiçek, İ.; Duman, N. Seasonal and annual precipitation trends in Turkey. Carpathian J. Earth Environ. Sci. 2015, 10, 77–84. [Google Scholar]
  70. Serra, C.; Burgueño, A.; Lana, X. Analysis of maximum and minimum daily temperatures recorded at Fabra Observatory (Barcelona, NE Spain) in the period 1917–1998. Int. J. Climatol. 2001, 21, 617–636. [Google Scholar] [CrossRef]
  71. Gavrilov, M.B.; Lazić, L.; Pešić, A.; Milutinović, M.; Marković, D.; Stanković, A.; Gavrilov, M.M. Influence of Hail Suppression on the Hail Trend in Serbia. Phys. Geogr. 2010, 31, 441–454. [Google Scholar] [CrossRef]
  72. Gavrilov, M.B.; Lazić, L.; Milutinović, M.; Gavrilov, M.M. Influence of Hail Suppression on the Hail Trend in Vojvodina, Serbia. Geogr. Pannonica 2011, 15, 36–41. [Google Scholar] [CrossRef]
  73. Gavrilov, M.B.; Marković, S.B.; Zorn, M.; Komac, B.; Lukić, T.; Milošević, M.; Janićević, S. Is hail suppression useful in Serbia?—General review and new results. Acta Geogr. Slov. 2013, 53, 165–179. [Google Scholar] [CrossRef]
  74. Janc, N.; Gavrilov, M.B. History of Hail Suppression in Serbia; LAP LAMBERT Academic Publishing: Saarbrücken, Germany, 2017. [Google Scholar]
  75. Ahmed, K.; Shahid, S.; Wang, X.-J..; Nawaz, N.; Khan, N. Spatiotemporal Changes in Aridity of Pakistan during 1901–2016. Hydrol. Earth Syst. Sci. 2019, 23, 3081–3096. [Google Scholar] [CrossRef]
  76. Tabari, H.; Marofi, S.; Aeini, A.; Talaee, P.H.; Mohammadi, K. Trend analysis of reference evapotranspirationin the western half of Iran. Agric. For. Meteorol. 2011, 151, 128–136. [Google Scholar] [CrossRef]
  77. Drapela, K.; Drapelova, I. Application of Mann-Kendall test and the Sen’s slope estimates for trend detection in deposition data from Bílý Kříž (Beskydy Mts., the Czech Republic) 1997–2010. Beskydy 2011, 4, 133–146. [Google Scholar]
  78. Statistical Software & Data Analysis Add-on for Excel | XLSTAT. Available online: https://www.xlstat.com/en/ (accessed on 17 March 2019).
  79. Sümegi, P.; Krolopp, E. Quatermalacological analyses modelling of the Upper Weichselian palaeoenviromental changes in the Carpathian Basin. Quat. Int. 2002, 91, 53–63. [Google Scholar] [CrossRef]
  80. Marković, S.B.; McCoy, W.D.; Oches, E.A.; Savić, S.; Gaudenyi, T.; Jovanović, M.; Stevens, T.; Walther, R.; Ivanišević, P.; Galić, Z. Paleoclimate record in the Late Pleistocene loess-paleosol sequence at Petrovaradin Brickyard (Vojvodina, Serbia). Geol. Carpathica 2005, 56, 483–491. [Google Scholar]
  81. Marković, S.B.; Oches, E.; Sümegi, P.; Jovanović, M.; Gaudenyi, T. An introduction to the Upper and Middle Pleistocene loess-paleosol sequences of Ruma section (Vojvodina, Serbia). Quat. Int. 2006, 149, 80–86. [Google Scholar] [CrossRef]
  82. Marković, S.B.; Oches, E.A.; McCoy, W.D.; Gaudenyi, T.; Frechen, M. Malacological and sedimentological evidence for “warm” climate from the Irig loess sequence (Vojvodina, Serbia). Geochem. Geophys. Geosyst. 2007, 8, Q09008. [Google Scholar] [CrossRef]
  83. Marković, S.B.; Sümegi, P.; Stevens, T.; Schaetzl, R.J.; Obreht, I.; Chu, W.; Buggle, B.; Zech, M.; Zech, R.; Zeeden, C.; et al. The Crvenka loess-paleosol sequence: A record of continuous grassland domination in the southern Carpathian Basin during the Late Pleistocene. Palaeogeogr. Palaeoclimatol. Palaeoecol. 2018, 509, 33–46. [Google Scholar] [CrossRef]
Figure 1. Territories of Vojvodina and SE Banat, their locations in Serbia and Europe, meteorological stations and tree ring sampling site used in this study.
Atmosphere 10 00586 g001
Figure 2. The distribution and trend of the mean annual De Martonne Aridity Index, IaDM, for (a) Vojvodina and (b) SE Banat both in the period 1949–2017. The aridity trend is presented with a solid, black line and trend equation, and p is the probability.
Atmosphere 10 00586 g002
Figure 3. The distribution and trend of the mean annual Forestry Aridity Index, FAI, for (a) Vojvodina and (b) SE Banat both for the period 1949–2017. The aridity trend is presented with a solid, black line and trend equation, and p is the probability.
Atmosphere 10 00586 g003
Figure 4. The distribution and trend of the PDSI for SE Banat and Vojvodina in the period 1927–2016. The PDSI trend is presented with a solid, black line and trend equation, and p is the probability.
Atmosphere 10 00586 g004
Figure 5. The distribution and trend of the TRWI for SE Banat in the period 1927–2017. The TRWI trend is presented with a solid, black line and trend equation, and p is the probability.
Atmosphere 10 00586 g005
Figure 6. The distributions and trends of the mean annual temperature, Ta, and the mean annual amount precipitation, Pa, in the period 1949–2017, for (a) Vojvodina and (b) SE Banat, respectively. Trends of the Ta and the Pa are presented with solid, black lines and trend equations, and p are probabilities.
Atmosphere 10 00586 g006
Figure 7. The correlation coefficients between the TRWI and the mean monthly temperature, Tm, and the mean monthly amount of precipitation, Pm, for SE Banat during the period 1949–2017, where p is the significance level, the prefix “p” indicates the previous year and “AMJJA” represents the period from April to August in the current year.
Atmosphere 10 00586 g007
Figure 8. Comparisons between the TRWI and the PDSI during April–August for SE Banat from 1927 to 2016, where r is the coefficient of correlation and p is the significance level.
Atmosphere 10 00586 g008
Figure 9. Comparisons between the Tree Ring Width Index and the DM Aridity Index during April–August for SE Banat from 1949 to 2017, where r is the coefficient of correlation and p is the significance level.
Atmosphere 10 00586 g009
Figure 10. Comparisons between the TRWI and the FAI for SE Banat from 1949 to 2017, where r is the coefficient of correlation and p is the significance level. The vertical axis of the FAI has been reversed to compare.
Atmosphere 10 00586 g010
Table 1. The De Martonne aridity index classification.
Types of ClimateValues of IaDM
AridIaDM < 10
Semi-arid10 ≤ IaDM < 20
Mediterranean20 ≤ IaDM < 24
Semi-humid24 ≤ IaDM < 28
Humid28 ≤ IaDM < 35
Very humid35 ≤ IaDM ≤ 55
Extremely humidIaDM > 55
Table 2. Meteorological features of forestry climate categories [31].
FAI ValuesForestry Climate Categories
Less than 4.75Beech climate
4.75–6.00Hornbeam-oak climate
6.00–7.25The sessile oak/Turkey oak climate
More than 7.25Forest-steppe climate
Table 3. Statistical characteristics of the standardized tree ring chronology.
SiteSE Banat
Altitude (m AMSL)83–181
Standard deviation (SD)0.29
First-order autocorrelation (AC1)0.18
Length of chronology (CL, years)99
Mean tree ring width (mm)3.31
Mean inter-series correlation (Rbar)0.40
Expressed population signal (EPS)0.92
Table 4. Trends of climate parameters for SE Banat and Vojvodina.
OrdinarClimate ParametersPeriodsTrends
SE BanatVojvodina
1.TRWI1927–2017No-
2.Ta1949–2017YesYes
3.Pa1949–2017NoNo
4.DM Aridity Index1949–2017NoNo
5.FAI1949–2017NoNo
6.PDSI1927–2016NoNo

