1. Introduction
Air pollution is regarded as an on-going threat to public health and is linked to an estimated 400,000 premature deaths in the EU each year [
1]. Given the complexity and impact of air pollution, the EU has introduced the Air Quality Directives to set limit and target values for concentrations of major air pollutants [
2,
3]. These directives also prescribe in detail how to measure ambient air quality using standardized reference methods, with well-defined quality requirements. Hence, regulatory monitoring networks are generally strictly regulated and based on a limited number of advanced, quality-assured and therefore costly measurement stations. Due to their low spatial resolution, it is often difficult for regulatory measurement networks to meet all demands from local populations asking for detailed information about pollutants, for instance at their residence [
4]. Instead, such information is usually derived from models that come with considerable uncertainties.
As smart technology and Internet of Things (IoT) become more prevalent, there is the promise of low-cost sensors that will enable wide-scale monitoring in dense, supplementary networks [
5,
6]. The growing popularity of small low-cost gas and particle sensors, micro-controllers, and open-source programs will increasingly allow citizens to gather air pollution data. Citizens start to measure air quality in their own backyard, form their own neighbor watch, and reach out to Environmental Protection Agencies (EPAs) for knowledge and guidance, but also with their sensor results. Many examples of citizen scientists measuring air pollutants already exist [
7]. An example of a large-scale and successful citizen science project is Luftdaten [
8]. This project started by the Open Knowledge Lab at the local level in Stuttgart (Germany), is now supported in seven languages and has participants from all over the world. Similarly, inspired by technological advancements, many municipalities work on the concept of becoming a ‘smart city’, based on the premise that data collection from all kinds of sources, including sensors, helps to manage cities efficiently.
For authorities and science communities, sensors may provide a low-cost addition, or ultimately even alternative, to the reference and official equivalent measurement methods defined in the European Air Quality Directive (2008/50/EC). Low-costs sensors allow monitoring at a much higher spatial and temporal resolution. In addition, due to their low cost, these monitoring systems become available for other users and uses. For example, when coupled to GPS and/or smartphones, citizens could estimate their exposure when residing in complex urban areas, traffic junctions, street canyons, and other polluted places. However, the increasing interest in low-cost air quality sensors brings, besides major opportunities, also some important challenges. Currently, the quality of sensor measurements is an issue, as performance may vary spatially and temporally [
9]. This makes it difficult to interpret sensor data, especially for citizen scientists with limited background and statistical knowledge. Moreover, authorities are quite often concerned that air quality measurements from sensors will be used in legal procedures despite the fact that they lack an official status.
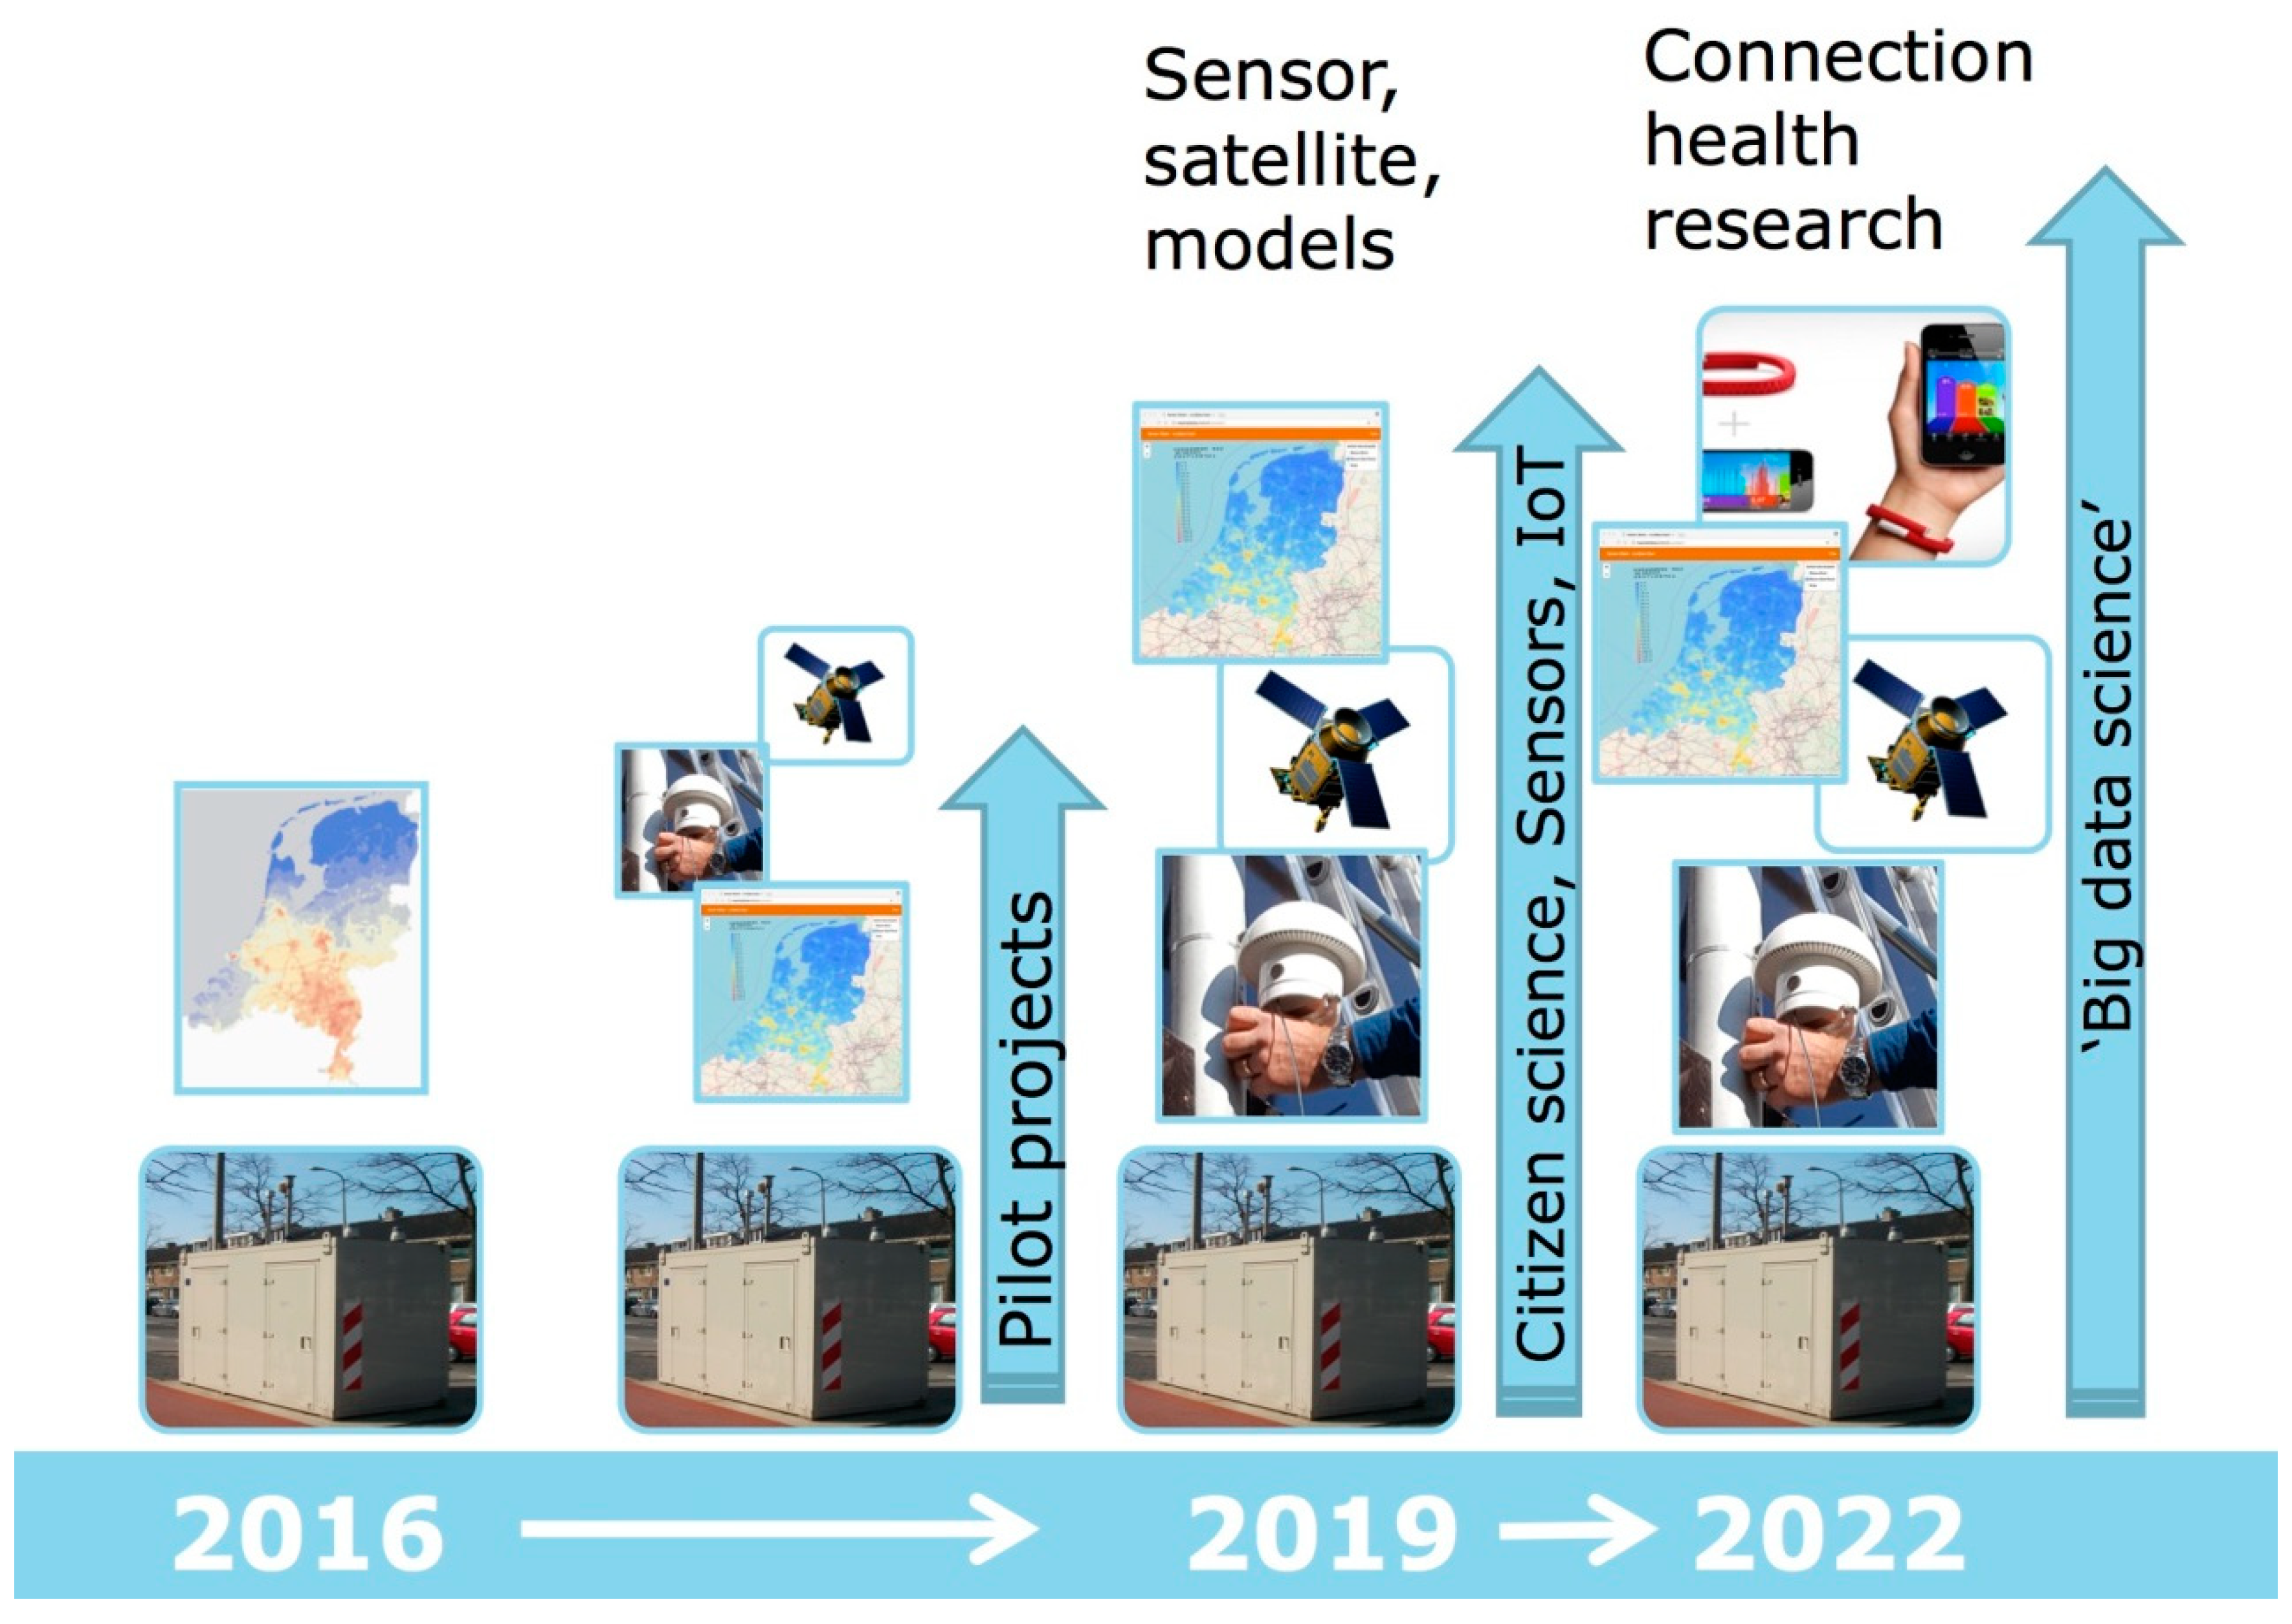
In response to these rapid technological and societal developments, RIVM and the Dutch Ministry for Infrastructure and Water Management have started a program to innovate the national air quality measurement network. This “Innovation Program for Environmental Monitoring (IPEM)” aims to include small sensors, citizen science, and new modelling techniques as an integral part of the monitoring system. The IPEM started in 2016 and runs for approximately five years. The main milestones of the program are depicted in
Figure 1. It is anticipated that the current Dutch network for measuring air quality will evolve to a hybrid system of a high-quality reference base supplemented with large amounts of sensor data collected by citizen scientists, municipalities, companies, etc. Ultimately, the aim of the program is a crowdsourced system that provides local communities with detailed environmental data, while simultaneously enriching the national monitoring system. Equally important, this new approach encourages experts to communicate methods and findings in a way that appeals to their citizen audience.
As a national EPA, an important task for RIVM is to remain an independent and impartial judge of air quality findings, irrespective of whether these are obtained by official measurements or by new sensor technology. Consequently, there are a few challenges that apply specifically to EPAs. For example, it might be tempting for EPAs to prioritize the testing of sensors and to wait to engage with citizen scientists until sensors meet official quality criteria and can be used for monitoring. However, to support citizen science and to be able to make good use of the data, an EPA also needs to devise ways to calibrate and employ the data, and build the infrastructure and communications channels to facilitate the citizen science community, while taking into account their needs and feedback. In addition, it might be best for official monitoring purposes when sensor measurements are standardized, i.e. everyone uses the same sensor and measuring procedure. However, this would limit the freedom of citizen scientists and might impede progress as employing a wide range of sensors in the field provides a real-world ‘test lab’. Therefore, an EPA needs to balance its own potential preferences with those of a wider range of stakeholders, including stakeholders that are traditionally somewhat out of scope for a national EPA: citizens, municipalities, and enterprises. All this needs to be done while simultaneously performing the traditional EPA tasks, which include many legal obligations. These challenges thus require an approach that is flexible enough to accommodate different users and usages, while at the same time is focused enough to work towards the goal of a system where official measurements and citizens’ measurements are combined.
This paper describes the building blocks of our “Innovation Program for Environmental Monitoring”, which consists of the development of a knowledge portal open to contributions from others, new calibration approaches for low-cost and uncertain sensors, a (sensor) data portal with visualizations for citizens and modelling and assimilation techniques for incorporating these uncertain sensor data in air pollution models. Our approach will be illustrated with a few use-case examples. The full technical details of the examples will not be presented in this overview article, but will be described at a later stage.
Important scientific questions associated with this innovation program include the overall uncertainty of a large number of low-cost sensors compared to that of the traditional monitoring systems with low spatial resolution, which are discussed conceptually in this paper. Furthermore, we will discuss experiences with citizen science approaches that help EPAs shape new science–society relationships in a more interactive and reflexive way. In doing so, our reflections will help improve understanding of the value of low-cost air quality sensors within the wider context of air quality monitoring and citizen science, and how the role of EPAs might change.
2. Citizen Science
The main reason for RIVM’s early involvement in citizen science projects was the rapidly developing market for low-cost sensors, which lead to many people measuring air quality in their own backyard. To understand how air quality sensors were being used, it was necessary to engage proactively with existing citizen science communities and to understand their needs. RIVM has therefore been participating in citizen science projects on air quality since 2012. The nature of these early projects, the degree of involvement and collaboration partners have been described in detail elsewhere [
10]. Despite the varying nature of these projects, RIVM’s main input in these citizen science projects revolved around some common themes, primarily around the need for expert information on questions like:
What is air quality?
What are the regulations and policies around air quality?
How do you measure air quality? What sensors are there on the market?
What is the quality of the (sensor) measurements?
How to put the sensor measurements into a broader context?
These questions overlap with RIVM’s core business: the monitoring of air quality. However, to engage constructively with citizen scientists, citizen science groups and local authorities, expert information had to be made easily accessible for citizen scientists. Therefore, a knowledge portal—currently available as “
www.samenmeten.nl” (measuring together)—was built to provide the expert information requested by citizen scientists. This knowledge portal was presented at a symposium in December 2016. Attendants at this symposium were citizen scientists, policy makers from the Ministry of Infrastructure and Water Management, local authorities, local health organizations, and specialists from research institutes. The primary aim of the symposium was to exchange information, look for ways to connect and collaborate, and to search for a way forward in citizen science and air quality. Attendance at this first symposium exceeded expectations with more than 100 people present. Many policy makers and specialists were interested in citizen science but did not know exactly how to proceed. Therefore, the community “Measuring Together” was established, with its knowledge portal “samenmeten.nl”, as central hub for citizen science and air quality in the Netherlands. This knowledge portal provides information on air quality and sensors, but also on citizen science projects, information usually provided by the projects themselves. At the request of the citizen science community “Measuring Together”, RIVM has continued to organize meetings for people to connect and exchange information. Several citizen science meetings were organized with a growing audience, including an international meeting in 2017: “Status of Air Quality Sensors and their use in (official) monitoring strategies” [
11].
In short, the air quality citizen science community around “Measuring Together” has been built gradually. First by participating in individual CS projects, by learning from these projects what was needed and by moving forward in small but concrete steps, each time verifying whether the steps were supported by the community.
Example: Succesful Encouragement of Citizen Sensor Use
RIVM has actively encouraged the use of low-cost sensors in the Netherlands. One successful activity was measuring dust from fireworks during New Year’s Eve. This took place for the first time at New Year’s Eve 2016/2017. In December 2016, at the end of the first symposium on citizen science and air quality, 65 cheap dust sensors (Shinyei PPD42) were distributed among the audience using a lottery. Participants were instructed to make a weatherproof housing to mount the sensors outside to increase the participant’s feeling of ownership and responsibility. Each sensor was already connected to an ESP8266 Wi-Fi communication chip. The results of the measurements were automatically sent to the RIVM data portal where they were visualized. Combined with 25 other similar sensor kits, the effects of fireworks on dust concentrations were measured using a total of 90 cheap dust sensors.
The measurements during New Year’s Eve 2016/2017 attracted a lot of media attention. For instance, a newspaper headline read: “Fireworks dust peak finally measured”. Although inaccurate, as fireworks dust is measured every year without fail by our colleagues using official reference measurements, this headline is a great illustration of the potential of citizen science measurements to attract attention to air quality issues. The measurements also figured on social media, particularly on Twitter where “Measuring Together” (active as @samenmeten) received messages from several citizen scientists offering data, and embracing the data and posting results faster than we could do ourselves.
Aware of the impact from the 2016/2017 fireworks project, RIVM distributed the next year some 65 more modern dust sensors (Nova SDS011) [
12] among several citizen science projects in Dutch cities. By this time, a community of citizens building their own sensor kits had started to grow in the Netherlands, some of which used the Long Range (LoRa) network for acquisition of the data. In total, 150 sensors measured the effects of fireworks on the PM
10 and PM
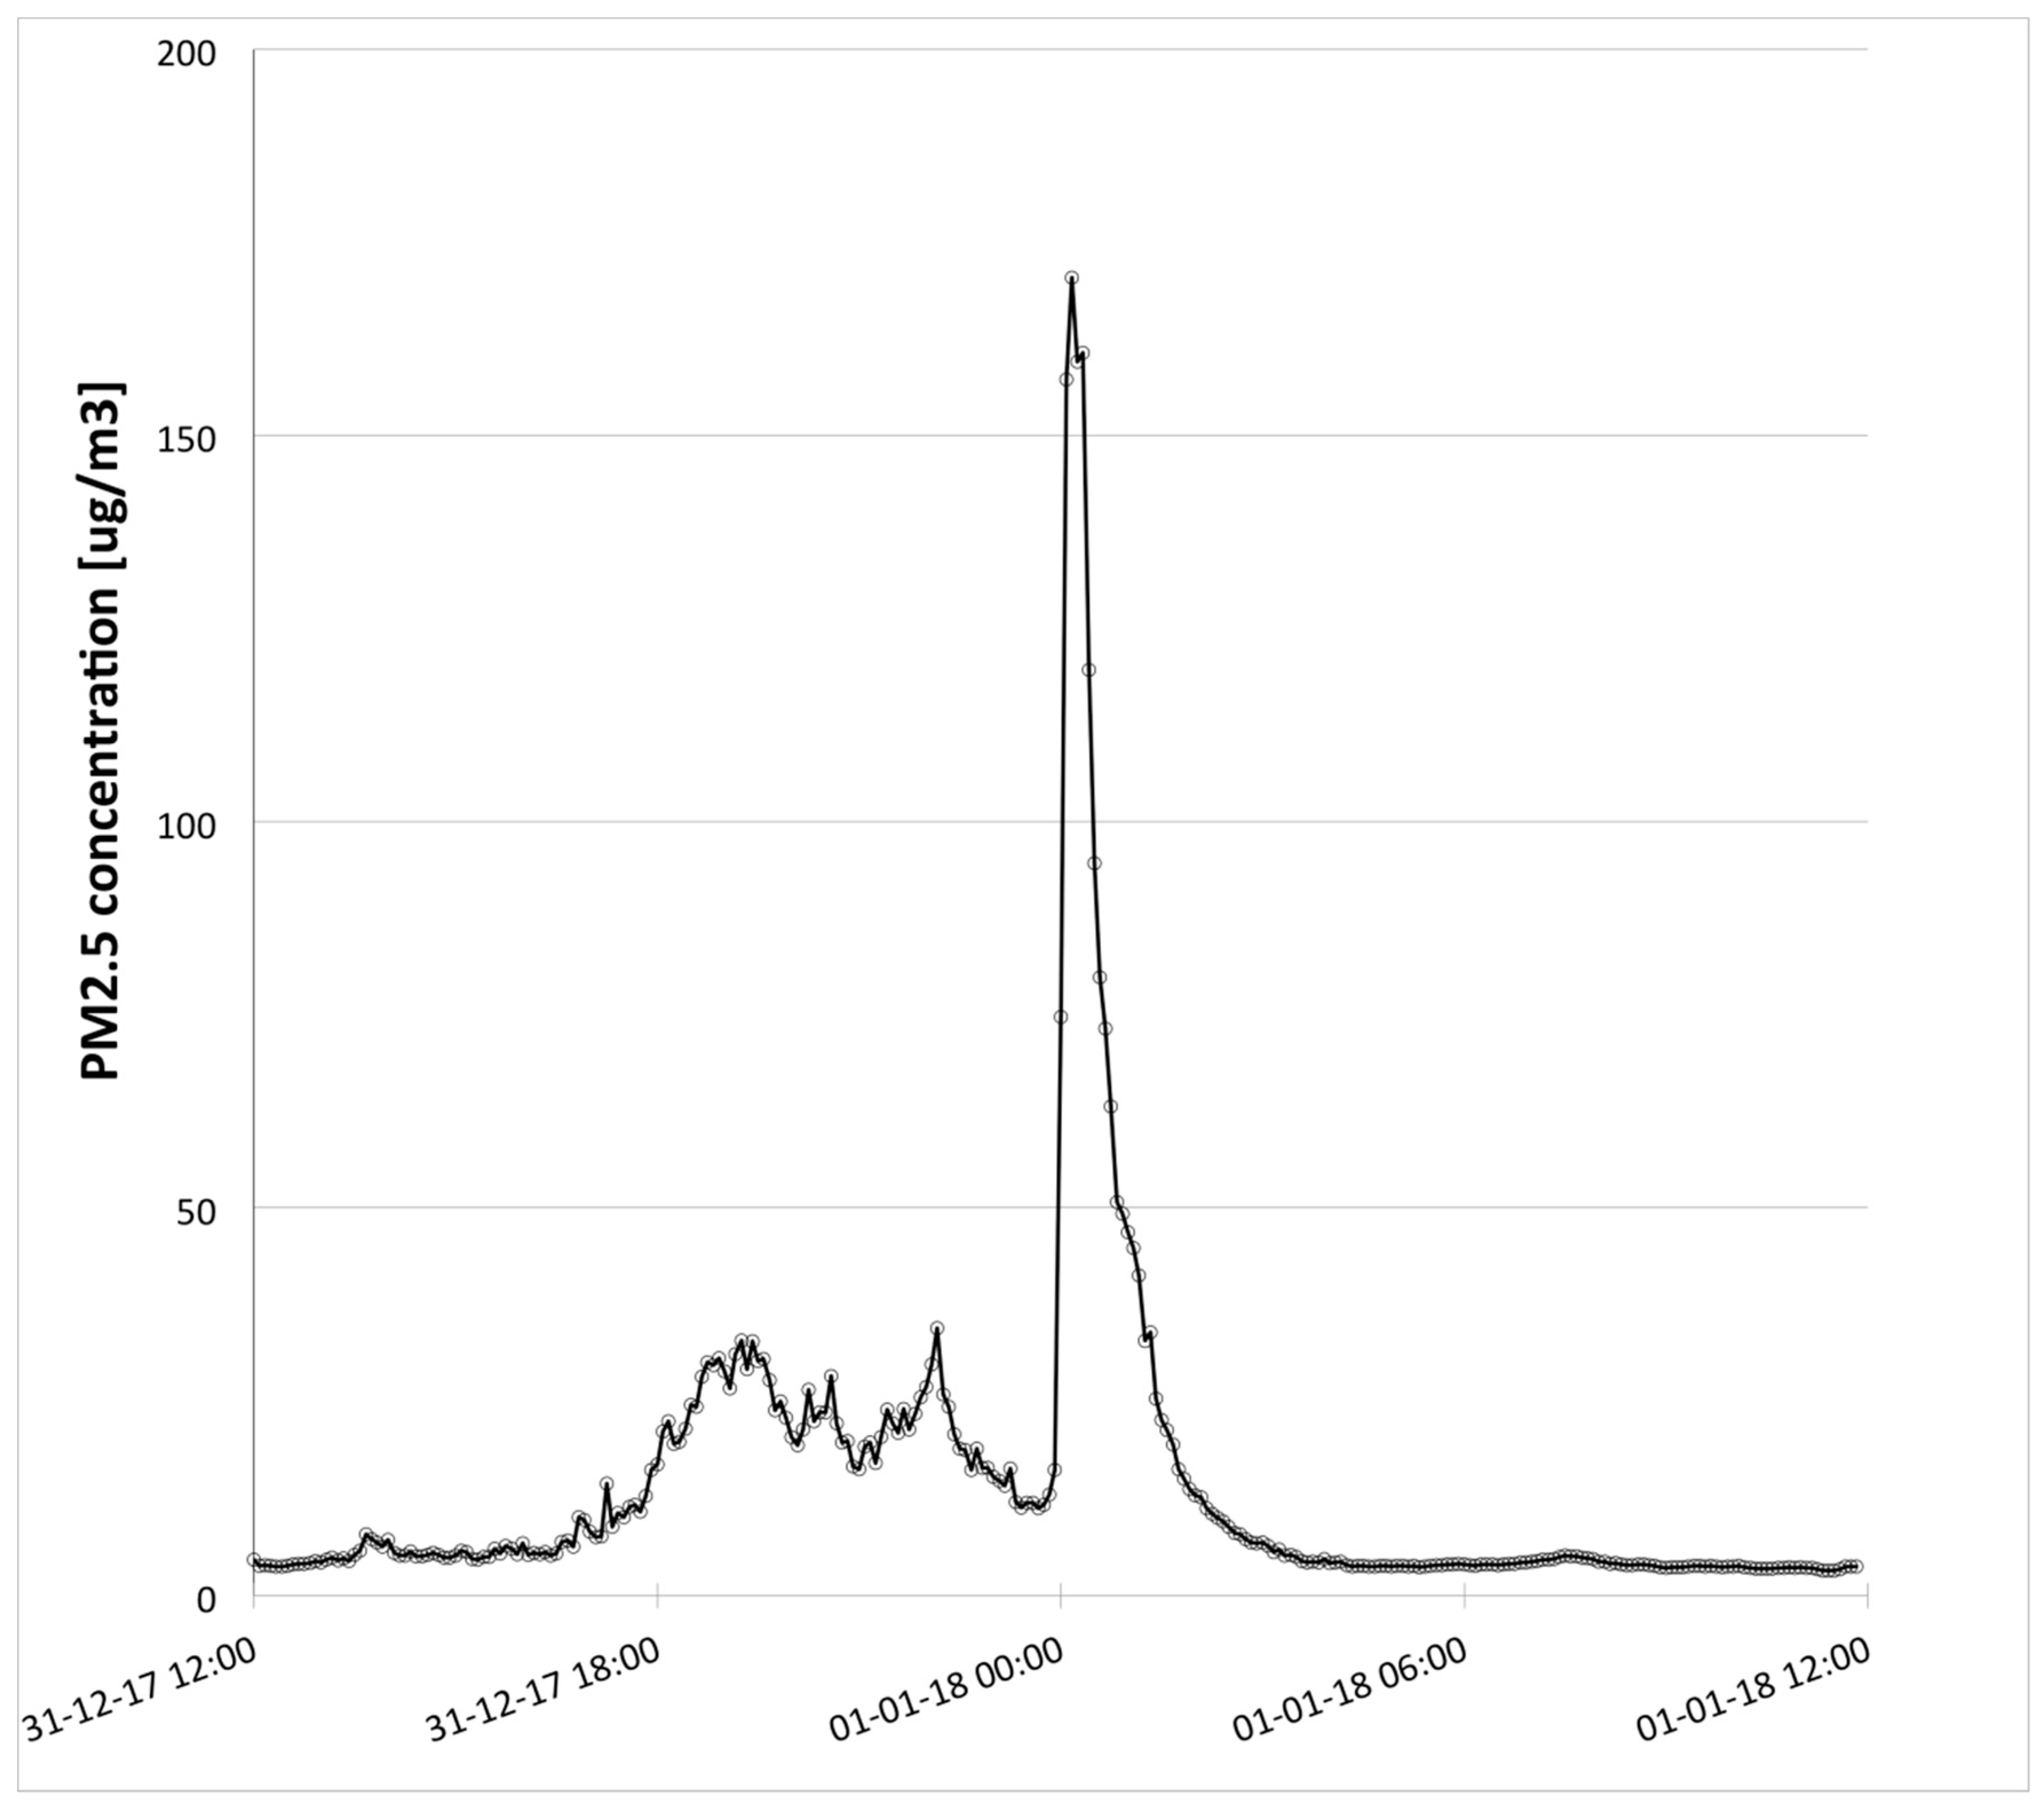
2.5 concentrations during New Year 2017/2018. Finally, during New Year’s Eve 2018/2019, a thriving community with approximately 350 dust sensors, mostly SDS011, showed how dust concentrations quickly increased after the fireworks started.
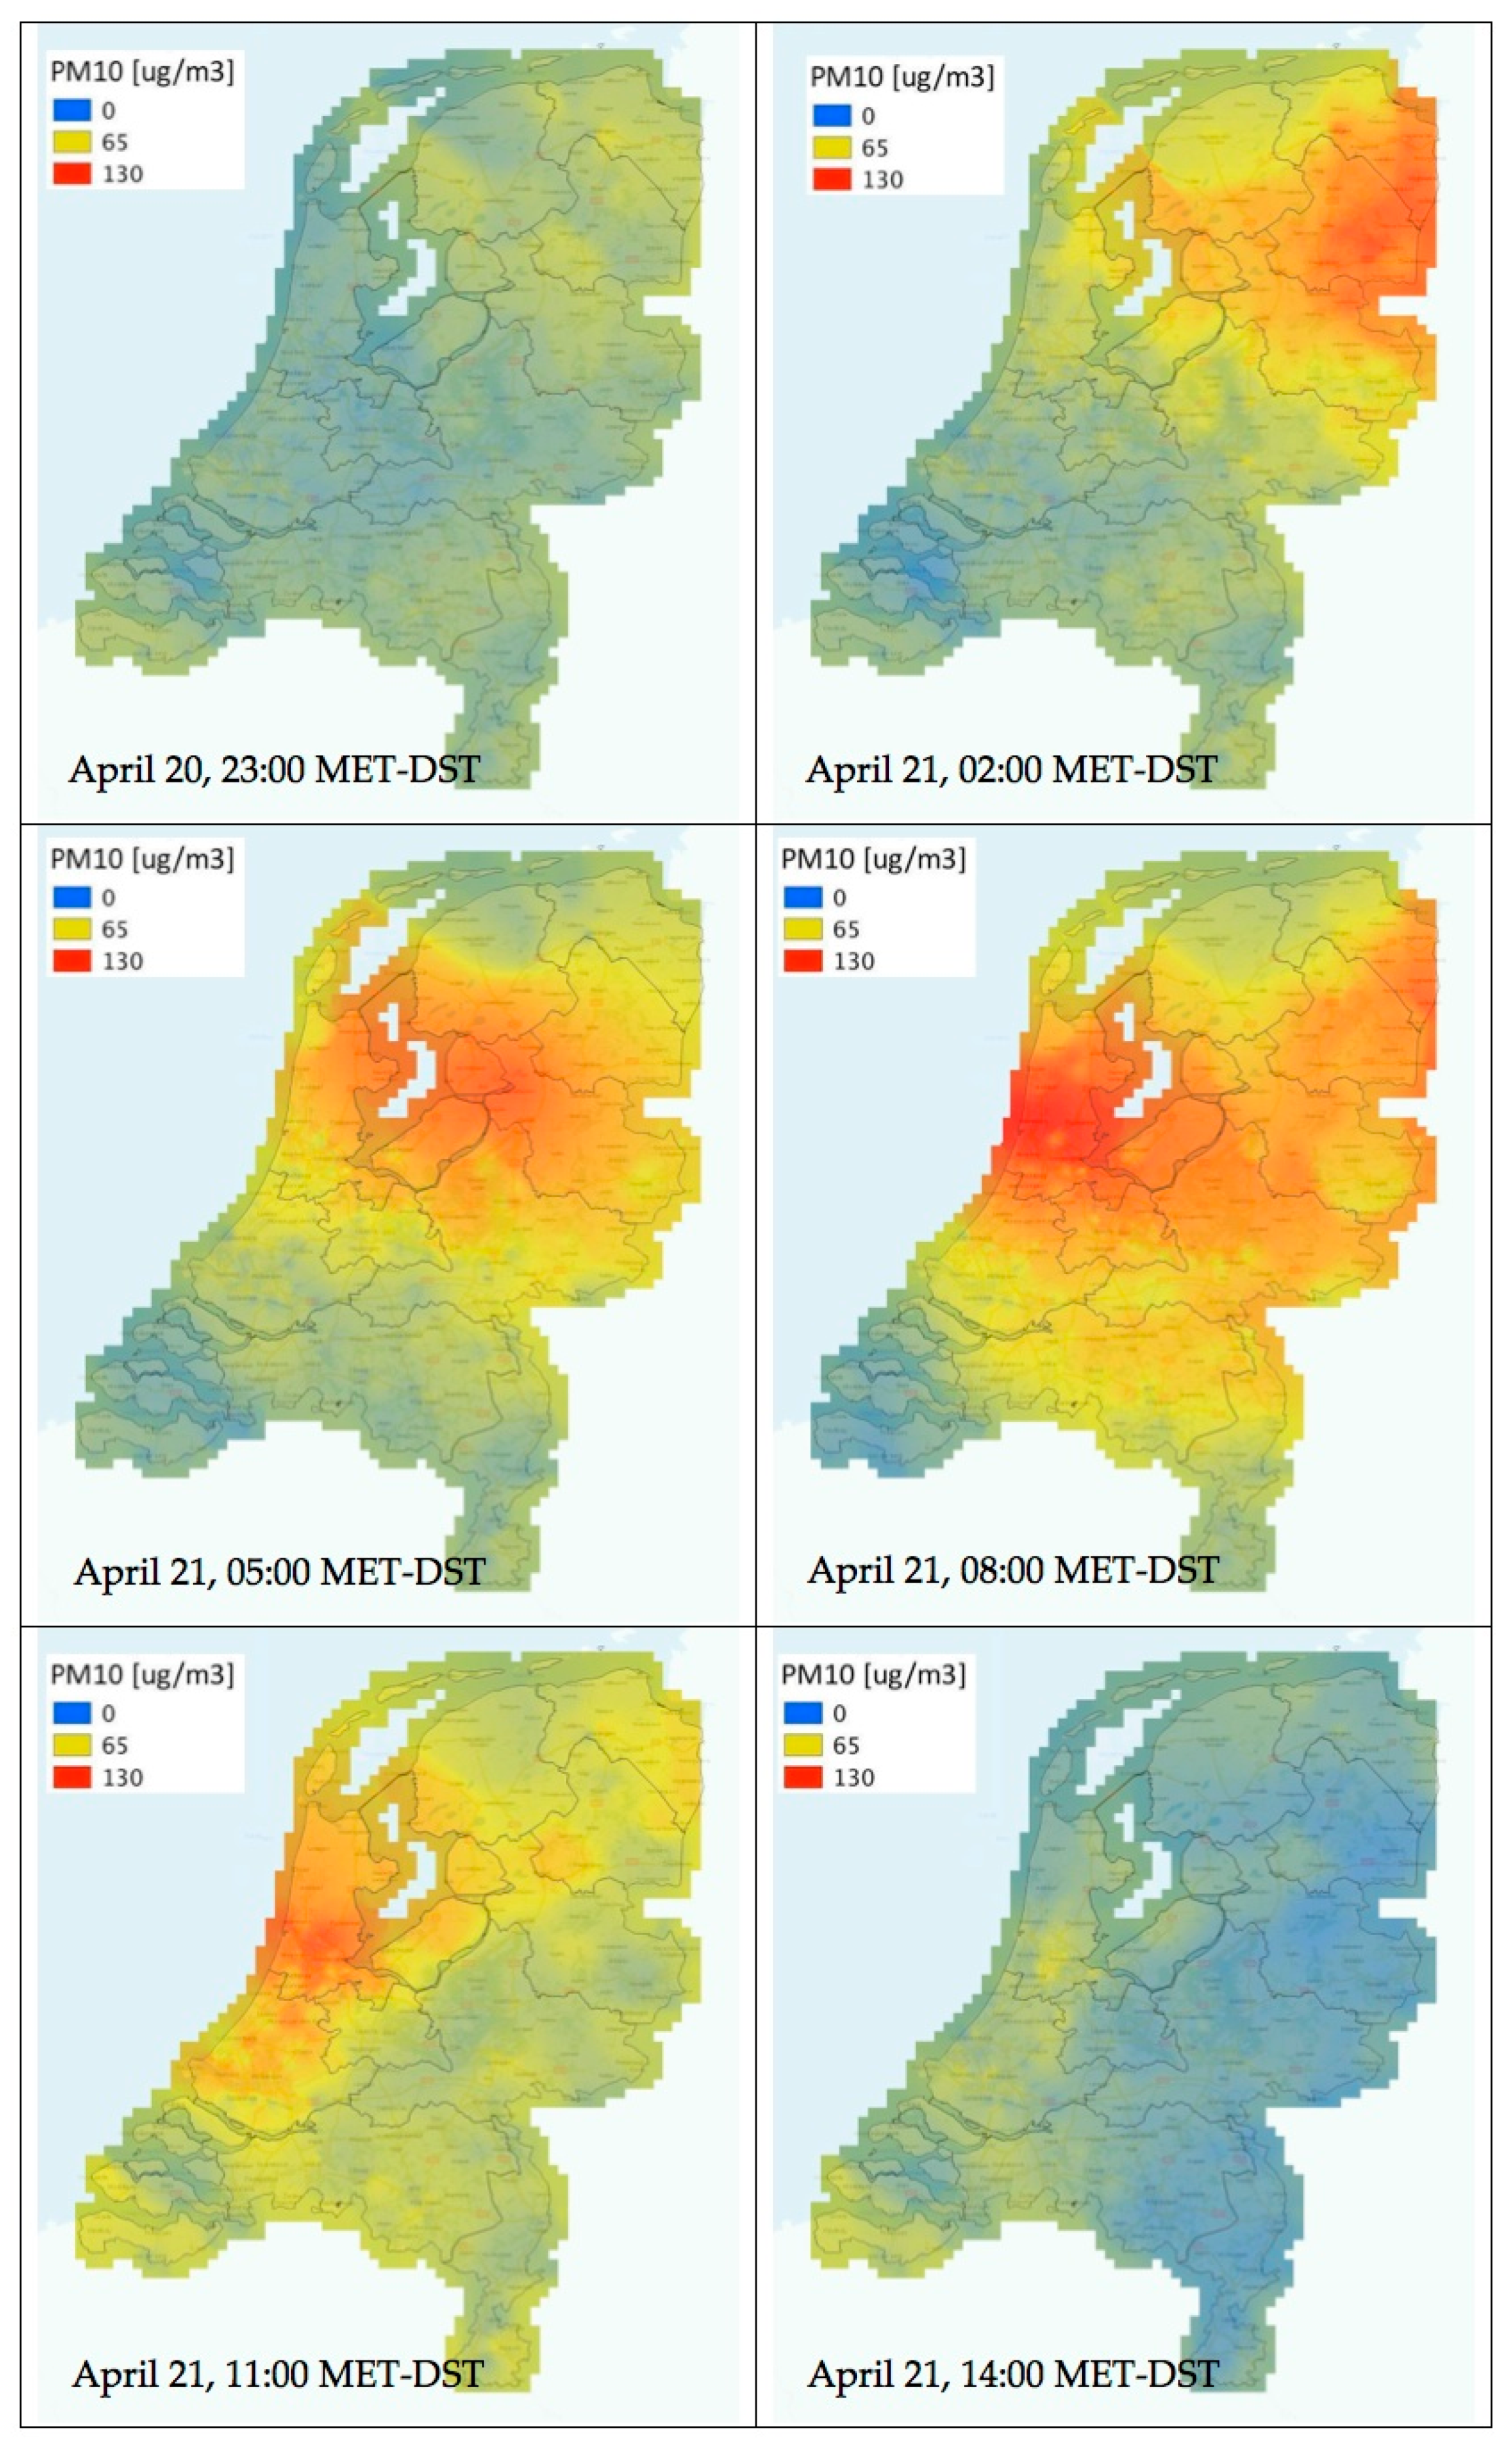
The results from these three measuring campaigns show that sensors registered increases in PM
2.5 and PM
10 concentrations of factors 16–25 between midday on December 31 and the start of the New Year. After only a few hours, concentrations were back at the same levels as the day before (
Figure 2).
All data was instantly shared with both participants and the public. The data was analyzed by both professionals as well as others.
Thus, the Fireworks-project helped to build, unite, and enlarge the air quality citizen science community in the Netherlands. It also further inspired RIVM to build a “Measuring Together” data portal open for all citizen science projects to upload their data, see
Section 5.
3. Calibration of Sensors
The technological potential of sensors is associated with new challenges: the reliability of the measurement results is often inadequate, even for applications where lower accuracy is sufficient, such as in citizen science projects. RIVM has therefore initiated several studies not only assessing the quality of single sensor data, which are influenced by varying meteorology and possible interfering gasses, but also improving their measuring performance (see below). This is not purely a scientific exercise but takes place in cooperation with citizens, manufacturers and authorities. In the end, this should lead to a selection of (sets of) sensors that can be used in official monitoring and modelling, as well as in other applications like citizen science initiatives.
3.1. Calibration of NO2 Sensors
There are approximately fifty sensor kits with NO
2 sensors operating in the Netherlands (status June 2019), with about thirty operated by RIVM. The Alphasense B43F NO
2 sensor [
13] is employed in all of these. To our knowledge, this sensor is one of the few that starts to give sensible results at ambient NO
2 levels, presently roughly 15–25 µg/m
3 (yearly average), although it must be noted that the performance of the sensor is better at higher concentration levels.
Analysis of the results shows that the NO
2 sensor can be calibrated successfully using a comparison to reference measurements. Calibration algorithms are derived for individual sensors using multi-linear regression models to account for influences of meteorology and ozone. These are applied real time, using meteorological data and hourly maps of ozone based on a combination of a model and reference measurements. Presently, a relatively simple formula is found to work well to calculate NO
2 from the output voltage of the sensor and several environmental parameters:
where
NO2 is the NO
2 concentration derived from the sensor (in microgram per cubic meter);
Vsensor is the output voltage of the sensor (in Volt);
O3
ambient is the ambient ozone concentration at the location of the sensor (in microgram per cubic meter);
Tambient is the ambient temperature at the location of the sensor in °C.
The parameters
a0–
a4 in Equation (1) are obtained by co-locating the sensors with official measuring equipment, collecting several weeks of data and subsequently fitting the parameters individually using the software packages R (version 3.3.3) [
14] and RStudio (version 1.0.136) [
15], using the multi-regression routine
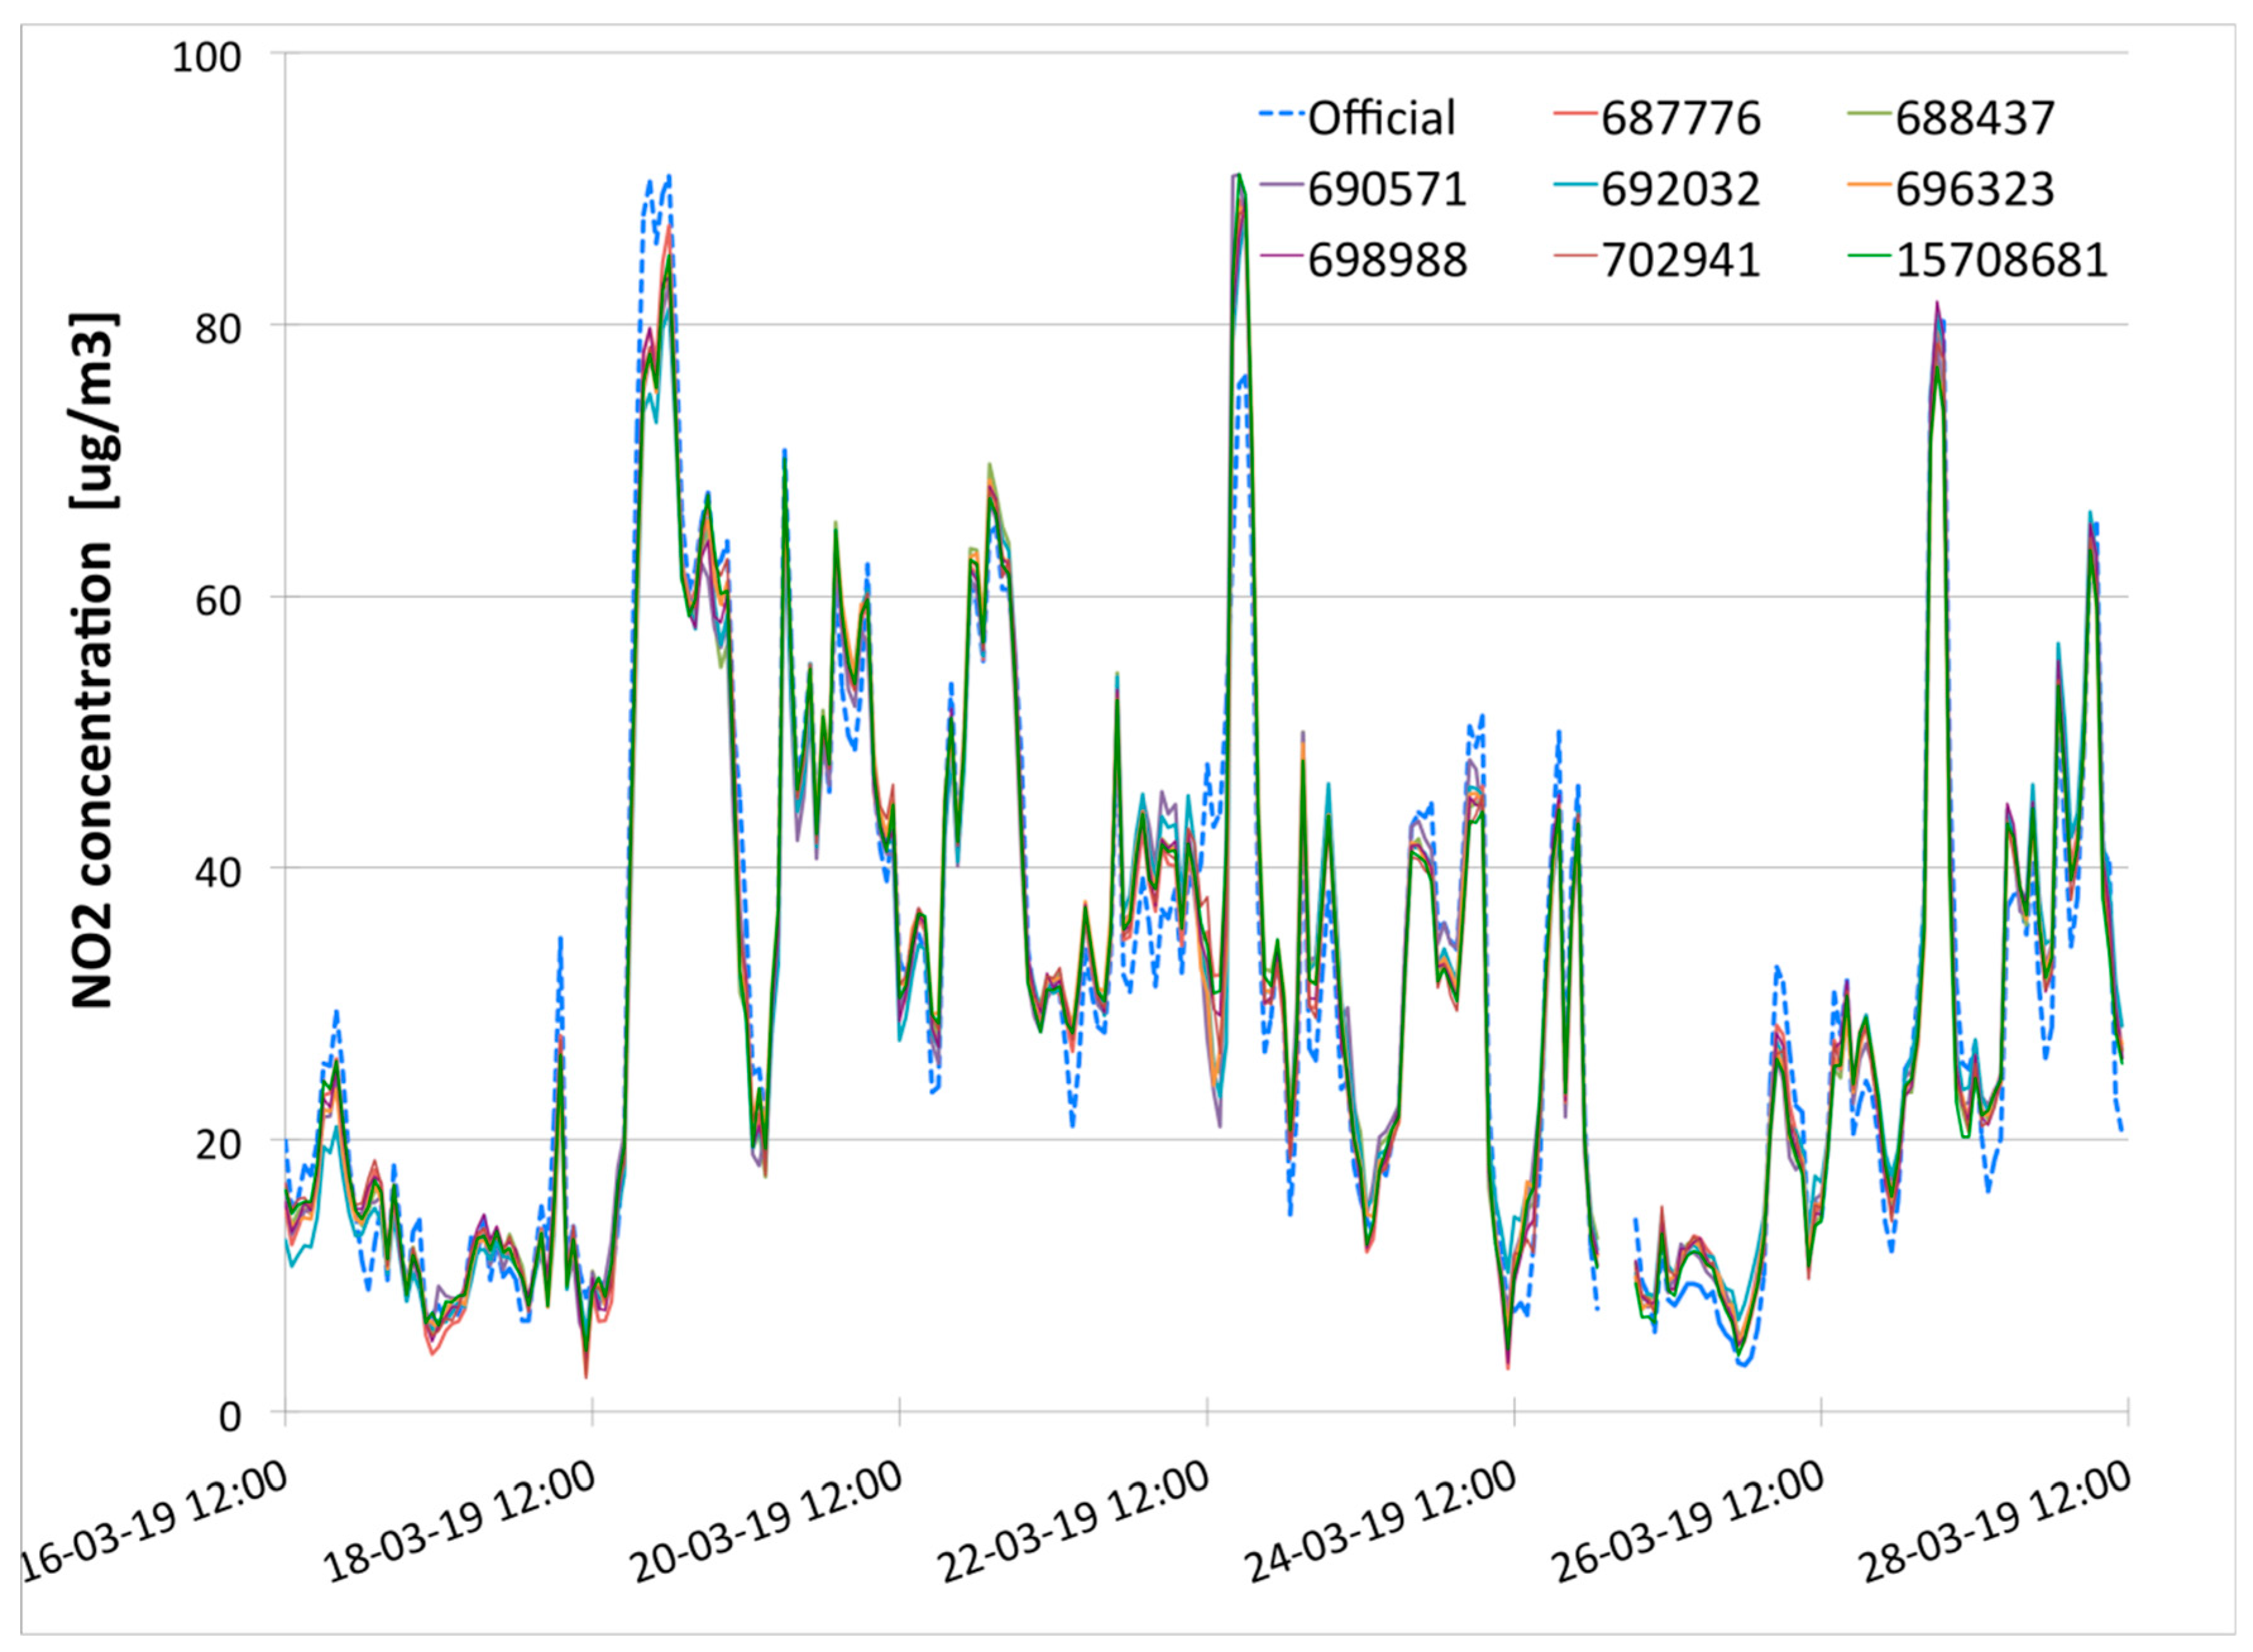
lm. The result of a co-location experiment comparing a set of eight low-cost sensor systems measuring NO
2 with a reference instrument during several weeks is shown in
Figure 3. The results of the sensors, after fitting the calibration parameters, follow the result of the official measurements very closely. The correlation coefficients between the individual sensors and the reference measurements shown in
Figure 3 are all higher than 0.95.
However, some of the sensors drift and the sensitivity will change significantly over time. Several calibration strategies are being tested to detect this drift and change in sensitivity, and to correct for it. The simplest method is to re-calibrate each sensor after a specific period in the field, say 2–3 months, but this is less feasible in practice as the number of sensors increases. A slightly more complex method is based on the assumption that during the night there is limited variation in NO
2 concentration. During the night, the calibration of the sensors can be verified by comparing the results of sensors to nearby official measurements [
16]. If there are no nearby measurements, an interpolation between measurements or model information can be used. When significant differences are observed, nightly concentrations are used to adjust the parameters in the calibration. The ‘nightly calibration’ not only assumes limited local gradients in NO
2 gradients, but also assumes that the effects of diurnal ozone variations are limited. There are substantial uncertainties in these assumptions. However, these uncertainties seem less than there will be in case the sensors are allowed to drift without any adjustment. Tests performed by both RIVM and others indicate that the RMSE between official measurements and co-located sensors after applying the ‘nightly calibration’ is comparable to that obtained using calibration over the whole period [
17].
Preliminary results from measurements obtained with the Alphasense B43F, indicate that calibration and use of these sensors in the winter can result in very stable results, but in the summer the results are rather poor [
17]. Possibly the sensor does not perform well at higher temperatures, which might be caused by as of yet unknown interferences, and/or because the NO
2 concentrations typically observed during summer lie close to or below the detection limit.
3.2. Calibration of PM2.5/PM10 Sensors
Sensors for particulate matter have their own unique problem: humidity [
18]. Dust sensors do not actually measure dust mass but they use an optical system, mostly a laser, to detect the passage of particles [
12]. Proprietary algorithms from the manufacturers estimate the number of particles from the optical signals and their estimated sizes. Particle numbers combined with estimates for the average density then provide an estimate of the amount of mass in the air.
When the relative humidity approaches 100%, for example during fog episodes in the morning, the sensors interpret small drops of water as particles, creating concentration peaks. Citizen scientists quite often interpret these peaks as pollution due to the morning rush hour. RIVM has developed an approach to perform a real-time correction for meteorological conditions for (groups of) the Nova SDS011 sensor (see
Section 4).
Corrections for sensors can also be obtained by comparing results of sensors to those of nearby official measurements over a long period and subsequently determining empirical relations. This is similar to the procedure used for NO
2 sensors, but the relation used for the calibration is different. As a spin-off of the 2017/2018 citizen science measurements of fireworks, a substantial number of SDS011 sensors was operating in the city center of Amsterdam. Combined with a number of sensors in Amsterdam participating in the Luftdaten project, there were some 20 sensors providing data in most or all of 2018. Amsterdam furthermore has a relative dense network of official measurements, maintained by the municipal health service. These measurements are performed using the BAM1020 from Met-One [
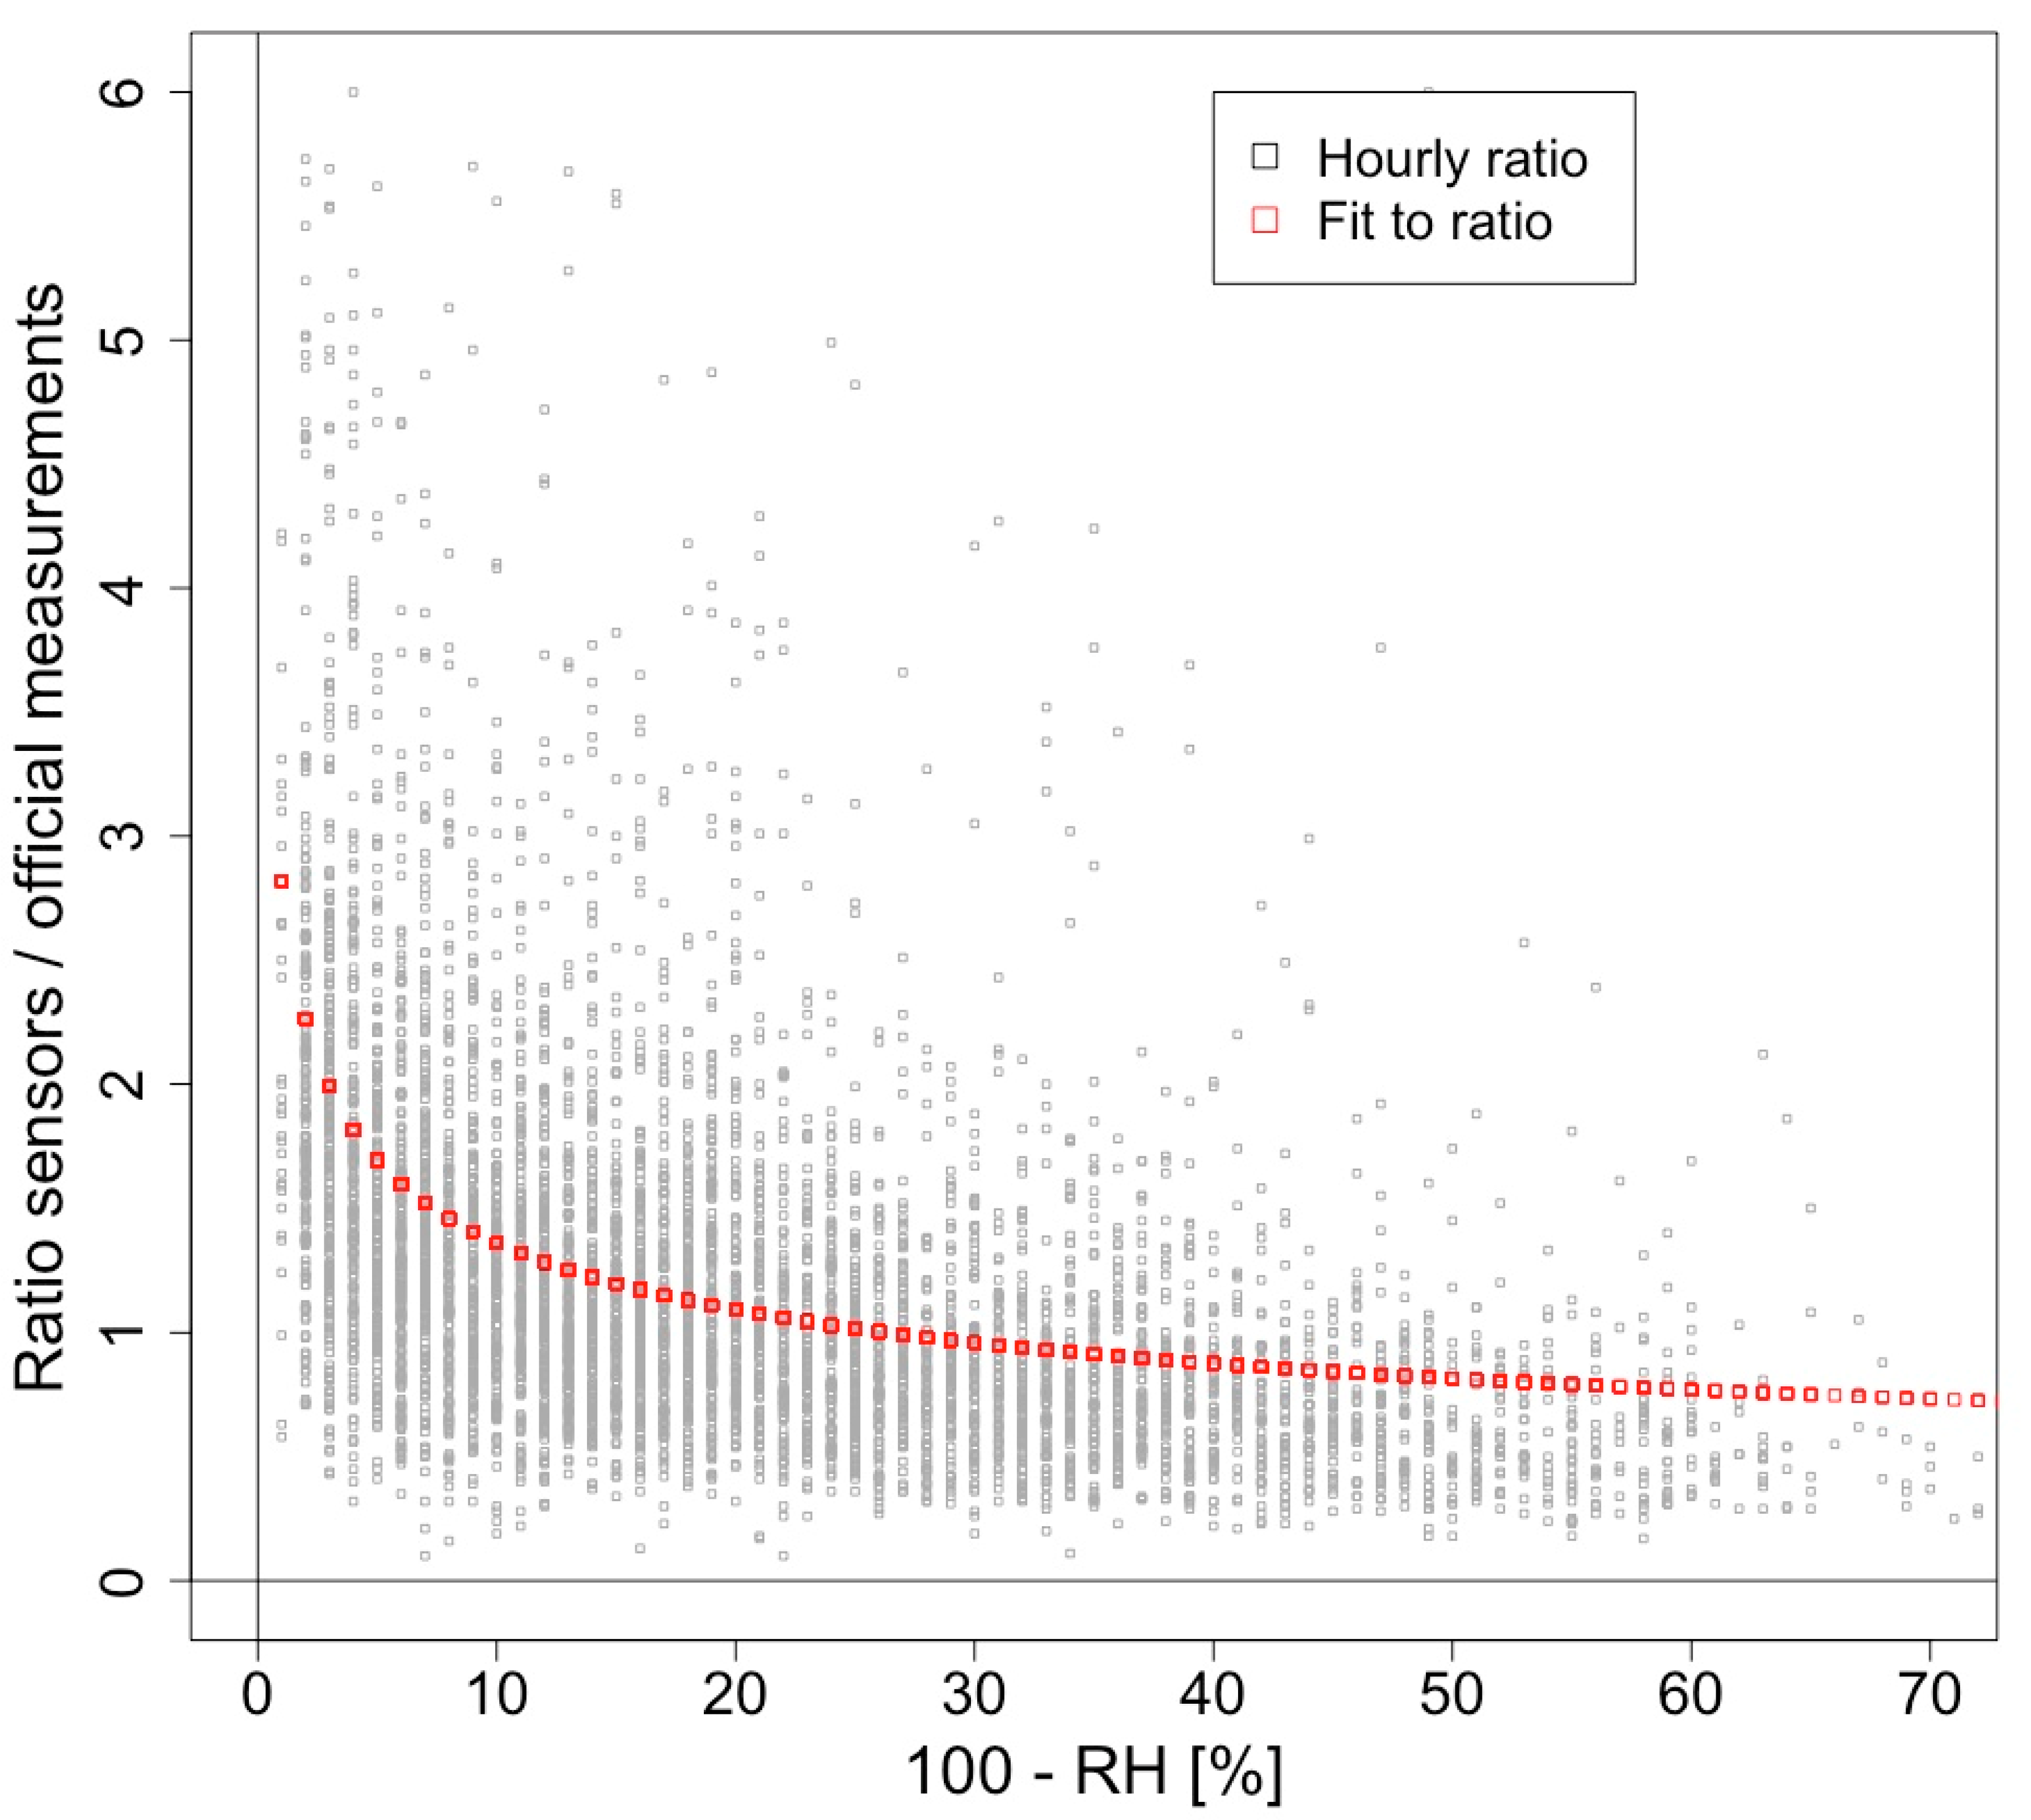
19]. Based on the official hourly measurements in Amsterdam during all of 2018, is it observed that there are, on average, only relatively small systematic differences between the measurement locations (approximately 15% for traffic and urban background stations). Although there are marked differences between hourly measurements at various locations, they tend to cancel out with respect to the average concentration in the center of Amsterdam. Therefore, the hourly average of the 20 sensors irrespective of their location was compared to official measurements at a central urban background location. The hourly ratios between the official measurements and the sensors were subsequently plotted as a function of the relative humidity, measured at nearby Schiphol airport. A simple relation of the hourly correction factors (CF) emerged:
With CF the (dimensionless) correction factor and RH the relative humidity (in %). Using (100-RH) instead of just RH makes it easier to fit a relation. The factor
a and power
b are fitted from the data using the packages R and RStudio with the routine for non-linear fitting
nls. For PM
2.5 the fitted parameters were
a = 2.81 ± 0.05 and
b = −0.32 ± 0.01. The hourly correction factors and the fit to the data are shown in
Figure 4.
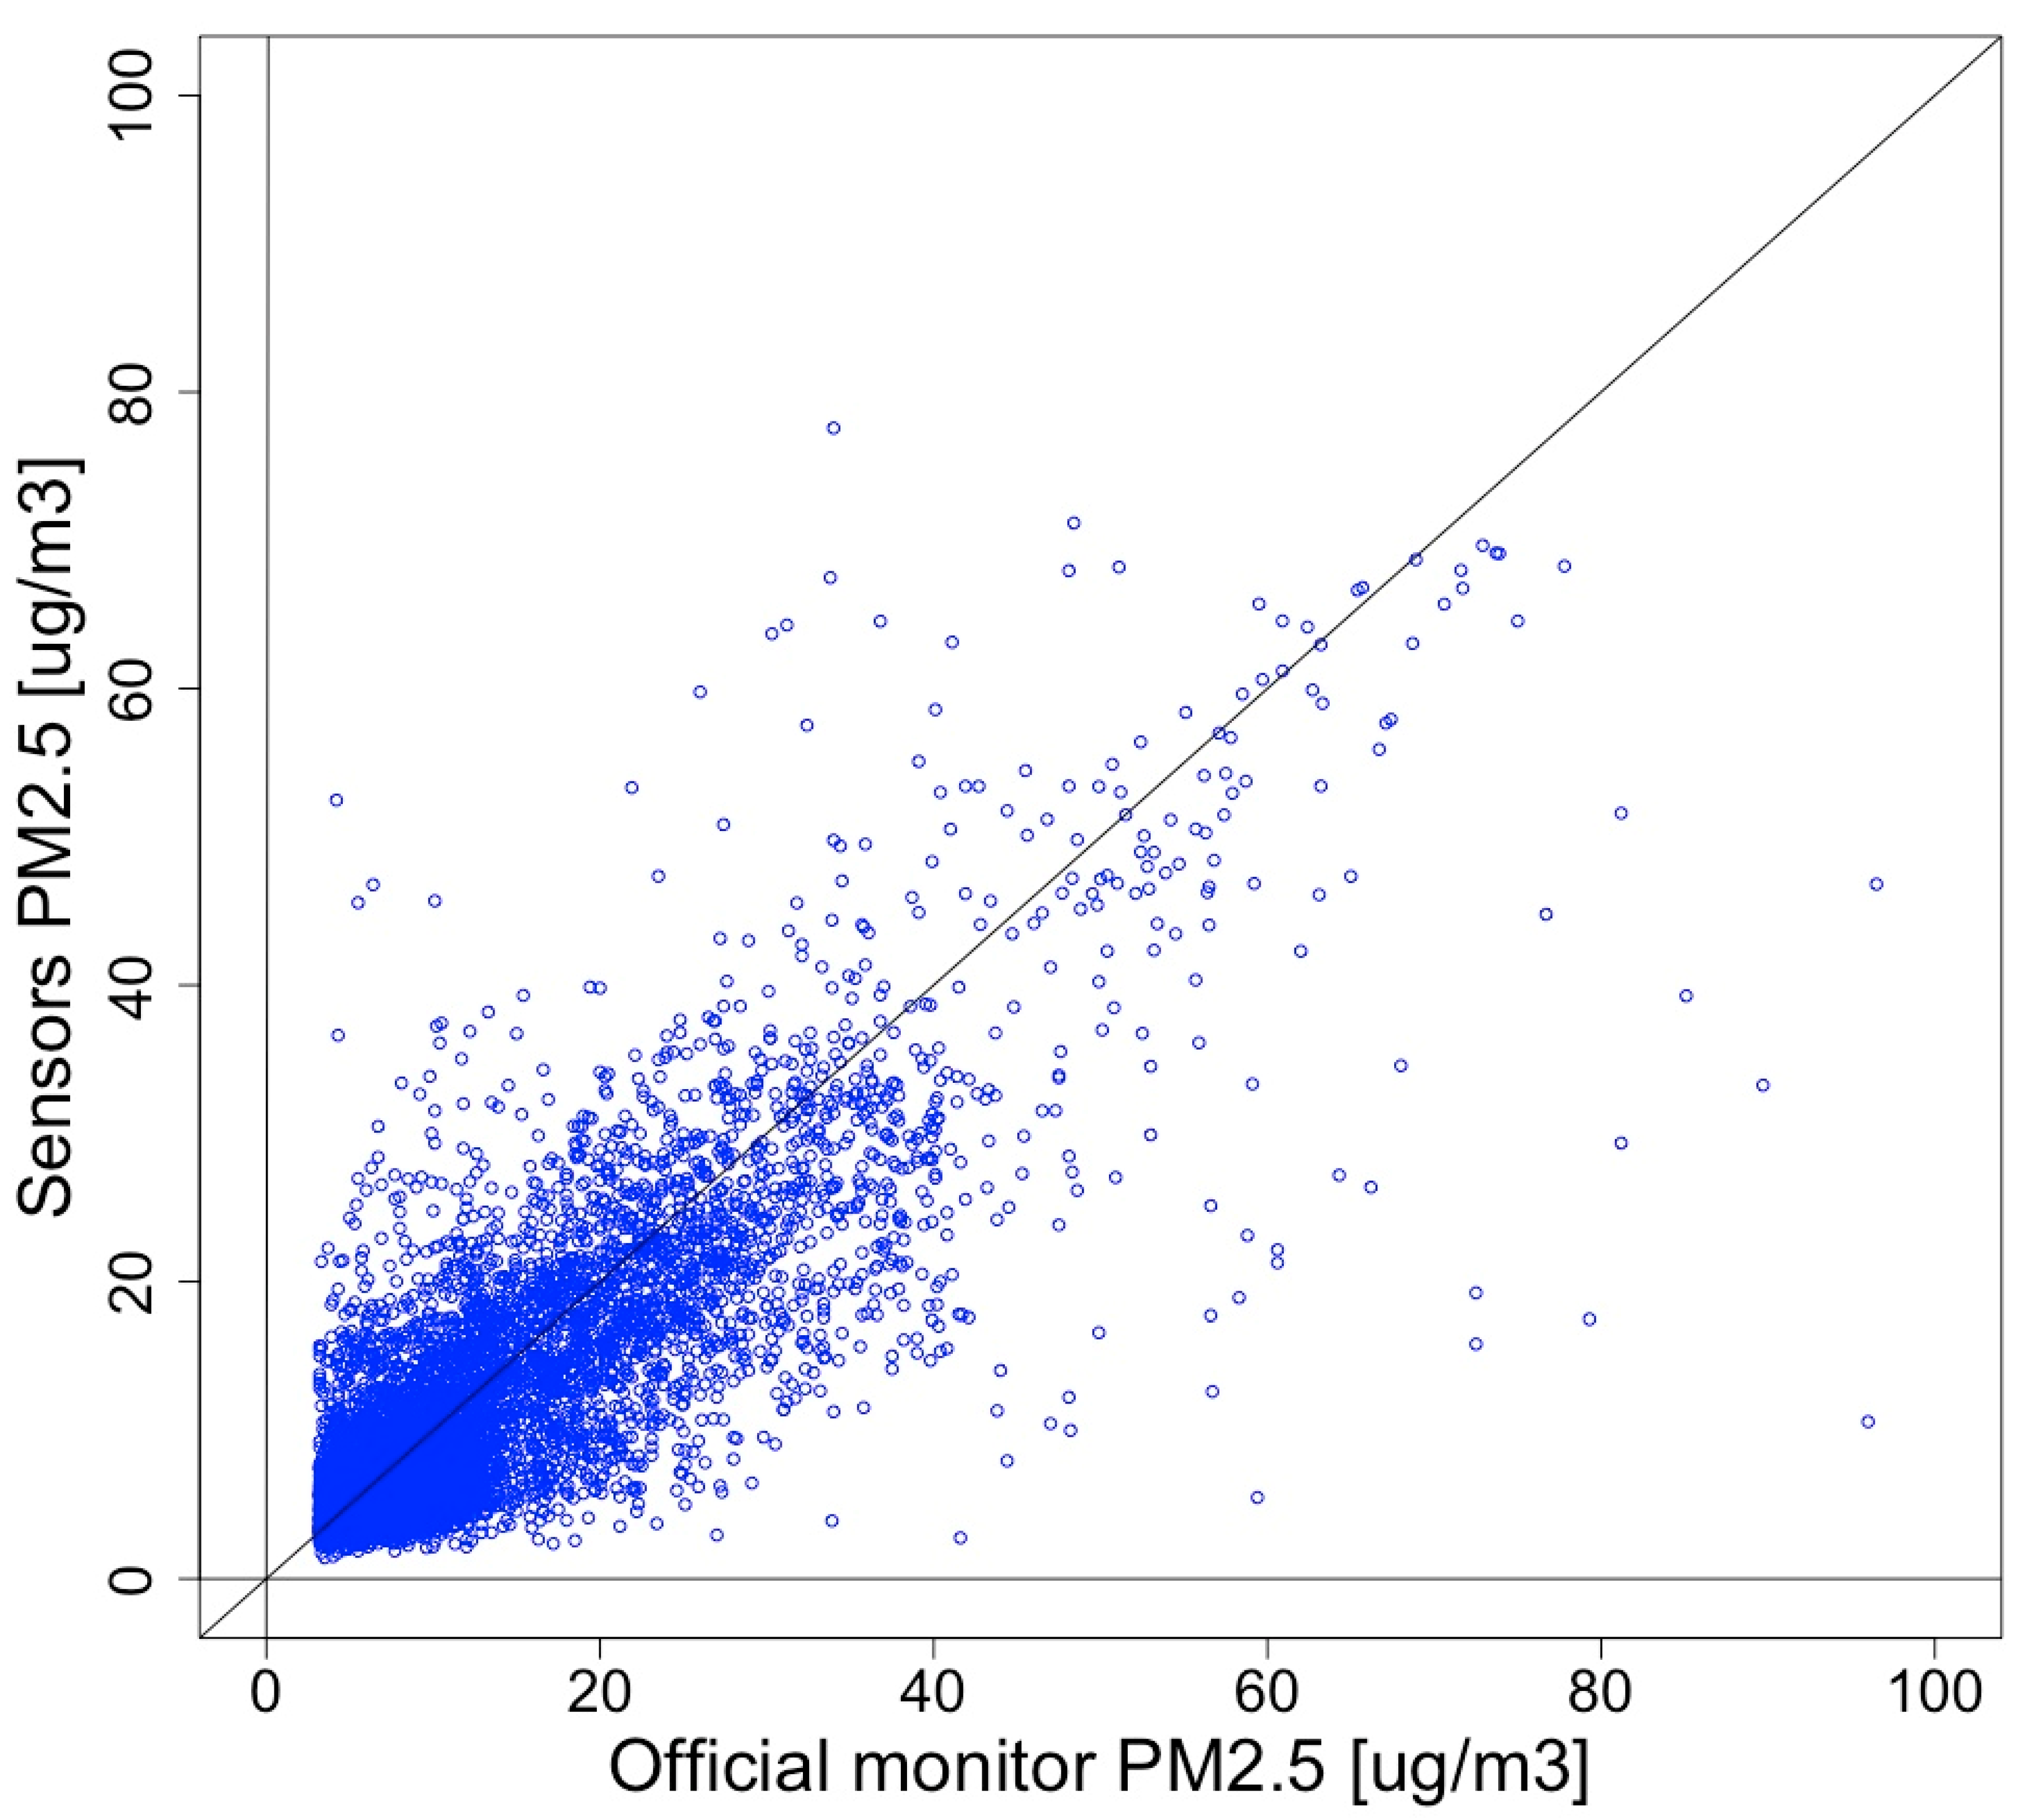
After applying the correction for relative humidity to the data, the correlation between the average of the sensors and the official measurements increases from 0.74 to 0.80. The result, after correction, is shown in
Figure 5. Additionally, the Amsterdam data were used to train and validate a Random Forest (RF) machine-earning algorithm. The results found by us as well as others indicate that RF can further improve the calibration of dust sensors [
20].
We have performed similar analyses for the PM10 measurements of the same sensors. On average, the sensors are less sensitive to larger particles. A correction, that includes the separate measurements of PM2.5 and PM10, is able to provide a reasonable correction for the effects of relative humidity. Research into the cause is on-going.
For more tests, around fifteen sensor kits have been deployed along roads on the grounds of Utrecht University, close to RIVM and a partner in several projects. RIVM and Utrecht University manage these sensors. The kits contain the Alphasense B43F NO2 sensor and the Nova SDS011 PM2.5/PM10. The sensor kits at Utrecht University also served as a testing ground to learn more about the housing of several sensors in one kit and, most important, about the best way to communicate the data to the server. The results of these sensors are open to the public and are part of an app that is being developed by students of the University of Utrecht.
3.3. International Cooperation
To assess and possibly improve the quality of low-cost sensors, RIVM also contributes to a number of European initiatives:
With the support of the European Commission’s LIFE program, the VAQUUMS project (Various Assessments of air Quality Measurement methods and their policy Support) examines which sensors can be a valuable addition to the reference measurements. It establishes the actual performance of sensor systems measuring particulate matter, ozone and nitrogen dioxide. After a selection of the most promising ones, the sensor systems are subjected to rigorous laboratory and field tests that give insight into their reliability. In the end, an instruction guide for correct sensor usage is to be written. The project also engages a dialogue with local governments, citizens, scientists and industry to define quality requirements for different possible use cases.
The CEN Technical Committee 264 (Working Group 42: ‘Sensors’) develops a “Technical Specification” (TS) for air- and PM-based sensor systems. The draft TS so far is based on a combination of field co-location studies and laboratory tests. In the end, the protocol will enable a classification of (tested) sensor devices in air quality monitoring for regulatory and non-regulatory purposes (with a lighter experimental design).
RIVM has also cooperated in the AirSensEUR project organized by the Joint Research Centre (JRC) [
21,
22]. AirSensEUR boxes have been installed in sites of the national Air Quality Network of the RIVM, generating a large dataset for analysis.
The combined efforts from different (national) institutes, universities and organizations, as well as from many citizen scientists and groups are important to define the general quality parameters of the many sensors that are and will become available. Cooperation is important to obtain useful data on many sensors while still keeping the work required to a reasonable amount. EPAs might play an integrative role here as they are uniquely positioned between authorities, scientists, and citizens.
5. Data Portal
An important request from citizen scientists is the possibility to see their own sensor data, and to compare their own measurements to other sensors or official reference measurements. Therefore, RIVM has developed a data portal where sensor data are publicly available:
samenmeten.rivm.nl. To our knowledge, this data portal represents the most comprehensive and continuously increasing sensor dataset in the Netherlands, currently comprising over 500 sensors.
Everyone is encouraged to share air quality sensor data with RIVM. However, RIVM has a few requirements for sharing to improve data quality, including:
Type of sensor and modifications (for instance “air drying”) must be known. This is important in order to assess the quality of the data and to decide whether to include the sensor data in RIVM’s calibration algorithms.
All algorithms used to calibrate and post-process the data of sensors should be known; no “black boxes” are allowed. The use of proprietary algorithms in sensors is inevitable. However, subsequent treatment of the data by the producer or by the user should be reported and documented.
The owner of the sensor should be aware that the data will be made publicly available and that his or her location is shared on a map. The location of the sensors is randomly shifted by up to 50 meters every time they are shown on a map. This makes it more difficult for casual users of the website to establish the exact location of the sensor and thus provides a certain level of privacy for people who share their sensor data.
5.1. Data Acquisition and Storage
RIVM collects sensor data from a variety of its own projects, using multiple IoT techniques, such as Wi-Fi, LoRa, and Narrowband (NB-IoT), to harvest these data. Experiences with these techniques have been varied. Wi-Fi has been used by RIVM to upload the sensor data since the early days. The main drawback of Wi-Fi-connectivity is the number of operations required from the user. Technically skilled users generally have no problem connecting the sensor to their own Wi-Fi-network, but it proves difficult for others. Moreover, the Wi-Fi signal is more prone to failure especially when used with mobile networks (3/4G), leading to messed-up or missing data. Therefore, other sensors are equipped with LoRa, provided by The Things Network (TTN) [
29]. LoRa requires a simpler configuration than Wi-Fi and delivers a more robust data stream. Data are read via the Message Queuing Telemetry Transport (MQTT), a straightforward protocol to harvest the data from TTN. The main drawback of LoRa is the lack of coverage in rural areas. Consequently, it is not possible to use LoRa for monitoring in rural areas except when own gateways are deployed, which is not practical for RIVM. NB-IoT is increasingly being used as a communication technique to transmit sensor data. NB-IoT uses the existing commercial mobile networks to connect devices and servers. A major advantage is that it has nation-wide coverage, at least in the Netherlands. All data land in an InfluxDB, a relatively simple database optimized for time series and fast access to the data.
Some sensor data are collected from other projects’ API’s using Python. For example, Luftdaten has several thousand sensors operational in Europe, and offers the data by an open API. Every five minutes, an API-call is performed to collect data from devices in the Netherlands, Belgium and Germany.
As a result, InfluxDB holds all raw data records from various sources. However, InfluxDB is regarded as a pass-through-database, and all raw data are near real-time inserted into a PostgresDB. This PostgresDB is within the RIVM-firewall and considered as the primary database. In PostgresDB, the raw data are accumulated into hourly averages. These hourly averages are, sometimes after calibration, visualized at RIVM data portal.
5.2. Visualization and Downloads
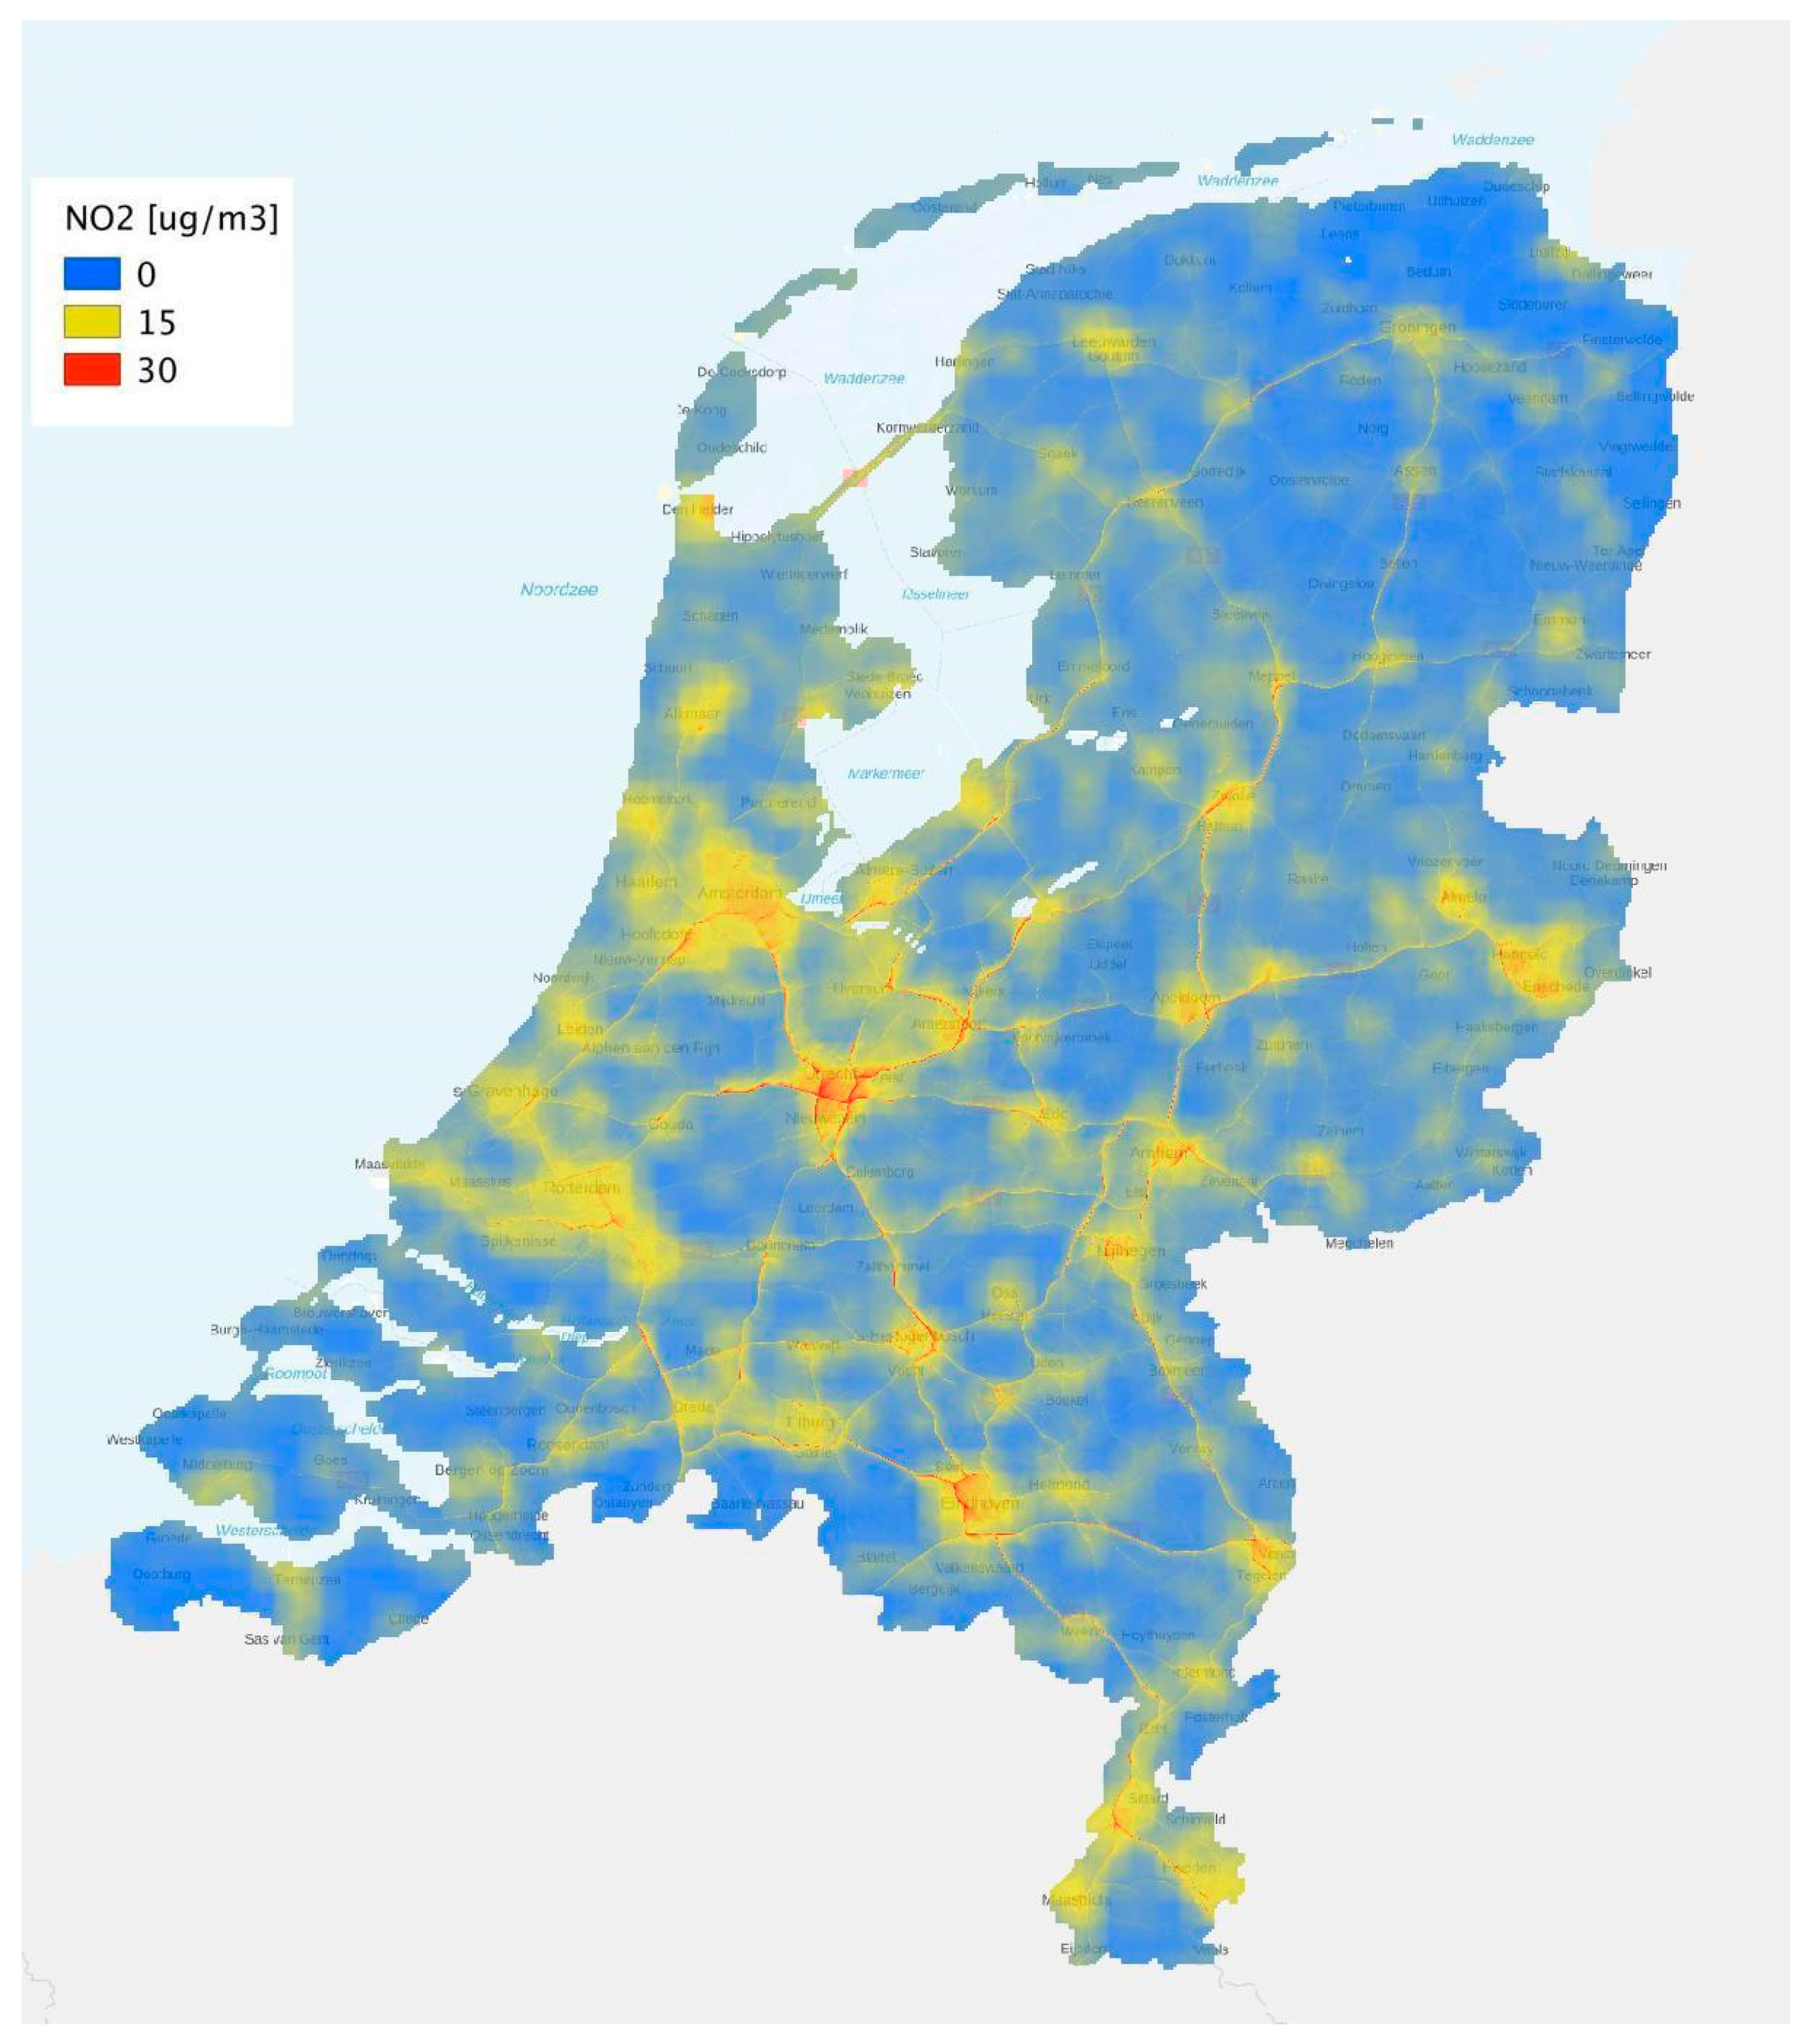
RIVM data portal shows sensors as colored dots on the map, with colors based on the most recent hourly sensor value (
Figure 8). The color scale that is used is based on color scales used in other Dutch air quality maps, such as those at the Atlas of the Living Environment [
30]. Sensor data are shown for different air quality components: PM
10, PM
2.5, and NO
2. In addition to sensor data, monthly data from passive NO
2 samplers are also visualized. When available, weather data such as temperature and air pressure, can also be selected.
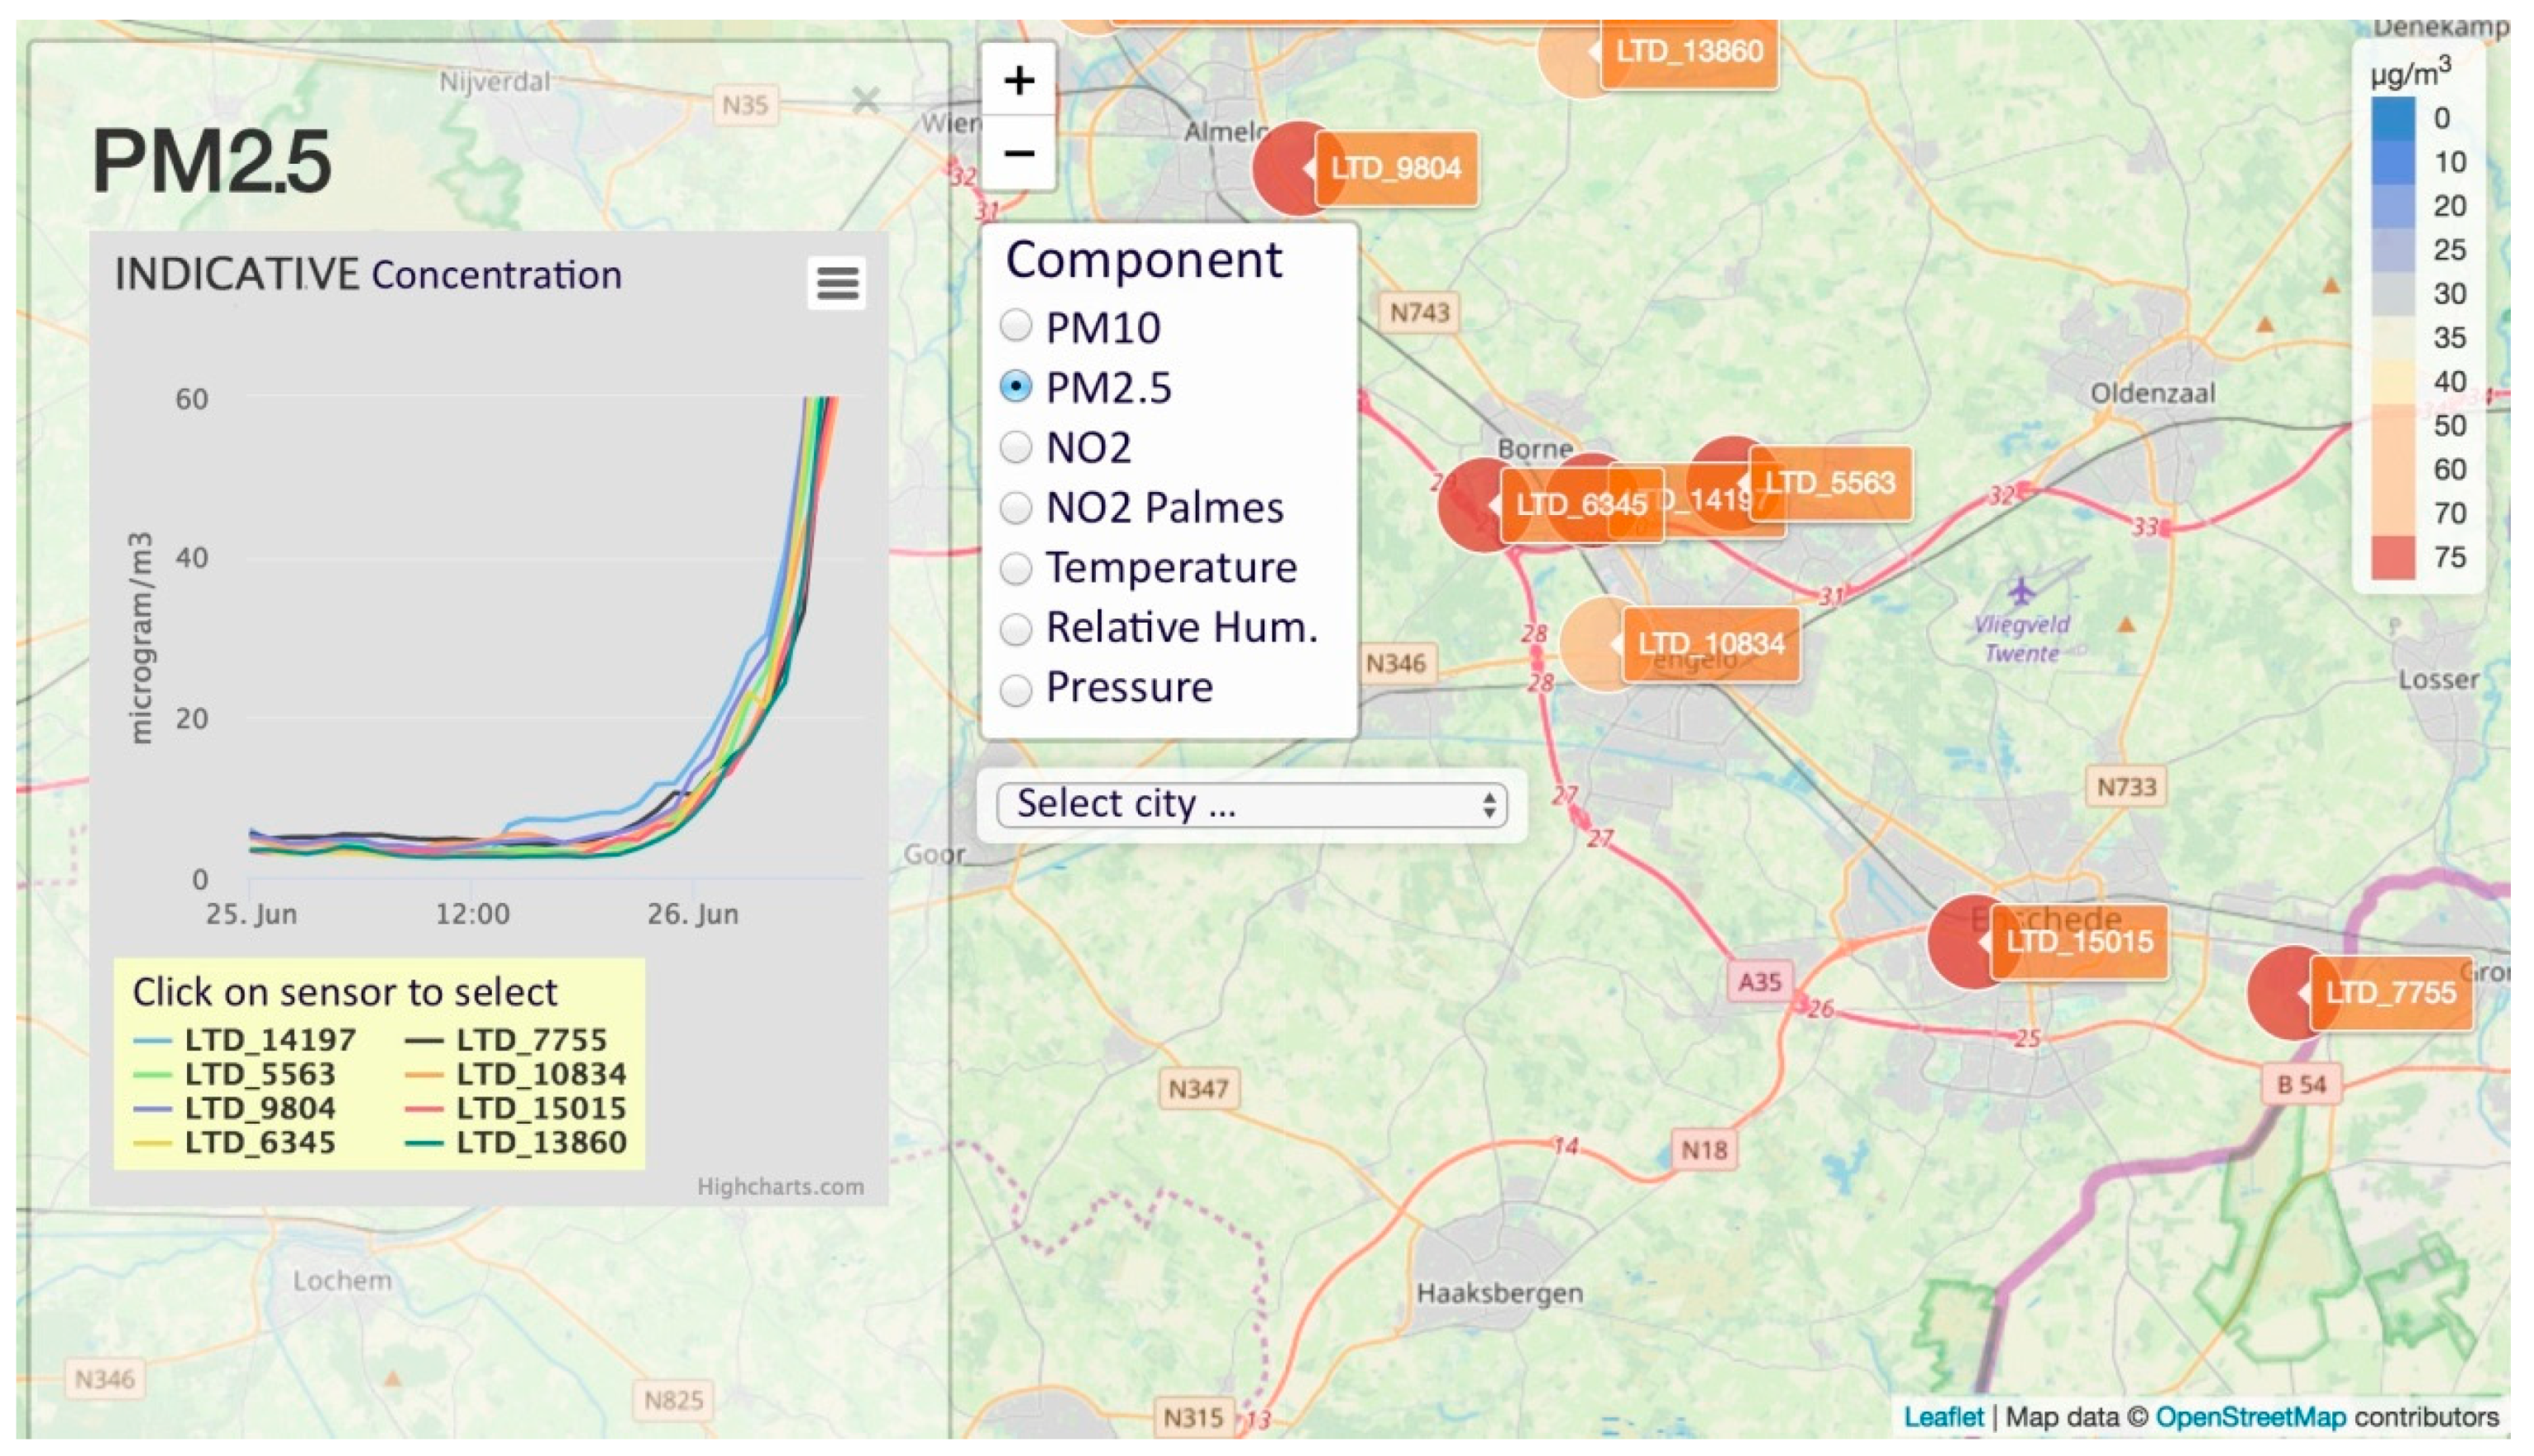
As a result, the homepage of the RIVM data portal provides a rapid overview of the current air quality in the Netherlands, as measured by all sensors. It is possible to zoom in to municipal or individual sensor level. When ten or fewer sensors are visible, a dashboard pops up with a line graph for all sensors, making it possible to get a quick impression of the trends from these sensors (
Figure 9). Moreover, it is possible to examine individual sensor data. By default, a time series plot is shown, where sensor data can be compared to the nearest official reference air quality station. Time series data are useful to learn about the variability in air pollution concentrations.
All sensor data are available for download. Currently, an application-programming interface (API) is being developed using the OGC SensorThings API [
31], making it easy for third parties to download sensor data in bulk. For people who are not familiar with APIs, a new download function will be developed.
6. Discussion
The development of a national data platform for sensor data opens up opportunities to integrate data from national or global sources, which may lead to the development of data products and applications that can help users understand air quality at neighborhood scale [
32]. Here we have presented RIVM’s approach for developing such a data platform and presented some use case examples. Historically, air quality data has been collected by several communities, researchers, and academics, but often only in the context of individual programs. A centralized data platform is therefore an important wish of the air quality community, as it allows a more efficient collection and visualization of sensor data, and allows for more powerful data analytics [
32]. For instance, calibration algorithms can be tested on a large scale, in real-world situations. Moreover, by providing a data platform, individuals do not need to solve problems like data connection, data acquisition and visualization of sensor data, but can focus on the results of their measurements.
In a recent workshop on low-cost air quality sensors, it was discussed that the air quality community needs to move away from qualifying sensor data as good or bad, because it will be up to the end-users to determine whether the data quality is good enough for their particular use [
32]. An important precondition for this is the inclusion of metadata so that the quality of the sensor data can be characterized. This will be an important next step for RIVM’s data platform as metadata is currently not automatically included. For well-known projects, such as Luftdaten and RIVM’s own projects, the set-up of the sensor is known, but individual sensor modifications might happen. This should be included in the metadata but individual users typically do not supply metadata. A standardized method of collecting metadata will thus be important. Consequently, calibration algorithms developed by RIVM only make use of well-known sensors, such as the SDS011 and B43F and in a few months, the Sensirion SPS30 will also be included. All this implies that the maintenance and quality assurance of the air quality monitoring system will undergo fundamental changes if sensors are to become part of the regular monitoring system.
Even though the quality of sensor data might be sufficient for certain applications, it remains important to put the use of low-cost sensors into perspective: the current quality of low-cost sensors does not allow using the data for legal purposes or to test against air quality standards. Moreover, analyzing individual sensor data might not be useful because of the variability in sensor quality. At the same time, as the examples in our article show, the use of low-cost sensors, particularly of PM-sensors, can add value to the regular monitoring system as well as to individual users’ experience, and can generate attention to air quality issues in general, consistent with typical examples from the literature [
33]. Therefore, it is important to strike the right balance between promoting the use of sensors and questioning the value of (individual) sensors. This remains an on-going challenge, particularly with the rise of commercial companies claiming sensor data can be used for policy decision-making [
34]. Moreover, the involvement of hundreds of individuals and dozens of city councils, each with their own ideas about the use of air quality sensors, makes it practically impossible to emphasize this to individuals. The establishment of a knowledge portal where current information about air quality sensors is shared helps to facilitate discussions about the quality of sensor data, and to clarify expectations at the start of projects. Moreover, expanding our presence on social media makes it easier to participate in direct discussions with non-professionals.
The involvement of citizens requires a shift in approach from air quality experts from targeting only other professionals in the field towards also engaging with non-professionals. In many cases, citizens are interested in the consequences of air pollution for their own health, and ask for effective ways to tackle air pollution in their neighborhood; issues that are traditionally somewhat out of the scope of experts on environmental data. In addition, since current sensors do not meet objective quality requirements, linking sensor data to health outcomes is tricky. This implies that it may not be possible to address all concerns raised by citizens, though it may be useful to raise awareness about the potential health impacts of air pollution. Therefore, a reflexive approach from air quality experts is required, where concerns from citizens are taken serious, but limitations of current technologies are clearly explained.
Lastly, the involvement of EPAs in sensors and air quality is important to standardize practices, both nationally as well as internationally. Therefore, RIVM is actively involved in, for instance, the CEN Technical Committee. Moreover, the involvement of EPAs from many countries should ensure that the measurements of air quality are carried out in a transparent way, and that open data are safeguarded. This is particularly important since the concept of a ‘smart city’ is of interest to a wide range of commercial parties, and several companies, such as Google, are now starting to measure air quality as a service to governments [
35]. At the same time, RIVM’s data platform allows third parties to monetize the data. For instance, data might be used for apps such as a route planner based on the lowest air pollution exposure, dashboards about the local environment et cetera. An important concern here is that of environmental justice [
32], as this might not benefit the data owners who contributed data to the data platform. However, these developments might also advance science and practical, real-world application of air quality data. Nonetheless, it is important that air quality data, but also the subsequent tools to analyze the data, are available to local communities that may lack the skills or resources to develop these tools themselves. Therefore, an active role of EPAs will make sure that data about the living environment will remain freely available for citizens.
Outlook
So far, we have reflected on the experiences resulting from our “Innovation Program for Environmental Monitoring”. The next steps within the program include the assimilation of other types of air quality information, such as satellite data, into the hourly air quality maps (
Figure 1). Another important step is the move towards a better characterization of individuals’ air pollution exposure during the day. Presently, epidemiological studies often link health outcomes to air pollution at the home address, while a significant amount of time is spent elsewhere. Sensors allow a better quantification of actual exposure to air pollution [
36]. Currently, RIVM is involved in a project where Sensirion SPS30 dust sensors are being mounted on 500 bicycles, all located within some 25 km from the city of Utrecht. Calibration and validation of the output will be a major challenge, but if successful, a better estimation of typical air pollution during cycle commutes will be obtained. Sensors are also being deployed around intensive livestock farming, where a potential link between actual PM-concentrations and short-term health outcomes will be investigated. These projects represent steps towards the overall aim to better quantify the exposome, i.e. all environmental exposures of an individual in a lifetime, and how those exposures relate to health.
In future, the system with sensors that we are building could be further expanded to also include the exposure at the own home or other indoor environments. This however requires ways to deal with privacy issues, as will the use of personal measurements e.g. with activity trackers and the like. Also, addition of other environmental parameters (e.g., noise, radiation) would be a possibility.
7. Conclusions
The role of EPAs will change significantly over the coming years because of the rise of citizen science and increasingly better performing low-cost sensor technology. As our article shows, a knowledge portal and a centralized data platform are important tools to connect with citizens and their respective needs, and to facilitate the sharing of air quality data obtained by low-cost sensors. Providing the public with the information needed to perform better measurements is mutually beneficial for the citizens and EPA‘s. Other EPA’s and similar organizations are recommended to create their own versions of these kinds of portals or provide similar services using other tools and solutions.
It is important that the data in the portal are “open” and the data platform and subsequent tools are accessible to all, and that it is easy for third parties to up- and download their data. For the majority of users of the data portal, visualization of sensor data is most useful when it shows current air quality and indicates whether the level of air pollution is ‘high’ or ‘low’.
Providing some sort of calibration standard or methods is important to increase the overall quality of the sensor data in the portal. A centralized data platform allows for better data analytics and the establishment of shared calibration algorithms. An important precondition for this is the inclusion of sufficient metadata so that the sensor quality can be characterized. Further research is needed to establish robust calibration methods and to better understand citizen scientists’ needs to improve the current data platform.
Many of the users of the Dutch platforms look for information about the relation between their health and the air pollution they measure. Given the current quality of sensor measurements, establishing explicit links between sensor results and health effects is tricky. It is very important to communicate the uncertainties and limitations of sensors clearly. In our experience, users of sensor data understand the limitations of their measurement results.
Finally, for national EPA’s and similar organizations, an important task is to remain an independent and impartial judge of air quality findings, irrespective of whether these are obtained by official measurements or by new sensor technology. By doing this, the EPA’s can earn and keep the trust of all involved parties, citizens, as well as authorities.

 ,
, 


