Article

Copper and Nickel Nanoparticles Prepared by Thermal Treatment of Their Respective Cations Confined in Nanopores through High-Pressure Synthesis

by
Nancy Brodie-Linder
1,2,*,
Johnny Deschamps
3,
Marianne Bombled
1,
Nicolas Pasternak
2,
Fabrice Audonnet
4,
Patricia Beaunier
5 and
Christiane Alba-Simionesco
1
1
Laboratoire Léon Brillouin (LLB), University Paris-Saclay, CEA, CNRS, 91191 Gif-sur-Yvette, France
2
BioCIS, CY Cergy Paris Université, CNRS, 95000 Cergy Pontoise, France
3
Unité Chimie et Procédés (UCP), École Nationale Supérieure de Techniques Avancées (ENSTA IP Paris), Institut Polytechnique de Paris, 828 Boulevard des Maréchaux, CEDEX, 91762 Palaiseau, France
4
Institut Pascal, Université Clermont Auvergne, CNRS, F-63000 Clermont Ferrand, France
5
Laboratoire de Réactivité de Surface (LRS), Sorbonne Université, CNRS, 4 Place Jussieu, F-75005 Paris, France
*
Author to whom correspondence should be addressed.
Appl. Nano 2021, 2(3), 278-288; https://doi.org/10.3390/applnano2030020
Submission received: 21 July 2021 / Revised: 15 August 2021 / Accepted: 30 August 2021 / Published: 9 September 2021

Abstract

:
A new and simple method for preparing confined copper and nickel nanoparticles by thermal treatment of their respective cations inside Mobil Composition of Matter 41 (MCM–41) hydrophobic nanopores is presented here. Surface modified MCM–41 hydrophobic materials were impregnated by using high-pressure treatment with copper II (Cu II) or nickel II (Ni II) aqueous solutions. After pressure release and washing, the remaining metal cations, confined exclusively within the nanopores, were heated, forming metallic nanoparticles. Reduction of the cations by a redox reaction between the hydrophobic organic surface and the confined metal cations is proposed. Transmission electronic microscopy (TEM), selected area electron diffraction (SAED), nitrogen (N2) adsorption at −196 °C (77 K), Fourier transform infrared (FTIR) and thermogravimetric (TGA) analyses evidenced the identification of copper and nickel nanoparticles (NPs).

1. Introduction

The use of nanoparticles in our everyday life is not a new phenomenon. Precious metal nanoparticles were used even in ancient times in varnishes or other types of coatings, for example, to enhance the colouring and beauty of ceramics [1]. Since these early times, metal nanoparticle use has entered numerous other domains. The potential uses of nanoparticles as sensors [2], as catalysts [3], for environmental clean-up [4,5], as doping agents for hydrogen storage by adsorption [6], in biological and nanotechnological fields [7] and in medicine for cancer activity [8], to name a few examples, have greatly amplified their importance. These metal nanoparticles (NPs) of nanometric size exhibit enhanced thermal, optical, chemical and physical properties compared to their bulk metal counter parts [9] and, for these reasons, have become a target base in both the research and industrial communities. Metal NPs deposited on solid, most often inert surfaces are the base for a wide variety of applications, notably in catalysis [3,4,5]. The bottom-up approach for the synthesis of metal NPs begins at the atomic or molecular level and builds up to form the NP structure. There are three methods of synthesis using the bottom-up approach: (1) physical (chemical vapour deposition, irradiation or photochemical reduction), (2) biological (using plants and microorganisms for reduction reactions and the stabilization of NPs) and (3) chemical reduction (using chemical reducing agents such as sodium borohydride, hydrazine or citrate anions, to name a few) [10,11,12]. Although the biological method pertaining to microorganisms has seen a surge recently in research literature, the serious drawbacks concerning active substance identification and metal NPs recovery from reaction media limit the utilization of this method [13]. Of the three types of synthesis method mentioned above, the most commonly used is the chemical reduction route, especially with respect to metal NPs dispersion on inert surfaces. In this method, a metal cation aqueous solution is reacted with a reducing agent in the presence of an inert surface. Under the conditions used, adherence to the surface can occur while the metal nanoparticles are forming or after formation. This part of the preparation can be very complex. C.T. Campbell explained that the binding strength of metal atoms to a surface is very important [14]. If the binding is too strong, the reactivity towards adsorbates is not expected to be high, yet, if the binding is too weak, the rate of sintering is expected to increase.
To adapt a metal NP to a particular application, it is necessary to control the homogeneity of nanoparticle dispersion, the adherence to the support and the metal loading. These parameters can become even more challenging when the inert support is a porous material. Here, the metal cation must enter into the pores and then, once reduced, adhere to the pore surface. Two processes are used to synthesize silica nanoporous materials. The first is a one-pot synthesis where the metal salt is added to the sol during the nanoporous material synthesis [15], and the second is postgrafting and/or impregnation with a metal salt solution [16]. In both cases, the metal cations must be reduced using reducing agents such as hydrogen, formaldehyde or sodium borohydride, resulting in the presence of the reduced species on the grain surface and inside the pores. This could lead to difficulties depending on the application targeted, as the reactivity of metal nanoparticles on the grain surface and inside the pores can be different. In previous works, we studied the complexation of the Cu II cation in aqueous ammoniacal solution and its reactivity towards surface silanol groups of a mesoporous templated silicate material. We found that surface-bonded Cu II atoms readily formed bonds with water molecules, resulting in an increased amount of adsorbed water compared to that for the original hydrophilic material [17,18,19]. Therefore, to study the interesting relationship between the confined cations and their aqua ligands, it was more convenient to create a hydrophobic environment so that any adsorbed water could be more easily controlled and observed. As silanol groups within the pores contribute to the adsorption and hydrogen bonding of water molecules, replacing the silanol hydrogen by Me3Si groups would mean that the adsorbed water could be attributed to the presence of the Cu II cations. Recently, we developed a high-pressure method for confining Cu II cations exclusively inside Mobil Composition of Matter 41 (MCM–41) hydrophobic nanopores [20]. Using this method, we extended the process to include Ni II cations and developed a specific and simple way to prepare well-dispersed copper and nickel NPs by using thermal treatments, without the use of any reducing agents.

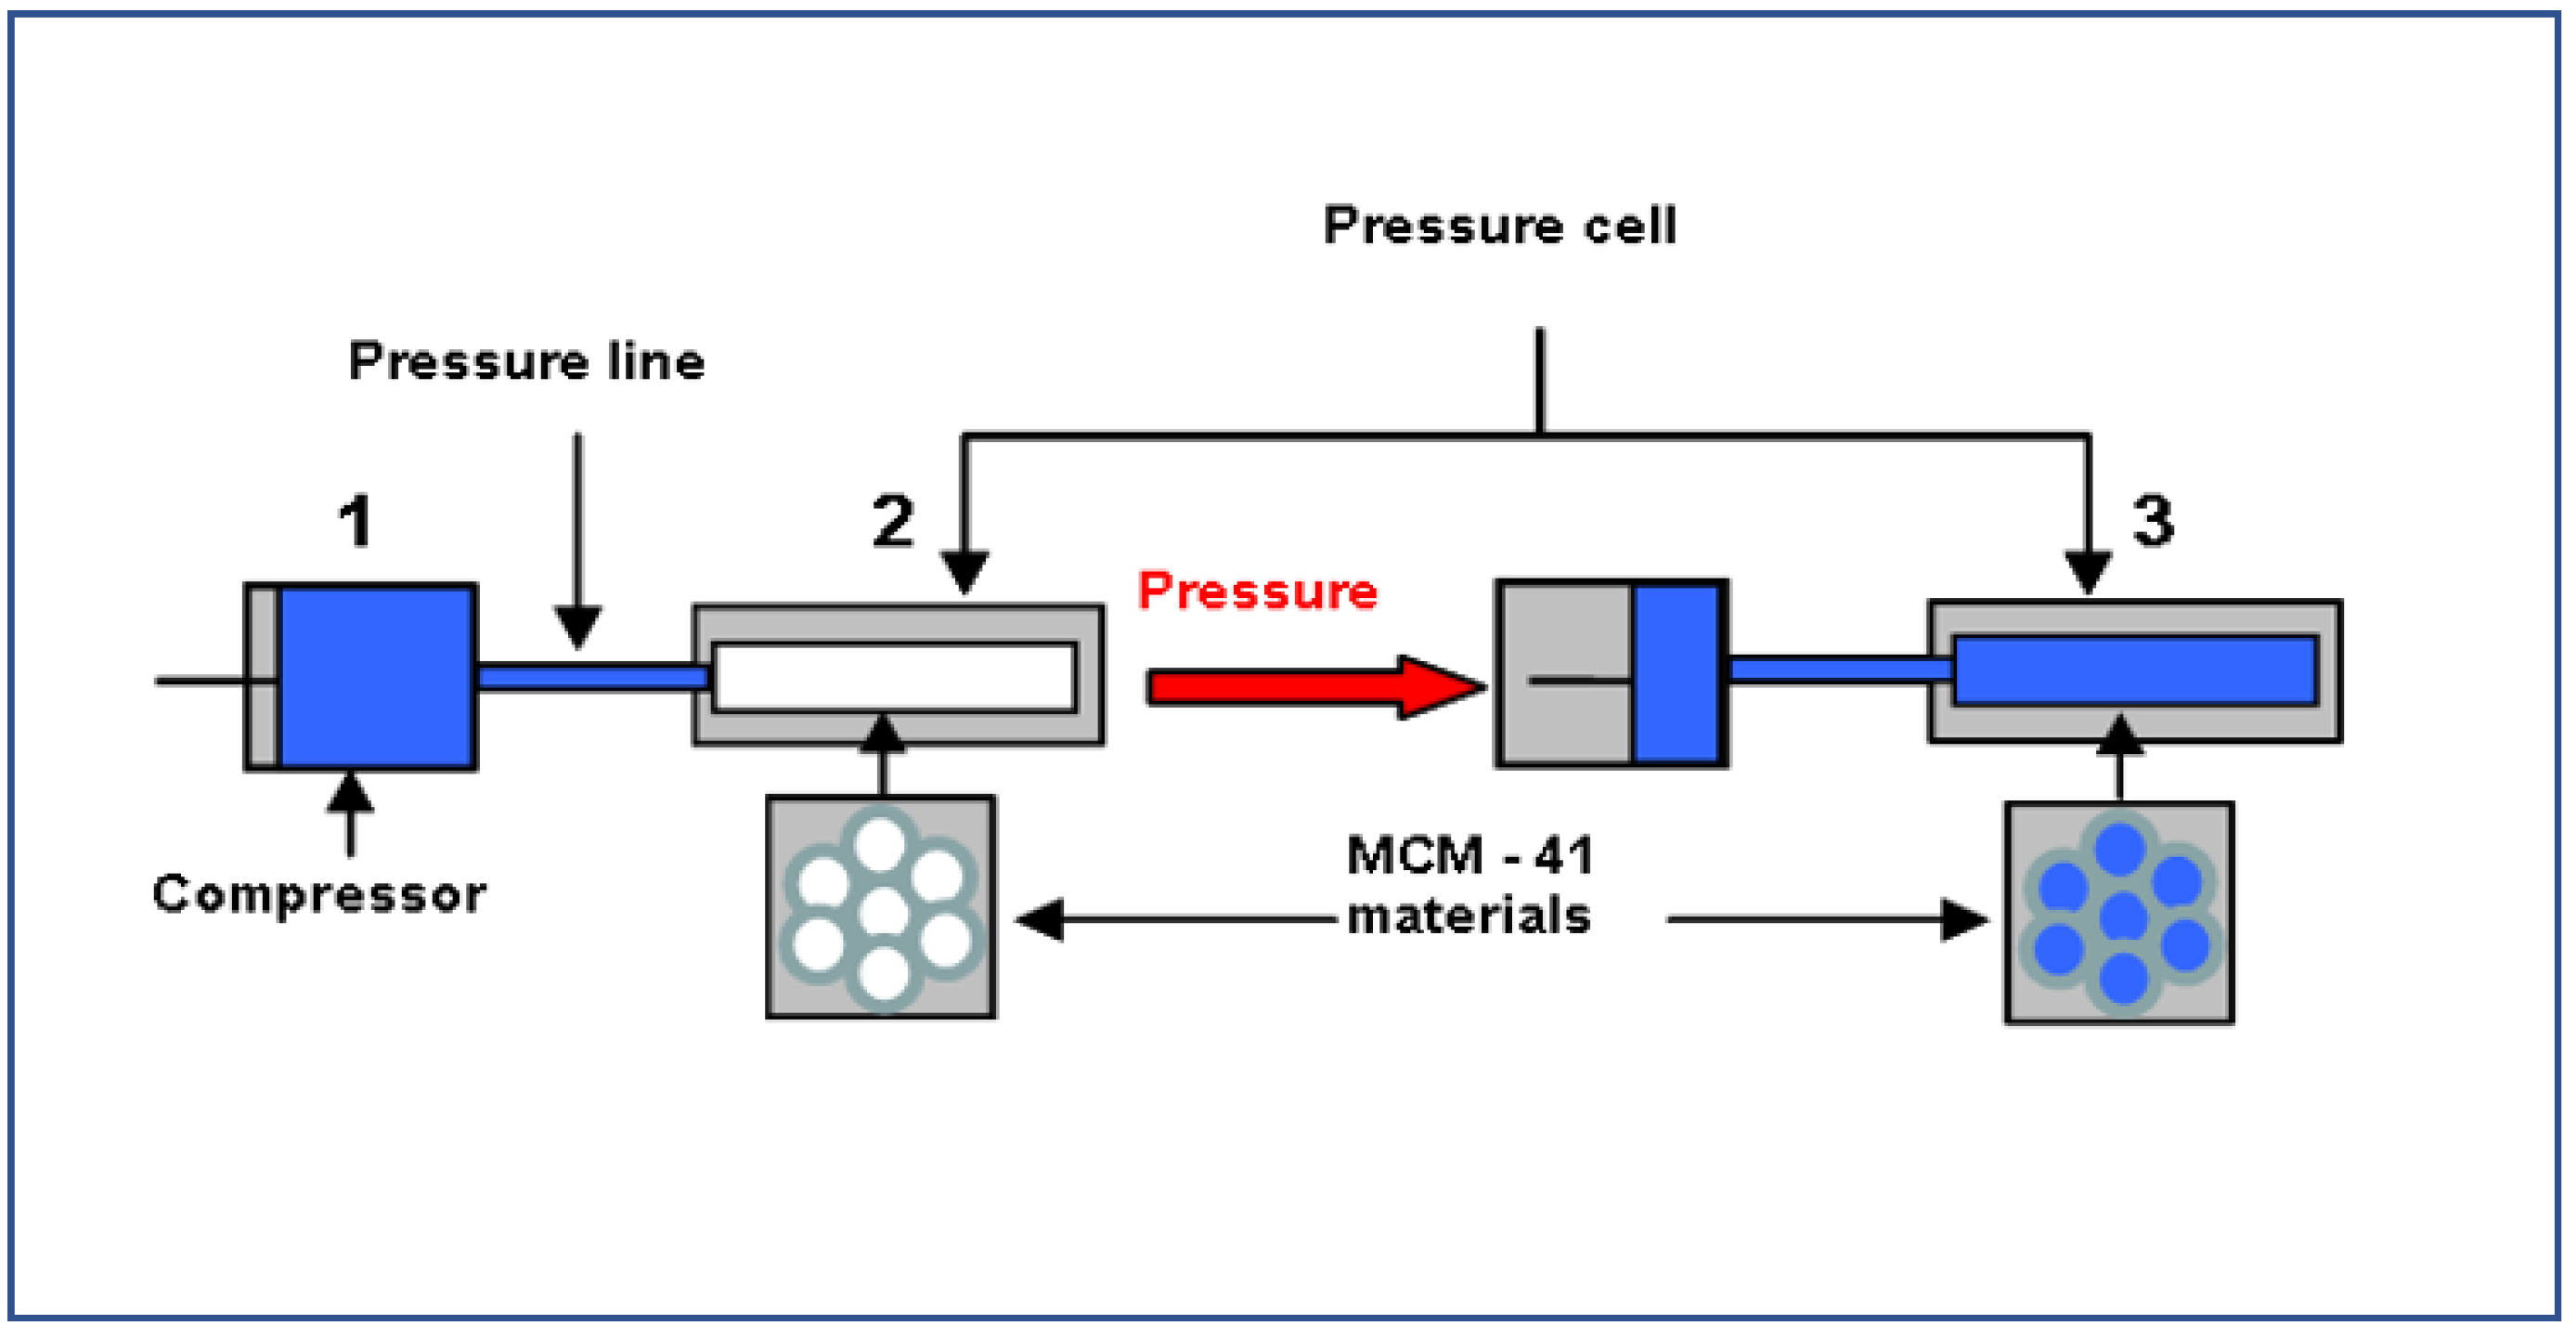
2. Materials and Methods

MCM–41 metal preparation–Our pressure method, represented in Figure 1, was already used for the confinement of Cu II species in hydrophobic MCM–41 materials of varying pore size [20]. Here we extended this high-pressure synthesis to include Ni II cations to demonstrate that metal cation confinement is not exclusive to Cu II. The MCM–41 materials were prepared and their surfaces modified by replacing surface silanols (OH) by O–Si(CH3)3 groups as described in our previous work [21]. An MCM–41 material, containing O–Si(CH3)3 groups on the surface, with a pore size of 3.82 nm was used for all pressure treatments and is denoted by MCM–Si. In a typical preparation of our hydrophobic–hydrophilic metal cation silica material, we used a 0.5 mol·L−1 aqueous solution of M(NO3)2.xH2O (M = Cu II, Ni II) containing a particular amount of concentrated NH4OH 28% (w/w) to give a pH of 10.5 and 11.5 for the Cu II and the Ni II, respectively. This solution was forced into the pores under a pressure of 4000 bar at room temperature. The pressure setup is shown in Figure 1 and was identical to the setup used in our previous work [20]. The pH of the solution was chosen for each cation to ensure that no precipitation of the respective hydroxide would occur during the pressure treatment. The concentration of the ammoniacal metal nitrate solution was optimized in order to load the maximum amount of M into the pores without the crystallization of the M ammine or M hydroxo complexes inside the pressure line. The addition of the basic solution contributed to maintain the electroneutrality of the metal complex once trapped in the pores. After 1 h, the system was depressurized to atmospheric pressure. The cell containing the silica powder with the ammoniacal metal nitrate solution was rinsed with distilled water onto a ground glass filter, and the excess solution was evacuated by vacuum filtration. Any residual metal solution was removed by washing with distilled water. After drying in an oven at 80 °C for 3 h, MCM–Si–M materials (M = Cu II or Ni II) were obtained as blue and green powders, respectively.
Thermal treatment—Thermal treatment of the MCM–Si–M materials was carried in a tubular furnace under argon at a heating rate of 10 °C per minute to 650 °C. After approximately 1 h, the heating was stopped, and the powder was cooled to ambient temperature under argon. The colour of the powders was transformed to a red-black or black for M = Cu and Ni, respectively. These final samples are denoted MCM–Si–M–HT.
Characterization–Infrared spectra were taken of neat samples on a Bruker Equinox 55 spectrophotometer with an ATR (attenuated total reflectance) accessory in the 4000–600 cm−1 region.
Transmission electron microscopy analyses were performed on a JEOL JEM-100 CX II UHR apparatus operating at 100 kV at the Microscopy Centre of the Institute of Materials Paris Centre, Sorbonne University, Paris. The powder samples were ground and dispersed in 2-propanol, deposited on a copper grid covered with a carbon thin film and dried before analysis.
Elemental analyses of the MCM–Si materials for C, N, Cu and Ni were carried out by the Service Central d’Analyse, Vernaison, France, and the results are summarized in Table 1.
The thermal stabilities of the different samples were investigated by thermogravimetric analysis (TGA, TA Instrument, Q50 model). The MCM–Si materials were heated from 25 to 850 °C at a heating rate of 10 °C·min−1 under argon flow of 60 mL·min−1. The BET surface area, the nitrogen/walls affinity parameter and the pore volume of all the samples were determined in a static volumetric adsorption system (Micromeritics Tristar II 3020) using nitrogen (N2) adsorption–desorption isotherm at −196 °C (77 K). Note here that in order to prepare enough MCM–Si–M–HT powder for characterization, the MCM–Si–M materials were heated in a tubular furnace using the same conditions determined by TGA. As the important mass loss occurred in the 400 to 600 °C temperature region, the formation of the MCM–Si–M–HT materials was considered to be optimized once the temperature of 650 °C was reached.
Before adsorption measurement, the samples were degassed by heating up to 100 °C under vacuum for 12 h. We expressed the specific surface ABET and the nitrogen/walls affinity parameter C by using the BET (Brunauer, Emmett and Teller) [22] model, as well as the pore volume Vp as shown in Table 2 and Table 3. To determine the pore diameter (d), several models such as the KJS (Kruk, Jaroniec and Sayari) [23], improved KJS (iKJS) [24] and BJH (Barrett, Joyner and Halenda) [25] are available. The improved iKJS method was finally used, as it was better adapted to the roughness of the pore surface in our materials.

3. Results and Discussion

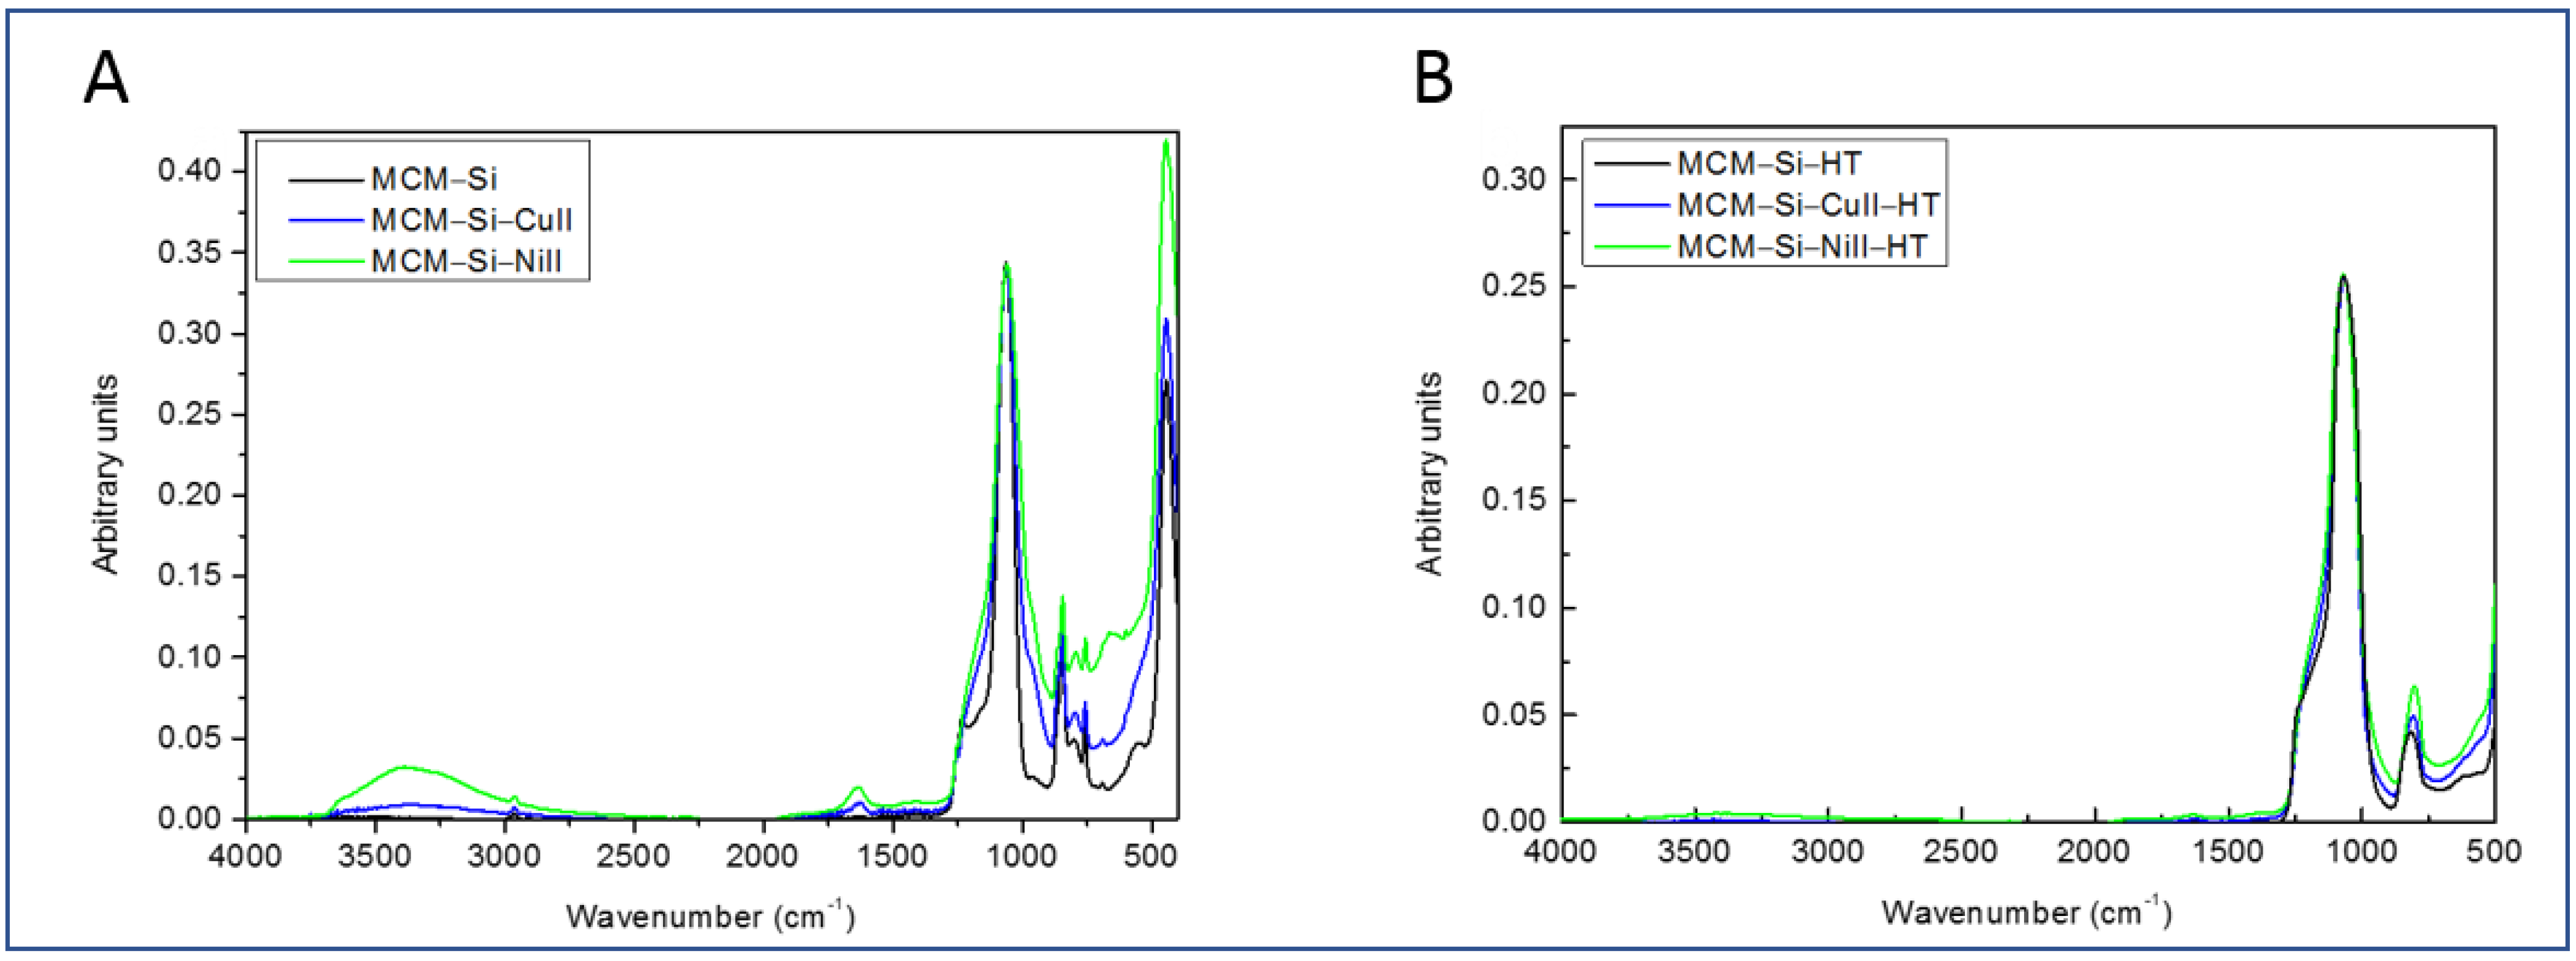
3.1. Fourier Transform Infrared (FTIR) Analysis

In this work, we describe a novel method to form copper and nickel NPs by confinement in hydrophobic pores. For the success of this method, the retention of the hydrophobic surface after pressure synthesis with the Cu II and Ni II cations is important. A comparison of IR spectra corresponding to the newly prepared MCM–Si–M materials and the original MCM–Si material is shown in Figure 2A. Although the intense peak in the 1000 cm−1 region was broadened, likely due to slight distortion of the silica network during pressure treatment, the retention of the organic surface (O–Si(CH3)3) was clearly demonstrated. The form and position of peaks in the 2900 and 800 cm−1 regions corresponding to the υ(C–H) stretching and δ(–CH3) bending modes, respectively, remained intact for both MCM–Si–M materials. However, additional peaks at 1620 cm−1 and in the region of 3400 cm−1 appeared, indicating that adsorbed water [20] was present. Although the drying step was identical in both cases, the intensity of these two peaks was more important for the MCM–Si–Ni II material, indicating that more adsorbed water was present. This point is discussed later on. After thermal treatment, the IR spectra of the MCM–Si–HT and both MCM–Si–M–HT (M = Cu and Ni) materials, shown in Figure 2B, were very similar. The peaks corresponding to adsorbed water almost disappeared, but were still present, as after heat treatment, the exposed silica surface adsorbed atmospheric water very quickly. The peaks at 2900 and 800 cm−1, on the other hand, totally disappeared, and the absence of these peaks for all three materials clearly demonstrated the loss of the organic surface.

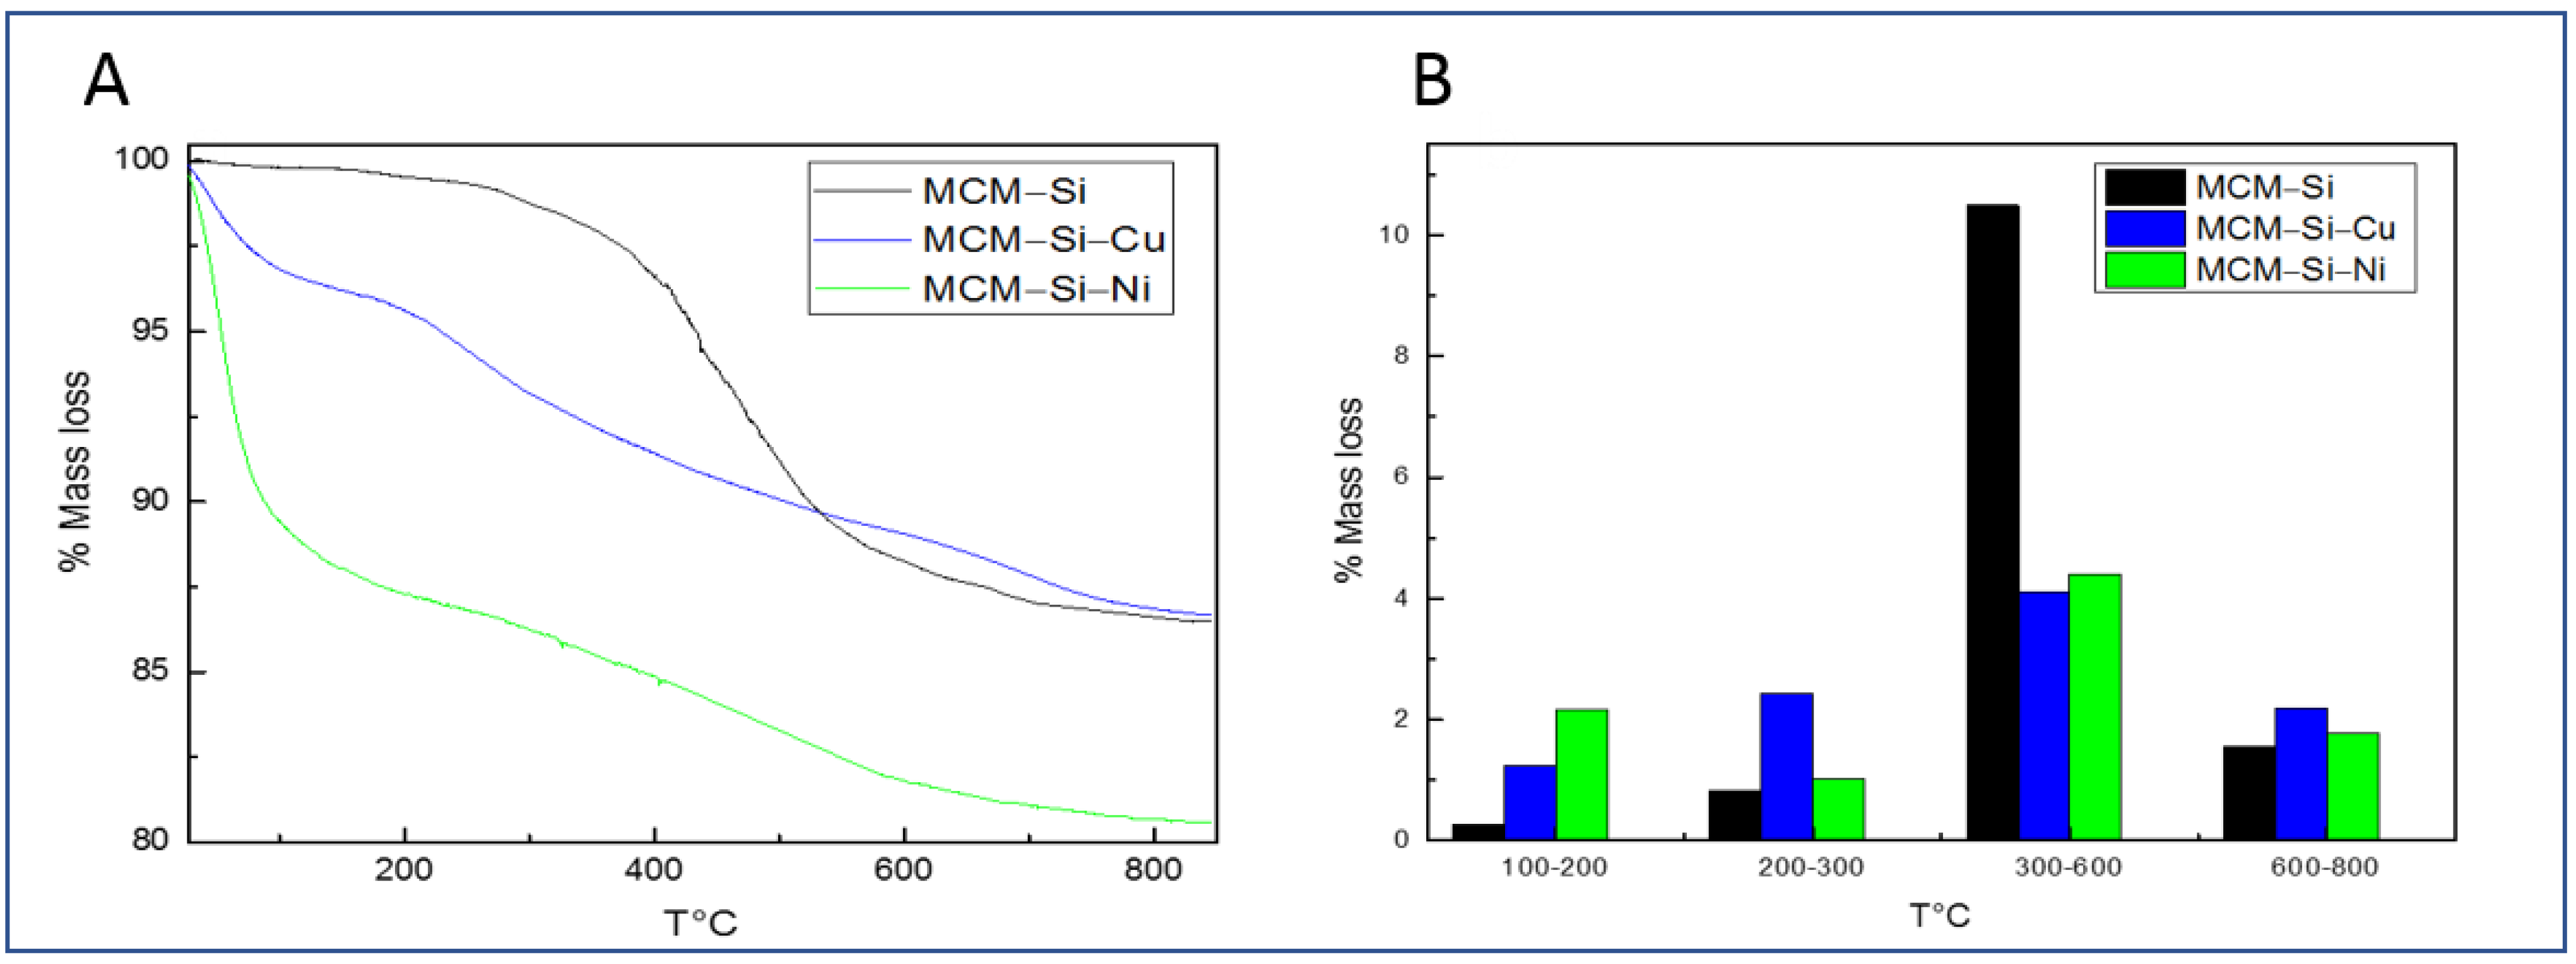
3.2. Thermogravimetric Analysis (TGA)

To take a closer look at when and in what proportion the hydrophobic surface was lost through heating, TGA was carried out for the MCM–Si and the MCM–Si–M materials (see Figure 3A). As expected for the grafted hydrophobic surface, MCM–Si, very little mass loss was recorded until 300 °C was reached. For mesoporous silica materials in general, the mass loss occurring under 300 °C was attributed to adsorbed water present through interaction of surface silanol groups [26]. Here, very little adsorbed water was present for the MCM–Si material, demonstrating that most of the silanol groups were replaced by O–Si(CH3)3 groups, creating a very hydrophobic surface. This was not the case for the two MCM–Si–M materials, as they both exhibited important mass loss up to 300 °C. However, the hydrophobic surface was still intact at this point, but water is present. The only difference between MCM–Si and MCM–Si–M (M = Cu II and Ni II) was the presence of the cations in the nanopores, and thus we can conclude that the cations were confined in an aqueous state. Due to the use of ammoniacal solutions at relatively high pH values for the confinement process, it was important to investigate if the metal cations retained ammonia as well as water in their confined state. Only residual amounts of nitrogen compared to the percentage of confined metal cations were present in the MCM–Si–M materials (see Table 1), confirming that the cations retained only water after confinement by pressure.
We return to the earlier point concerning the water adsorption capacity of the MCM–Si–Ni II materials. The MCM–Si–Ni II mass loss between 25 °C and 100 °C, corresponding to loosely bound surface water, was more than three times higher than that of the Cu II material. Note that although the amount of Ni II cations compared to Cu II cations in the MCM–Si–M materials is 1.3 times higher (see Table 1), this cannot alone explain the much higher amount of adsorbed water in the case of the MCM–Si–Ni II. It is possible that some degradation of the MCM–Si–Ni II hydrophobic surface has occurred during the pressure confinement step as a higher pH was used.
To illustrate the important differences in mass loss between the MCM–Si and MCM–Si–M (M = Cu II and Ni II) materials, the results of the TGA were expressed using a bar graph (see Figure 3B). In the 100–200 °C and 200–300 °C ranges, the mass loss for the MCM–Si–M materials was much more important than that of the pristine material, MCM–Si (~1%). As discussed earlier, the important mass losses up to 300 °C were related to water loss. On the other hand, the mass loss recorded for the MCM–Si–M materials in the temperature range from 300 to 600 °C was much lower than that recorded for the pristine material. In this temperature range, surface organic groups were lost by calcination, and, as evidenced by IR analysis recorded after thermal treatment, this was the case for all three materials. However, the MCM–Si–M materials experienced much less mass loss during thermal decomposition of the organic groups, indicating that some mass was retained during this process. The blackish colour of the MCM–Si–M–HT residues and the results from elementary analysis (Table 1) clearly demonstrate that the mass retained corresponded to carbon. It is also important to note here that the MCM–Si–HT powder retained its white colour as expected for the removal of all organic material. Thus, the carbon remaining was a direct consequence of the metal cation presence in the porous silica. This is an interesting point, as metal NPs encapsulated by carbon have potential uses in applications such as cathode materials for rechargeable batteries [27].

3.3. Redox Chemistry

In order to find a reasonable explanation for this phenomenon, we explored the redox chemistry that might be involved in the formation of the residual carbon. The carbon in the surface organic materials was in an oxidation state of −4, and thus, to form carbon, there must be an oxidant, or at least a substance to accept electrons. The metal cations in the MCM–Si–M materials were in a +2 oxidation state. Considering that the metal cations were in close proximity with the organic material during thermal treatment, electron exchange can be considered. The redox reaction between the carbon from the trimethyl silyl surface and the metal cations during heating corresponds to Equation (1):
2M2+ + C4− → M + C (graphite)
The theoretical amount of carbon necessary to reduce the Cu II to Cu 0 in the MCM–Si–Cu–HT material can be calculated using Equation (1). The calculated amount of carbon is very close to what would be expected if this redox reaction actually occurred (see Table 1). Similarly as in the MCM–Si material, the other organic materials not accounted for would be lost, possibly in the form of low molecular gases such as carbon dioxide and methane.
The carbon atoms used in the redox reaction were deposited on the silica surface, giving the black colour to the MCM–Si–Cu–HT material. Similarly, the MCM–Si–Ni–HT material is black, and thus, the same scenario may occur in that case. However, the amount of carbon remaining in the MCM–Si–Ni–HT material was approximately 60% higher than theoretically expected. Considering that some alteration of the MCM–Si–Ni–HT nanoporous surface occurred during Ni II cation confinement, as evidenced by the higher amount of water adsorption, we can consider that this surface change could also have contributed to the formation of excess carbon during the heating process.

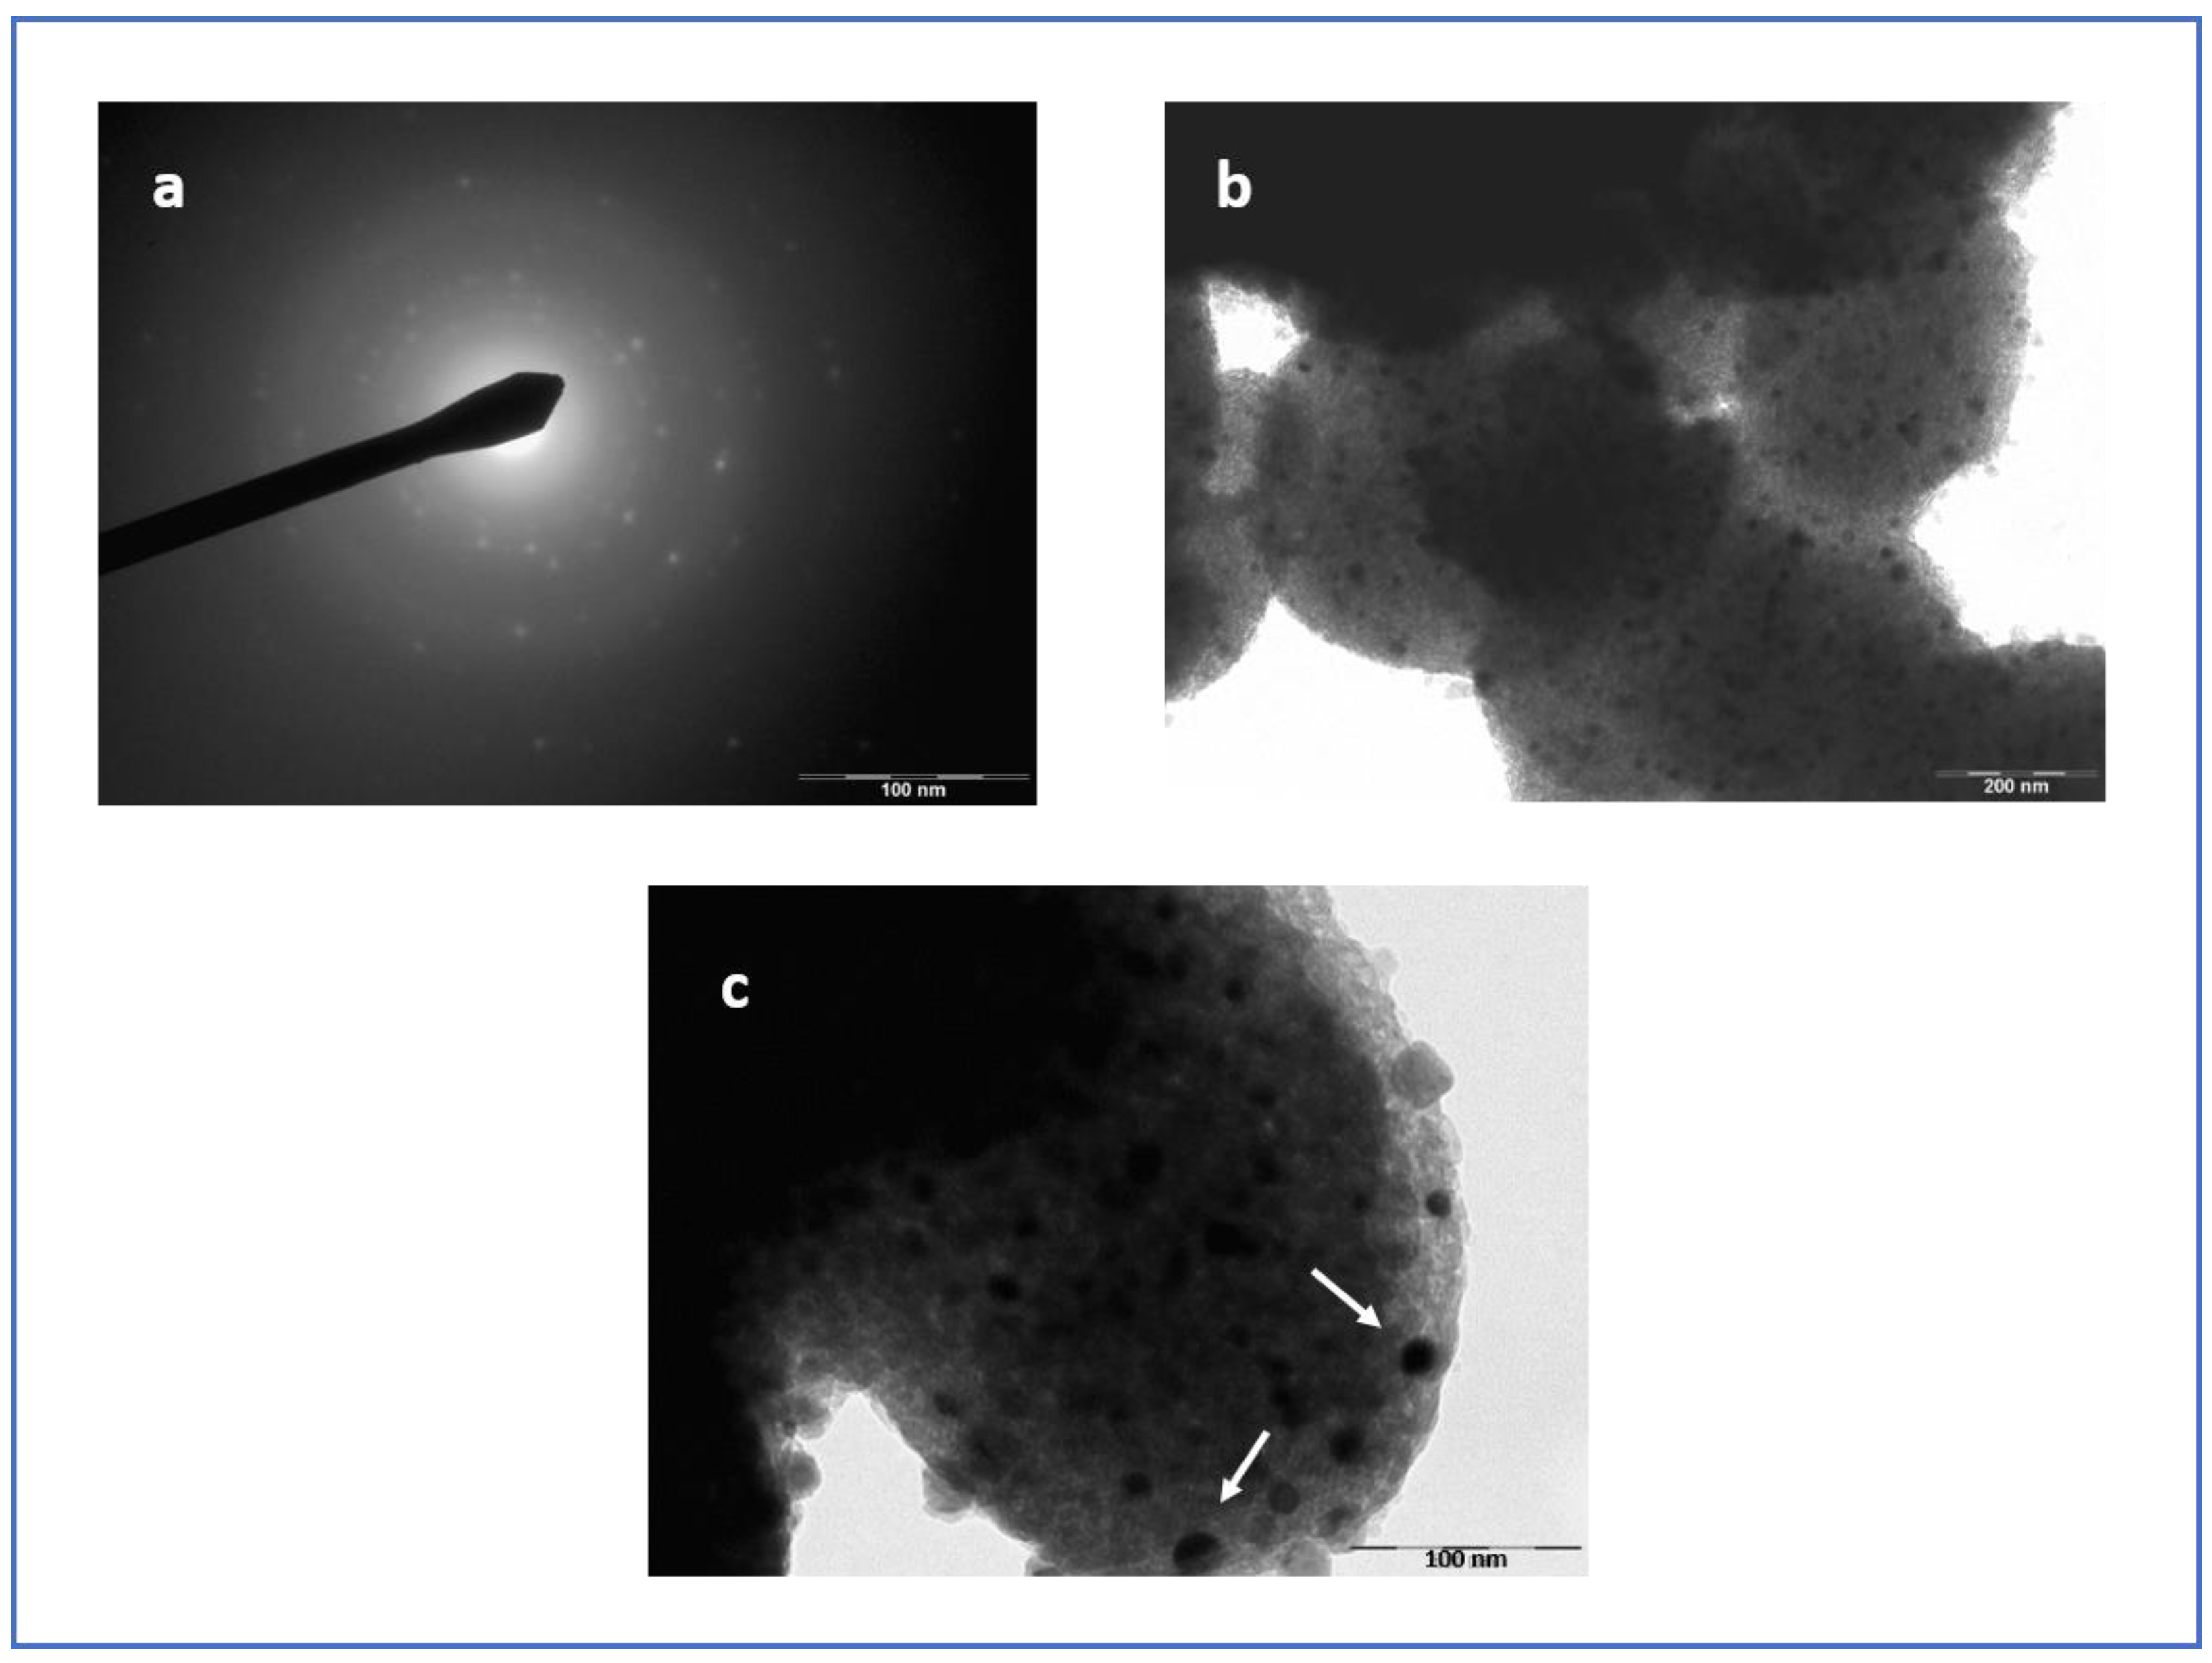
3.4. Micoscopy Analysis

In order to further investigate the colour change of the powders after heating and the presence of residual carbon, TEM images of the heated materials were obtained. For the MCM–Si–Cu–HT (Figure 4b,c), spherical NPs can be observed. However, the NP size was larger than the pores, suggesting that the NPs pushed through the pore wall. The selected area electron diffraction (SAED) pattern (Figure 4a) confirmed the formation of Cu nanoparticles. Indeed the 2.088, 1.787, 1.280 and 1.081 Å distances measured on the main diffraction rings are consistent with the (111), (200), (220), (311) and (440) indices of the structure fcc of copper, respectively. For the MCM–Si–Ni–HT (Figure 5a), the SAED pattern confirmed the formation of Ni nanoparticles. The Ni metallic particles were detected by the lattice planes of 2.036, 1.755, 1.230 and 1.053 Å, corresponding, respectively, to the (111), (200), (220) and (311) planes of the structure fcc of nickel. However, here, there was an important degradation of the porosity of the support (Figure 5b,c). The particularly high pH of the nickel cation solution, although necessary to avoid precipitation leading to a blockage of the pressure line, participated in the deterioration of deteriorated the silica porosity. Despite the deterioration of the support, the Ni NPs were quite homogeneous in size and in morphology. The homogeneity in morphology observed for both Cu and Ni NPs is very interesting. As a comparison, gold NPs can exhibit different types of morphology such as circular, triangular, hexagonal or rectangular [28].
Thus, for the Ni and Cu metals, our method of pressure and then thermal treatment formed confined metal nanoparticles. Considering that the metal cation solution was forced into the pores at 4000 bar, one would expect well-distributed metal cations within the nanopores. It follows, then, that the metal nanoparticles formed would also be homogeneously dispersed. This homogeneous dispersion of NPs was observed in the TEM images presented in Figure 4 and Figure 5 for MCM–Si–Cu–HT and MCM–Si–Ni–HT, respectively. However, in some cases, extrusion of the reduced metal forming NPs at the pore openings seems to have occurred, especially in the case of the MCM–Si–Cu–HT materials (see Figure 4c). In this case, the Cu NPs appeared at the surface of the nanoporous material. However, as evidenced by the nitrogen adsorption experiments, the pores were not totally blocked, but the adsorption isotherm was clearly modified as compared to the unheated material.

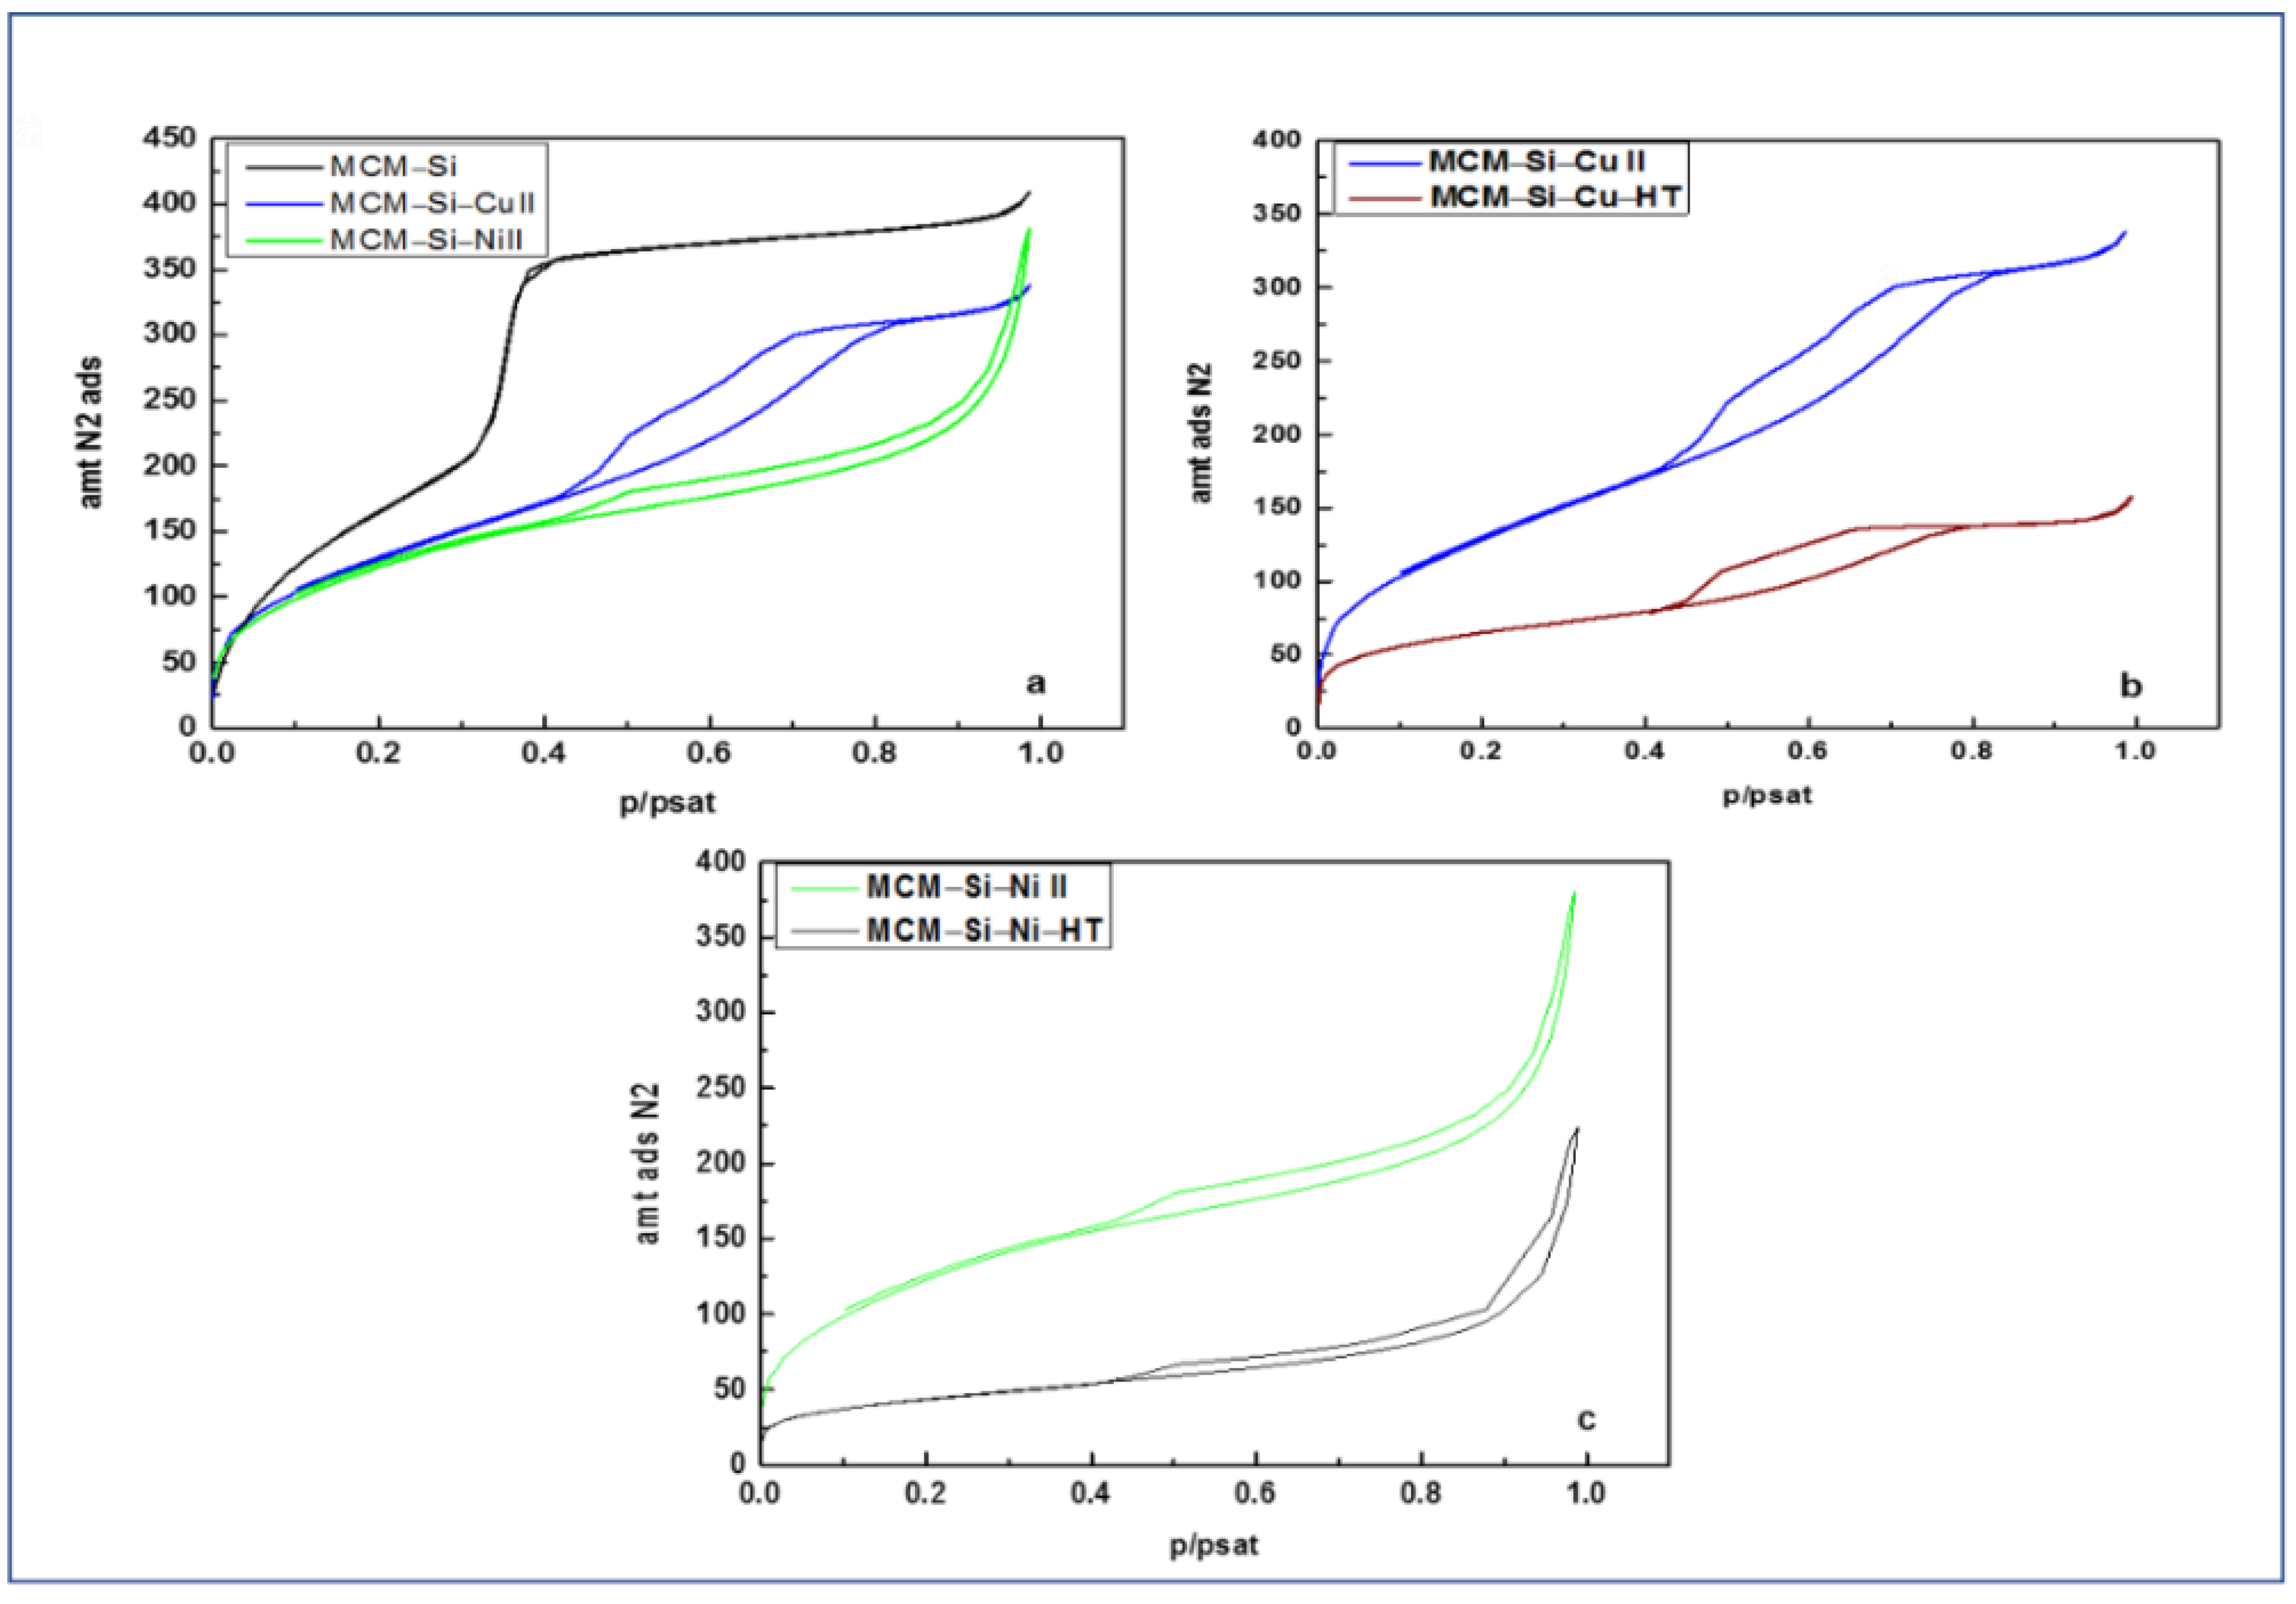
3.5. Porosity Analysis

The nitrogen adsorption–desorption isotherms of the three synthesized materials are shown in Figure 6. The experimental parameters relevant for the characterization of our materials, such as specific surface area ABET, pore volume Vp, pore diameter diKJS and nitrogen/walls affinity parameter C are listed in Table 2 and Table 3 for the materials before and after heat treatment, respectively. According to the classification of Thommes et al. [29], the isotherm corresponding to the pristine material (MCM–Si) (see Table 2) is of type IVb, which is related to adsorbents that have cylindrical mesopores. Type IVb typically characterizes the hydrophobic MCM–41 material [30]. The isotherm associated to the copper-confined material is of type IV, albeit considerably modified. Type IV characterizes a mesoporous adsorbent that shows a hysteresis loop associated to capillary condensation and evaporation taking place in mesopores with a much larger pore distribution compared to the pristine material (see Table 3). The isotherm corresponding to the material with confined nickel nanoparticles is of type II with a likely H3 hysteresis (see Table 3). This characterizes a macroporous adsorbent, approaching a nonporous material, in which the macropores are not completely filled by pore condensate. These results, for both the MCM–Si–Cu–HT and MCM–Si–Ni–HT powders, were justified by the microscopy images, which revealed that the size of the metallic nanoparticles was bigger than the pore sizes, and that their confinement, because of the high-pressure method, probably modified the porous structure. Moreover, NPs were observed at the pore openings due to the extrusion of the metal, once reduced and particularly in the case of copper (see Figure 4c).
However, the modification of the porous structure did not hinder the formation of the metal NPs.
The abrupt change in the C values for both heated materials, from under 50 to 129, indicates that the interactions between the adsorbate and the surface became much stronger. The loss of the methyl groups from the organic surface with a partial transformation to carbon would expose areas of the bare silica surface. The nitrogen adsorbate has a higher affinity for a silica surface in comparison to a hydrophobic surface and thus the rise in the C value is expected.

4. Conclusions

In this paper, we developed and described a new method for synthesizing copper and nickel nanoparticles (NPs) confined in hydrophobic nanopores in situ using only thermal treatment without the use of chemical reducing agents. Moreover, the NPs were homogeneously dispersed within the hydrophobic materials because of the use of a specific high-pressure confinement method for Cu II and Ni II metal cations. The reduction of the cations can be explained by a redox reaction between the hydrophobic organic surface and the confined metal cations. This work also demonstrated that the intimate proximity of metal cations to an organic surface is not innocent and that the consequence upon heating is metal reduction. This original method for preparing metal NPs, forming carbon as a consequence of the redox reaction, could be an interesting route to explore for carbon encapsulation of metal NPs.

Author Contributions

Conceptualization, N.B.-L.; methodology, N.B.-L. and J.D.; validation, all authors; formal analysis, all authors; investigation, N.B.-L. and J.D.; data curation, N.B.-L.; writing—original draft preparation, N.B.-L. and J.D.; writing—review and editing, all authors; supervision, N.B.-L.; project administration, N.B.-L.; All authors have read and agreed to the published version of the manuscript.

Funding

This research received no external funding.

Institutional Review Board Statement

Not applicable.

Informed Consent Statement

Not applicable.

Conflicts of Interest

The authors declare no conflict of interest.

Abbreviations

MCM–41Mobil Composition of Matter 41
TEMTransmission electron microscopy
SAEDSelected area electron diffraction
FTIRFourier transform infrared
TGAThermogravimetric analysis
NPNanoparticle
MCM–SiMCM–41 material, containing O–Si(CH3)3 groups on the surface, with a pore size of 3.82 nm, used for all pressure treatments
MCM–Si–M (M = Cu II or Ni II)MCM–Si material, containing copper II or nickel II, before thermal treatment
MCM–Si–M–HT (M = Cu II or Ni II)MCM–Si–M material, containing copper or nickel NP, after thermal treatment
ATRAttenuated Total Reflectance
BETBrunauer, Emmett and Teller
KJS KrukJaroniec and Sayari
iKJSimproved KJS
BJHBarrett, Joyner and Halenda

References

  1. Baglioni, P.; Carretti, E.; Chelazzi, D. Nanomaterials in art conservation. Nat. Nanotech. 2015, 10, 287–290. [Google Scholar] [CrossRef]
  2. Tessier, P.M.; Velev, O.D.; Kalambur, A.T.; Rabolt, J.F.; Lenhoff, A.M.; Kaler, E.W. Assembly of gold nanostructured films templated by colloidal crystals and use in surface-enhanced Raman spectroscopy. J. Am. Chem. Soc. 2000, 122, 9554–9555. [Google Scholar] [CrossRef]
  3. Chaughule, R.S.; Ramanujan, R.V. Nanoparticles: Synthesis, Characterization and Applications; Chaughule, R.S., Ramanujan, R.V., Eds.; American Scientific Publishers: Stevenson Ranch, CA, USA, 2010. [Google Scholar]
  4. Goodman, D.W. Supported metal clusters: Synthesis, structure, and catalysis. Chem. Rev. 1995, 95, 511–522. [Google Scholar]
  5. Astruc, D.M.C. Gold nanoparticles:  Assembly, supramolecular chemistry, quantum-size-related properties, and applications toward biology, catalysis, and nanotechnology. Chem. Rev. 2004, 104, 293–346. [Google Scholar]
  6. Prasanth, K.; Catoire, L.; Deschamps, J. Aluminium doping composite metal-organic framework by alane nanoconfinement: Impact on the room temperature hydrogen uptake. Micropor. Mesopor. Mat. 2017, 243, 214–220. [Google Scholar]
  7. Pansare, A.V.; Amol, A.; Shedge, A.A.; Patil, V.R. Discrete SeNPs-Macromolecule Binding Manipulated by Hydrophilic Interaction. Int. J. Biol. Macromol. 2018, 107, 1982–1987. [Google Scholar] [CrossRef]
  8. Shedgea, A.A.; Pansare, S.V.; Khairkarc, S.R.; Chatred, S.Y.; Chakrabartib, S.; Nagarkare, A.A.; Pansare, A.V.; Patil, V.R. Nanocomposite of functional silver metal containing curcumin biomolecule model systems: Protein BSA bioavailability. J. Inorg. Biochem. 2020, 212, 111210. [Google Scholar] [CrossRef]
  9. Kumar, K.H.; Venkatesh, N.; Bhowmik, H.; Kuila, A. Metallic nanoparticle: A review. Biomed. J. Sci. Tech. Res. 2018, 4, 3765–3775. [Google Scholar]
  10. Roldan Cuenya, B. Metal nanoparticle catalysts beginning to shape-up. Acc. Chem. Res. 2013, 46, 1682–1691. [Google Scholar] [CrossRef]
  11. Ealias, A.M.; Saravanakumar, M.B. A Review on the classification, characterisation, synthesis of nanoparticles and their application. In Proceedings of the IOP Conference Series: Materials Science and Engineering 2017, Busan, Korea, 25–27 August 2017; p. 032019. [Google Scholar]
  12. Govindrao Jamkhande, P.; Ghule, N.; Haque Bamer, A.; Kalaskar, M. Metal nanoparticles synthesis: An overview on methods of preparation, advantages and disadvantages, and applications. J. Drug Deliv. Sci. Technol. 2019, 53, 101174–101185. [Google Scholar] [CrossRef]
  13. Kato, Y.; Suzuki, M. Synthesis of Metal Nanoparticles by Microorganisms. Crystals 2020, 10, 589. [Google Scholar] [CrossRef]
  14. Campbell, C.T. The Energetics of Supported Metal Nanoparticles: Relationships to sintering rates and catalytic activity. Acc. Chem. Res. 2013, 46, 1712–1719. [Google Scholar] [CrossRef]
  15. Abrokwah, R.; Deshmane, V.; Kuila, D. Comparative performance of M-MCM-41 (M: Cu, Co, Ni, Pd, Zn and Sn) catalysts for steam reforming of methanol. J. Mol. Cat. A Chem. 2016, 425, 10–20. [Google Scholar] [CrossRef] [Green Version]
  16. Zienkiewicz-Strzalka, M.; Pasieczna-Patkowska, S.; Kozak, M.; Pikus, S. Silver nanoparticles incorporated onto ordered mesoporous silica from tollen’s reagent. App. Surf. Sci. 2013, 266, 337–343. [Google Scholar] [CrossRef]
  17. Brodie-Linder, N.; Audonnet, F.; Dosseh, G.; Alba-Simionesco, C.; Imperor, M. SBA-15 synthesis: Are there lasting effects of temperature change within the first 10 minutes of TEOS polymerization? Mater. Chem. Phys. 2008, 108, 73–81. [Google Scholar] [CrossRef]
  18. Brodie-Linder, N.; Besse, R.; Audonnet, F.; Le Caër, S.; Deschamps, J.; Imperor-Clerc, M.; Alba-Simionesco, C. The key to control Cu II loading in silica based mesoporous materials. Micr. Mes. Mat. 2010, 132, 518–525. [Google Scholar] [CrossRef]
  19. Brodie-Linder, N.; Le Caër, S.; Alam, M.S.; Renault, J.P.; Alba-Simionesco, C. H2 formation by electron irradiation of SBA-15 materials and the effect of Cu(II) grafting. Phys. Chem. Chem. Phys. 2010, 12, 14188–14195. [Google Scholar] [CrossRef]
  20. Brodie-Linder, N.; Deschamps, J.; Audonnet, F.; Alba-Simionesco, C. Method to create a hydrophilic environment within hydrophobic nanostructures. Micropor. Mesopor. Mat. 2013, 179, 17–21. [Google Scholar] [CrossRef]
  21. Schoeffel, M.; Brodie-Linder, N.; Audonnet, F.; Alba-Simionesco, C. Wall thickness determination of hydrophobically functionalized MCM-41 materials. J. Mat. Chem. 2012, 22, 557–567. [Google Scholar] [CrossRef]
  22. Brunauer, S.; Emmett, E.; Teller, P.H. Adsorption of gases in multimolecular layers. J. Am. Chem. Soc. 1938, 60, 309–319. [Google Scholar] [CrossRef]
  23. Kruk, M.; Jaroniec, M.; Sayari, A. Application of large pore MCM-41 Molecular sieves to improve pore size analysis using nitrogen adsorption measurements. Langmuir 1997, 13, 6267–6273. [Google Scholar] [CrossRef]
  24. Jaroniec, M.; Solovyov, L.A. Improvement of the Kruk-Jaroniec-Sayari method for pore size analysis of ordered silicas with cylindrical mesopores. Langmuir 2006, 22, 6757–6760. [Google Scholar] [CrossRef] [PubMed]
  25. Barrett, E.P.; Joyner, L.G.; Halenda, P.P. The Determination of pore volume and area distributions in porous substances. I. Computations from Nitrogen Isotherms. J. Am. Chem. Soc. 1951, 73, 373–380. [Google Scholar] [CrossRef]
  26. Knight, A.; Kalugin, N.; Coker, E.; Iigen, A. Water properties under nano-scale confinement. Sci. Rep. 2019, 9, 8246. [Google Scholar] [CrossRef]
  27. Zhang, K.; Lee, T.H.; Bubach, B.; Jang, H.W.; Ostadhassan, M.; Choi, J.-W.; Shokouhimehr, M. Graphite carbon-encapsulated metal nanoparticles derived from Prussian blue analogs growing on natural loofa as cathode materials for rechargeable aluminum-ion batteries. Sci. Rep. 2019, 9, 13665–13674. [Google Scholar] [CrossRef]
  28. Pansare, A.V.; Khairkar, S.R.; Shedge, A.A.; Chhatre, S.Y.; Patil, V.R.; Nagarkar, A.A. In situ nanoparticle embedding for authentication of epoxy composites. Adv. Mater. 2018, 30, 1801523. [Google Scholar] [CrossRef]
  29. Thommes, M.; Kaneko, K.; Neimark, A.; Oliver, J.; Rodriguez-Reinoso, F.; Rouquerol, J.; Sing, K.S. Physisorption of gases, with special reference to the evaluation of surface area and pore size distribution. Pure Appl. Chem. 2015, 879, 105–1069. [Google Scholar]
  30. Deschamps, J.; Audonnet, F.; Brodie-Linder, N.; Schoeffel, M.; Alba-Simionesco, C. A thermodynamic limit of the melting/freezing processes of water under strongly hydrophobic nanoscopic confinement. Phys. Chem. Chem. Phys. 2010, 12, 1440–1443. [Google Scholar] [CrossRef] [PubMed]
Figure 1. Pressure setup used for the metal confinement (left: at atmospheric pressure; right: under pressure).
Applnano 02 00020 g001
Figure 2. FTIR spectra of MCM–Si–M materials (M = Cu II, Ni II). Before (A) and after thermal treatment (B).
Applnano 02 00020 g002
Figure 3. Thermogravimetric analysis (TGA) of MCM–Si and MCM–Si–M materials (M = Cu II, Ni II) plotted as a function of temperature versus % mass loss. Graphic representation with total analysis (A). Bar graph of temperature groups to illustrate mass loss trends (B).
Applnano 02 00020 g003
Figure 4. (a) SAED pattern; (b,c) TEM micrograph of MCM–Si–Cu–HT. The white arrows indicate NPs at the pore openings due to the extrusion of the metal, once reduced.
Applnano 02 00020 g004
Figure 5. (a) SAED pattern; (b,c) TEM micrograph of MCM–Si–Ni–HT. (b,c) illustrate clearly the homogeneity in size and in morphology of the Ni NPs despite the degradation of the support observed.
Applnano 02 00020 g005
Figure 6. Nitrogen adsorption isotherms at −196 °C (77 K) for the different prepared materials. (a) MCM–Si and MCM–Si–M materials (M = Cu II, Ni II); (b) MCM–Si–Cu and MCM–Si–Cu–HT materials; (c) MCM–Si–Ni and MCM–Si–Ni–HT materials.
Applnano 02 00020 g006
Table 1. Elementary analysis and % weight loss in 400–600 °C region for the MCM–Si–M materials (M = Cu II, Ni II).
MCM–Si–M% C per Weight% Weight Loss% N per Weight% M per Weight
MCM–Si11.2810.5
MCM–Si–Cu II 4.110.527.5
MCM–Si–Ni II4.400.3210.0
MCM–Si–Cu–HT0.71 (0.70) a
MCM–Si–Ni–HT1.49 (1.0) a
a Amount of carbon expected if stoichiometry of redox reaction was respected.
Table 2. Characteristics of the MCM–Si materials determined by nitrogen adsorption analysis at −196 °C (77 K) before heat treatment.
MaterialsABET/(m2·g−1)Vp/(cm3·g−1)d iKJS/nmC
MCM–Si658.10.6003.8224
MCM–Si–Cu II474.80.4952.129
MCM–Si–Ni II456.10.3212.1047
Table 3. Characteristics of the MCM–Si materials determined by nitrogen adsorption analysis at −196 °C (77 K) after heat treatment.
MaterialsABET/(m2·g−1)Vp/(cm3·g−1)d iKJS/nmC
MCM–Si–Cu–HT234.20.2781.86129
MCM–Si–Ni–HT157.40.3691.82129
Publisher’s Note: MDPI stays neutral with regard to jurisdictional claims in published maps and institutional affiliations.

