Article

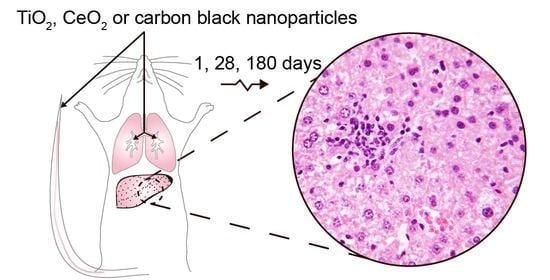
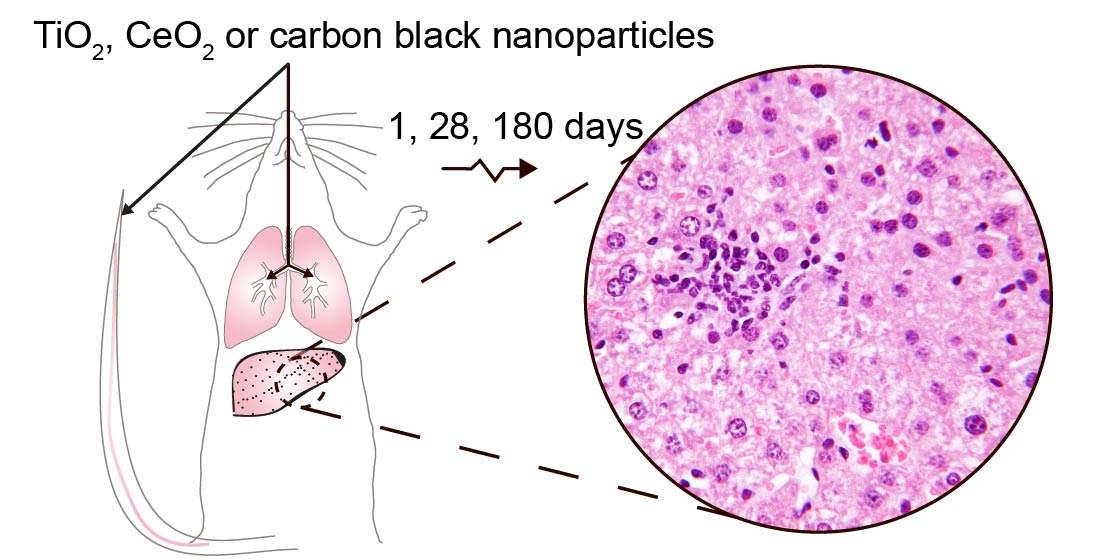
Effect on Mouse Liver Morphology of CeO2, TiO2 and Carbon Black Nanoparticles Translocated from Lungs or Deposited Intravenously

1
National Food Institute, Technical University of Denmark, 2800 Kgs. Lyngby, Denmark
2
The National Research Centre for the Working Environment, 2100 Copenhagen, Denmark
3
Department of Pathophysiology, Forensic Veterinary Medicine and Administration, Faculty of Veterinary Medicine, University of Warmia and Mazury in Olsztyn, 10-717 Olsztyn, Poland
*
Author to whom correspondence should be addressed.
Appl. Nano 2021, 2(3), 222-241; https://doi.org/10.3390/applnano2030016
Submission received: 30 June 2021 / Revised: 13 August 2021 / Accepted: 18 August 2021 / Published: 20 August 2021
(This article belongs to the Special Issue Women in Nanoscience)

Abstract

:
Exposure to nanoparticles by various routes results in size-dependent translocation of nanoparticles to the systemic circulation and subsequent accumulation in the liver. The purpose of this study was to determine possible adverse effects in the liver of long-lasting nanoparticle presence in the organ. Mice exposed to a single dose (162 µg/animal equivalent to 9 mg/kg body weight) of TiO2, CeO2 or carbon black nanoparticles by intratracheal instillation or intravenous injection, resulting in relatively low or high liver burdens, were followed for 1, 28 or 180 days. Clinical appearance, feed intake, body and liver weights, hematological indices, and transaminases and alkaline phosphatase activities were unaffected by exposure. Exposure-related foreign material persisted in the liver up to 180 days after intratracheal and intravenous exposure, mainly in sinusoids, near Kupffer cells, or around blood vessels. Increased incidences of histological findings after intratracheal or intravenous exposure included: initially, prominent nuclei of Kupffer cells, the apparent increase in binucleate hepatocytes (TiO2 and carbon black) and inflammatory infiltrations (CeO2); later, cytoplasmic vacuolation, pyknosis and necrosis, especially for CeO2. Thus, neither low nor high nanoparticle burden in the liver affected enzymatic markers of liver injury, but indications of exposure-related necrotic changes, particularly for CeO2 nanoparticles, were noted.

Graphical Abstract

1. Introduction

Unique properties of nanoparticles, such as small size, large surface area and high surface reactivity in comparison to bulk material, have led to a wide range of nanoparticle applications. This increases the risk of adverse health effects following consumer and occupational exposures. Inhalation of nanoparticles leads to pulmonary deposition and especially alveolar deposition, resulting in prolonged particle presence in the lung and inflammation [1,2]. A small fraction of the deposited particles undergoes translocation and access systemic circulation directly or via the lymphatic system to reach the liver or spleen [3,4,5,6,7,8]. Intravenously (IV) injected nanoparticles preferentially accumulate in the liver [9]. The clearance of insoluble nanoparticles from the liver is slow [10], and little is known about the adverse effects of the long-lasting presence of nanoparticles in the organ [11,12]. On the other hand, there are examples of severe adverse effects following liver accumulation of particles. Thorotrast, a colloidal suspension of thorium dioxide particles, was used as a radiographic contrast agent in the US, Europe and Japan from 1930 to 1960 [13]. The radioactive thorium dioxide particles were shown to accumulate in the liver and spleen and caused primary liver cancer in exposed patients [14].
The nanoparticles used in this work, i.e., titanium dioxide (TiO2), cerium oxide (CeO2) and carbon black, are high volume nanomaterials. TiO2 is a white pigment used in paints, coatings, cosmetics and pharmaceuticals [15]. It is also authorized in the EU as a food additive E171 (Regulation (EC) No 1333/2008) but the European Food Safety Agency (EFSA) recently concluded that TiO2 (E 171) can no longer be considered safe when used as a food additive [16]. CeO2 is used as a diesel fuel additive [17], an abrasive agent for chemical-mechanical planarization of advanced integrated circuits [18], and a polishing agent for glass mirrors, television tubes and ophthalmic lenses [19]. There are also studies of potential therapeutic uses of CeO2 nanoparticles [20,21]. Carbon black is a black pigment with broad applications [15]. Carbon black is a well-known reactive oxygen species (ROS) generator and has been shown to be mutagenic and genotoxic [22,23,24]. Adverse effects on the lung after pulmonary exposure to these nanoparticles are well-established [25,26,27,28,29,30,31,32,33,34,35,36,37]. TiO2 particles including nanosized particles (<100 nm) were detected in human liver and spleen [38,39], human placenta and meconium of newborn infants [40]. This raises questions of a possible health hazard of nanoparticles present in these organs [11,12,41].
Translocation of TiO2, CeO2 and carbon black nanoparticles from lungs to the liver was studied by us previously in laboratory mice [24,42]. Increasing liver concentrations of titanium and cerium in the liver tissue up to 180 days after intratracheal instillation (IT) confirmed continuous translocation and prolonged nanoparticle presence in the organ [24,42]. The rate of translocation following intratracheal exposure to TiO2 nanoparticles was similar to the translocation rate following inhalation exposure to TiO2 nanoparticles [42,43]. Translocation of carbon black was confirmed by brightfield microscopy.
The aim of the present study was to investigate possible adverse effects in the liver following long-lasting internal exposure to TiO2, CeO2 and carbon black nanoparticles. Thus, we examined livers of mice from a previously published study [24,42], where mice were exposed intravenously or intratracheally to the three nanoparticles, resulting in high and low liver burdens, respectively. Liver effects were assessed by conventional histological technique and enhanced darkfield microscopy, and by liver weight and activity of enzymes recognized as biomarkers of liver injury. Furthermore, we also assessed standard toxicological parameters—such as changes in body weight, feed intake and hematological parameters—as endpoints indicative of the clinical condition of the mice in the study.

2. Materials and Methods

Physicochemical properties of the studied nanoparticles, preparation of the particles for exposure and animal exposures were reported previously [24,42], and therefore, only brief descriptions are provided below.

2.1. Characterization of Nanoparticles and Nanoparticle Suspensions

TiO2 was provided by NanoAmor, CeO2 by Degussa-Quimidroga and carbon black (Printex 90) by Evonik Degussa. All tested nanomaterials were received as powders. The nanoparticles were characterized previously, and selected physicochemical parameters are presented in Table 1. TiO2 nanoparticles were pure rutile nanorods with a length of 50–60 nm and a diameter of 10–15 nm [42,44]. The CeO2 nanoparticles were cubic (fluorite structure) with primary particles of few to tens of nanometres. Carbon black nanoparticles were spherical amorphous carbon particles with a primary particle size around 14 nm [45]. None of the nanoparticles were surface-modified. TiO2 and carbon black are considered insoluble, whereas CeO2 nanoparticles were partly soluble [42,46].
Nanoparticle suspensions of 3.24 mg/mL were prepared in 2% v/v mouse serum in nanopure water (as vehicle) as described [34,35,41,42] and were sonicated for 15 min on ice, using a probe sonicator operating at 100 W/22.5 kHz (Microson ultrasonic cell disruptor, XL-2000 Microson™, Qsonica, LLC., equipped with disruptor horn with a diameter of 3.2 mm and maximum peak-to-peak amplitude of 180 μm). The control vehicle, 2% v/v serum in nanopure water, was also sonicated prior to administration. The hydrodynamic size distribution of each sonicated nanoparticle suspension was determined by dynamic light scattering (DLS) (Zetasizer Nano-ZS, Malvern Instruments, Malvern, UK) before administration as described previously [24,25,42,50]. The median particle diameter measured for TiO2, CeO2 and carbon black nanoparticles in suspension was 68 nm, 68 nm, and 51 nm, respectively [24]. Z-average and polydispersity index were 131.4 and 0.120, respectively, for TiO2; 148.8 and 0.174, respectively, for CeO2; 104.3 and 0.157, respectively, for carbon black nanoparticles. Preparation and analysis of electron microscopy samples of TiO2 and CeO2 nanoparticles used in our study together with data on the size distribution of TiO2, CeO2 and carbon black particle suspensions obtained by DLS were published previously [24,42].

2.2. Animal Handling and Exposure to Nanoparticles

The animal study was approved by the Danish Animal Experimental Inspectorate under the Ministry of Justice (Permission 2012-15-2934-00089 C6) and overseen by the Animal Welfare Committee for Animal Care and Use of the National Food Institute, Technical University of Denmark, Denmark.
Two hundred and sixteen C57BL/6 (B6JBOM-F) female mice (6 weeks old, body weight of 17.5 ± 0.9 g (mean ± SD) from Taconic, Ry, Denmark) were randomly divided into experimental and control groups (n = 9/group) and acclimated for 2 weeks. The mice were housed in polypropylene cages (Type III with Tapvei bedding and enrichment—nesting material and den), 5 or 4 mice per cage, under the controlled environmental conditions (12 h light/12 h dark cycle with the lights on from 7 p.m. to 7 a.m., room temperature of 22 °C ± 1°, relative humidity of 55% ± 5) and offered a standard pelleted diet (Altromin No. 1324) and citric acid acidified water (to avoid microbiological contamination of drinking water), both ad libitum. At the start of the study, the mice were anesthetized with 0.5 mL/100 g body weight (bw) of Hypnorm® (Fentanyl citrate 0.315 mg/mL and Fluanisone 10 mg/mL, Nomeco, Copenhagen, Denmark) and Dormicum® (Midazolam 5 mg/mL, Roche, Hvidovre, Denmark) by subcutaneous injection. Intratracheal instillation was performed as described earlier [24,26,42,45]. We have previously shown an overall even pulmonary distribution of particles using this exposure technique [51,52]. For intravenous exposure, a tail-vein injection was performed using a 0.4 × 20 mm needle (Terumo Europe, n.v. 3001, Leuven, Belgium). The mice received—by intratracheal instillation or intravenous injection—a single dose of 50 µL of the vehicle (all vehicle control groups) or of 162 µg of TiO2, CeO2 or carbon black nanoparticles dispersed in 50 µL vehicle that corresponded to 9 mg nanoparticles/kg bw. After the exposure, anesthetized mice were placed back to their cages, heated with a heating lamp and/or warming blanket and monitored until they recovered from anesthesia. During the study, clinical appearance was checked twice daily. Feed intake was recorded weekly, and body weight was recorded once a week up to 28 days post-treatment and every second week thereafter.

2.3. Selection of the Dose

The intratracheally deposited dose of the nanoparticles was selected based on the Danish occupational exposure limit for TiO2 and an inhalation study with TiO2 nanoparticles in mice [53]. In that study, the lung burden of the mice was reported to be 0.8 mg/lung for TiO2, whereas the mice in the current study were exposed to 0.162 mg. The mice in the inhalation study inhaled 0.0018 m3/h × 18 h/day × 7 mg/m3 = 0.2268 mg per day, 5 days a week for 13 weeks. Thus, the cumulated inhaled dose was 0.2268 mg × 5 days/week × 13 weeks = 14.742 mg/mouse. The lung deposition rate was 0.8 mg/14.742 mg × 100% = 5.43%. Thus, the calculated daily pulmonary deposition in the inhalation study was 0.0018 m3/h × 0.054 × 18 h × 7 mg/m3 = 0.0122 mg. The applied dose in the current study (162 µg) would thus correspond to 162 µg/12.2 µg/day = 14 exposure days in the cited animal study or exposure during 21 8-h working days at 10 mg/m3 (the current Danish occupational exposure limit for TiO2). Based on similar calculations, and assuming 33% pulmonary deposition [27], the intratracheally deposited dose of carbon black would be comparable to a lung burden after exposure during 10 8-h working days at 3.5 mg/m3 (the current Danish occupational exposure limit for carbon black).

2.4. Necropsy and Sample Collection

Before the terminations on days 1, 28 and 180, the non-fasted mice were weighed. Approximately 100 µL of blood was collected from the facial vein of all mice in each group in EDTA-coated tubes for hematology analysis. Thereafter, mice were anesthetized by subcutaneous injection of the Hypnorm/Dormicum mixture (0.5–0.7 mL/100 g body weight), exsanguinated by withdrawing the heart blood and subjected to necropsy. In the intratracheally exposed mice, bronchoalveolar lavage (BAL) was performed (n = 6 mice/group) and reported previously [24]. Lungs from three mice from each group were fixed in situ (by cannulating the trachea and delivering 4% neutral buffered formaldehyde solution via the cannula at a constant fluid pressure of 25 cm before the thorax was opened), excised and immersed into 4% neutral buffered formaldehyde solution for further microscopic examination. The livers from all animals were weighed, and specimens were fixed in 4% neutral buffered formaldehyde solution. Samples of liver (n = 9/group) and lung (n = 6/group) were collected for comet assay and determination of the total mass concentration of titanium (Ti) and cerium (Ce) in the lungs and the liver by inductively coupled plasma-mass spectrometry (ICP-MS) (Table 2), and the size distribution of CeO2 in the liver after intratracheal and intravenous exposure by single particle ICP-MS measurement, as reported previously [24,42].

2.5. Hematology Parameters and Activity of Transaminases and Alkaline Phosphatase

Hematology parameters were examined in EDTA-stabilized tubes using an abcTM Animal Blood Counter instrument (Horiba Abx Scil Abc Vet Animal Blood Counter). Alanine transaminase, aspartate transaminase and alkaline phosphatase enzyme activities were measured in plasma obtained by centrifugation for 10 min, at 4 °C, at 2500× g of sodium–heparin-stabilized blood collected on day 28 from the mice using Pentra 400 (Horiba ABX, Montpellier, France) and commercially available kits (Horiba ABX Medical, Montpellier, France; catalog no. A11A01627, A11A01626 and A11A01629, respectively). Samples from each exposure group were run in the same batch in a random order to decrease variation. A control sample was included for every 15th sample.

2.6. Histological Examination

The 4% neutral buffered formaldehyde solution fixed lung (n = 3/group) and liver samples (n = 9/group, except for 3 groups with 1 case of a spontaneous death each; see Results) were embedded in paraffin, sectioned in 4–6 µm slices and stained with hematoxylin and eosin (H&E staining). Histological examination by light microscopy in brightfield mode was performed by two operators, at first with knowledge of treatment groups and thereafter blindly [54]. INHAND proposal for diagnostic nomenclature of microscopic changes in rodents was followed [55,56]. Inflammatory cell infiltrates (focal infiltrations of mono- and polynuclear and/or histiocytic cells) in the liver were divided into two categories: small (<10 inflammatory cells, sporadically accompanied by necrotic hepatocytes with distinct eosinophilic cytoplasm) and big (>10 inflammatory cells typically surrounded by necrotic hepatocytes with distinct eosinophilic cytoplasm and with apoptotic bodies/debris often present), and their numbers were recorded. For other changes, the presence was recorded, and incidence for each group reported.

2.7. Detection of Foreign Material in Lung and Liver by Enhanced Darkfield and Brightfield Microscopy

The presence and the localization of foreign material in H&E stained histological lung and liver sections after exposures to TiO2 and CeO2 were examined by the enhanced darkfield mode of Cytoviva enhanced darkfield hyperspectral system (Auburn, AL, USA) at 40×. Aggregates of foreign material originating from TiO2 and CeO2 exposure show intense light scattering in enhanced darkfield [24,42]. Presence of carbon black was examined by brightfield microscopy at standard magnifications (10×–40×). Carbon black was visible as black spots. Images were acquired at 40× and 100× on an Olympus BX 43 microscope with a Qimaging Retiga4000R camera for darkfield and a Nikon DS-Fi2 camera for brightfield.

2.8. Statistical Analysis

All presented values were expressed as mean ± standard deviation (SD). One-way or two-way analysis of variance (ANOVA) was used to analyze the data sets (body and liver weights, feed intake, hematology, enzyme activity). In order to fulfill the normality and variance homogeneity criteria, some variables were logarithmically transformed, and some were ranked before applying nonparametric one-way or two-way ANOVA analysis. If the statistical significance was reached in the ANOVA analysis, the Tukey post-hoc multiple comparison test was used to examine the differences between the test groups. p-value < 0.05 was considered statistically significant. The statistical analyses were performed using SAS 9.4 statistical software (SAS Institute Inc., Cary, NC, USA). Incidence data from histological examination of the liver were analyzed by Fisher’s exact test (the software package Graph Pad Prism 7.02, Graph Pad Software Inc., La Jolla, CA, USA), and the non-normally distributed data on number of inflammatory cell infiltrations in the livers were assessed by the Mann–Whitney U-test (Complex Online Web Statistical calculators https://astatsa.com, accessed on 1 June 2021).

3. Results

3.1. General Appearance, Body Weight, Feed Intake and Liver Weight

The clinical appearance of mice remained unaffected up to 180 days post-exposure, but three spontaneous deaths occurred before the scheduled termination: one in the intravenous 28-day control group, one in the intravenous 180-day TiO2 group, and one in the intratracheal 180-day carbon black group. Necropsy did not clarify the cause of death. At the scheduled terminations, no test substance-related gross changes were observed. Body weight, feed intake, liver absolute and relative weights were comparable between the control and exposed groups (Table 2).

3.2. Hematology

Slightly but statistically significantly lower values, as compared with vehicle controls, were recorded for some of the calculated erythrocyte indices (mean corpuscular volume, mean corpuscular hemoglobin or mean corpuscular hemoglobin concentration) after intratracheal instillation of CeO2 or carbon black nanoparticles, or after intravenous exposure to CeO2 nanoparticles on day 180. In addition, a lower platelet count was recorded on day 1 in the intravenously exposed TiO2 group as compared to that in the control group (Table S1). The observed differences to controls were small without a consistent pattern, and the values were within the normal ranges. Consequently, the differences in hematology were considered chance findings of no toxicological relevance. Our results are in accordance with previous studies, where no effects on hematological parameters in laboratory rodents after a single or repeated dose of TiO2 or CeO2 nanoparticles by inhalation or intravenous exposure were observed [57,58,59,60].

3.3. Activities of Enzymes Indicative of Liver Injury

There were no statistically significant differences in alkaline phosphatase, aspartate transaminase and alanine transaminase activities measured in plasma 28 days post-exposure (Table 3).

3.4. Lung Histology

Intratracheal exposure to TiO2, CeO2 or carbon black nanoparticles induced inflammation in terms of increased influx of neutrophils in bronchoalveolar lavage fluid, as reported previously [24], and histopathological changes in lung tissue. Histopathological changes were to a lesser degree observed following intravenous exposure to the three nanoparticles. The lung morphology and incidence of changes and localization of nanoparticles in lungs are presented in the Supplementary File (Table S2, Figures S1–S3). The observed histopathological inflammatory changes in the lung after intratracheal or intravenous exposure to TiO2, CeO2 or carbon black nanoparticles are in accordance with previous reports [25,26,27,28,29,30,31,32,33,34,35,36,37,61,62,63].

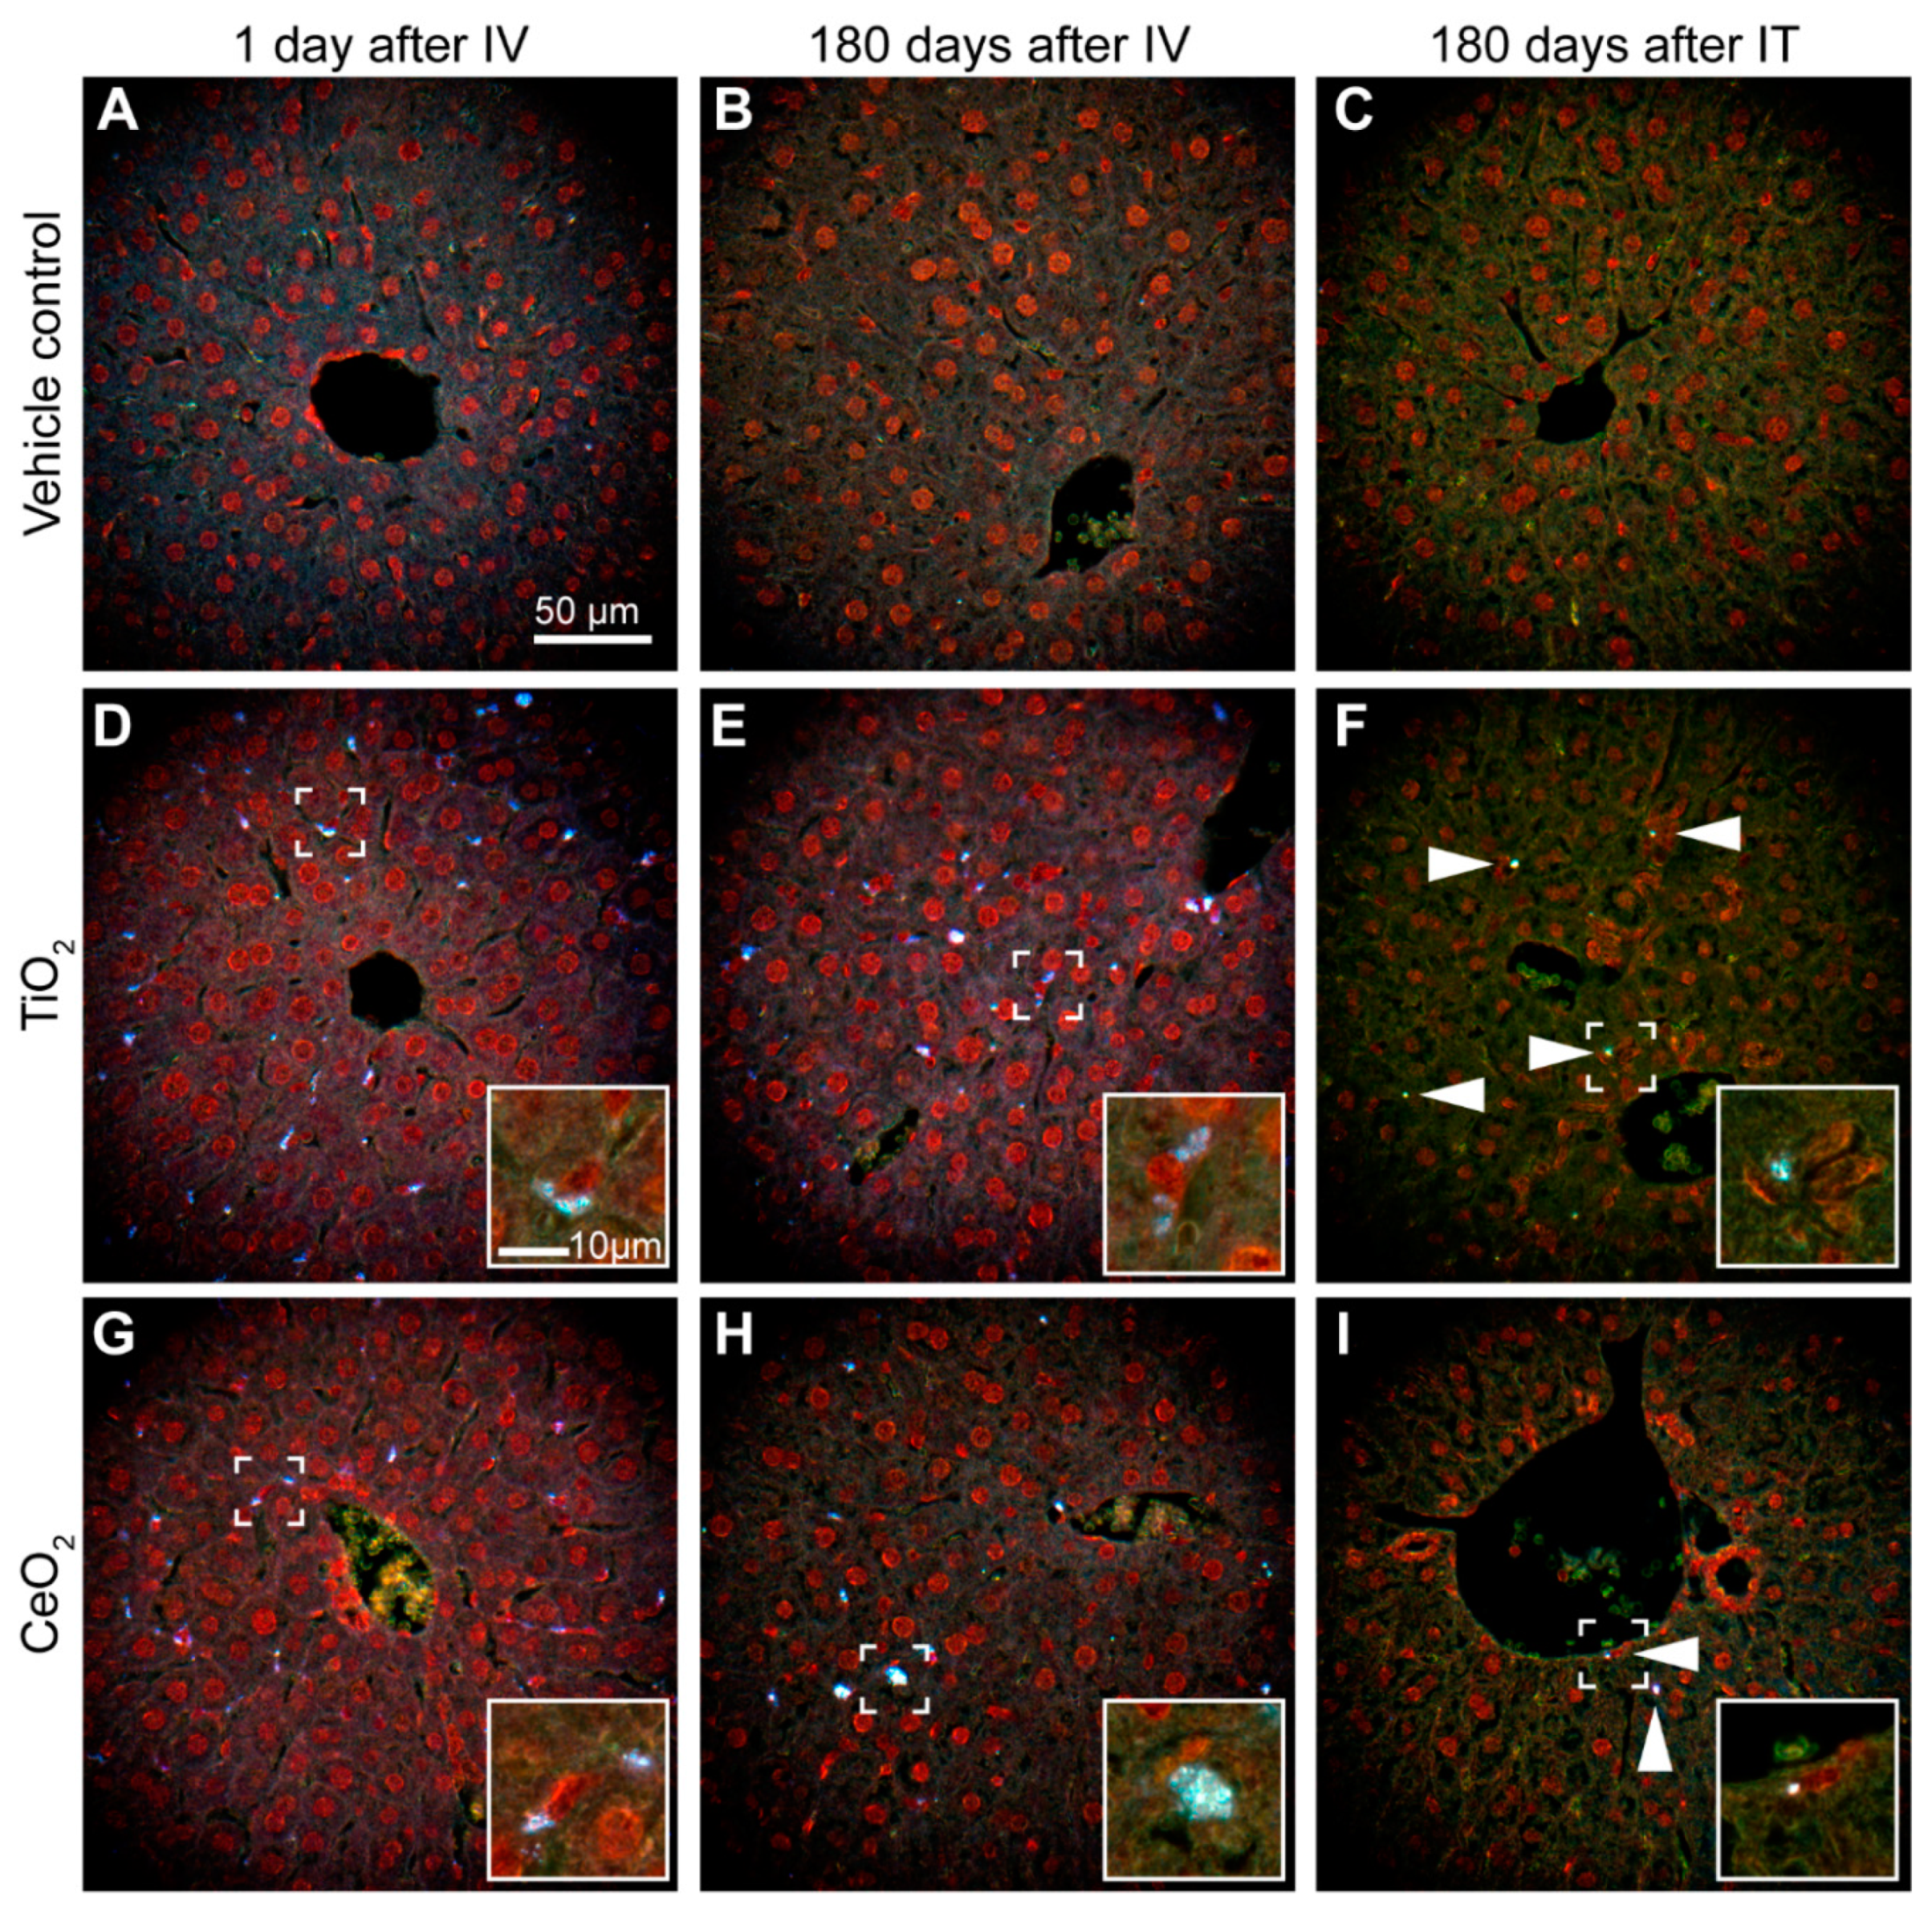
3.5. Localization of Nanoparticles in Liver

3.5.1. Localization in Liver after Intravenous Exposure

One day after intravenous exposure to TiO2, CeO2 or carbon black nanoparticles, small agglomerates of foreign material were evenly distributed across whole liver sections, mainly in sinusoids and often close to Kupffer cells (liver macrophages) (Figure 1D,G and Figure 2J). In the carbon black group, foreign material was also observed in some central venules (Figure 2J). Then, 180 days after intravenous exposure, the foreign material was visible in fewer but larger agglomerates (Figure 1E,H and Figure 2L). The agglomerates were mainly located in sinusoids or accumulated around blood vessels just below the endothelium. Occasionally, small agglomerates were possibly seen in endothelial cells (not shown). Foreign material was also present in some but not all infiltrations of inflammatory cells in the liver, both 1 and 180 days after intravenous exposure.

3.5.2. Localization in Liver after Intratracheal Instillation

180 days after intratracheal exposure to TiO2 and CeO2 nanoparticles, foreign material was also seen in the liver (Figure 1F,I), as previously described by us [24,42]. These agglomerates were smaller and much less frequent than the agglomerates detected in the liver 180 days after intravenous exposure. The small agglomerates were mainly scattered in sinusoids occasionally appearing phagocytized by Kupffer cells (insert in Figure 1F) and at veins either below the endothelium or sometimes possibly in endothelial cells (insert in Figure 1I). The agglomerates were rarely observed at locations indicating uptake by hepatocytes.
Overall, the enhanced darkfield microscopy observations were in concordance with the different concentration levels of titanium and cerium following intratracheal and intravenous exposure measured by ICP-MS (Table 2), as previously reported [42].

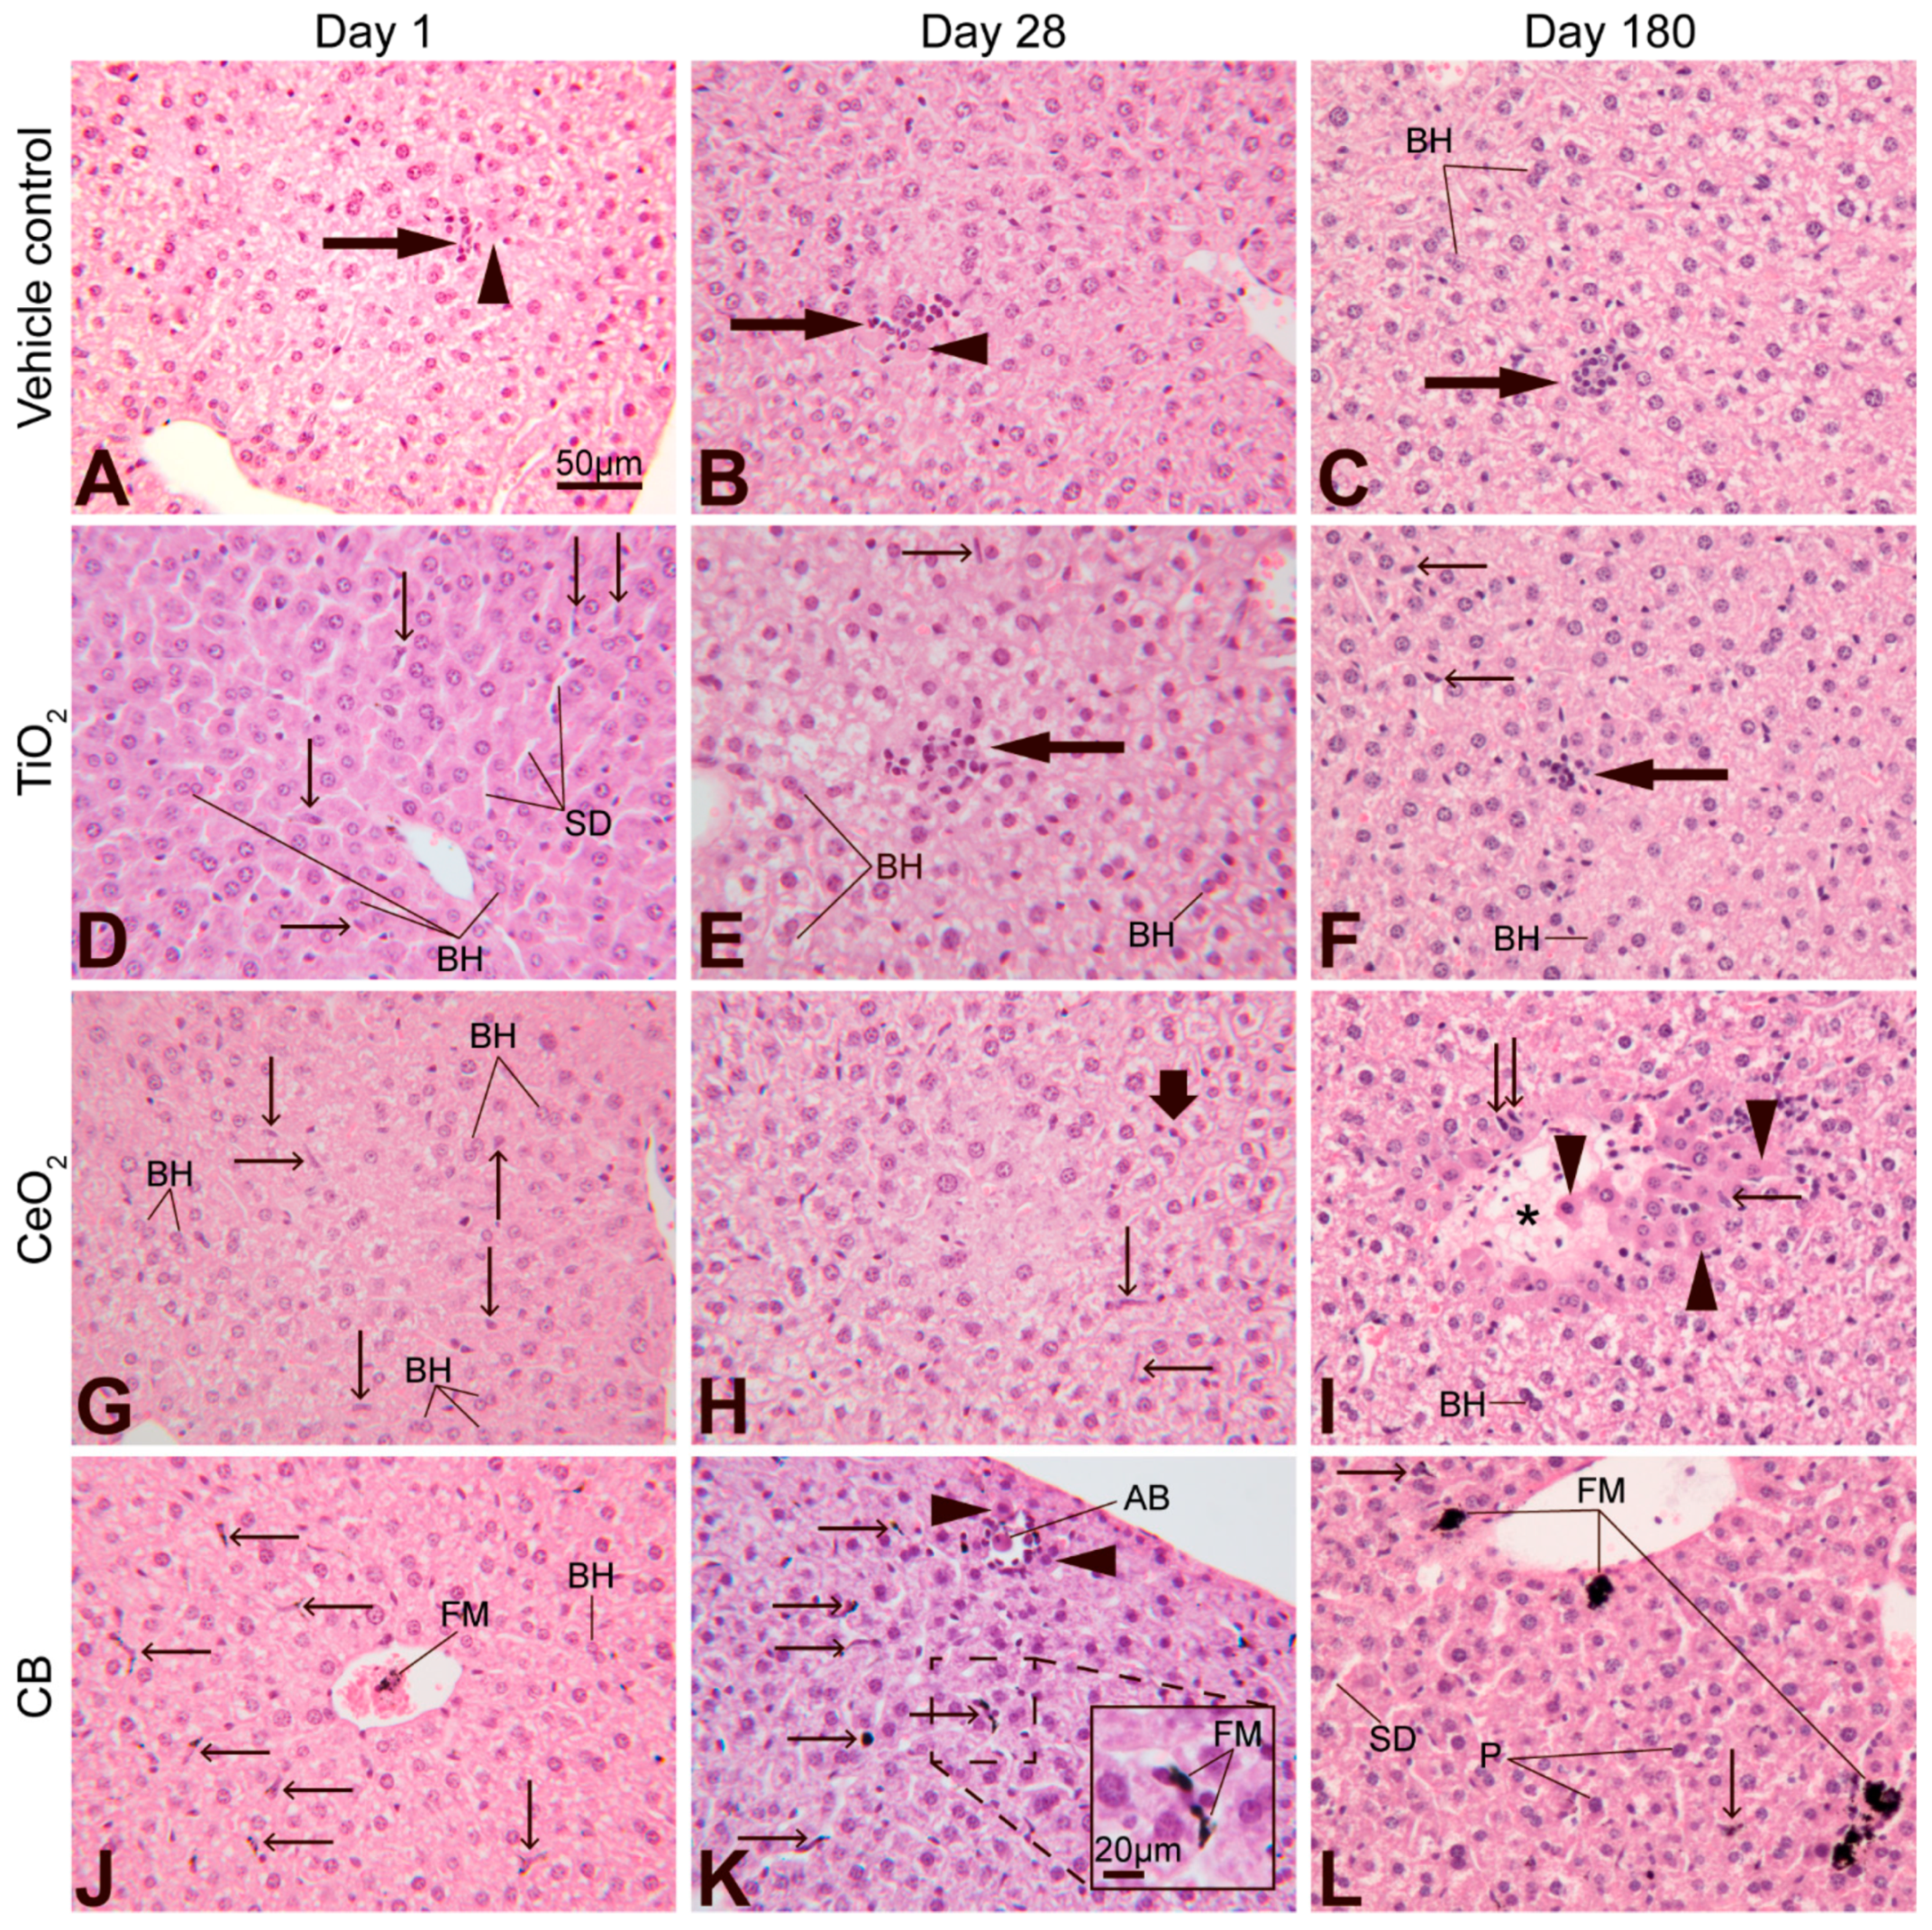
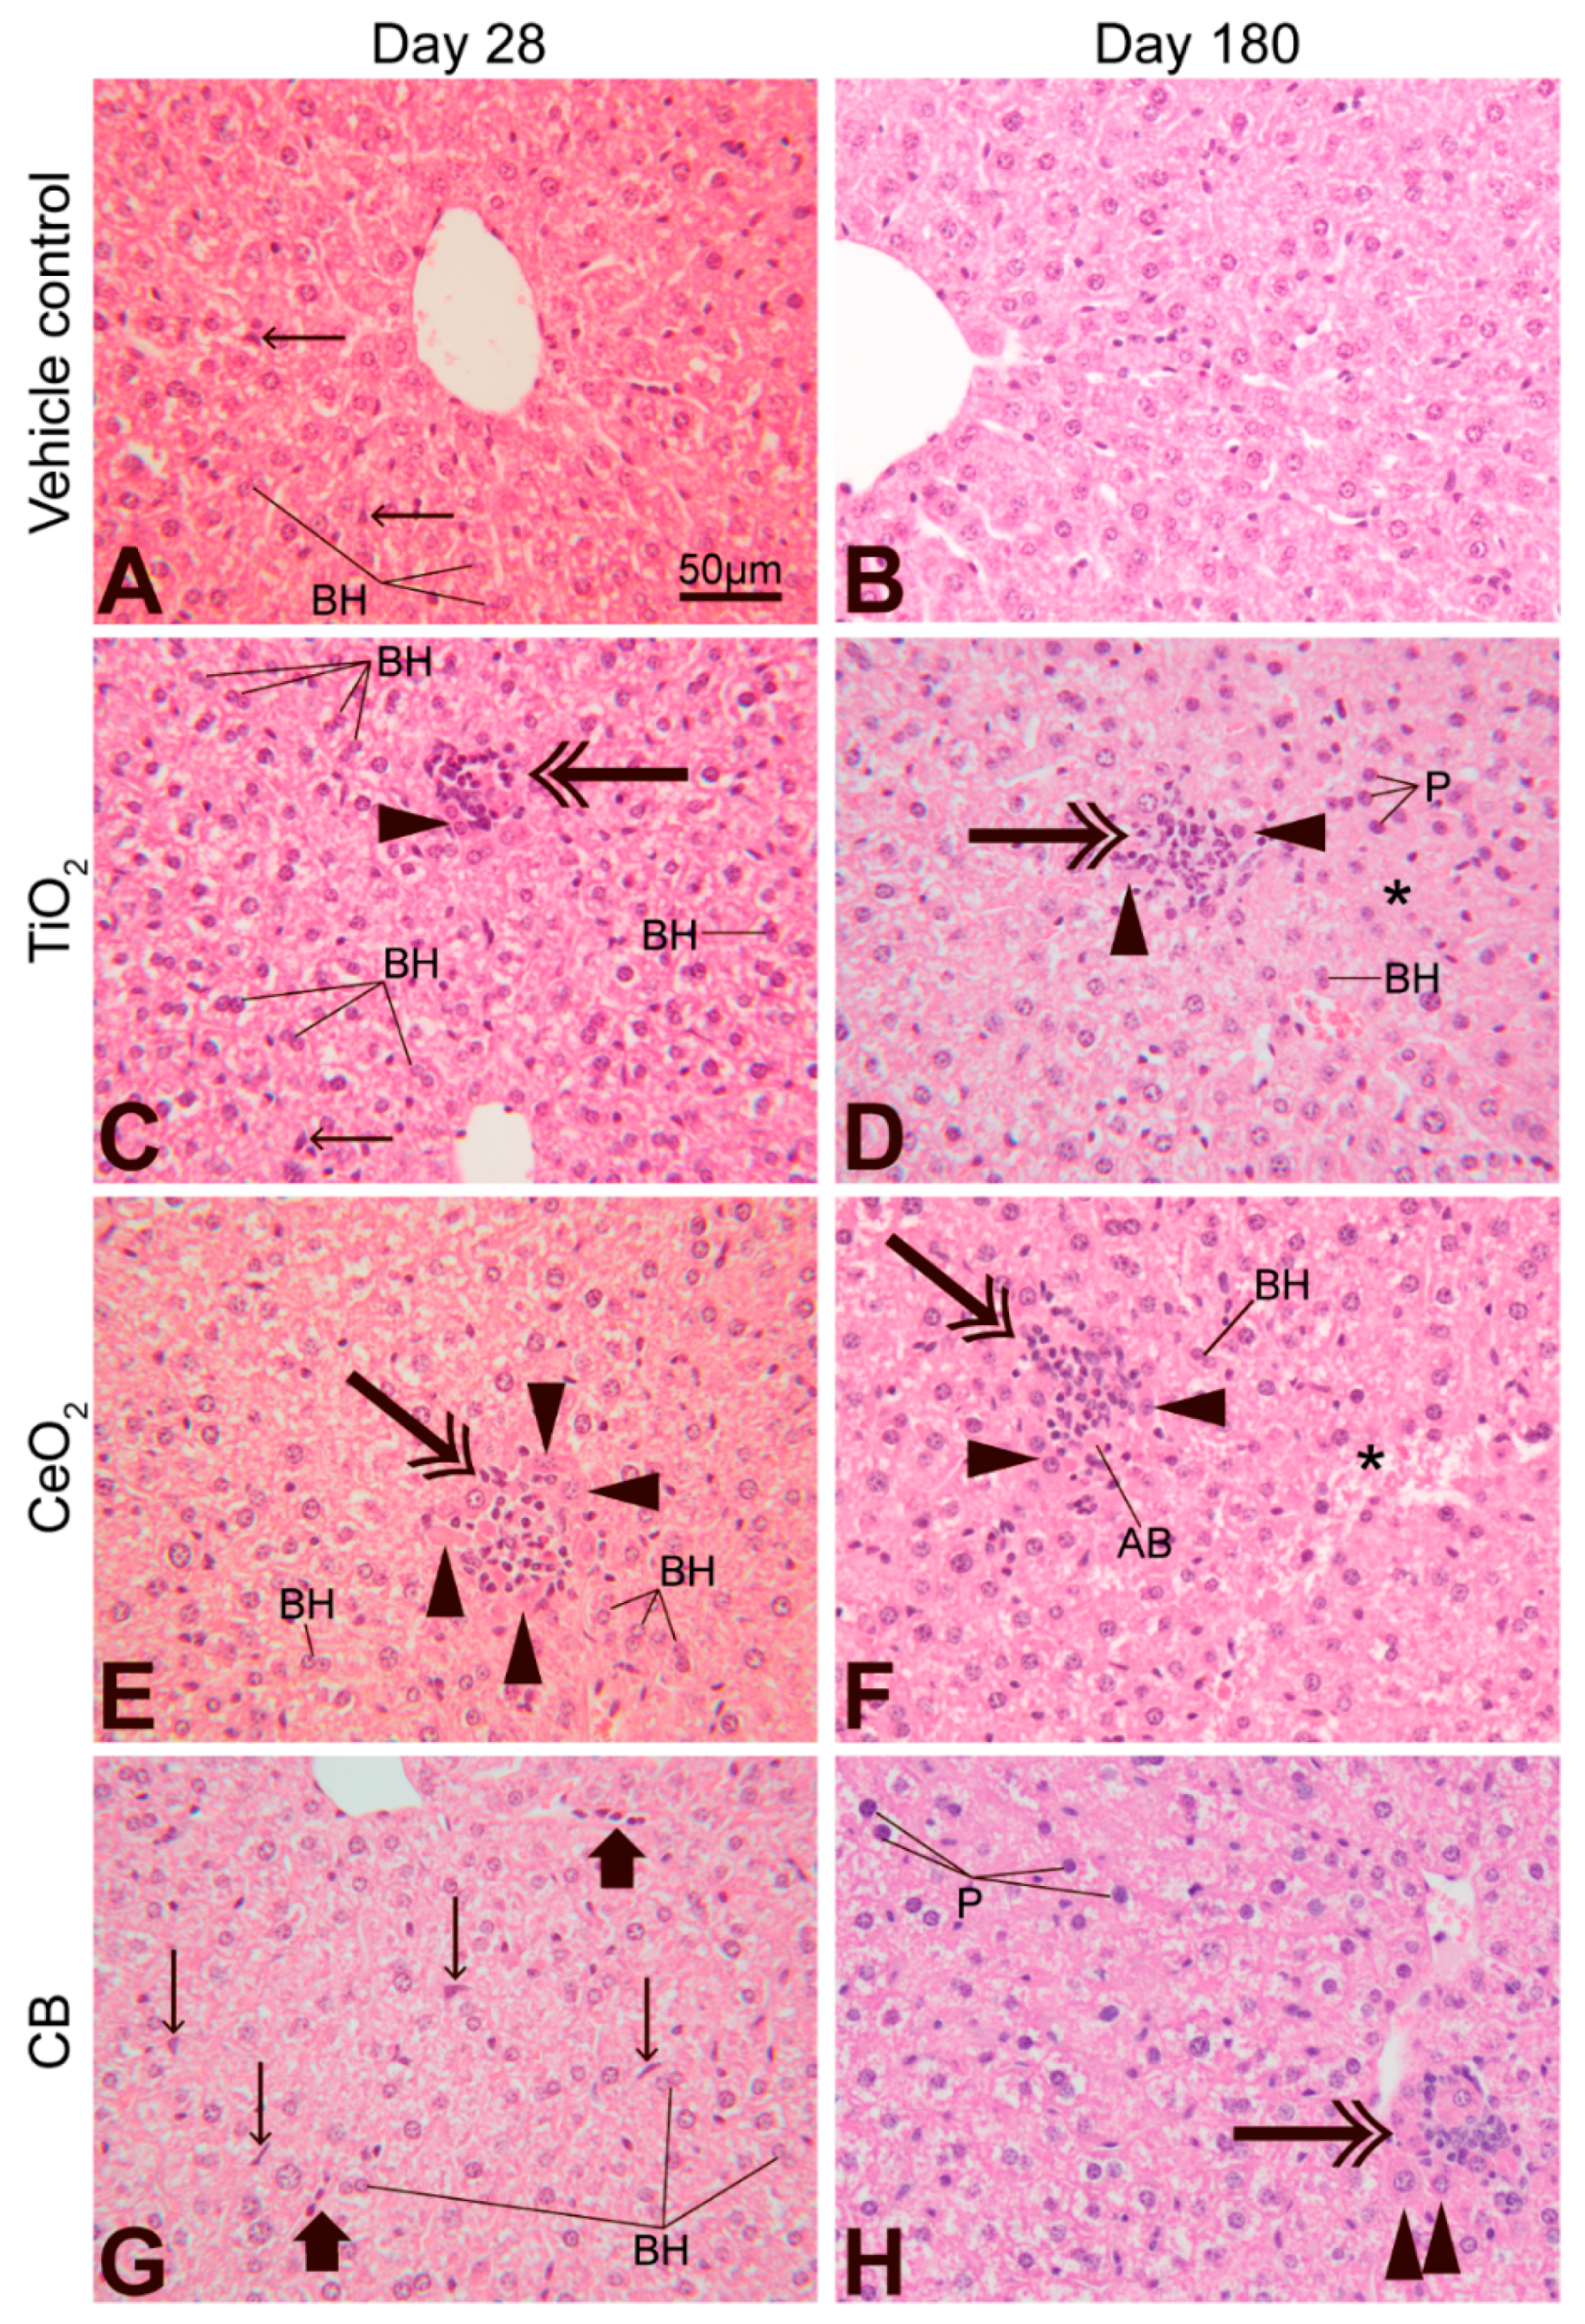
3.6. Effect of Nanoparticle Exposure on Liver Histology

The microscopic changes in the liver were predominantly of inflammatory and necrotic types (Table 4, Table S3 and S4 and Figure 2 and Figure 3).
The incidence of inflammatory changes was statistically significantly higher only in the CeO2 group for small inflammatory cell infiltrations on day 1 after intravenous exposure (Table 4). The incidence and/or number of inflammatory infiltrations were statistically significantly lower in the carbon black group on day 1 after intravenous exposure (big infiltrations) and intratracheal exposure (small infiltrations) and on day 28 after intratracheal and intravenous exposure (small infiltrations). Furthermore, the number of small inflammatory cell infiltrations was statistically significantly lower in the TiO2 group 28 days after intratracheal exposure (Table 4).
The observed necrotic changes included necrotic hepatocytes (hepatocytes with distinct eosinophilic, i.e., dark-pink, cytoplasm surrounding focal inflammatory infiltrations), single hepatocytes with pyknotic nuclei (dark, round, homogenous mass smaller than normal nuclei), areas with hepatocytes with pyknotic nuclei usually adjacent to areas of necrosis, and focal necrosis (area of either missing or partially retained morphological outline, in which hepatocytes had either pale or distinct eosinophilic cytoplasm lacking vacuolated appearance; and nuclei of some of the hepatocytes appeared pyknotic) (Figure 2 and Figure 3, Table 4 and Table S4).
Incidence of necrotic changes was statistically significantly higher for CeO2 nanoparticles relative to controls on day 28 after intratracheal instillation (single hepatocytes with pyknotic nuclei) and intravenous injection (areas of hepatocytes with pyknotic nuclei and necrosis), and on day 180 after intratracheal exposure (area of hepatocytes with pyknotic nuclei) (Table 4). Moreover, a statistically significantly higher incidence of areas of hepatocytes with pyknotic nuclei was recorded on day 180 for TiO2 after intratracheal instillation and for carbon black after intravenous exposure.
Furthermore, a statistically significantly higher incidence as compared to vehicle controls was recorded for an apparent increase in binucleate hepatocytes on day 1 after intratracheal and intravenous exposure to TiO2 and after intravenous exposure to carbon black, for the presence of Kupffer cells with prominent nuclei (Kupffer cell karyomegaly) on day 1 after intravenous exposure to TiO2 and carbon black, and for cytoplasmic vacuolation in hepatocytes on day 28 after intratracheal exposure to CeO2 (Table 4). Cytoplasmic vacuolation was slight, as it generally affected single hepatocytes located midzonally.
Other microscopic changes observed after intratracheal or intravenous exposure were hyperplasia (increased presence) of Kupffer and oval cells, and of connective tissue near bile ductules or venules, sinusoidal dilatation and congestion (Supplementary Table S4). Due to the sporadic occurrence and the non-statistically significant incidence as compared to vehicle control groups, none of these effects could be considered exposure-related.

4. Discussion

Pulmonary and intravenously administrated nanoparticles accumulate in the liver, and nanoparticle clearance from the liver is slow [9,12,42,64,65,66]. The aim of the present study was to investigate whether the liver accumulation of TiO2, CeO2 and carbon black nanoparticles could adversely affect liver function and morphology over time. The tested nanoparticles were of a similar primary size, but with different physicochemical properties (Table 1), which may affect toxicity.

4.1. Relevance of the Exposure by Intratracheal Instillation

Although pulmonary exposure via inhalation is considered a golden standard in occupational risk assessment, exposure via intratracheal instillation is considered useful for hazard assessment. This is supported by concordance between the toxicological responses and induction of biological pathways in lungs following intratracheal instillation and inhalation [67,68], although intratracheal instillation can induce more inflammation [69]. Furthermore, the translocation of nanosized TiO2 from lung to liver was similar following inhalation and intratracheal instillation [42,43]. Intratracheal exposure allows control of the deposited dose, whereas pulmonary deposition following inhalation exposure varies depending on the aerosolization and the size distribution of the aerosolized particle agglomerates [1,67].

4.2. Liver Burden of Nanoparticles

In the present study, the same dose was administered by intratracheal and intravenous exposure, resulting in different nanoparticle burdens of the liver as quantified for TiO2 and CeO2 (Table 2) [42]. The kinetics of the nanoparticle accumulation in the liver differed by exposure route, as previously shown for TiO2 nanoparticles [65,66]. Following pulmonary administration, the liver concentration of titanium and cerium increased over time to about 2 µg/g after 180 days [42]. Conversely, intravenous exposure resulted in a high liver content of titanium and cerium of about 40 µg/g already 1 day post-exposure, as expected, and remained at a high level for 180 days. The levels of titanium in the liver in the current study 1, 28, and 180 days after intratracheal exposure [42] (Table 2) were approximately 6, 14 and 40 times higher, respectively, and 1 day after intravenous exposure, the titanium level was 1000 times higher than the average level detected in human liver (0.04 ± 0.02 µg titanium/g human liver tissue) [38]. The human liver samples were most likely reflecting environmental and consumer exposure to titanium, although no data on the sources of exposure were available for the human samples [38]. The titanium burden in the human liver samples was thus more comparable to the titanium levels found in livers from vehicle controls in the current study (0.4 ± 0.2 µg titanium/g). Thus, in the present study, the internal liver exposure to the nanoparticles ranged from a level with occupational relevance (intratracheal exposure) to a very high level (intravenous exposure) as compared to the levels reported in the human liver, likely reflecting consumer and environmental exposure levels [38].

4.3. Body Weight, Feed Intake, Hematology, Transaminases and Alkaline Phosphatase, and Liver Weight

Neither intratracheal nor intravenous exposures or the subsequent deposition of nanoparticles in the liver affected the clinical condition of the mice, as evaluated by means of body weight, feed intake, hematology, activity of aminotransferases and alkaline phosphatase or liver weight, up to 180 days post-exposure. The finding of no effect on the activity of alanine aminotransferase, aspartate aminotransferase and alkaline phosphatase (Table 3) is in agreement with several reports where considerably higher pulmonary or intravenous doses of TiO2 or CeO2 nanoparticles were applied [57,59,70,71,72]. On the other hand, a single intratracheal dose of 7 mg CeO2 nanoparticles/kg bw slightly but statistically significantly elevated the activity of alanine aminotransferase and decreased absolute and relative liver weight in rats [73,74]. We consider it plausible that the difference in our result could originate from the use of another animal species, different CeO2 nanoparticles and vehicles.

4.4. Liver Histology

The most frequently observed histological changes in the liver were inflammatory infiltrations, pyknosis (a sign of the onset of necrotic changes) and necrosis.
Focal inflammatory infiltrations are common findings in the liver of aging mice, but toxicant insult may affect their severity and incidence [75]. Inflammatory liver infiltrations were reported after single intratracheal exposures to low doses of CeO2 nanoparticles in rats [73], TiO2 and carbon black nanoparticles in mice [26,76], and after single intravenous exposure of mice to a relatively high dose of TiO2 nanoparticles [57]. The internal liver burden was only measured in one of these studies [73]. These reports suggest the relation of inflammatory liver changes with exposure to nanoparticles. We found indications of reduced inflammation in the liver following carbon black exposure, as the incidence and/or number of inflammatory cell infiltrations on day 1 and day 28 after intratracheal and intravenous exposure were lower compared to vehicle controls. In accordance, the carbon black exposures did not induce hepatic acute phase response whereas TiO2 and CeO2 nanoparticles did [24]. Moreover, previous studies of gene expression in the liver following intratracheal exposure to carbon black showed only modestly increased expression of acute phase response signaling genes 1 day post-exposure, which had declined to baseline at days 3 and 28 [77]. The hepatic transcriptional response consisted mainly of increased transcription of genes related to the 3-hydroxy-3-methylglutaryl-Coenzyme A reductase pathway on days 1 and 28, whereas no inflammatory signature was observed [77]. In the present study, although the incidence and/or number of inflammatory changes were statistically significantly different compared to controls for some exposures and time points, a high background of inflammatory liver changes in control groups [78] did not allow any firm conclusion on their relation to exposure. On the other hand, an increase in the size of inflammatory liver changes was reported after oral exposure, resulting in an internal liver exposure to titanium in the same range as after intratracheal exposure in the present study [79]. The diverging result could be caused by the use of a different TiO2 (food grade) and study design.
Although hepatocellular necrosis (dead cells or tissue) is an incidental focal finding in the liver of aging mice, a hepatic injury may result in cell death involving individual or groups of hepatocytes [75]. Pyknosis is an irreversible condensation of the nucleus of a cell undergoing necrosis or apoptosis (programmed cell death). Pyknosis of single hepatocytes was previously observed after single intratracheal exposure to TiO2 and carbon black nanoparticles [76], and focal liver necrosis was reported after relatively high intravenous doses (645 mg/kg bw and above) of TiO2 nanoparticles [57]. To our knowledge, pyknosis and necrosis have not been reported previously for CeO2 nanoparticles [11,58,71,73,80,81], However, increased apoptosis of hepatocytes induced by CeO2 nanoparticles was reported [74]. This finding is supportive of our observation of increased pyknosis. Although apoptosis is considered a physiological process, increased apoptosis, as well as necrosis, are viewed as adverse effects, as both may affect the physiological status of the organ.
In the current study with known internal liver exposure, increased incidence of necrotic changes was observed already 28 days after intratracheal and intravenous exposure to CeO2. This indicated an earlier onset of necrotic changes compared to the vehicle control group and the two other nanoparticle groups (Table 4). The severity of necrotic changes differed for the two exposure routes, with only single pyknotic hepatocytes after intratracheal instillation and areas of pyknosis and necrosis for intravenous injection. This difference could be due to the kinetics: intratracheal exposure results in continuous translocation and nanoparticle uptake in the liver, whereas intravenous exposure results in a high nanoparticle liver burden already on the exposure day. The necrotic effect persisted over time, as increased incidence of areas of hepatocytes with pyknotic nuclei was seen 180 days after intratracheal exposure to CeO2 (and TiO2). Furthermore, the incidence of areas of necrosis 180 days after intratracheal and intravenous exposure was higher than in the control groups but did not reach statistical significance (Table 4).
The necrotic changes could be due to the presence of CeO2 nanoparticles in the liver, or a sequel of systemic inflammation and hepatic acute phase response previously reported by us [24]. However, since both carbon black and TiO2 exposure induced similar levels of pulmonary inflammation and TiO2 exposure induced similar hepatic acute phase response as CeO2, the former is more likely. Furthermore, CeO2 nanoparticles are slightly soluble at the low pH in the lysosome and undergo partial dissolution in the liver [42,46], and this could potentially contribute to pyknosis and necrosis. It was also suggested that the accumulation of CeO2 nanoparticles in the liver after intratracheal exposure causes hepatic oxidative stress and apoptosis [74].
Overall, our results indicate that the continuous translocation of a small fraction of CeO2 nanoparticles following pulmonary exposure as well as a high cerium liver burden may be related to necrosis in the liver. This calls for further investigation of nanoparticle fate in the liver, especially for CeO2 nanoparticles.
Furthermore, an increased incidence of cytoplasmic vacuolation (hydropic degeneration) on day 28 in the intratracheal CeO2 group was observed in our study. This is a reversible change, but it can lead to cell death. Its presence on day 28 in the intratracheal CeO2 group corroborates with the increased incidence of single-cell pyknosis at that time point. Hydropic degeneration of hepatocytes was also reported after translocation of CeO2 nanoparticles from the lung after intratracheal exposure in mice or in rats [73,80].
Due to their phagocytic action, Kupffer cells attract attention in the discussion of potential hazardous effects of nanoparticle accumulation in the liver [4,5,9,65,66,82,83,84]. Internalization of CeO2 into Kupffer cells was reported in mice after repeated inhalation of CeO2 nanoparticles at cerium liver levels of about 0.6 mg/g tissue or above [58] and after intravenous exposure of rats as demonstrated by electron microscopy [71]. In the latter study, Kupffer cell hypertrophy was reported. Hypertrophy of Kupffer cells (cytoplasmic volume increase) was not seen in the present study, but increased incidence of Kupffer cells with prominent nuclei was recorded 1 day after intravenous exposure to TiO2 or carbon black nanoparticles. This could indicate activation of Kupffer cells. In addition, exposure-related foreign material appeared phagocytized by Kupffer cells at all time points post-exposure. On day 180 after intravenous injection, the foreign material appeared to collect in fewer and larger agglomerates and often around blood vessels, but the surrounding tissue appeared unaffected similar to a previous observation for gold nanoparticles [10]. Whether this condensation of foreign material would adversely affect the surrounding tissue with chronic exposure to nanoparticles is unknown.
Another histologic observation, which deserves attention, is a transiently increased incidence of an apparent increase in binucleate hepatocytes relative to the control background 1 day after intratracheal and intravenous exposure to TiO2 nanoparticles and after intravenous exposure to carbon black (Table 4). Although binucleate hepatocytes are common in the mouse liver, this observation may indicate a treatment-related hepatocytic activation [85]. The apparent increase in binucleate hepatocytes was previously reported after intratracheal exposure of mice to a single dose of 162 µg/mouse of TiO2 [45,76] or rats to 7 mg CeO2/kg bw [73].

5. Conclusions

Exposure-related foreign materials were present in mouse livers up to 180 days following translocation from the lungs after intratracheal instillation, or after intravenous injection, of either TiO2, CeO2, or carbon black nanoparticles, resulting in relatively low or high liver burdens, respectively. Intratracheal exposure induced previously reported long-lasting pulmonary inflammation and acute phase response, and both intratracheally and intravenously dosed carbon black induced hepatic genotoxicity [24,42]. In the present investigation, no additional adverse effects were seen on clinical appearance, feed intake, body and liver weights, hematological parameters and enzymatic markers of liver injury. Histological examination revealed indications of early onset of CeO2-related necrotic changes in the liver following the continuous translocation of CeO2 nanoparticles from lungs as well as following intravenous exposure resulting in relatively high cerium liver burden. Whether a continuous and long-lasting deposition of nanoparticles in the liver following chronic exposure would lead to adverse functional or morphological changes in the liver remains to be established.

Supplementary Materials

The following are available online at https://www.mdpi.com/article/10.3390/applnano2030016/s1, Figure S1: Particle detection in the lung, Figure S2: Lung histology after intratracheal instillation, Figure S3: Lung histology after intravenous injection, Table S1: Hematology results, Table S2: Lung histology, Table S3: Inflammatory cell infiltrations in the liver, Table S4: Additional liver histology.

Author Contributions

Conceptualization, J.M., A.M., G.R.-H., A.T.S. and U.V.; Methodology, A.M., G.R.-H., A.T.S. and U.V.; Investigation, J.M., A.M., T.B., J.S., G.R.-H., A.T.S. and U.V.; Writing—Original Draft Preparation, J.M., A.M., T.B. and U.V.; Writing—Review and Editing, A.M., T.B. and U.V.; Visualization, T.B., A.M. and J.S.; Supervision, G.R.-H., A.T.S. and U.V. All authors have read and agreed to the published version of the manuscript.

Funding

The project was supported by The Danish Centre for Nanosafety (grant no. 20110092173-3) from the Danish Working Environment Research Foundation and the Danish Centre for Nanosafety II and FFIKA, Focused Research Effort on Chemicals in the Working Environment, from the Danish Government and the European Union’s Horizon 2020 research and innovation program under grant agreement No. 760813, PATROLS.

Institutional Review Board Statement

The animal study was approved by the Danish Animal Experimental Inspectorate under the Ministry of Justice (Permission 2012-15-2934-00089 C6, approved 18 March 2010) and overseen by the Animal Welfare Committee for Animal Care and Use of the National Food Institute, Technical University of Denmark, Denmark.

Data Availability Statement

The data presented in this study are available in the article and the supplementary file.

Acknowledgments

The authors would like to thank Annette Landin, Sarah Grundt Simonsen, Anne-Marie Ørngreen, Maja Danielsen, Birgitte Koch Herbst, Marianne Hansen and Rie Romme Rasmussen from National Food Institute and Anne-Karin Asp, Anne Abildtrup, Michael Guldbrandsen, Zdenka Orabi Kyjovska, Lourdes Pedersen and Elzbieta Christiansen from NFA and Aleksander Penkowski from University of Warmia and Mazury in Olsztyn, Poland for their technical assistance.

Conflicts of Interest

The authors declare that there are no conflict of interest.

References

  1. Oberdörster, G.; Oberdörster, E.; Oberdörster, J. Nanotoxicology: An Emerging Discipline Evolving from Studies of Ultrafine Particles. Environ. Health Perspect. 2005, 113, 823–839. [Google Scholar] [CrossRef]
  2. Stone, V.; Miller, M.R.; Clift, M.; Elder, A.; Mills, N.L.; Møller, P.; Schins, R.P.; Vogel, U.; Kreyling, W.; Jensen, K.A.; et al. Nanomaterials Versus Ambient Ultrafine Particles: An Opportunity to Exchange Toxicology Knowledge. Environ. Health Perspect. 2017, 125, 106002. [Google Scholar] [CrossRef]
  3. Semmler-Behnke, M.; Takenaka, S.; Fertsch, S.; Wenk, A.; Seitz, J.; Mayer, P.; Oberdörster, G.; Kreyling, W. Efficient Elimination of Inhaled Nanoparticles from the Alveolar Region: Evidence for Interstitial Uptake and Subsequent Reentrainment onto Airways Epithelium. Environ. Health Perspect. 2007, 115, 728–733. [Google Scholar] [CrossRef] [PubMed] [Green Version]
  4. Oberdörster, G.; Sharp, Z.; Atudorei, V.; Elder, A.; Gelein, R.; Lunts, A.; Kreyling, W.; Cox, C. Extrapulmonary translocation of ultrafine carbon particles following whole-body inhalation exposure of rats. J. Toxicol. Environ. Health Part A 2002, 65, 1531–1543. [Google Scholar] [CrossRef] [PubMed]
  5. Husain, M.; Wu, D.; Saber, A.T.; Decan, N.; Jacobsen, N.R.; Williams, A.; Yauk, C.; Wallin, H.; Vogel, U.; Halappanavar, S. Intratracheally instilled titanium dioxide nanoparticles translocate to heart and liver and activate complement cascade in the heart of C57BL/6 mice. Nanotoxicology 2015, 9, 1013–1022. [Google Scholar] [CrossRef] [PubMed] [Green Version]
  6. Kreyling, W.G.; Semmler-Behnke, M.; Seitz, J.; Scymczak, W.; Wenk, A.; Mayer, P.; Takenaka, S.; Oberdörster, G. Size dependence of the translocation of inhaled iridium and carbon nanoparticle aggregates from the lung of rats to the blood and secondary target organs. Inhal. Toxicol. 2009, 21, 55–60. [Google Scholar] [CrossRef]
  7. Geiser, M.; Kreyling, W.G. Deposition and biokenetics of inhaled nanoparticles. Part. Fibre Toxicol. 2010, 7, 2–19. [Google Scholar] [CrossRef] [Green Version]
  8. Lipka, J.; Semmler-Behnke, M.; Sperling, R.; Wenk, A.; Takenaka, S.; Schleh, C.; Kissel, T.; Parak, W.J.; Kreyling, W.G. Biodistribution of PEG-modified gold nanoparticles following intratracheal instillation and intravenous injection. Biomaterials 2010, 31, 6574–6581. [Google Scholar] [CrossRef]
  9. Sadauskas, E.; Wallin, H.; Stoltenberg, M.; Vogel, U.; Doering, P.; Larsen, A.; Danscher, G. Kupffer cells are central in the removal of nanoparticles from the organism. Part. Fibre Toxicol. 2007, 4, 10. [Google Scholar] [CrossRef] [Green Version]
  10. Sadauskas, E.; Danscher, G.; Stoltenberg, M.; Vogel, U.; Larsen, A.; Wallin, H. Protracted elimination of gold nanoparticles from mouse liver. Nanomed. Nanotechnol. Biol. Med. 2009, 5, 162–169. [Google Scholar] [CrossRef]
  11. Kermanizadeh, A.; Powell, L.G.; Stone, V. A review of hepatic nanotoxicology—Summation of recent findings and considerations for the next generation of study designs. J. Toxicol. Environ. Health Part B 2020, 23, 137–176. [Google Scholar] [CrossRef]
  12. Sun, T.; Kang, Y.; Liu, J.; Zhang, Y.; Ou, L.; Liu, X.; Lai, R.; Shao, L. Nanomaterials and hepatic disease: Toxicokinetics, disease types, intrinsic mechanisms, liver susceptibility, and influencing factors. J. Nanobiotechnol. 2021, 19, 1–23. [Google Scholar] [CrossRef]
  13. Lipshutz, G.S.; Brennan, T.V.; Warren, R.S. Thorotrast-induced liver neoplasia: A collective review. J. Am. Coll. Surg. 2002, 195, 713–718. [Google Scholar] [CrossRef]
  14. Andersson, M.; Vyberg, M.; Visfeldt, J.; Carstensen, B.; Storm, H.H. Primary Liver Tumors among Danish Patients Exposed to Thorotrast. Radiat. Res. 1994, 137, 262. [Google Scholar] [CrossRef]
  15. Hansen, S.F.; Heggelund, L.R.; Besora, P.R.; Mackevica, A.; Boldrin, A.; Baun, A. Nanoproducts—What is actually available to European consumers? Environ. Sci. Nano 2015, 3, 169–180. [Google Scholar] [CrossRef] [Green Version]
  16. EFSA Panel on Food Additives and Flavourings. Safety assessment of titanium dioxide (E171) as a food additive. EFSA J. 2021, 19, 6585. [Google Scholar] [CrossRef]
  17. Rzigalinski, B.A.; Carfagna, C.S.; Ehrich, M. Cerium oxide nanoparticles in neuroprotection and considerations for efficacy and safety. Wiley Interdiscip. Rev. Nanomed. Nanobiotechnol. 2017, 9, e1444. [Google Scholar] [CrossRef] [PubMed]
  18. Feng, X.; Sayle, D.C.; Wang, Z.L.; Paras, M.S.; Santora, B.; Sutorik, A.C.; Sayle, T.X.T.; Yang, Y.; Ding, Y.; Wang, X.; et al. Converting Ceria Polyhedral Nanoparticles into Single-Crystal Nanospheres. Science 2006, 312, 1504–1508. [Google Scholar] [CrossRef] [PubMed] [Green Version]
  19. Cassee, F.R.; Van Balen, E.C.; Singh, C.; Green, D.; Muijser, H.; Weinstein, J.; Dreher, K. Exposure, Health and Ecological Effects Review of Engineered Nanoscale Cerium and Cerium Oxide Associated with its Use as a Fuel Additive. Crit. Rev. Toxicol. 2011, 41, 213–229. [Google Scholar] [CrossRef] [PubMed]
  20. Casals, G.; Perramón, M.; Casals, E.; Portolés, I.; Fernández-Varo, G.; Morales-Ruiz, M.; Puntes, V.; Jiménez, W. Cerium Oxide Nanoparticles: A New Therapeutic Tool in Liver Diseases. Antioxidants 2021, 10, 660. [Google Scholar] [CrossRef] [PubMed]
  21. Manne, N.D.; Arvapalli, R.; Graffeo, V.A.; Bandarupalli, V.V.K.; Shokuhfar, T.; Patel, S.; Rice, K.; Ginjupalli, G.K.; Blough, E.R. Prophylactic Treatment with Cerium Oxide Nanoparticles Attenuate Hepatic Ischemia Reperfusion Injury in Sprague Dawley Rats. Cell. Physiol. Biochem. 2017, 42, 1837–1846. [Google Scholar] [CrossRef]
  22. Jacobsen, N.R.; Saber, A.T.; White, P.; Møller, P.; Pojana, G.; Vogel, U.; Loft, S.; Gingerich, J.; Soper, L.; Douglas, G.R.; et al. Increased mutant frequency by carbon black, but not quartz, in thelacZ andcII transgenes of muta™mouse lung epithelial cells. Environ. Mol. Mutagen. 2007, 48, 451–461. [Google Scholar] [CrossRef]
  23. Jacobsen, N.R.; Pojana, G.; White, P.; Møller, P.; Cohn, C.A.; Korsholm, K.S.; Vogel, U.; Marcomini, A.; Loft, S.; Wallin, H. Genotoxicity, cytotoxicity, and reactive oxygen species induced by single-walled carbon nanotubes and C60fullerenes in the FE1-Muta™Mouse lung epithelial cells. Environ. Mol. Mutagen. 2008, 49, 476–487. [Google Scholar] [CrossRef] [PubMed]
  24. Modrzynska, J.; Berthing, T.; Ravn-Haren, G.; Jacobsen, N.R.; Weydahl, I.K.; Loeschner, K.; Mortensen, A.; Saber, A.T.; Vogel, U. Primary genotoxicity in the liver following pulmonary exposure to carbon black nanoparticles in mice. Part. Fibre Toxicol. 2018, 15, 1–12. [Google Scholar] [CrossRef] [Green Version]
  25. Wallin, H.; Kyjovska, Z.O.; Poulsen, S.S.; Jacobsen, N.R.; Saber, A.T.; Bengtson, S.; Jackson, P.; Vogel, U. Surface modification does not influence the genotoxic and inflammatory effects of TiO2 nanoparticles after pulmonary exposure by instillation in mice. Mutagenesis 2017, 32, 47–57. [Google Scholar] [CrossRef] [PubMed] [Green Version]
  26. Saber, A.T.; Jacobsen, N.R.; Mortensen, A.; Szarek, J.; Jackson, P.; Madsen, A.M.; Jensen, K.A.; Koponen, I.K.; Brunborg, G.; Gützkow, K.B.; et al. Nanotitanium dioxide toxicity in mouse lung is reduced in sanding dust from paint. Part. Fibre Toxicol. 2012, 9, 4. [Google Scholar] [CrossRef] [PubMed] [Green Version]
  27. Bourdon, J.A.; Saber, A.T.; Jacobsen, N.R.; Jensen, K.A.; Madsen, A.M.; Lamson, J.S.; Wallin, H.; Møller, P.; Loft, S.; Yauk, C.; et al. Carbon black nanoparticle instillation induces sustained inflammation and genotoxicity in mouse lung and liver. Part. Fibre Toxicol. 2012, 9, 5. [Google Scholar] [CrossRef] [Green Version]
  28. Warheit, D.B.; Webb, T.R.; Reed, K.L.; Frerichs, S.; Sayes, C. Pulmonary toxicity study in rats with three forms of ultrafine-TiO2 particles: Differential responses related to surface properties. Toxicology 2007, 230, 90–104. [Google Scholar] [CrossRef]
  29. Liu, R.; Yin, L.; Pu, Y.; Liang, G.; Zhang, J.; Su, Y.; Xiao, Z.; Ye, B. Pulmonary toxicity induced by three forms of titanium dioxide nanoparticles via intra-tracheal instillation in rats. Prog. Nat. Sci. 2009, 19, 573–579. [Google Scholar] [CrossRef]
  30. Kwon, S.; Yang, Y.-S.; Yang, H.-S.; Lee, J.; Kang, M.-S.; Lee, B.-S.; Lee, K.; Song, C.-W. Nasal and Pulmonary Toxicity of Titanium Dioxide Nanoparticles in Rats. Toxicol. Res. 2012, 28, 217–224. [Google Scholar] [CrossRef] [Green Version]
  31. Keller, J.; Wohlleben, W.; Ma-Hock, L.; Strauss, V.; Gröters, S.; Küttler, K.; Wiench, K.; Herden, C.; Oberdörster, G.; Van Ravenzwaay, B.; et al. Time course of lung retention and toxicity of inhaled particles: Short-term exposure to nano-Ceria. Arch. Toxicol. 2014, 88, 2033–2059. [Google Scholar] [CrossRef] [Green Version]
  32. Saputra, D.; Yoon, J.-H.; Park, H.; Heo, Y.; Yang, H.; Lee, E.J.; Lee, S.; Song, C.-W.; Lee, K. Inhalation of Carbon Black Nanoparticles Aggravates Pulmonary Inflammation in Mice. Toxicol. Res. 2014, 30, 83–90. [Google Scholar] [CrossRef] [PubMed] [Green Version]
  33. Yoshiura, Y.; Izumi, H.; Oyabu, T.; Hashiba, M.; Kambara, T.; Mizuguchi, Y.; Lee, B.W.; Okada, T.; Tomonaga, T.; Myojo, T.; et al. Pulmonary toxicity of well-dispersed titanium dioxide nanoparticles following intratracheal instillation. J. Nanoparticle Res. 2015, 17, 241. [Google Scholar] [CrossRef] [PubMed] [Green Version]
  34. Morimoto, Y.; Izumi, H.; Yoshiura, Y.; Tomonaga, T.; Oyabu, T.; Myojo, T.; Kawai, K.; Yatera, K.; Shimada, M.; Kubo, M.; et al. Pulmonary toxicity of well-dispersed cerium oxide nanoparticles following intratracheal instillation and inhalation. J. Nanoparticle Res. 2015, 17, 1–16. [Google Scholar] [CrossRef] [Green Version]
  35. Schwotzer, D.; Ernst, H.; Schaudien, D.; Kock, H.; Pohlmann, G.; Dasenbrock, C.; Creutzenberg, O. Effects from a 90-day inhalation toxicity study with cerium oxide and barium sulfate nanoparticles in rats. Part. Fibre Toxicol. 2017, 14, 23. [Google Scholar] [CrossRef] [PubMed] [Green Version]
  36. Danielsen, P.H.; Knudsen, K.B.; Štrancar, J.; Umek, P.; Koklič, T.; Garvas, M.; Vanhala, E.; Savukoski, S.; Ding, Y.; Madsen, A.M.; et al. Effects of physicochemical properties of TiO2 nanomaterials for pulmonary inflammation, acute phase response and alveolar proteinosis in intratracheally exposed mice. Toxicol. Appl. Pharmacol. 2020, 386, 114830. [Google Scholar] [CrossRef] [PubMed]
  37. Ma, J.Y.; Zhao, H.; Mercer, R.R.; Barger, M.; Rao, M.; Meighan, T.; Schwegler-Berry, D.; Castranova, V.; Ma, J.K. Cerium oxide nanoparticle-induced pulmonary inflammation and alveolar macrophage functional change in rats. Nanotoxicology 2010, 5, 312–325. [Google Scholar] [CrossRef] [PubMed]
  38. Heringa, M.B.; Peters, R.J.B.; Bleys, R.L.A.W.; Van Der Lee, M.K.; Tromp, P.C.; Van Kesteren, P.C.E.; Van Eijkeren, J.C.H.; Undas, A.; Oomen, A.G.; Bouwmeester, H. Detection of titanium particles in human liver and spleen and possible health implications. Part. Fibre Toxicol. 2018, 15, 1–9. [Google Scholar] [CrossRef]
  39. Peters, R.J.B.; Oomen, A.G.; Van Bemmel, G.; Van Vliet, L.; Undas, A.; Munniks, S.; Bleys, R.L.A.W.; Tromp, P.C.; Brand, W.; Van Der Lee, M. Silicon dioxide and titanium dioxide particles found in human tissues. Nanotoxicology 2020, 14, 420–432. [Google Scholar] [CrossRef]
  40. Guillard, A.; Gaultier, E.; Cartier, C.; Devoille, L.; Noireaux, J.; Chevalier, L.; Morin, M.; Grandin, F.; Lacroix, M.Z.; Coméra, C.; et al. Basal Ti level in the human placenta and meconium and evidence of a materno-foetal transfer of food-grade TiO2 nanoparticles in an ex vivo placental perfusion model. Part. Fibre Toxicol. 2020, 17, 51. [Google Scholar] [CrossRef]
  41. Heringa, M.B.; Geraets, L.; Van Eijkeren, J.C.H.; Vandebriel, R.; De Jong, W.H.; Oomen, A.G. Risk assessment of titanium dioxide nanoparticles via oral exposure, including toxicokinetic considerations. Nanotoxicology 2016, 10, 1515–1525. [Google Scholar] [CrossRef] [Green Version]
  42. Modrzynska, J.; Berthing, T.; Ravn-Haren, G.; Kling, K.; Mortensen, A.; Rasmussen, R.R.; Larsen, E.H.; Saber, A.T.; Vogel, U.; Loeschner, K. In vivo-induced size transformation of cerium oxide nanoparticles in both lung and liver does not affect long-term hepatic accumulation following pulmonary exposure. PLoS ONE 2018, 13, e0202477. [Google Scholar] [CrossRef] [Green Version]
  43. Hougaard, K.S.; Jackson, P.; Jensen, K.A.; Sloth, J.J.; Löschner, K.; Larsen, E.H.; Birkedal, R.K.; Vibenholt, A.; Boisen, A.-M.Z.; Wallin, H.; et al. Effects of prenatal exposure to surface-coated nanosized titanium dioxide (UV-Titan). A study in mice. Part. Fibre Toxicol. 2010, 7, 16. [Google Scholar] [CrossRef] [Green Version]
  44. Halappanavar, S.; Saber, A.T.; Decan, N.; Jensen, K.A.; Wu, D.; Jacobsen, N.R.; Guo, C.; Rogowski, J.; Koponen, I.K.; Levin, M.; et al. Transcriptional profiling identifies physicochemical properties of nanomaterials that are determinants of the in vivo pulmonary response. Environ. Mol. Mutagen. 2015, 56, 245–264. [Google Scholar] [CrossRef]
  45. Saber, A.T.; Jensen, K.A.; Jacobsen, N.R.; Birkedal, R.; Mikkelsen, L.; Møller, P.; Loft, S.; Wallin, H.; Vogel, U. Inflammatory and genotoxic effects of nanoparticles designed for inclusion in paints and lacquers. Nanotoxicology 2011, 6, 453–471. [Google Scholar] [CrossRef]
  46. Graham, U.M.; Tseng, M.T.; Jasinski, J.B.; Yokel, R.; Unrine, J.; Davis, B.H.; Dozier, A.K.; Hardas, S.S.; Sultana, R.; Grulke, E.A.; et al. In Vivo Processing of Ceria Nanoparticles inside Liver: Impact on Free-Radical Scavenging Activity and Oxidative Stress. ChemPlusChem 2014, 79, 1083–1088. [Google Scholar] [CrossRef] [PubMed]
  47. Kyjovska, Z.O.; Jacobsen, N.R.; Saber, A.T.; Bengtson, S.; Jackson, P.; Wallin, H.; Vogel, U. DNA damage following pulmonary exposure by instillation to low doses of carbon black (Printex 90) nanoparticles in mice. Environ. Mol. Mutagen. 2014, 56, 41–49. [Google Scholar] [CrossRef] [Green Version]
  48. Lide, R.C. Handbook of Chemistry and Physics, 84th ed.; CRC Press: Boca Raton, FL, USA, 2004. [Google Scholar]
  49. Levin, M.; Rojas, E.; Vanhala, E.; Vippola, M.; Liguori, B.; Kling, K.I.; Koponen, I.K.; Mølhave, K.; Tuomi, T.; Gregurec, D.; et al. Influence of relative humidity and physical load during storage on dustiness of inorganic nanomaterials: Implications for testing and risk assessment. J. Nanoparticle Res. 2015, 17, 337. [Google Scholar] [CrossRef] [Green Version]
  50. Saber, A.T.; Bornholdt, J.; Dybdahl, M.; Sharma, A.K.; Loft, S.; Vogel, U.; Wallin, H. Tumor necrosis factor is not required for particle-induced genotoxicity and pulmonary inflammation. Arch. Toxicol. 2004, 79, 177–182. [Google Scholar] [CrossRef] [PubMed]
  51. Poulsen, S.S.; Saber, A.T.; Williams, A.; Andersen, O.; Købler, C.; Atluri, R.; Pozzebon, M.E.; Mucelli, S.P.; Simion, M.; Rickerby, D.; et al. MWCNTs of different physicochemical properties cause similar inflammatory responses, but differences in transcriptional and histological markers of fibrosis in mouse lungs. Toxicol. Appl. Pharmacol. 2015, 284, 16–32. [Google Scholar] [CrossRef]
  52. Mikkelsen, L.; Sheykhzade, M.; Jensen, K.A.; Saber, A.T.; Jacobsen, N.R.; Vogel, U.; Wallin, H.; Loft, S.; Møller, P. Modest effect on plaque progression and vasodilatory function in atherosclerosis-prone mice exposed to nanosized TiO2. Part. Fibre Toxicol. 2011, 8, 32. [Google Scholar] [CrossRef] [PubMed] [Green Version]
  53. Heinrich, U.; Fuhst, R.; Rittinghausen, S.; Creutzenberg, O.; Bellmann, B.; Koch, W.; Levsen, K. Chronic Inhalation Exposure of Wistar Rats and two Different Strains of Mice to Diesel Engine Exhaust, Carbon Black, and Titanium Dioxide. Inhal. Toxicol. 1995, 7, 533–556. [Google Scholar] [CrossRef]
  54. Haschek, W.M.; Rousseaux, C.G.; Wallig, M.A. Fundamentals of Toxicologic Pathology, 2nd ed.; Academic Press: London, UK, 2010. [Google Scholar] [CrossRef]
  55. Renne, R.; Brix, A.; Harkema, J.; Herbert, R.; Kittel, B.; Lewis, D.; March, T.; Nagano, K.; Pino, M.; Rittinghausen, S.; et al. Proliferative and Nonproliferative Lesions of the Rat and Mouse Respiratory Tract. Toxicol. Pathol. 2009, 37, 5S–73S. [Google Scholar] [CrossRef] [PubMed] [Green Version]
  56. Thoolen, B.; Maronpot, R.R.; Harada, T.; Nyska, A.; Rousseaux, C.; Nolte, T.; Malarkey, D.E.; Kaufmann, W.; Küttler, K.; Deschl, U.; et al. Proliferative and Nonproliferative Lesions of the Rat and Mouse Hepatobiliary System. Toxicol. Pathol. 2010, 38, 5S–81S. [Google Scholar] [CrossRef] [PubMed]
  57. Xu, J.; Shi, H.; Ruth, M.; Yu, H.; Lazar, L.; Zou, B.; Yang, C.; Wu, A.; Zhao, J. Acute Toxicity of Intravenously Administered Titanium Dioxide Nanoparticles in Mice. PLoS ONE 2013, 8, e70618. [Google Scholar] [CrossRef] [PubMed] [Green Version]
  58. Aalapati, S.; Ganapathy, S.; Manapuram, S.; Anumolu, G.; Prakya, B.M. Toxicity and bio-accumulation of inhaled cerium oxide nanoparticles in CD1 mice. Nanotoxicology 2013, 8, 786–798. [Google Scholar] [CrossRef] [PubMed]
  59. Srinivas, A.; Rao, P.J.; Selvam, G.S.; Murthy, P.B.; Reddy, P.N. Acute inhalation toxicity of cerium oxide nanoparticles in rats. Toxicol. Lett. 2011, 205, 105–115. [Google Scholar] [CrossRef]
  60. Gosens, I.; Mathijssen, L.E.; Bokkers, B.G.; Muijser, H.; Cassee, F.R. Comparative hazard identification of nano- and micro-sized cerium oxide particles based on 28-day inhalation studies in rats. Nanotoxicology 2013, 8, 643–653. [Google Scholar] [CrossRef] [PubMed]
  61. Okada, T.; Ogami, A.; Lee, B.W.; Kadoya, C.; Oyabu, T.; Myojo, T. Pulmonary responses in rat lungs after intratracheal instillation of 4 crystal forms of titanium dioxide nanoparticles. J. Occup. Health 2016, 58, 602–611. [Google Scholar] [CrossRef] [Green Version]
  62. Rahman, L.; Wu, N.; Johnston, M.; William, A.; Halappanavar, S.; Williams, A. Toxicogenomics analysis of mouse lung responses following exposure to titanium dioxide nanomaterials reveal their disease potential at high doses. Mutagenesis 2016, 32, 59–76. [Google Scholar] [CrossRef] [Green Version]
  63. Husain, M.; Saber, A.T.; Guo, C.; Jacobsen, N.R.; Jensen, K.A.; Yauk, C.L.; Williams, A.; Vogel, U.; Wallin, H.; Halappanavar, S. Pulmonary instillation of low doses of titanium dioxide nanoparticles in mice leads to particle retention and gene expression changes in the absence of inflammation. Toxicol. Appl. Pharmacol. 2013, 269, 250–262. [Google Scholar] [CrossRef] [PubMed] [Green Version]
  64. Semmler, M.; Seitz, J.; Erbe, F.; Mayer, P.; Heyder, J.; Oberdörster, G.; Kreyling, W.G. Long-Term Clearance Kinetics of Inhaled Ultrafine Insoluble Iridium Particles from the Rat Lung, Including Transient Translocation into Secondary Organs. Inhal. Toxicol. 2004, 16, 453–459. [Google Scholar] [CrossRef]
  65. Kreyling, W.; Holzwarth, U.; Haberl, N.; Kozempel, J.; Hirn, S.; Wenk, A.; Schleh, C.; Schäffler, M.; Lipka, J.; Semmler-Behnke, M.; et al. Quantitative biokinetics of titanium dioxide nanoparticles after intravenous injection in rats: Part 1. Nanotoxicology 2017, 11, 434–442. [Google Scholar] [CrossRef] [PubMed]
  66. Kreyling, W.G.; Holzwarth, U.; Haberl, N.; Kozempel, J.; Wenk, A.; Hirn, S.; Schleh, C.; Schäffler, M.; Lipka, J.; Semmler-Behnke, M.; et al. Quantitative biokinetics of titanium dioxide nanoparticles after intratracheal instillation in rats: Part 3. Nanotoxicology 2017, 11, 454–464. [Google Scholar] [CrossRef]
  67. Gaté, L.; Knudsen, K.B.; Seidel, C.; Berthing, T.; Chézeau, L.; Jacobsen, N.R.; Valentino, S.; Wallin, H.; Bau, S.; Wolff, H.; et al. Pulmonary toxicity of two different multi-walled carbon nanotubes in rat: Comparison between intratracheal instillation and inhalation exposure. Toxicol. Appl. Pharmacol. 2019, 375, 17–31. [Google Scholar] [CrossRef]
  68. Kinaret, P.; Ilves, M.; Fortino, V.; Rydman, E.; Karisola, P.; Lähde, A.; Koivisto, A.J.; Jokiniemi, J.; Wolff, H.; Savolainen, K.; et al. Inhalation and Oropharyngeal Aspiration Exposure to Rod-Like Carbon Nanotubes Induce Similar Airway Inflammation and Biological Responses in Mouse Lungs. ACS Nano 2017, 11, 291–303. [Google Scholar] [CrossRef]
  69. Baisch, B.L.; Corson, N.M.; Wade-Mercer, P.; Gelein, R.; Kennell, A.J.; Oberdörster, G.; Elder, A. Equivalent titanium dioxide nanoparticle deposition by intratracheal instillation and whole body inhalation: The effect of dose rate on acute respiratory tract inflammation. Part. Fibre Toxicol. 2014, 11, 5. [Google Scholar] [CrossRef] [Green Version]
  70. Wang, J.; Zhou, G.; Tiancheng, W.; Yu, H.; Wang, T.; Ma, Y.; Jiangxue, W.; Gao, Y.; Li, Y.-F.; Sun, J. Acute toxicity and biodistribution of different sized titanium dioxide particles in mice after oral administration. Toxicol. Lett. 2007, 168, 176–185. [Google Scholar] [CrossRef]
  71. Tseng, M.T.; Fu, Q.; Lor, K.; Fernandez-Botran, G.R.; Deng, Z.-B.; Graham, U.; Butterfield, D.A.; Grulke, E.A.; Yokel, R. Persistent Hepatic Structural Alterations Following Nanoceria Vascular Infusion in the Rat. Toxicol. Pathol. 2014, 42, 984–996. [Google Scholar] [CrossRef] [PubMed]
  72. Park, E.-J.; Park, Y.-K.; Park, K.-S. Acute Toxicity and Tissue Distribution of Cerium Oxide Nanoparticles by a Single Oral Administration in Rats. Toxicol. Res. 2009, 25, 79–84. [Google Scholar] [CrossRef]
  73. Nalabotu, S.K.; Kolli, M.B.; Triest, W.; Ma, J.Y.; Manne, N.D.; Katta, A.; Addagarla, H.; Rice, K.; Blough, E.R. Intratracheal instillation of cerium oxide nanoparticles induces hepatic toxicity in male Sprague-Dawley rats. Int. J. Nanomed. 2011, 6, 2327–2335. [Google Scholar] [CrossRef] [Green Version]
  74. Nalabotu, S.K.; Manne, N.D.; Kolli, M.B.; Nandyala, G.; Para, R.K.; Rice, K.M.; Jones, C.D.; Blough, E.R. Role of Oxidative Stress and Apoptosis in the Hepatic Toxicity Induced by Cerium Oxide Nanoparticles Following Intratracheal Instillation in Male Sprague-Dawley Rats. J. Toxicol. Risk Assess. 2019, 5, 26. [Google Scholar] [CrossRef]
  75. Harada, T.; Enomoto, A.; Boorman, G.A.; Maronpot, R.A. Liver and gallbladder. In Pathology of the Mouse; Maronpot, R.R., Boorman, G.A., Gaul, B.W., Eds.; Cache River Press: Vienna, IL, USA, 1999; pp. 119–183. [Google Scholar]
  76. Saber, A.T.; Mortensen, A.; Szarek, J.; Jacobsen, N.R.; Levin, M.; Koponen, I.K.; Jensen, K.A.; Vogel, U.; Wallin, H. Toxicity of pristine and paint-embedded TiO2 nanomaterials. Hum. Exp. Toxicol. 2019, 38, 11–24. [Google Scholar] [CrossRef] [PubMed]
  77. Bourdon, J.A.; Halappanavar, S.; Saber, A.T.; Jacobsen, N.R.; Williams, A.; Wallin, H.; Vogel, U.; Yauk, C.L. Hepatic and Pulmonary Toxicogenomic Profiles in Mice Intratracheally Instilled with Carbon Black Nanoparticles Reveal Pulmonary Inflammation, Acute Phase Response, and Alterations in Lipid Homeostasis. Toxicol. Sci. 2012, 127, 474–484. [Google Scholar] [CrossRef] [PubMed] [Green Version]
  78. Hirouchi, Y.; Iwata, H.; Yamakawa, S.; Kato, M.; Kobayashi, K.; Yamamoto, T.; Inoue, H.; Enomoto, M.; Shiga, A.; Koike, Y. Historical data of neoplastic and non-neoplastic lesions in B6C3F1(C57BL/6CrSlc*C3H/HeSlc) mice. J. Toxicol. Pathol. 1994, 7, 153–177. [Google Scholar] [CrossRef] [Green Version]
  79. Talamini, L.; Gimondi, S.; Violatto, M.B.; Fiordaliso, F.; Pedica, F.; Tran, N.L.; Sitia, G.; Aureli, F.; Raggi, A.; Nelissen, I.; et al. Repeated administration of the food additive E171 to mice results in accumulation in intestine and liver and promotes an inflammatory status. Nanotoxicology 2019, 13, 1087–1101. [Google Scholar] [CrossRef]
  80. Liu, Y.; Ji, J.; Ji, L.; Li, Y.; Zhang, B.; Yang, T.; Yang, J.; Lv, L.; Wu, G. Translocation of intranasal (i.n.) instillation of different-sized cerium dioxide (CeO2) particles: Potential adverse effects in mice. J. Toxicol. Environ. Health Part A 2019, 82, 1069–1075. [Google Scholar] [CrossRef] [PubMed]
  81. Chen, B.; Lum, J.T.-S.; Huang, Y.; Hu, B.; Leung, K.S.-Y. Integration of sub-organ quantitative imaging LA-ICP-MS and fractionation reveals differences in translocation and transformation of CeO2 and Ce3+ in mice. Anal. Chim. Acta 2019, 1082, 18–29. [Google Scholar] [CrossRef]
  82. Kermanizadeh, A.; Chauché, C.; Balharry, D.; Brown, D.M.; Kanase, N.; Boczkowski, J.; Lanone, S.; Stone, V. The role of Kupffer cells in the hepatic response to silver nanoparticles. Nanotoxicology 2013, 8, 149–154. [Google Scholar] [CrossRef] [PubMed]
  83. Park, J.-K.; Utsumi, T.; Seo, Y.-E.; Deng, Y.; Satoh, A.; Saltzman, W.M.; Iwakiri, Y. Cellular distribution of injected PLGA-nanoparticles in the liver. Nanomed. Nanotechnol. Biol. Med. 2016, 12, 1365–1374. [Google Scholar] [CrossRef] [Green Version]
  84. Kreyling, W.G.; Holzwarth, U.; Schleh, C.; Kozempel, J.; Wenk, A.; Haberl, N.; Hirn, S.; Schäffler, M.; Lipka, J.; Semmler-Behnke, M.; et al. Quantitative biokinetics of titanium dioxide nanoparticles after oral application in rats: Part 2. Nanotoxicology 2017, 11, 443–453. [Google Scholar] [CrossRef] [PubMed]
  85. Wang, M.-J.; Chen, F.; Lau, J.T.Y.; Hu, Y.-P. Hepatocyte polyploidization and its association with pathophysiological processes. Cell Death Dis. 2017, 8, e2805. [Google Scholar] [CrossRef] [PubMed]
Figure 1. Liver tissue 1 and 180 days after intravenous (IV) or intratracheal (IT) exposure to vehicle control (AC), TiO2 (DF) and CeO2 (GI) nanoparticles. Enhanced darkfield microscopy. (D,G): Agglomerates of foreign material (white) were distributed across liver sections 1 day after intravenous exposure and often appeared phagocytized by Kupffer cells (inserts in (D,G)). (E,H): 180 days after intravenous exposure, material was accumulated in fewer and larger agglomerates. (F,I): Agglomerates seen 180 days after intratracheal instillation were small and much less frequent (arrowheads). Scale bars in A and in the insert in D apply to all images.
Applnano 02 00016 g001
Figure 2. Microscopic changes in the liver of mice 1, 28 or 180 days after single intravenous injection of a vehicle (AC), TiO2 (DF), CeO2 (GI) or carbon black (CB) (JL) nanoparticles. Focal infiltration of inflammatory cells (long arrows); necrotic hepatocytes with distinct eosinophilic cytoplasm (arrowheads); binucleate hepatocytes (BH); cytoplasmic vacuolation (white spaces in hepatocytes); prominent nuclei of Kupffer cells (tiny arrows); sinusoidal dilatations (SD); area of necrosis (asterisk); hyperplasia of Kupffer cells (thick arrow); apoptotic body (AB); pyknosis of nuclei of hepatocytes (P); black foreign material (FM). HE stain, scale bar in A applies to all images.
Applnano 02 00016 g002
Figure 3. Microscopic changes in the liver of mice 28 (A,C,E,G) or 180 days (B,D,F,H) after single intratracheal instillation (IT) of a vehicle (A,B), TiO2 (C,D), CeO2 (E,F) or carbon black (CB) (G,H) nanoparticles. Prominent nuclei of Kupffer cells (tiny arrows); binucleate hepatocytes (BH); focal infiltration of inflammatory cells (double arrows); necrotic hepatocytes with distinct eosinophilic cytoplasm (arrowheads); pyknosis of nuclei of hepatocytes (P); cytoplasmic vacuolation (white spaces in hepatocytes); area of necrosis (asterisk); hyperplasia of Kupffer cells (thick arrows). HE stain, scale bar in A applies to all images.
Applnano 02 00016 g003
Table 1. Selected physicochemical parameters of the tested nanomaterials.
Tested NanomaterialSourcePrimary Particle SizeSpecific Surface AreaParticle Density
TiO2 (rutile)NanoAmor [44]10.5 nm [44]139.1 m2/g [44]4.23 g/cm3 [47]
CeO2Degussa/Quimidroga [48]13.0 ± 12.1 nm [48]56.7 m2/g [48]7.29 g/cm3 [48]
Carbon blackEvonik-Degussa14 nm [45]295 m2/g [49]2.1 g/cm3 [49]
Table 2. Initial and final body weights, feed intake, absolute and relative liver weights and titanium or cerium content of mice liver.
1 Day28 Days180 Days
ControlTiO2CeO2CBControlTiO2CeO2CBControlTiO2CeO2CB
Intratracheal instillation
Initial body weight (g)18.63 ± 1.6617.44 ± 1.7419.02 ± 0.9117.86 ± 1.4418.30 ± 0.918.20 ± 1.4018.50 ± 0.9018.00 ± 1.0018.60 ± 0.5218.00 ± 1.0318.30 ± 0.9418.00 ± 0.98
Final body weight (g)17.79 ± 1.3516.61 ± 1.7317.84 ± 0.6917.67 ± 1.3521.18 ± 0.8921.52 ± 1.2421.54 ± 0.7421.10 ± 1.2724.70 ± 0.8524.90 ± 0.9925.40 ± 1.9325.05 ± 1.50
Feed intake (g/kg bw/day) A----181.8 ± 21.6187.8 ± 19.8185.9 ± 3.8196.5 ± 23.4168.5 ± 13.3171.3 ± 7.6161.8 ± 10.0187.1 ± 40.7
Absolute liver weight (g)0.9 ± 0.090.77 ± 0.090.89 ± 0.040.84 ± 0.081.04 ± 0.041.05 ± 0.121.10 ± 0.061.06 ± 0.071.15 ± 0.071.21 ± 0.121.20 ± 0.171.21 ± 0.15
Relative liver weight (g/100 g)4.79 ± 0.274.66 ± 0.334.99 ± 0.214.78 ± 0.394.90 ± 0.164.88 ± 0.495.10 ± 0.205.05 ± 0.174.67 ± 0.214.85 ± 0.304.69 ± 0.364.80 ± 0.37
Ti content in liver (µg/g) B0.41 ± 0.200.25 ± 0.15n.a.n.a.0.30 ± 0.060.54 ± 0.31n.a.n.a.0.18 ± 0.111.57 ± 1.38n.a.n.a.
Ce content in liver (µg/g) B0.02 ±0.01n.a.0.03 ± 0.02n.a.0.02 ± 0.02n.a.0.82 ± 0.71n.a.0.00 ±0.00n.a.2.03 ± 2.63n.a.
Intravenous injection
Initial body weight (g)19.14 ± 0.8118.72 ± 0.6519.56 ± 0.9619.42 ± 0.8118.20 ± 1.318.20 ± 1.218.20 ± 1.018.80 ± 1.118.56 ± 0.9518.30 ± 1.3317.18 ± 1.1018.30 ± 1.42
Final body weight (g)18.08 ± 0.7918.03 ± 0.6918.49 ± 0.7518.10 ± 0.7521.29 ± 1.3221.31 ± 0.8720.74 ± 1.4021.39 ± 1.2225.40 ± 1.7124.10 ± 1.1425.70 ± 2.2526.00 ± 1.41
Feed intake (g/kg bw/day) A----182.1 ± 3.9181.8 ± 9.2192.4 ± 17.4173.5 ± 6.9180.2 ± 4.9201.1 ± 21.4183.4 ± 8.4186.0 ± 19.3
Absolute liver weight (g)0.90 ± 0.070.86 ± 0.070.94 ± 0.100.88 ± 0.091.00 ± 0.071.06 ± 0.071.01 ± 0.111.05 ± 0.081.22 ± 0.161.17 ± 0.101.18 ± 0.161.20 ± 0.19
Relative liver weight (g/100 g)4.91 ± 0.444.76 ± 0.285.08 ± 0.384.83 ± 0.344.71 ± 0.084.96 ± 0.224.88 ± 0.334.89 ± 0.194.80 ± 0.384.82 ± 0.264.56 ± 0.334.62 ± 0.67
Ti content in liver (µg/g) B0.42 ± 0.1440.4 ± 33.0n.a.n.a.0.49 ± 0.1533.1 ± 27.1n.a.n.a.0.40 ± 0.1922.2 ± 22.3n.a.n.a.
Ce content in liver (µg/g) B0.03 ± 0.03n.a.40.0 ± 47.8n.a.0.01 ±0.01n.a.36.9 ± 53.0n.a.0.02 ±0.03n.a.48.0 ±37.5n.a.
N = 9/group, except for 8 in the intravenous control group after 28 days and in the intratracheal carbon black (CB) and intravenous TiO2 groups after 180 days. All values are mean ± SD. Bodyweight, feed intake, liver absolute and relative weights in the exposed groups were not statistically significantly different from the controls (p > 0.05, analysis of variance (ANOVA)) A Feed intake was not recorded during 24 h after exposures, as the mice were anesthetized prior to dosing by intratracheal or intravenous routes, and this procedure is known to affect feed intake. B Titanium (Ti) and cerium (Ce) content in the liver measured by ICP-MS was previously published [42]. ICP-MS is not appropriate for quantification of carbon in liver tissue due to a high endogenous content of carbon. Brightfield microscopy provided visual evidence on the internal exposure of carbon black in the liver. n.a.: not analyzed.
Table 3. Activity of transaminases and alkaline phosphatase (mean ± SD) in plasma of mice 28 days after a single exposure to 162 µg of TiO2, CeO2 and carbon black nanoparticles administered by intratracheal instillation or intravenous injection.
EnzymeIntratracheal InstillationIntravenous Injection
(U/L)ControlTiO2CeO2CBControlTiO2CeO2CB
ALP119 ± 17138 ± 16113 ± 13133 ± 19125 ± 17121 ± 13119 ± 13128 ± 14
AST185 ± 141132 ± 78293 ± 179213 ± 119151 ± 8591 ± 20136 ± 25120 ± 56
ALT35 ± 838 ± 341 ± 947 ± 1339 ± 534 ± 739 ± 838 ± 8
ALP: alkaline phosphatase, AST: aspartate transaminase, ALT: alanine transaminase, CB: carbon black. Activities of transaminases and ALP in the exposed groups were not statistically significantly different from the controls (p > 0.05, analysis of variance (ANOVA)). The number of animals per group was 9, except in the intravenous control group where there were 8. Furthermore, one outlier was identified (for AST in the carbon black group exposed by intratracheal instillation) and removed from the data sets, as its value deviated by more than two standard deviations from the respective mean value.
Table 4. Microscopic liver changes—statistically significantly different from control groups—1, 28 or 180 days after a single exposure of mice to 162 µg of TiO2, CeO2 and carbon black (CB) nanoparticles administered by intratracheal instillation or intravenous injection.
Days Post-ExposureIntratracheal InstillationIntravenous Injection
ControlTiO2CeO2CBControlTiO2CeO2CB
Focal infiltration of inflammatory cells (small)
day 15/92/96/91/93/97/98/9 *6/9
(8)(2)(12)(1) #(6)(11)(12)(10)
day 289/99/98/94/9 *5/88/96/91/9 *
(25)(17) #(25)(11) #(13)(12)(15)(1) #
day 1806/95/95/92/85/93/86/93/9
(11)(9)(8)(2)(10)(9)(13)(3)
Focal infiltration of inflammatory cells (big)
day 13/94/93/93/96/92/96/91/9 *
(5)(5)(8)(3)(10)(2)(11)(3) #
day 284/94/93/96/94/87/93/96/9
(6)(5)(4)(13)(4)(11)(3)(15)
day 1806/93/96/92/84/94/84/95/9
(11)(6)(10)(2)(8)(10)(9)(9)
Hepatocytes with pyknotic nuclei (single)
day 10/90/90/91/91/90/91/90/9
day 280/91/95/9 *2/93/81/90/92/9
day 1801/90/90/91/81/93/85/92/9
Hepatocytes with pyknotic nuclei (area)
day 10/90/91/90/93/97/91/94/9
day 281/91/92/90/90/82/97/9 **2/9
day 1803/98/9 *8/9 *3/80/92/81/95/9 *
Necrosis (area)
day 10/90/90/92/98/99/93/94/9
day 283/94/96/92/91/81/96/9 *4/9
day 1805/98/99/96/82/91/95/96/9
Prominent nuclei of Kupffer cells
day 10/90/90/90/93/99/9 **3/99/9 **
day 282/90/90/92/95/84/94/97/9
day 1801/90/91/91/80/91/80/92/9
Apparent increase in binucleate hepatocytes
day 10/96/9 **1/91/90/95/9 *3/95/9*
day 280/94/92/94/91/82/90/90/9
day 1800/92/90/90/80/90/80/92/9
Cytoplasmic vacuolation (hydropic degeneration) in hepatocytes
day 10/90/90/90/90/90/92/90/9
day 282/94/98/9 *0/96/84/96/95/9
day 1802/97/93/96/85/90/84/96/9
Changes are expressed by their incidence: the number of animals with a given change of the total number of animals examined in the group, * denotes p <0.05, ** denotes p < 0.01, Fisher’s exact probability test. Values in parentheses refer to total number of inflammatory cell infiltrations per group, #: p < 0.05, Mann–Whitney U-test. N = 9/group, except for 8 in the intravenous control group after 28 days, and in the intratracheal carbon black and intravenous TiO2 groups after 180 days.
Publisher’s Note: MDPI stays neutral with regard to jurisdictional claims in published maps and institutional affiliations.

