
Methanogenic Archaea Quantification in the Human Gut Microbiome with F420 Autofluorescence-Based Flow Cytometry
 , and
, and 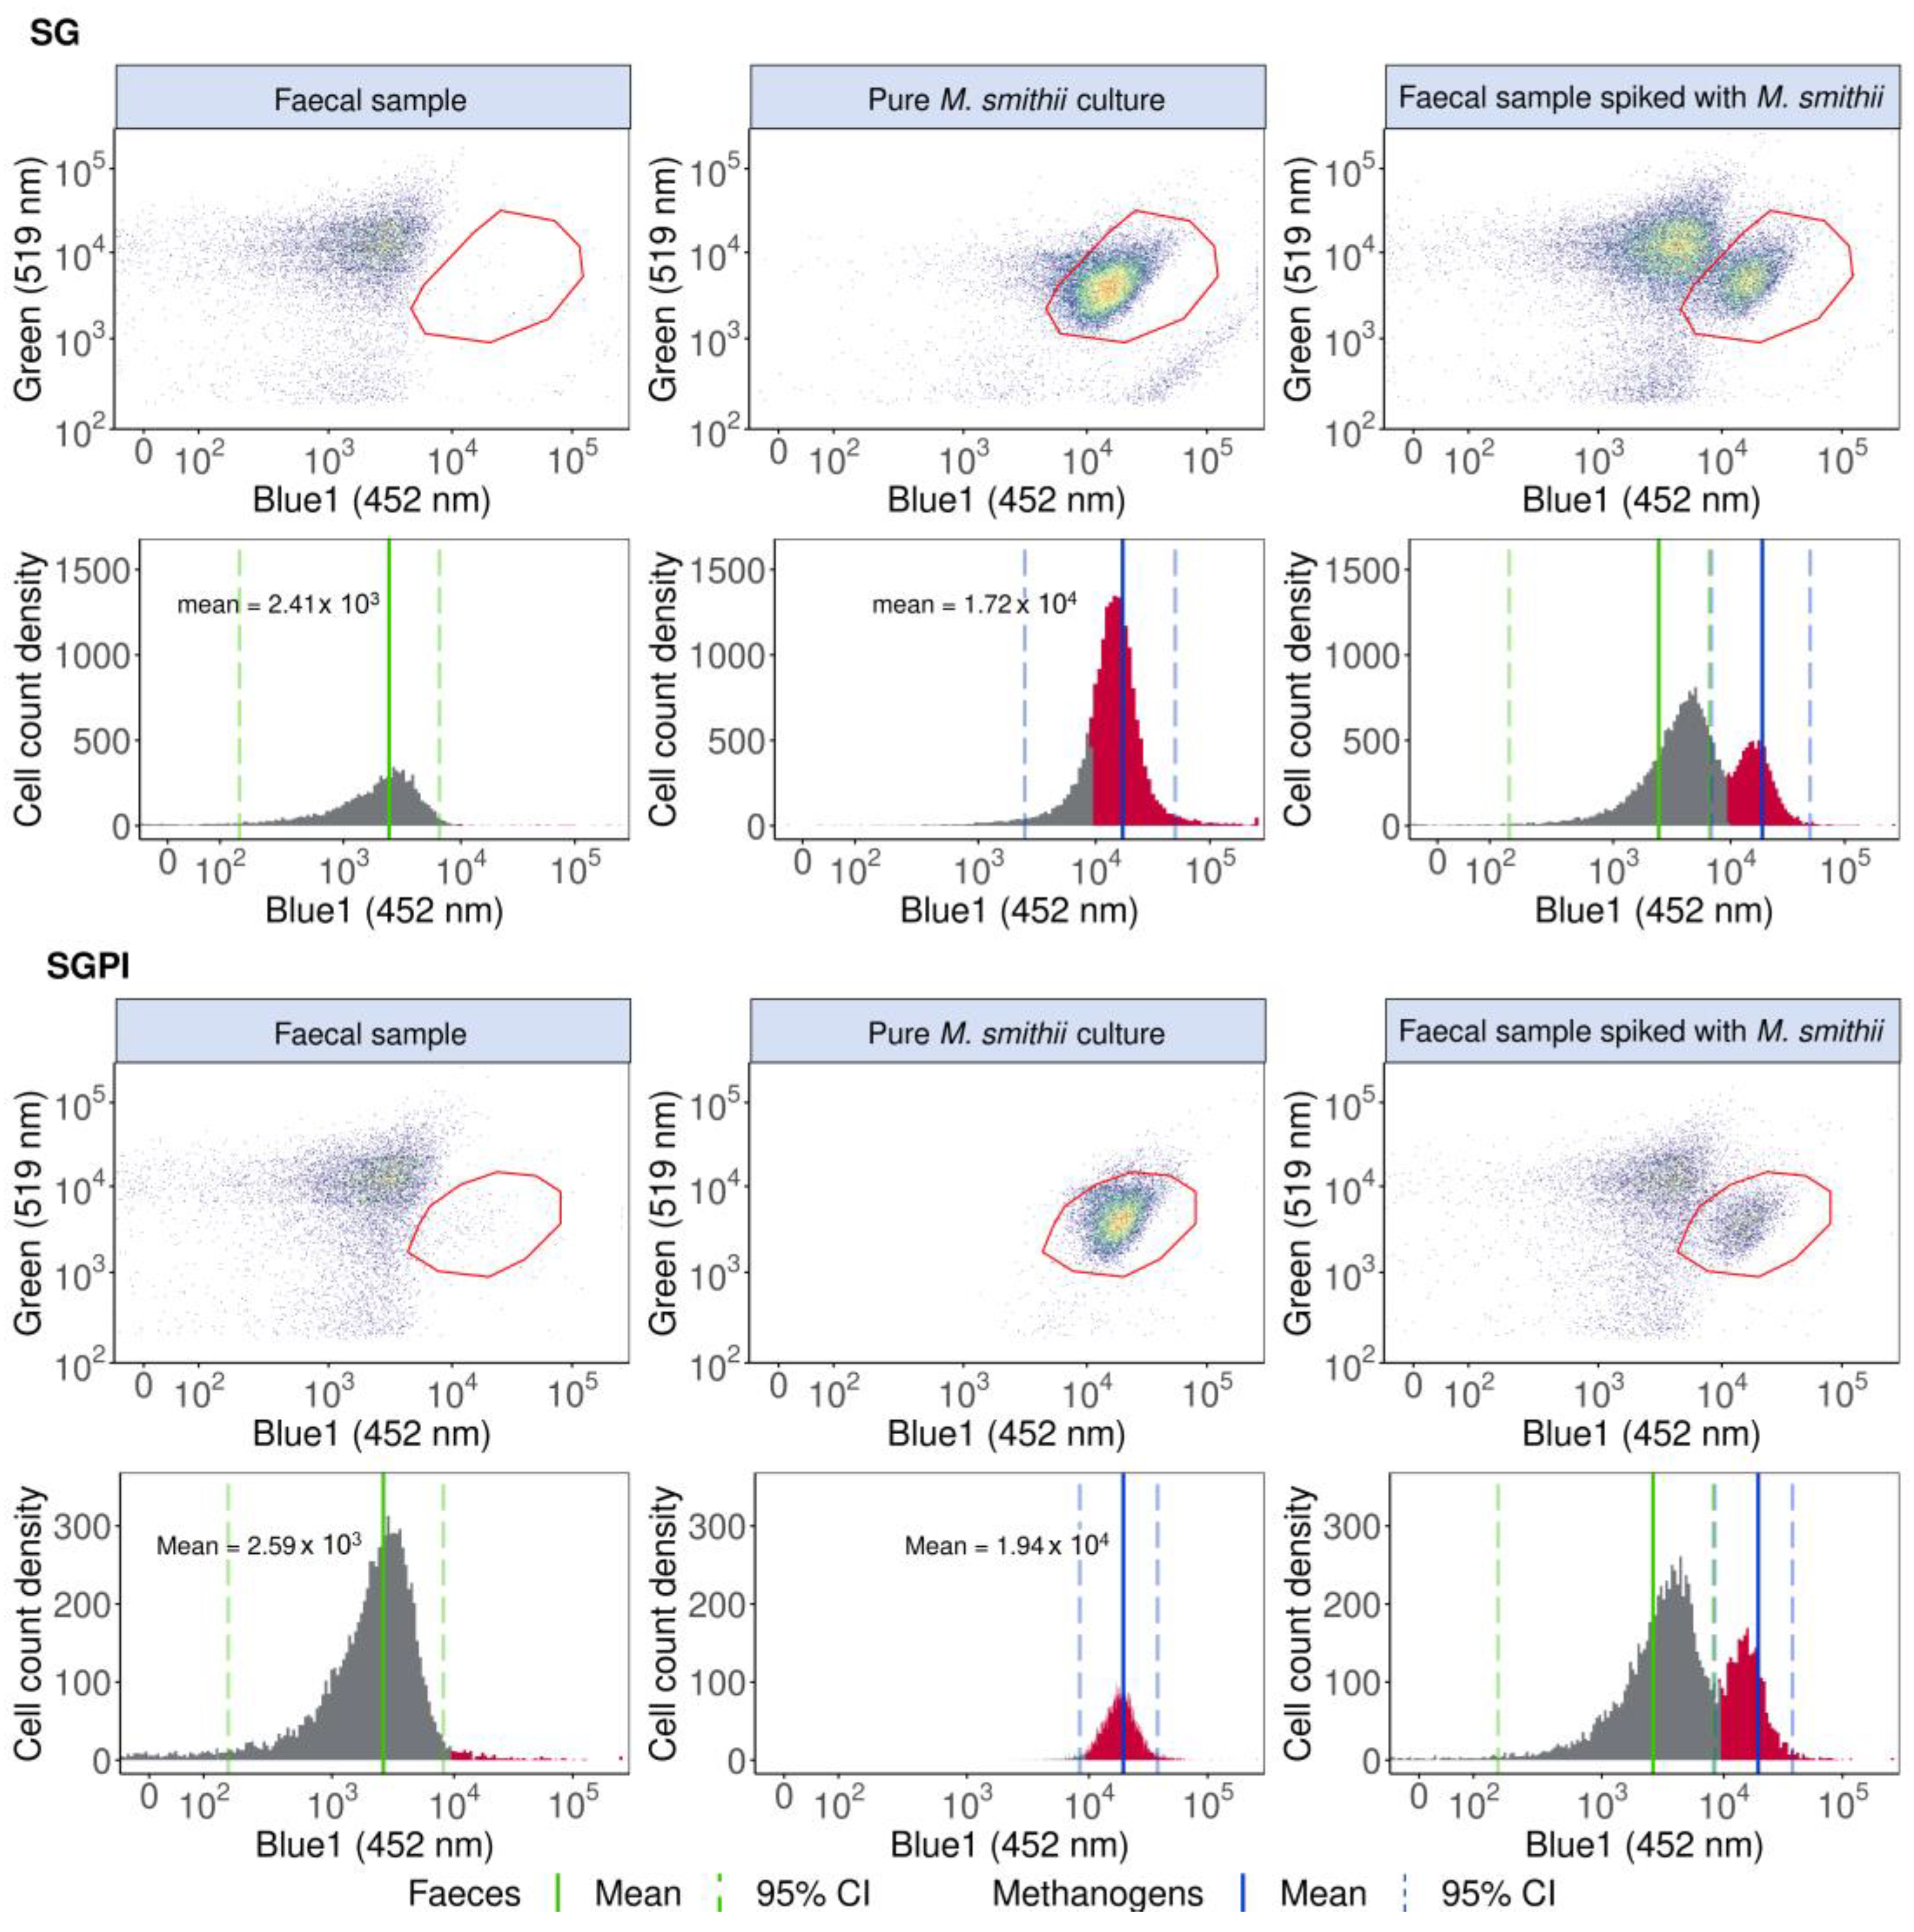
Abstract
:1. Introduction
2. Materials and Methods
2.1. Validating Flow Cytometry to Identify Methanogenic Archaea in the Human Gut Microbiome Based on F420 Autofluorescence with a Methanobrevibacter Smithii Type Strain
2.1.1. Methanobrevibacter smithii Cultivation and Quantification
2.1.2. Preparation of Faecal Slurries
2.1.3. Flow Cytometry F420 Autofluorescence-Based Detection and Quantification of the Methanogenic Archaea M. smithii in a Spiked Faecal Sample
2.2. Benchmarking Flow Cytometry to Quantify Endogenous Methanogenic Archaea Based on F420 Autofluorescence against 16S rRNA Gene Amplicon Sequencing
2.2.1. Applying Flow Cytometry to Quantify Endogenous Methanogenic Archaea in Faecal Samples of 10 Individuals Based on F420 Autofluorescence
2.2.2. Applying Universal and Archaeal-Specific 16S rRNA Gene Amplicon Sequencing to Detect Endogenous Methanogenic Archaea in Faecal Samples of 10 Individuals
2.3. Benchmarking Flow Cytometry to Quantify Methanogenic Archaea in In Vitro Reactor Samples Based on F420 Autofluorescence against Methane Production Measurements and 16S rRNA Gene Amplicon Sequencing
2.3.1. Applying Flow Cytometry to Quantify Endogenous Methanogenic Archaea in SHIME Samples of 5 Individuals Based on F420 Autofluorescence
2.3.2. Applying Universal 16S rRNA Gene Amplicon Sequencing to Quantify Endogenous Methanogenic Archaea in SHIME Samples of 5 Individuals
2.3.3. Measuring Methane in SHIME Headspace Samples of 5 Individuals
2.4. Bioinformatics and Statistical Analysis
2.5. Ethical Approval
3. Results
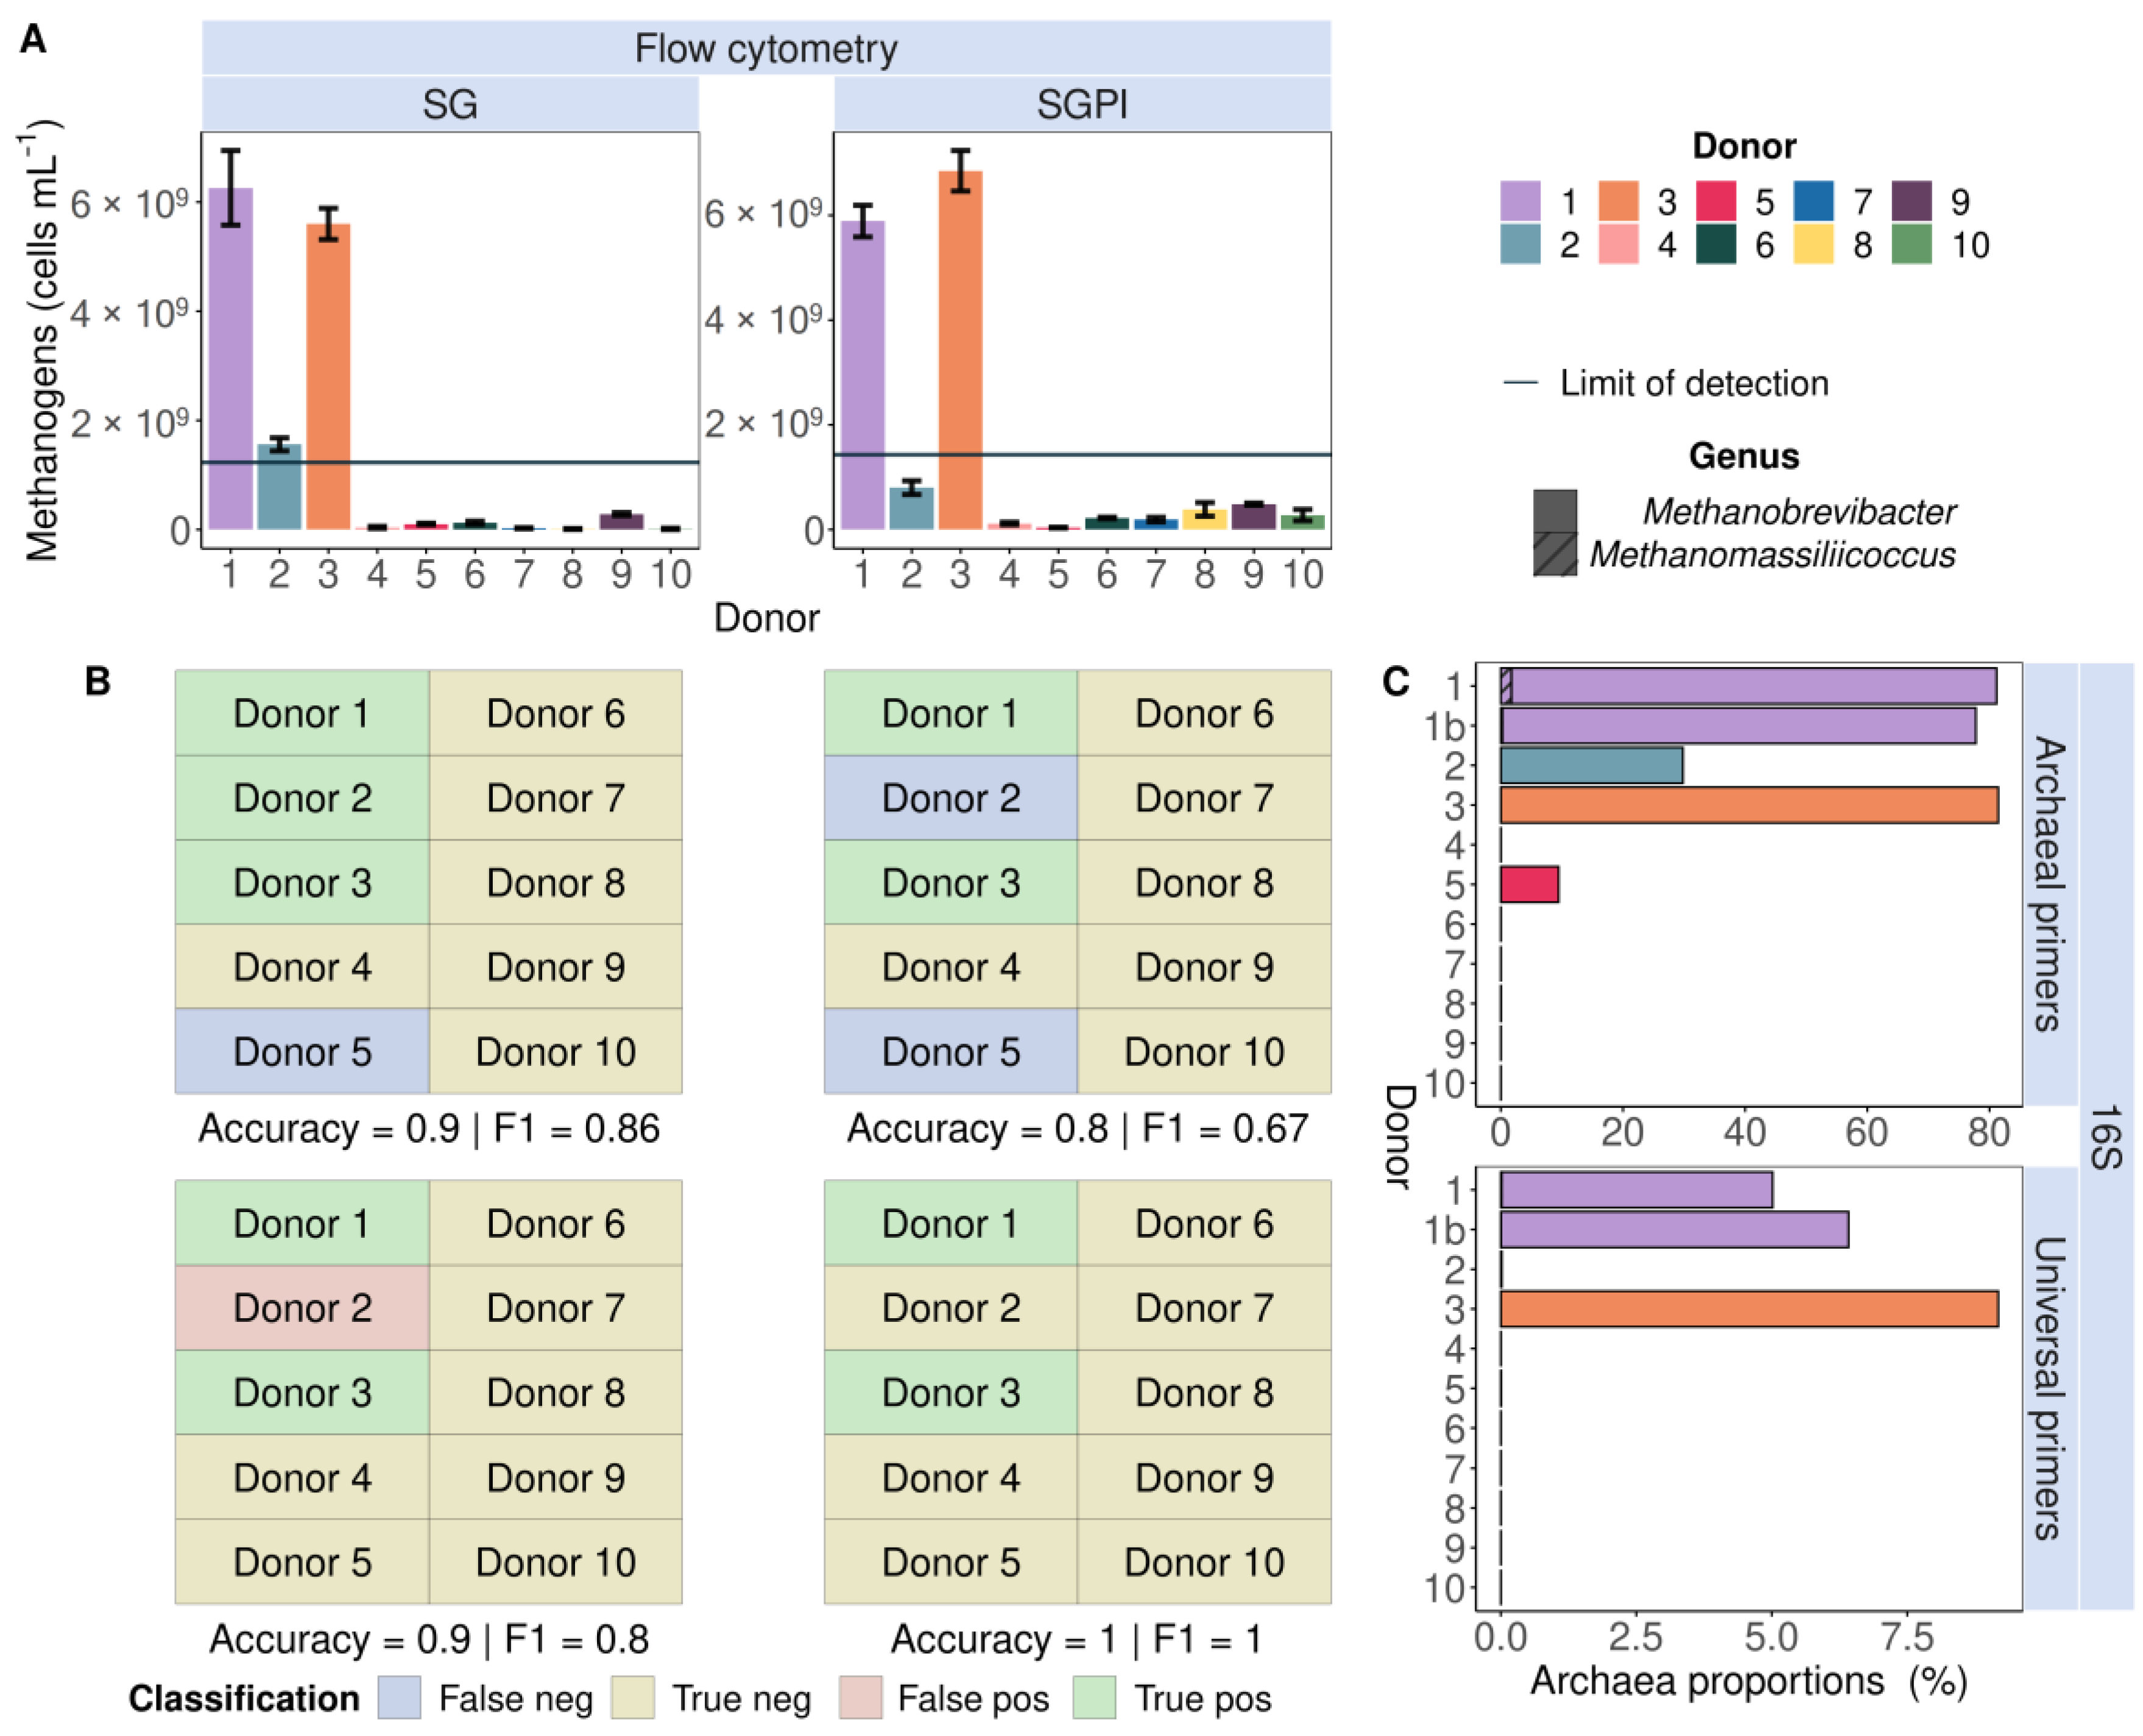
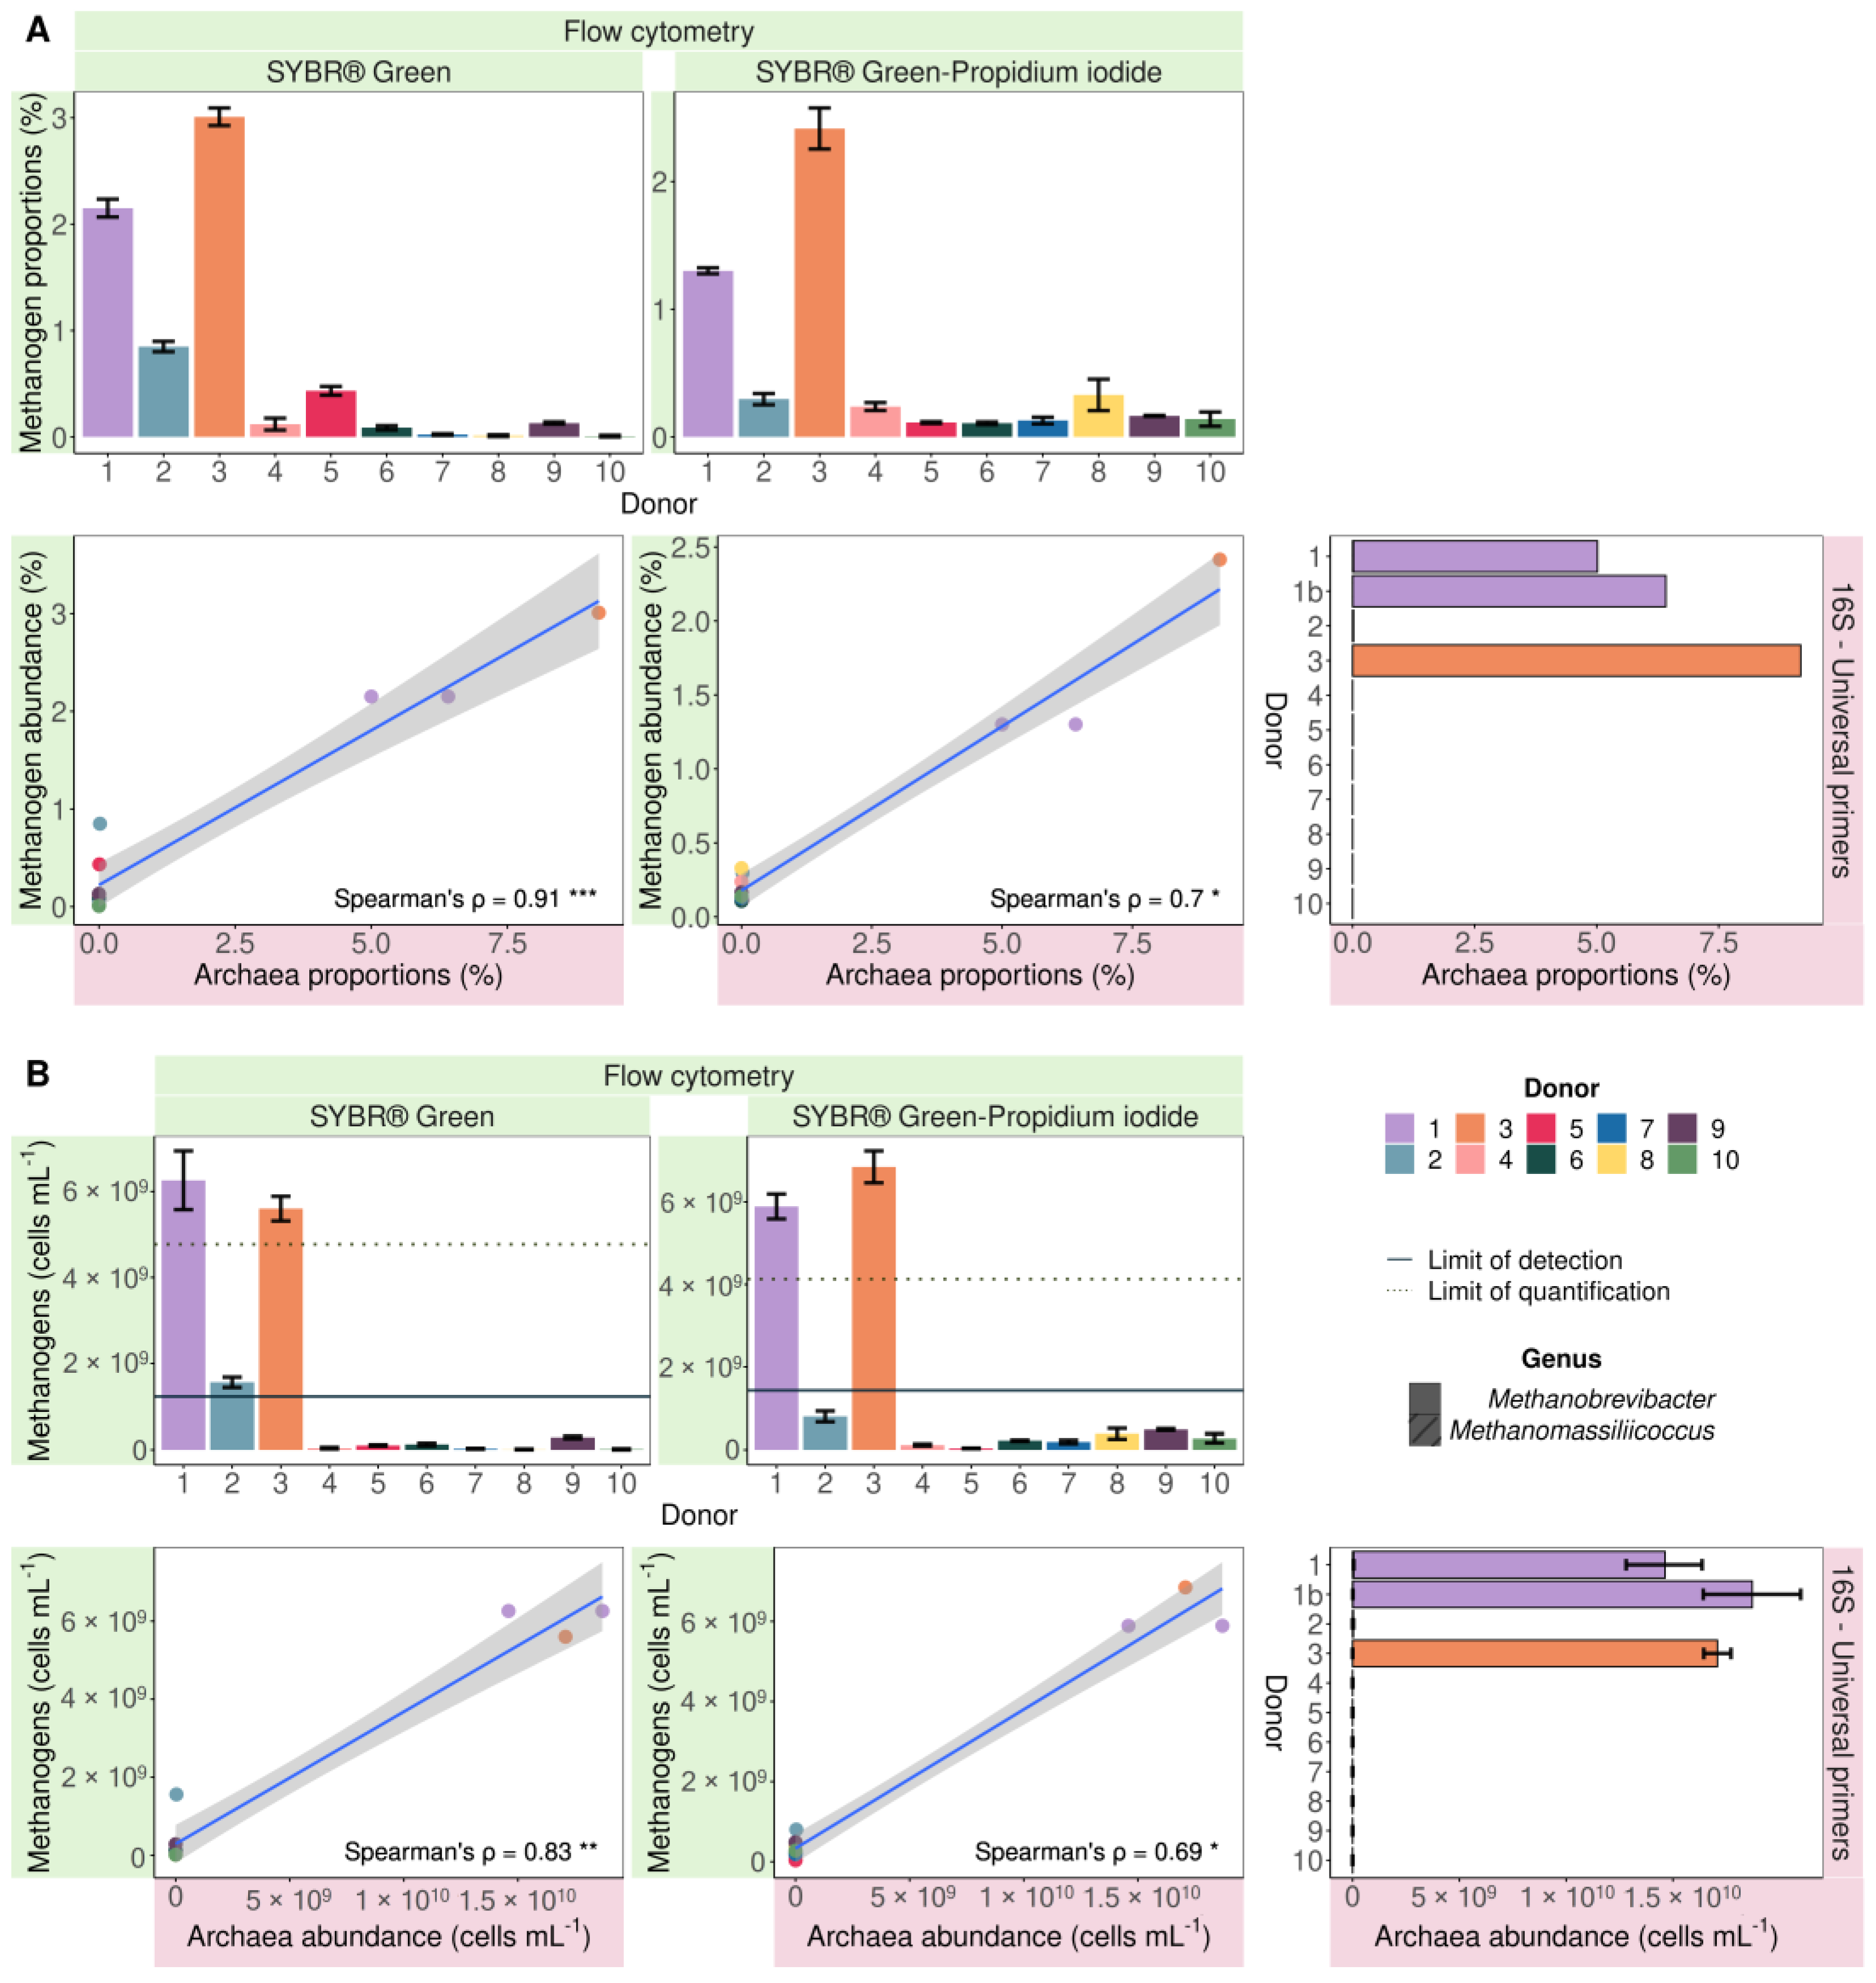
3.1. Detection and Quantification of Endogenous Methanogens Is Consistent between Flow Cytometry and 16S rRNA Gene Amplicon Sequencing in Faecal Samples and In Vitro Incubated Faecal Samples
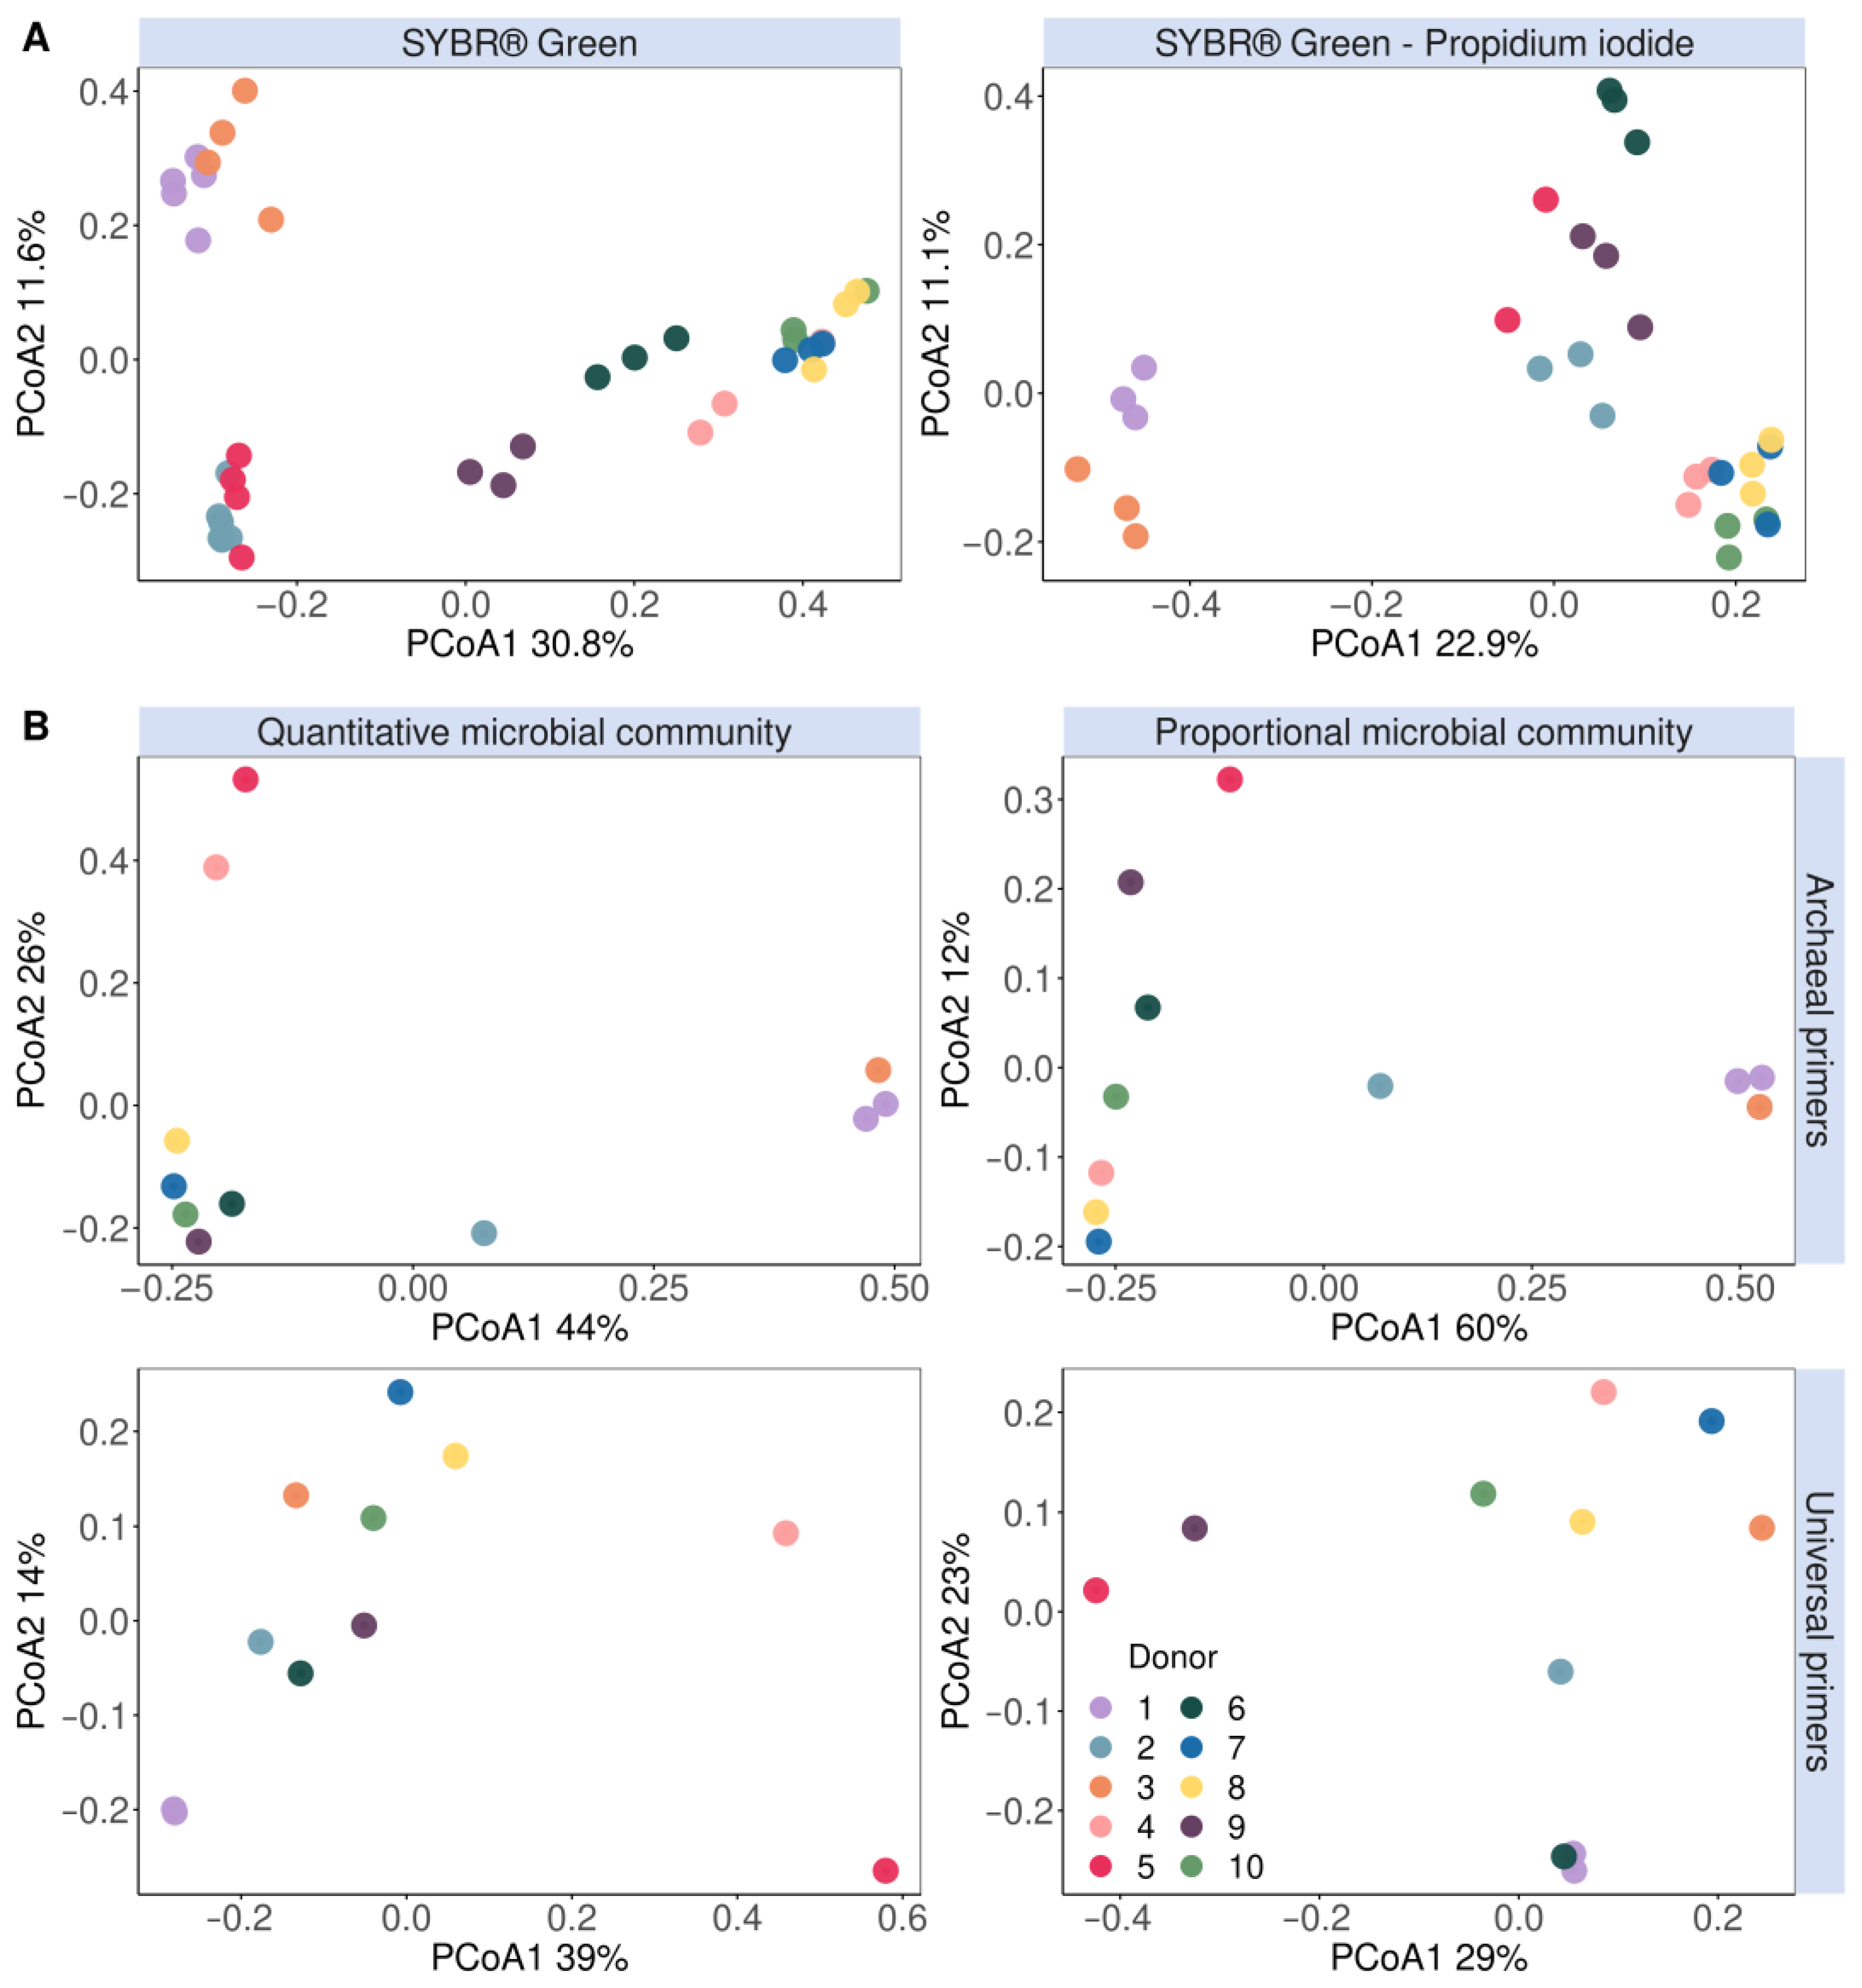
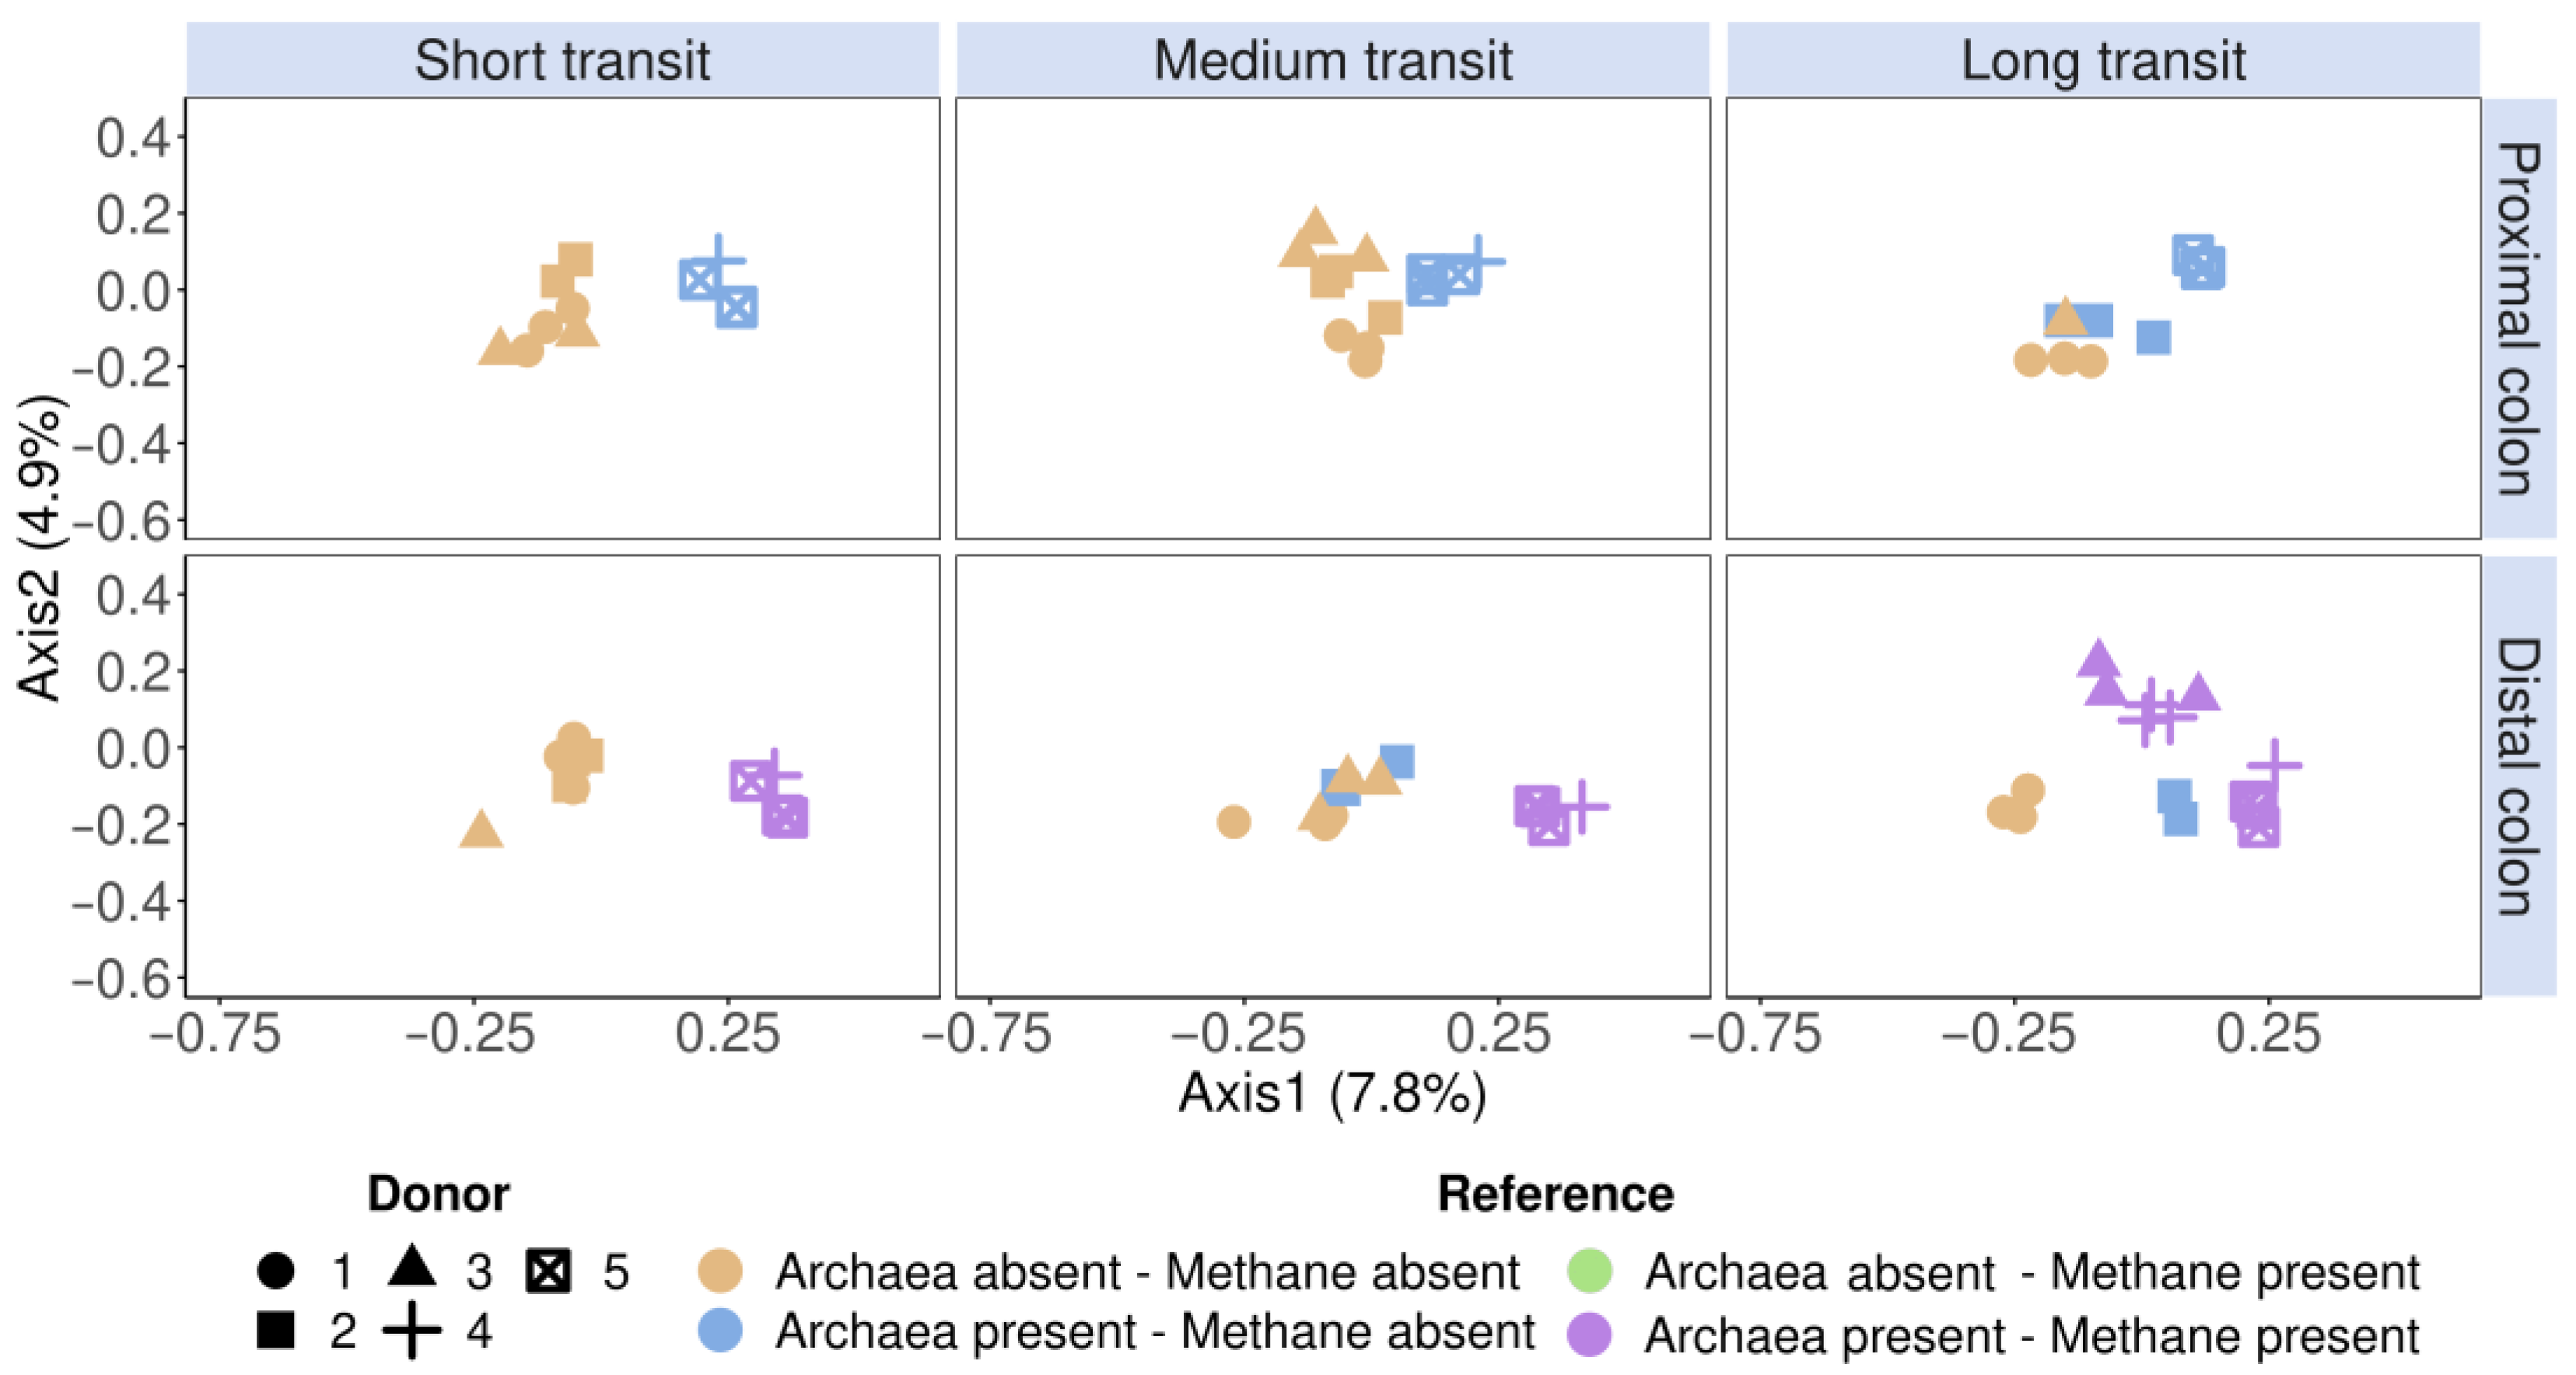
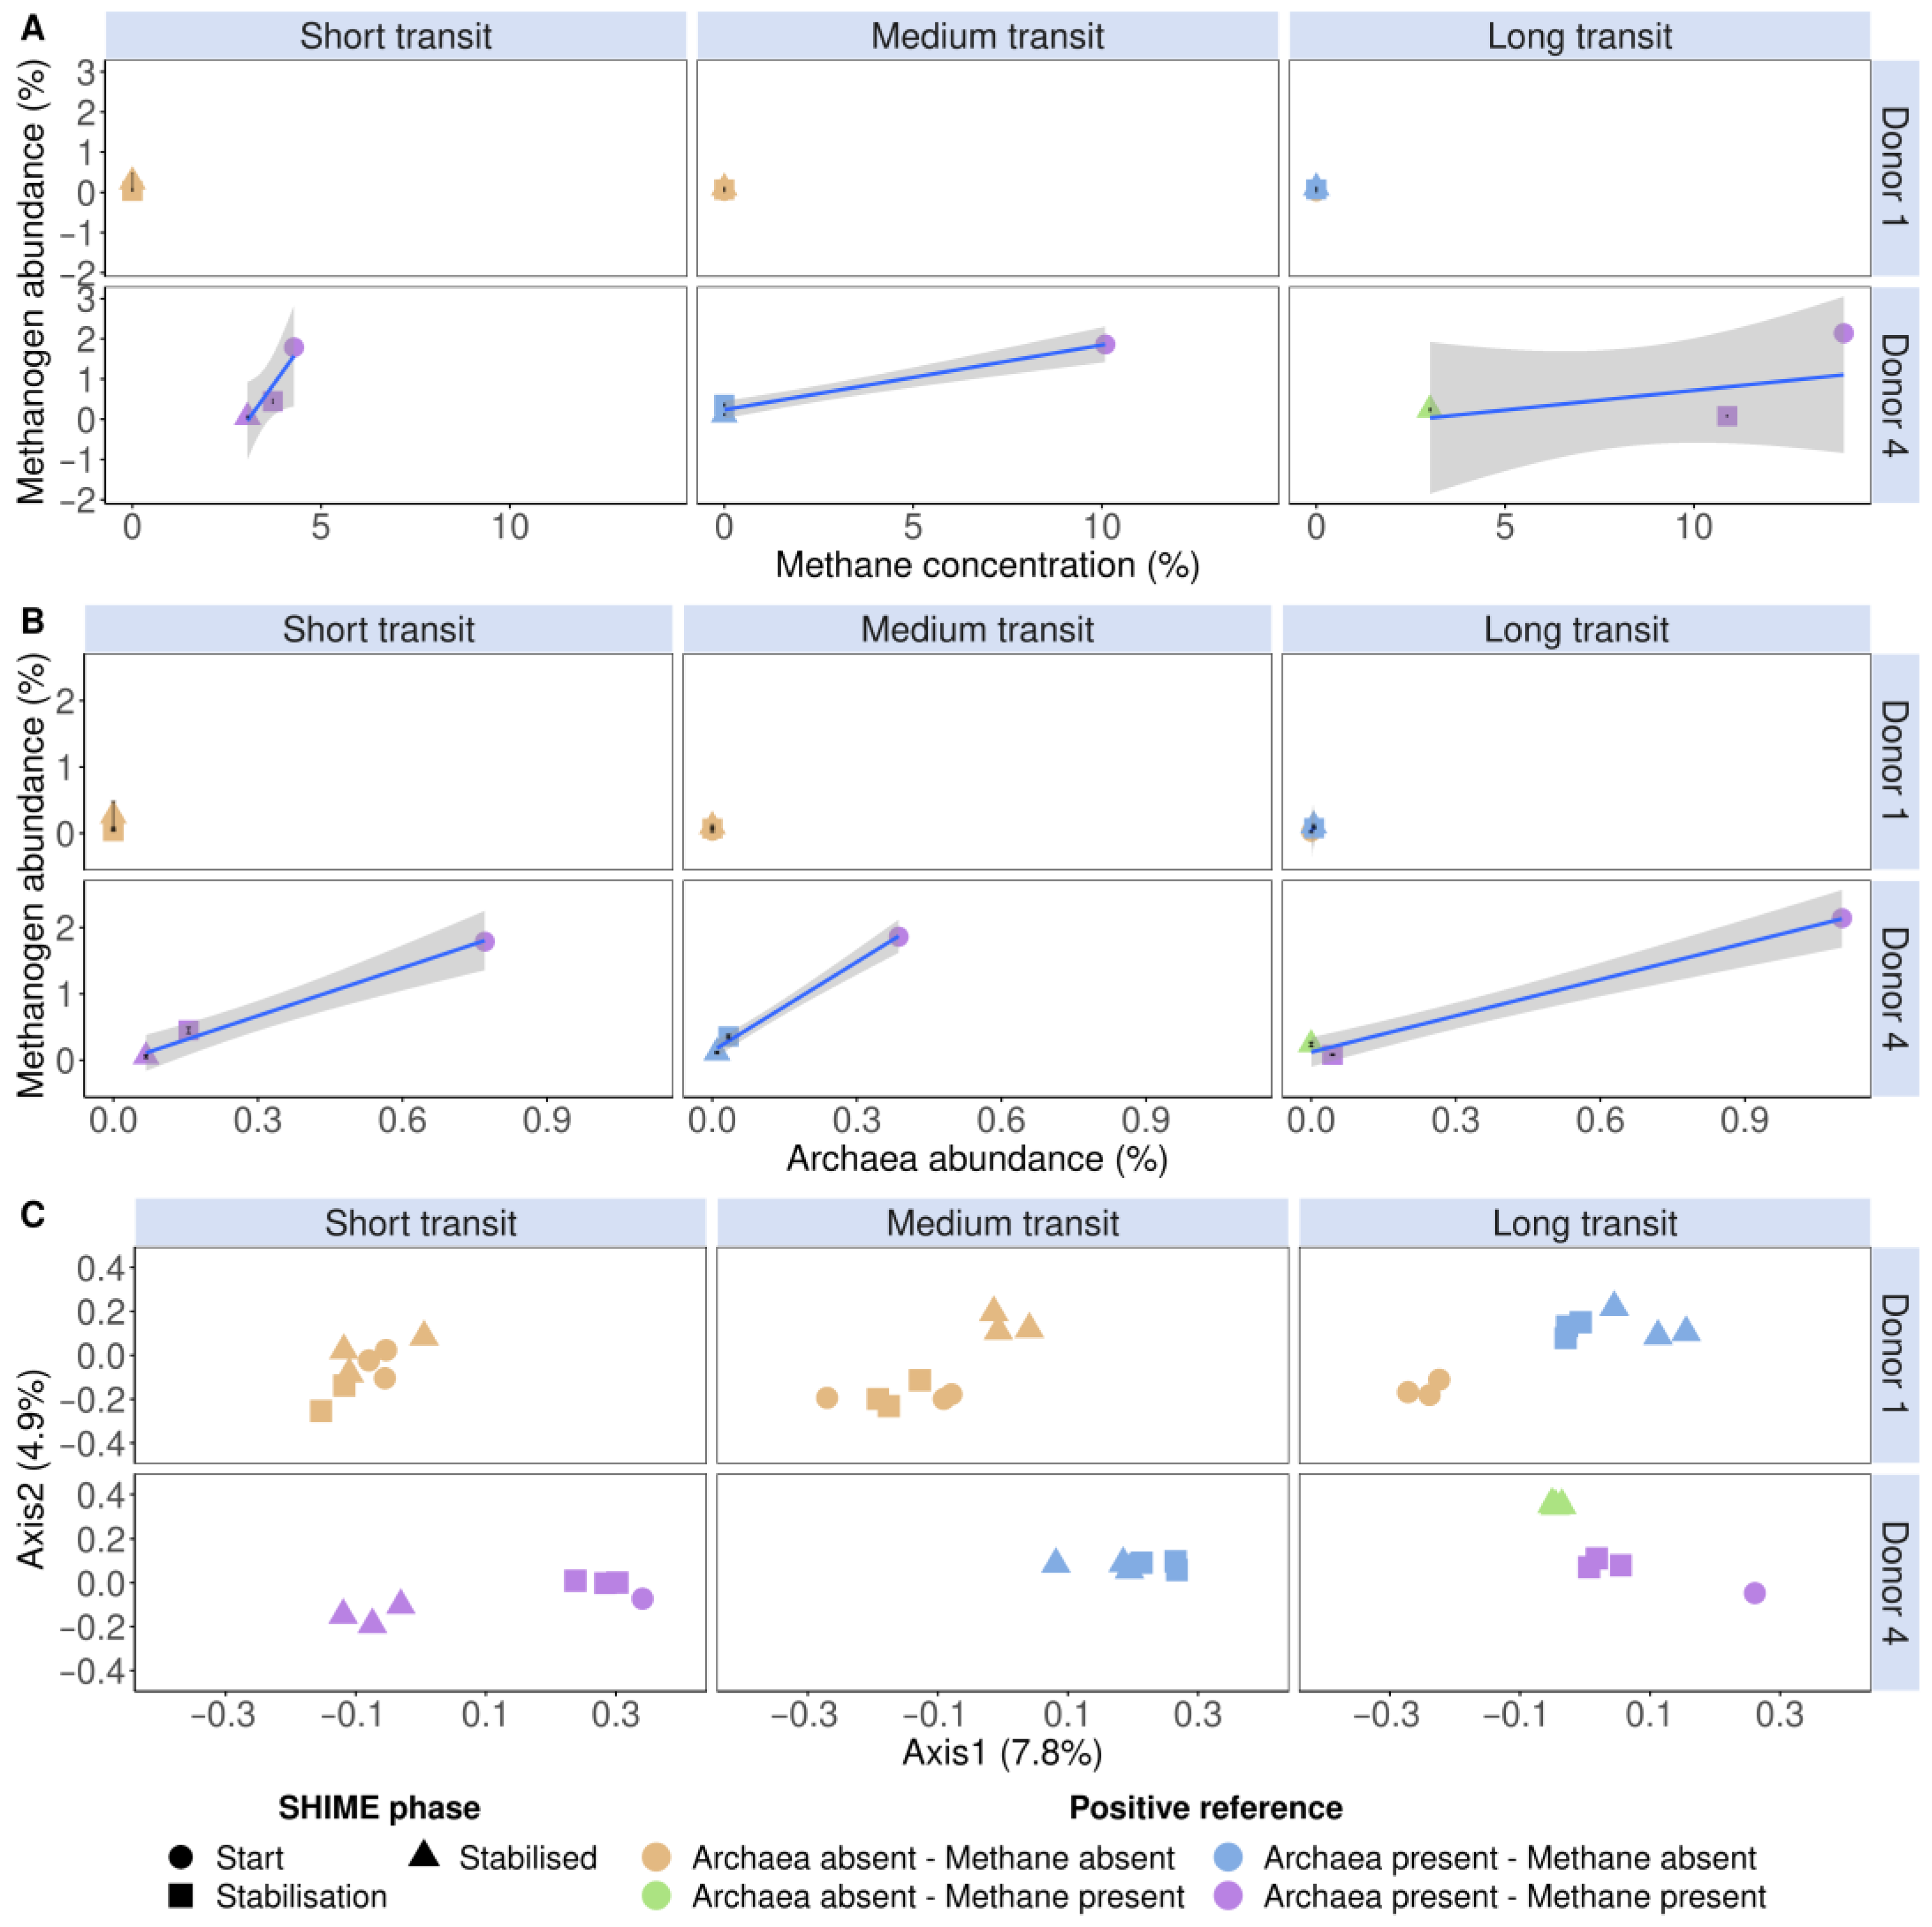
3.2. Methanogens Clustered according to In Vitro Methane Production and Methanogenic Archaea Presence in In Vitro Incubated Faecal Samples
4. Discussion
5. Conclusions
Supplementary Materials
Author Contributions
Funding
Institutional Review Board Statement
Informed Consent Statement
Data Availability Statement
Acknowledgments
Conflicts of Interest
References
- Ver Eecke, H.C.; Butterfield, D.A.; Huber, J.A.; Lilley, M.D.; Olson, E.J.; Roe, K.K.; Evans, L.J.; Merkel, A.Y.; Cantin, H.V.; Holden, J.F. Hydrogen-limited growth of hyperthermophilic methanogens at deep-sea hydrothermal vents. Proc. Natl. Acad. Sci. USA 2012, 109, 13674–13679. [Google Scholar] [CrossRef] [PubMed]
- Gaci, N.; Borrel, G.; Tottey, W.; O’Toole, P.W.; Brugère, J.-F. Archaea and the human gut: New beginning of an old story. World J. Gastroenterol. WJG 2014, 20, 16062. [Google Scholar] [CrossRef] [PubMed]
- Angle, J.C.; Morin, T.H.; Solden, L.M.; Narrowe, A.B.; Smith, G.J.; Borton, M.A.; Rey-Sanchez, C.; Daly, R.A.; Mirfenderesgi, G.; Hoyt, D.W.; et al. Methanogenesis in oxygenated soils is a substantial fraction of wetland methane emissions. Nat. Commun. 2017, 8, 1567. [Google Scholar] [CrossRef] [PubMed]
- Kumpitsch, C.; Fischmeister, F.P.S.; Mahnert, A.; Lackner, S.; Wilding, M.; Sturm, C.; Springer, A.; Madl, T.; Holasek, S.; Högenauer, C.; et al. Reduced B12 uptake and increased gastrointestinal formate are associated with archaeome-mediated breath methane emission in humans. Microbiome 2021, 9, 193. [Google Scholar] [CrossRef] [PubMed]
- Dridi, B.; Henry, M.; El Khéchine, A.; Raoult, D.; Drancourt, M. High prevalence of Methanobrevibacter smithii and Methanosphaera stadtmanae detected in the human gut using an improved DNA detection protocol. PLoS ONE 2009, 4, e7063. [Google Scholar] [CrossRef] [PubMed]
- Hoffmann, C.; Dollive, S.; Grunberg, S.; Chen, J.; Li, H.; Wu, G.D.; Lewis, J.D.; Bushman, F.D. Archaea and Fungi of the Human Gut Microbiome: Correlations with Diet and Bacterial Residents. PLoS ONE 2013, 8, e66019. [Google Scholar] [CrossRef] [PubMed]
- Chibani, C.M.; Mahnert, A.; Borrel, G.; Almeida, A.; Werner, A.; Brugère, J.-F.; Gribaldo, S.; Finn, R.D.; Schmitz, R.A. A catalogue of 1167 genomes from the human gut archaeome. Nat. Microbiol. 2021, 7, 48–61. [Google Scholar] [CrossRef] [PubMed]
- Hoegenauer, C.; Hammer, H.F.; Mahnert, A.; Moissl-Eichinger, C. Methanogenic archaea in the human gastrointestinal tract. Nat. Rev. Gastroenterol. Hepatol. 2022, 19, 805–813. [Google Scholar] [CrossRef]
- Vanderhaeghen, S.; Lacroix, C.; Schwab, C. Methanogen communities in stools of humans of different age and health status and co-occurrence with bacteria. FEMS Microbiol. Lett. 2015, 362, 92. [Google Scholar] [CrossRef]
- Borrel, G.; McCann, A.; Deane, J.; Neto, M.C.; Lynch, D.B.; Brugère, J.F.; O’Toole, P.W. Genomics and metagenomics of trimethylamine-utilizing Archaea in the human gut microbiome. ISME J. 2017, 11, 2059–2074. [Google Scholar] [CrossRef]
- Basseri, R.J.; Basseri, B.; Pimentel, M.; Chong, K.; Youdim, A.; Low, K.; Hwang, L.; Soffer, E.; Chang, C.; Mathur, R. Intestinal Methane Production in Obese Individuals Is Associated with a Higher Body Mass Index. Gastroenterol. Hepatol. 2012, 8, 22–28. [Google Scholar]
- Ghavami, S.B.; Rostami, E.; Sephay, A.A.; Shahrokh, S.; Balaii, H.; Aghdaei, H.A.; Zali, M.R. Alterations of the human gut Methanobrevibacter smithii as a biomarker for inflammatory bowel diseases. Microb. Pathog. 2018, 117, 285–289. [Google Scholar] [CrossRef]
- Coker, O.O.; Wu, W.K.K.; Wong, S.H.; Sung, J.J.; Yu, J. Altered Gut Archaea Composition and Interaction With Bacteria Are Associated With Colorectal Cancer. Gastroenterology 2020, 159, 1459–1470.e5. [Google Scholar] [CrossRef] [PubMed]
- Smith, N.W.; Shorten, P.R.; Altermann, E.H.; Roy, N.C.; McNabb, W.C. Hydrogen cross-feeders of the human gastrointestinal tract. Gut Microbes 2019, 10, 270. [Google Scholar] [CrossRef] [PubMed]
- Bang, C.; Schmitz, R.A. Archaea: Forgotten players in the microbiome. Emerg. Top. Life Sci. 2018, 2, 459–468. [Google Scholar]
- Dridi, B.; Fardeau, M.-L.; Ollivier, B.; Raoult, D.; Drancourt, M. Methanomassiliicoccus luminyensis gen. nov., sp. nov., a methanogenic archaeon isolated from human faeces. Int. J. Syst. Evol. Microbiol. 2012, 62, 1902–1907. [Google Scholar] [CrossRef]
- Miller, T.L.; Wolin, M.J. Methanosphaera stadtmaniae gen. nov., sp. nov.: A species that forms methane by reducing methanol with hydrogen. Arch. Microbiol. 1985, 141, 116–122. [Google Scholar] [CrossRef]
- Karakashev, D.; Batstone, D.J.; Trably, E.; Angelidaki, I. Acetate oxidation is the dominant methanogenic pathway from acetate in the absence of Methanosaetaceae. Appl. Environ. Microbiol. 2006, 72, 5138–5141. [Google Scholar] [CrossRef] [PubMed]
- Chaudhary, P.P.; Conway, P.L.; Schlundt, J. Methanogens in humans: Potentially beneficial or harmful for health. Appl. Microbiol. Biotechnol. 2018, 102, 3095–3104. [Google Scholar] [CrossRef]
- Söllinger, A.; Urich, T. Methylotrophic methanogens everywhere—Physiology and ecology of novel players in global methane cycling. Biochem. Soc. Trans. 2019, 47, 1895–1907. [Google Scholar] [CrossRef]
- Dorokhov, Y.L.; Shindyapina, A.V.; Sheshukova, E.V.; Komarova, T.V. Metabolic methanol: Molecular pathways and physiological roles. Physiol. Rev. 2015, 95, 603–644. [Google Scholar] [CrossRef]
- Oliphant, K.; Allen-Vercoe, E. Macronutrient metabolism by the human gut microbiome: Major fermentation by-products and their impact on host health. Microbiome 2019, 7, 91. [Google Scholar] [CrossRef]
- Dridi, B. Laboratory tools for detection of archaea in humans. Clin. Microbiol. Infect. 2012, 18, 825–833. [Google Scholar] [CrossRef] [PubMed]
- Vlasova, A.V.; Isakov, V.A.; Pilipenko, V.I.; Sheveleva, S.A.; Markova, Y.M.; Polyanina, A.S.; Maev, I.V. Methanobrevibacter smithii in irritable bowel syndrome: A clinical and molecular study. Ter. Arkhiv 2019, 91, 47–51. [Google Scholar] [CrossRef] [PubMed]
- Erdrich, S.; Tan, E.C.K.; Hawrelak, J.A.; Myers, S.P.; Harnett, J.E. Hydrogen–methane breath testing results influenced by oral hygiene. Sci. Rep. 2021, 11, 26. [Google Scholar] [CrossRef] [PubMed]
- Cheeseman, P.; Toms-Wood, A.; Wolfe, R.S. Isolation and Properties of a Fluorescent Compound, Factor420, from Methanobacterium Strain M.o.H. J. Bacteriol. 1972, 112, 527. [Google Scholar] [CrossRef]
- Eirich, L.D.; Vogels, G.D.; Wolfe, R.S. Distribution of coenzyme F420 and properties of its hydrolytic fragments. J. Bacteriol. 1979, 140, 20. [Google Scholar] [CrossRef] [PubMed]
- Grinter, R.; Greening, C. Cofactor F420: An expanded view of its distribution, biosynthesis and roles in bacteria and archaea. FEMS Microbiol. Rev. 2021, 45, fuab021. [Google Scholar] [CrossRef]
- Lambrecht, J.; Cichocki, N.; Hübschmann, T.; Koch, C.; Harms, H.; Müller, S. Flow cytometric quantification, sorting and sequencing of methanogenic archaea based on F420 autofluorescence. Microb. Cell Fact. 2017, 16, 180. [Google Scholar] [CrossRef]
- Bellais, S.; Nehlich, M.; Ania, M.; Duquenoy, A.; Mazier, W.; Engh, G.v.D.; Baijer, J.; Treichel, N.S.; Clavel, T.; Belotserkovsky, I.; et al. Species-targeted sorting and cultivation of commensal bacteria from the gut microbiome using flow cytometry under anaerobic conditions. Microbiome 2022, 10, 24. [Google Scholar] [CrossRef]
- Props, R.; Monsieurs, P.; Mysara, M.; Clement, L.; Boon, N. Measuring the biodiversity of microbial communities by flow cytometry. Methods Ecol. Evol. 2016, 7, 1376–1385. [Google Scholar] [CrossRef]
- Balch, W.E.; Fox, G.E.; Magrum, L.J.; Woese, C.R.; Wolfe, R.S. Methanogens: Reevaluation of a unique biological group. Microbiol. Rev. 1979, 43, 260–296. [Google Scholar] [CrossRef]
- DSMZ. Medium Number 1523. Modified Methanobacterium Medium. Deutsche Sammlung von Mikroorganismen und Zellkulturen GmbH. List of Recommended Media for Microorganisms. 2015. Available online: https://www.dsmz.de/microorganisms/medium/pdf/DSMZ_Medium1523.pdf (accessed on 16 June 2022).
- DSMZ. Medium Number 320. Clostridium cellulovorans Medium. Deutsche Sammlung von Mikroorganismen und Zellkulturen GmbH. List of Recommended Media for Microorganisms. 2020. Available online: https://www.dsmz.de/microorganisms/medium/pdf/DSMZ_Medium320.pdf (accessed on 16 June 2022).
- DSMZ. Medium Number 503. Anaerobic Freshwater (fwm) Medium. Deutsche Sammlung von Mikroorganismen und Zellkulturen GmbH. List of Recommended Media for Microorganisms. 2022. Available online: https://www.dsmz.de/microorganisms/medium/pdf/DSMZ_Medium503.pdf (accessed on 16 June 2022).
- De Boever, P.; Deplancke, B.; Verstraete, W. Fermentation by Gut Microbiota Cultured in a Simulator of the Human Intestinal Microbial Ecosystem Is Improved by Supplementing a Soygerm Powder. J. Nutr. 2000, 130, 2599–2606. [Google Scholar] [CrossRef] [PubMed]
- Van, P.; Jiang, W.; Gottardo, R.; Finak, G. ggCyto: Next generation open-source visualization software for cytometry. Bioinformatics 2018, 34, 3951–3953. [Google Scholar] [CrossRef] [PubMed]
- R Core Team. R: A Language and Environment for Statistical Computing; R Foundation for Statistical Computing: Vienna, Austria, 2022; Available online: https://www.R-project.org/ (accessed on 8 January 2024).
- Geirnaert, A.; Wang, J.; Tinck, M.; Steyaert, A.; Abbeele, P.V.D.; Eeckhaut, V.; Vilchez-Vargas, R.; Falony, G.; Laukens, D.; De Vos, M.; et al. Interindividual differences in response to treatment with butyrate-producing Butyricicoccus pullicaecorum 25-3T studied in an in vitro gut model. FEMS Microbiol. Ecol. 2015, 91, fiv054. [Google Scholar] [CrossRef] [PubMed]
- De Paepe, K.; Kerckhof, F.; Verspreet, J.; Courtin, C.M.; Van de Wiele, T. Inter-individual differences determine the outcome of wheat bran colonization by the human gut microbiome. Environ. Microbiol. 2017, 19, 3251–3267. [Google Scholar] [CrossRef] [PubMed]
- Klindworth, A.; Pruesse, E.; Schweer, T.; Peplies, J.; Quast, C.; Horn, M.; Glöckner, F.O. Evaluation of general 16S ribosomal RNA gene PCR primers for classical and next-generation sequencing-based diversity studies. Nucleic. Acids Res. 2013, 41, e1. [Google Scholar] [CrossRef]
- Gantner, S.; Andersson, A.F.; Alonso-Sáez, L.; Bertilsson, S. Novel primers for 16S rRNA-based archaeal community analyses in environmental samples. J. Microbiol. Methods 2011, 84, 12–18. [Google Scholar] [CrossRef]
- Minnebo, Y.; Delbaere, K.; Goethals, V.; Raes, J.; Van de Wiele, T.; De Paepe, K. Gut microbiota response to in vitro transit time variation is mediated by microbial growth rates, nutrient use efficiency and adaptation to in vivo transit time. Microbiome 2023, 11, 240. [Google Scholar] [CrossRef]
- Vandeputte, D.; Kathagen, G.; D’Hoe, K.; Vieira-Silva, S.; Valles-Colomer, M.; Sabino, J.; Wang, J.; Tito, R.Y.; De Commer, L.; Darzi, Y.; et al. Quantitative microbiome profiling links gut community variation to microbial load. Nature 2017, 551, 507–511. [Google Scholar] [CrossRef]
- Minnebo, Y.; De Paepe, K.; Raes, J.; Van de Wiele, T. Nutrient load acts as a driver of gut microbiota load, community composition and metabolic functionality in the simulator of the human intestinal microbial ecosystem. FEMS Microbiol. Ecol. 2021, 97, 111. [Google Scholar] [CrossRef] [PubMed]
- Wickham, H. ggplot2: Elegant Graphics for Data Analysis. 2016. Available online: https://ggplot2.tidyverse.org/ (accessed on 8 January 2024).
- Kassambara, A. ggpubr: ‘ggplot2′ Based Publication Ready Plots. R Package Version 0.2.4.999. 2019. Available online: https://rpkgs.datanovia.com/ggpubr/ (accessed on 8 January 2024).
- Quast, C.; Pruesse, E.; Yilmaz, P.; Gerken, J.; Schweer, T.; Yarza, P.; Peplies, J.; Glöckner, F.O. The SILVA ribosomal RNA gene database project: Improved data processing and web-based tools. Nucleic. Acids Res. 2013, 41, D590–D596. [Google Scholar] [CrossRef] [PubMed]
- McMurdie, P.J.; Holmes, S. Waste Not, Want Not: Why Rarefying Microbiome Data Is Inadmissible. PLoS Comput. Biol. 2014, 10, e1003531. [Google Scholar] [CrossRef]
- Oksanen, J.; Blanchet, F.G.; Kindt, R.; Legendre, P.; O’Hara, R.B.; Simpson, G.L.; Solymos, P.; Stevens, M.H.; Wagner, H. Vegan: Community Ecology Package. R Package Version 2.5-6. 2019. Available online: https://cran.r-project.org/package=vegan (accessed on 8 January 2024).
- McMurdie, P.J.; Holmes, S. phyloseq: An R Package for Reproducible Interactive Analysis and Graphics of Microbiome Census Data. PLoS ONE 2013, 8, e61217. [Google Scholar] [CrossRef] [PubMed]
- Kuhn, M. Building Predictive Models in R Using the caret Package. J. Stat. Softw. 2008, 28, 1–26. [Google Scholar] [CrossRef]
- Geirnaert, A.; Calatayud, M.; Grootaert, C.; Laukens, D.; Devriese, S.; Smagghe, G.; De Vos, M.; Boon, N.; Van De Wiele, T. Butyrate-producing bacteria supplemented in vitro to Crohn’s disease patient microbiota increased butyrate production and enhanced intestinal epithelial barrier integrity. Sci. Rep. 2017, 7, 11450. [Google Scholar] [CrossRef]
- Van Herreweghen, F.; De Paepe, K.; Roume, H.; Kerckhof, F.-M.; Van de Wiele, T. Mucin degradation niche as a driver of microbiome composition and Akkermansia muciniphila abundance in a dynamic gut model is donor independent. FEMS Microbiol. Ecol. 2018, 94. [Google Scholar] [CrossRef] [PubMed]
- Vandeputte, D.; De Commer, L.; Tito, R.Y.; Kathagen, G.; Sabino, J.; Vermeire, S.; Faust, K.; Raes, J. Temporal variability in quantitative human gut microbiome profiles and implications for clinical research. Nat. Commun. 2021, 12, 6740. [Google Scholar] [CrossRef]
- Rosenberg, M.; Azevedo, N.F.; Ivask, A. Propidium iodide staining underestimates viability of adherent bacterial cells. Sci. Rep. 2019, 9, 6483. [Google Scholar] [CrossRef]
- Pausan, M.R.; Csorba, C.; Singer, G.; Till, H.; Schöpf, V.; Santigli, E.; Klug, B.; Högenauer, C.; Blohs, M.; Moissl-Eichinger, C. Exploring the Archaeome: Detection of Archaeal Signatures in the Human Body. Front. Microbiol. 2019, 10, 2796. [Google Scholar] [CrossRef]
- Ernst, L.; Steinfeld, B.; Barayeu, U.; Klintzsch, T.; Kurth, M.; Grimm, D.; Dick, T.P.; Rebelein, J.G.; Bischofs, I.B.; Keppler, F. Methane formation driven by reactive oxygen species across all living organisms. Nature 2022, 603, 482–487. [Google Scholar] [CrossRef] [PubMed]


Disclaimer/Publisher’s Note: The statements, opinions and data contained in all publications are solely those of the individual author(s) and contributor(s) and not of MDPI and/or the editor(s). MDPI and/or the editor(s) disclaim responsibility for any injury to people or property resulting from any ideas, methods, instructions or products referred to in the content. |
© 2024 by the authors. Licensee MDPI, Basel, Switzerland. This article is an open access article distributed under the terms and conditions of the Creative Commons Attribution (CC BY) license (https://creativecommons.org/licenses/by/4.0/).
Share and Cite
Minnebo, Y.; De Paepe, K.; Props, R.; Lacoere, T.; Boon, N.; Van de Wiele, T. Methanogenic Archaea Quantification in the Human Gut Microbiome with F420 Autofluorescence-Based Flow Cytometry. Appl. Microbiol. 2024, 4, 162-180. https://doi.org/10.3390/applmicrobiol4010012
Minnebo Y, De Paepe K, Props R, Lacoere T, Boon N, Van de Wiele T. Methanogenic Archaea Quantification in the Human Gut Microbiome with F420 Autofluorescence-Based Flow Cytometry. Applied Microbiology. 2024; 4(1):162-180. https://doi.org/10.3390/applmicrobiol4010012
Chicago/Turabian StyleMinnebo, Yorick, Kim De Paepe, Ruben Props, Tim Lacoere, Nico Boon, and Tom Van de Wiele. 2024. "Methanogenic Archaea Quantification in the Human Gut Microbiome with F420 Autofluorescence-Based Flow Cytometry" Applied Microbiology 4, no. 1: 162-180. https://doi.org/10.3390/applmicrobiol4010012