Article

Computational Analysis of Concrete Flow in a Reinforced Bored Pile Using the Porous Medium Approach

1
Centre for Building Materials, Technical University of Munich, Franz-Langinger-Strasse 10, 81245 Munich, Germany
2
Ingenieurbüro Schiessl, Gehlen, Sodeikat GmbH, 80687 Munich, Germany
3
Bauer Spezialtiefbau GmbH, 86529 Schrobenhausen, Germany
4
OMV Deutschland GmbH, 84489 Burghausen, Germany
*
Authors to whom correspondence should be addressed.
Appl. Mech. 2022, 3(2), 481-495; https://doi.org/10.3390/applmech3020028
Submission received: 18 March 2022 / Revised: 13 April 2022 / Accepted: 20 April 2022 / Published: 22 April 2022

Abstract

:
In this paper, the flow of concrete in a reinforced bored pile is analysed using computational simulations. In order to reduce the computational time, a porous medium that equally mimics the presence of the reinforcement is used. Experimental measurements are used as bounds on the material parameters describing the flow of fresh concrete. The influence of rheological properties of fresh concrete and the thickness of the porous medium that represents the reinforcements is analysed with a classical U-box simulation. Finally, casting of a bored pile is analysed using computational simulation implementing a porous medium representing the reinforcement cage. The concrete flow behavior and especially the filling of the concrete cover zone is analyzed for casting scenarios with different concretes varying in their rheological behavior. Simulations using the porous medium approach is 10x faster than simulations that explicitly model the reinforcements. Simulation results show that a good workability (low viscosity and low yield stress) of the initial batches of concrete must be maintained throughout pouring to avoid the risk of defect formation in the cover zone.

1. Introduction

In construction of deep foundations like bored piles, the reinforcement cages can significantly obstruct the flow of fresh concrete, especially when the structural design requires a high degree of reinforcement. This may result in the creation of defects in the cover zone of the bore piles (see Figure 1). In addition, the reinforcements can serve as drainage paths during concrete bleeding [1] leading to poor bonding and creation of defects. Presence of these defects will affect the durability and structural performance of the pile. Therefore, beside meeting special requirements on minimum clear spacing for deep foundations, the concrete properties have to fulfill high workability (i.e., low yield stress and viscosity) to limit imperfections to an acceptable extent [2,3]. However, long pouring times, and additional effects such as high ambient temperatures can adversely affect the workability and rheological behaviour (i.e., increasing yield stress and viscosity) of the concrete, increasing the risk of insufficient filling [1].
Methods for evaluating the material including the condition of the cover zone after completion of pouring are non-destructive techniques such as the Thermal Integrity Profiling (TIP) method, i.e., by recording and evaluating the hydration heat development [2] or by visual inspection when the pile surface has been exposed. Using such testing methods for optimizing the rheological properties to avoid formation of defects during concrete casting is not practical as the method is costly, time-consuming and would require several tests before an optimal solution can be obtained through trial and error. Recently an ultrasonic wave propagation based method has been proposed [4] for monitoring concrete during pile construction, but the method has to be further developed to predict defect formation based on the dynamic evolution of concrete properties.
Computational simulations on the other hand, can support, quality control of the concrete pouring process. Numerical simulation of concrete form filling in bored piles would be a powerful tool especially for highly reinforced bored piles at great depths with long pouring times. In particular, analysis of the model parameters, i.e., a sensitivity analysis would provide insight into the mechanisms and factors that govern the quality of the reinforced concrete and allow assessing the need or requirements for changes in structural or also concrete mix design. Fresh concrete can be numerically simulated using Lagrangian models [5,6,7,8] or Eulerian models [9,10,11]. See [12] for an overview of the two approaches. In this paper, concrete flow using a Eulerian method, i.e., Computational Fluid Dynamics (CFD) taking approximately into account the rheological properties depending on time (thixotropy and age) and the real dimensions and detailing of a bored pile including the reinforcement cage are investigated. Ref. [13] investigated the rheological behavior of Tremie concrete for deep foundations using the CFD simulations of the L-box and slump test. Ref. [14] used CFD to simulate the spreading of fresh concrete in bored piles. However in the simulation, the reinforcements were not considered possibly due to high computational costs. At present, the most detailed and comprehensive simulation of concrete placement in deep foundations was performed in [15]. Simulations showed that the reinforcement cages caused an increased restriction to concrete flow. In the simulation, the reinforcements were modeled explicitly. An explicit geometrical modeling of the reinforcements requires a finer discretization of the computational domain. This in turn increases the computational costs. Using this simulation method for a parameter analysis or a sensitivity study would not be practical. As the explicit consideration of every single reinforcement bar in the simulation is computationally expensive (requiring several days to weeks of computational time), especially when a parameter analysis or sensitivity study is required, a strategy to reduce the computational effort while maintaining the accuracy is essential. To this end, an effective medium approach (also called the porous medium approach) that considers the induced flow resistance due to the reinforcements equivalent to that of a porous medium was proposed in [16,17]. In order to analyse the flow behavior of concrete in a deep reinforced concrete pile in a computationally efficient manner, we use a novel approach that considers the reinforcements in the bored pile as a porous medium. The paper is structured as follows. In Section 2, the essential ingredients of the model is briefly described. In Section 3, the results of the investigation of the influence of the parameters on the accuracy of the porous media assumption is presented. In Section 4 the results of the simulation of batch-wise placement of concrete in a full-scale reinforced concrete pile is presented. Finally the paper is summarized and conclusions provided.

2. Materials and Methods

2.1. Functional Principles of CFD

Computational fluid dynamics (CFD) software (e.g., Flow-3D, COMSOL etc.) use numerical methods and algorithms for the simulation of fluid flows. Concrete casting and the form-filling behavior of concrete can be simulated using CFD [11,18,19,20]. For a simulation of the casting process of a bored pile the Herschel-Bulkley [21] or a Bingham [22] equation can be used. These constitutive models [23] require as input parameters, the material properties such as the density, viscosity and yield stress ageing behaviour (thixotropy). These input parameters have to represent the real flow behaviour of concrete used for practical applications. One important aspect for the simulation is the discretization. Two conflicting goals must be solved. The size of the discrete cells has to be smaller than the smallest solid dimension (e.g., diameter of reinforcement rebars in millimetre-range) and small enough in the area of interest (e.g., the concrete cover zone). However, by doubling the number of cells, the computation time increases. Therefore, especially regarding the simulation of interactions between a fluid (e.g., concrete or bentonite) and the reinforcement cage (diameters in centimetre-range) in a bored pile (diameters with a couple of meters and depths with more than 20 m) the calculation time can become extremely long (about several weeks). One solution for this challenge is to substitute the reinforcement cage by an equivalent homogeneous medium, i.e., a porous medium that can reduce the computation time up to 85% [24]. In this paper, normal flowable concrete (consistency class F4–F5) as used in deep foundatations is modelled as a yield-stress fluid and the reinforcements are modelled as a porous medium. In the following section the porous medium approach is described.

2.2. Porous Medium Representation of Reinforcements

In all simulations in this paper, laminar flow behaviour is assumed. The region in the computational domain containing the reinforcement cage is modeled as a porous medium. Concrete flow in this porous medium is governed by the Darcian Saturated Drag Model [25] that is defined using two input parameters. The porosity ϕ and the drag-coefficient A . In this paper the porosity is the ratio of the volume of the void space V V with respect to the volume of the region representing the porous medium V T . Given the volume of the reinforcements V S , the porosity can be obtained as follows:
ϕ = V V / V T = 1 V S / ( V T )
The drag coefficient A characterizes the flow resistance caused by the porous medium and is given below:
A = ϕ μ ρ 1 / k x 1 / k y
Here A is the drag coefficient, k x and k y (according to [24,26,27]) are the permeabilities corresponding to flow perpendicular and parallel to the direction of flow, μ is the plastic viscosity and ρ is the density of fresh concrete. The arrangement of the reinforcing bars induce an anisotropic flow. The corresponding permeabilities are given as follows.
k x = d 2 0.16 1 φ π 4 φ 3 π 4 φ + 3 4 φ π
k y = k z = d 2 16 π 1.479 ln φ + 2 φ φ 2 2 0.0186 φ 4
In the above expressions, d is the diameter of the rebars and φ is the solid volume fraction (of the porous medium) defined as φ = 1 ϕ . k x is the permeability normal to the reinforcement cage and k y = k z is the permeability parallel to the reinforcement bars.Using the drag coefficient A , the deceleration of fresh concrete due to the effect of the rebars can be written as:
f d = A · v .
In the above equation, v is the velocity of fresh concrete. This drag term is added to the linear momentum balance equation to account for the drag force density induced by the reinforcement cage.

2.3. Reinforcement

The configuration of the reinforcement considered in this paper is shown in Figure 2. The reinforcement cage comprises of longitudinal (36 mm) and stirrup (20 mm) reinforcement bars with a clearance width of 0.04 m × 0.05 m and a cover zone of 0.06 m. This specialized configuration (reinforcement and cover dimensions) of the reinforcement cage was based on the data provided to us by the industrial partner.
Two important assumptions are made regarding the configuration of the reinforcements in the subsequent computational analysis. Firstly, in order to replace this reinforcement cage with a porous medium, the parameter d that represents the diameter of the reinforcements has to be specified. In this paper d is assumed to be the average value of 28 mm that is calculated as the average diameter of the longitudinal (36 mm) and stirrup (20 mm) reinforcement. This averaging was necessary for using Equations (3) and (4). Secondly, for the explicit simulations (geometrically modeled reinforcements) of the L-box considered in Section 3, the reinforcements are assumed to lie on one plane. The reason for assuming the reinforcements to lie on one plane is to save computational resources, as a staggered configuration would require a very fine discretization to accurately model the geometry in Section 3. This assumption would influence the thickness of the porous medium and this effect is also analysed in Section 3. The thickness of the reinforcing cage is 56 mm. In the simulation, the porous medium region that represent the reinforcement cage is assumed to be 60 mm. This value was set for allowing a coarser discretization. In Section Section 3.1.1, the influence of the thickness of the porous medium is analysed.

2.4. Specification of the Material Properties

The Bingham equation is used to describe the rheology of concrete as follows:
τ = τ d + μ γ ˙
In the above equation, τ is the shear stress, τ d is the dynamic yield stress, μ is the plastic viscosity and γ ˙ is the strain rate. The properties of the simulated concretes are based on the results of experimental investigations on the required rheological characteristics of Tremie concretes obtained within the framework of a research and development project. The report on this experimental research and development project can be found in [28]. The results of the project also served as a basis for the target values provided in [2] regarding the minimum and maximum values for the dynamic yield stress τ d and viscosity μ and the corresponding values for the slump flow and the slump flow velocity. According to [2,28], the dynamic yield stress τ d should be in the range between 75 Pa and 300 Pa in order to ensure sufficient concrete form filling in the bored pile, see Figure 3, left. For the same reason, the plastic viscosity μ of the concrete should be between 20 Pas and ≈50 Pas, see Figure 3 right. Furthermore, the form filling was investigated when using concretes out of this range in order to simulate insufficient form filling. For the simulated concretes, either the yield stress τ d (75 Pa ≤ τ d ≤ 500 Pa) or the viscosity μ (30 Pas ≤ μ ≤ 75 Pas) were stepwise varied in order to determine their effect on the form filling. Table 1 shows all concrete variations.
The surface roughness of the porous layer is set to 0.028 m as a mean value of the diameter of the longitudinal (36 mm) and stirrup (20 mm) reinforcement. The heterogeniety of the soil medium was considered by specifying the surface roughness of the bored pile wall. The surface roughness of the bored pile wall is set to 0.006 m as the medium roughness of a soil with a medium grain diameter of 0.012 m.

3. Computational Analysis

We perform two sets of simulation with two different geometries. Firstly concrete flow in a U-box is simulated. This simulation is performed in order to analyse the influence of the material and geometrical parameters on the accuracy of the porous medium approach. Thereafter, concrete casting of a bored-pile is simulated and analysed using a restricted set of material parameters. All simulations are performed using the software Flow3D.

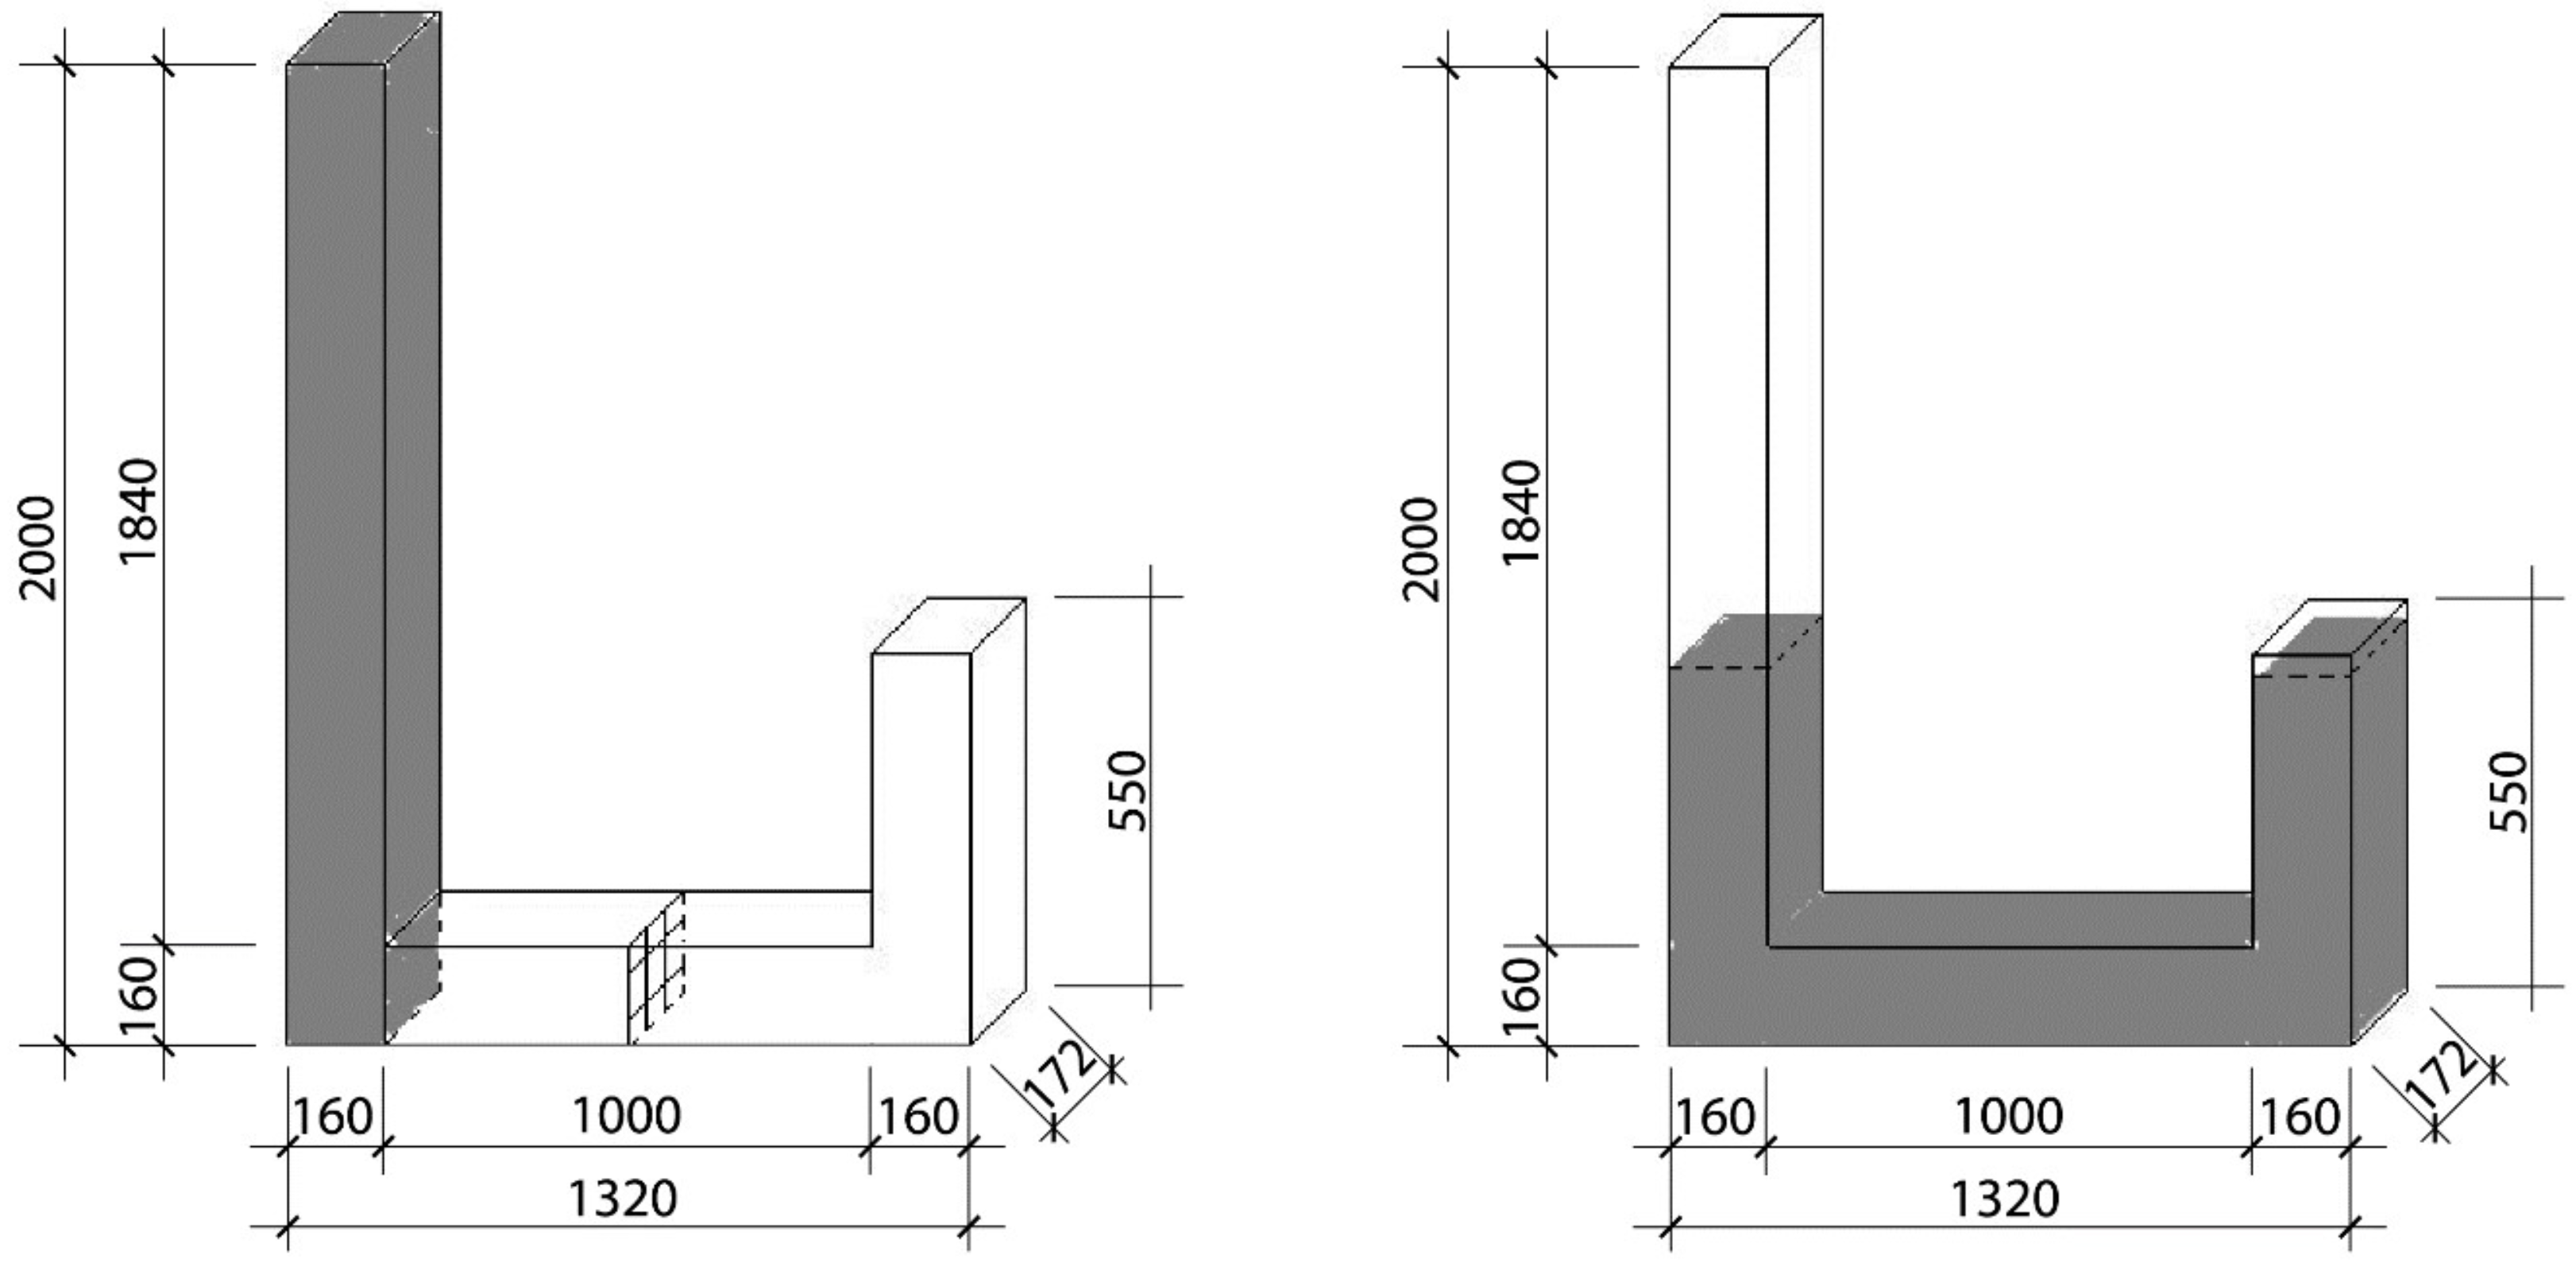
3.1. Simulation and Analysis of Concrete Flow in a U-Box

The geometry of the U-Box simulation domain is shown in Figure 4. In order to save simulation time, only 550 mm of the right section is considered in the simulation domain. The reinforcement and the corresponding porous medium representation of the reinforcement is located in the centre of the horizontal part of the U-box as shown in Figure 4 right. The cross section of the reinforcement shows a section of the cage with the longitudinal (36 mm) and stirrup (20 mm) reinforcement. The clearance width between the rebars is 0.04 m × 0.05 m. On the walls, no friction is defined. The top surfaces of the left and right vertical section are open (set to “Outflow”) to prevent a vacuum or over pressure due to the movement of the fluid.
The grid size in the domain except the reinforcement region is 0.01 m. In the reinforcement region, the grid size is reduced to 0.005 m in order to have a realistic discretization of the reinforcements. For the simulations in which the porous medium substitutes the reinforcements, a grid size of 0.055 is assumed. A larger grid size of 0.055 is used because the porous medium representation of the reinforcement does not need a fine discretization of the geometry of the reinforcements. In a first analysis step the flow distance in the horizontal section and the vertical rise of the concrete in the right section (see Figure 5) are compared between the case considering the true reinforcement geometry and that of the porous medium representation. In order to identify the correct thickness of the porous medium, five different thicknesses are considered: 30 mm, 40 mm, 50 mm, 55 mm, and 60 mm. In a second step the rheology (yield stress and viscosity) of the concrete is varied in order to identify the effect of the rheological parameters on the flow behaviour through the porous medium as well as on the simulation time.

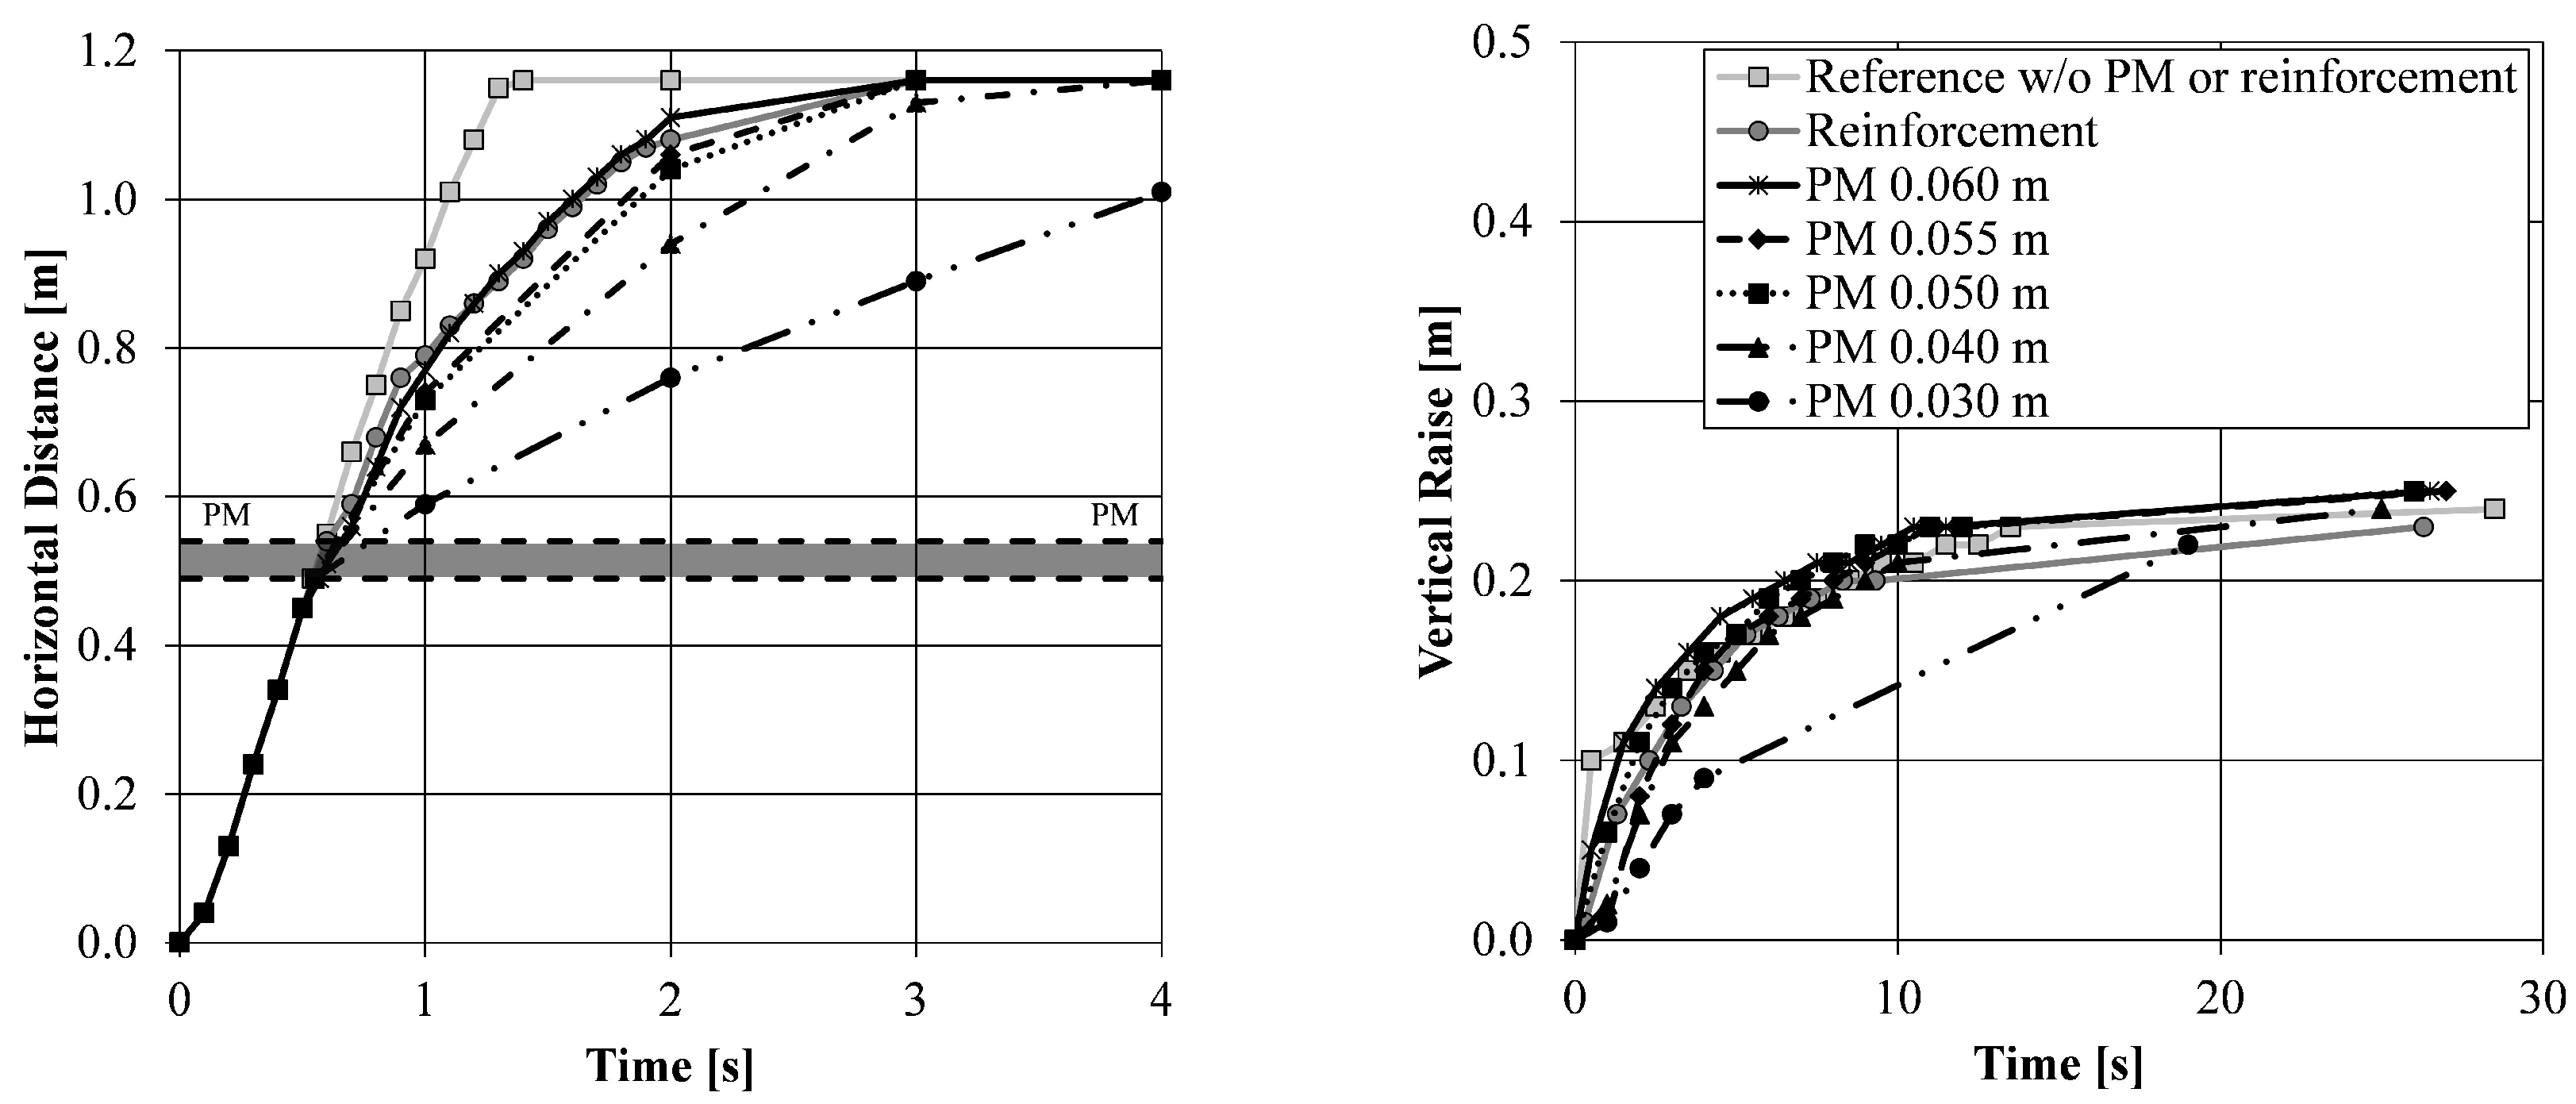
3.1.1. Influence of the Thickness of the Porous Medium

Firstly the influence of the thickness of the porous medium on the accuracy of the results is analysed. The rheological properties of the concrete is set to a yield stress of 150 Pa and a viscosity of 30 Pas.
Figure 6, left shows the horizontal flow distance as a function of the flow time. The first aspect that can be observed is the exactly similar flow pattern until the porous medium or the reinforcement is reached due to the same viscosity in all cases. The reference simulation without the porous medium or reinforcement (light grey cubes) shows the fastest flow time until the end of the horizontal part is reached. The reinforcement (grey circles) decelerates the flow once the concrete passes the rebars. The porous medium also affects the flow time of fresh concrete. However, the thickness of the porous medium has an effect on the degree of deceleration of the concrete. Hence, with decreasing thickness of the porous medium the deceleration increases. Best results for the simulation of the reinforcement is achieved with a porous medium thickness of 0.055 m which is approximately the same thickness as the reinforcement (0.056 m). Thereby, the calculation time accelerates 5 times in comparison to the reinforced bored pile by using the same grid size of 0.005 m. Especially with regard to an optimized grid size in the U-box of 0.01 m, the porous medium with a thickness of 0.060 m shows the best results with a reduction of the simulation time by 10 times or 1000%, respectively, in comparison to the reinforcement. Figure 6, right shows the vertical raise of the concrete in the U-box as a function of the flow time after reaching the end of the horizontal section. The time is set to zero, when the concrete starts to rise. The first thing to notice is that the rheological properties of the concrete prevent a levelling of the concrete between the right and the left vertical part of the U-box, even without reinforcement or the porous medium. A full levelling would be reached at a vertical raise of 0.5 m. Furthermore, the graph exhibits that all simulations reach almost the same level in comparable flow time. This is also caused due to the same rheological properties of the concrete. Therefore, the porous medium with 0.06 m thickness is used for further simulations.

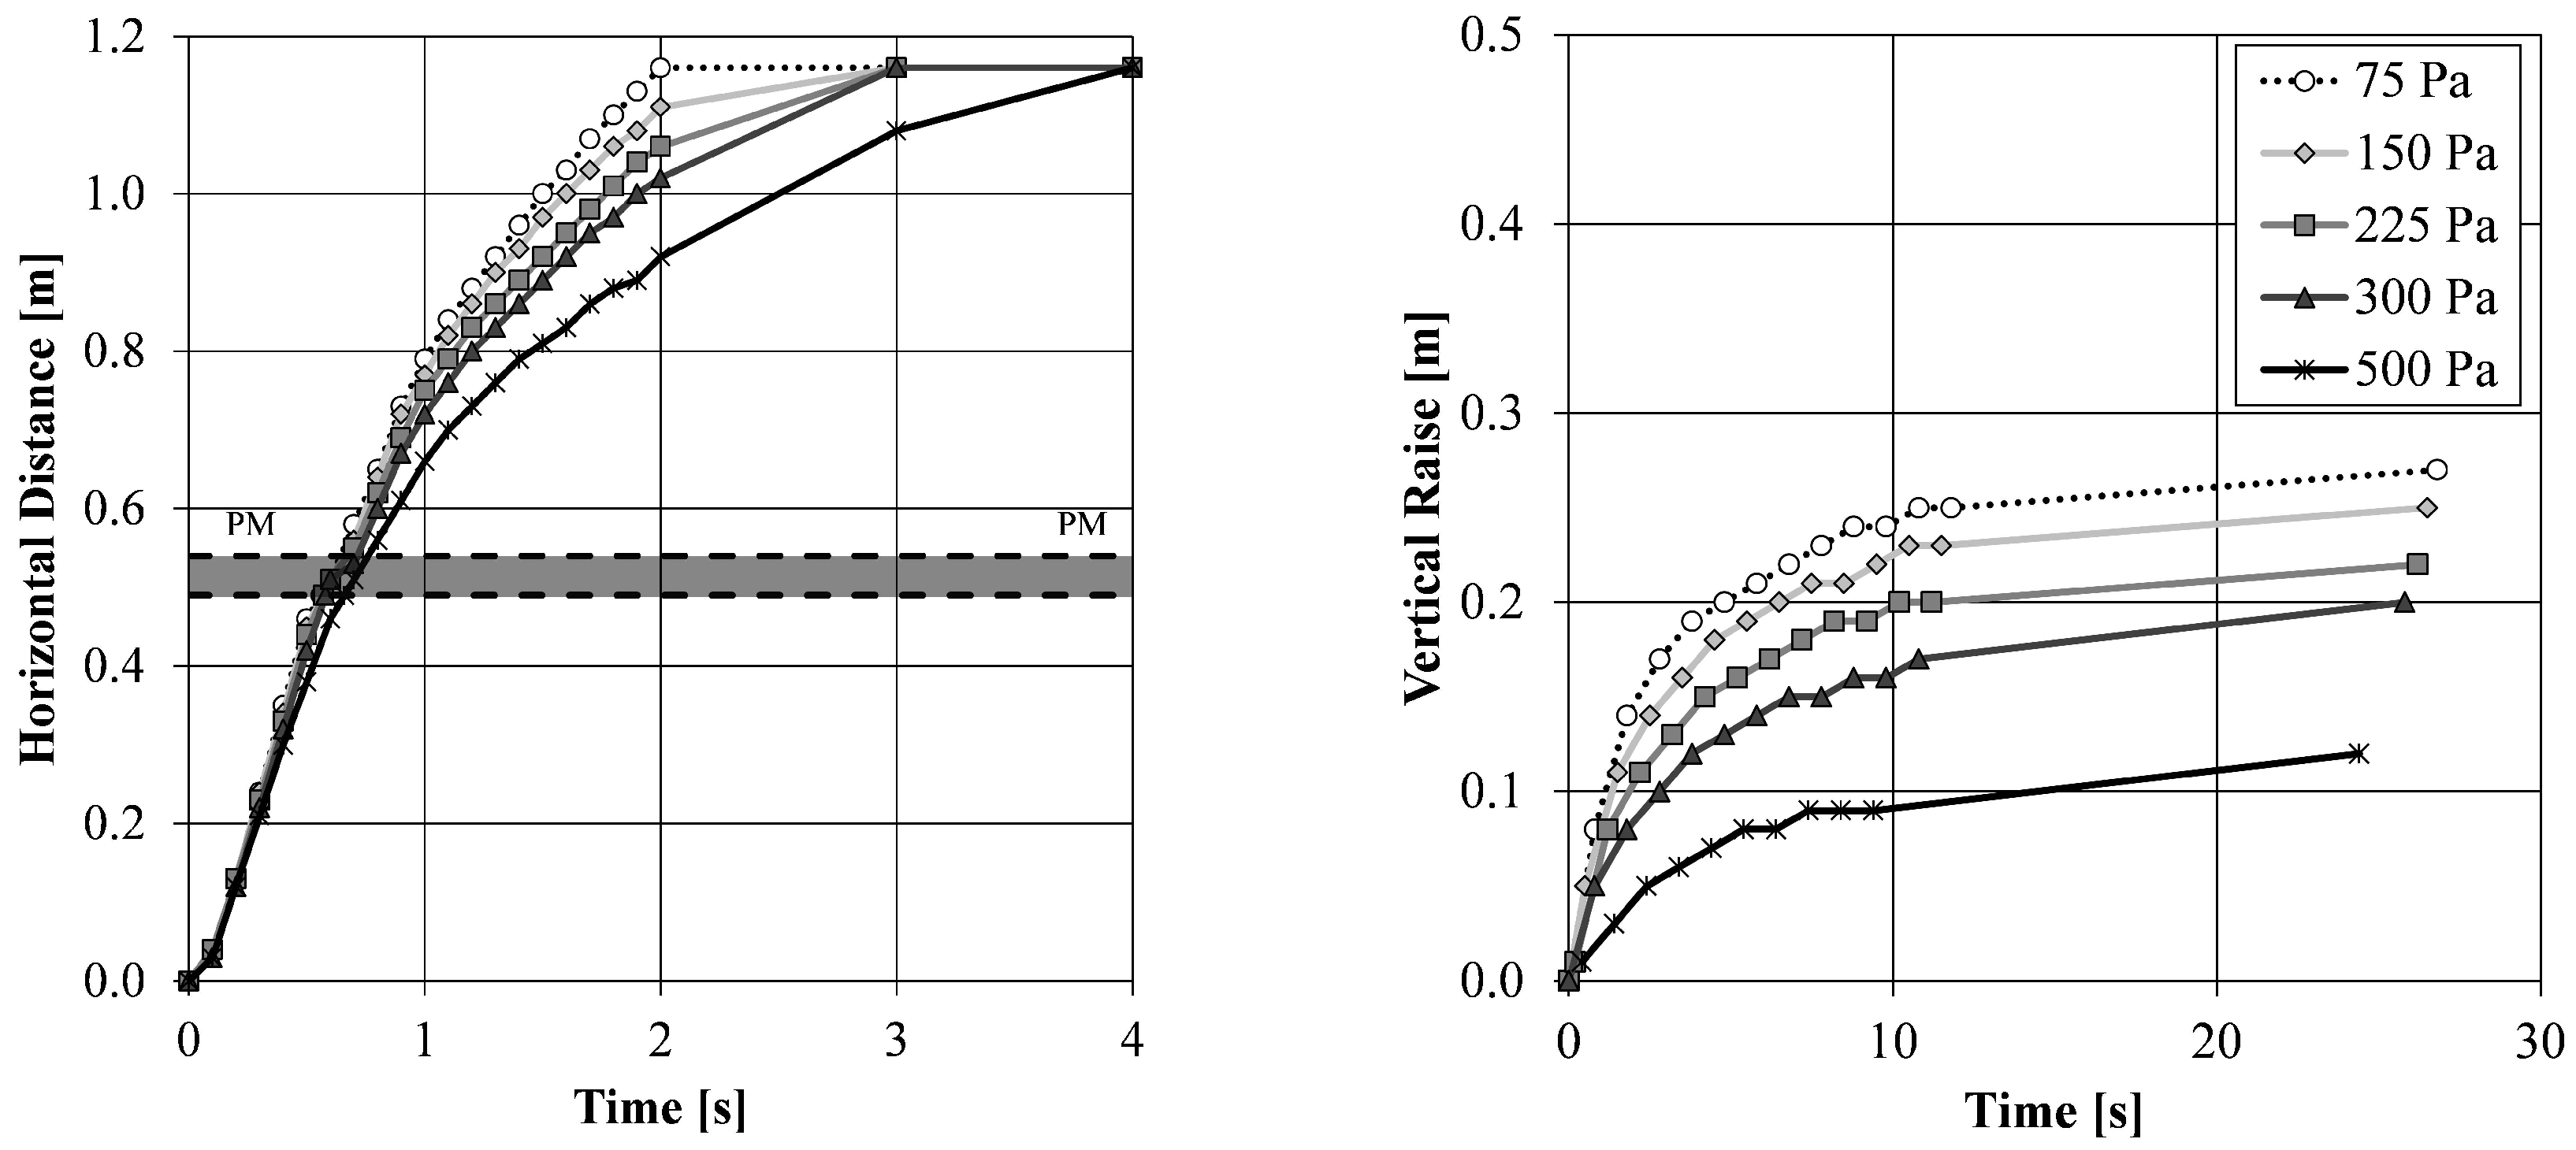
3.1.2. Influence of the Yield Stress

In order to analyse the influence of the yield stress the thickness of the porous medium is set to 0.060 m and the viscosity to 30 Pas. The values of yield stress are 75 Pa, 150 Pa, 255 Pa, 300 Pa, and 500 Pa. Figure 7, left shows the flow distance in the horizontal part of the U-box depending on flow time. Figure 7, right shows the vertical rise of the concrete in the right part of the U-box depending on flow time.
The results show that the flow time increases with increasing yield stress, until the end of the horizontal section of the U-box is reached. The differences in the flow time result essentially from the time required to penetrate the porous medium. Concretes with a higher yield stress are significantly slowed down caused by an increased effect of friction and thus require more time to flow through the porous medium. Behind the porous medium the concrete reaches the end of the horizontal section of the U-box faster with decreasing yield stress due to increased flow speed. Furthermore, the higher the yield stress the lower is the rise of the concrete in the right vertical section of the U-box in Figure 7, right. This is caused by the lower kinetic energy which is required to overcome the yield stress of the material against the gravity before the raise stops. The decreasing kinetic energy also explains the decreasing flow time in Figure 7, right.

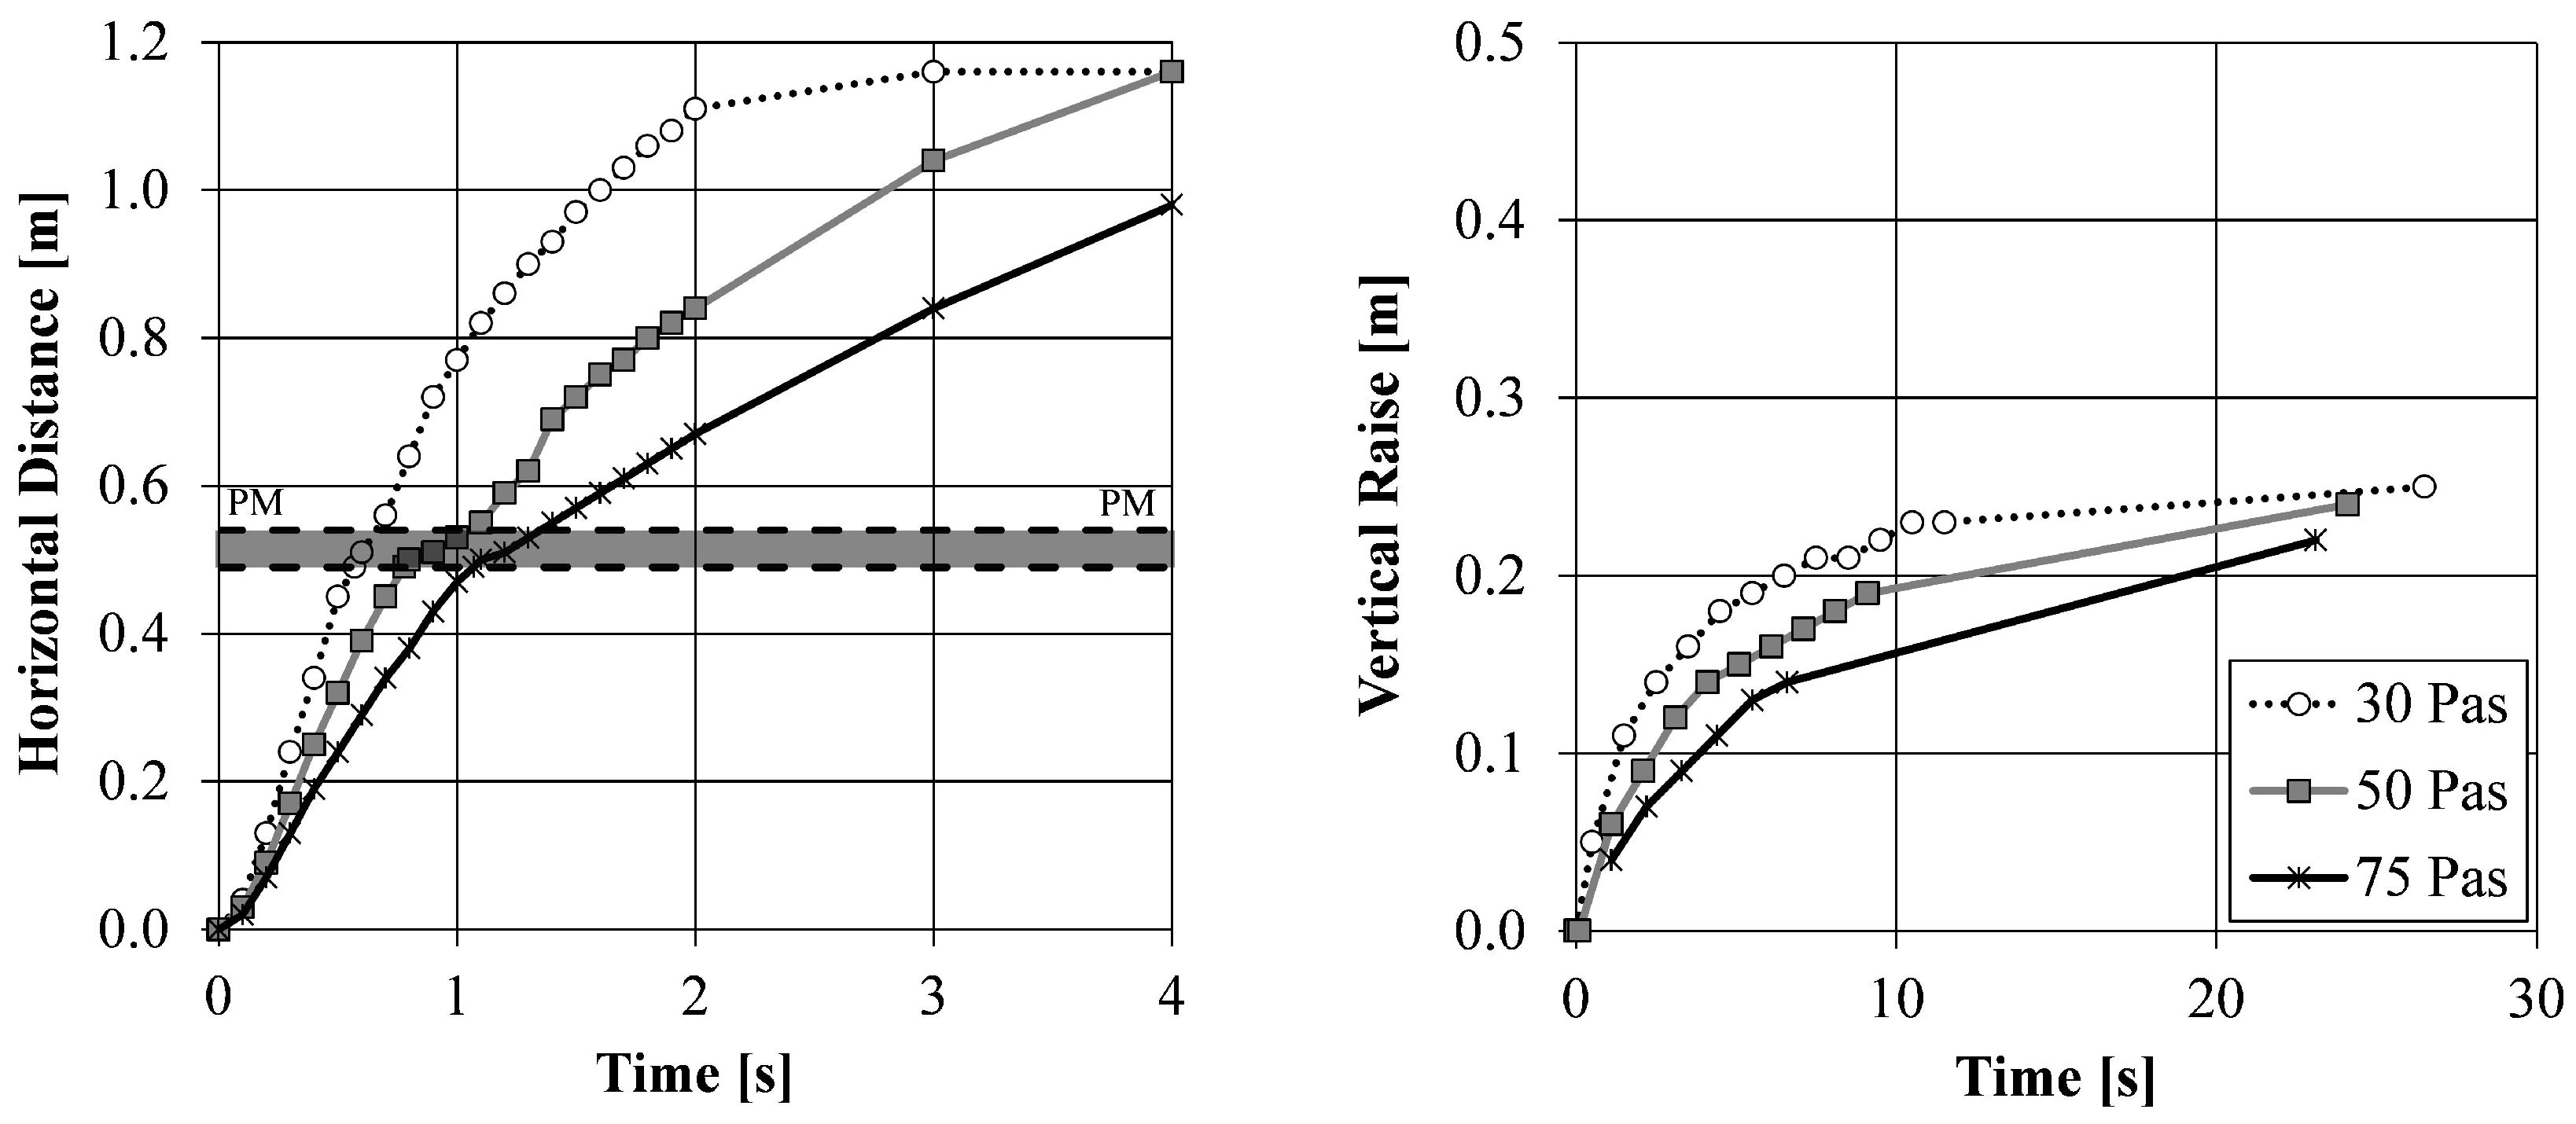
3.1.3. Influence of the Viscosity

In order to investigate the effect of the viscosity, the yield stress is set to 150 Pa and the thickness of the porous medium to 0.06 m. Three different viscosities are considered 30 Pas, 50 Pas, and 75 Pas.
Figure 8, left shows the flow distance in the horizontal section of the U-box and Figure 8, right the vertical raise of the concrete in the right vertical section of the U-box depending on flow time. The horizontal flow distance and the vertical raise show similar results in comparison to the simulations with varying yield stress. However, there are some crucial differences. An increasing viscosity causes a slower flow speed directly from the beginning in contrast to the results of Figure 7, where the flow speed just reduces behind the porous medium caused by a reduced kinetic energy through increased friction. The kinetic energy should not have high differences between the concretes in Figure 8 due to vertical raise to the same level in Figure 8, right. The viscosity should have its main effect on the flow speed. However, the porous medium layer seems to have a slight effect on kinetic energy which explains the slightly higher raise in the vertical section with increasing viscosity. The phenomenon is probably affected by the value of the viscosity which is a direct input parameter for the permeability of the porous medium. The simulations with varying yield stress and viscosity show realistic results in flow behaviour through the porous medium or reinforcement, respectively.

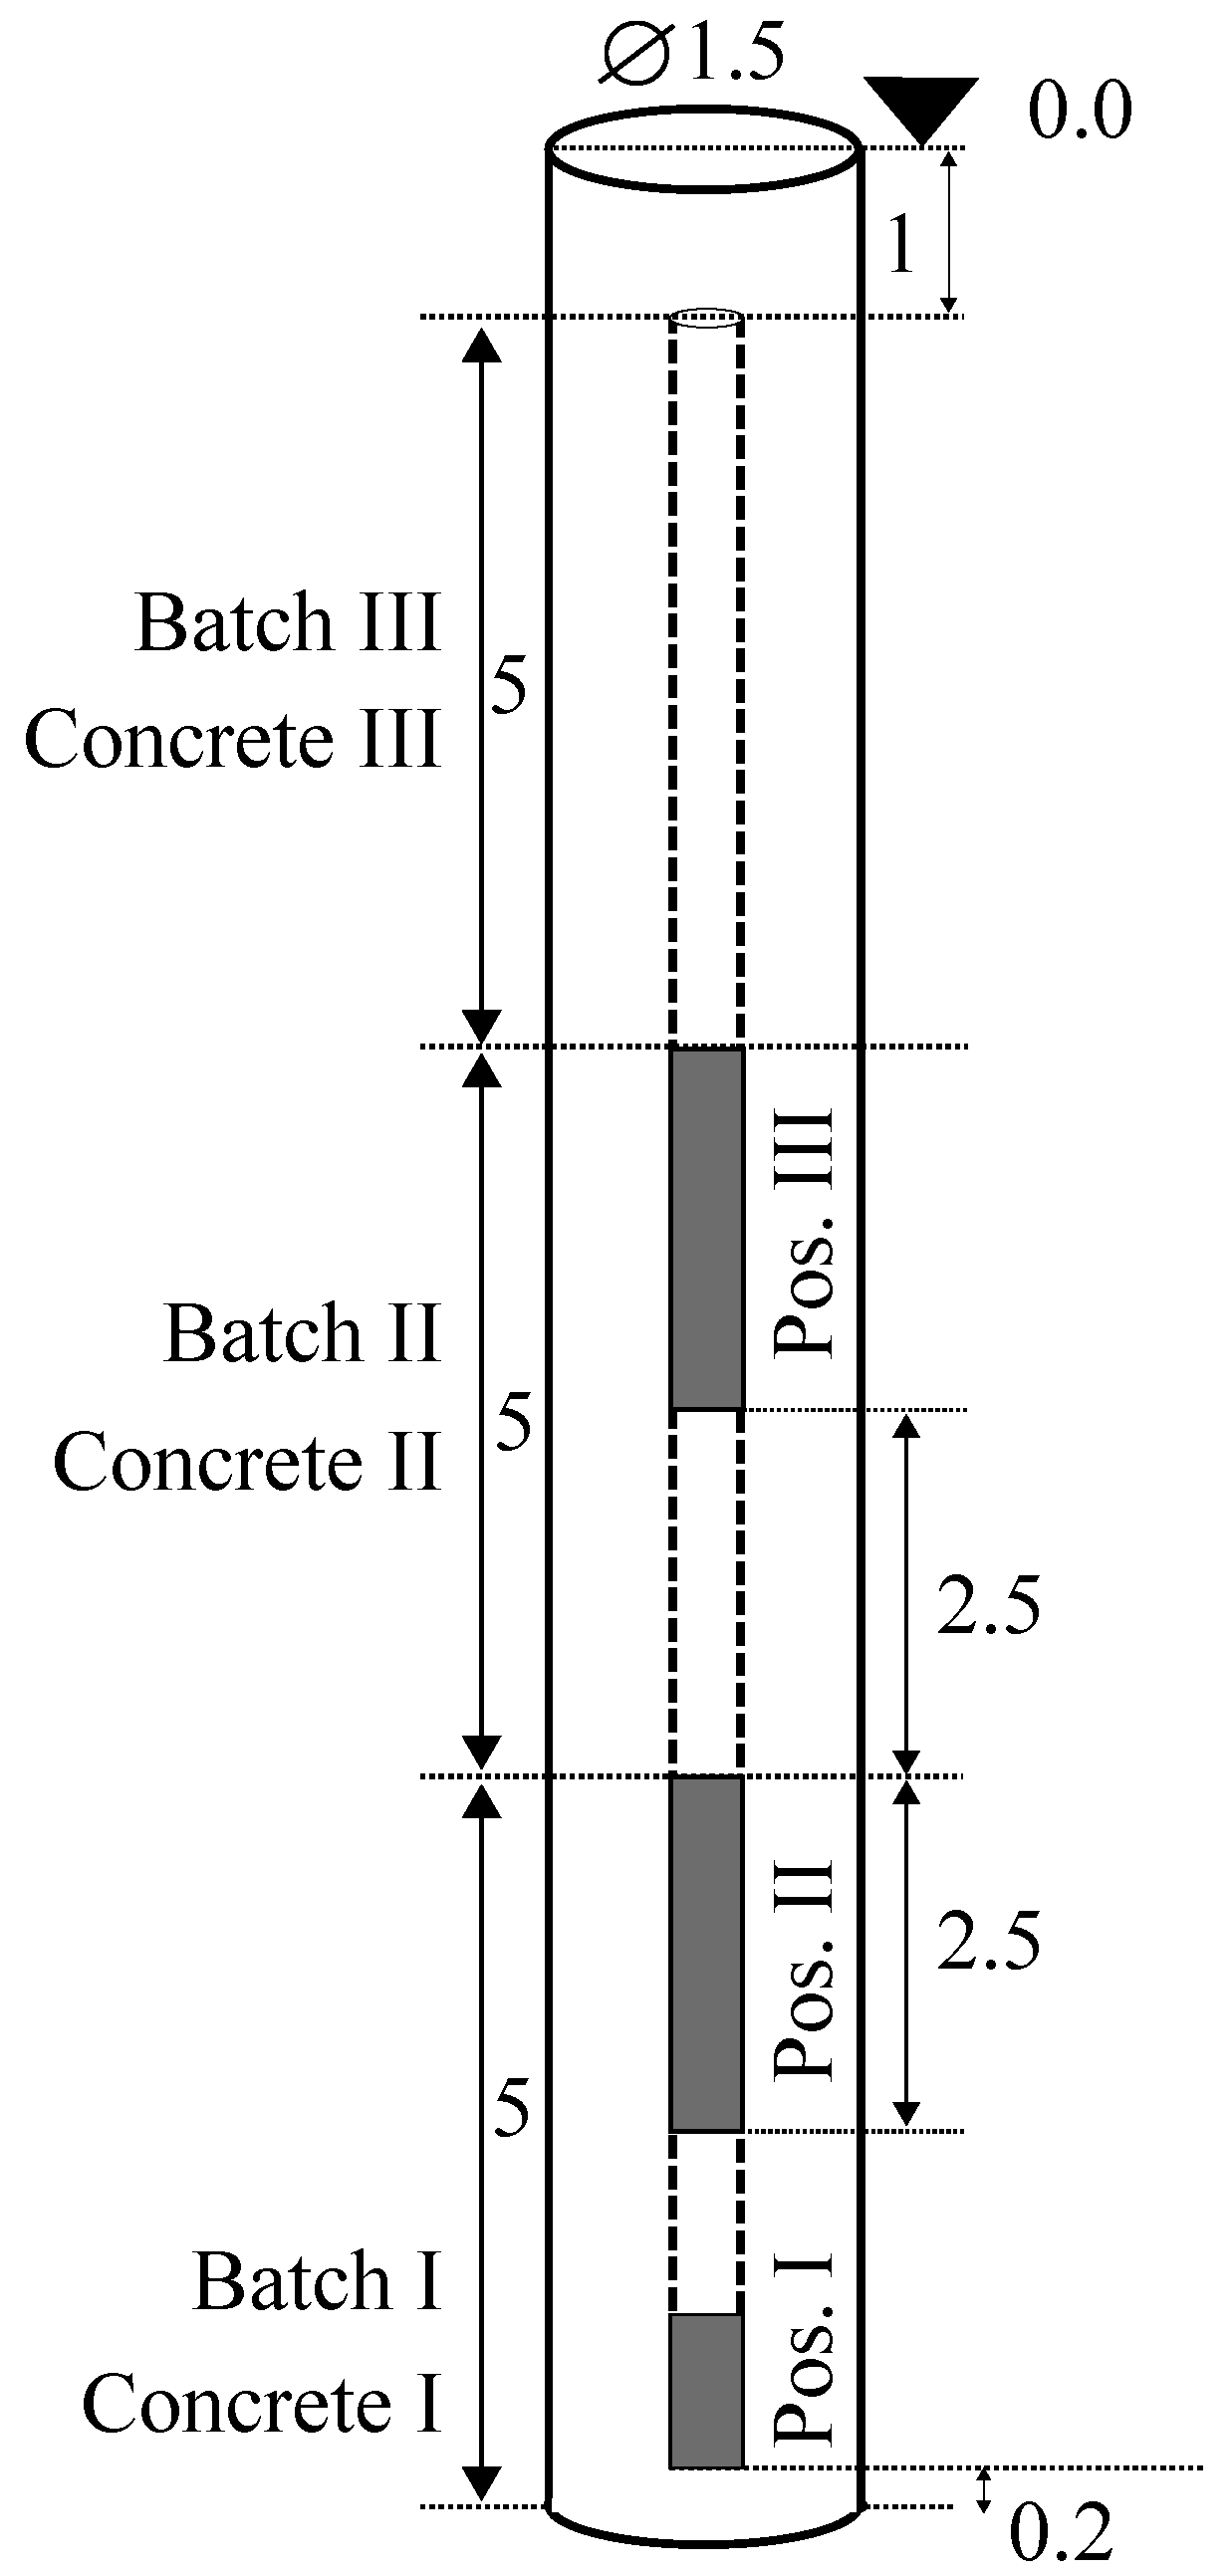
4. Simulation and Analysis of Concrete Flow in a Bored Pile

For the simulation of the bored pile a hydraulic supported bored pile type is used. The support fluid is bentonite. The depth of the pile is 16 m with a diameter of 1.5 m, see Figure 9.
Centred in the bored pile the Tremie (funnel) pipe is shown with an inner diameter d i of 0.24 m and an outer diameter d o of 0.27 m in three casting positions I, II and III. Simultaneously, the volumes of the concrete batches are shown with 9 m 3 each. The pouring time of the batches are set to 7.5 min for the reference concrete with yield stress 150 Pa and viscosity 30 Pas, representing a real pouring scenario. Thus, the pouring time depends on the viscosity of the concrete and the infill period is adjusted to the viscosity of the material. The reinforcement is replaced in all simulations by a porous medium with a thickness of 0.06 m. This thickness is the best compromise regarding to calculation time and accuracy from the experiments in the U-box (see Section 3.1.1). The boundary conditions are defined as “Outflow” at the top of the bored pile as well as “velocity” at the top of the Tremie pipe (to have a defined flow rate in the Tremie pipe) and as “wall” at the side wall and the bottom of the pile. The grid size is set to 0.03 m as the lowest common denominator of all dimensions in the pile. In the simulations of this paper only position I and II of the Tremie, batches I and II, respectively, are simulated. For this purpose the simulation is done in two steps. In the first step the flow of batch I is calculated in Tremie position I. In step one the pile is filled with bentonite which has to be replaced by concrete I. In step two batch II is filled in batch I through the Tremie pipe in position II. Therefore, concrete II has to replace concrete I and the bentonite after passing concrete I. To simulate a time dependent evolution of the behaviour of concrete, the rheological properties of batch II is varied in Section 4.3. As a result of the simulations, the distribution of the concrete batches in the bored piles are compared depending on the rheological properties of the concrete batches.

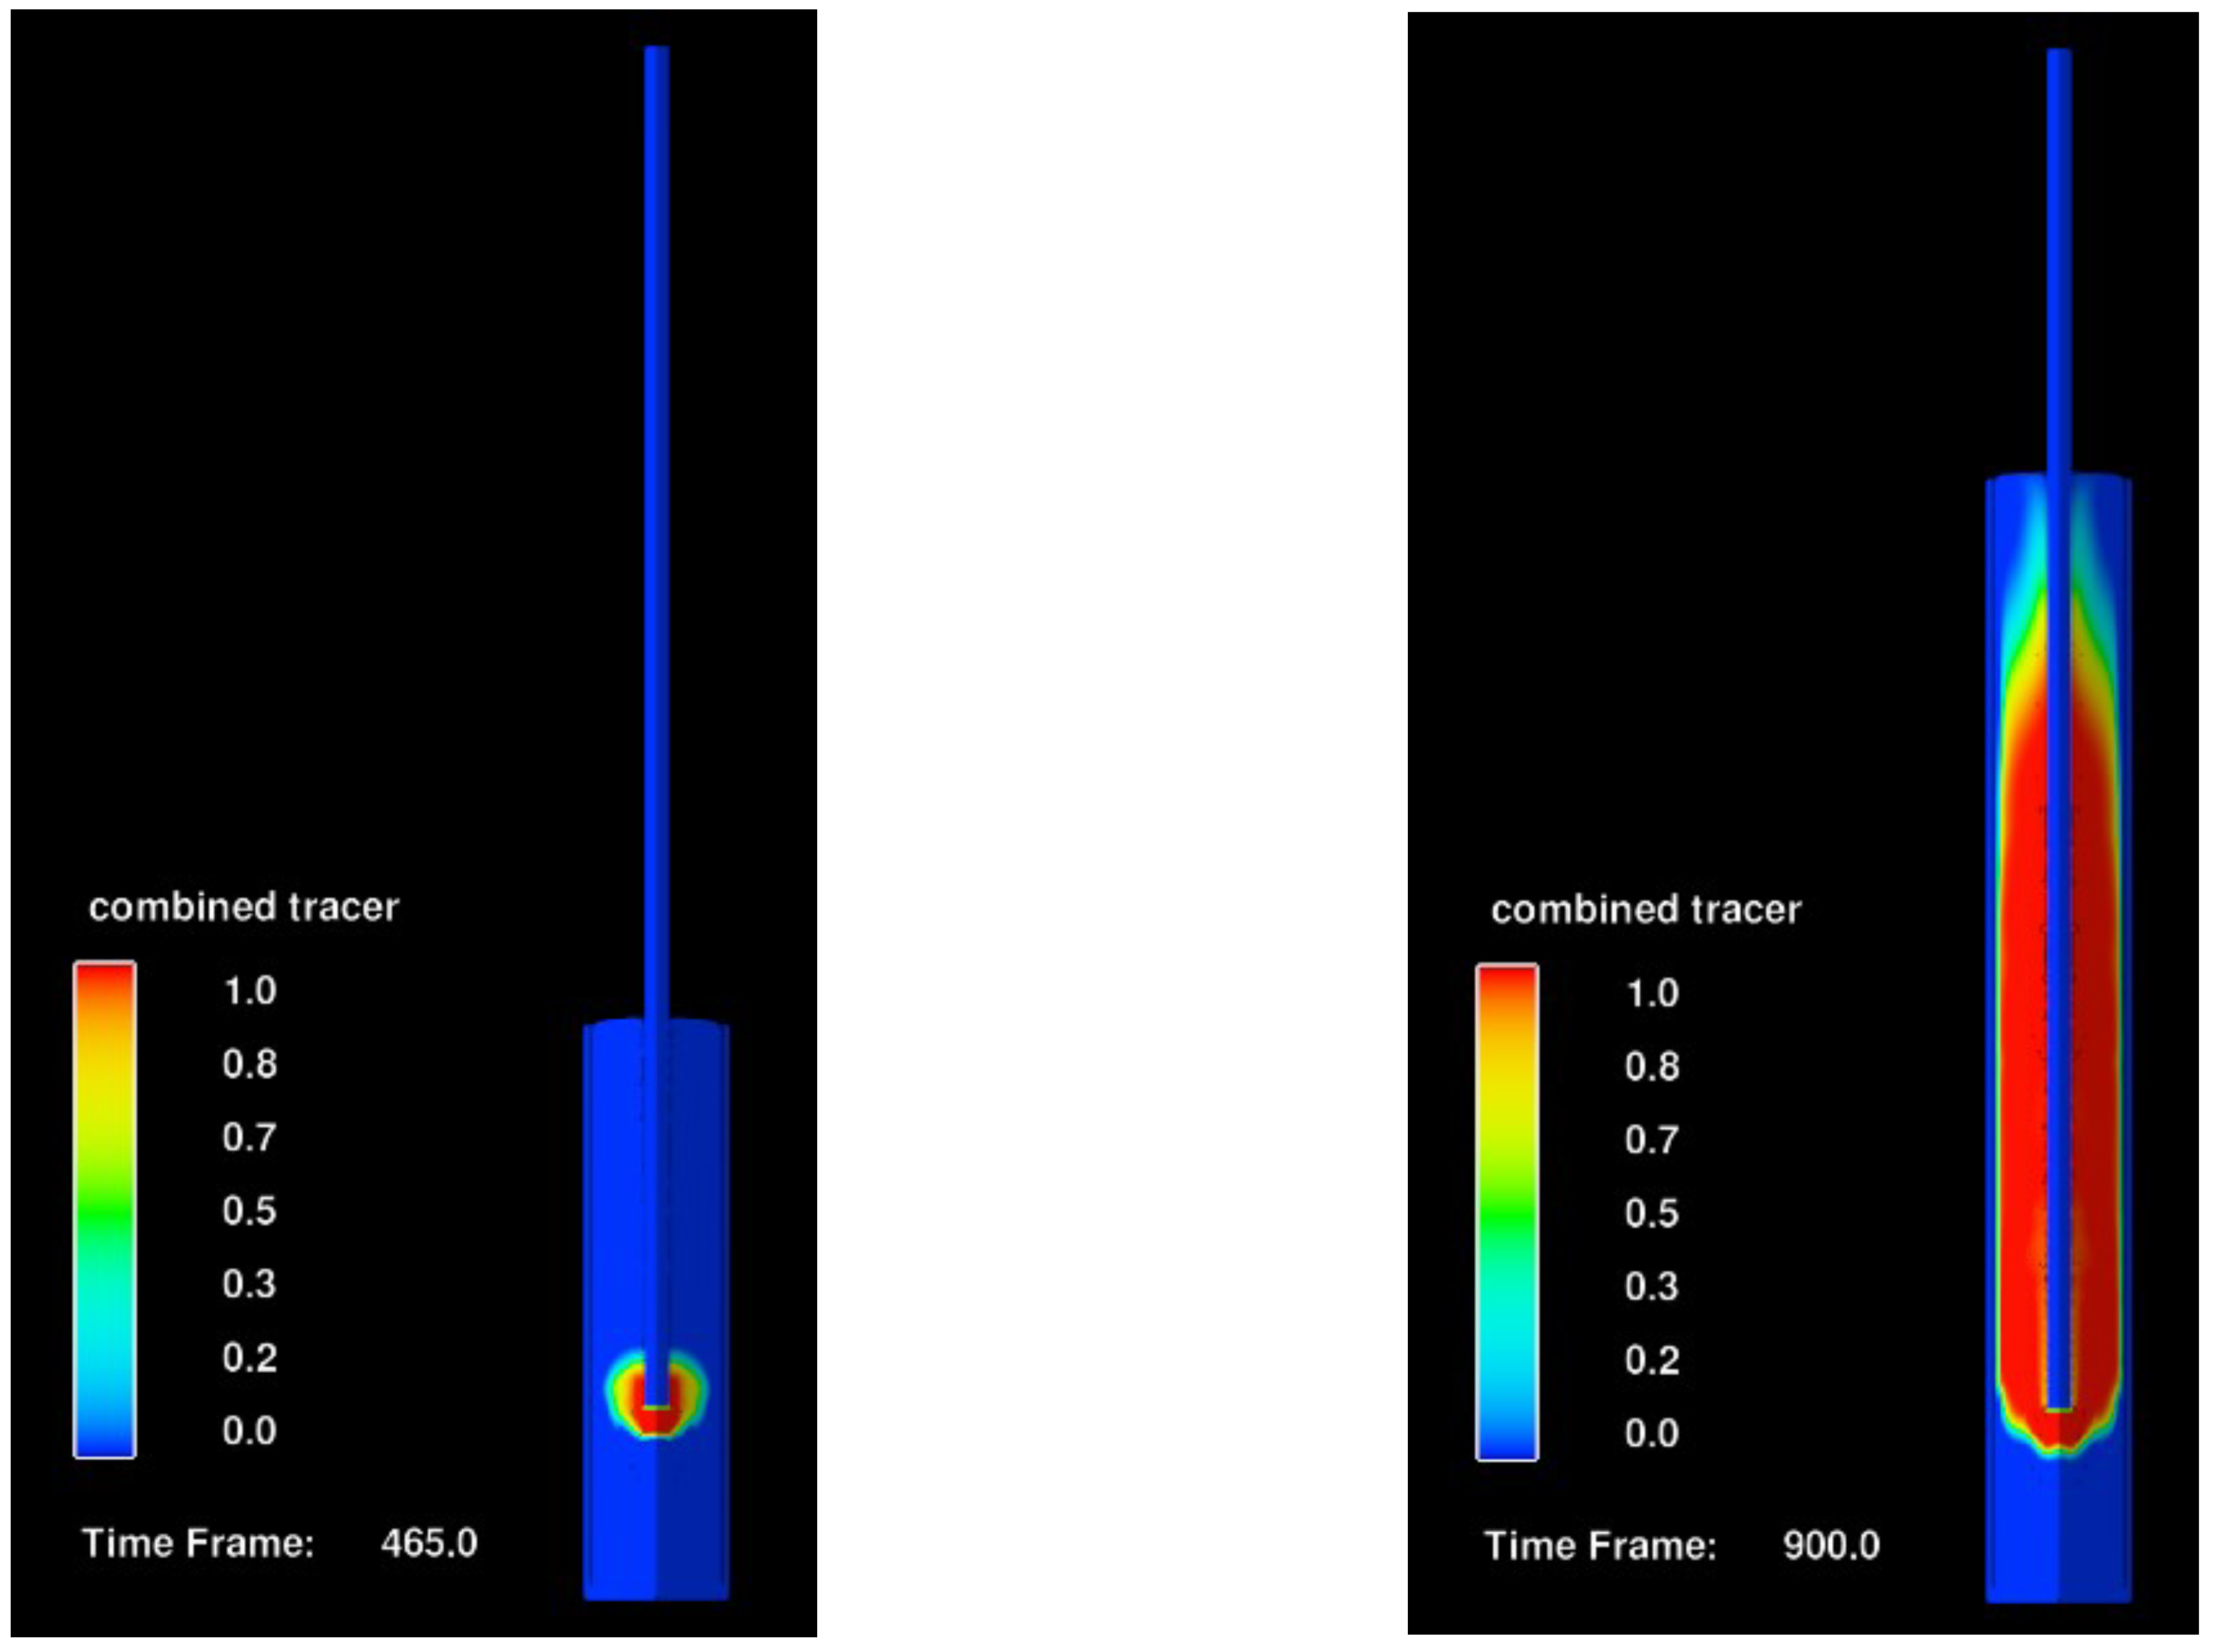
4.1. Effect of Pouring a Concrete with Low/Medium Yield Stress and Medium Viscosity in a Concrete with Same Properties (Concrete A)

Figure 10 shows the pouring of “fresh” concrete with low/medium yield stress and medium viscosity (batch II) in batch I of a concrete with the same properties. The yield stress of concrete A is 150 Pa with a viscosity of 30 Pas. This case simulates a pouring process without any delay with a low thixotropic concrete which leads to almost similar properties of the concrete batches as in the fresh state.
Figure 10, left shows the casting process 15 s after starting the infill of batch II and Figure 10, right after 450 s. The blue colour represents batch I and the red colour batch II. The colour gradation between blue and red symbolises a diffuse zone between the two batches. 15 s after begin of the infill the red concrete starts to build a bubble around the outflow of the Tremie pipe, which directly aligns with the pipe and begins to raise along the pipe following the path of least resistance to flow. Simultaneously, the red concrete spreads in the horizontal direction until the porous medium is reached. However, even after 450 s and complete infill, batch II cannot penetrate the porous medium and replace concrete I in the cover zone. The red concrete seems to press the blue concrete into the porous medium horizontally. The concrete level in the cover zone exhibits a lower height than in the centre zone of the pile. This could be an effect of friction of the wall. The porous medium in the small cross section slows the concrete and causes the characteristic curvature of the concrete surface. This curvature also appears at the Tremie pipe. However, no defects in the cover zone appear and a good filling of the pile is achieved. This flow behaviour has a good correlation to bulging flow according to [2].

4.2. Effect of Pouring a Concrete with Medium Yield Stress and High Viscosity in a Concrete with Same Properties (Concrete B)

Figure 11 shows the pouring of an “old” concrete with medium yield stress and high viscosity (batch II) in batch I of a concrete with the same properties. The yield stress of the concrete B is 500 Pa with a viscosity of 75 Pas. This case simulates a delayed pouring process with a high thixotropic concrete, respectively, which leads to an increase of the yield stress and viscosity over time caused, e.g., by a delayed ready-mix truck.
Figure 11, left shows the casting process 15 s after starting the infill of batch II and Figure 11, right after 835 s. The longer time period for pouring batch I and batch II in comparison to Figure 10 is caused by the higher viscosity of the concrete. The green colour represents batch I and the red colour batch II. The colour gradation between green and red symbolises a diffuse zone between the two batches. Similar to the more flowable concrete in Figure 10, 15 s after beginning the infill, the red concrete starts to build a bubble around the outflow of the Tremie pipe, which directly aligns to the pipe and begins to rise along the pipe following the path of least resistance to flow. However, alignment of the concrete seems to be much more pronounced. This effect could be caused by the higher flow resistance of batch I. Simultaneously, the red concrete spreads in the horizontal direction until the porous medium is reached. However, the red concrete is again not able to replace the green concrete of batch I with the same rheological properties. Furthermore like in Figure 10, the concrete level in the cover zone exhibits a lower height than in the centre zone of the pile. Unlike in Figure 10 the red concrete seems partly to penetrate the cover zone at the top of the poured concrete which is in, correlation to bulging flow behaviour in [2].

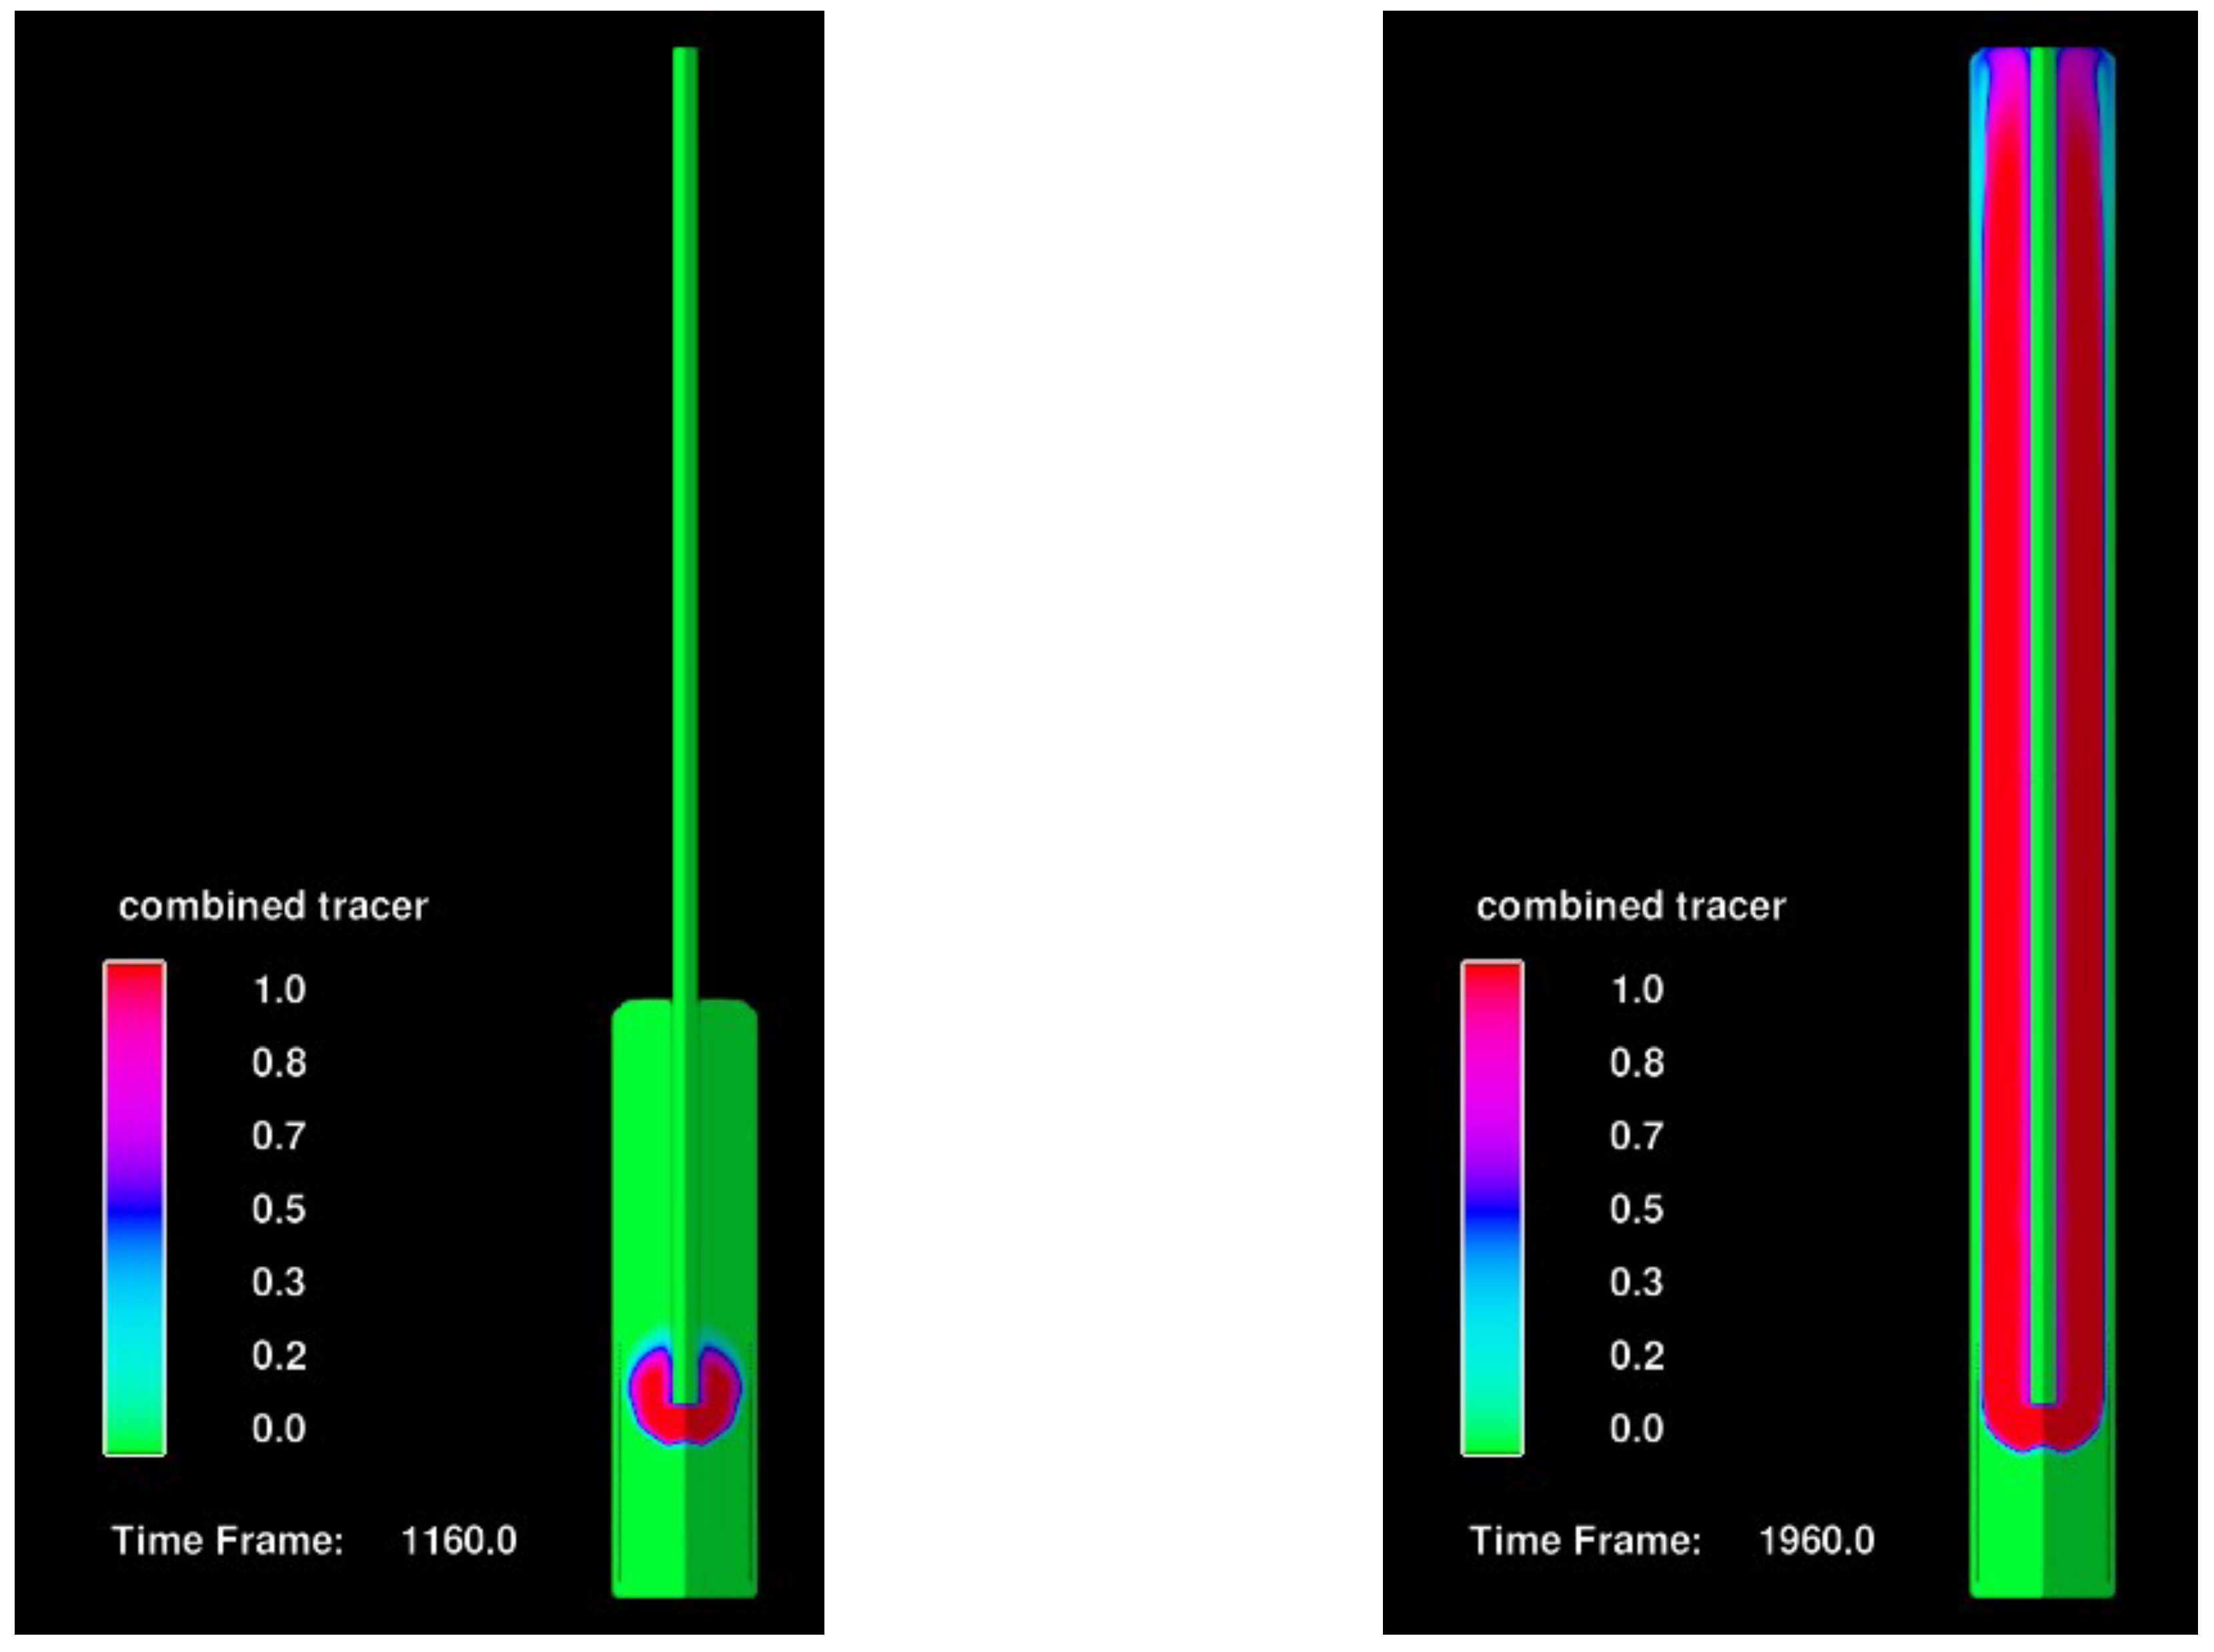
4.3. Effect of Pouring a Concrete A in Concrete B

Figure 12 shows the pouring of a “fresh” concrete A with low/medium yield stress (150 Pa, 30 Pas) and medium viscosity (batch II) in batch I of an “old” concrete B (500 Pa, 75 Pas) with medium yield stress and high viscosity. This case simulates a pouring process of a high thixotropic concrete, which causes a very fast increase of the yield stress and viscosity over time. This property combined, e.g., with a long gap between the infill of batch I and II leads to high differences in the rheological properties of the old and the fresh concrete. Figure 12 to the left shows the casting process 15 s after starting the infill of batch II and Figure 12 to the right after 1125 s. The longer time period for pouring of batch I and batch II in comparison to Figure 10 and Figure 11 is caused by the large difference in the viscosity between the two batches. The green colour represents batch I and the red colour batch II. The colour gradation between green and red symbolises a diffuse border zone between the two batches.
In Figure 12, left, the concrete shows, at the same time as in Figure 11, left, a noticeably smaller bubble around the Tremie pipe outlet, due to the higher restriction to flow of batch II into the “meanwhile stiffer” batch I. Simultaneously the concrete level between the cover zone and the pile centre has a much higher difference. This effect must be caused by a higher flow resistance against batch II in the restricted cover zone, and the relatively unrestricted bulk flow in the centre. The fact, that the material in the cover zone is not displaced in the cover zone at all, as in the two previous simulations, may be caused by a limitation of the software which allows only to use two different fluids. For the second stage the fluid to be replaced is not bentonite in this case but concrete A. As a consequence of the blocking effect of concrete A as supporting fluid, batch I and II in the pile centre show plug flow behaviour (according to [2]) but is however not able to penetrate the porous medium into the cover zone. So the concrete batch II is not able to fill the cover zone for the second stage of the simulation, i.e., over the upper half in the pile centre. Although the earlier discussed step between the centre and the cover zone, which was still simulated with realistic concrete and support fluid properties, would clearly indicate the conditions to enforce inclusions (even if concrete at a higher elevation could “drop down” into the cover zone, it could not completely displace the support fluid), the presented simulation seems not to be accurate in detail. To prove the postulated higher probability for inclusions in such a scenario, the simulation has in future to be repeated with concrete A and bentonite but with application of a thixotropic value for concrete A to simulate the aging process. This is still an ongoing field of research.

4.4. Comparison of the Calculation Time of Reinforced Pile and Pile with Porous Medium

For the simulation of the reinforced bored pile a section of 90° should be used for the calculation for a failure free flow through the cage. For the simulation of a bored pile with the porous medium layer, a section of 5° is sufficient to achieve failure free results of the simulation. For the comparison of the calculation time the pouring of batch I of concrete A is simulated. The reinforced bored pile would need 284,085 s = 3.3 days to calculate a pouring over 450 s. This corresponds to a calculation time of 631 s for 1 s simulated pouring time. For the same pouring time the bored pile with the porous medium needs only 61,206 s = 0.71 days for the calculation which corresponds to a calculation time of 136 s for 1 s simulated pouring time. Therefore, the simulation with a porous medium instead of reinforcement is 4.6 times faster or saves 464% calculation time, respectively.

5. Conclusions

In this paper, the casting of a reinforced bored pile is simulated using a novel porous media approach. The main conclusions are listed below:
  • Using the porous medium approach to model reinforcements, the simulation of concrete flow is 10 times faster. Hence a drastic saving of computational time is achieved;
  • The porous medium approach is accurate and this has been validated and the influence of the rheological parameters have been analysed using the U-Box simulations;
  • Computational simulations of casting of a reinforced pile using the porous media approach showed that after a first batch of casting, subsequent batches of concrete cannot penetrate the reinforcements;
  • After the first batch has been poured, subsequent batches of concrete prefer to rather move vertically against gravity rather than penetrate the reinforcement in the horizontal direction. As a consequence, if the first batch of concrete is less workable (i.e., high viscosity and yield stress), then the risk of the formation of defects in the cover zone is highly likely due to the flow resistance induced by the reinforcements;
  • To improve the accuracy of the simulation, the thixotropy of concrete, i.e., the time-dependent evolution of the rheological properties of concrete must be considered.

Author Contributions

Conceptualization, T.K., D.W., K.B., F.G.; methodology, T.K., D.W.; software, F.G.; validation, D.W., F.G.; formal analysis, F.G.; investigation, T.K., D.W., K.B., F.G., J.J.T.; resources, C.G.; data curation, T.K., F.G.; writing—original draft preparation, D.W., F.G.; writing—review and editing, T.K., K.B., C.G., J.J.T.; visualization, F.G., J.J.T.; supervision, T.K., D.W.; project administration, T.K.; funding acquisition, K.B., C.G. All authors have read and agreed to the published version of the manuscript.

Funding

This research received no external funding.

Institutional Review Board Statement

Not applicable.

Informed Consent Statement

Not applicable.

Data Availability Statement

Not applicable.

Conflicts of Interest

The authors declare no conflict of interest.

Abbreviations

The following abbreviations are used in this manuscript:
CFDComputational Fluid Dynamics
PMPorous Medium

References

  1. Larish, M. Fundamental Mechanisms of Concrete Bleeding in Bored Piles. In Proceedings of the Concrete 2019 Conference, Sydney, Australia, 8–11 September 2019; pp. 8–11. [Google Scholar]
  2. EFFC/DFI-Concrete-Task-Group. Guide to Tremie Concrete for Deep Foundations. 2018. Available online: https://www.effc.org/content/uploads/2018/08/EFFC_DFI_Tremie_Concrete_Guide_2nd-Edition_2018_Final_rev2_28-08-18.pdf (accessed on 1 September 2018).
  3. Larisch, M. Concrete defects in bored piles as a result of insufficient applications of chemical admixtures. In Proceedings of The NZ Concrete Industry Conference, Dunedin, New Zealand, 10–12 October 2019. [Google Scholar]
  4. Liu, H.; Liu, W.; Sui, S.; Xu, H.; Wang, J. Dynamic monitoring technique of bored pile pouring process based on multi-frequency ultrasound. J. Civ. Struct. Health Monit. 2022, 12, 411–425. [Google Scholar] [CrossRef]
  5. Mechtcherine, V.; Gram, A.; Krenzer, K.; Schwabe, J.H.; Shyshko, S.; Roussel, N. Simulation of fresh concrete flow using Discrete Element Method (DEM): Theory and applications. Mater. Struct. 2014, 47, 615–630. [Google Scholar] [CrossRef]
  6. Cui, W.; Ji, T.; Li, M.; Wu, X. Simulating the workability of fresh self-compacting concrete with random polyhedron aggregate based on DEM. Mater. Struct. 2017, 50, 92. [Google Scholar] [CrossRef]
  7. Ramyar, E.; Cusatis, G. Discrete Fresh Concrete Model for Simulation of Ordinary, Self-Consolidating, and Printable Concrete Flow. J. Eng. Mech. 2022, 148, 04021142. [Google Scholar] [CrossRef]
  8. Xu, Z.; Li, Z.; Jiang, F. The applicability of SPH and MPS methods to numerical flow simulation of fresh cementitious materials. Constr. Build. Mater. 2021, 274, 121736. [Google Scholar] [CrossRef]
  9. Roussel, N.; Gram, A. Simulation of fresh concrete flow. In RILEM State-of-the-Art Reports; Springer: Dordrecht, The Netherlands, 2014; Volume 15. [Google Scholar]
  10. De Schryver, R.; El Cheikh, K.; Lesage, K.; Yardimci, M.Y.; De Schutter, G. Numerical Reliability Study Based on Rheological Input for Bingham Paste Pumping Using a Finite Volume Approach in OpenFOAM. Materials 2021, 14, 5011. [Google Scholar] [CrossRef] [PubMed]
  11. Roussel, N.; Geiker, M.R.; Dufour, F.; Thrane, L.N.; Szabo, P. Computational modeling of concrete flow: General overview. Cem. Concr. Res. 2007, 37, 1298–1307. [Google Scholar] [CrossRef] [Green Version]
  12. Vasilic, K.; Gram, A.; Wallevik, J.E. Numerical simulation of fresh concrete flow: Insight and challenges. RILEM Tech. Lett. 2019, 4, 57–66. [Google Scholar] [CrossRef]
  13. Larisch, M.; Qin, Z.; Alehossein, H. Performance control tests and numerical simulations for concrete in deep foundations. Concr. Aust. 2013, 39, 26–34. [Google Scholar]
  14. Grandstrand, O. New findings concerning the spreading of fresh concrete in bored piles. In Insights and Innovations in Structural Engineering, Mechanics and Computation; Zingoni, A., Ed.; CRC PRess: London, UK, 2016; Chapter 349; pp. 2116–2121. [Google Scholar]
  15. Wilkes, C. Modelling Tremie Concrete Placement in Deep Foundations. Ph.D. Thesis, University of Cambridge, Cambridge, UK, 2021. [Google Scholar]
  16. Vasilic, K.; Meng, B.; Kühne, H.C.; Roussel, N. Flow of fresh concrete through steel bars: A porous medium analogy. Cem. Concr. Res. 2011, 41, 496–503. [Google Scholar] [CrossRef]
  17. Vasilic, K.; Schmidt, W.; Kühne, H.C.; Haamkens, F.; Mechtcherine, V.; Roussel, N. Flow of fresh concrete through reinforced elements: Experimental validation of the porous analogy numerical method. Cem. Concr. Res. 2016, 88, 1–6. [Google Scholar] [CrossRef]
  18. Roussel, N. Correlation between yield stress and slump: Comparison between numerical simulations and concrete rheometers results. Mater. Struct. 2006, 39, 501–509. [Google Scholar] [CrossRef]
  19. Roussel, N.; Coussot, P. ’Fifty-cent rheometer’ for yield stress measurements: From slump to spreading flow. J. Rheol. 2005, 49, 705–718. [Google Scholar] [CrossRef]
  20. Roussel, N.; Staquet, S.; Schwarzentruber, L.A.; Le Roy, R.; Toutlemonde, F. SCC casting prediction for the realization of prototype VHPC-precambered composite beams. Mater. Struct. 2007, 40, 877–887. [Google Scholar] [CrossRef]
  21. De Larrard, F.; Ferraris, C.; Sedran, T. Fresh concrete: A Herschel-Bulkley material. Mater. Struct. 1998, 31, 494–498. [Google Scholar] [CrossRef]
  22. Tattersall, G.H.; Banfill, P.F. The Rheology of Fresh Concrete; Number Monograph; Pitman Advanced Pub. Program: MI, USA, 1983. [Google Scholar]
  23. Roussel, N. Understanding the Rheology of Concrete; Elsevier: Amsterdam, The Netherlands, 2011. [Google Scholar]
  24. Vasilić, K. A Numerical Model for Self-Compacting Concrete Flow through Reinforced Sections: A Porous Medium Analogy. Ph.D. Thesis, Bundesanstalt für Materialforschung und-prüfung (BAM), Berlin, Germany, 2016. [Google Scholar]
  25. Manual, F.U. Flow3D User Manual, v9.3; Flow Science Inc.: Santa Fe, NM, USA, 2011; pp. 97–99. [Google Scholar]
  26. Tamayol, A.; Bahrami, M. Transverse permeability of fibrous porous media. Phys. Rev. E 2011, 83, 046314. [Google Scholar] [CrossRef] [PubMed] [Green Version]
  27. Tamayol, A.; Bahrami, M. Analytical determination of viscous permeability of fibrous porous media. Int. J. Heat Mass Transf. 2009, 52, 2407–2414. [Google Scholar] [CrossRef]
  28. Kränkel, T. Rheology and Workability Testing of Deep Foundation Concrete in Europe and the US. 2018. Available online: https://www.effc.org/content/uploads/2018/08/R_D_Report_draft-2018.pdf (accessed on 1 September 2019).
Figure 1. Faults in the cover zone due to incomplete filling as a possible result of highly reinforced cages or insufficient workability, i.e., rheological behaviour of the concrete (Bauer Spezialtiefbau GmbH).
Applmech 03 00028 g001
Figure 2. Reinforcement in bored pile: left: horizontal cross section (dimensions in mm); right: clearance width (0.04 m × 0.05 m) of the rebars in the reinforcement cage (dimensions in mm).
Applmech 03 00028 g002
Figure 3. Target values for dynamic yield stress (left) and plastic viscosity (right) of Tremie concrete for good form filling properties from experimental measurements, acc. to [2,28].
Applmech 03 00028 g003
Figure 4. left: Dimension of the U-Box, right: Reinforcement located in the centre of the horizontal section of the U-box with centered rebars (dimensions in mm).
Applmech 03 00028 g004
Figure 5. U-box with concrete (grey colour): left: initial state and right: state after simulation with levelled concrete (dimensions in mm).
Applmech 03 00028 g005
Figure 6. U-box simulation with comparison between reinforcement and porous medium (PM) with varying thickness.
Applmech 03 00028 g006
Figure 7. U-box simulation with varying yield stress.
Applmech 03 00028 g007
Figure 8. U-box simulation with varying viscosity.
Applmech 03 00028 g008
Figure 9. Longitudinal cross section of the bored pile (dimensions in m).
Applmech 03 00028 g009
Figure 10. Bored pile simulation: low yield stress in low yield stress concrete, left after 15 s and right after 450 s after start to fill in batch II.
Applmech 03 00028 g010
Figure 11. Bored pile simulation: high yield stress in high yield stress concrete, left 15 s and right 835 s after start to infill batch II.
Applmech 03 00028 g011
Figure 12. Simulation bored pile: low yield stress in high yield stress concrete, left: 35 s and right 1125 s after start to infill batch II.
Applmech 03 00028 g012
Table 1. List of yield stress and viscosity variations used in the simulations.
VariationYield Stress [Pa]Viscosity [Pa s]Concrete Used for Bored Pile Simulations
17530-
27550-
315030Concrete A
415050-
515075-
622530-
722550-
830030-
930050-
1050030-
1150050Concrete B
Publisher’s Note: MDPI stays neutral with regard to jurisdictional claims in published maps and institutional affiliations.

