Experimental Investigations on the Temperature Increase of Ultra-High Performance Concrete under Fatigue Loading


1
Institute of Concrete Structures, Technische Universität Dresden, 01069 Dresden, Germany
2
Institute of Concrete and Masonry Structures, Technische Universität Darmstadt, 64289 Darmstadt, Germany
*
Author to whom correspondence should be addressed.
Appl. Sci. 2019, 9(19), 4087; https://doi.org/10.3390/app9194087
Submission received: 30 August 2019
/
Revised: 24 September 2019
/
Accepted: 26 September 2019
/
Published: 30 September 2019
(This article belongs to the Section Civil Engineering)
Abstract
:Leaner, more filigree, and resource-saving constructions are the development goal of the in the building industry. In reinforced concrete construction, a ultra-high strength concrete was developed to achieve these goals. Due to its use and requirements, this very pressure-resistant material is no longer only exposed to static loads. In applications such as wide-span bridges, machine foundations and wind turbines, the susceptibility to vibration is also significant. Research into the fatigue behavior of the new building material is therefore very important. In this article we will discuss the effect of heating up of high performance concretes under fatigue stress. The thesis is that warming up, which was already observed by several research groups, has an influence on the fatigue strength. Changes in the strength of the concrete or residual stresses generated by heating can lead to early failure. The aim is to find the reasons for the heating and the grade of influence on the fatigue strength. A systematic test program was developed to investigate the influencing parameters maximum stress level, frequency, and maximum grain size of the concrete. Thirty fatigue tests were carried out; the results will be presented here. The influence on the temperature increase as well as on the heating rate for the individual parameters will be discussed. The results show that all three discussed parameters have a significant influence on the temperature rise. Whereas the maximum temperature reached depends strongly on the frequency, the other two parameters mainly influence the heating rate.
1. Introduction
The development towards increasingly larger and leaner buildings and the focus on resource-saving construction are placing new requirements on building materials. Long-span bridges or wind turbines not only require higher material strengths to carry the static loads but must also be able to resist the increasing demands of system-related vibrations. High performance (HPC) and ultra-high performance (UHPC) concretes have been developed for reinforced concrete construction to increase material efficiency. The stresses of the material require a comprehensive state of knowledge of the fatigue behavior of the material. This has already been investigated by various researchers [1,2,3,4,5,6,7,8,9]. When determining fatigue strengths and creating Wöhler curves, for example, tests according to [10] are recommended in Germany. A large number of required load changes can be achieved with high frequencies so that the attempts do not take too long. In previous investigations of UHPC and HPC samples, the warming up of the specimens was measured [11,12,13,14,15,16]. For normal concrete, however, no heating has been measured so far, which is the reason why the effect has not yet been studied in such detail. Normal concrete is generally less well packed and has significantly more pores inside due to the higher water–cement ratio. As a result, the internal friction potential under a pressure-swelling load is significantly lower. This internal friction between binder and aggregate is assumed to be the reason for the heating. A summary of the state of knowledge for the heating phenomenon is given in [17] as a basis for the investigations. This article deals with this effect related to UHPC. The hypothesis is that the additional specimen heating has a significant influence on the fatigue strength of high performance concretes. An influence on the fatigue strength during the tests would lead to a frequency-dependent reduction in the possible number of load cycles of the concretes if standard values were to be created. Furthermore, it will be interesting in the future which frequencies become relevant in praxis and whether the effect is then not only a test-related influence, but can even become decisive for the application.
The aim was to conduct a parameter study to find out what causes the temperature increase. In further steps the influence on the fatigue strength was to be determined. For this purpose, tests were carried out in which the load-related parameters frequency and related maximum stress level were varied. In addition, two concretes with different mixtures and similar compressive strength were used to determine the influence of aggregates of different sizes.
2. Materials and Methods
2.1. Experimental Program
For the development of a systematic test program it is necessary to know the state of knowledge, which was already summarized in [17]. Parameters with an influence on the heating of UHPC were identified from results of previous investigations [11,12,13]. The ideas were also confirmed by other publications such as [14,15,16]. In summary, it can be concluded that the parameters for a systematic investigation are the frequency, the maximum stress level, the specimen size, the maximum grain size of the concrete, and the concrete strength. In Table 1, the test program is summarized. The attempts that have already been carried out and evaluated are listed. Thus far, the load-dependent parameters frequency and maximum stress level with three variants each as well as two high performance concretes with different maximum grain sizes have been investigated. The minimum related stress level was not varied in this research project and is constant at 10% of the mean concrete strength.
2.2. Materials and Specimen Geometry
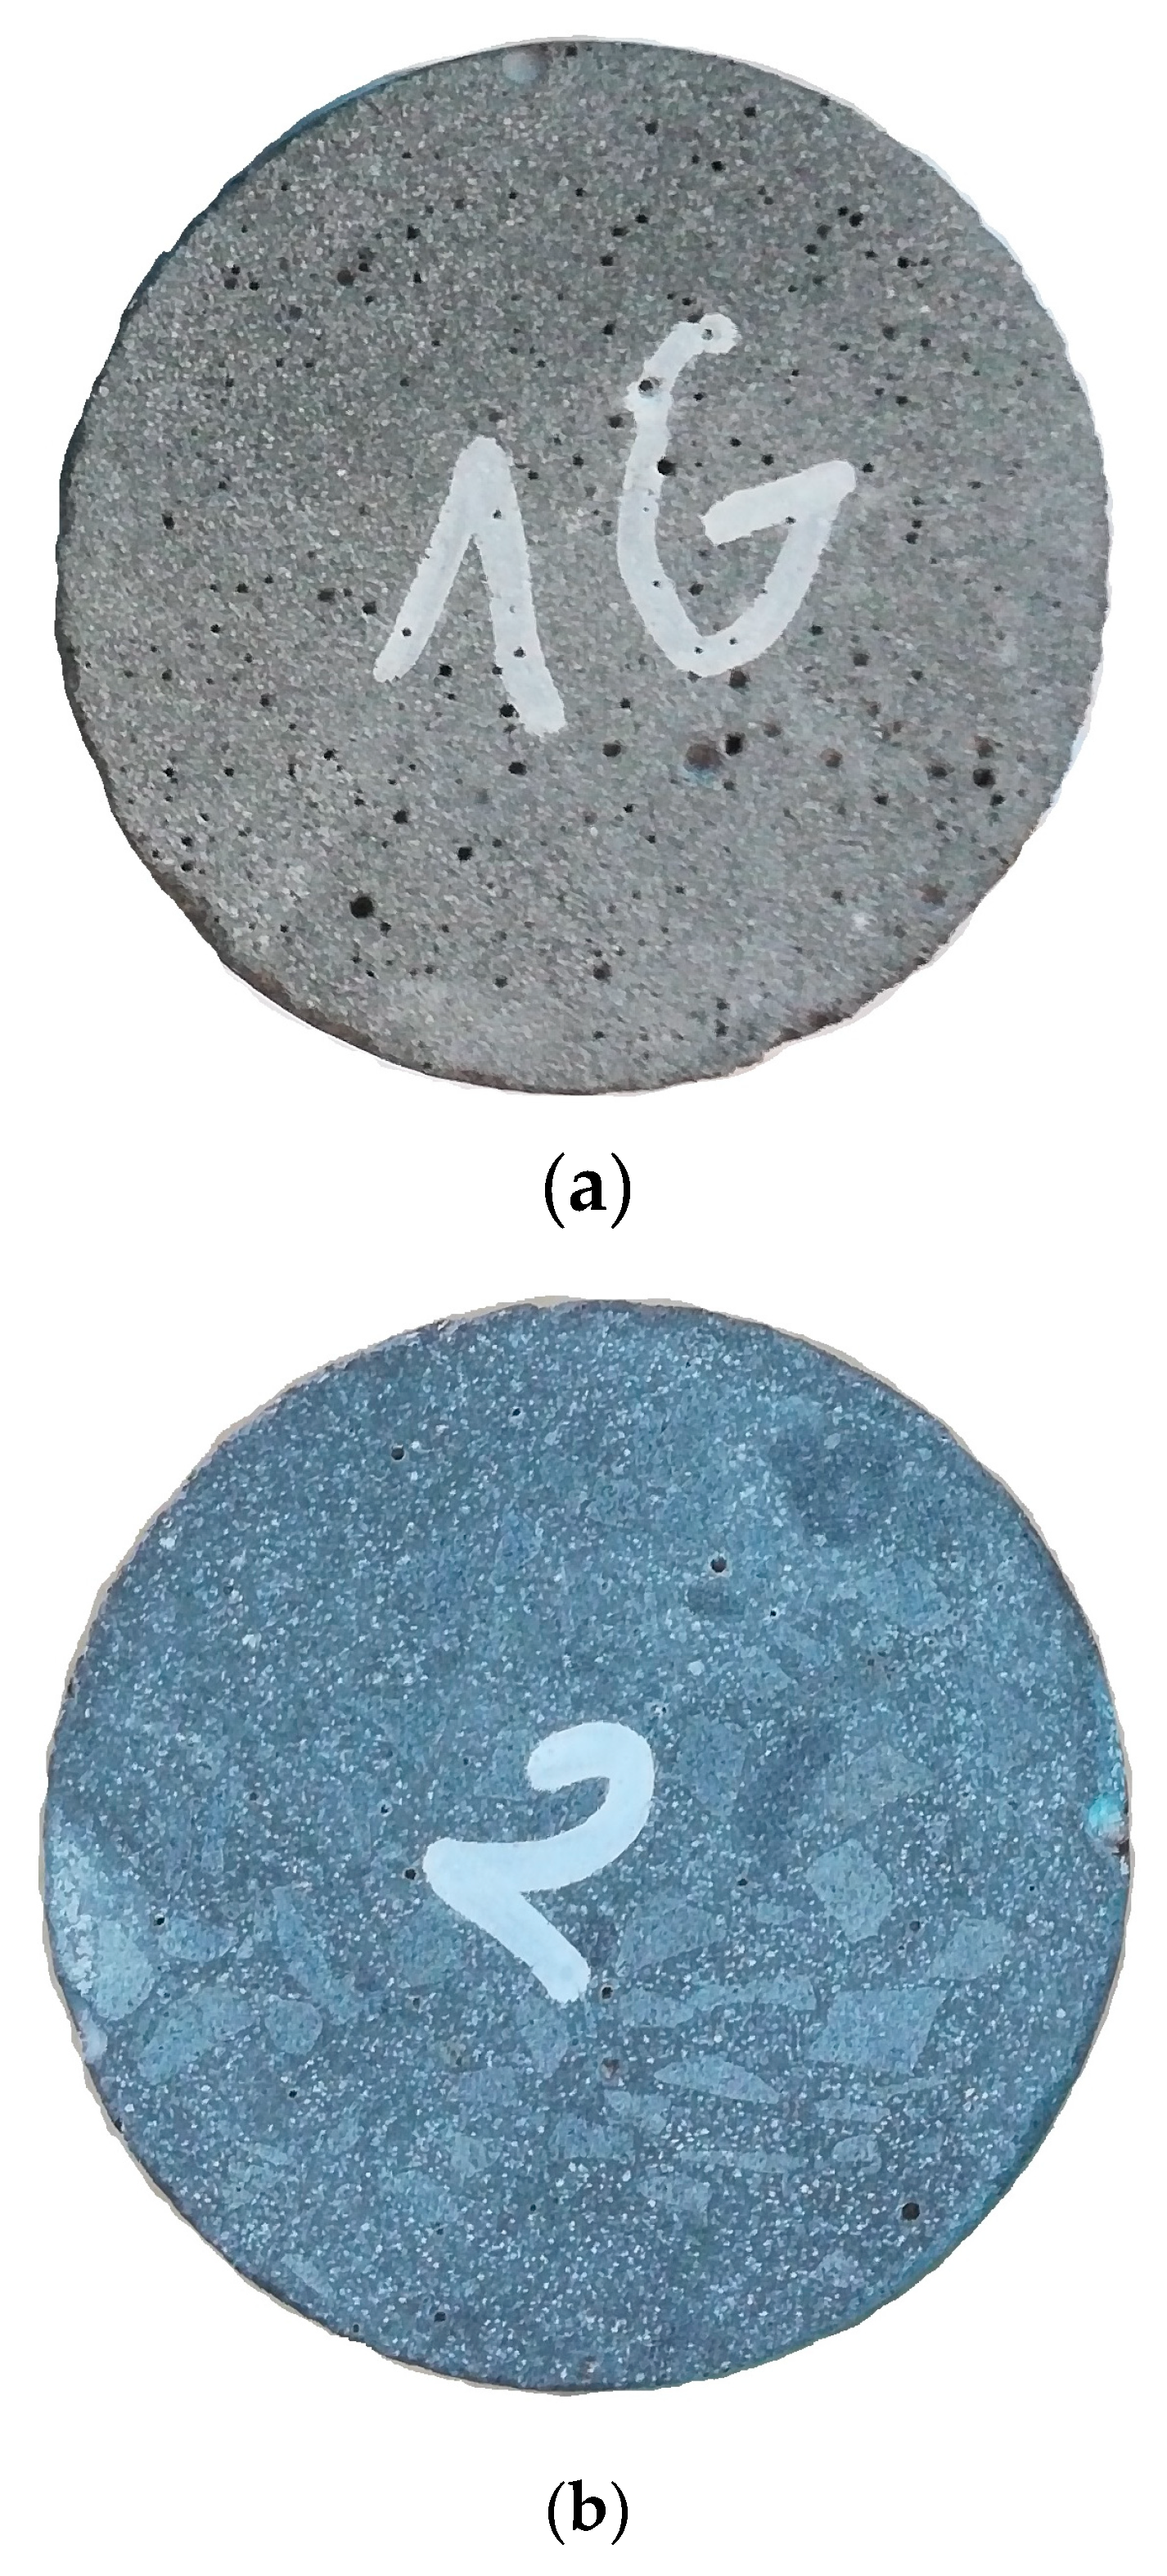
The experiments were performed with two UHPC. Both had a similar composition and strength. The only difference was the maximum grain size used, the influence of which on heating was to be investigated. Information on the composition and the static strength values of the two high performance concretes used can be found in Table 2. More detailed information on the material used can be found in the Appendix A, Table A1. Figure 1 shows examples of cross-sections of cylindrical specimens of both mixtures.
The strength after 28 days was determined according to DIN EN 12390 [18] on 150/300 mm cylinders. However, the strength development of the concrete has not been completed at this time. In order to be able to assume the same reference strengths in successive tests over a longer period of time, the strength development was investigated for both UHPC. The mean strength was largely constant from 90 days as already shown in [17,19] which was thus also determined as the minimum age for all concrete samples for the fatigue tests.
Cylinder geometry with a ratio between diameter and height of 1/3 was used for the fatigue tests which was recommended by [10] for the standardization of fatigue tests on concrete subjected to compressive loading. The strength development, the reference strength and the fatigue tests were performed with the same specimen geometry. A diameter of 60 mm and a height of 180 mm were selected. This geometry allows a multitude of comparisons with previous projects, such as [1,2,8,13]. This size is also the geometry behind the current Wöhler curves of the fib Model Code 2010 [20].
2.3. Specimen’s Preparation and Application
All specimens of each UHPC for the fatigue tests as well as for the determination of the reference strength were manufactured in one batch to minimize manufacturing differences. After concreting, each test specimen was stored for one day in the formwork [19], and then for the first week in water. After the water-storage, the specimens were stored in a climatic chamber at a constant temperature of 20 °C and a relative humidity of 65% until the test. Before the tests, the cylinders were sawn to 180 mm length and the loading surfaces were ground plane-parallel.
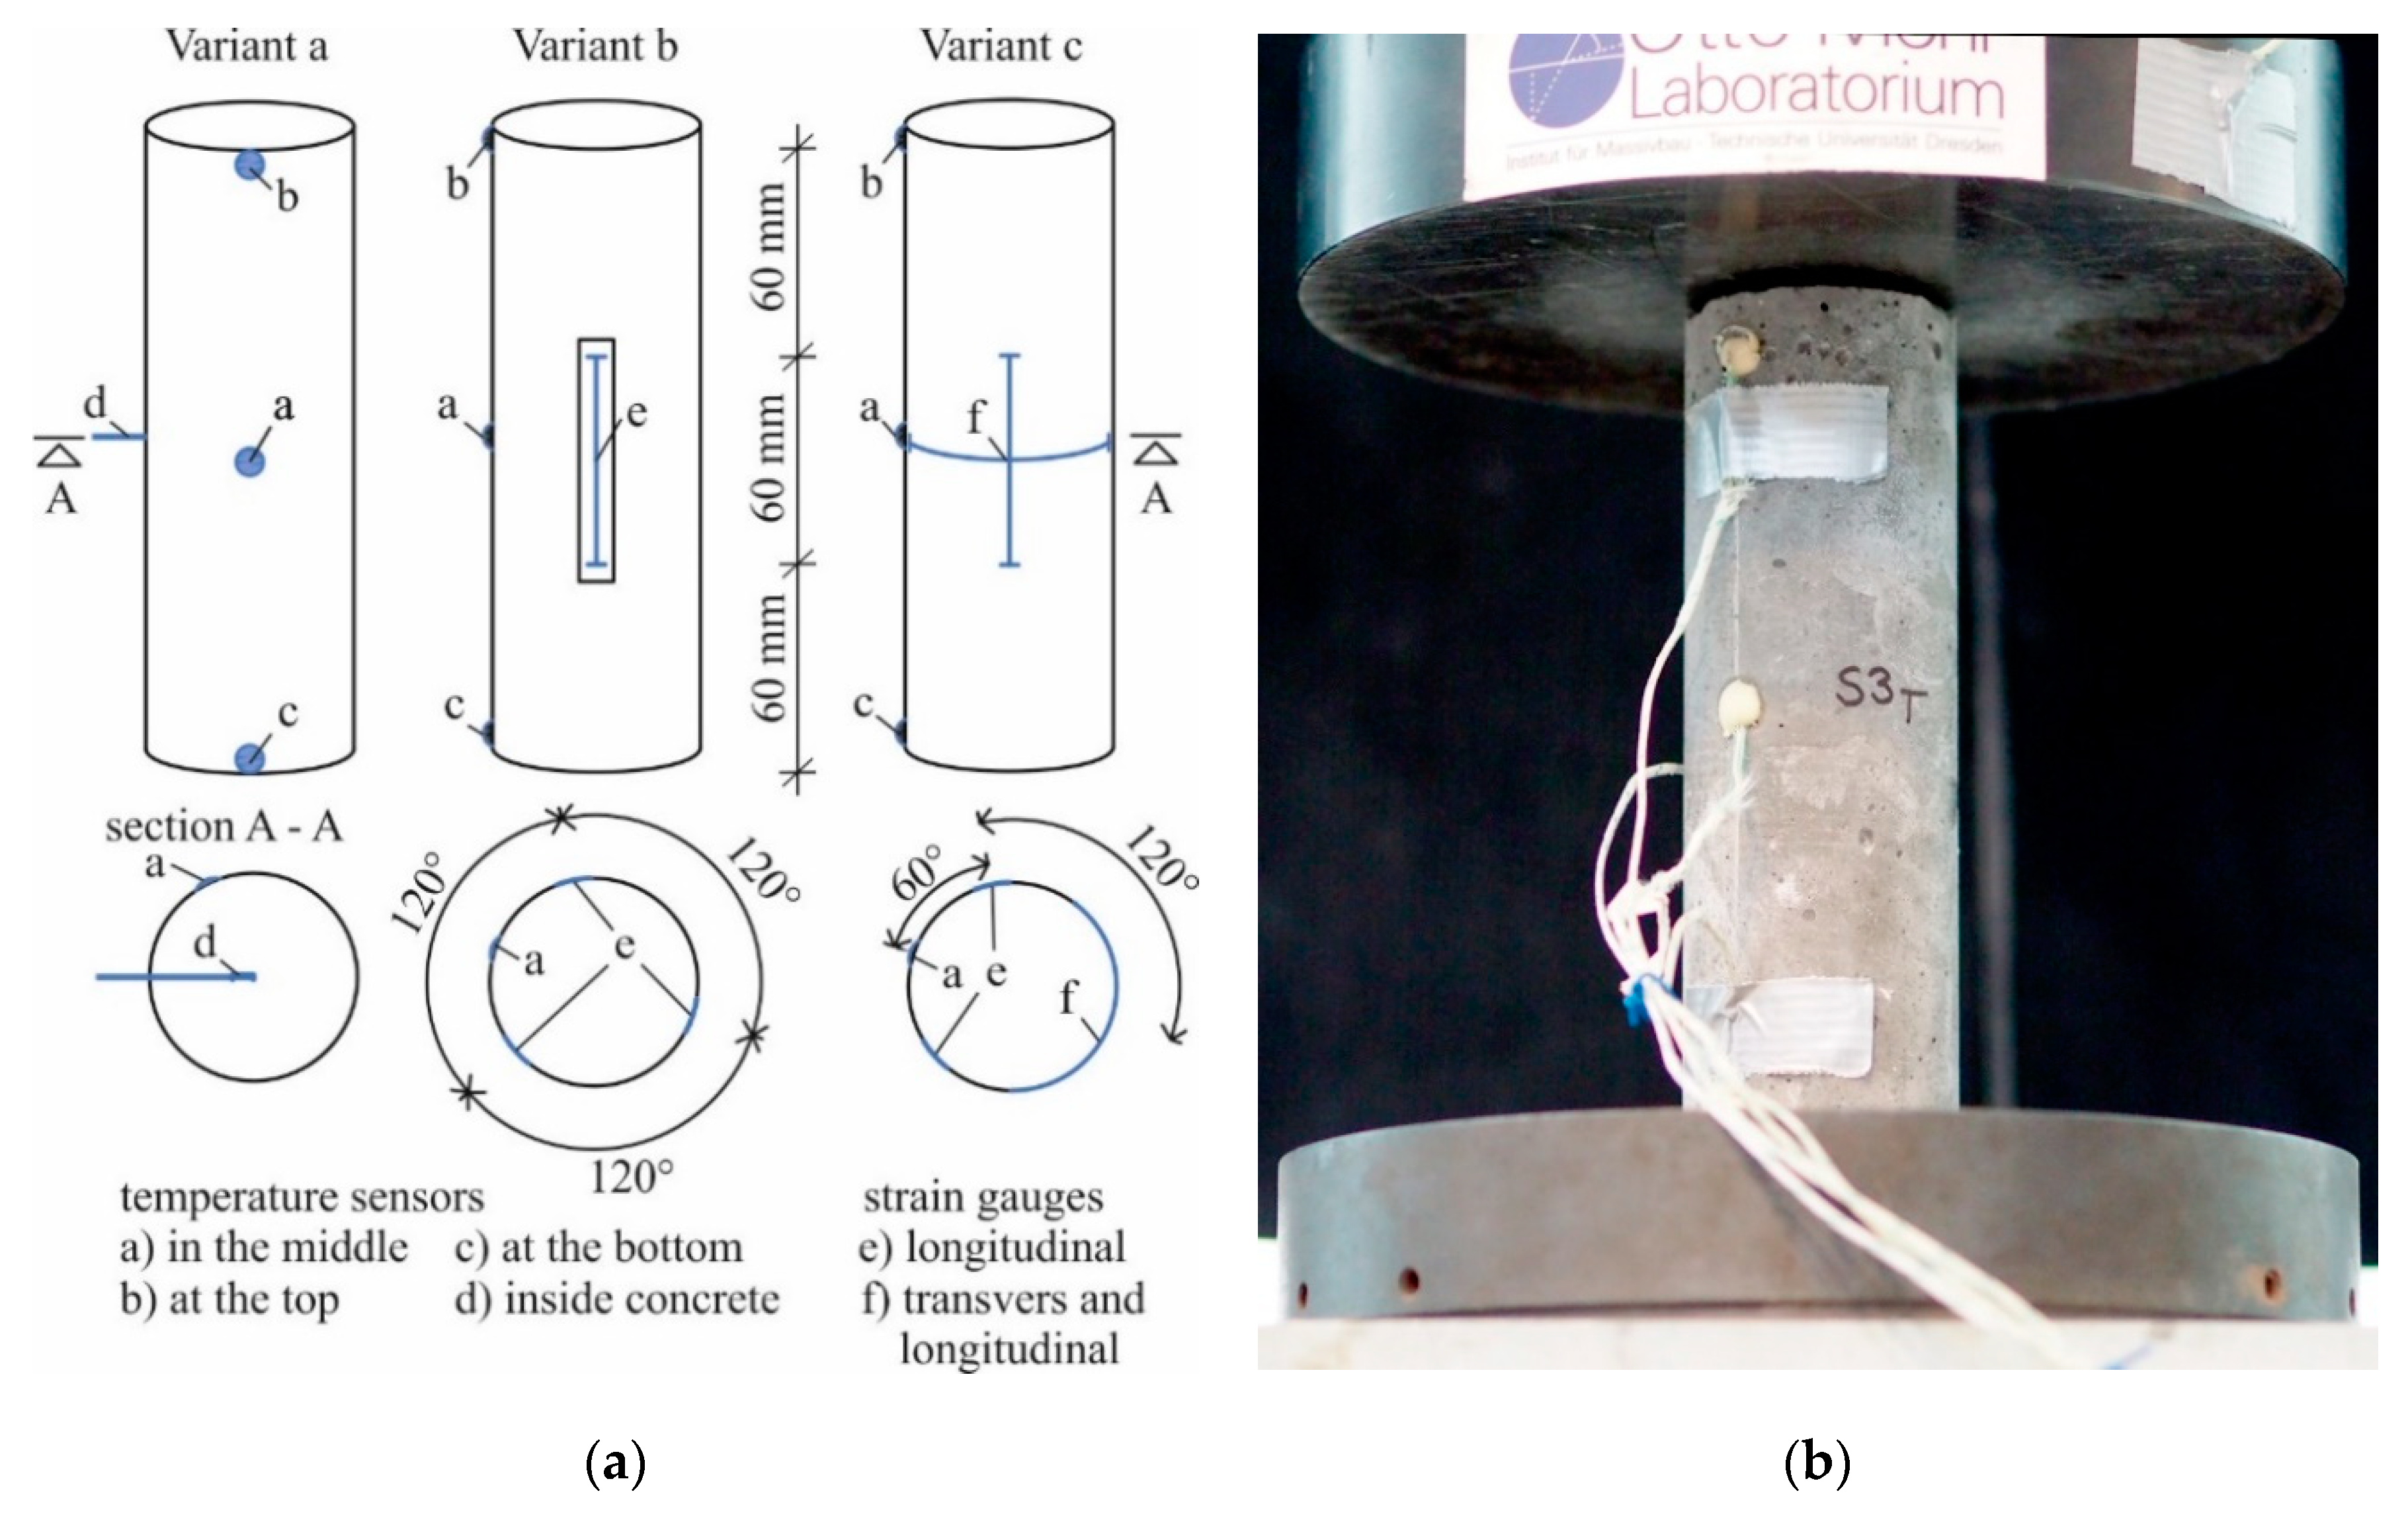
Additionally to the measurement of the machine force, the machine displacement and the number of cycles, we measured the longitudinal strain and the temperature development. Three test specimens were provided per parameter configuration. In order to be able to record all necessary measurement data well, three different configurations were chosen accordingly. The three variants are shown in Figure 2.
The temperature development over the test period was measured at all specimens. For this purpose, temperature sensors were glued on the surface of the specimen at three positions: at the sample’s top, in the middle and at the bottom. In order to detect external influences, the temperature at the load introduction of the testing machine and the ambient temperature were also measured during each test. With a maximum duration of 7 days, the influence of the changing night and day temperature was clearly visible. In order to be able to measure a temperature development also inside the concrete, a temperature sensor was embedded in the center of gravity of the test specimen according to Variant a in Figure 2. The aim was to detect temperature gradients in the concrete by determining the difference between the outside and the center of the cross-section. In the Variants b and c, the longitudinal strain was recorded additional. For this purpose, three 60 mm long strain gauges PL60 (preusser-messtechnik GmbH) were glued to the surface with a distance of 120° (angle in the cross-section). In Variant c, a cross strain gauge was placed instead of one of the longitudinal strain gauges. This allowed the recording of the transverse strain; the measuring length was also 60 mm.
2.4. Test Setup
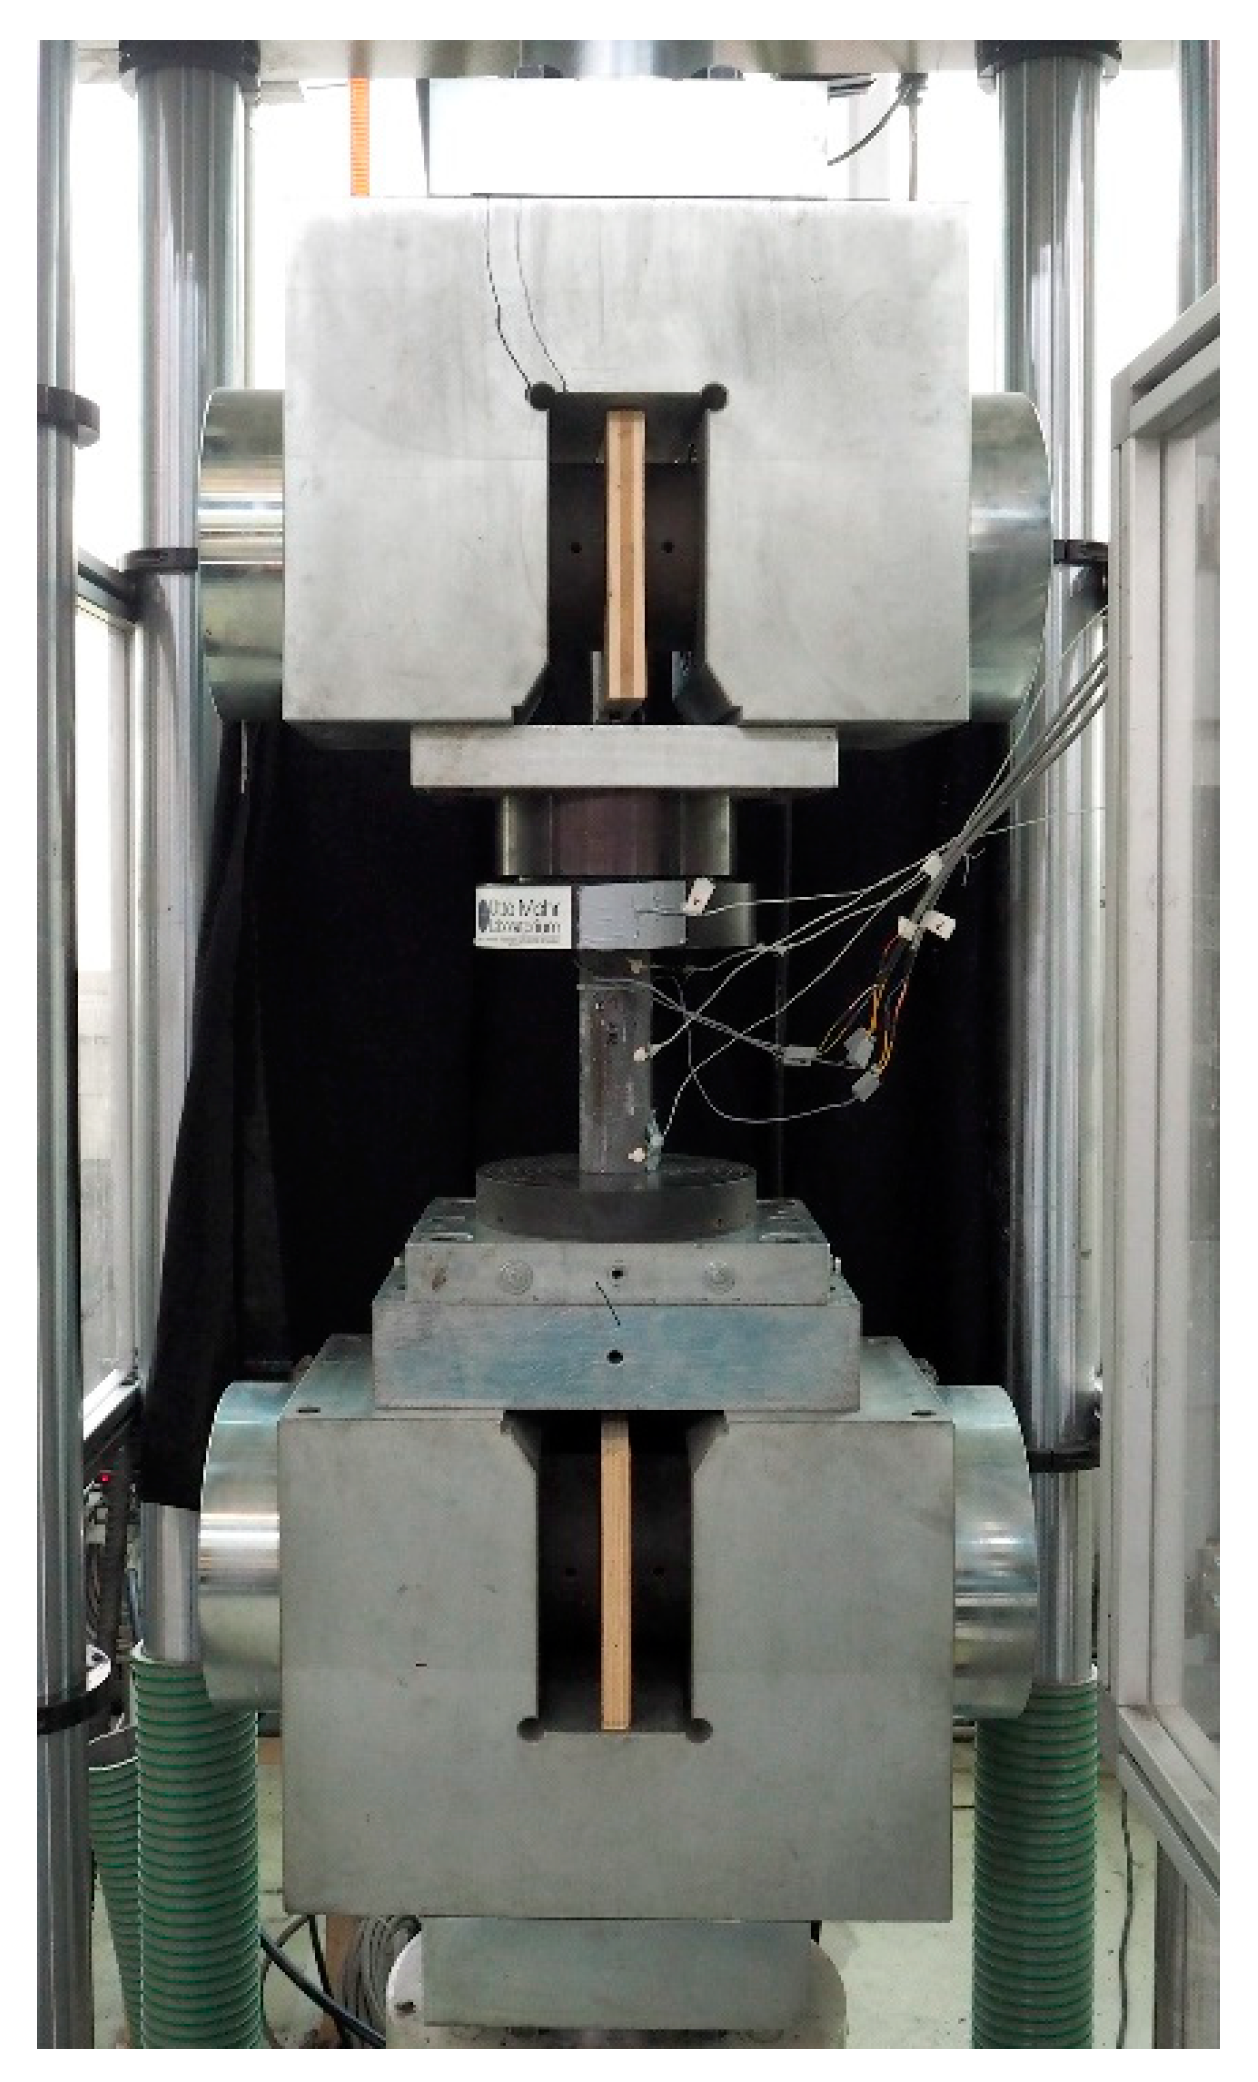
The tests were carried out using the servo-hydraulic testing machines Schenck Hydropuls PSB (maximum load: 1.0 MN) for the test with 3 Hz and 10 Hz and the universal 2.5 MN machine for the 20 Hz trials. First, the middle stress level was set statically. Afterwards the fatigue load was applied with a sinusoidal curve. The data collection took place continuously with a speed of 100 Hz (tests with 3 Hz), 200 Hz (10 Hz) and 400 Hz (20 Hz). Thus, at least 20 measured values were obtained per load cycle. If the fatigue tests reached a load cycle number of 2 million, the trials were stopped because no change in temperature development could be detected (break-off criterion, see Section 3.2). Figure 3 shows a sample made of UHPC 1 in the servo-hydraulic testing machine.
3. Results
3.1. Heating Process in a Test Specimen
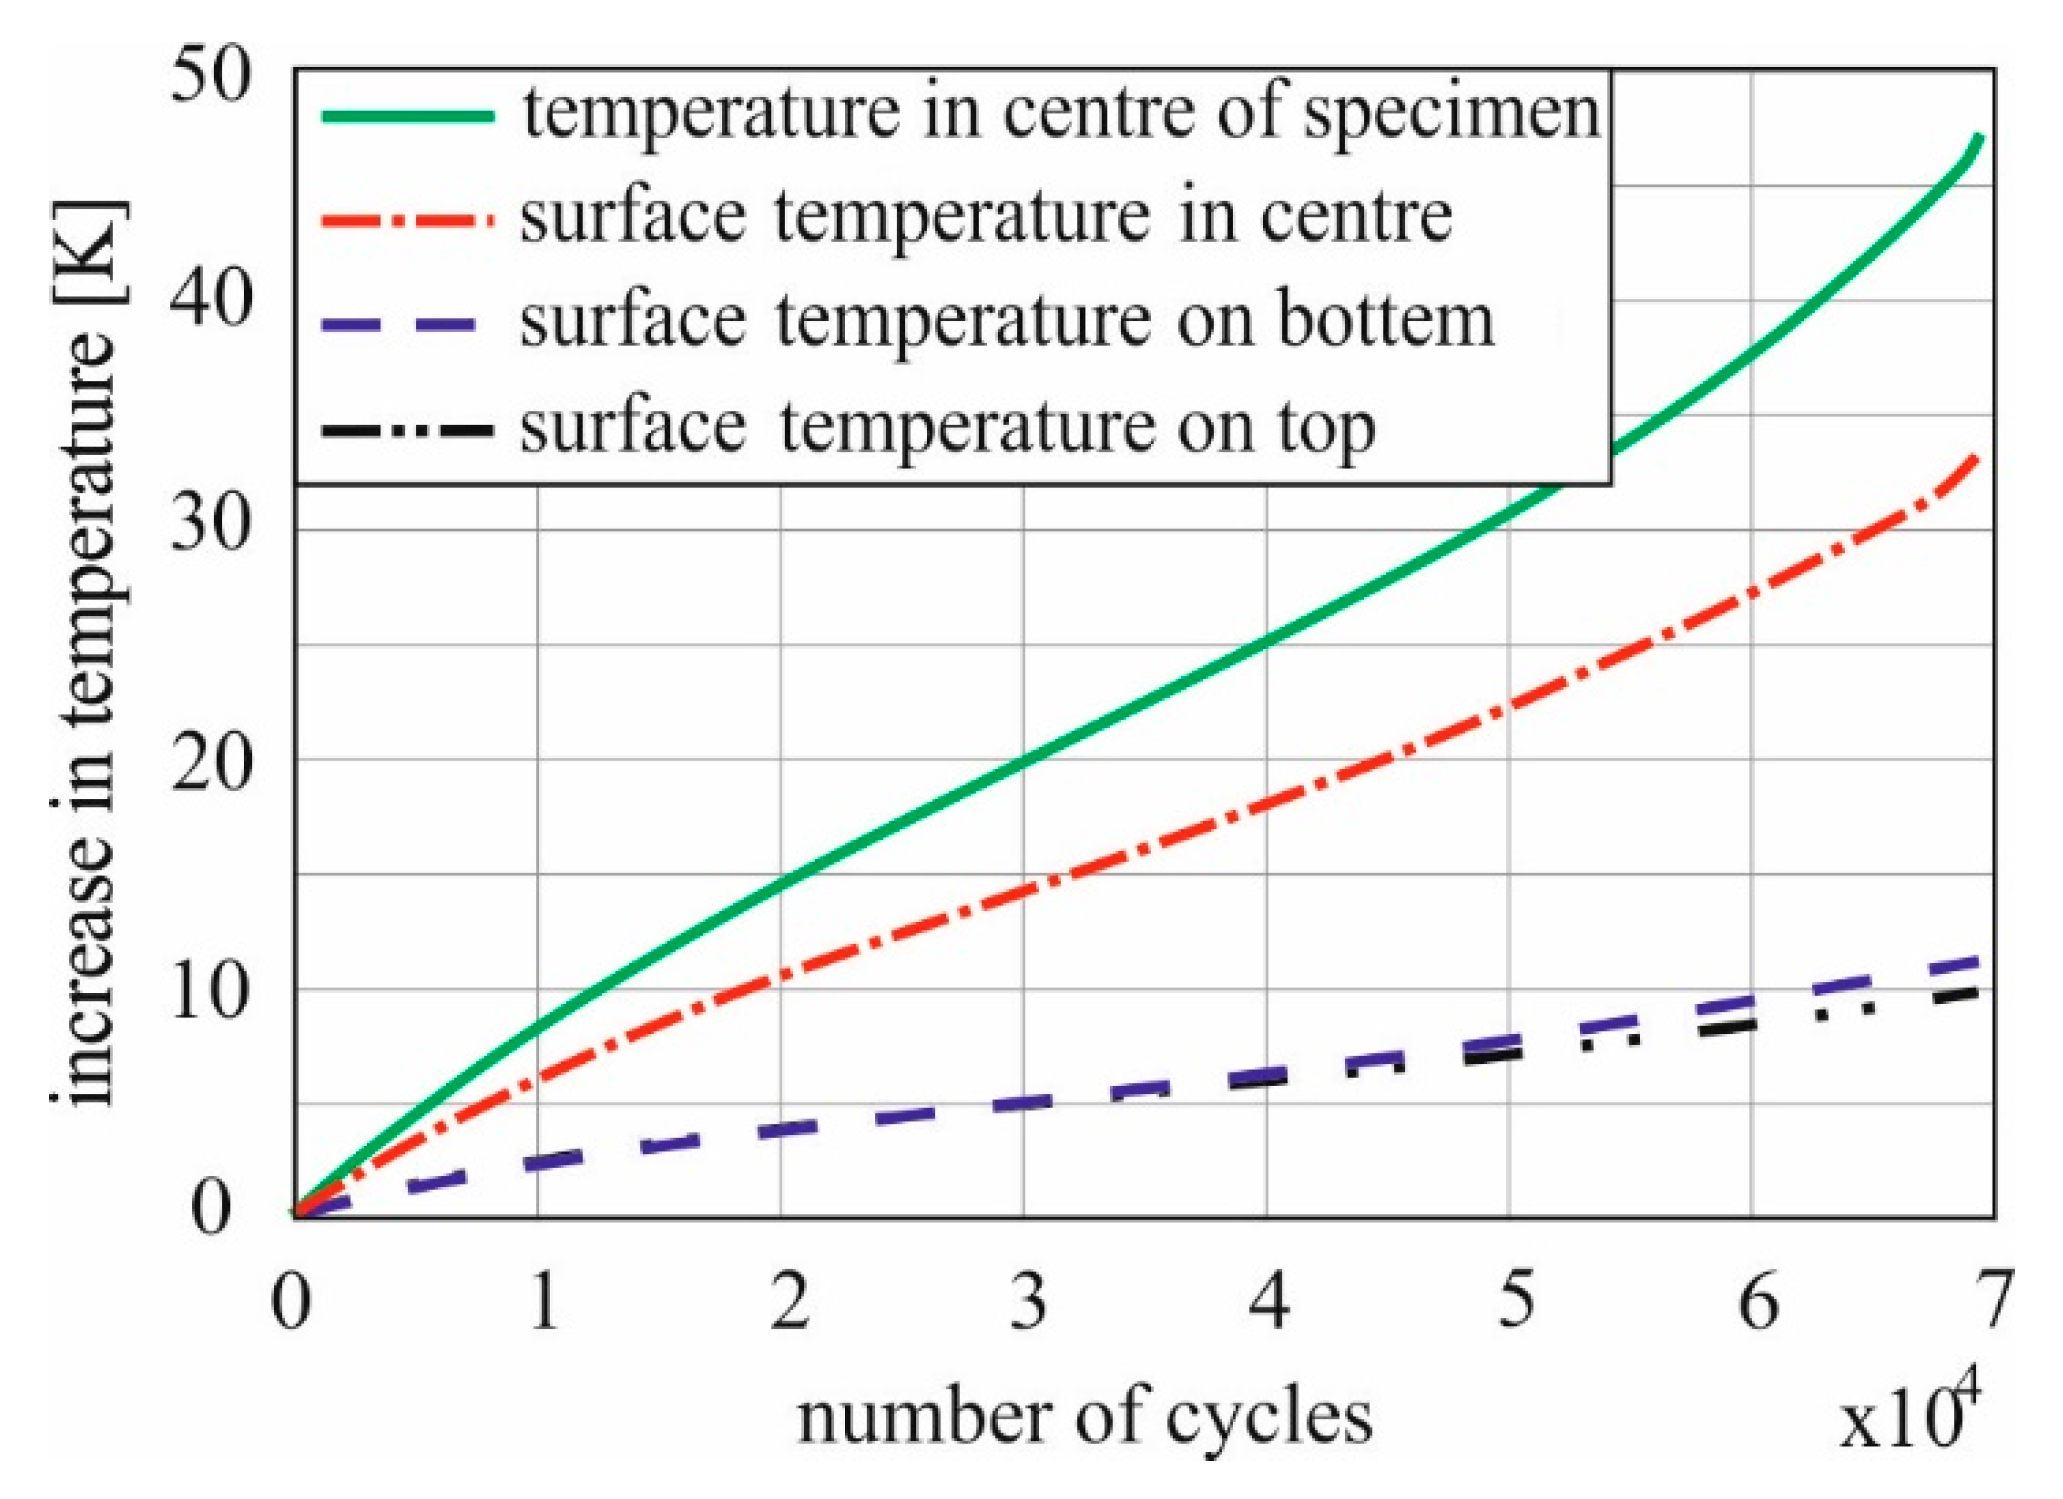
By measuring at four points on and in the concrete, the heating process can be described over the test duration for the specimen. The diagram in Figure 4 illustrates the course of the heating curves as an example for one test. The figure shows a sample of the UHPC 1 tested at a test frequency of 10 Hz and a related maximum stress level of 70%. The four curves display the temperature differences reached at the four measuring points via the test. The influences of the surrounding temperature and the temperature induced by the testing machine have already been eliminated here and in the following temperature curves. Only the warming of the concrete due to fatigue stress is shown.
The diagram shows an increase in temperature at all measuring points plotted over the number of load cycles. The maximum value was measured with 47 K inside the sample. It was reached immediately before failure after 72.588 load cycles. The same characteristic displays the curve on the surface in the middle of the height of the specimen (red line). However, the temperatures reached at this point were lower. This resulted in a temperature difference in the cross-section between the center and the surface. This difference increased over the entire duration of the test until failure. It reached a maximum value of 13 K at a radius of 30 mm. The increases at the bottom and at the upper end of the specimen were significantly lower and very similar to each other. From this it can be seen that the warming up during fatigue loading is generated most strongly in the middle of the specimens. The difference between the internal measuring point and the surface is caused by the transfer of the temperature to the environment, which is hampered inside. The influence of the used testing machine on the temperature development was negligible low.
For UHPC 2, curves with the same characteristics were recorded at the same configuration, whereby the achieved number of load cycles and temperature values varied.
3.2. Temperature Rise Under Parameter Variation
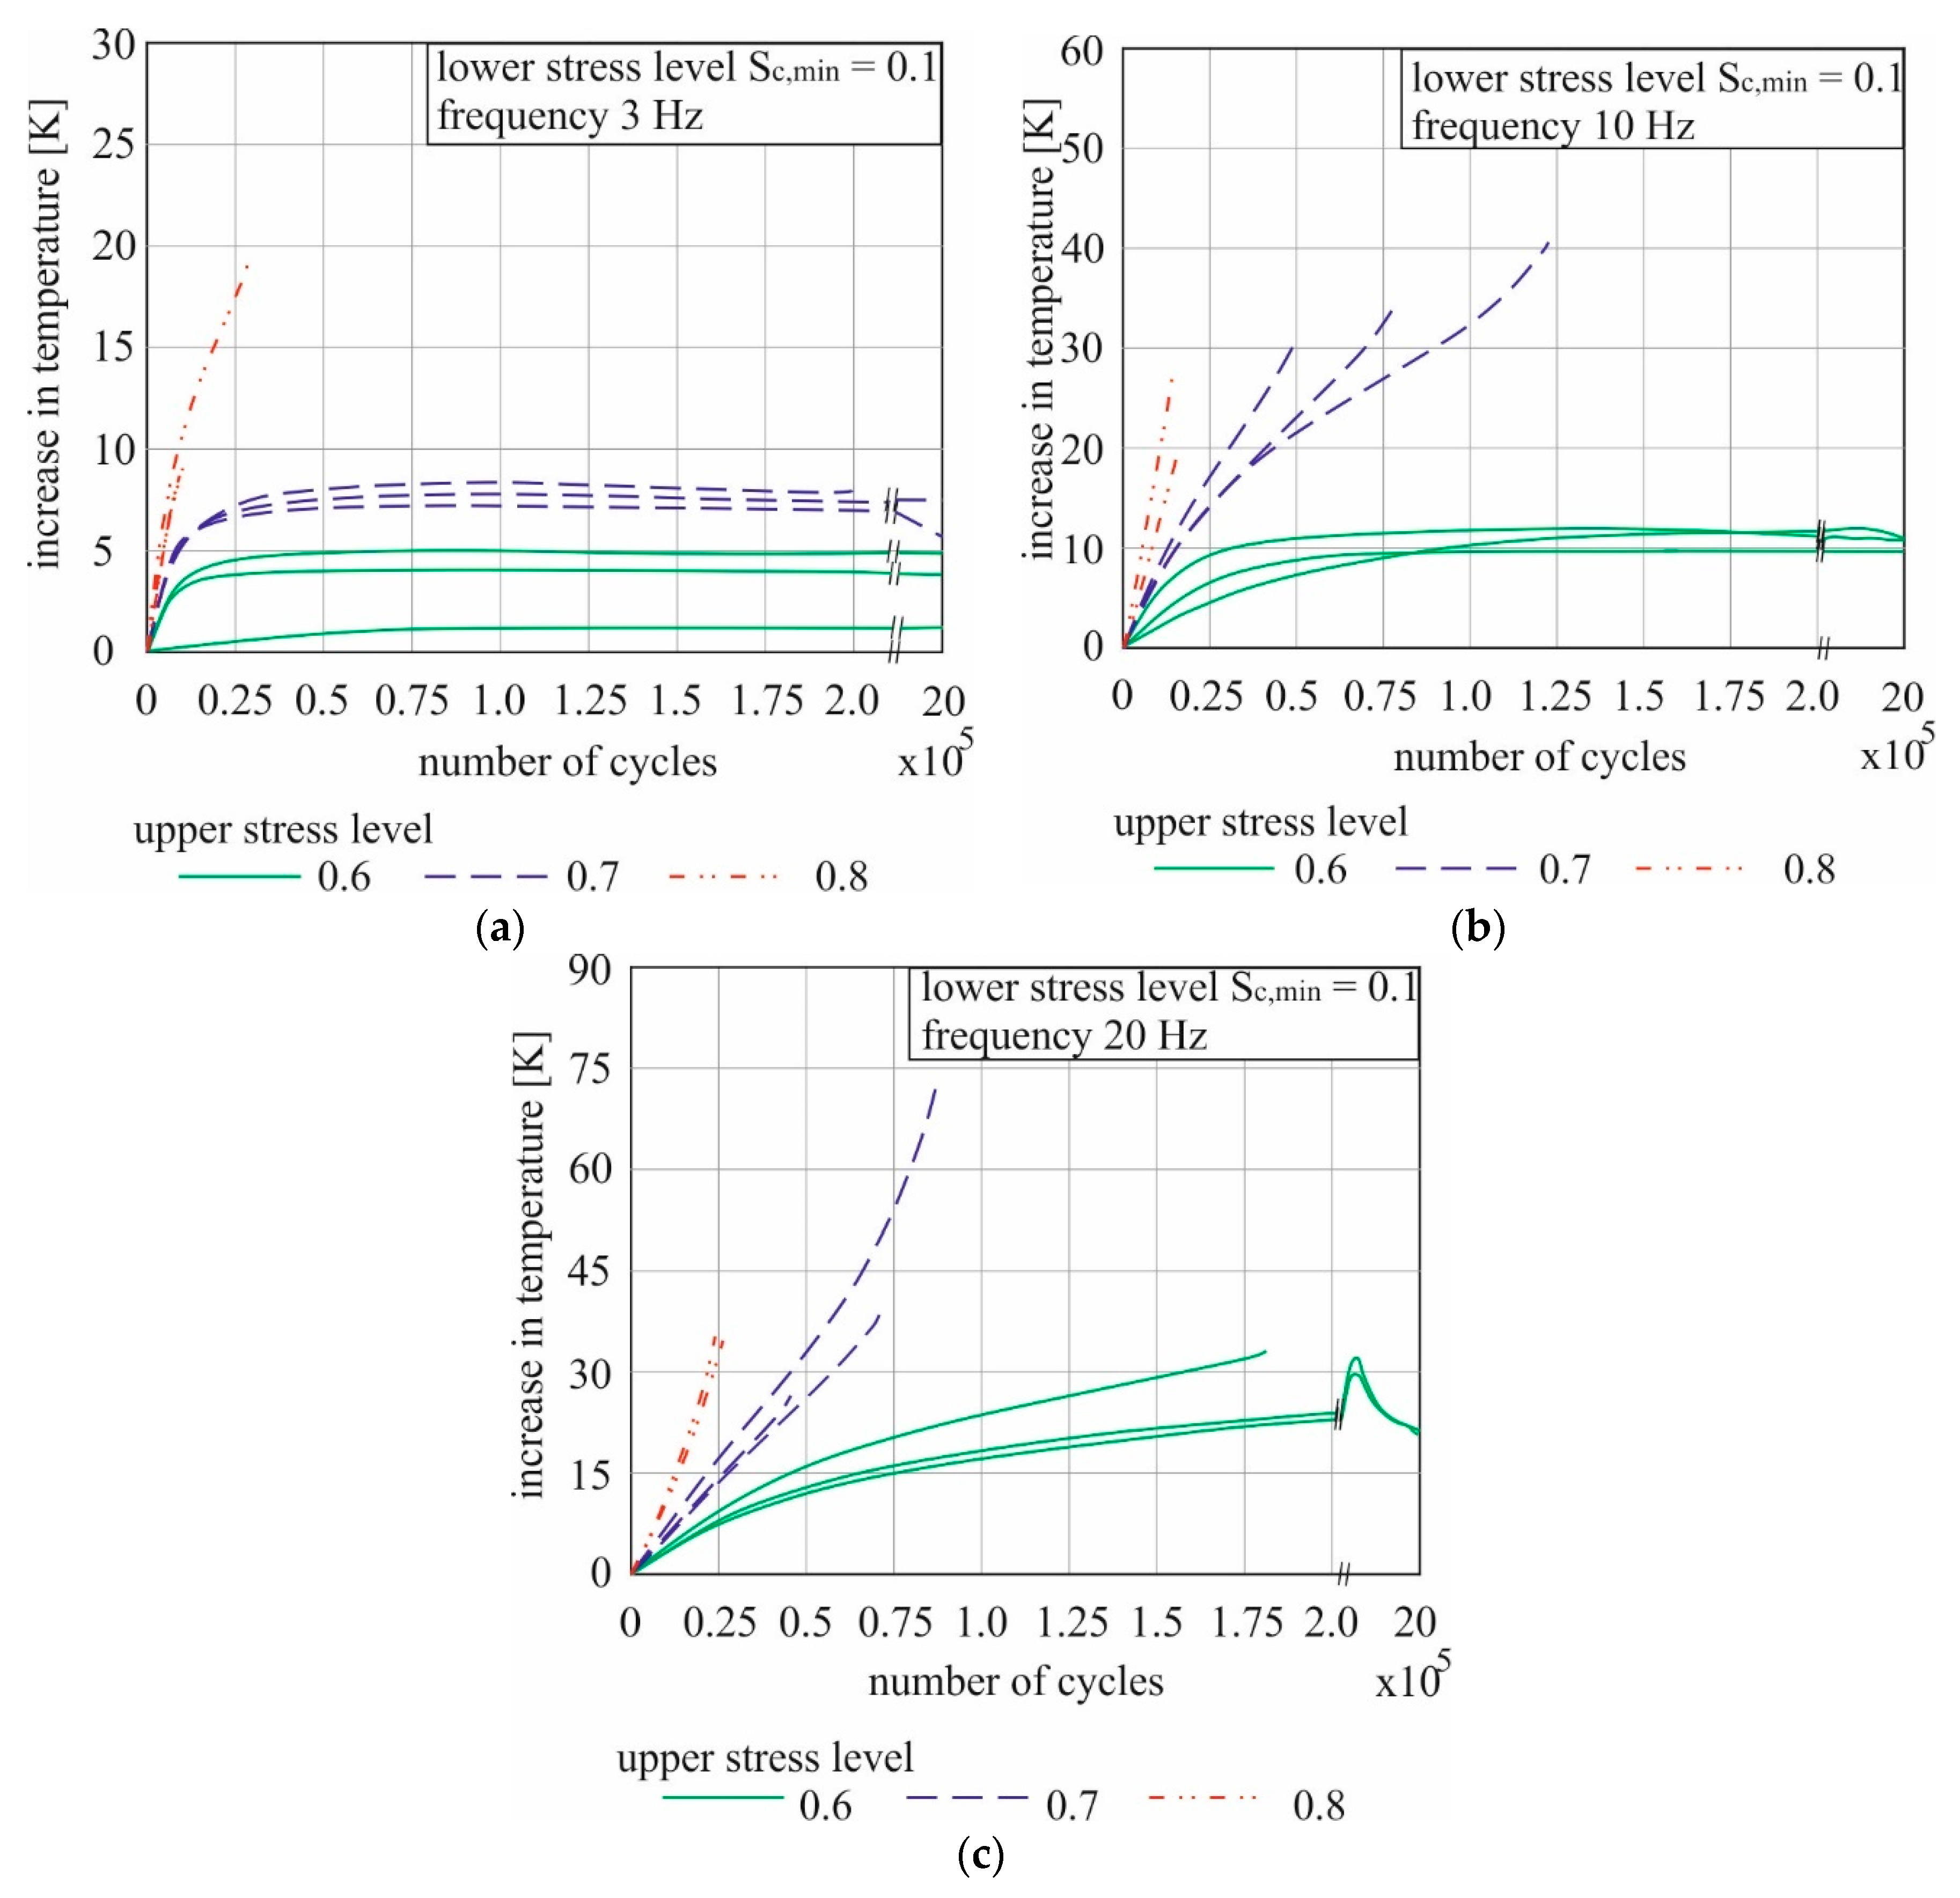
In the following, the heating curves for the varying stress levels, frequencies and the two concretes are presented. In the diagrams, the heating curves on the center of the surface are displayed in each case. This represents the maximum temperature rise which was measured in all tests. As shown in Table 1, three frequencies (3/10/20 Hz) were tested for the UHPC 1 and three different maximum stress levels (σo = 0.6/0.7/0.8) were applied at each frequency. The diagrams in Figure 5 present the heating curves over the number of load cycles for all 27 tests. The influences of the load-dependent parameters on the temperature increase of the UHPC 1 under fatigue stress can be seen clearly. It should be noted, that a change in the scaling for the number of load cycles at 200,000 load cycles takes place in the X-axis in all diagrams (marked by two small oblique strokes). Thus it is possible to make the courses of curves with an early and a late failure visible in one graphic. Please also note that the scaling of the Y-axes is different.
Basically, all tests show a temperature increase of the UHPC samples. The characteristics of the curves indicate a strong dependence of the heating of the samples on the two load-dependent parameters.
The diagram (a) of Figure 5 shows the curves for the lowest frequency of 3 Hz. At 3 Hz, a higher maximum temperature is reached with increasing maximum stress level. Not only the maximum temperature, but also the steepness of the curve of heating increases is maximally. At an upper load level sc,max of 80% of concrete strength, the specimens failed during the temperature rise, which was in 2 of 3 cases nearly linear over the whole test. In these two trials, the specimens achieve both a temperature increase of less than 10 K. The failure occurred very early due to the high fatigue damage. At sc,ma = 0.7, a maximum temperature difference of about 8 K was recorded after 20 to 25 thousand cycles. The temperature then remained almost constant. Two of three specimens reached the break-off criterion of 2 million load cycles without failure, where a minimal temperature drop could be noticed. At sc,max = 0.6, the curves are similar to the 0.7 ones. However, the maximum temperature differences were with only 5 K even lower. Each test was finished after 2 million load changes as stated in Section 2.4.
The rise of the temperature curves was dependent on the maximum stress level also at 10 Hz, as can be seen in the diagram (b) of Figure 5. However, the temperature maxima achieved were significantly higher than for the slower loading. Again at sc,max = 0.6 a maximum value was reached at approximately 80 thousand load cycles. From this point on, the temperature difference to the starting temperature of all three specimens remained at approximately 12 K and no failure of the test specimen occurred until the tests were stopped. All attempts with higher stress level shows a steady increase in temperature until failure. At sc,max = 0.8, the increase was again the steepest, but the total temperature increase of round about 24 K (in average) was approximately 11 K less than the average value for cyclic loading with the mean level of sc,max = 0.7. In addition, the tested 0.8 specimen failed already near 20 thousand load cycles, whereby the same temperature of the test specimens with sc,max = 0.7 was first reached at a little under 50 thousand load cycles on average. However, the mean values were not that meaningful at 70 percent as upper stress level, since there was a large variation. That can be seen in the load cycle numbers. The failure occurred between 50 thousand and 120 thousand load cycles.
The curves for sc,max = 0.7 and 0.8 in the diagram (c) of Figure 5 display a basically similar picture at 20 Hz as at 10 Hz, but higher temperatures were reached. The greatest increase in temperature of a test specimen was achieved in the entire test series at sc,max = 0.7 and 20 Hz with 68 K. This value stands out significantly, as in the two other tests with the same configuration only temperature increases of 28 K and 38 K were recorded, respectively. The highest stress velocity caused an increase of more than 30 K even at the lowest maximum stress level of 0.6 and was thus significantly higher than at the lower frequencies. These increases run in two of three attempts over 500 thousand load cycles. After that, the samples cooled down by about 12 K. From 1.25 million to 2 million load cycles, the temperature remained constant. One specimen failed after 180 thousand load cycles.
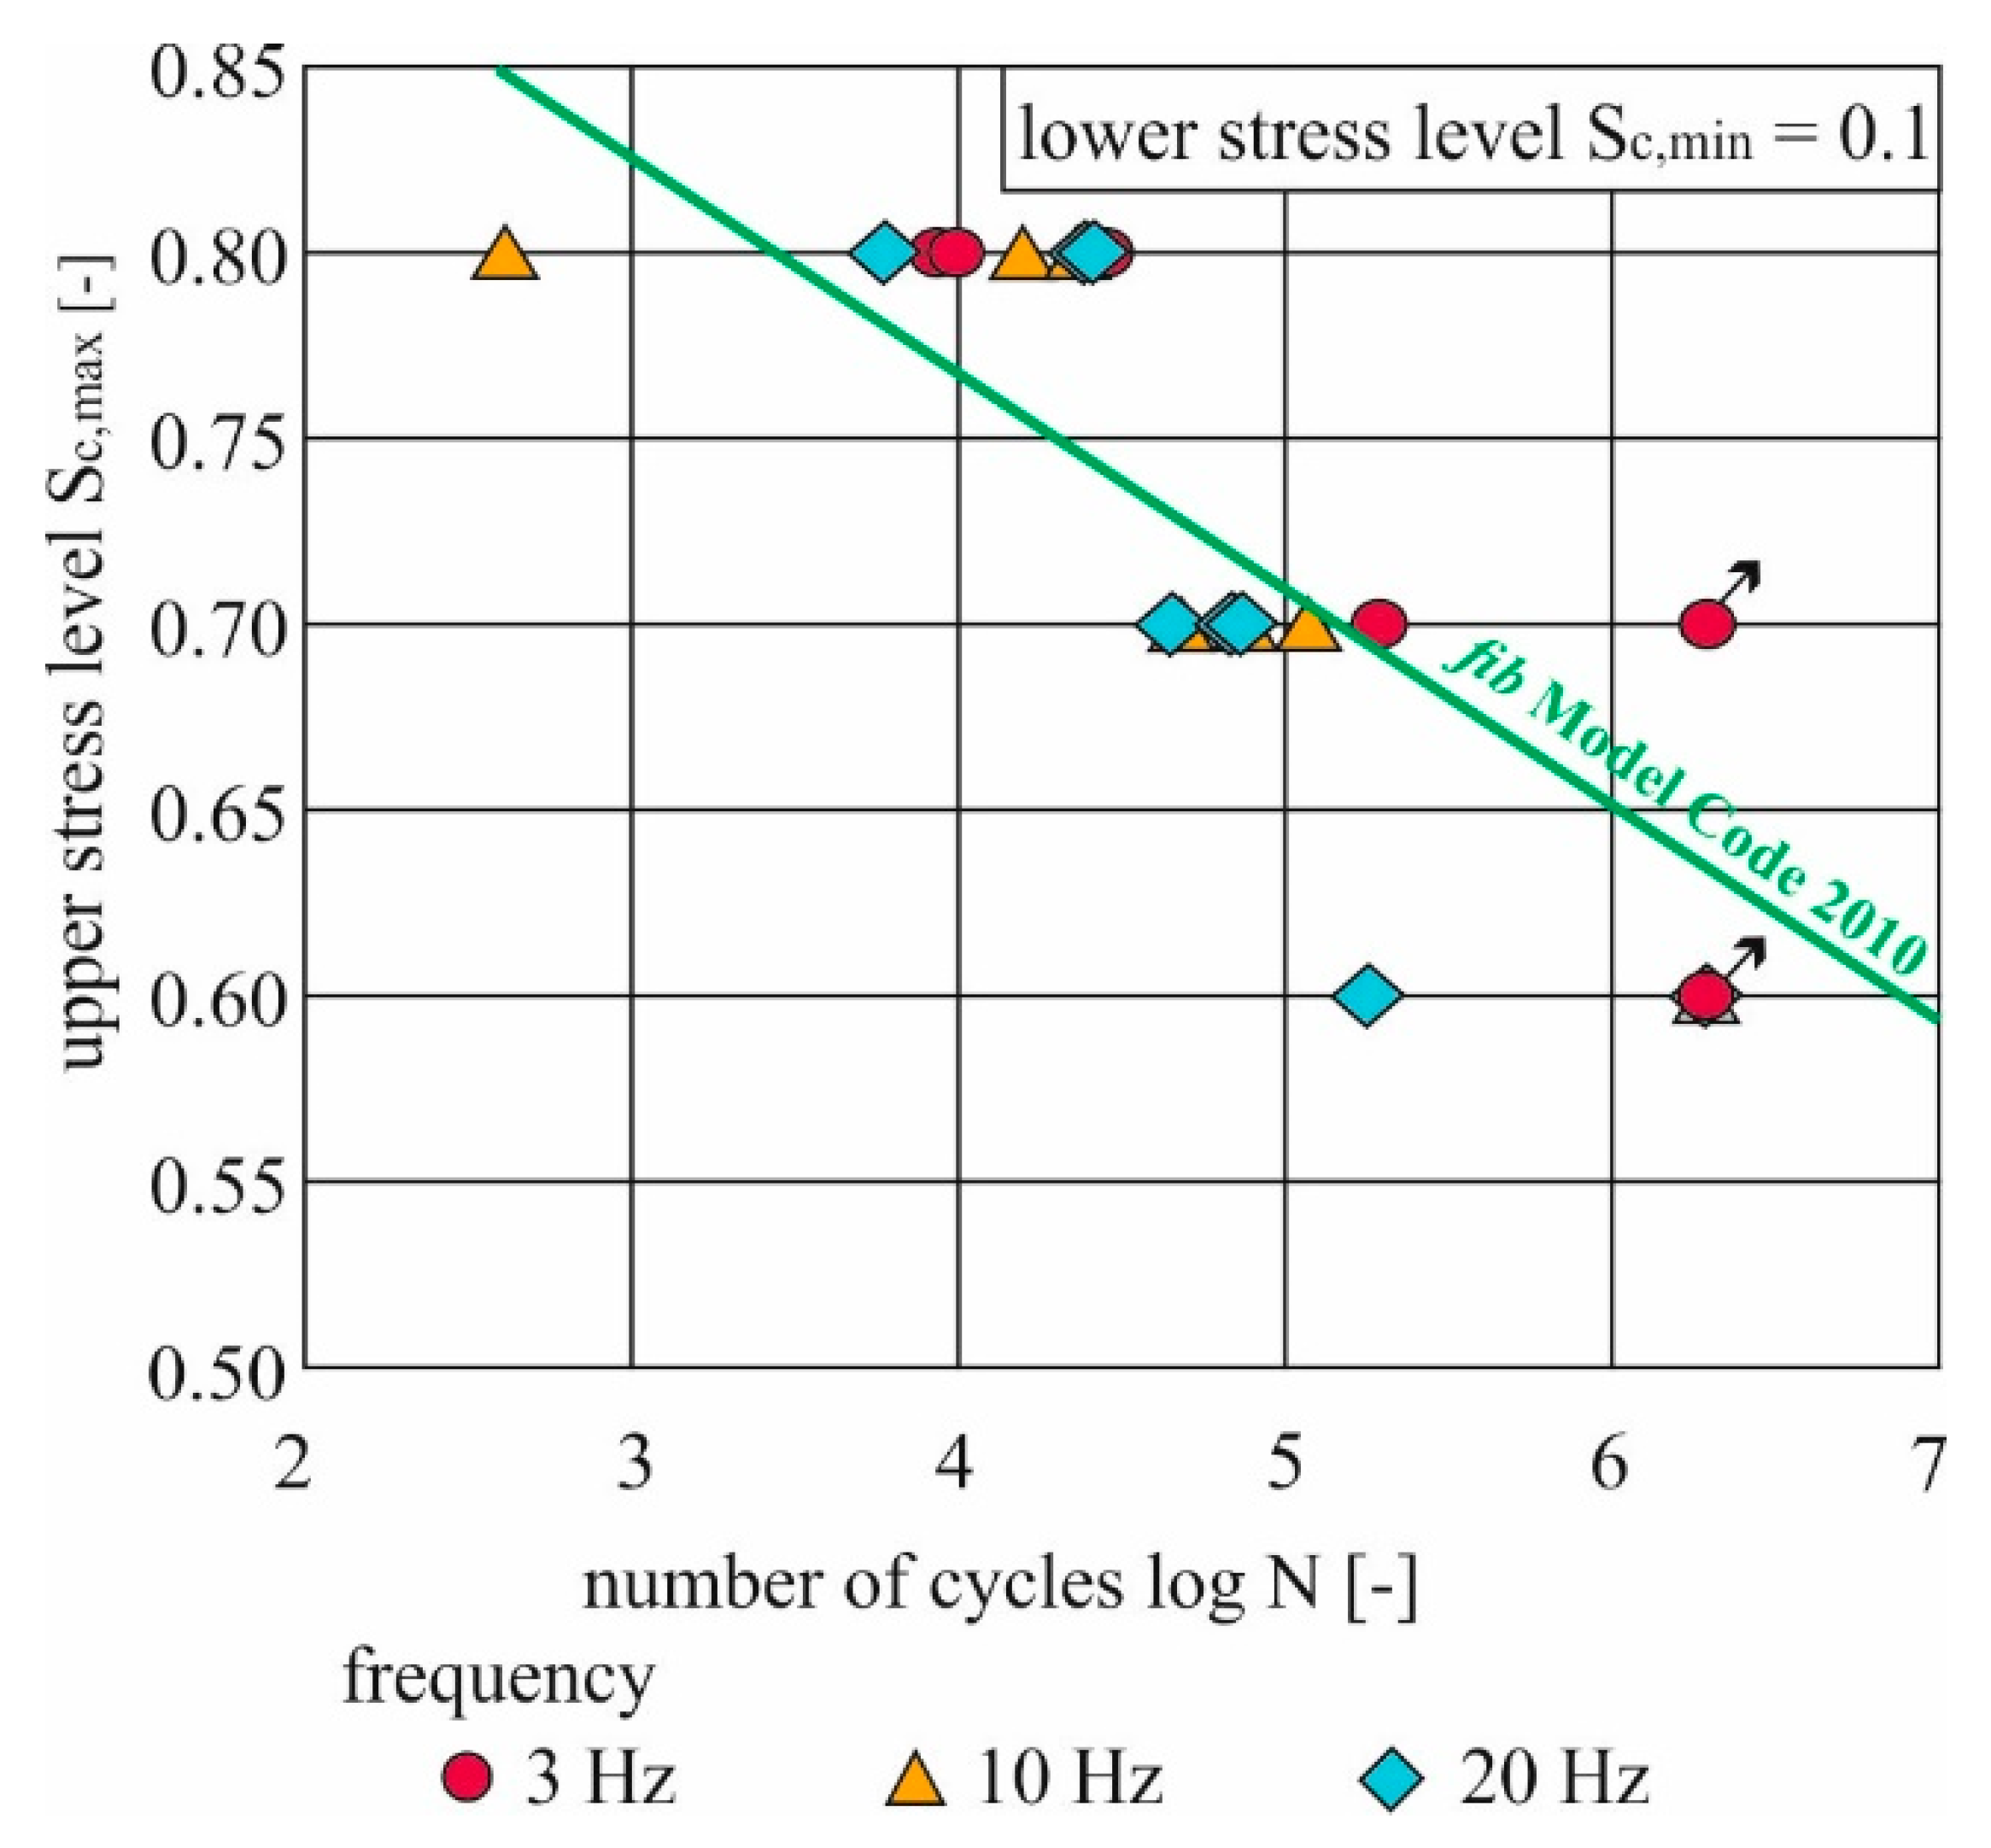
In total it is noticeable that only at a frequency of 10 Hz and 20 Hz a strong temperature increase in the concrete can be achieved. At 3 Hz, the increase generated was usually so low that the influence on the fatigue strength for the UHPC 1 is negligible. This can also be seen in Figure 6. There, the achieved number of load cycles for all tests is presented logarithmically as a function of the maximum stress level. The continuous line describes the expected value for the number of load cycles according to the Wöhler curve included in the Model Code 2010 [19]. The attempts with a maximum stress level of 0.6 achieved, with a few exceptions, the termination criterion of 2 million load cycles. In all cases, the heating curves also reached a maximum value at which the warming stopped. The break-off criterion lied below the Wöhler curve, which is why this comparison does not make sense. At sc,ma = 0.8 we got the steepest rise of the heating curves at each frequency, but at 10 Hz and 20 Hz not the maximum temperatures. Failure was expected to occur very early. The values according to fib Model Code 2010 were also reached (or even exceeded) with temperature increase. The early failure in comparison to the other maximum stress levels was mainly caused by the high degradation. The one outlier below the Wöhler curve had large blowholes due to production and is therefore not considered for the mean values.
As can be seen in Figure 6, only the tests specimens at 70% of the uniaxial compressive strength as upper stress level failed before the calculated values according to [20] were reached, and this at 10 Hz and 20 Hz, where also the maximum temperatures were reached. Thus, a non-negligible influence of the warming up on fatigue strength of UHPC can be assumed here. Thus, at frequencies that cause significant heating, there is a range between 60% and 80% of the mean concrete strength in which sufficient temperature is generated to have an influence on the strength, but failure does not occur previously due to fatigue loading. As [4,5,6,13] have determined, for example, there is a point at approx. 75% of the mean concrete strength as an upper stress level at which the failure and damage behavior change somewhat. The changing influence of the frequency on the fatigue strength above and below the value was often detected. With a different increase in damage and differently oriented crack growth, heating can possibly also be influenced. The results show that although there is still a significant increase in temperature, the heating rate is clearly influenced over the test length, which is discussed in more detail in Section 3.3. The comparison with the UHPC 2 is therefore displayed with tests at 10 Hz and sc,max = 0.7.
Figure 7 shows a comparison of the heating curves for UHPC 1 and UHPC 2. Here, the influence of the maximum grain size on the temperature curve can be displayed.
As already described for the UHPC 1, the UHPC 2 test specimens also failed during the heating process. On average, the temperatures reached are similar for both concretes. However, it is noticeable that the curves with the smaller maximum grain size of 1 mm always show a steeper course. In addition, the number of load cycles achieved with the larger maximum grain size of 8 mm for the same strength is on average double that of the UHPC 1. Relative to the Wöhler curve, the test specimens of the UHPC 2 also reached the expected number of load cycles with 140 thousand on average.
3.3. Heating Rate of the Concrete
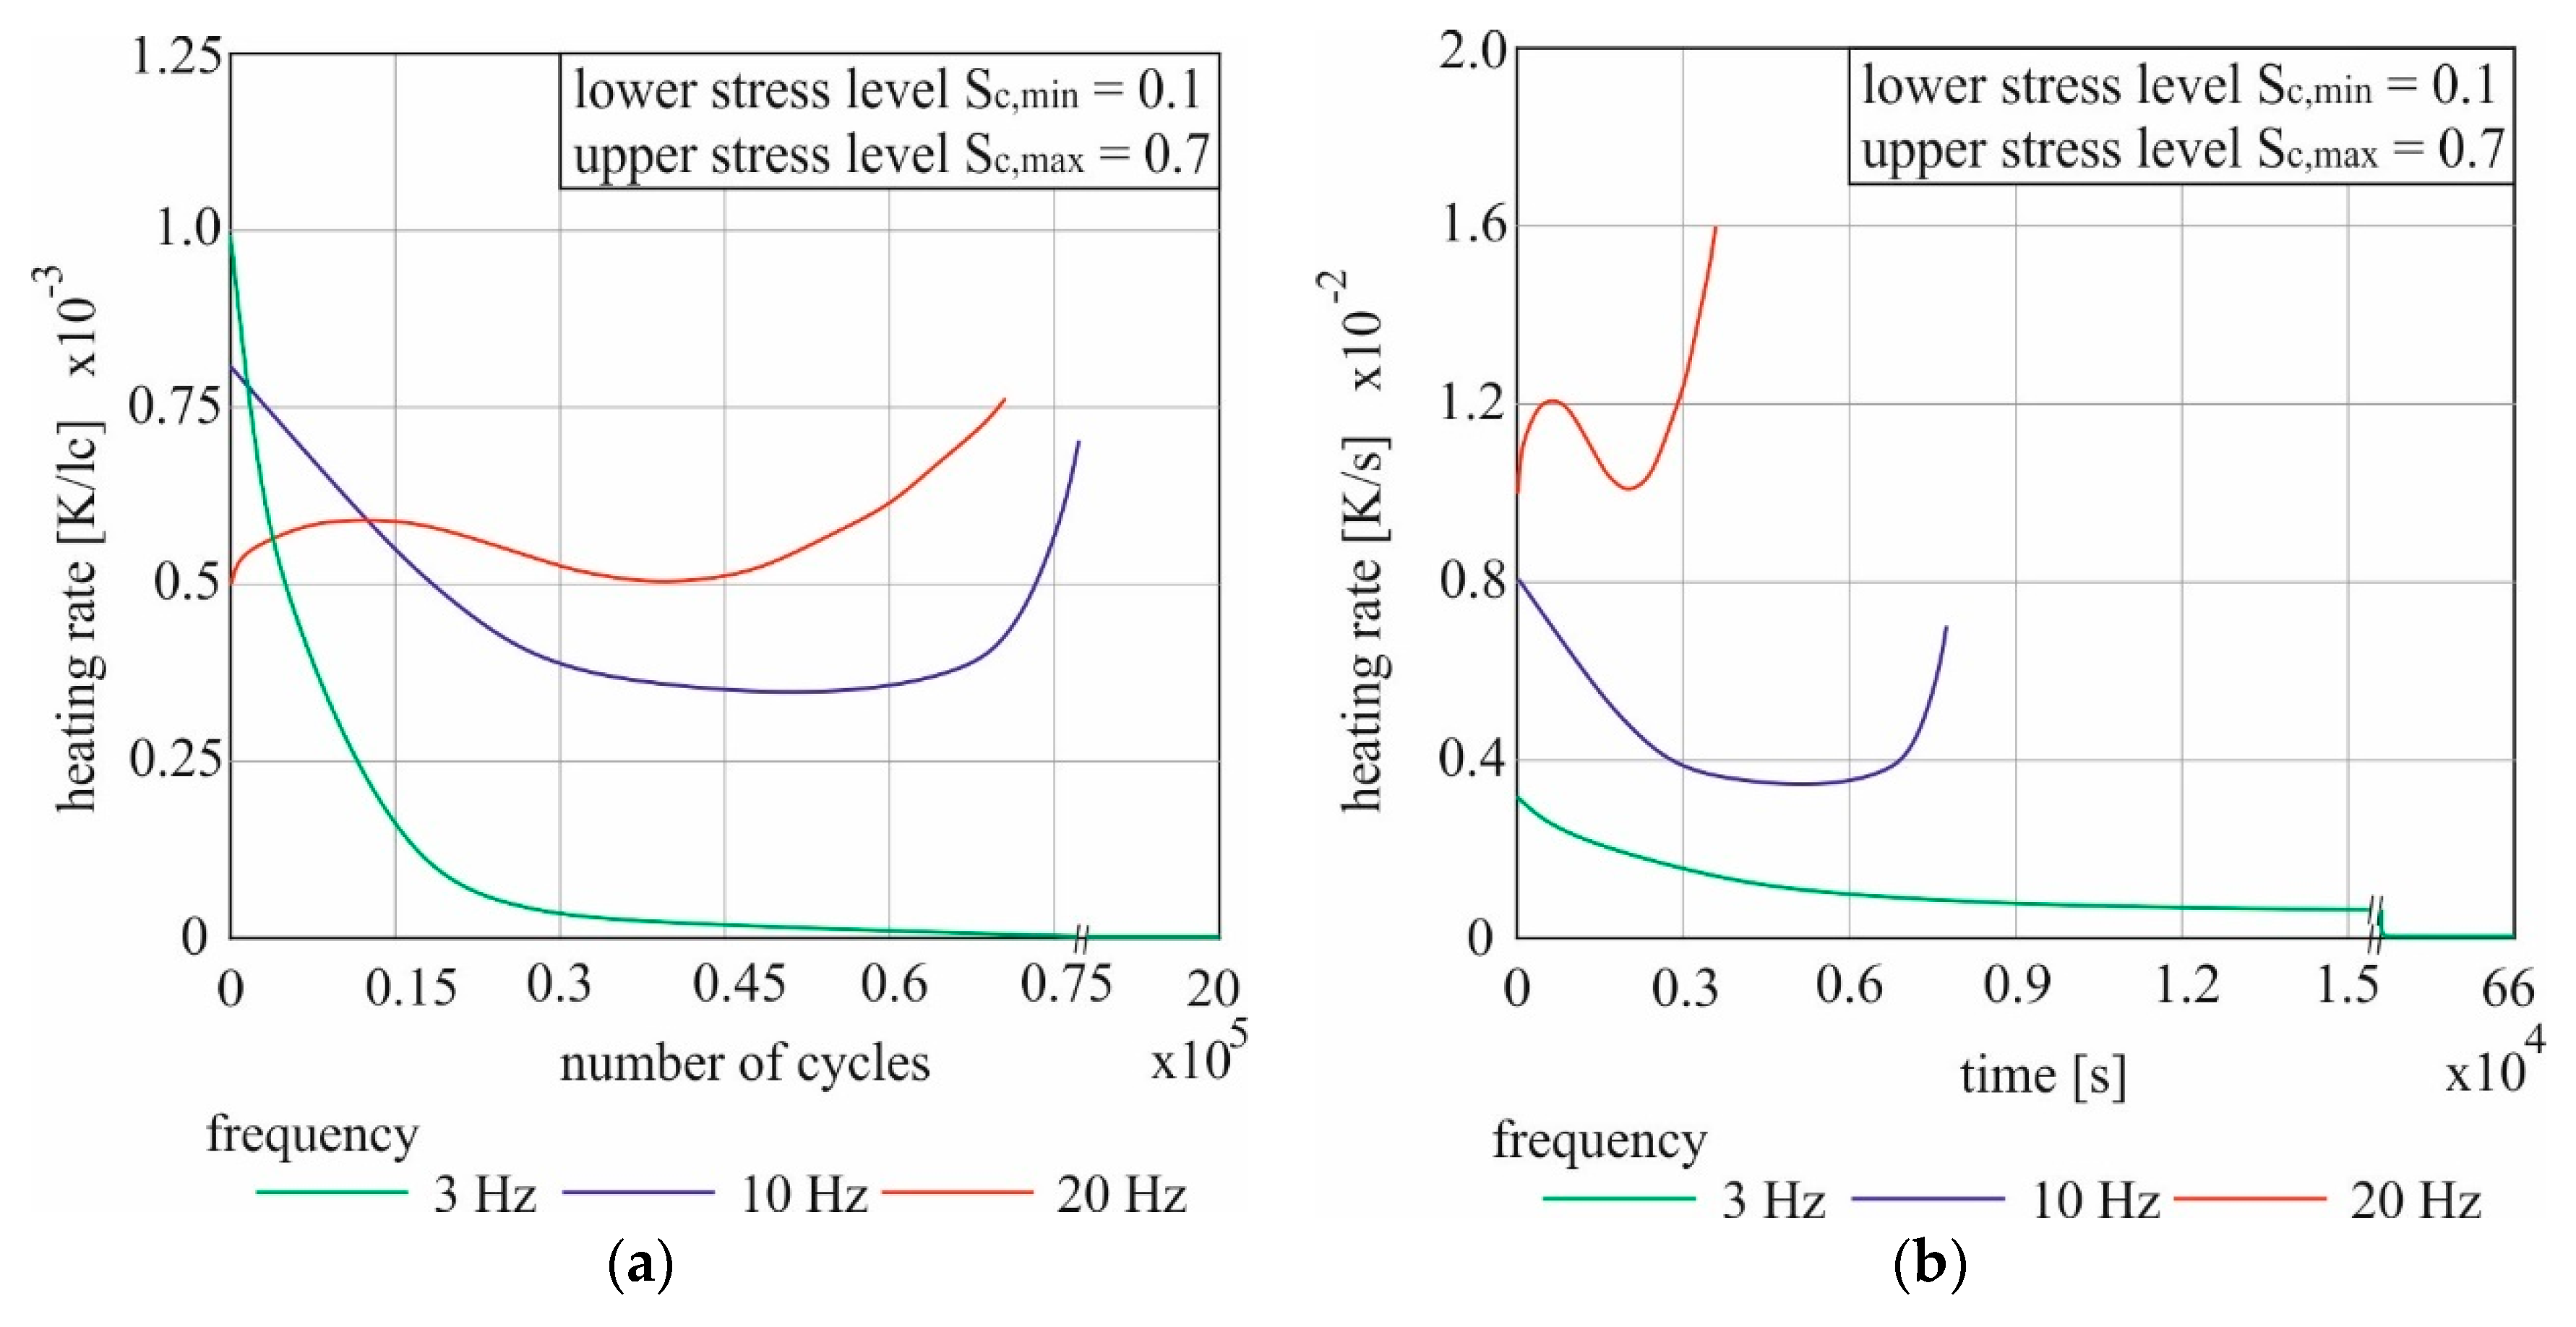
The steepness of the warming up curves can be used to estimate how strong the increase in temperature was during the test. In order to quantify this heating rate, the heating curves can be derived. This was done for the attempts at sc,max = 0.7 for the UHPC 1 concerning both the number of load cycles and the duration. Figure 8 shows the speed of the temperature increase for one attempt each at 3 Hz, 10 Hz and 20 Hz. As an example, the test that reached the temperature in the middle of the respective configuration was selected for the representation.
The diagram (a) in Figure 8 shows the rates of temperature increase per load cycle. The fastest rise of 10−3 K/lc was recorded in the attempt with the lowest total temperature difference reached at 3 Hz. It was measured directly at the beginning of the test. In relation to a load change, more force is applied to the test specimen over time as the length of the load change increases. For 3 Hz, the longest force application is generated with 1/3 s. The speed of the temperature increase decreased rapidly afterwards. After 1,500 load cycles the point of overlap with the 10 Hz curve is reached, and after 4,150 load cycles with the 20 Hz curve. Additionally, with regard to the number of load cycles, the heating per load cycle was therefore quickly at its slowest at the lowest test frequency. After only 0.25% of the total number of load changes, this speed has already halved. The regressive curve reaches the value 0 after 75 thousand load cycles. This means that no further heating of the test specimen occurred after less than 4% of the total number of load cycles up to the break-off criterion.
The experiment with 10 Hz had its maximum heating speed also at the beginning of the attempt with 0.8·10-3 K/lc. Then, the course did not drop to 0, though, rather at 0.35·10−3 K/ lc a turning point after about two thirds of the overall course was reached and the heating speed increased again. The warming rate decrease at the beginning was noticeably lower than at 3 Hz and during the first 15 thousand load changes nearly linear with 1.67·10−8 K/lc2. The increase in heating velocity was particularly strong during the last 10% of the experiment. The specimen failed at a heating speed of 0.7·10−3 K/lc before the initial value was reached again.
In contrast to 10 Hz, the maximum heating speed was reached at 20 Hz for all evaluated samples that failed before the break-off criterion; the maximum speed of the temperature increase was reached immediately before the failure. In relation to the number of load changes, the rate of warming at the start is lowest with 0.5·10−3 K/lc. However, this starting velocity did not decrease during the test. The curve shows two turning points. After 12 thousand of 70.7 thousand load changes, a first maximum of 0.6·10−3 K/lc is reached. Then the speed decreased until the start value was reached again. From 12 thousand load changes, compared to the other frequencies resp. load speeds, the highest warming speed per load cycle at 20 Hz was also permanently recorded. Immediately before failure, the heating rate was 0.76·10−3 K/lc.
The diagram (b) in Figure 8 shows the same attempts. This case, however, the heating rate is displayed in relation to the test duration in seconds instead of load cycles. The curve characteristics remain the same like described before for diagram (a). Due to the changed reference value on the X-axis, the curves are significantly compressed and stretched. Because the number of load cycles per second varies significantly between 3, 10 and 20, the test durations are correspondingly very different. The test with 20 Hz was already finished after 58 min, the test with 10 Hz lasted 2 h and 10 min and the 3 Hz test took over a week until the break-off criterion was reached. If the start values of the speed are considered in terms of time, the order is exactly reversed in comparison to the load cycle-related values. The difference of the load changes per second (factor 2) is also clearly expressed here. The resulting temperature increase rates are so far apart that there are no intersections of the curves. The clearly lowest maximum value of the temperature increase rate was reached in the test with 3 Hz with 0.31·10−2 K/s and reaches 0 after 25 thousand seconds.
Looking at the 10 Hz and the 20 Hz attempt, one can compare the first and the second reached maximum value of the warming speed. The load speed factor between both is 2.0. The heating rate at 10 Hz had a starting value of 0.8·10−2 K/s. At 20 Hz, this value was 1.2·10−2 K/s. The factor here is therefore only 1.5 and is thus less than the frequency difference. If observing the heating rate in each test directly before failure, the result is 0.7·10−2 K/s for 10 Hz and 1.6·10−2 K/s for 20 Hz. The factor in this case is 2.28 and thus above the frequency comparison.
The comparisons of the velocity show that with the same load cycle level between 0.1 and 0.7 of the mean concrete compressive strength, the temperature input is different depending on the load cycle (lc) and the test duration at different frequencies.
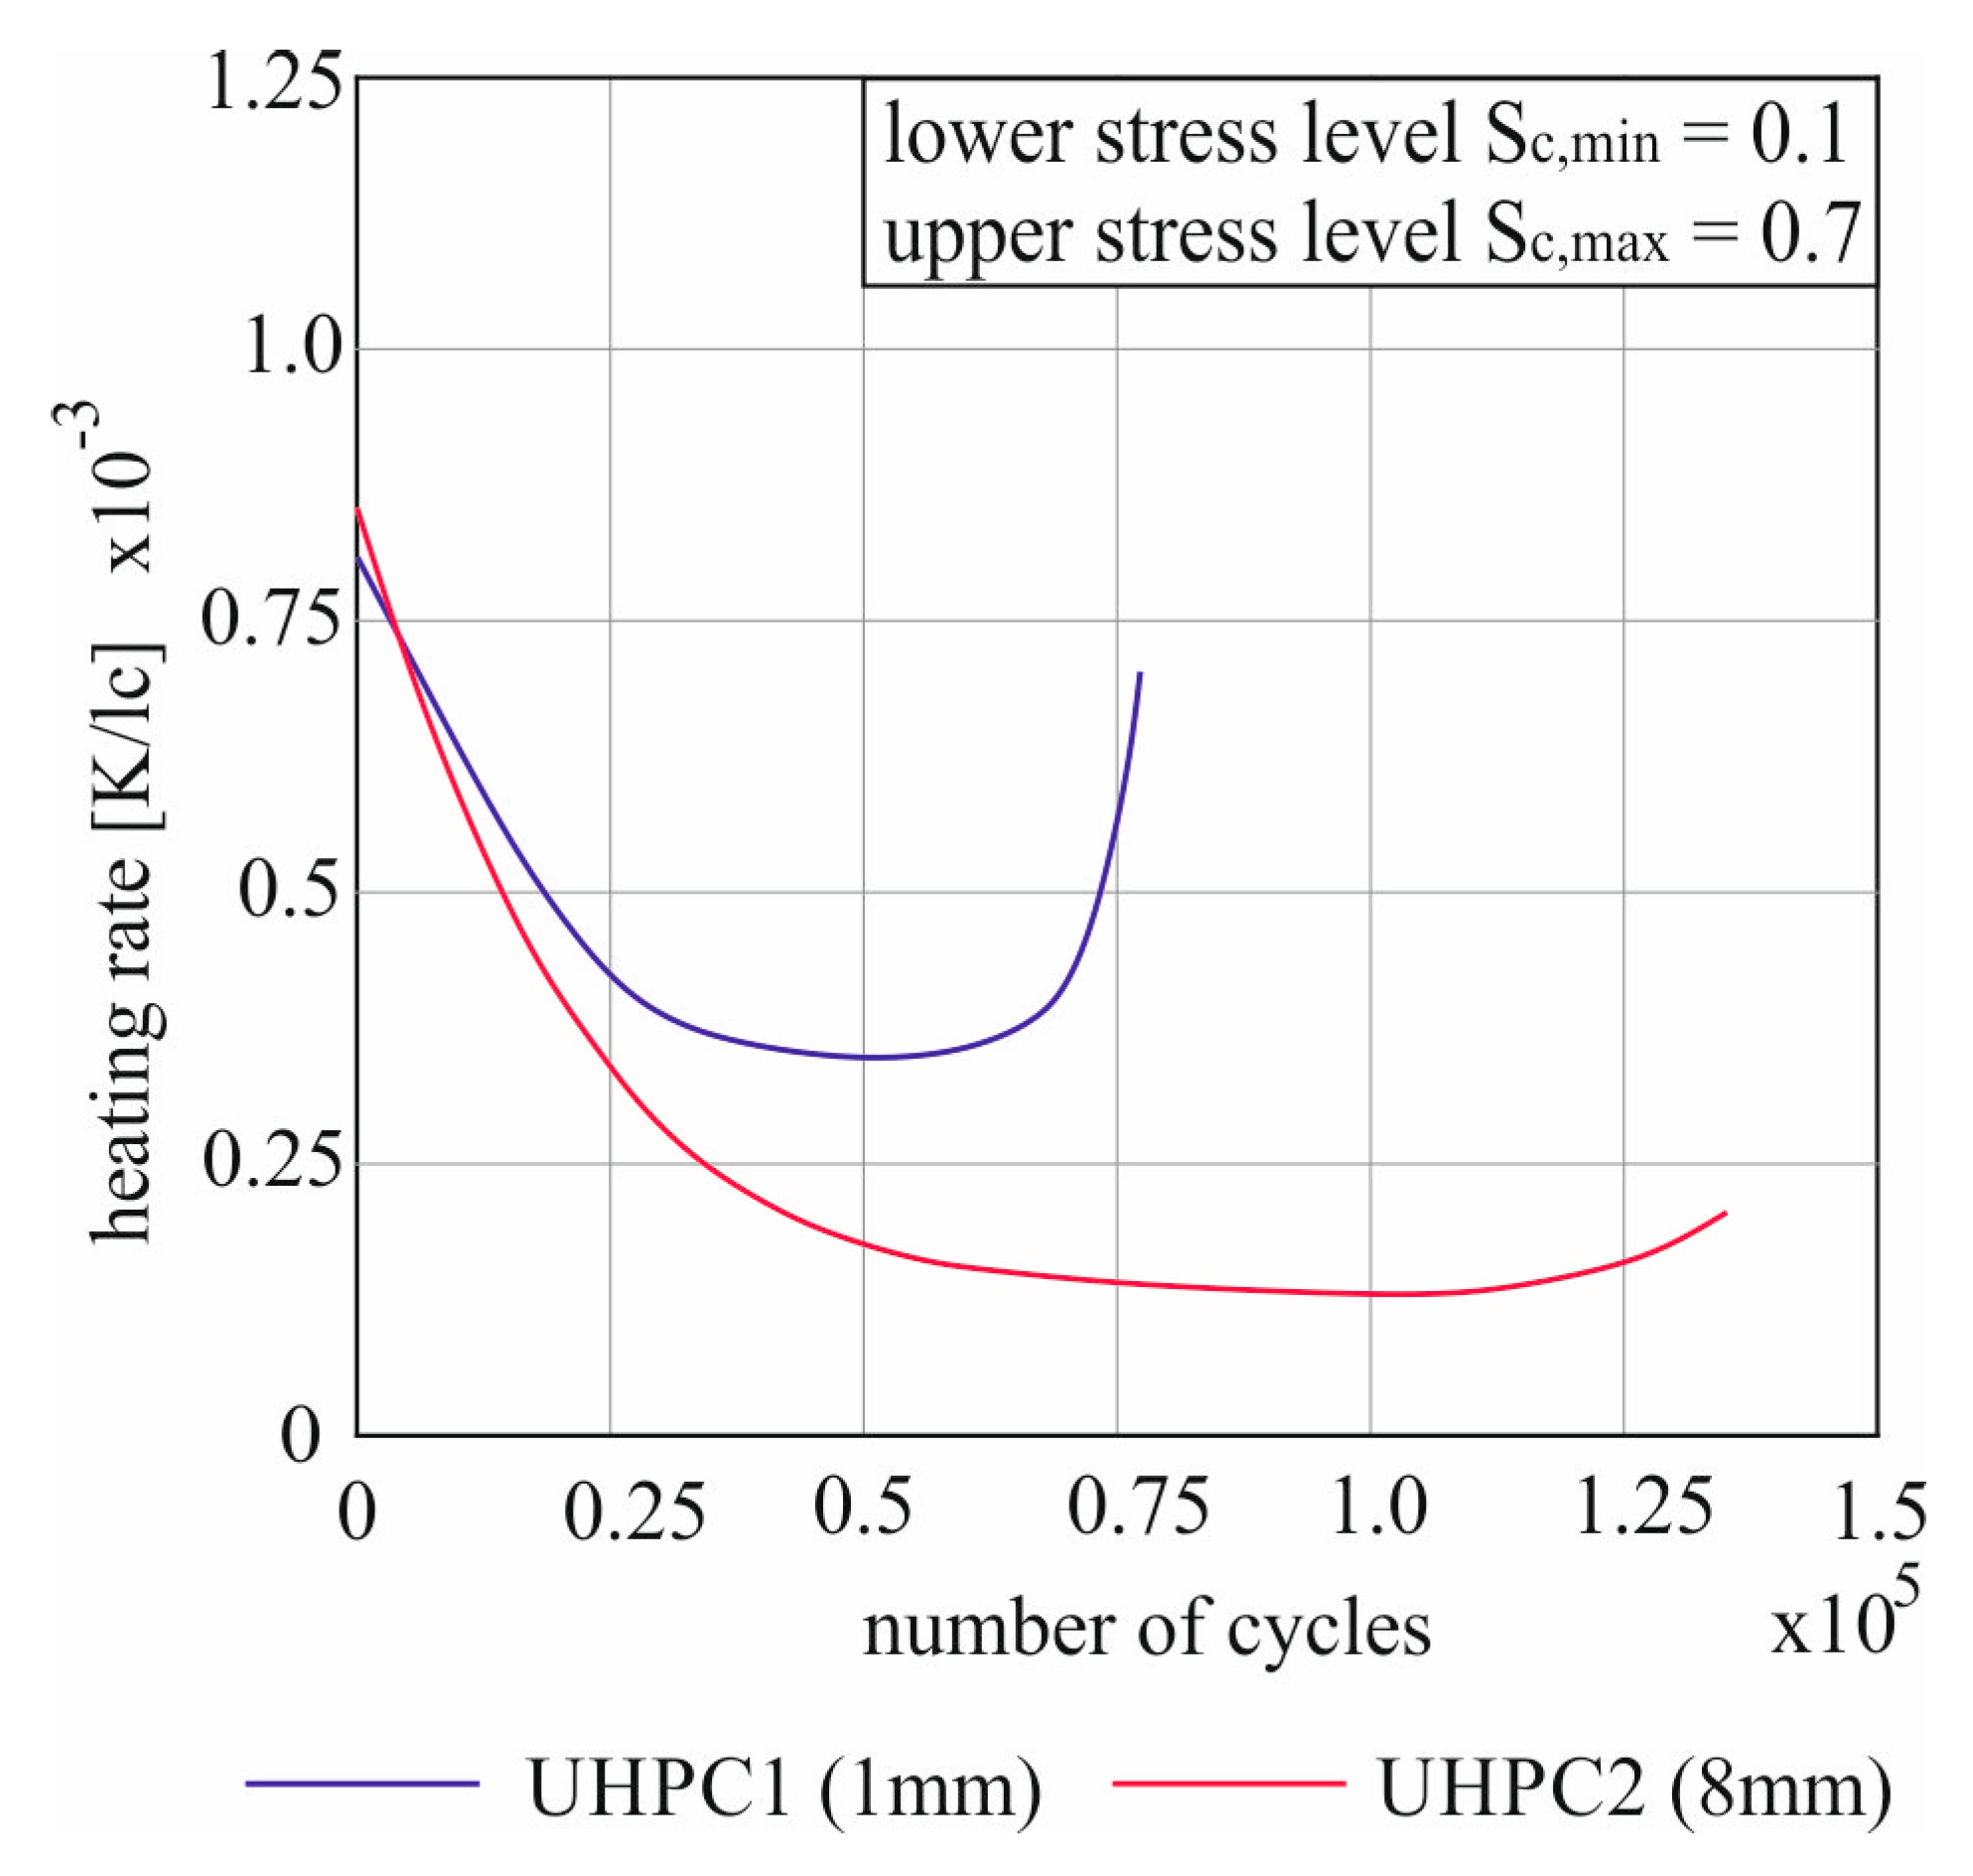
As with the heating curves, the UHPC 2 is compared to the UHPC 1 for the same load cycle at a frequency of 10 Hz to discuss the influence of the maximum grain size on the heating rate. This is represented by the load-cycle-related velocity in Figure 9.
The two curves show principally similar behavior. In each case, the maximum value of the heating rate can be seen at the start of the test. With 0.8·10−3 K/lc for the UHPC 1 with a maximum grain size of 1 mm and 0.85·10−3 K/lc for the UHPC 2 with a larger maximum grain size of 8 mm, these values lie very close together. This is followed by a reduction in the warming up rate which was first linear in both experiments and then attenuated. Thereby the warming speed of the UHPC 2 decreased faster. In both attempts, a turning point was reached at a minimum heating rate before it rose again. As from 4,500 load changes, the heating speed of the UHPC 2 was always lower than that of the UHPC 1, which led to a slower increase in the temperature difference curves (Figure 7). The maximum temperatures difference reached with +33.4 K (UHPC 1) and +32.1 K (UHPC 2) were very close to each other. Due to the higher heating rate, however, this temperature was reached after 77.5 thousand load changes at the finer aggregate concrete. For aggregates up to 8 mm, on the other hand, almost 135 thousand load cycles were required for the same temperature increase.
Another clear difference can be seen from the derived curves of the temperature rise. Both attempts start with a similar heating rate, but the increase before failure is very different. The UHPC 1 reached 87.5% of the starting velocity before failure occurred. In contrast, the UHPC 2 reached only 25% of the start value after the climb to the end.
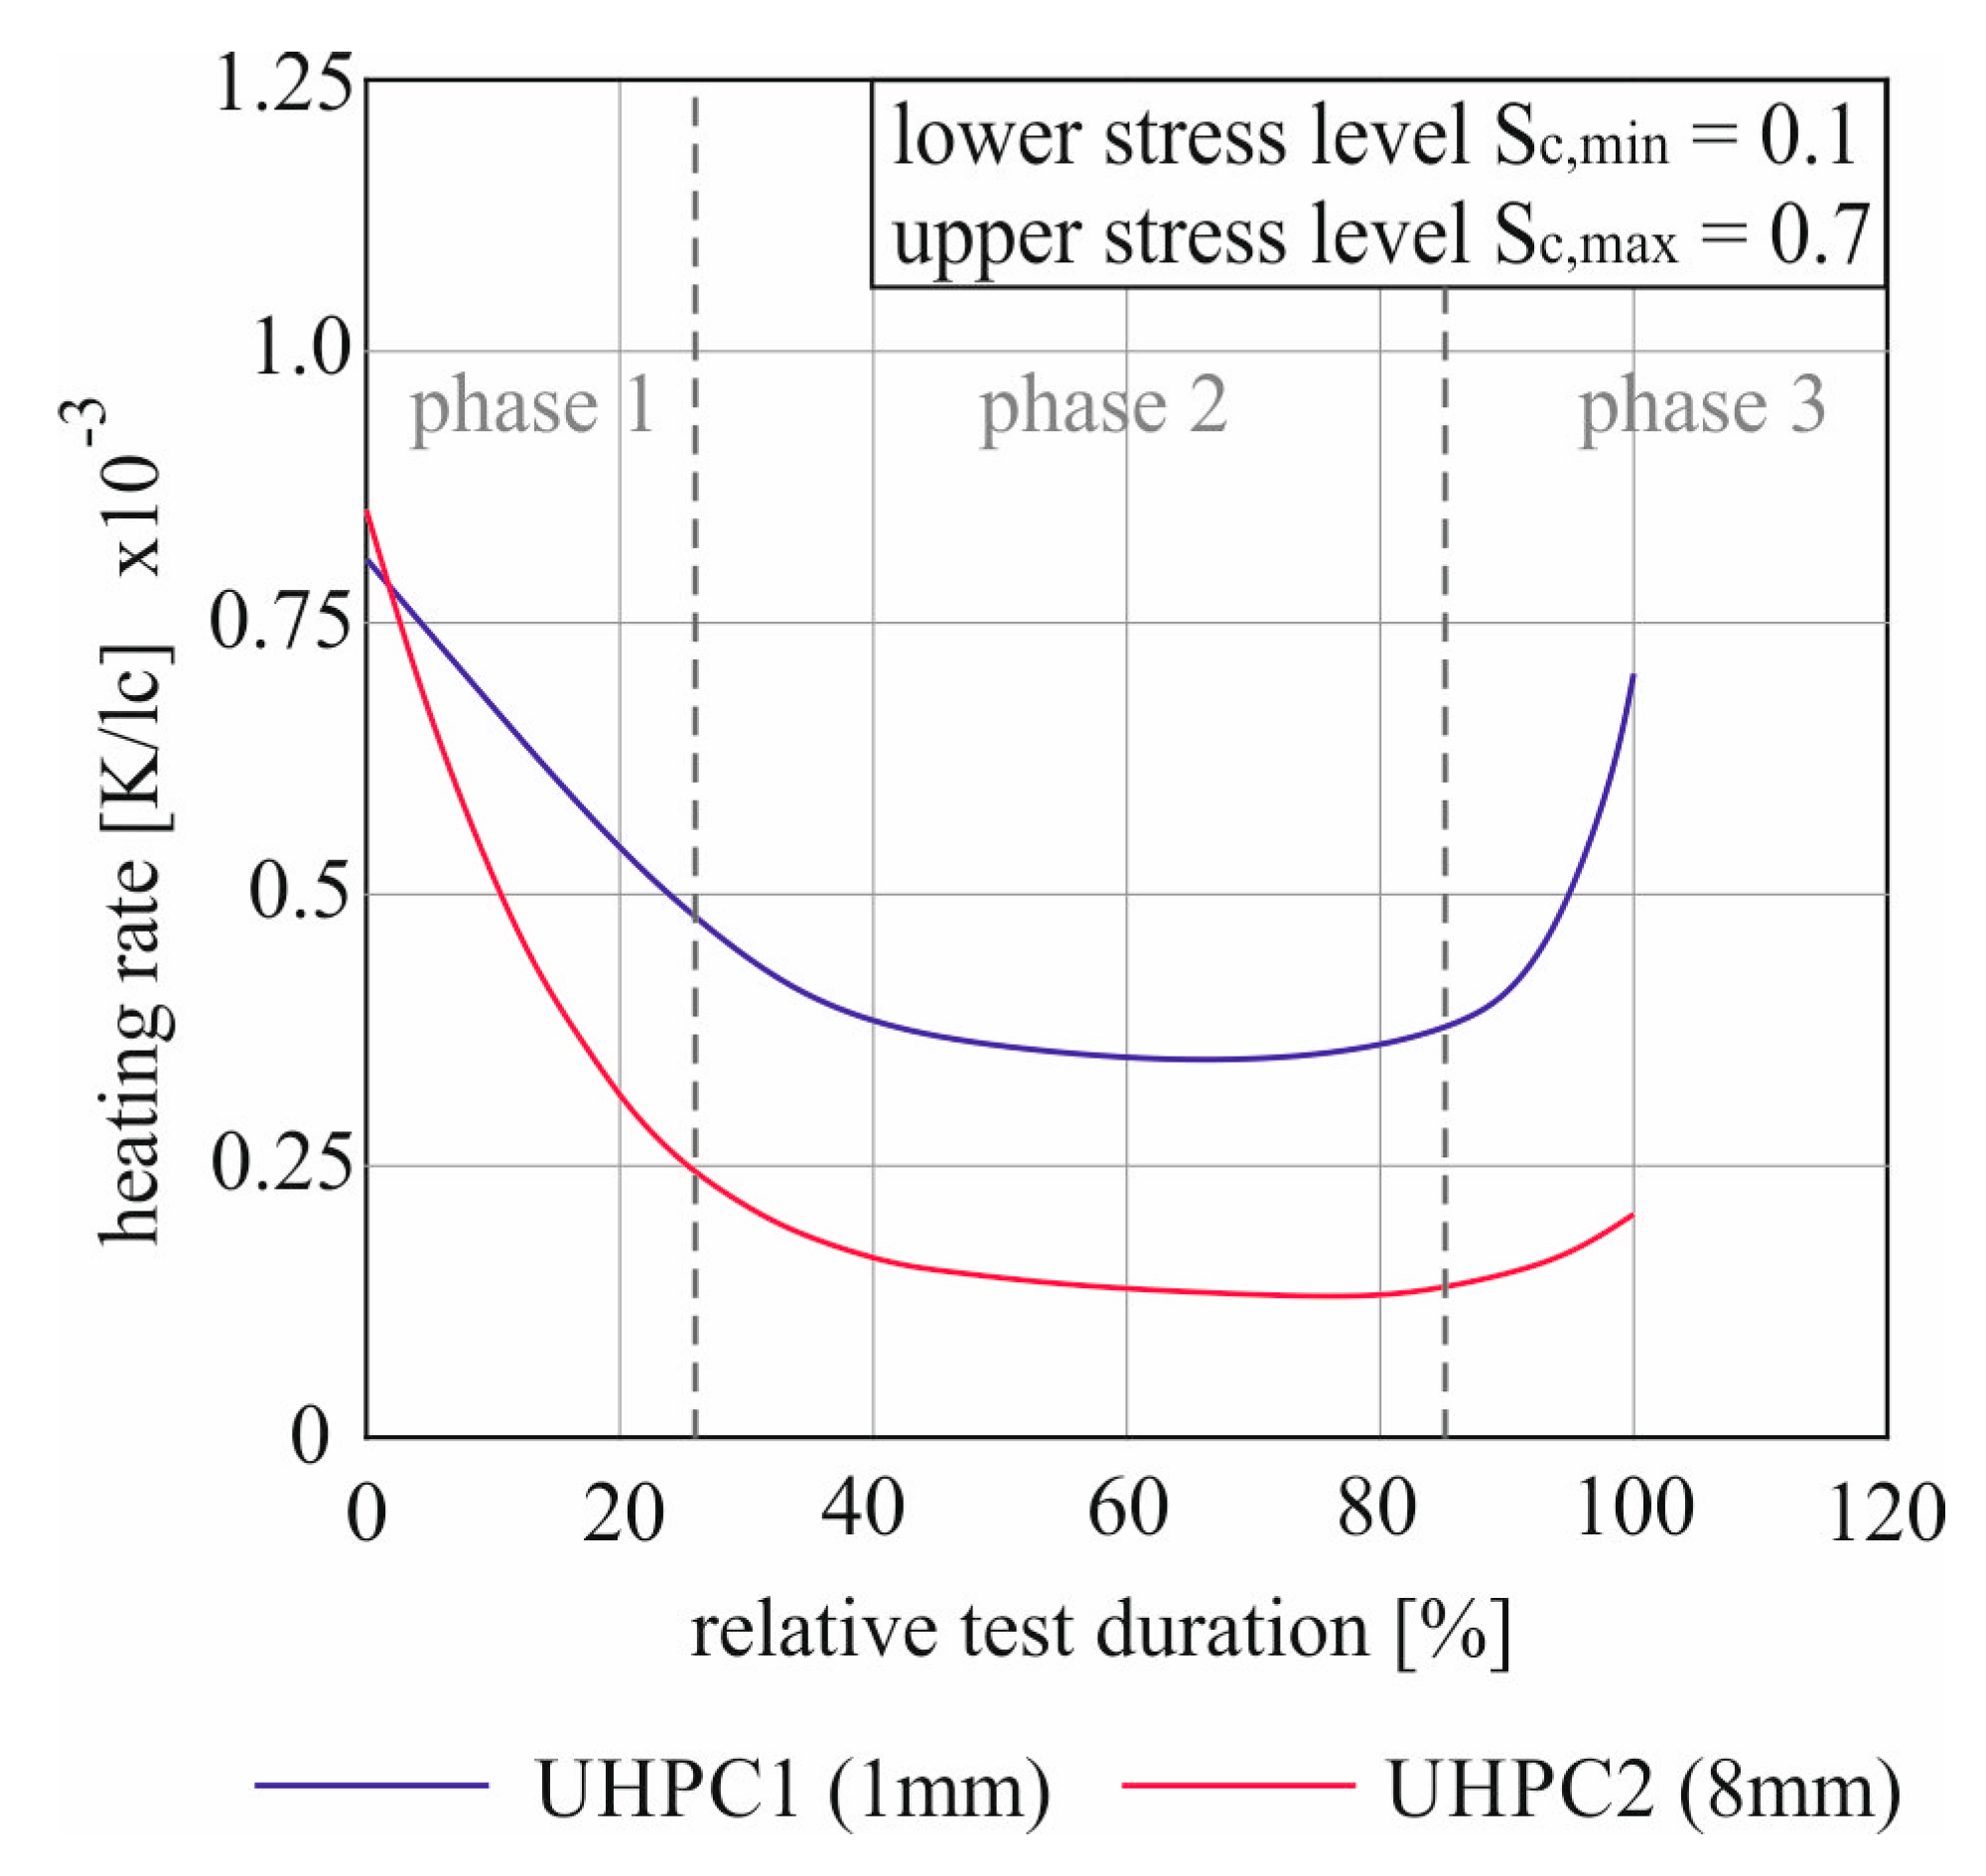
In order to be able to compare the two curves relatively to each other, they are shown again in Figure 10 with reference to the relative test duration with 100% means the end of the attempt.
The similarity of the curve can also be seen very well in relation to the percentage duration in Figure 10. After the initial linear decrease of the velocity, the heating rate decreases regressively between approx. 20% and 40%. Until about 2/3 of the test duration, the curves then run approximately parallel until the lowest heating rate is reached. Finally, there is an equal relative duration of the ascent at the end, with visibly different intensity. The curves can be divided into three phases. The phases 1 and 3 are characterized by strong changes in heating speed. During these phases, the difference between the curves also increases visibly. Phase 2, on the other hand, displays an almost linear reduction of the heating rate of about the same amount in both experiments. Thus a constant distance remains. After both attempts started with almost the same warming speed, they already had a difference of 0.22·10−3 K/ lc at the turning point and the heating rate of UHPC 1 was 2.7 times higher than that of UHPC 2. During phase 3, this difference has increased to 0.5·10−3 K/lc until failure. At the end of the trials, the factor between the courses was already 3.5.
The comparison of the two concretes with the same strength and different aggregate shows, that with the same loading parameters, the courses of the heating rate-relative test duration curves are basically similar, but the absolute values are clearly dependent on the maximum grain size. The only exception seems to be the start of the test. This may be caused by the fact that at the beginning of the test there was no structural change in the concrete due to fatigue loading. With the duration of the test continuing, the damage will result in different conditions in the concretes and thus probably the different friction potentials.
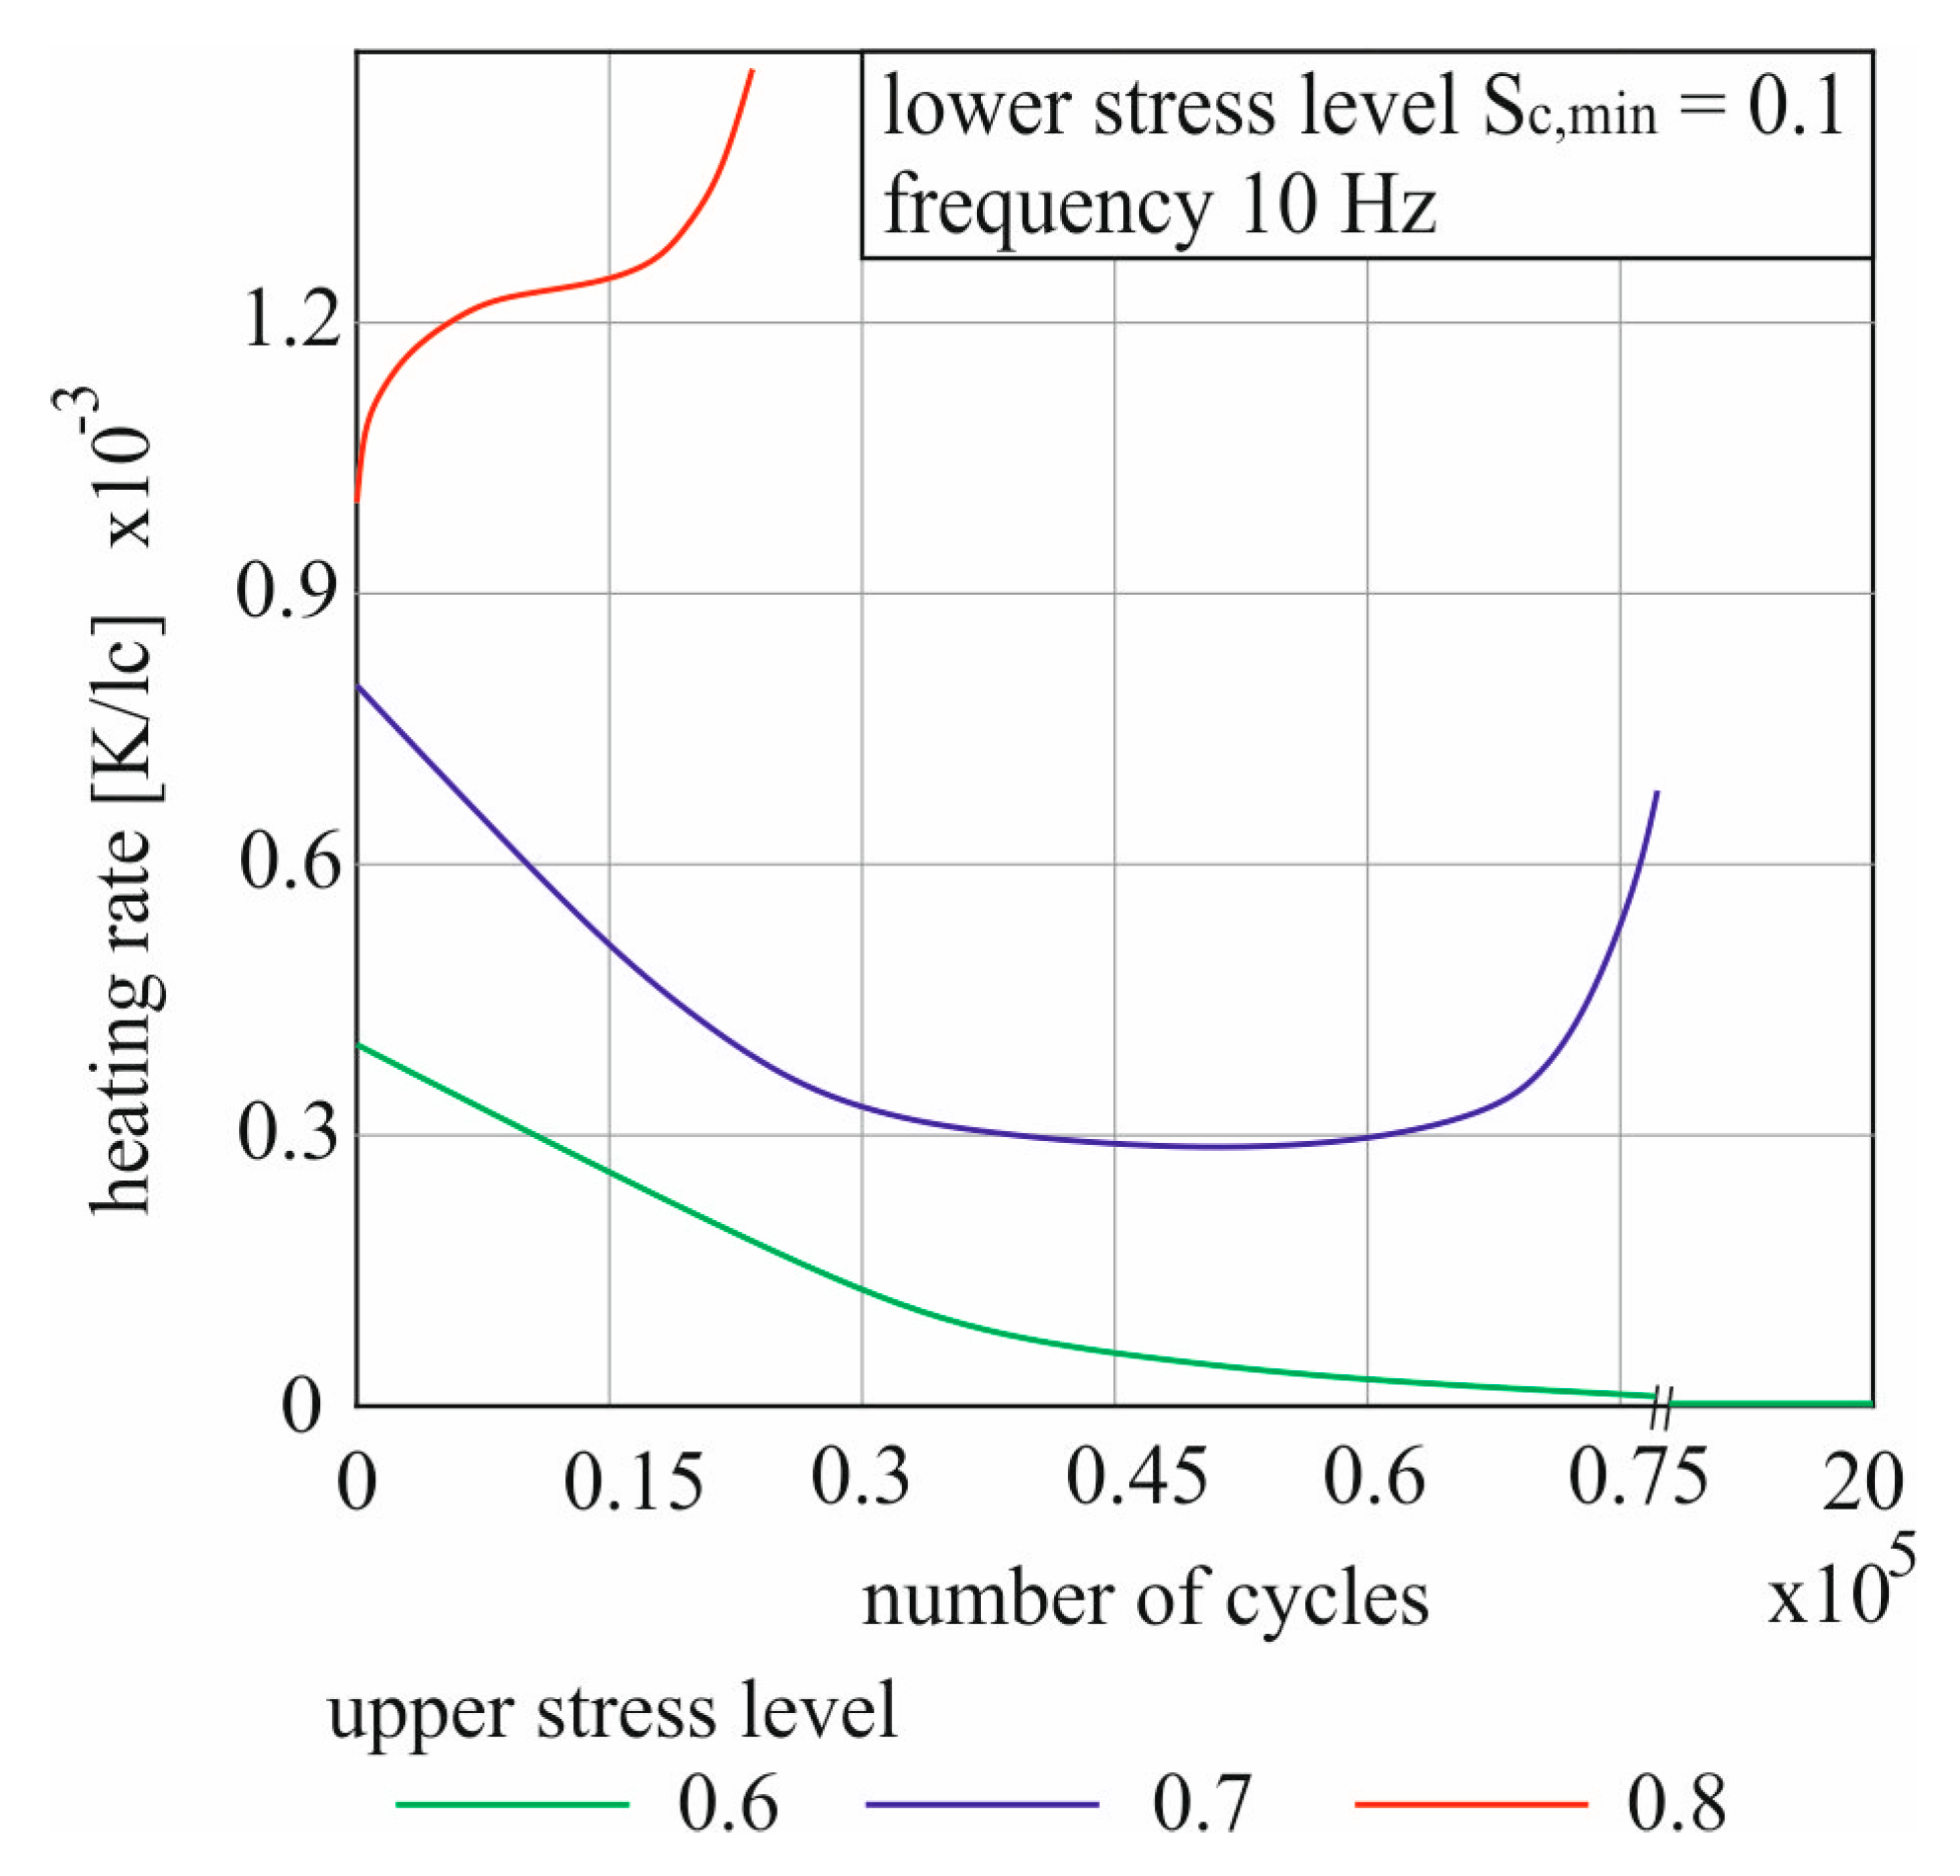
A last variant of a comparison of the heating rates is shown in Figure 11. Using UHPC 1, the influence of the upper stress level on the heating rate for three attempts is shown here. An attempt can be seen for each stress cycle as a representative. All specimens were loaded with a test frequency of 10 Hz. The velocity of heating is again shown in relation to the load changes.
As expected, the lowest load cycle with sc,max = 0.6 shows the lowest heating per load change. The starting value of 0.4·10−3 K/lc is already the lowest. Then the speed decreases linearly and regressively until an increase of 0 is reached after 90 thousand load changes. From this point on, the heating curve has reached a constant value, compare Figure 5b. The curve at sc,max = 0.7 was already described in detail before, see Figure 8, Figure 9 and Figure 10.
For sc,max = 0.8 the highest starting heating velocity is obtained. After a starting value of 10−3 K/lc, however, the warming further increased over the entire course. The maximum speed value was recorded with 1.49·10−3 K/lc immediately before the failure occurred. As with all attempts that have achieved failure, there is again a progressive increase in the warming rate curve before failure. The seemingly linear courses of the heating in the tests with 80% of the mean concrete strength as upper stress level and a frequency of 10 Hz thus show an increase of the steepness over the whole test duration (Figure 5). The degradation caused by the fatigue load also increased rapidly, which means that the sample failed after only 23.4 thousand load cycles. It can therefore be seen that a faster warming is achieved with a rising maximum stress level, because more energy and a larger plastic percentage in the load is also introduced via the compressive fatigue load per load change.
4. Summary, Conclusion, and Outlook
The results from Chapter 3 show that all three parameters examined have a noticeable influence on the heating of ultra-high performance concrete.
Regarding the upper stress level, it can be said that the warming is faster with increasing values. At the same time, not only the heating speed is higher, but also the degradation under fatigue stress increases. This caused an earlier failure. Finally, the highest upper stress level does not condition the highest temperature difference at the same time. Tests with a load cycle between 10% and 70% of the mean concrete strength did not achieve the calculated values according to the Wöhler curve of the fib model code 2010 for UHPC 1. The lowest tested maximum stress level at Sc,max = 0.6 showed only very low temperature increases. It can be assumed from this that there is a minimum maximum stress level below which no (or negligible) heating occurs in the specimen.
One thesis to explain a minimum upper stress level is the approach of deformations in the elastic and plastic range. Only at a certain stress does the proportion of plastic deformation and thus irreversible structural changes become so large that heat can be generated by internal friction in microcracks. If the stress remains within the elastic range of the concrete, no significant heating is to be expected. As a differentiation upwards, the influence of a modified damage above 75% of the mean concrete strength can be decisive (see Section 3.2). Additional tests with smaller load steps between upper stress levels that were investigated until now will demonstrate this influence in more detail.
For the parameter frequency, it was found that the increase of the load speed increases the achievable temperature difference. This applies to tests with failure as well as to the run-throughs that had reached the break-off criterion. At the lowest frequency, only a small heating was generated and in no case the expected value, which calculation takes no temperature influence into account, was not achieved. Therefore, a minimum speed can also be assumed for the frequency, which is required to generate heat under internal friction. However, between 3 Hz and 10 Hz the difference in the temperature increase is considerably greater than in the comparison between 10 Hz and 20 Hz. A decreasing influence can be seen. With further intermediate steps regarding the frequency, this should be checked to investigate whether there is an upper limit value above which the temperature generation is not further influenced by the frequency. The heating rate in relation to time increases with increasing frequency due to the more frequent load changes per time. This can only be detected per load change after the constant crack growth, the so-called phase II, has been reached [1,4,21,22,23,24]. However, the average speed increases with increasing frequency.
The influence of different maximum grain sizes was tested with two UHPC mixtures of approximately equal strength. The mixture with grains up to 1 mm warmed up faster than the mixture with 8 mm. The maximum temperatures reached, however, were on average almost the same. The only difference was that the maximum temperature was reached later due to the lower heating rate. On average, with the same configuration, it is possible to carry out a fatigue load twice as long with the larger maximum grain size. The comparison also showed that there is an influence on the fatigue strength due to the different temperature increase. Thus, only the UHPC 1 does not achieve the expected value according to [20] under rapid heating. An explaining approach is the larger inner surface between cement and aggregates with a smaller maximum grain size. This greater friction potential could have a decisive influence if the components matrix and aggregate have different stiffness. On this thesis we will focus in our further investigations.
The measurement at several points basically confirms the results from as example [11,12,13,16] that the heating of ultra-high strength concrete under pressure-swell stress occurs in the concrete. An influence of the temperature on the fatigue strength is visible, though, because tests with the same maximum and minimum stress levels and higher heating rate tend to fail earlier. In the tests with sc,max = 0.7, which turned out to be decisive, the average temperature rise at the failure lied in the range between 30 K and 40 K. Not only the temperature difference, but also the heating rate is strongly influenced by the investigated parameters. It is particularly interesting that the failure of the test specimen is announced by a progressive increase of the heating speed. As already shown in other investigations [1,4,21,22,23,24], before the failure, there is a strong increase and enlargement of the cracks in the concrete, which also increases the friction surfaces in the concrete. This then leads to a rapid rise in temperature as an advance notification.
The experimental part of the project includes next the investigation of the parameters specimen size for the determination of a possible scaling effect and the concrete strength by means of lower strength concretes. The previous results will be supplemented with intermediate steps and supplementary attempts to the parameters, so that a more exact description and explanation of the observed effects is possible, and clear statements can be made despite the partly high scatter. Only with further tests and investigations can statements be made regarding the mathematical consideration of this effect in the creation of Wöhler curves and it be eroded whether consideration of the effect is necessary in the application of HPC and UHPC in practice. The experimental part of the project, which is carried out at the TU Dresden, is supplemented by numerical considerations of the project partner at the TU Darmstadt in order to be able to record the influence of concrete heating in a material model.
Author Contributions
Conceptualization, M.D. and S.S.; methodology, M.D., S.S. and N.L.T.; validation, N.L.T.; formal analysis, M.D. and N.L.T.; investigation, M.D. and N.L.T.; data curation, M.D.; writing—original draft preparation, M.D.; writing—review and editing, S.S.; visualization, M.D.; supervision, S.S.; project administration, S.S.; funding acquisition, S.S. and N.L.T.
Funding
This research is funded by the German Research foundation (DFG). The investigations are carried out in the project ‘Influence of load-induced temperature fields on the fatigue behavior of UHPC subjected to high frequency compression loading’ (funding period: 09.2017–08.2020, project number: 353981739 (experimental part: SCHE 1966/1-1) as part of the DFG Priority Programme ‘SPP 2020—Cyclic deterioration of High-Performance Concrete in an experimental-virtual lab’ [https://www.spp2020.uni-hannover.de/spp2020.html?&L=1], in which 12 projects all over Germany are involved.
Acknowledgments
First of all, we would like to thank the colleagues in the Otto Mohr Laboratory of the Institute of Concrete Structures, TU Dresden, where the specimens were produced and the experiments took place. Further thanks for the good cooperation go to the colleagues and partners in the SPP research projects and the coordination project of the SPP 2020.
Conflicts of Interest
The authors declare no conflicts of interest.
Appendix A. Materials

Table A1.
Composition details.
| Materials | UHPC 1 | UHPC 2 |
|---|---|---|
| Material composition | ||
| Binder | [kg/m3] | |
| Cement: Holcim Sulfo 5R, CEM I 52,5 R-SR3(na) | 795.4 | 666.5 |
| Microsilica: Sika Silicoll P (uncompact) | 168.6 | 181.5 |
| Aggregate | [kg/m3] | |
| Quartz flour: Quarzwerke W12 | 198.4 | 333.2 |
| Quartz flour: Quarzwerke W3 (rough) | - | 134.3 |
| Fine grit: Quarzwerke H33 | 971.0 | 363.0 |
| Basalt 2/8 | - | 612.1 |
| Liquid Phase | [kg/m3] | |
| Superplasticizer: BASF MasterGlenium ACE 394/SIKA ViscoCrete 2200 HE | 24.1 | 22.8 |
| Water | 187.9 | 162.0 |
| Properties of Fresh Concrete | ||
| Air content [%] | 2.1 | 1.0 |
| Settling flow dimension [cm] | 86 | 78 |
| Density [kg/dm3] | 2.33 | 2.45 |
References
- Oneschkow, N. Analyse des Ermüdungsverhaltens von Beton Anhand der Dehnungsentwicklung. Ph.D. Thesis, Gottfried Wilhelm Leibniz Universität Hannover, Hanover, Germany, 2016. [Google Scholar]
- Tue, N.V.; Mucha, S. Ermüdungsfestigkeit von hochfestem Beton unter Druckbeanspruchung. Bautechnik 2006, 83, 497–504. [Google Scholar] [CrossRef]
- Ibuk, H. Ermüdungsverhalten von Beton unter Druckschwellbelastung. Ph.D. Thesis, Ruhr-Universität Bochum, Bochum, Germany, 2008. [Google Scholar]
- Hohberg, R. Zum Ermüdungsverhalten von Beton. Ph.D. Thesis, TU Berlin, Berlin, Germany, 2004. [Google Scholar]
- Reinhardt, H.W.; Stroeven, P.; Den Uijl, J.A.; Kooistra, T.R.; Vrencken, J.H.A.M. Einfluß von Schwingbreite, Belastungshöhe und Frequenz auf die Schwingfestigkeit von Beton bei niedrigen Bruchlastwechselzahlen. Betonwerk und Fertigteil-Technik 1978, 44, 498–503. [Google Scholar]
- Sparks, P.R.; Menzies, J.B. The effect of rate of loading upon the static and fatigue strength of plain concrete in compression. Mag. Concr. Res. 1973, 25, 73–80. [Google Scholar] [CrossRef]
- Petkovic, G.; Rosseland, S.; Stemland, H.; Lenschow, R. High Strength Concrete SP3—Fatigue. Report 3.2 Fatigue of High Strength Concrete; SINTEF Structural Engineering: Trondheim, Norway, 1992. [Google Scholar]
- Schneider, S.; Hümme, J.; Marx, S.; Lohaus, L. Untersuchungen zum Einfluss der Probekörpergröße auf den Ermüdungswiderstand von hochfestem Beton. Beton- und Stahlbetonbau 2018, 113, 58–67. [Google Scholar] [CrossRef]
- Baktheer, A.; Camps, B.; Hegger, J.; Chudoba, R. Numerical and Experimental Investigations of Concrete Fatigue Behavior Exposed to Varying Loading Ranges. In Proceedings of the International Federation for Structural Concrete 5th International fib Congress, Melbourne, Australia, 8–11 October 2018. [Google Scholar]
- Marx, S. Empfehlungen zur Vereinheitlichung von Ermüdungsversuchen an Druckschwellbeanspruchtem Beton; Institut für Massivbau, Leibniz Universität Hannover: Hannover, Germany, 2013; DAfStb-PA Ermüdung D 12. [Google Scholar]
- Elsmeier, K.; Hümme, J.; Oneschkow, N.; Lohaus, L. Prüftechnische Einflüsse auf das Ermüdungsverhalten hochfester feinkörniger Vergussbetone. Beton- und Stahlbetonbau 2016, 111, 233–240. [Google Scholar] [CrossRef]
- von der Haar, C.; Hümme, J.; Marx, S.; Lohaus, L. Untersuchungen zum Ermüdungsverhalten eines höherfesten Normalbetons. Beton- und Stahlbetonbau 2015, 110, 699–709. [Google Scholar] [CrossRef]
- Elsmeier, K. Influence of temperature on the fatigue behavior of concrete. In Proceedings of the Concrete—Innovation and Design—Proceedings of fib Symposium 2015, Copenhagen, Denmark, 18–20 May 2015. [Google Scholar]
- Frei, V.; Pirskawetz, S.; Thiele, M.; Rogge, A. Experimental investigation of size effect on fatigue behaviour of high strength concrete—Concept and preliminary results. In Proceedings of the Concrete Deterioration Methods—Proceedings 5th International fib Congress, Melbourne, Australia, 8–11 October 2018. [Google Scholar]
- Schneider, S.; Marx, S. Investigation on the influence of loading frequency on the fatigue resistance of high strength concrete. In Proceedings of the 5th International fib Congress, Melbourne, Australia, 8–11 October 2018. [Google Scholar]
- Otto, C.; Lohaus, L. Premature Failure of High-strength Grout in Fatigue Tests due to the Warming of Specimen during Cyclic Loading. In Proceedings of the 6th International fib Congress, Krakow, Poland, 27–29 May 2019. [Google Scholar]
- Deutscher, M.; Tran, N.L.; Scheerer, S. Experimental investigation of load-induced temperature development in UHPC subjected to cyclic loading. In Proceedings of the 6th International fib Congress, Krakow, Poland, 27–29 May 2019. [Google Scholar]
- DIN EN. 12390-3: Prüfung von Festbeton—Teil 3: Druckfestigkeit von Probekörpern; Deutsche Fassung EN: Berlin, Germany, 2009. [Google Scholar]
- Deutscher, M.; Tran, N.L.; Scheerer, S. Experimental investigation of load-induced increase of temperature in UHPC. In Proceedings of the 7th International Conference on Structural Engineering, Mechanics and Computation, Cape Town, South Africa, 2–4 September 2019. [Google Scholar]
- Walraven, J.; Bigaj-van Vilet, A. Fib Model Code for Concrete Structures 2010; Ernst Sohn GmbH & Co. KG: Lausanne, Switzerland, 2013. [Google Scholar]
- Kessler-Kramer, C. Zugtragverhalten von Beton unter Ermüdungsbeanspruchung. Ph.D. Thesis, Universität Fridericiana zu Karlsruhe, Karlsruhe, Germany, 2002. [Google Scholar]
- Weigler, H.; Klausen, D. Ermüdungsverhalten von Beton. Auswirkung einer Beanspruchung im Dauerfestigkeitsbereich. Betonwerk + Fertigteil-Technik 1979, 4, 214–220. [Google Scholar]
- Holmen, J.O. Fatigue design evaluation of offshore concrete structures. Mater. Struct. 1984, 17, 39–42. [Google Scholar] [CrossRef]
- Klausen, D. Festigkeit und Schädigung von Beton Bei Häufig Wiederholter Beanspruchung. Ph.D. Thesis, TU Darmstadt, Darmstadt, Germany, 1978. [Google Scholar]
Figure 1.
(a) Ultra-high performance concrete (UHPC) 1 (max. grain size 1 mm); (b) UHPC 2 (max. grain size 8 mm).
Figure 1.
(a) Ultra-high performance concrete (UHPC) 1 (max. grain size 1 mm); (b) UHPC 2 (max. grain size 8 mm).

Figure 2.
(a) Sample applications for fatigue tests; (b) Variant a in the testing machine.

Figure 3.
Testing machine during an experiment.

Figure 4.
Temperature development of one test specimen made of UHPC 1; test conditions: test frequency fP = 10 Hz, relation between lower and upper stress level Sc,min/Sc,max = 0.1/0.7.
Figure 4.
Temperature development of one test specimen made of UHPC 1; test conditions: test frequency fP = 10 Hz, relation between lower and upper stress level Sc,min/Sc,max = 0.1/0.7.

Figure 5.
Temperature development of all UHPC 1 specimens for maximum stress level of 0.6, 0.7 and 0.8 (a) frequency of 3 Hz; (b) frequency of 10 Hz; (c) frequency of 20 Hz.
Figure 5.
Temperature development of all UHPC 1 specimens for maximum stress level of 0.6, 0.7 and 0.8 (a) frequency of 3 Hz; (b) frequency of 10 Hz; (c) frequency of 20 Hz.

Figure 6.
Comparison of the numbers of cycles to failure of the UHPC 1 specimens in relation to the Wöhler curve of the fib Model Code 2010 [20].
Figure 6.
Comparison of the numbers of cycles to failure of the UHPC 1 specimens in relation to the Wöhler curve of the fib Model Code 2010 [20].

Figure 7.
Temperature development of specimens made of UHPC 1 an UHPC 2; test conditions: test frequency fP = 10 Hz, relation between lower and upper stress level Sc,min/Sc,max = 0.1/0.7.
Figure 7.
Temperature development of specimens made of UHPC 1 an UHPC 2; test conditions: test frequency fP = 10 Hz, relation between lower and upper stress level Sc,min/Sc,max = 0.1/0.7.

Figure 8.
Heating rate of UHPC 1 specimens for test frequency fP = 3 Hz, fP = 10 Hz and fP = 20 Hz and relation between lower and upper stress level Sc,min/Sc,max = 0.1/0.7, (a) related to the load cycles (lc); (b) related to the time (s).
Figure 8.
Heating rate of UHPC 1 specimens for test frequency fP = 3 Hz, fP = 10 Hz and fP = 20 Hz and relation between lower and upper stress level Sc,min/Sc,max = 0.1/0.7, (a) related to the load cycles (lc); (b) related to the time (s).

Figure 9.
Comparison of the Heating rate of UHPC 1 and UHPC 2 specimens for test frequency fP = 10 Hz and relation between lower and upper stress level Sc,min/Sc,max = 0.1/0.7. The heating rate is related to the load cycles (lc).
Figure 9.
Comparison of the Heating rate of UHPC 1 and UHPC 2 specimens for test frequency fP = 10 Hz and relation between lower and upper stress level Sc,min/Sc,max = 0.1/0.7. The heating rate is related to the load cycles (lc).

Figure 10.
Comparison of the heating rate of UHPC 1 and UHPC 2 specimens for test frequency fP = 10 Hz and relation between lower and upper stress level Sc,min/Sc,max = 0.1/0.7. The heating rate is related to the percentage test duration.
Figure 10.
Comparison of the heating rate of UHPC 1 and UHPC 2 specimens for test frequency fP = 10 Hz and relation between lower and upper stress level Sc,min/Sc,max = 0.1/0.7. The heating rate is related to the percentage test duration.

Figure 11.
Heating rate of UHPC 1 specimens for test frequency fP = 3 Hz and an upper stress level of Sc,max = 0.6, Sc,max = 0.7 and Sc,max = 0.8.
Figure 11.
Heating rate of UHPC 1 specimens for test frequency fP = 3 Hz and an upper stress level of Sc,max = 0.6, Sc,max = 0.7 and Sc,max = 0.8.

Table 1.
Experimental program.
| UHPC 1 (max grain size 1 mm) | ||
| Designation | Maximum stress level σc/fc [–] | Load frequency fP [Hz] |
| UHPC1-S-0.6-3 (a,b,c) | 0.6 | 3 |
| UHPC1-S-0.6-10 (a,b,c) | 0.6 | 10 |
| UHPC1-S-0.6-20 (a,b,c) | 0.6 | 20 |
| UHPC1-S-0.7-3 (a,b,c) | 0.7 | 3 |
| UHPC1-S-0.7-10 (a,b,c) | 0.7 | 10 |
| UHPC1-S-0.7-20 (a,b,c) | 0.7 | 20 |
| UHPC1-S-0.8-3 (a,b,c) | 0.8 | 3 |
| UHPC1-S-0.8-10 (a,b,c) | 0.8 | 10 |
| UHPC1-S-0.8-20 (a,b,c) | 0.8 | 20 |
| UHPC 2 (max grain size 8 mm) | ||
| Designation | Maximum stress level σc/fc [–] | Load frequency fP [Hz] |
| UHPC2-S-0.7-10 (a,b,c) | 0.7 | 10 |
Table 2.
Composition details and material properties.
| Materials | UHPC 1 | UHPC 2 |
| Material composition | ||
| Water-cement ratio [–] | 0.24 | 0.24 |
| Maximum grain size [mm] | 1 | 8 |
| Material properties | ||
| Compressive strength after 28 days [N/mm2] | 162.66 | 167.20 |
| Compressive strength after 90 days [N/mm2] | 182.70 | 184.40 |
| Elastic modulus [N/mm2] | 47,050 | 50,495 |
© 2019 by the authors. Licensee MDPI, Basel, Switzerland. This article is an open access article distributed under the terms and conditions of the Creative Commons Attribution (CC BY) license (http://creativecommons.org/licenses/by/4.0/).
Share and Cite
MDPI and ACS Style
Deutscher, M.; Tran, N.L.; Scheerer, S. Experimental Investigations on the Temperature Increase of Ultra-High Performance Concrete under Fatigue Loading. Appl. Sci. 2019, 9, 4087. https://doi.org/10.3390/app9194087
AMA Style
Deutscher M, Tran NL, Scheerer S. Experimental Investigations on the Temperature Increase of Ultra-High Performance Concrete under Fatigue Loading. Applied Sciences. 2019; 9(19):4087. https://doi.org/10.3390/app9194087
Chicago/Turabian StyleDeutscher, Melchior, Ngoc Linh Tran, and Silke Scheerer. 2019. "Experimental Investigations on the Temperature Increase of Ultra-High Performance Concrete under Fatigue Loading" Applied Sciences 9, no. 19: 4087. https://doi.org/10.3390/app9194087
Note that from the first issue of 2016, this journal uses article numbers instead of page numbers. See further details here.