Preparation and Characterization of Chitosan–Alginate Polyelectrolyte Complexes Loaded with Antibacterial Thyme Oil Nanoemulsions

Abstract
:
1. Introduction
2. Material and Methods
2.1. Material
2.2. Nanoemulsion Preparation
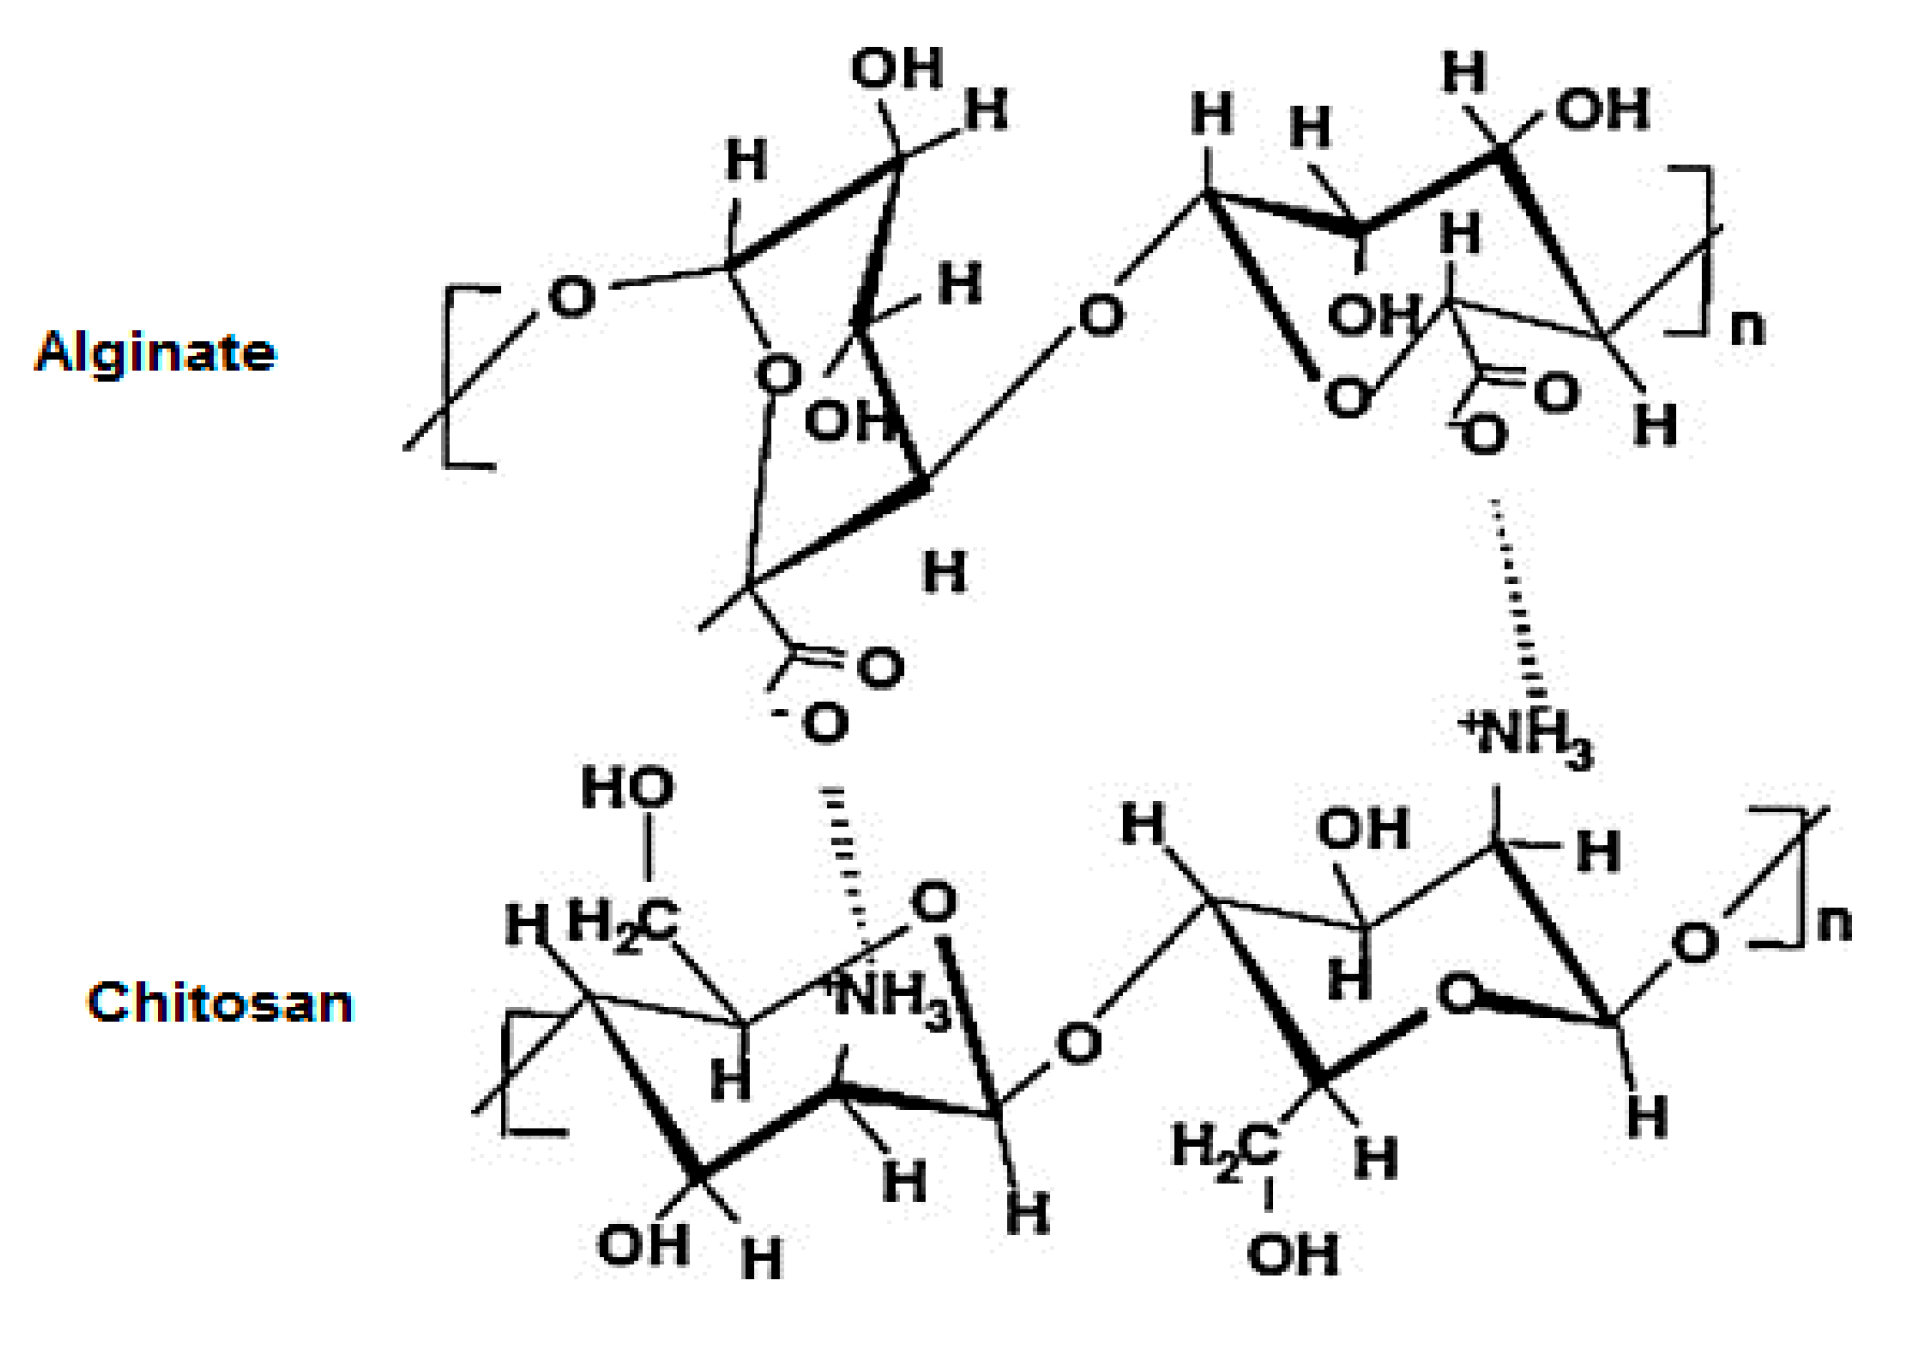
2.3. Polyelectrolyte Complex Preparation
3. Characterization
3.1. Entrapment Efficiency (EE) and Drug Loading (DL)
3.2. Particle Size and Charge Measurements
3.3. Morphology Studies
3.4. Fourier Transform Infrared Spectroscopy (FTIR)
3.5. PEC Swelling Ratio
3.6. Water Vapor Transmission Rate
3.7. pH Sensitivity
3.8. Mechanical Test
3.9. Cytotoxicity Test
3.10. In Vitro Test
3.11. Drug Release
3.12. Drug Release Kinetics
3.13. Drug Release Method Validation
3.14. Statistical Analysis
4. Results and Discussion
4.1. Entrapment Efficiency and Drug Loading
4.2. Hydrodynamic Emulsion Particle Diameters and Particle Charge Measurements
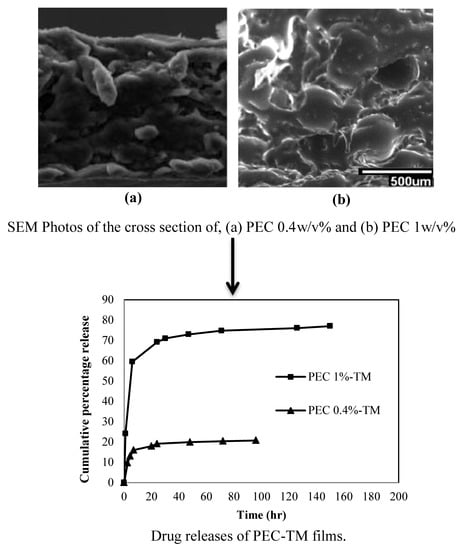
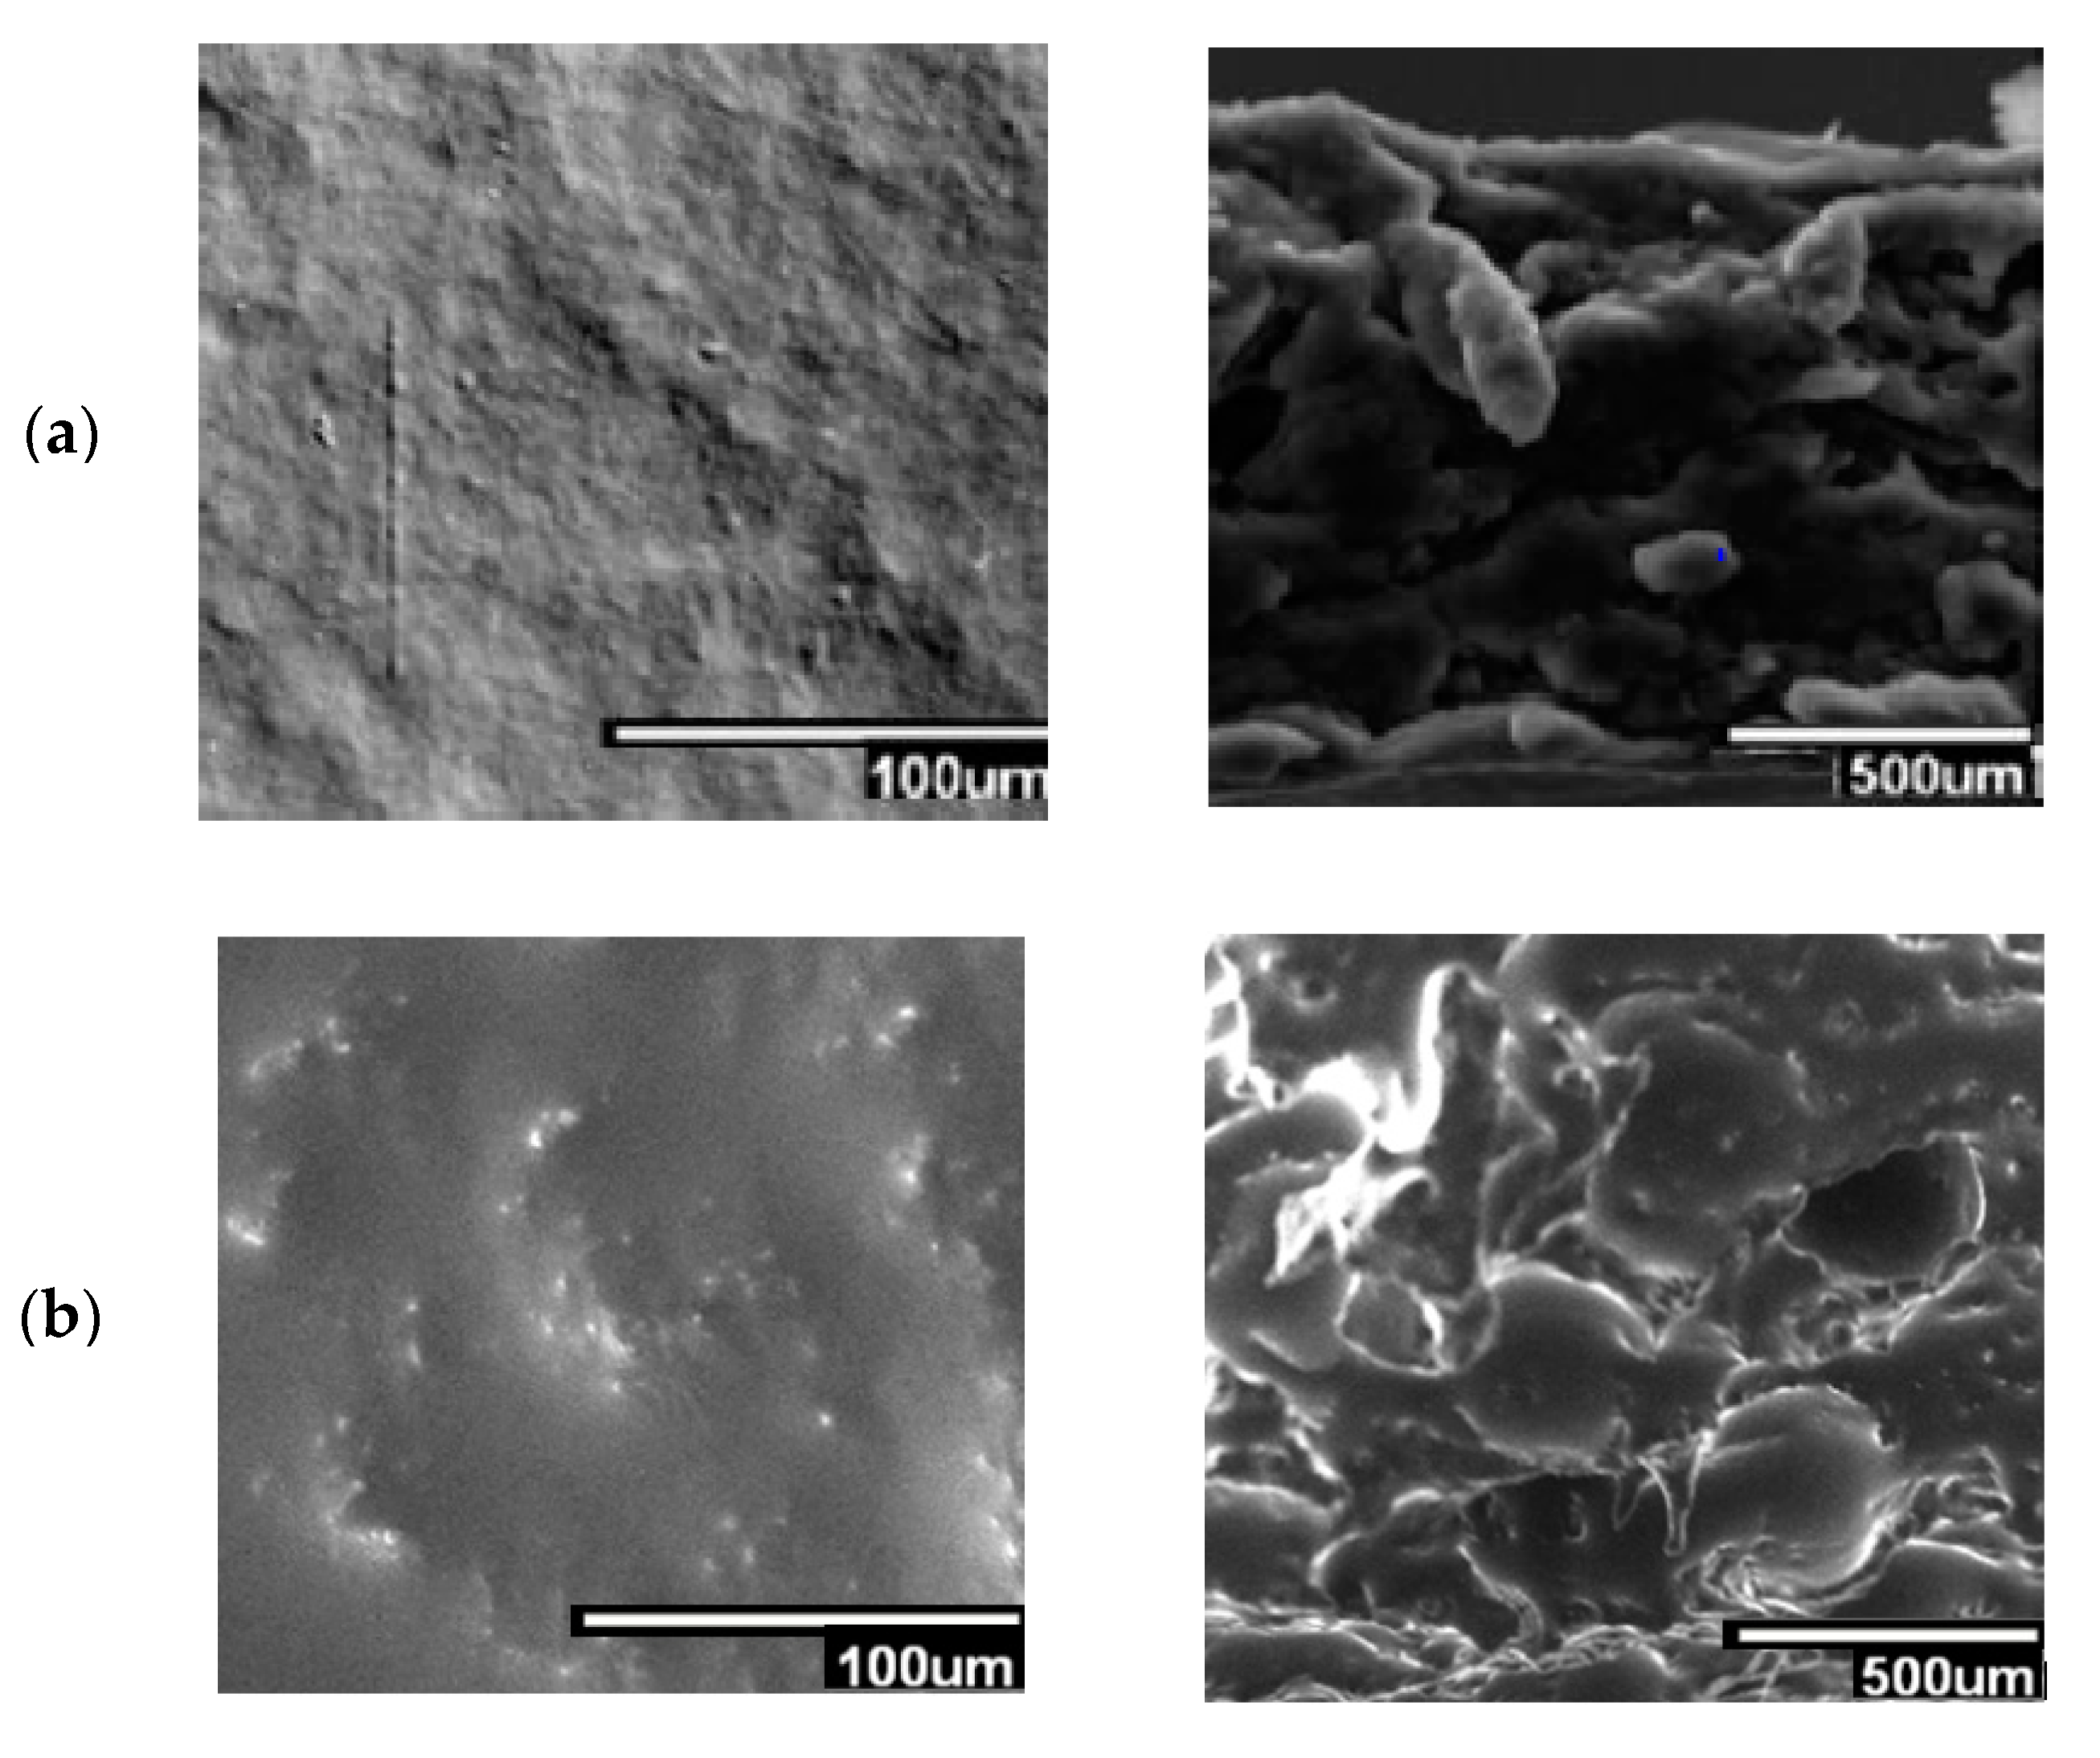
4.3. Morphology
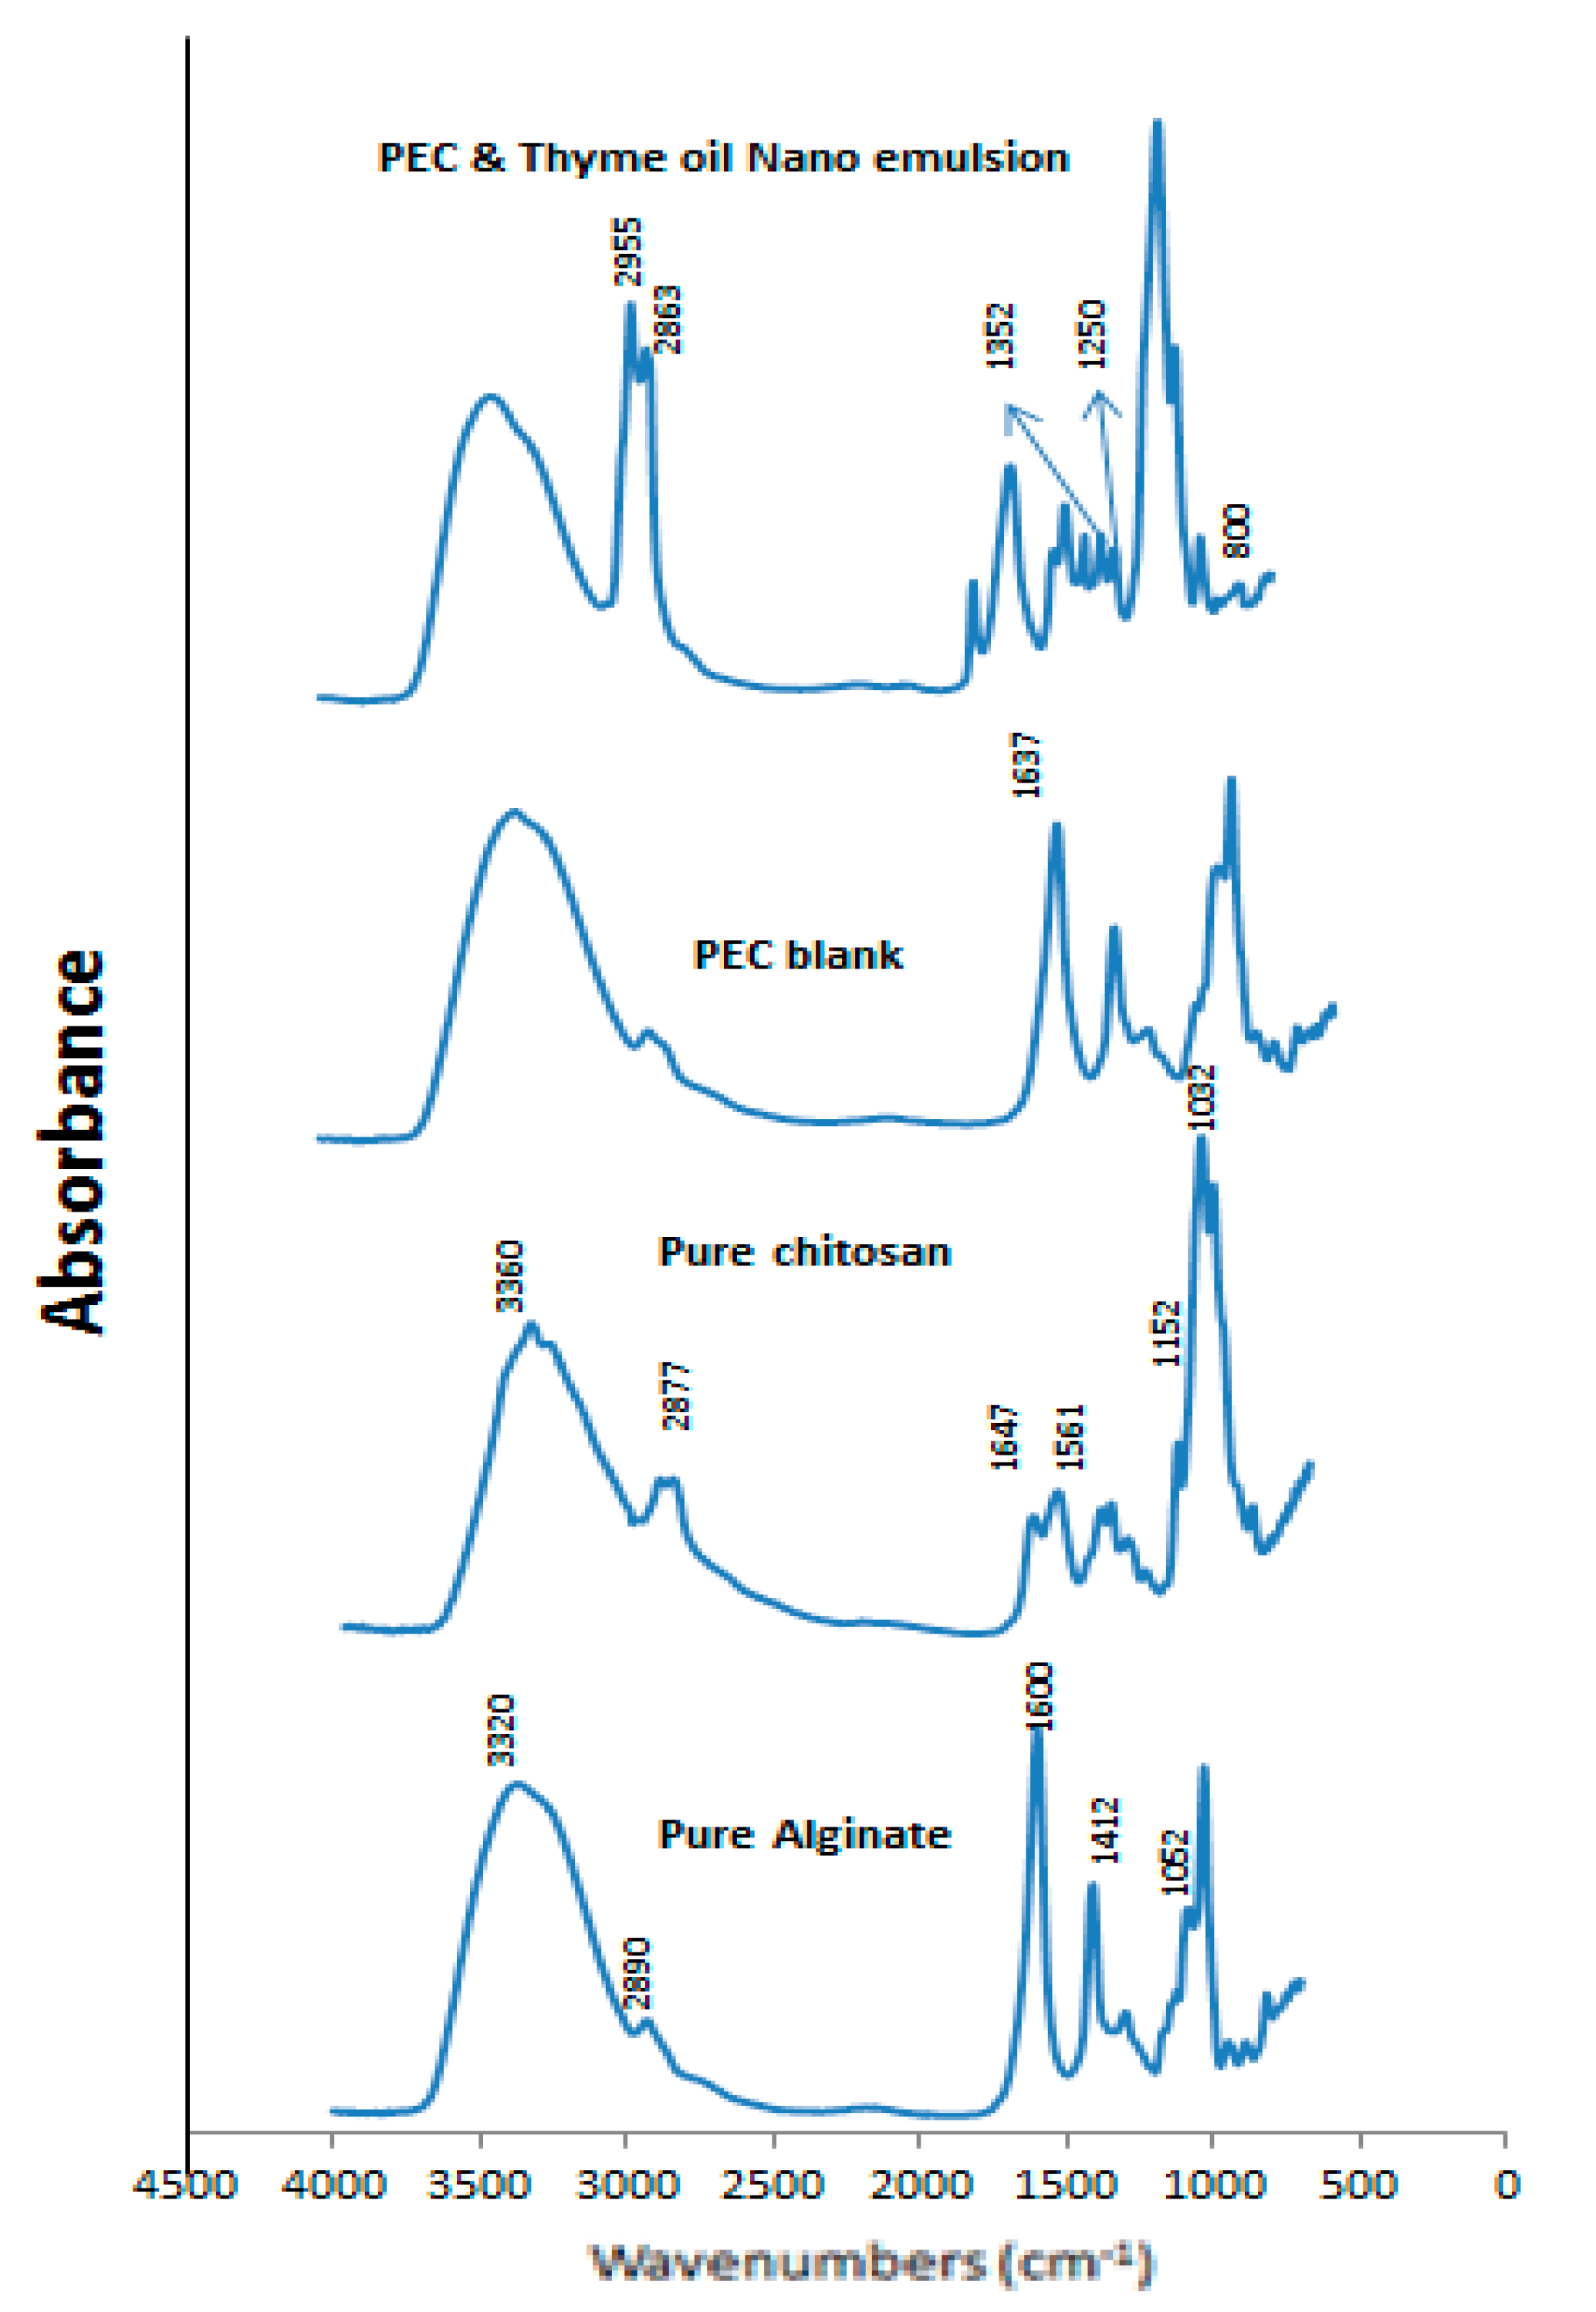
4.4. FTIR Analysis
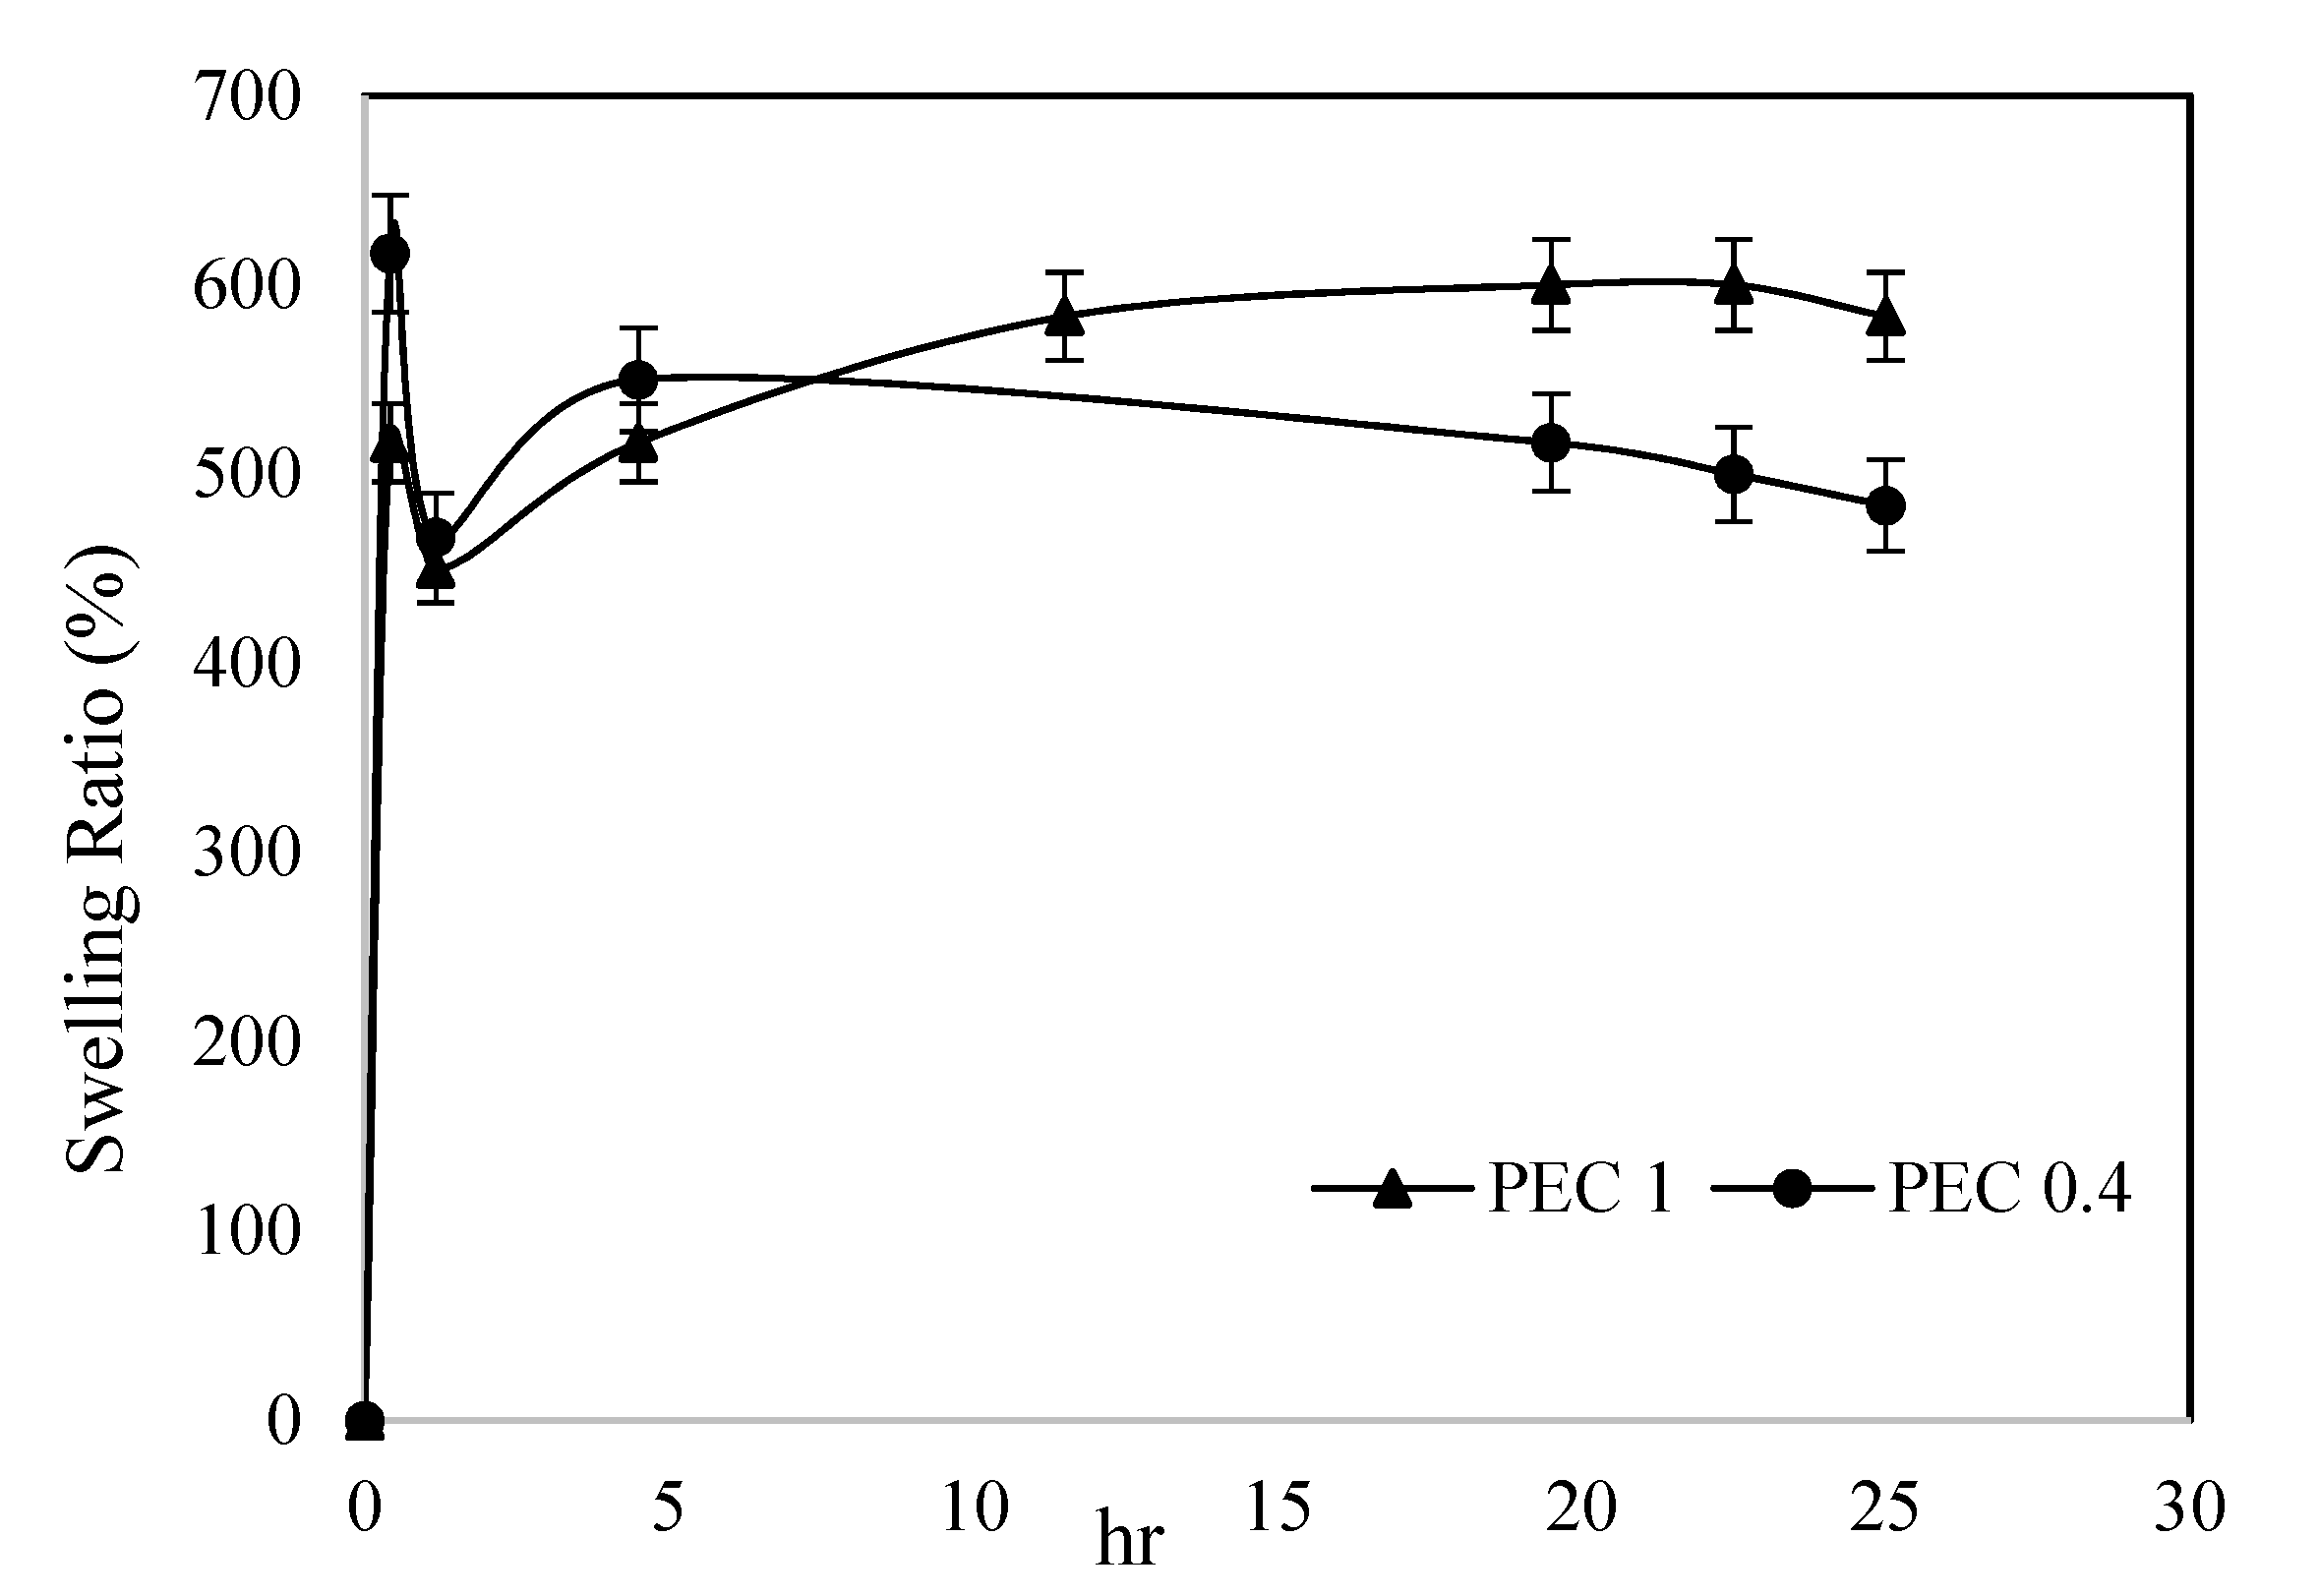
4.5. Swelling Ratio
4.6. Water Vapor Transmission Rate (WVTR)
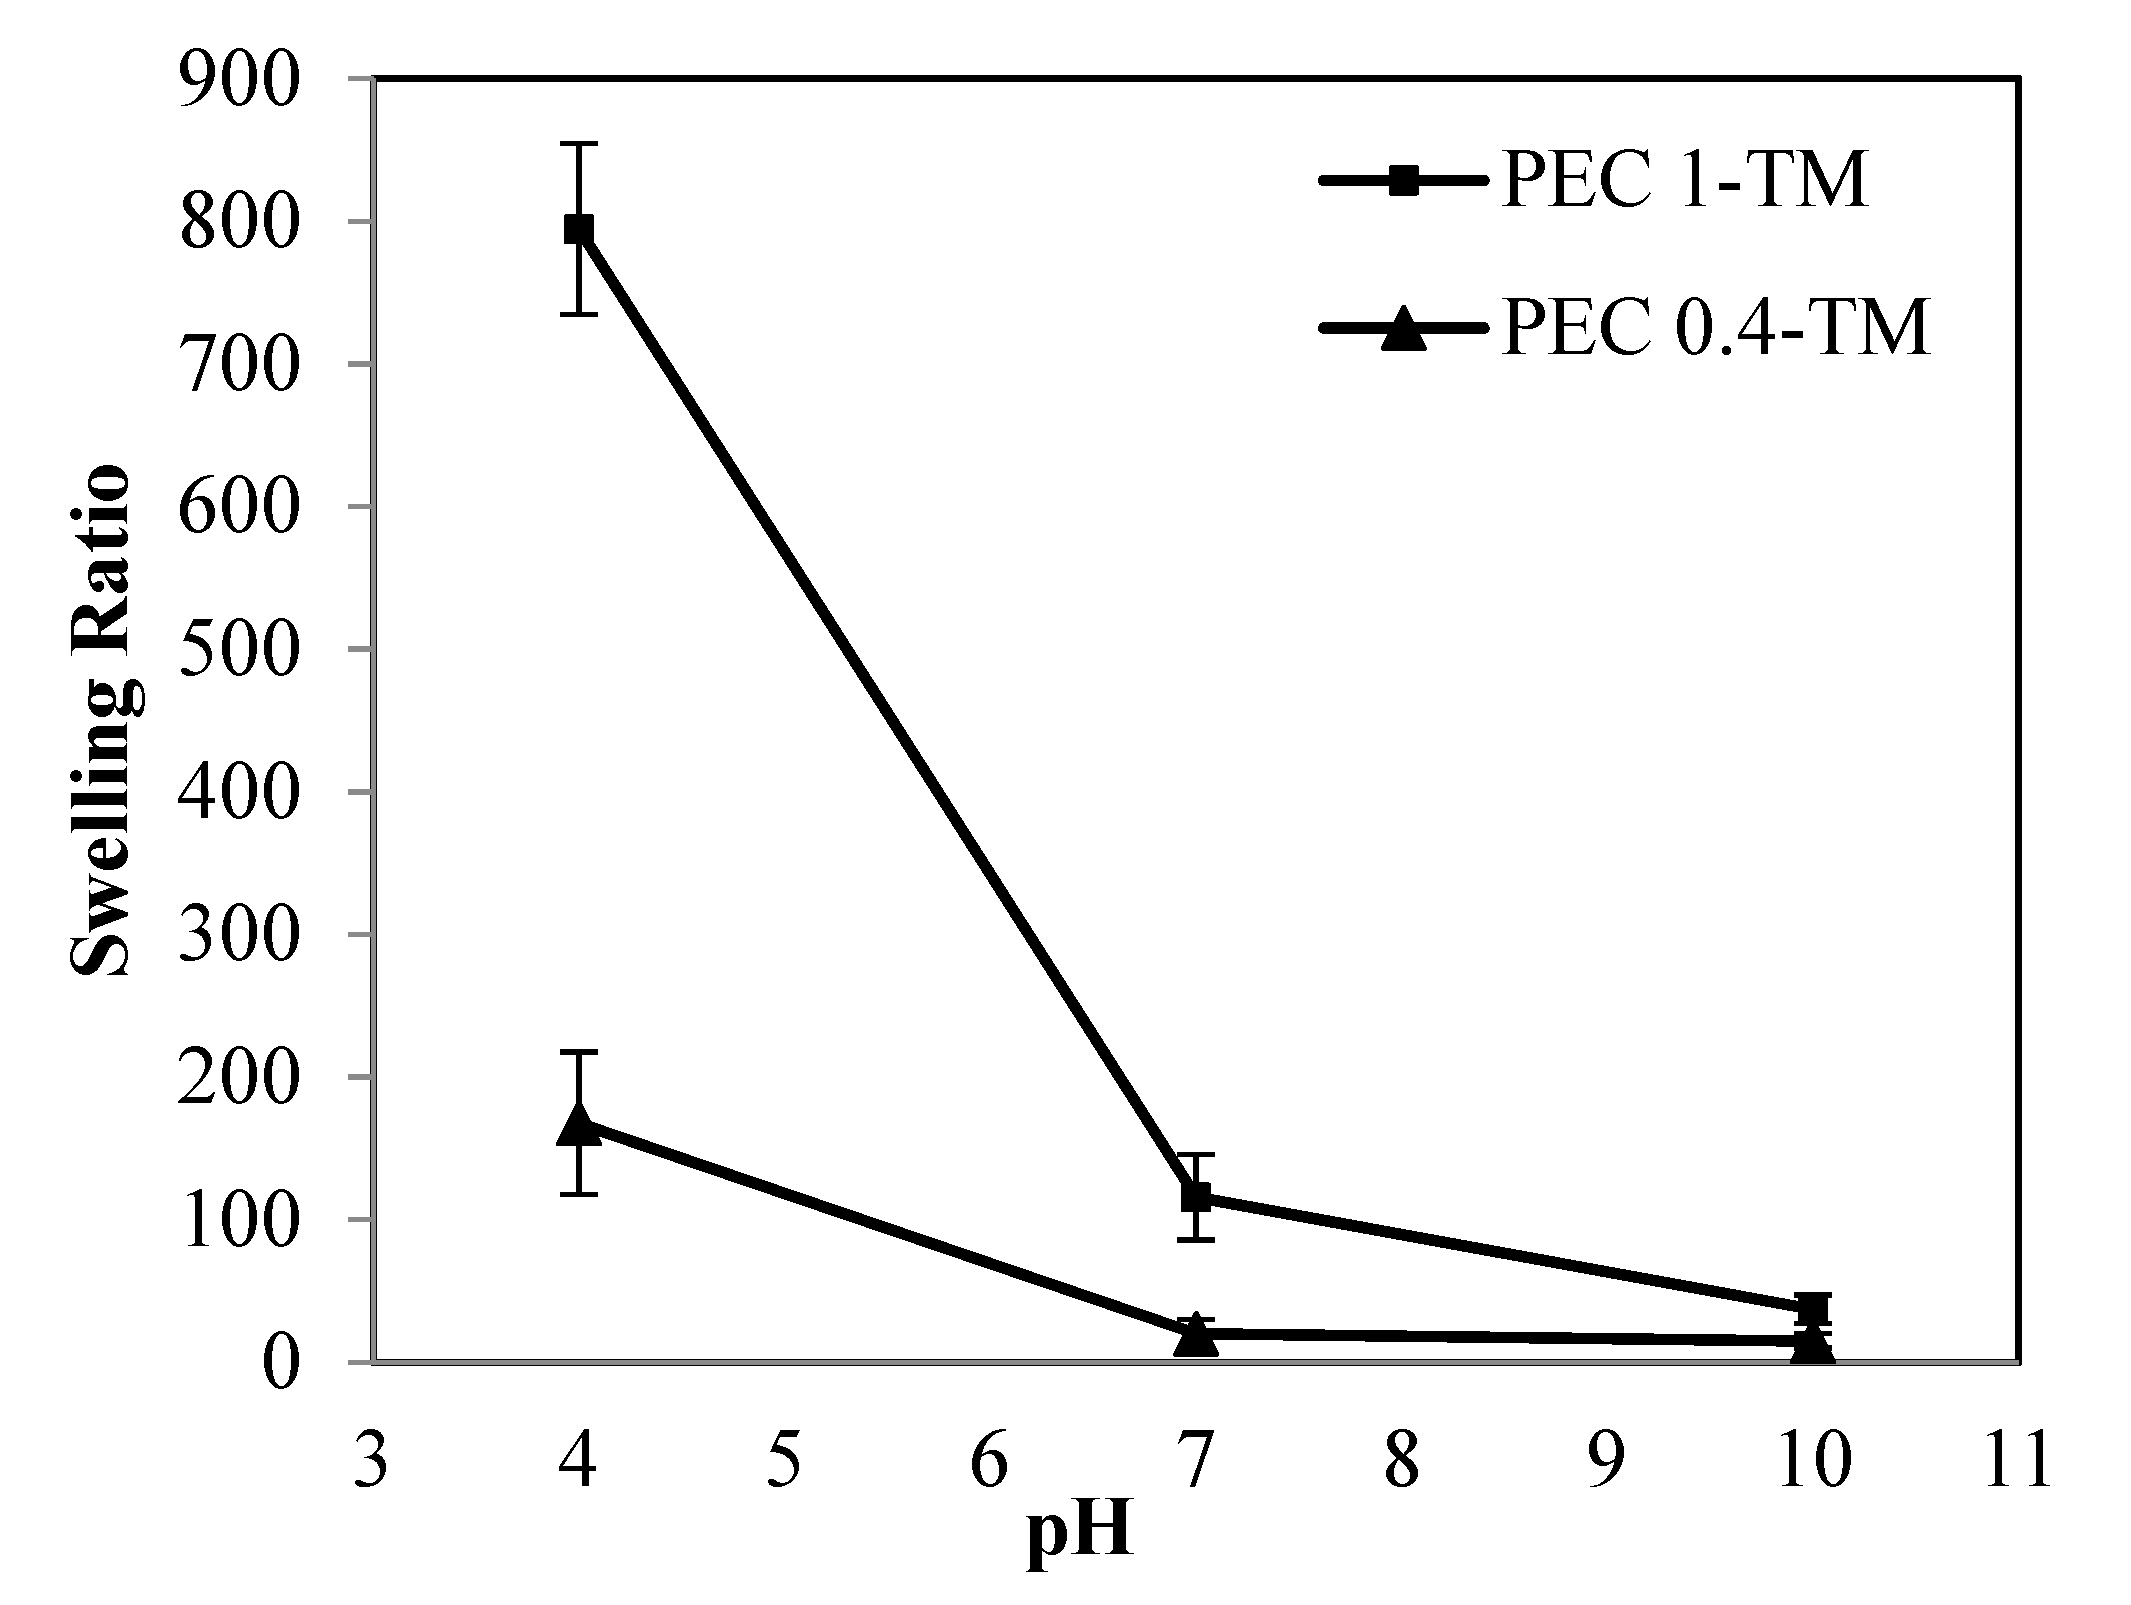
4.7. pH Sensitivity
4.8. Mechanical Tests
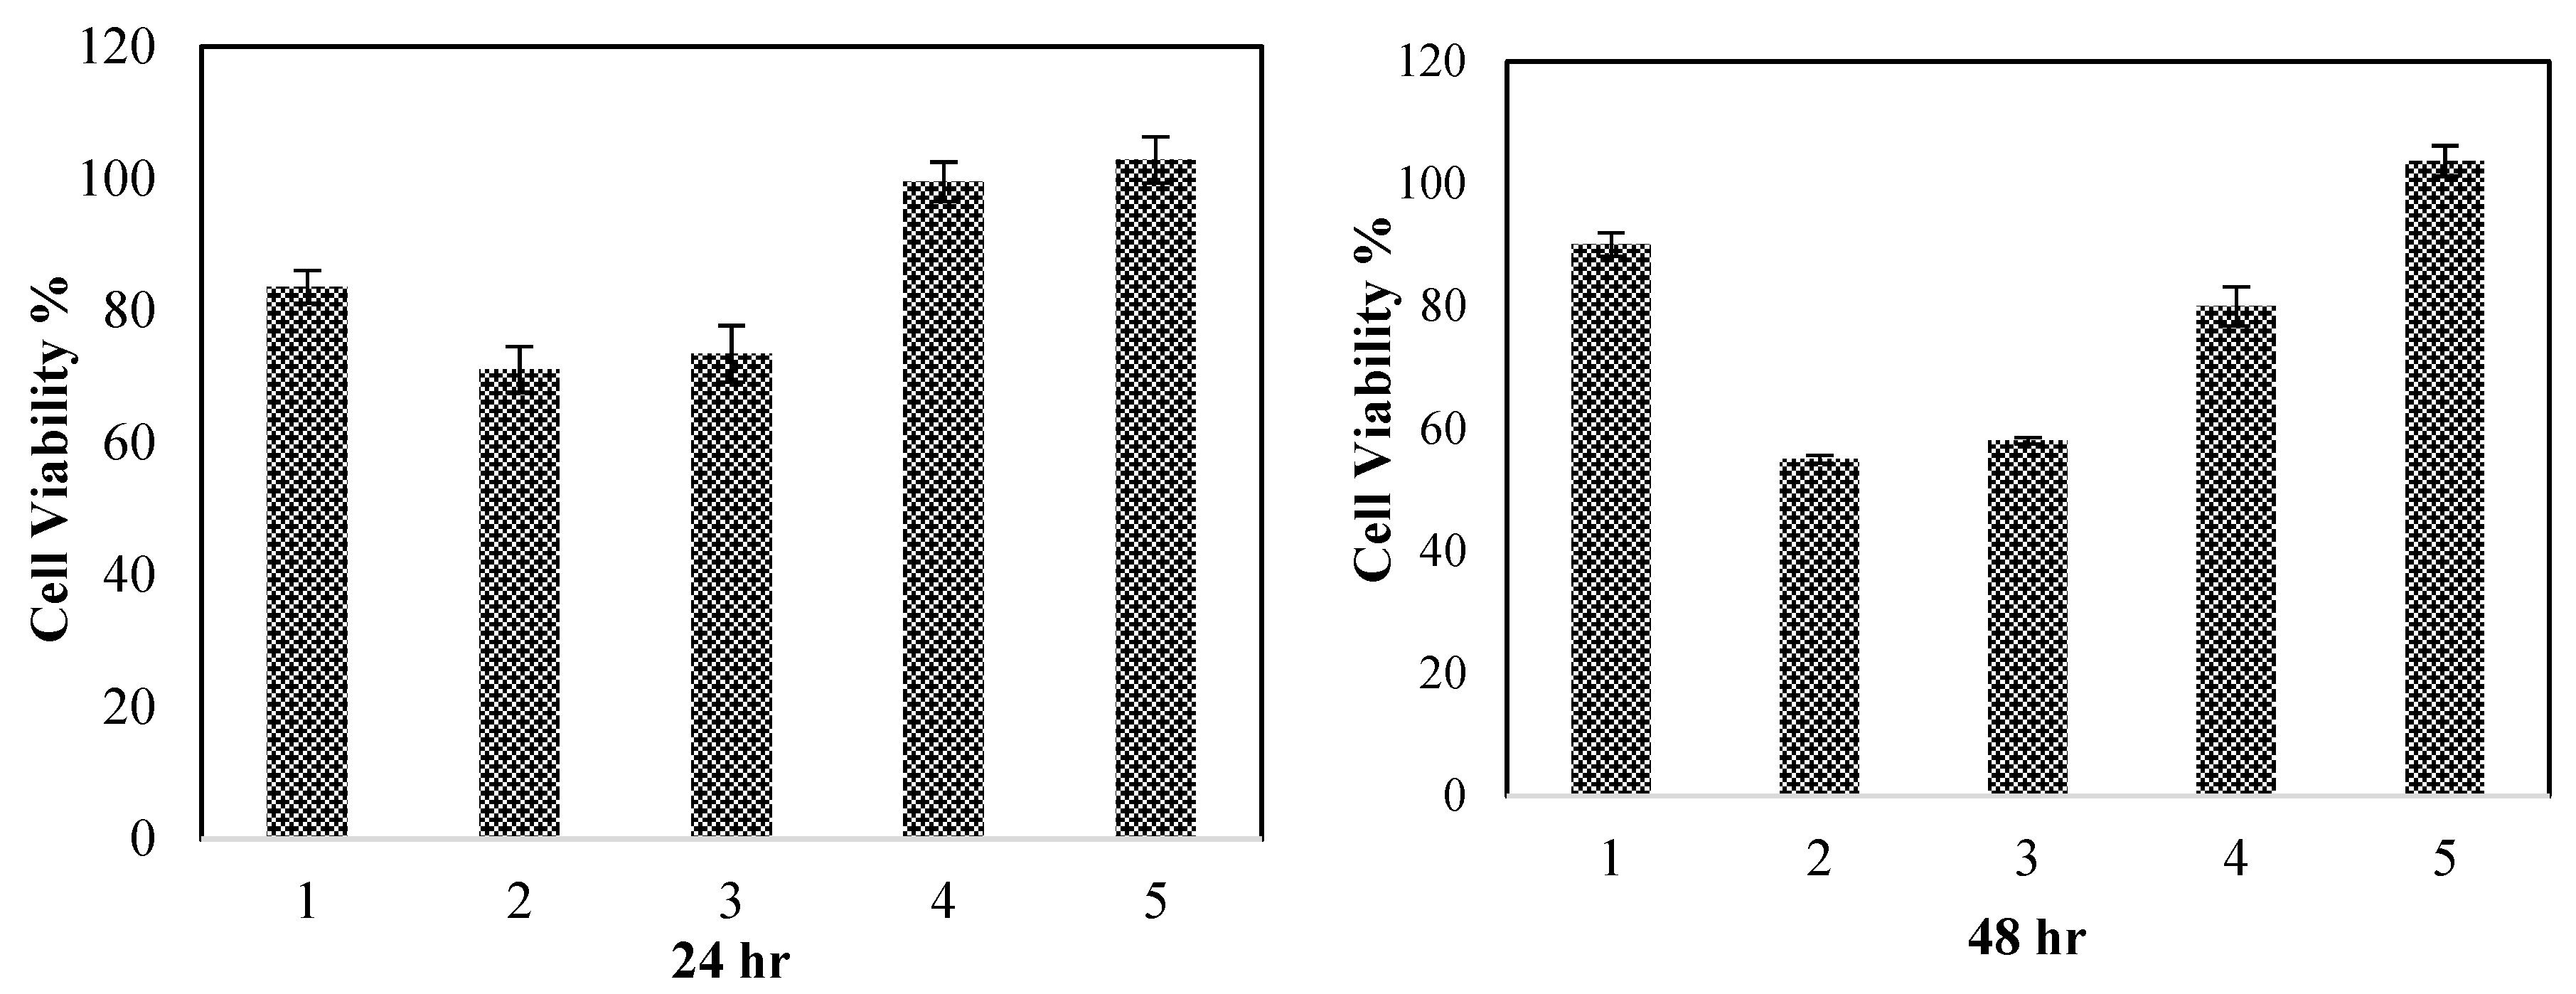
4.9. Cytotoxicity Test
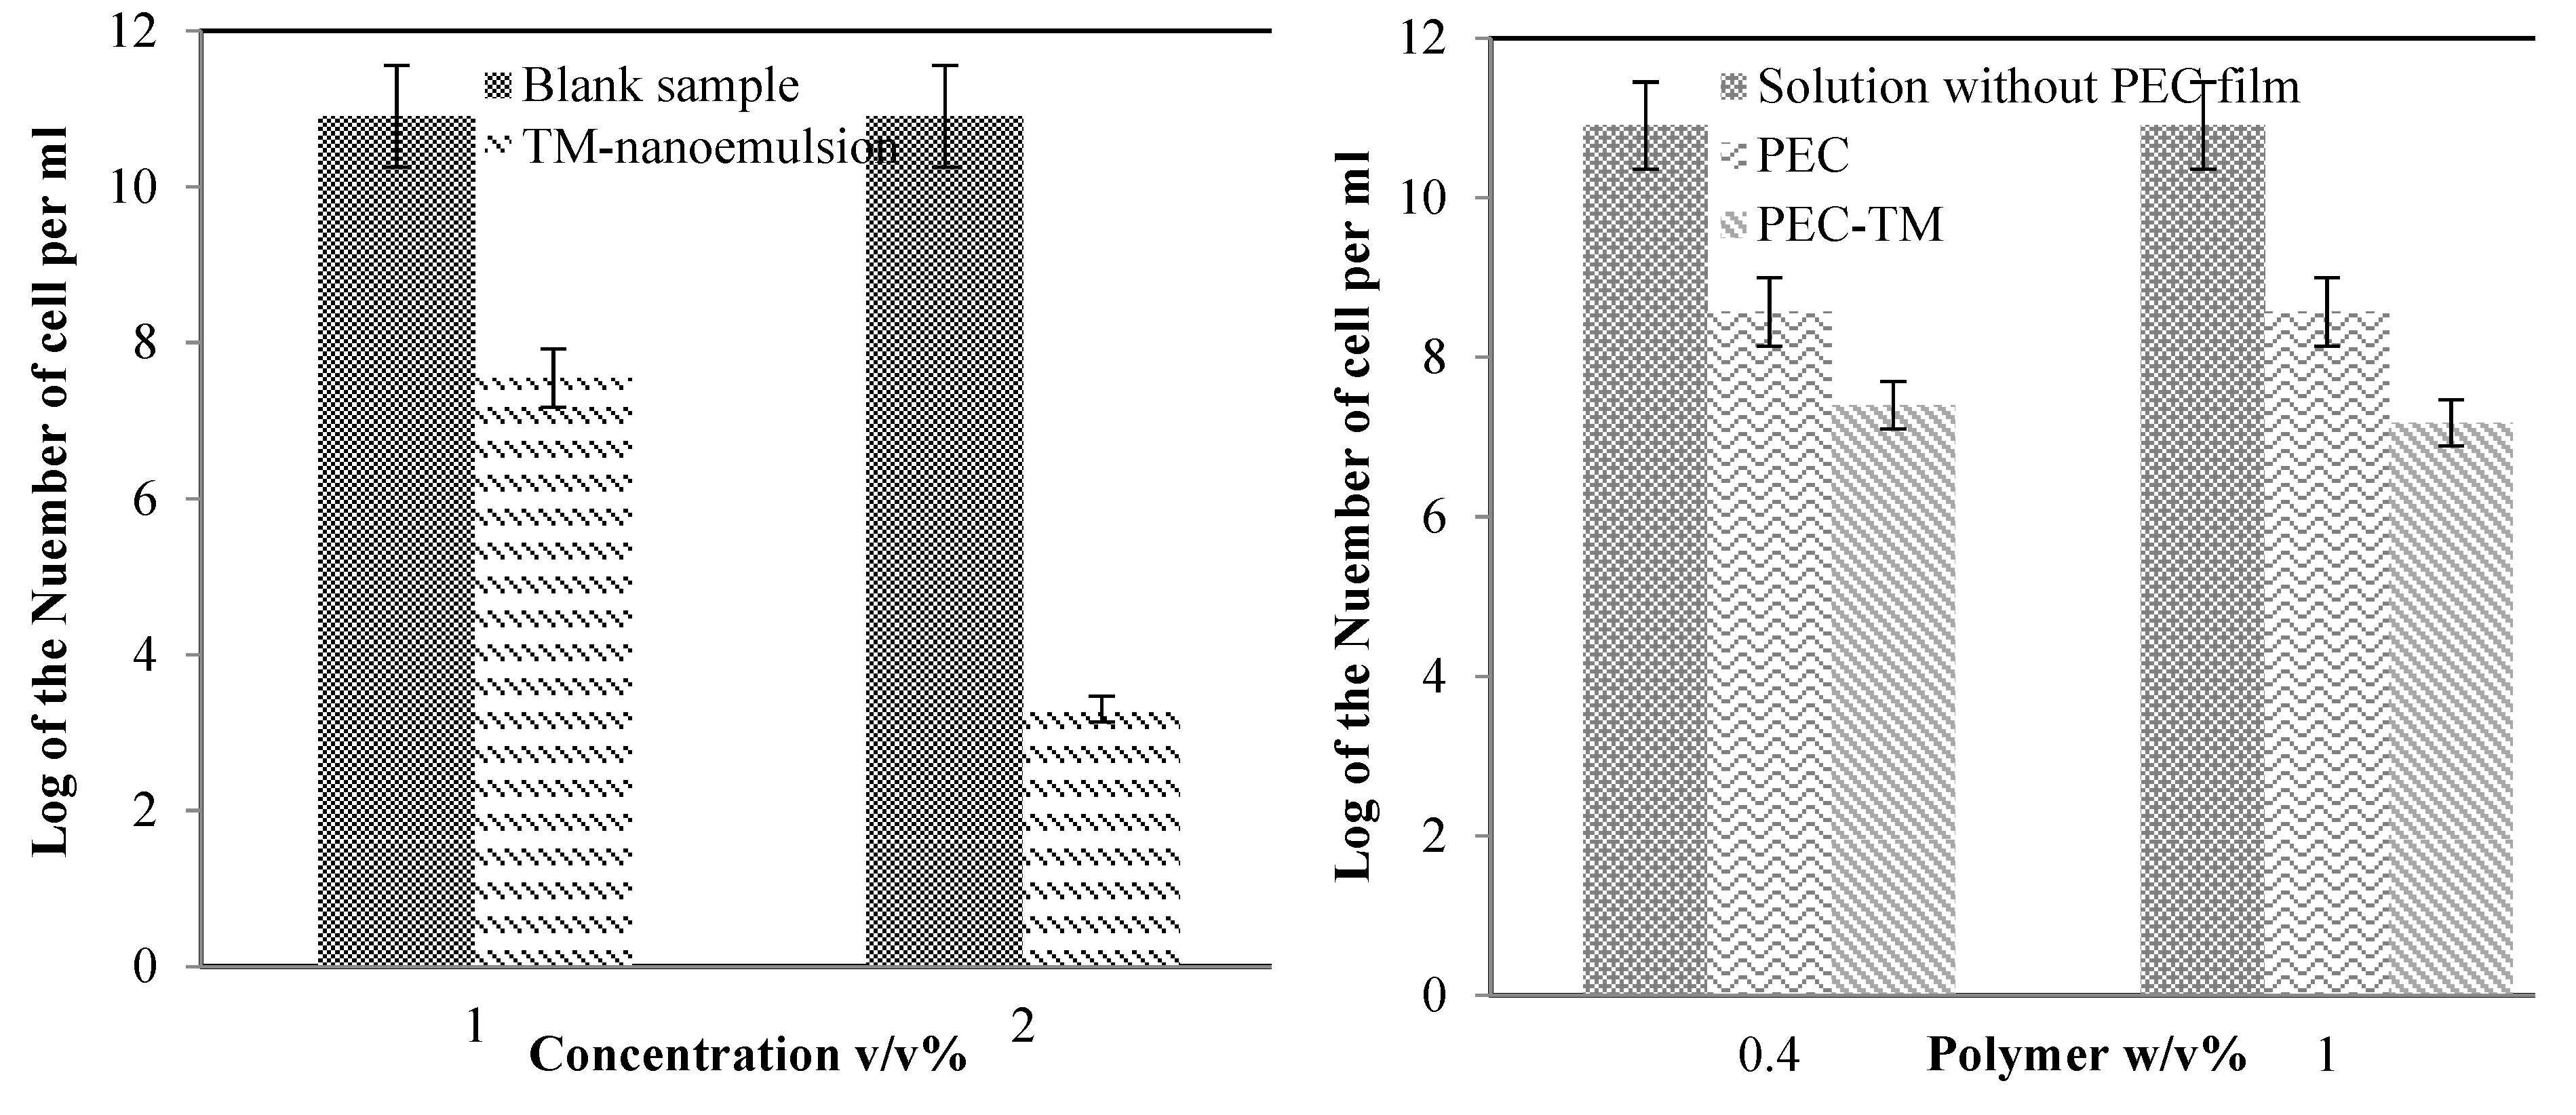
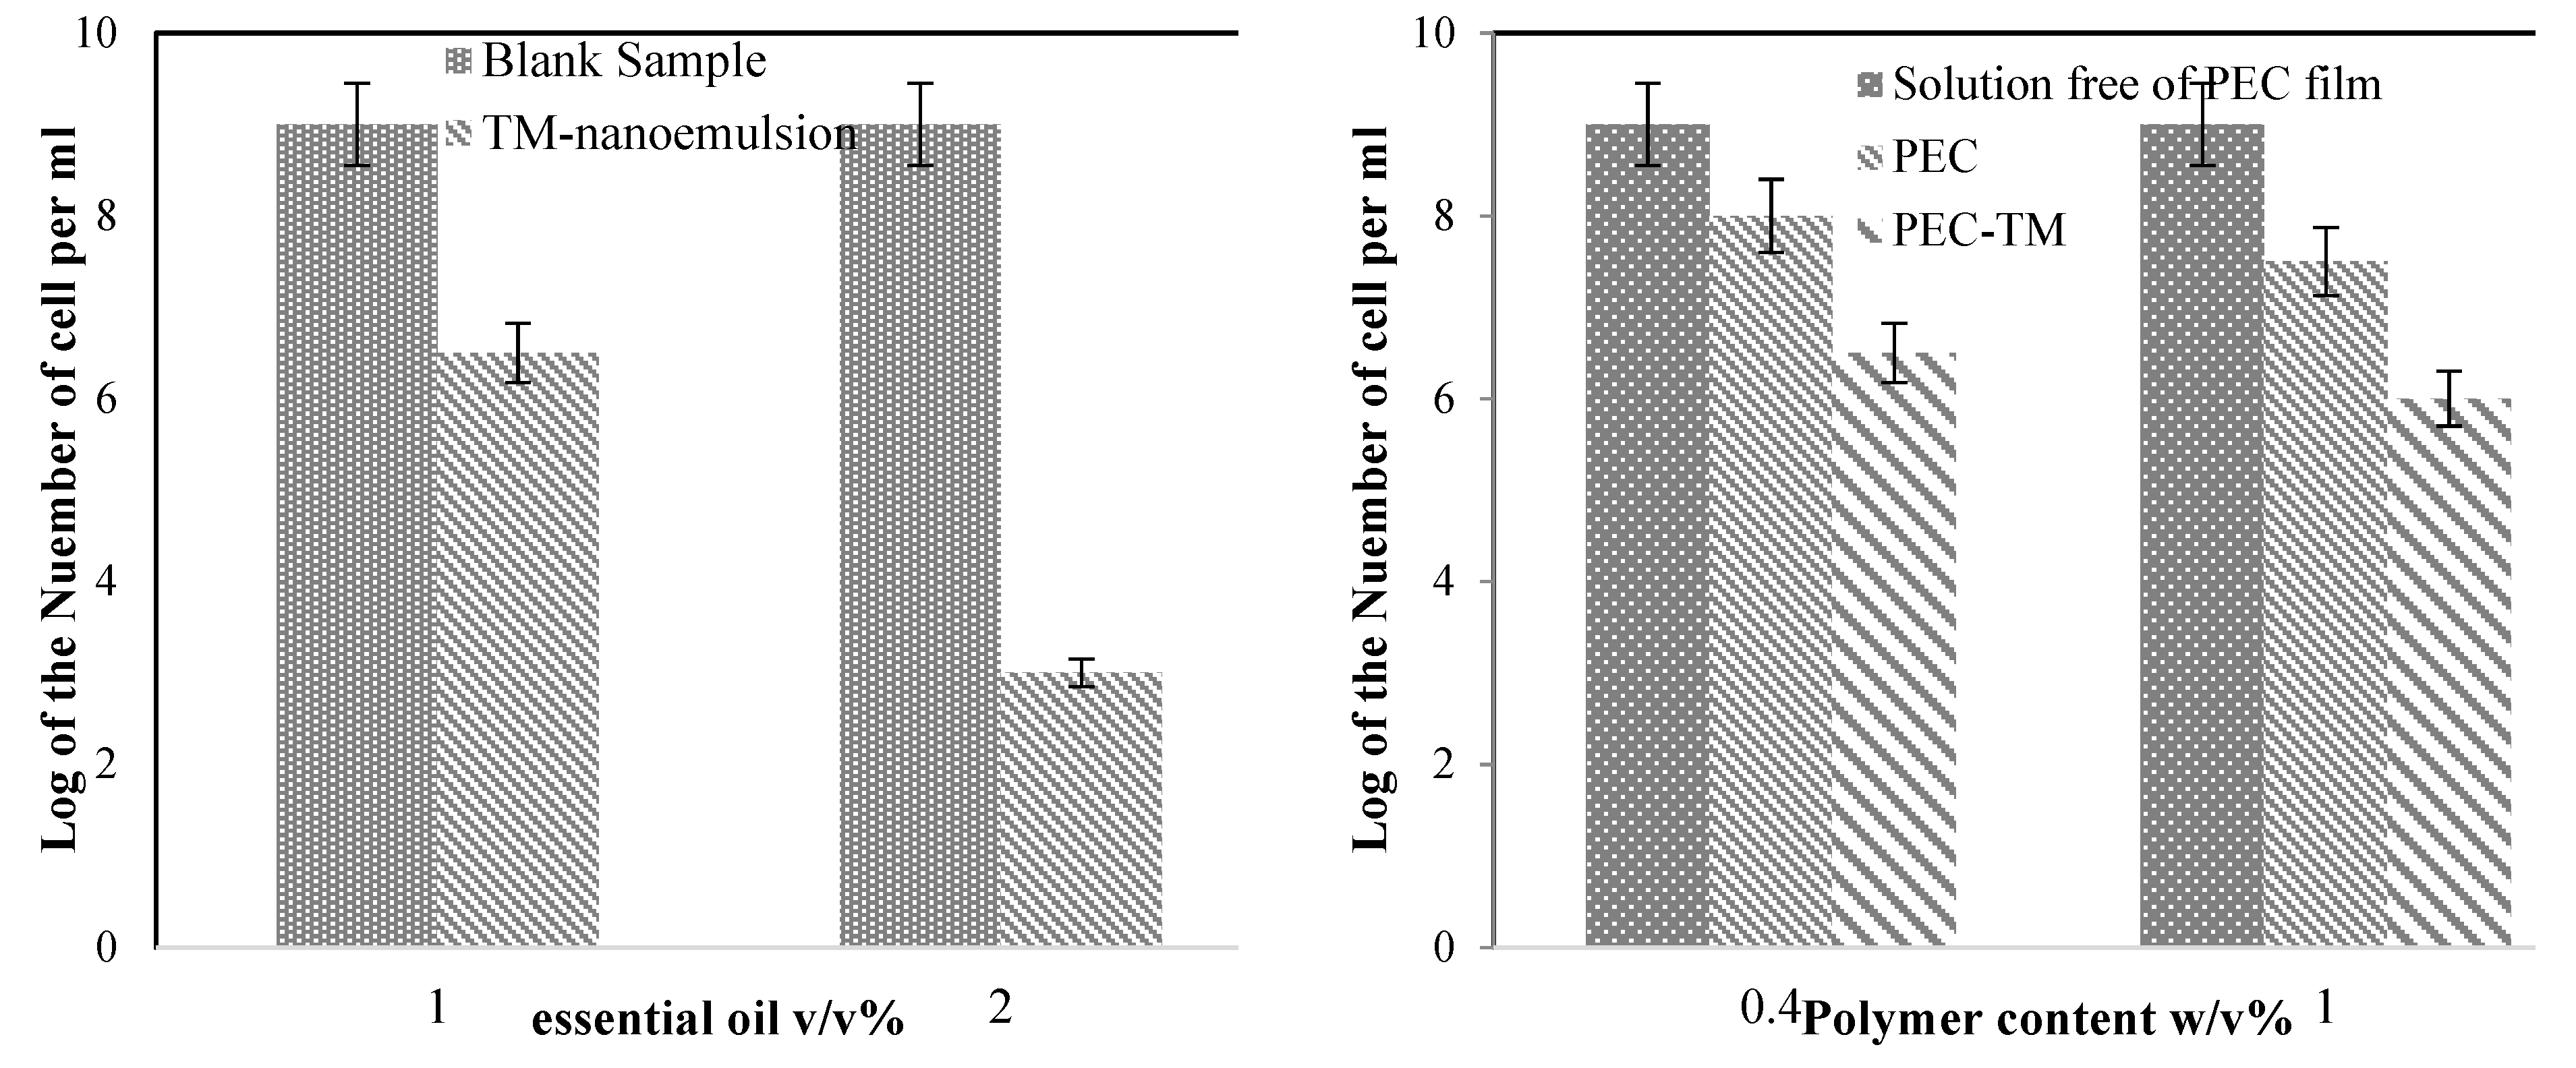
4.10. Antibacterial Test
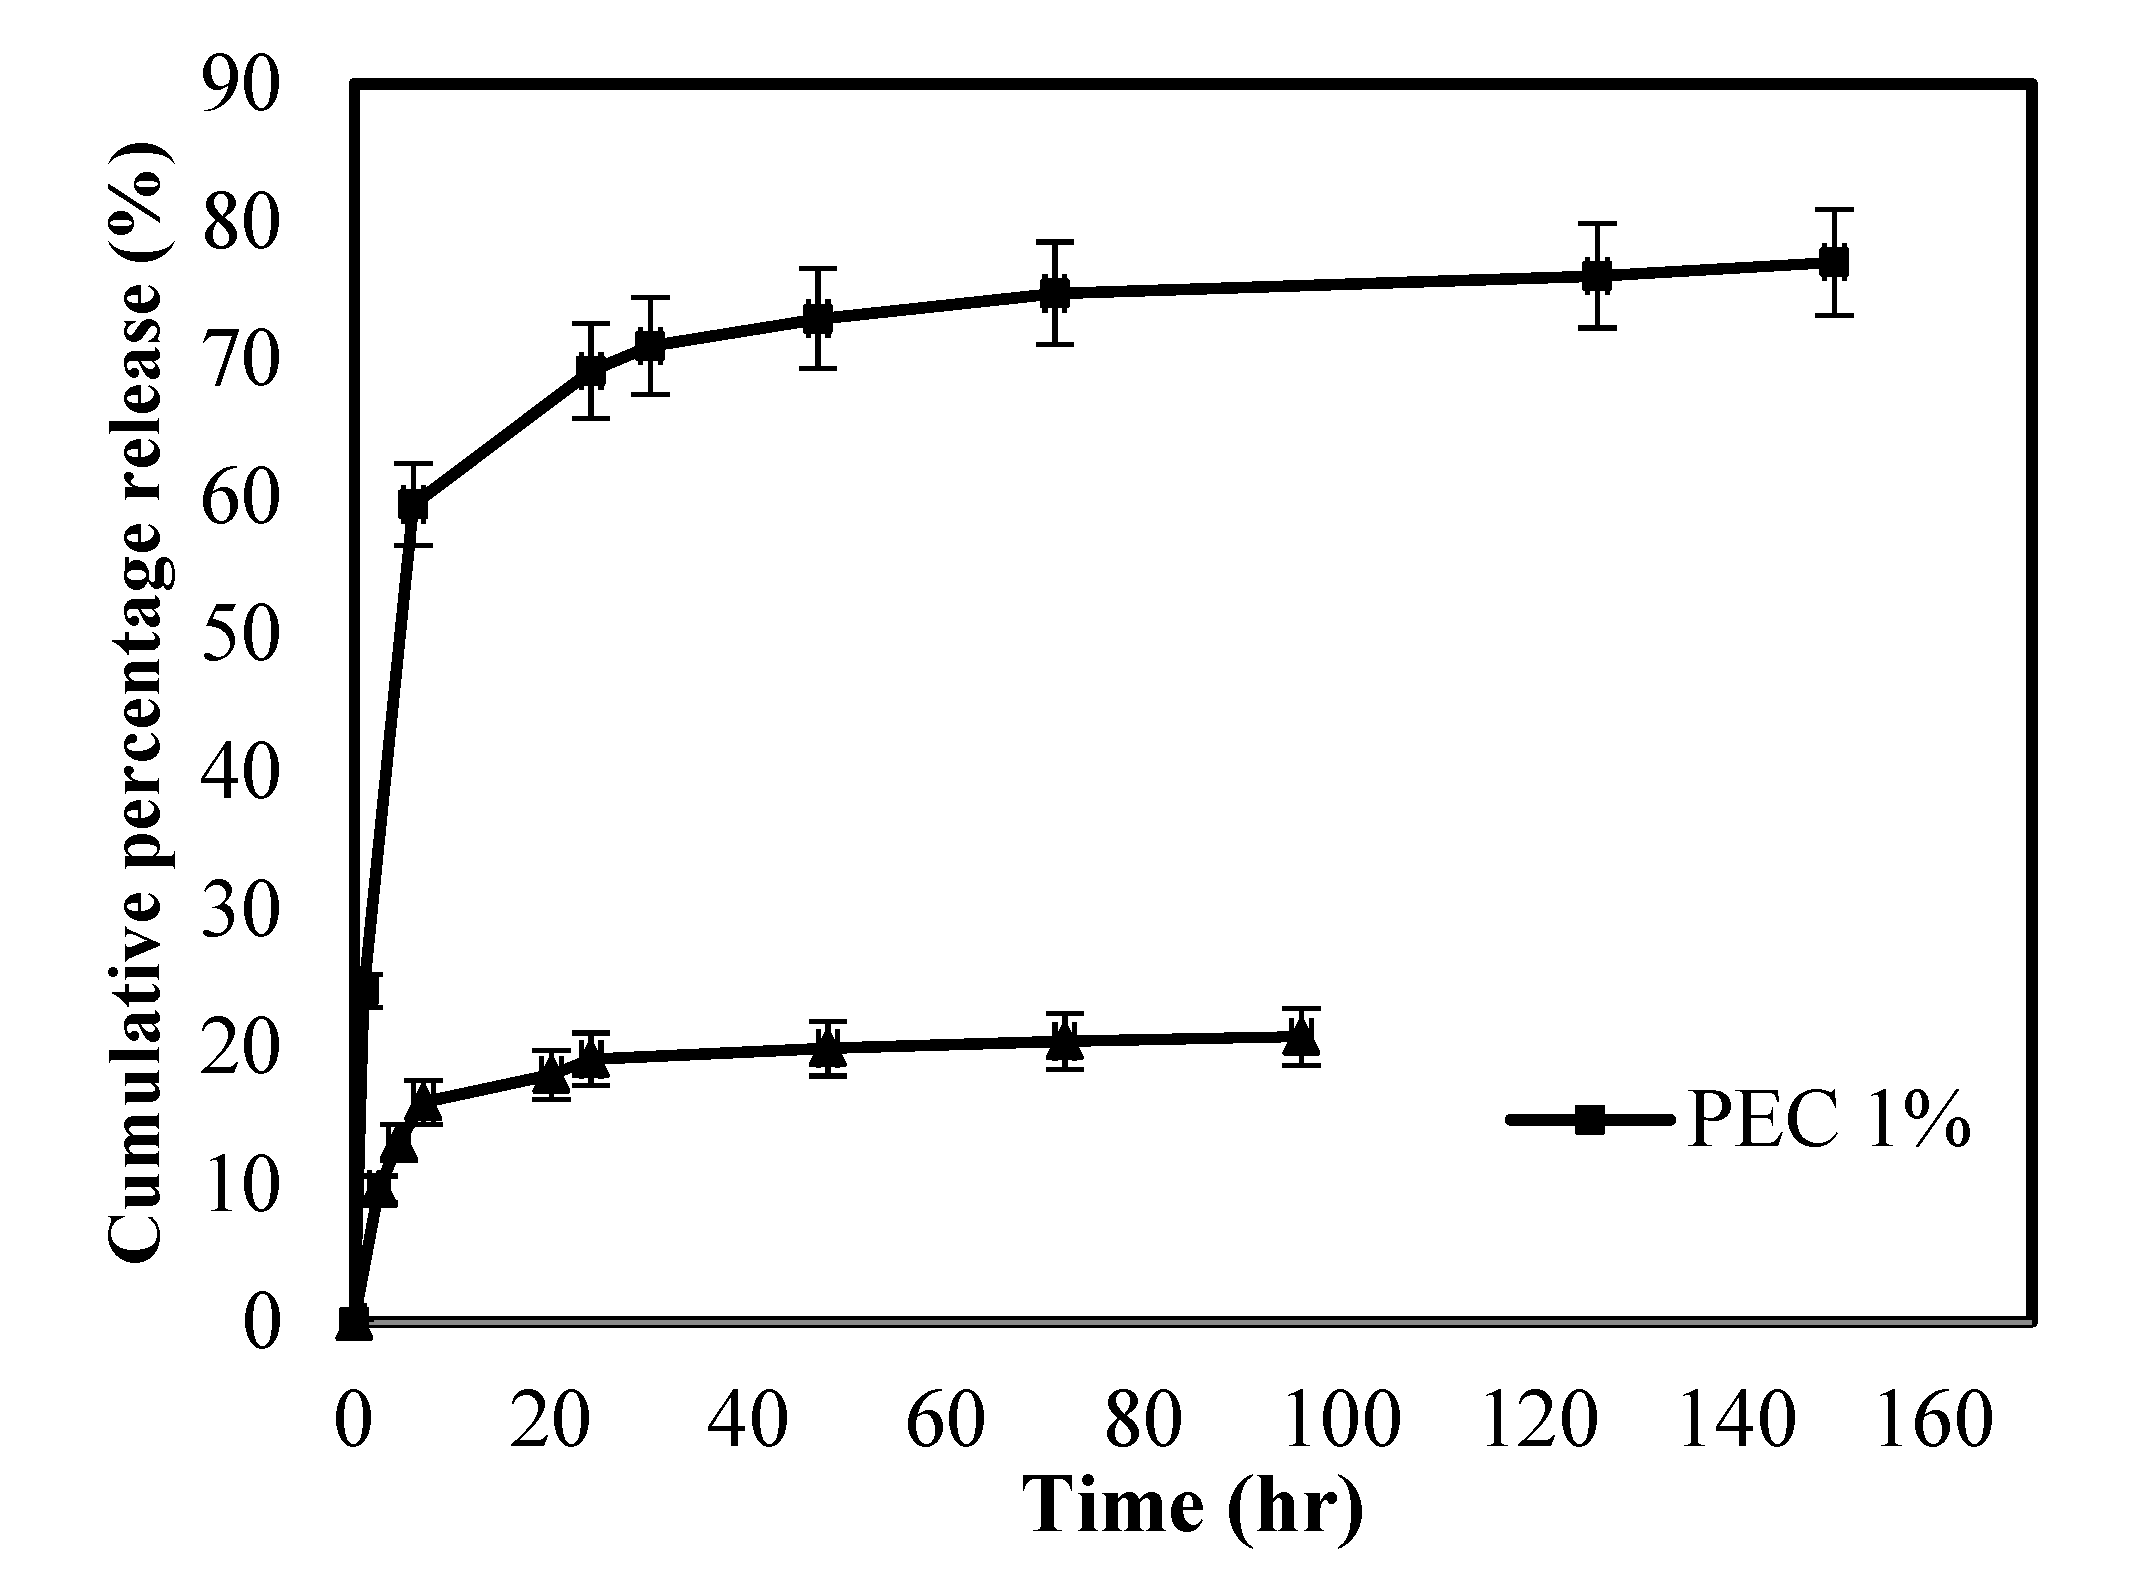
4.11. Drug Release
4.12. Drug Release Mechanism and Kinetics
5. Conclusions
Supplementary Materials
Author Contributions
Funding
Conflicts of Interest
References
- Buriuli, M.; Verma, D. Polyelectrolyte Complexes (PECs) for biomedical applications, Advances in Biomaterials for Biomedical Applications. Adv. Struct. Mater. 2017, 66, 45–93. [Google Scholar]
- Meng, X.; Tian, F.; Yang, J.; He, C.N.; Xing, N.; Li, F. Chitosan and alginate polyelectrolyte complex membranes and their properties for wound dressing application. J. Mater. Sci. Mater. Med. 2010, 21, 1751–1759. [Google Scholar] [CrossRef] [PubMed]
- Wang, L.; Khor, E.; Wee, A.; Lim, L.Y. Chitosan-Alginate PEC Membrane as a Wound Dressing: Assessment of Incisional Wound Healing. J. Biomed. Mater. Res. 2002, 63, 610–618. [Google Scholar] [CrossRef] [PubMed]
- Li, Z.; Ramay, H.R.; Hauch, K.D.; Xiao, D.; Zhang, M. Chitosan-alginate hybrid scaffolds for bone tissue engineering. Biomaterial 2005, 26, 3919–3928. [Google Scholar] [CrossRef] [PubMed]
- Florczyk, S.J.; Kim, D.; Wood, D.L.; Zhang, M. Influence of processing parameters on pore structure of 3D porous. J. Biomed. Mater. Sci. 2005, 98, 485–493. [Google Scholar]
- Iwasaki, N.; Yamane, S.T.; Majima, T.; Kasahara, Y.; Minami, A.; Harada, K.; Nonaka, S.; Maekawa, N.; Tamura, H.; Tokura, S.; et al. Feasibility of Polysaccharide Hybrid Materials for Scaffolds in Cartilage Tissue Engineering: Evaluation of Chondrocyte Adhesion to Polyion Complex Fibers Prepared from Alginate and Chitosan. Biomacromolecules 2004, 5, 828–833. [Google Scholar] [CrossRef] [PubMed]
- Majima, T.; Funakosi, T.; Iwasaki, N.; Yamane, S.T.; Harada, K.; Nonaka, S.; Minami, A.; Nishimura, S.I. Alginate and chitosan polyion complex hybrid fibers for scaffolds in ligament and tendon tissue engineering. J. Orthop. Sci. 2005, 10, 302–307. [Google Scholar] [CrossRef]
- Silva, C.M.; Ribeiro, A.J.; Figueiredo, M.; Ferreira, D.; Veiga, F. Microencapsulation of Hemoglobin in Chitosan-coated Alginate Microspheres. AAPS J. 2006, 7, 903–913. [Google Scholar] [CrossRef]
- Yong, K.; Mooney, L.D.J. Alginate: Properties and biomedical applications. Prog. Polym. Sci. 2012, 37, 106–126. [Google Scholar] [Green Version]
- Sahoo, D.; Nayak, P.L. Chitosan: The Most Valuable Derivative of Chitin. In Biomedical and Environmental Applications; Scrivener Publishing LLC: Beverly, MA, USA, 2011; pp. 129–166. [Google Scholar]
- Alexakis, T.; Boadu, D.K.; Quong, D.; Groboillot, A.; O’neill, I.; Poncelet, D.; Neufeld, R.J. Microencapsulation of DNA within alginate microspheres and cross-linked chitosan membranes for in vivo application. Appl. Biochem. Biotechnol. 1995, 50, 9–106. [Google Scholar] [CrossRef]
- Koueta, N.; Viala, H.; le Bihan, E. Applications, Uses and By-products from Cephalopods. In Cephalopod Culture; Iglesias, J., Fuentes, L., Villanueva, R., Eds.; Springer: Dordrecht, The Netherlands, 2014; pp. 131–147. [Google Scholar]
- Hamedi, H.; Moradi, S.; Hudson, S.M.; Tonelli, A.E. Chitosan based hydrogels and their applications for drug delivery in wound dressings: A review. Carbohydr. Polym. 2018, 199, 445–460. [Google Scholar] [CrossRef] [PubMed]
- Yan, X.L.; Khor, E.; Lim, L.Y. Chitosan-Alginate Films Prepared with Chitosans of Different Molecular Weights. Appl. Biomater. 2001, 358–365. [Google Scholar] [CrossRef] [PubMed]
- Lou, Y.; Wang, Q. Recent development of chitosan-based polyelectrolyte complexes with natural polysaccharides for drug delivery. Int. J. Biol. Macromol. 2014, 64, 353–367. [Google Scholar]
- Davidson, P. Food Antimicrobials: Back to Nature. In First International Symposium on Natural Preservatives in Food Systems; ISHS Acta Horticulturae: Princeton, NJ, USA, 2005. [Google Scholar]
- Gaysinsky, S.; Davidson, P.; McClements, D.; Weiss, J. Formulation and Characterization of Phyto-Phenol-Carrying Antimicrobial Micro emulsions. Food Biophys. 2008, 3, 54–65. [Google Scholar] [CrossRef]
- Deans, S.G.; Ritchie, G. Antibacterial properties of plant essential oils. Int. J. Food Microbiol. 1987, 5, 165–180. [Google Scholar] [CrossRef]
- Ündeğer, Ü.; Başaran, A.; Degen, G.H.; Başaran, N. Antioxidant activities of major thyme ingredients and lack of (oxidative) DNA damage in V79 Chinese hamster lung fibroblast cells at low levels of carvacrol and thymol. Food Chem. Toxicol. 2009, 47, 2037–2043. [Google Scholar] [CrossRef]
- Aydın, S.; Başaran, A.A.; Başaran, N. Modulating Effects of Thyme and Its Major Ingredients on Oxidative DNA Damage in Human Lymphocytes. J. Agric. Food Chem. 2005, 53, 1299–1305. [Google Scholar] [CrossRef]
- Hammer, K.A.; Carson, C.F.; Riley, T.V. Antimicrobial activity of essential oils and other plant extracts. J. Appl. Microbiol. 1999, 86, 985–990. [Google Scholar] [CrossRef] [Green Version]
- Nardelli, A.; D’Hooghe, E.; Drieghe, J.; Dooms, M.; Goossems, A. Allergic contact dermatitis from fragrance components in specific topical pharmaceutical products in Belgium. Contact Dermat. 2009, 60, 303–313. [Google Scholar] [CrossRef]
- Schilcher, H. Effects and side-effects of essential oils. In Essential Oils and Aromatic Plants; Schilcher, H., Ed.; Springer: Dordrecht, The Netherlands, 1985; pp. 217–231. [Google Scholar]
- Moghimi, R.; Ghaderi, L.; Rafati, H.; Aliahmadi, A.; McClements, D.J. Superior antibacterial activity of nanoemulsion of Thymus daenensis essential oil against E. coli. Food Chem. 2016, 194, 410–415. [Google Scholar] [CrossRef]
- Rao, J.; McClements, D.J. Food-grade micro emulsions, nanoemulsions and emulsions: Fabrication from sucrose mono palmitate & lemon oil. Food Hydrocoll. 2011, 25, 1413–1423. [Google Scholar]
- Relkin, P.; Jung, J.M.; Ollivon, M. Factors affecting vitamine degradation in oil-in-water nano emulsions. Thermodyn. Anal. Calorim. 2009, 98, 13–18. [Google Scholar] [CrossRef]
- Donsì, F.; Annunziata, M.; Sessa, M.; Ferrari, G. Nano encapsulation of essential oils to enhance their antimicrobial activity in foods. LWT-Food Sci. Technol. 2011, 44, 1908–1914. [Google Scholar]
- Weiss, J.; Gaysinsky, S.; Davidson, M.; McClements, J. Nanostructured encapsulation systems: Food antimicrobials. In Global Issues in Food Science and Technology; Academic Press: Cambridge, MA, USA, 2009; Chapter 24; pp. 425–479. [Google Scholar]
- Loquercio, A. Preparation and Characterization of Chitosan-Alginate Nanoparticles for Trans-Cinnamaldehyde Entrapment. Master’s Thesis, Texas A&M University, College Station, TX, USA, 2014. [Google Scholar]
- Al-Kaysi, R.; Muller, A.; Ahn, T.; Lee, S.; Bardeen, C. Effects of Sonication on the Size and Crystallinity of Stable Zwitterionic Organic Nanoparticles Formed by Reprecipitation in Water. Langmuir 2005, 21, 7990–7994. [Google Scholar] [CrossRef] [PubMed]
- Hudson Fusion, L.L.C. Sonicator Ultrasonic Liquid Processors; © SONICS & MATERIALS, INC: Newtown, CT, USA, 2014. [Google Scholar]
- Gierszewska, M.; Ostrowska-Czubenko, J.; Chrzanowska, E. pH-responsive chitosan/alginate polyelectrolyte complex membranes reinforced by tripolyphosphate. Eur. Polym. J. 2018, 101, 282–290. [Google Scholar] [CrossRef]
- Florczyk, S.J.; Kim, D.; Wood, D.L.; Zhang, M. Influence of processing parameters on pore structure of 3D porous chitosan–alginate polyelectrolyte complex scaffolds. Hournal Biomater. Med. Res. Part A 2011, 98, 614–620. [Google Scholar] [CrossRef] [PubMed]
- Tao, F.; Hill, L.E.; Peng, Y.; Gomes, C.L. Synthesis and characterization of b-cyclodextrin inclusion complexes of thymol and thyme oil for antimicrobial delivery applications. LWT Food Sci. Technol. 2014, 59, 247–255. [Google Scholar] [CrossRef]
- Abarca, R.L.; Rodríguez, F.J.; Guarda, A.; Galotto, M.J.; Bruna, J.E. Characterization of beta-cyclodextrin inclusion complexes containing an essential oil component. Food Chem. 2016, 196, 968–975. [Google Scholar] [CrossRef]
- Wang, X.; Luo, Z.; Xiao, Z. Preparation, characterization, and thermal stability of b-cyclodextrin/soybean lecithin inclusion complex. Carbohydr. Polym. 2014, 101, 1027–1032. [Google Scholar] [CrossRef] [PubMed]
- Lihong, F.; Huan, Y.; Yang, J.; Yang, M.; Min, P.; Jin, H. Preparation and characterization of chitosan/gelatin/PVA hydrogel for wound dressings. Carbohydr. Polym. 2016, 146, 427–434. [Google Scholar]
- Moradi, S.; Barati, A.; Salehi, E.; Tonelli, A.E.; Hamedi, H. Preparation and characterization of chitosan based hydrogels containing cyclodextrin inclusion compounds or nanoemulsions of thyme oil. Polym. Int. 2019. [Google Scholar] [CrossRef]
- Ritger, P.L.; Peppas, N.A. A Simple Equation for Description of Solute Release I. Fickian and non-Fickian Release from Non-Sweliable Devices in The Form of Slabs, Spheres, Cylinders or Discs. J. Control. Release 1987, 5, 23–36. [Google Scholar] [CrossRef]
- Gómeza, F.M.; Guerrero, J.; Matsuhiro, B.; Pavez, J. In vitro release of metformin hydrochloride from sodium alginate/polyvinyl alcohol hydrogels. Carbohydr. Polym. 2017, 155, 182–191. [Google Scholar] [CrossRef] [PubMed]
- Sung, J.H.; Hwang, M.; Kim, J.; Lee, J.H.; Kim, Y.; Kim, J.H.; Chang, S.W.; Jin, S.G.; Kim, J.A.; Lyoo, W.S.; et al. Gel characterisation and in vivo evaluation of minocycline-loaded wound dressing with enhanced wound healing using polyvinyl alcohol and chitosan. Int. J. Pharm. 2010, 392, 232–240. [Google Scholar] [CrossRef] [PubMed]
- Sibaja, B.; Culbertson, E.; Marshall, P.; Broughton, R.M.; Solano, A.A.; Esquivel, M.; Parker, J.; Fuente, L.; Auad, M.L. Preparation of alginate–chitosan fibers with potential biomedical applications. Carbohydr. Polym. 2015, 134, 598–608. [Google Scholar] [CrossRef] [PubMed]
- Dash, S.; Murthy, P.N.; Nath, L.; Chowdhury, P. Kinetic Modeling on Drug Release from Controlled Drug Delivery Systems. Acta Pol. Pharm. Drug Res. 2010, 67, 217–223. [Google Scholar]
- Gouda, R.; Baishya, H.; Qing, Z. Application of Mathematical Models in Drug Release Kinetics of Carbidopa and Levodopa ER Tablets. J. Dev. Drugs 2017, 6, 8. [Google Scholar]
- Elviri, L.; Foresti, R.; Bianchera, A.; Silvestrib, M.; Bettini, R. 3D-printed polylactic acid supports for enhanced ionization efficiency in desorption electrospray mass spectrometry analysis of liquid and gel samples. Talanta 2016, 155, 321–328. [Google Scholar] [CrossRef] [PubMed]
- Carletto, J.S.; de Roux, K.C.; Maltez, H.F.; Martendal, E.; Carasek, E. Use of 8-hydroxyquinoline-chitosan chelating resin in an automated on-line preconcentration system for determination of zinc(II) by F AAS. J. Hazard. Mater. 2008, 157, 88–93. [Google Scholar] [CrossRef]
- Jaiswal, M.; Dudhe, R.; Sharma, P.K. Nanoemulsion: An advanced mode of drug delivery system. Biotech 2015, 5, 123–127. [Google Scholar] [CrossRef]
- Hughes, J.M.; Budd, P.M.; Grieve, A.; Dutta, P.; Tiede, K.; Lewis, J. Highly monodisperse, lanthanide-containing polystyrene nanoparticles as potential standard reference materials for environmental “nano” fate analysis. J. Appl. Polym. Sci. 2015, 132, 42061. [Google Scholar] [CrossRef]
- Malvern Co. Dynamic Light Scattering Common Terms Defined. 2011. Available online: https://www.malvernpanalytical.com/en/learn/knowledge-center/whitepapers/WP111214DLSTermsDefined (accessed on 6 October 2016).
- Otoni, C.G.; Pontes, S.S.F.; Medeiros, E.A.A.; Soares, N.F.F. Edible Films from Methylcellulose and Nanoemulsions of Clove Bud (Syzygium aromaticum) and Oregano (Origanum vulgare) Essential Oils as Shelf Life Extenders for Sliced Bread. J. Agric. Food Chem. 2014, 62, 5214–5219. [Google Scholar] [CrossRef] [PubMed]
- Li, X.; Wu, W.; Liu, W. Synthesis and properties of thermo-responsive guar gum/poly(N-isopropylacrylamide) interpenetrating polymer network hydrogels. Carbohydr. Polym. 2008, 71, 394–402. [Google Scholar] [CrossRef]
- Le-Tien, C.; Millette, M.; Mateescu, M.-A.; Lacroix, M. Modified alginate and chitosan for lactic acid bacteria immobilization. Biotechnol. Appl. Biochem. 2004, 39, 347–354. [Google Scholar] [CrossRef] [PubMed]
- Ho, Y.C.; Mi, F.L.; Sung, H.W.; Kuo, P.L. Heparin-functionalized chitosan–alginate scaffolds for controlled release of growth factor. Int. J. Pharm. 2009, 376, 69–75. [Google Scholar] [CrossRef] [PubMed]
- Rukmani, A.; Sundrarajan, M. Inclusion of antibacterial agent thymol on β-cyclodextrin-grafted organic cotton. J. Ind. Text. 2011, 42, 132–144. [Google Scholar] [CrossRef]
- Mohammed, M.J.; Al-Bayati, F.A. Isolation and identification of antibacterial compounds from Thymus kotscyanus and aerial parts of Dianthus caryophyllus flower buds. Phytomedicine 2009, 16, 632–637. [Google Scholar] [CrossRef]
- Schulz, H.; Özkan, G.; Baranska, M.; Krüger, H.; Özcan, M. Chracterization of essential oil plants from Turkey by IR and Raman spectroscopy. Vib. Spectrosc. 2005, 39, 249–256. [Google Scholar] [CrossRef]
- Yu, S.H.; Mi, F.L.; Wu, Y.B.; Peng, C.K.; Shyu, S.S.; Huang, R.N. Antibacterial Activity of Chitosan–Alginate Sponges Incorporating Silver Sulfadiazine: Effect of Ladder-Loop Transition of Interpolyelectrolyte Complex and Ionic Crosslinking on the Antibiotic Release. J. Appl. Polym. Sci. 2005, 98, 538–549. [Google Scholar] [CrossRef]
- Li, H.; Yang, J.; Hu, X.; Liang, J.; Fan, Y.; Zhang, X. Superabsorbent polysaccharide hydrogels based on pullulan derivate as antibacterial release wound dressing. J. Biomed. Mater. Res. Part A 2011, 98, 31–39. [Google Scholar] [CrossRef]
- Lamke, L.O.; Nilsson, G.E.; Reithner, H.L. evaporative water loss from burns and the water permeability of grafts and artificial membranes used in the treatment of burns. Burns 1977, 3, 159–165. [Google Scholar] [CrossRef]
- Queen, D.; Gaylor, J.D.S.; Evans, J.H.; Courtney, J.M.; Reid, W.H. The preclinical evaluation of the water vapour transmission rate through burn wound dressings. Biomaterials 1987, 8, 367–371. [Google Scholar] [CrossRef]
- Wu, P.; Fisher, A.C.; Queen, D.; Gaylor, J.D. In vitro assessment of water vapor transmission of synthetic wound dressings. Biomaterials 1995, 16, 171–175. [Google Scholar] [CrossRef]
- Department of Materials Engineering and Chemistry. Modulus of Elasticity. In Building Materials 10-Testing Methods; Czech Technical University: Prague, Czech Republic, Chapter 15.
- Dai, W.; Sun, C.; Huang, S.; Zhou, Q. Carvacrol suppresses proliferation and invasion in human oral squamous cell carcinoma. Onco Target Ther. 2016, 9, 2297–2304. [Google Scholar] [CrossRef] [PubMed] [Green Version]
- Riella, K.R.; Marinho, R.R.; Santos, J.S.; Pereira-Filho, R.N.; Cardoso, J.C.; Albuquerque-Junior, R.L.C.; Thomazzi, S.M. Anti-inflammatory and cicatrizing activities of thymol, a monoterpene of the essential oil from Lippia gracilis, in rodents. J. Ethnopharmacol. 2012, 143, 656–663. [Google Scholar] [CrossRef] [PubMed] [Green Version]
- Farag, R.S.; Dawz, Z.Y.; Hewedi, F.M.; El-Baroty, G.S.A. Antimicrobial Activity of Some Egyptian Spice Essential Oils. J. Food Prot. 1989, 52, 665–667. [Google Scholar] [CrossRef] [PubMed]
- Gutierrez, J.; Barry-Ryan, C.; Bourke, P. The antimicrobial efficacy of plant essential oil combinations and interactions with food ingredients. Int. J. Food Microbiol. 2008, 124, 91–97. [Google Scholar] [CrossRef] [PubMed] [Green Version]
- Schelz, Z.; Molnar, J.; Hohmann, J. Antimicrobial and antiplasmid activities of essential oils. Fitoterapia 2006, 77, 279–285. [Google Scholar] [CrossRef]
- Lambert, R.J.W.; Skandamis, P.N.; Coote, P.J.; Nychas, G.J.E. A study of the minimum inhibitory concentration and mode of action of oregano essential oil, thymol and carvacrol. J. Appl. Microbiol. 2001, 91, 453–462. [Google Scholar] [CrossRef] [Green Version]
- Braga, P.C.; Sasso, M.D.; Culici, M.; Bianchi, T.; Bordoni, L.; Marabini, L. Anti-inflammatory activity of thymol: inhibitory effect on the release of human neutrophil elastase. Pharmacology 2006, 77, 130–136. [Google Scholar] [CrossRef]
- Lansdown, A.B. Calcium: A potential central regulator in wound healing in the skin. Wound Repair Regen. 2002, 10, 271–285. [Google Scholar] [CrossRef] [PubMed]
- Altiok, D.; Altiok, E.; Tihminlioglu, F. Physical, antibacterial and antioxidant properties of chitosan films incorporated with thyme oil for potential wound healing applications. J. Mater. Sci. Mater. Med. 2010, 21, 2227–2236. [Google Scholar] [CrossRef] [PubMed] [Green Version]
- Hajimehdipoor, H.; Shekarchi, M.; Khanavi, M.; Adib, N.; Amri, M. A validated high performance liquid chromatography method for the analysis of thymol and carvacrol in Thymus vulgaris L. volatile oil. Pharmacogn. Mag. 2010, 6, 154–158. [Google Scholar] [CrossRef] [PubMed]
- Li, P.; Dai, Y.; Zhang, J.; Wang, A.; Wei, Q. Chitosan-Alginate Nanoparticles as a Novel Drug Delivery System for Nifedipine. Int. J. Biomed. Sci. 2008, 4, 221–228. [Google Scholar] [PubMed]
- Sperling, L.H. Concentrated Solutions, Phase Separation Behavior, and Diffusion. In Introduction to Physical Polymer Science, 4th ed.; Wiley Interscience: Hoboken, NJ, USA, 2006; pp. 145–196. [Google Scholar]
- Ramteke, K.H.; Dighe, P.A.; Kharat, A.R.; Patil, S.V. Mathematical Models of Drug Dissolution: A Review. Sch. Acad. J. Pharm. 2014, 3, 388–396. [Google Scholar]
- Singhvi, G.; Singh, M. Review: In-Vitro Drug Release Characterization Models. Int. J. Pharm. Stud. Res. 2011, 2, 77–84. [Google Scholar]
- Chime, S.A.; Onunkwo, G.C.; Onyishi, I.I. Kinetics and Mechanisms of Drug Release from Swellable and Non Swellable Matrices: A Review. Res. J. Pharm. Biol. Chem. Sci. 2013, 4, 97–103. [Google Scholar]


| Sample | N1 * | N2 * | N3 * |
|---|---|---|---|
| Dia.(nm) | 50 ± 8 | 68 ± 10 | 165 ± 13 |
| PDI | 0.188 ± 0.001 | 0.202 ± 0.003 | 0.26 ± 0.004 |
| Samples | PEC 0.4 | TM-PEC %0.4 | PEC 1 | TM-PEC %1 |
|---|---|---|---|---|
| WVTR (g/m2/day) | 2189.2 ± 35 | 2016.99 ± 27 | 1929.7 ± 68 | 1922.6 ± 45 |
| Sample | Tensile Stress (MPa) | % Strain | Young’s Modulus (kPa) |
|---|---|---|---|
| TM-PEC %0.4 | 0.94 ± 0.08 | 9.72 ± 1.27 | 106.77 ± 23.57 |
| TM-PEC %1 | 2.24 ± 0.22 | 8.52 ± 1.62 | 265.87 ± 32.50 |
| Sample | Release Exponent, n | Kinetic Constant, k | Peppas | Zero-Order | First-Order | Higuchi | Hixson–Crowell | Time Range (hr) |
|---|---|---|---|---|---|---|---|---|
| TM-PEC %1 | 0.50 | 0.24 | 1.00 | 0.93 | 0.98 | 0.89 | 0.97 | 0–6 |
| TM-PEC %1 | 0.06 | 0.59 | 0.97 | 0.87 | 0.90 | 0.87 | 0.89 | 7–150 |
| TM-PEC %0.4 | 0.49 | 0.06 | 0.99 | 0.92 | 0.93 | 0.88 | 0.93 | 0–6 |
| TM-PEC %0.4 | 0.08 | 0.14 | 0.91 | 0.83 | 0.83 | 0.83 | 0.84 | 7–100 |
© 2019 by the authors. Licensee MDPI, Basel, Switzerland. This article is an open access article distributed under the terms and conditions of the Creative Commons Attribution (CC BY) license (http://creativecommons.org/licenses/by/4.0/).
Share and Cite
Hamedi, H.; Moradi, S.; Tonelli, A.E.; Hudson, S.M. Preparation and Characterization of Chitosan–Alginate Polyelectrolyte Complexes Loaded with Antibacterial Thyme Oil Nanoemulsions. Appl. Sci. 2019, 9, 3933. https://doi.org/10.3390/app9183933
Hamedi H, Moradi S, Tonelli AE, Hudson SM. Preparation and Characterization of Chitosan–Alginate Polyelectrolyte Complexes Loaded with Antibacterial Thyme Oil Nanoemulsions. Applied Sciences. 2019; 9(18):3933. https://doi.org/10.3390/app9183933
Chicago/Turabian StyleHamedi, Hamid, Sara Moradi, Alan E. Tonelli, and Samuel M. Hudson. 2019. "Preparation and Characterization of Chitosan–Alginate Polyelectrolyte Complexes Loaded with Antibacterial Thyme Oil Nanoemulsions" Applied Sciences 9, no. 18: 3933. https://doi.org/10.3390/app9183933