The Effect of Grain Size on the Hydrodynamics of Mudflow Surge from a Tailings Dam-Break
by
 and
and
Xiaofei Jing
1, 
Yulong Chen
2,*,
Dan Xie
1,
David J. Williams
3, 
Shangwei Wu
1,
Wensong Wang
4 and
Tianwei Yin
3 1
School of Safety Engineering, Chongqing University of Science and Technology, Chongqing 401331, China
2
School of Energy and Mining Engineering, China University of Mining and Technology, Beijing 100083, China
3
School of Civil Engineering, The University of Queensland, Brisbane, QLD 4072, Australia
4
School of Resources and Safety Engineering, Chongqing University, Chongqing 400044, China
*
Author to whom correspondence should be addressed.
Appl. Sci. 2019, 9(12), 2474; https://doi.org/10.3390/app9122474
Submission received: 30 April 2019
/
Revised: 12 June 2019
/
Accepted: 14 June 2019
/
Published: 18 June 2019
(This article belongs to the Section Mechanical Engineering)
Abstract
:Due to the differences in mineral processing techniques, the grain-size of tailings used in the construction of a tailings pond is not commensurate. It has been determined that the hydrodynamic characteristics of mudflow resulting from the failure of tailings dams are directly influenced by grain-size, solids concentration, and the surface roughness of gully and impoundment geometry. However, the behavior and influence of the grain size of mudflow resulting from a tailings dam failure have not been sufficiently examined. To investigate the effect of grain size on the hydrodynamic characteristics of mudflow surging from tailings dam failure, the law of mudflow evolution, the change of dynamics pressure, and the velocity distributions of mudflow have been obtained via a series of flume experiments utilizing three types of grain size tailings (d50 = 0.72 mm; d50 = 0.26 mm; d50 = 0.08 mm, respectively). This study proves conclusively that with an increase in grain size, the peak value of mudflow depth notably decreases in the same section. Furthermore, it has been noted that both the velocity and the dynamic pressure raise significantly, wherein the velocity displays two distinct primary stages; namely a rapid reduction stage and a slow reduction stage. This research provides a framework for the exploration of the effect of grain size on the hydrodynamics of slurry surging from a tailings dam failure, and all presented results provide an indispensable tool in terms of the accurate assessment of potential damage in the case of a prospective impoundment failure.
1. Introduction
In recent years, mine security accidents have occurred frequently, and the situation of the safe production of a mine has been in the severe condition [1,2,3]. In China, currently, there are more than 12,000 tailings impoundments nation-wide, most of which pose a potential hazard [4]. A characteristic common to the majority of tailings dam failures in the mining sector is the liquification of tailings, which results in a high-energy mudflow. When swept downstream, this creates the potential for extensive damage to property [5]. To assess the prospective damage in the case of such a failure, it is necessary to be able to predict the characteristics of the flow and the possible extent of flood movement. However, due to the differences in mineral processing techniques, the particle size and the distribution of tailings utilized during the construction of tailings impoundments are unequal; accordingly, there is an ostensible difference in the particle size of the resultant mudflow after the occurrence of a tailings dam failure.
The mechanical properties of mine tailings are heavily influenced by the particles’ grain size [6]. Over the past few decades, the mechanical properties of fine and coarse tailing materials have been studied based on a large number of physical and mechanical experiments [7,8,9]. In a study conducted by Yin [10], two individual tailings impoundments were studied (based on a series of model tests), the former of which using coarse tailings and the latter using fine tailings, to examine the effect of particle grain size on seepage laws. Moreover, Zhang [11] and Qiao [12] examined fine particle content of tailings dams and their effect on the liquefaction and engineering properties of tailings.
Furthermore, many researchers have studied rheological behaviors relative to the effect of tailings particle grain size over the past few years. Jeyapalan [13] conducted a series of flume experiments to predict flow characteristics and the possible extent of flood movement, consequently analyzing these findings based on flow movements observed in several case studies where failures have occurred. Jeong [14] analyzed factors affecting rheological behaviors, particularly with regard to the grain size of iron ore tailings. Charlebois [15] conducted a study on the flow and beaching behavior of sub-aerially deposited, polymer-flocculated oil sand tailings. Dutto [16] elucidated the influence of the type of viscous model—pure cohesive versus pure frictional—with the numerical reproduction of two different real flowslides that occurred in 1966: the Aberfan flowslide and the Gypsum tailings impoundment flowslide.
The hydrodynamic characteristics of debris flow are influenced not only by the roughness of the downstream gully [17,18,19,20] but also by the grain size, sediment concentration [21,22,23], although the behavior and influence of grain size on mudflow resulting from a tailings dam failure have not been examined sufficiently. To be able to assess the potential for damage in the event of tailings dam failure accurately, it is necessary to characterize the hydrodynamic properties of different particle sizes of the resulting mudflow.
This paper presents the factors affecting the hydrodynamic behaviors of mudflow surging from a tailings dam-break, particularly relative to the effect of grain size on these behaviors. This has been achieved via the utilization of a self-designed Tailings Dam-Break Model Test System (TDBMTS) which consists of glass flumes, a mudflow-height observation system, and a measurement system for the velocity and impact force of mudflow [24]. A series of flume experiments were conducted to observe the hydrodynamic behaviors of mudflow using three grain-particles of different sizes (d50 = 0.72 mm; d50 = 0.26 mm; d50 = 0.08 mm, respectively). From this analysis, some general conclusions can be drawn regarding the influence of grain-size on hydrodynamic behaviors, and insight has been obtained in terms of the development of conducting preliminary analysis for the assessment of potential damage in the case of a tailings dam failure.
2. Experimental Test
2.1. Experimental Apparatus
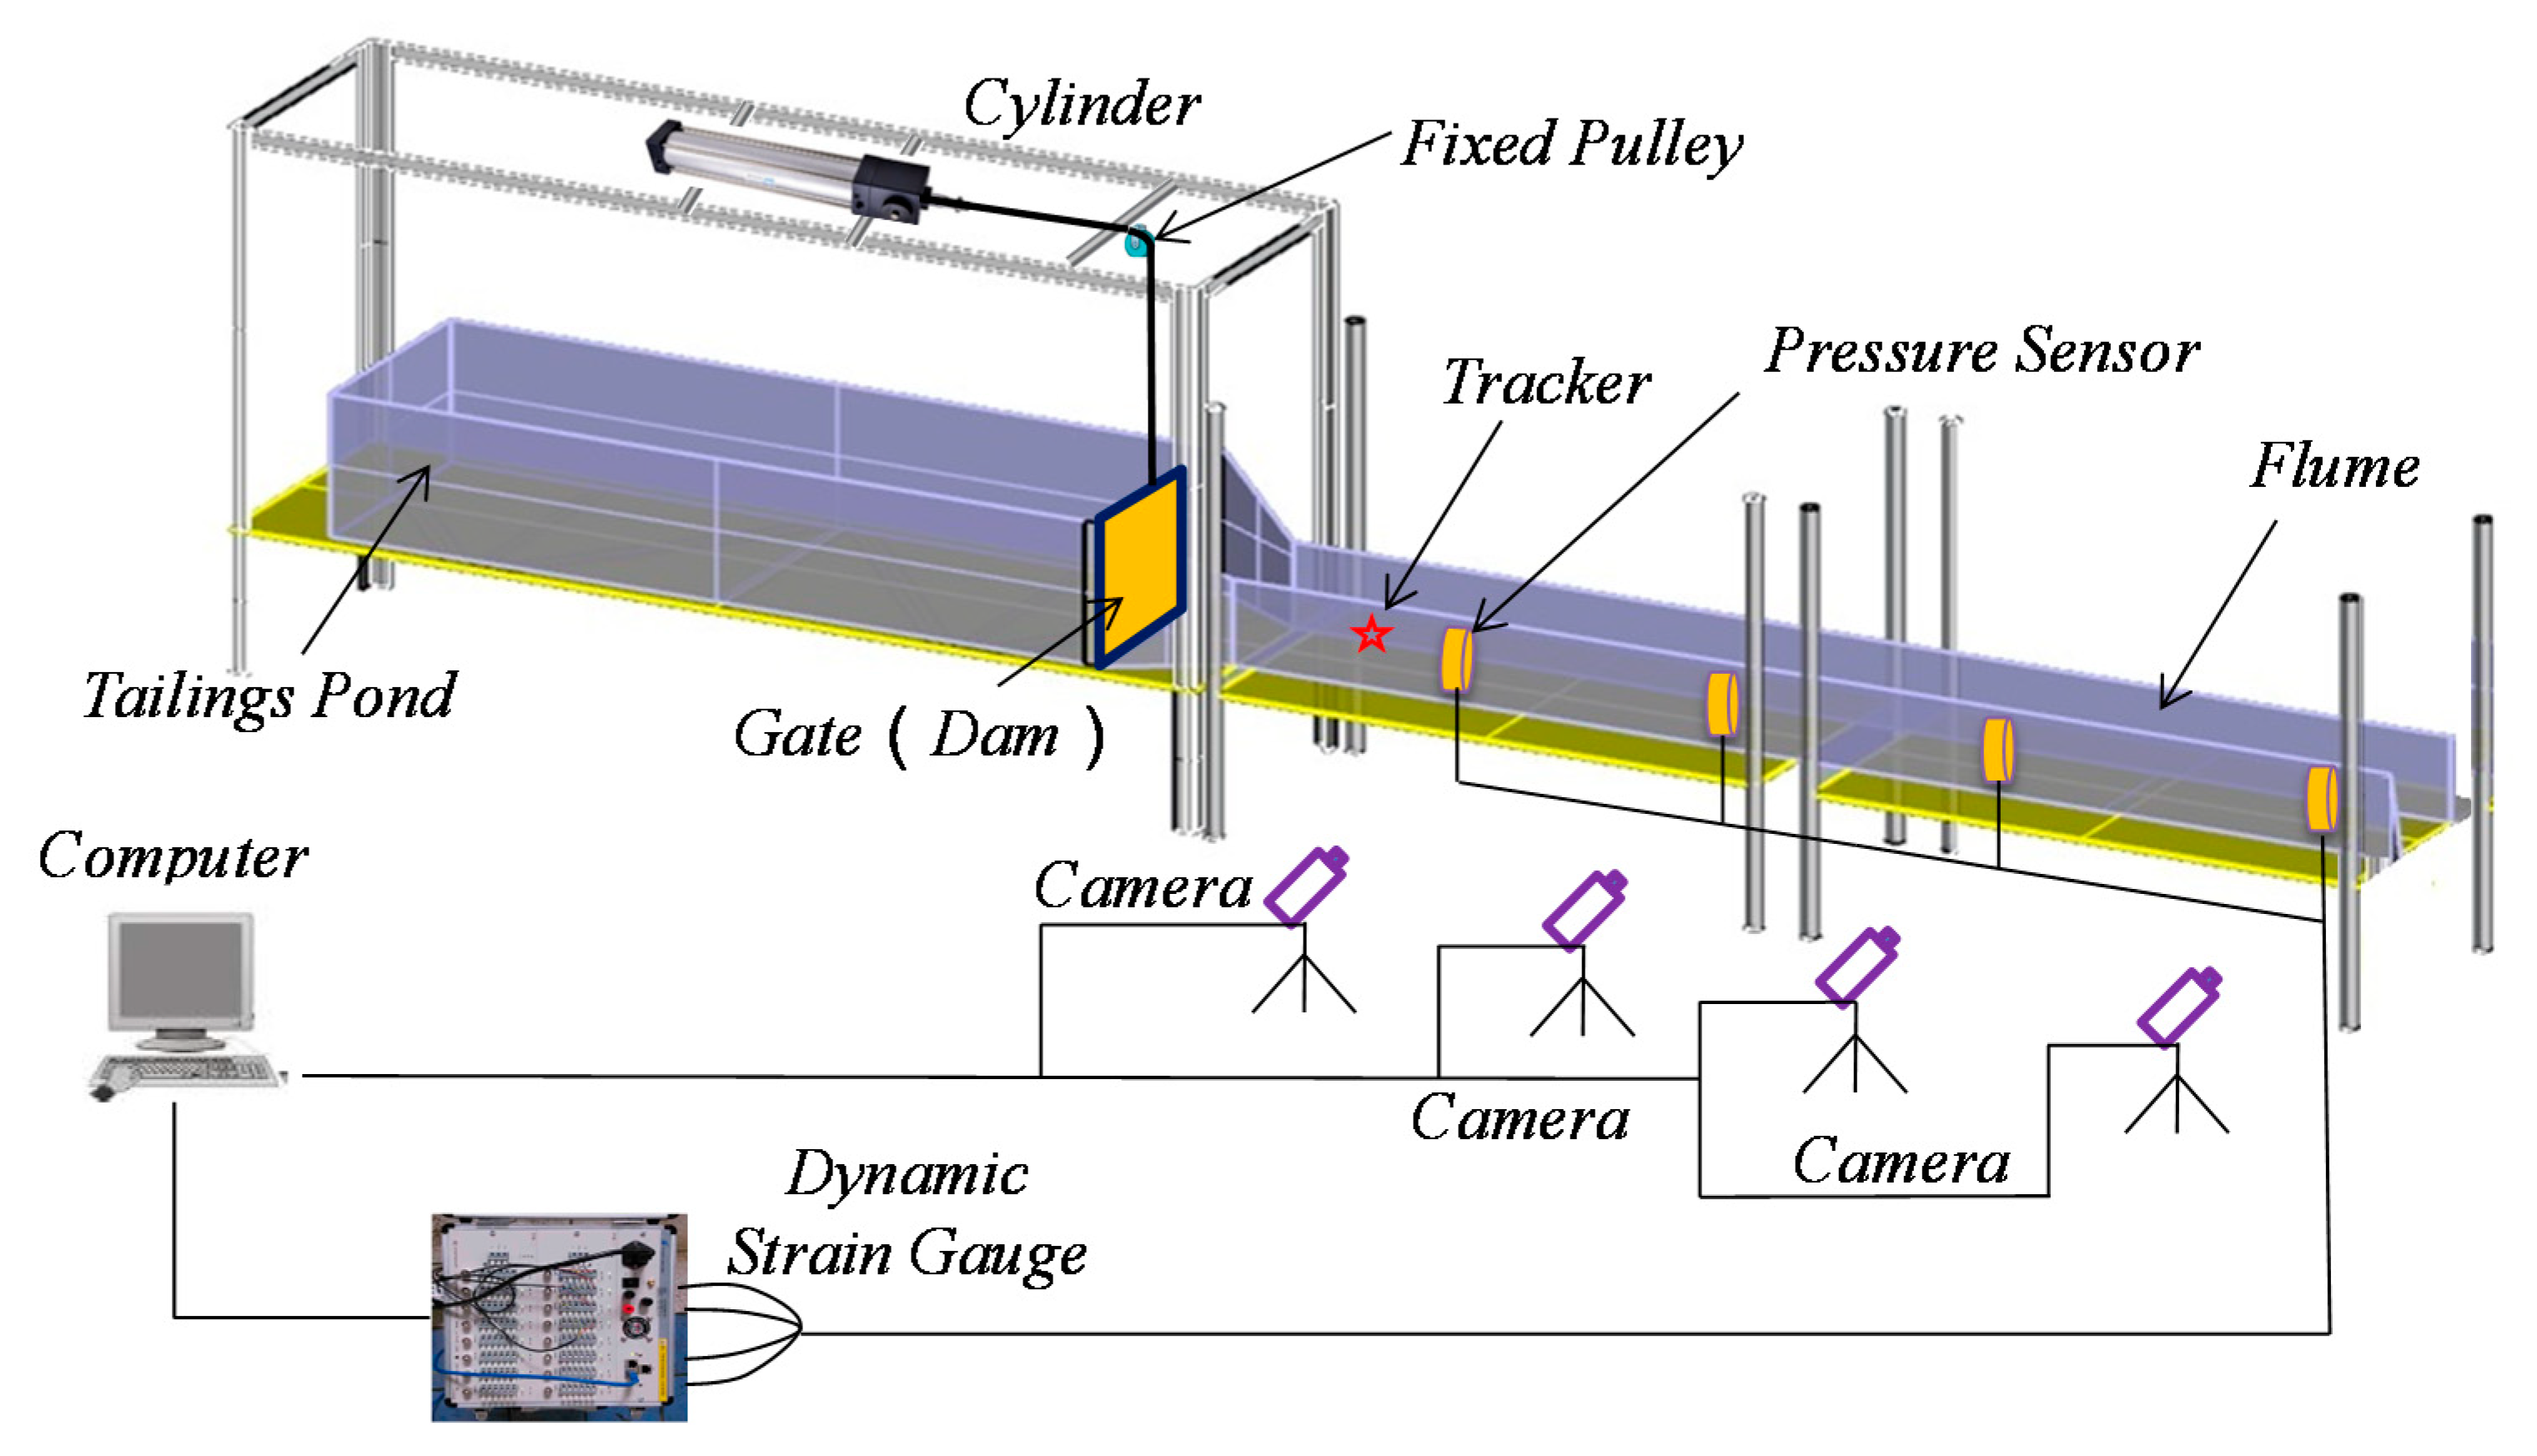
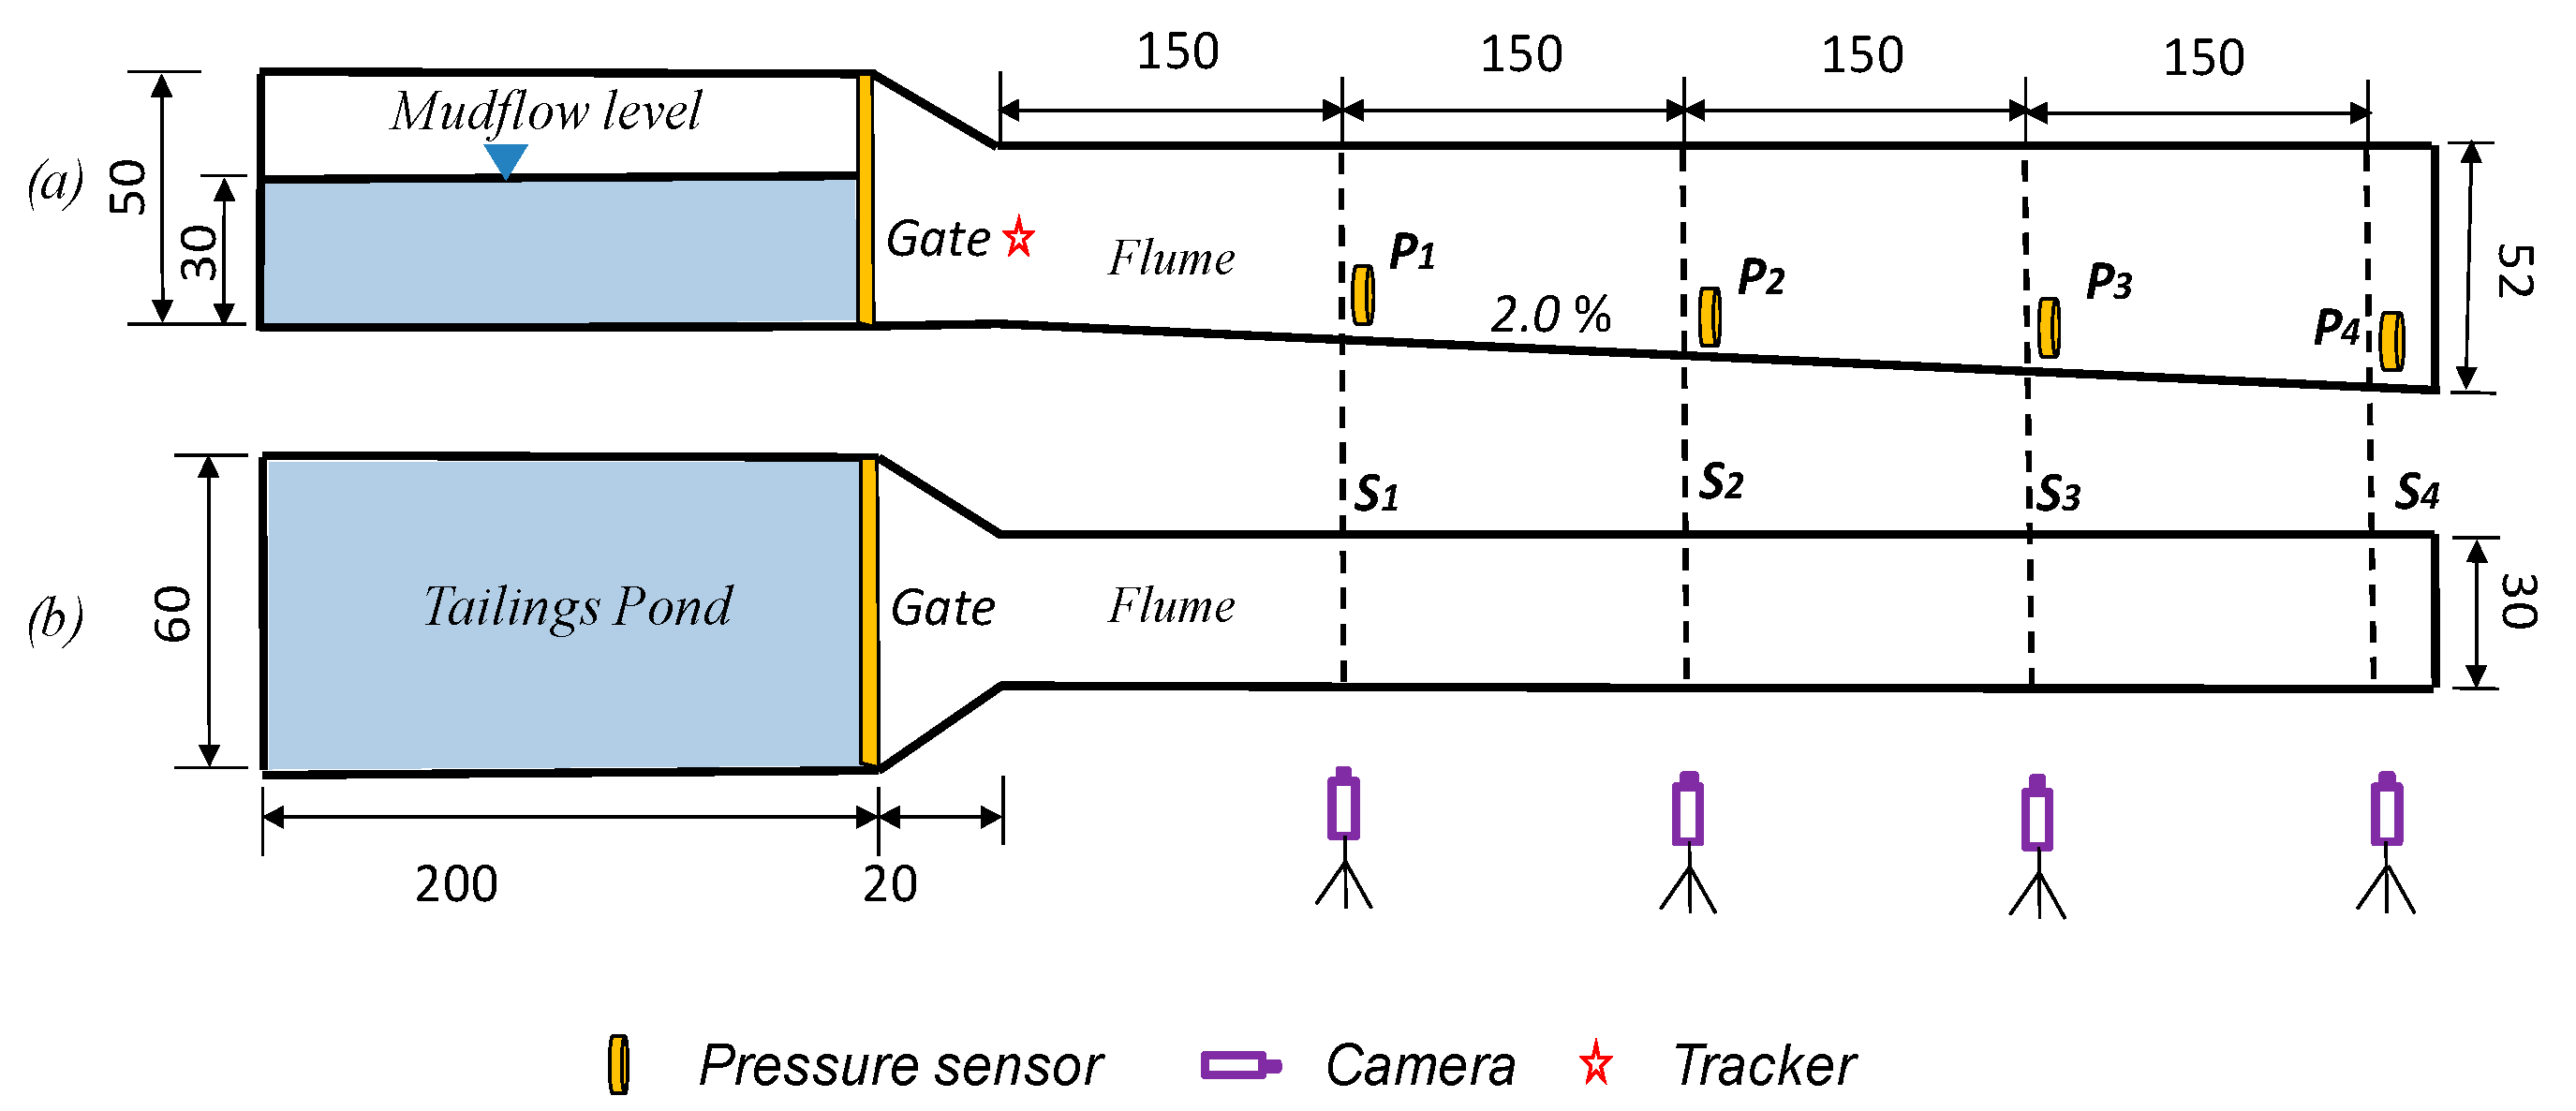
The experimental apparatus (Tailings Dam-Break Model Test System (TDBMTS)) consists of glass flumes, an observation system for mudflow height, and a measurement system for the velocity and impact force of mudflow. (Figure 1). Experiment measurement points and equipment layout are shown in Figure 2.
The main glass flume for the upstream (tailings pond) area has an internal dimension of 200 cm (length) by 60 cm (width) by 50 cm (height). The inner wall of the flume was lubricated with Vaseline to reduce friction. Six glass flumes, the dimensions of which were 100 cm (length) by 30 cm (width) by 40 cm (height), were connected at the downstream point. According to the actual topography of Yangtianjing tailings dam in China, the slope ratio of the gully is set to 2%, and the roughness of gully is set to 0.012. The mudflow movement was monitored using high-resolution cameras. There were four pressure sensors that were evenly spaced at 150 cm intervals, to monitor the impact force of downstream mudflow. To simulate a tailings dam-break, the rectangular gate was opened by the pneumatic cylinder within 0.5 s. The mudflow was prepared and premixed with tailings and water in 40% concentration using a mixer, then transported into the tailings pond.
2.2. Experimental Materials and Procedures
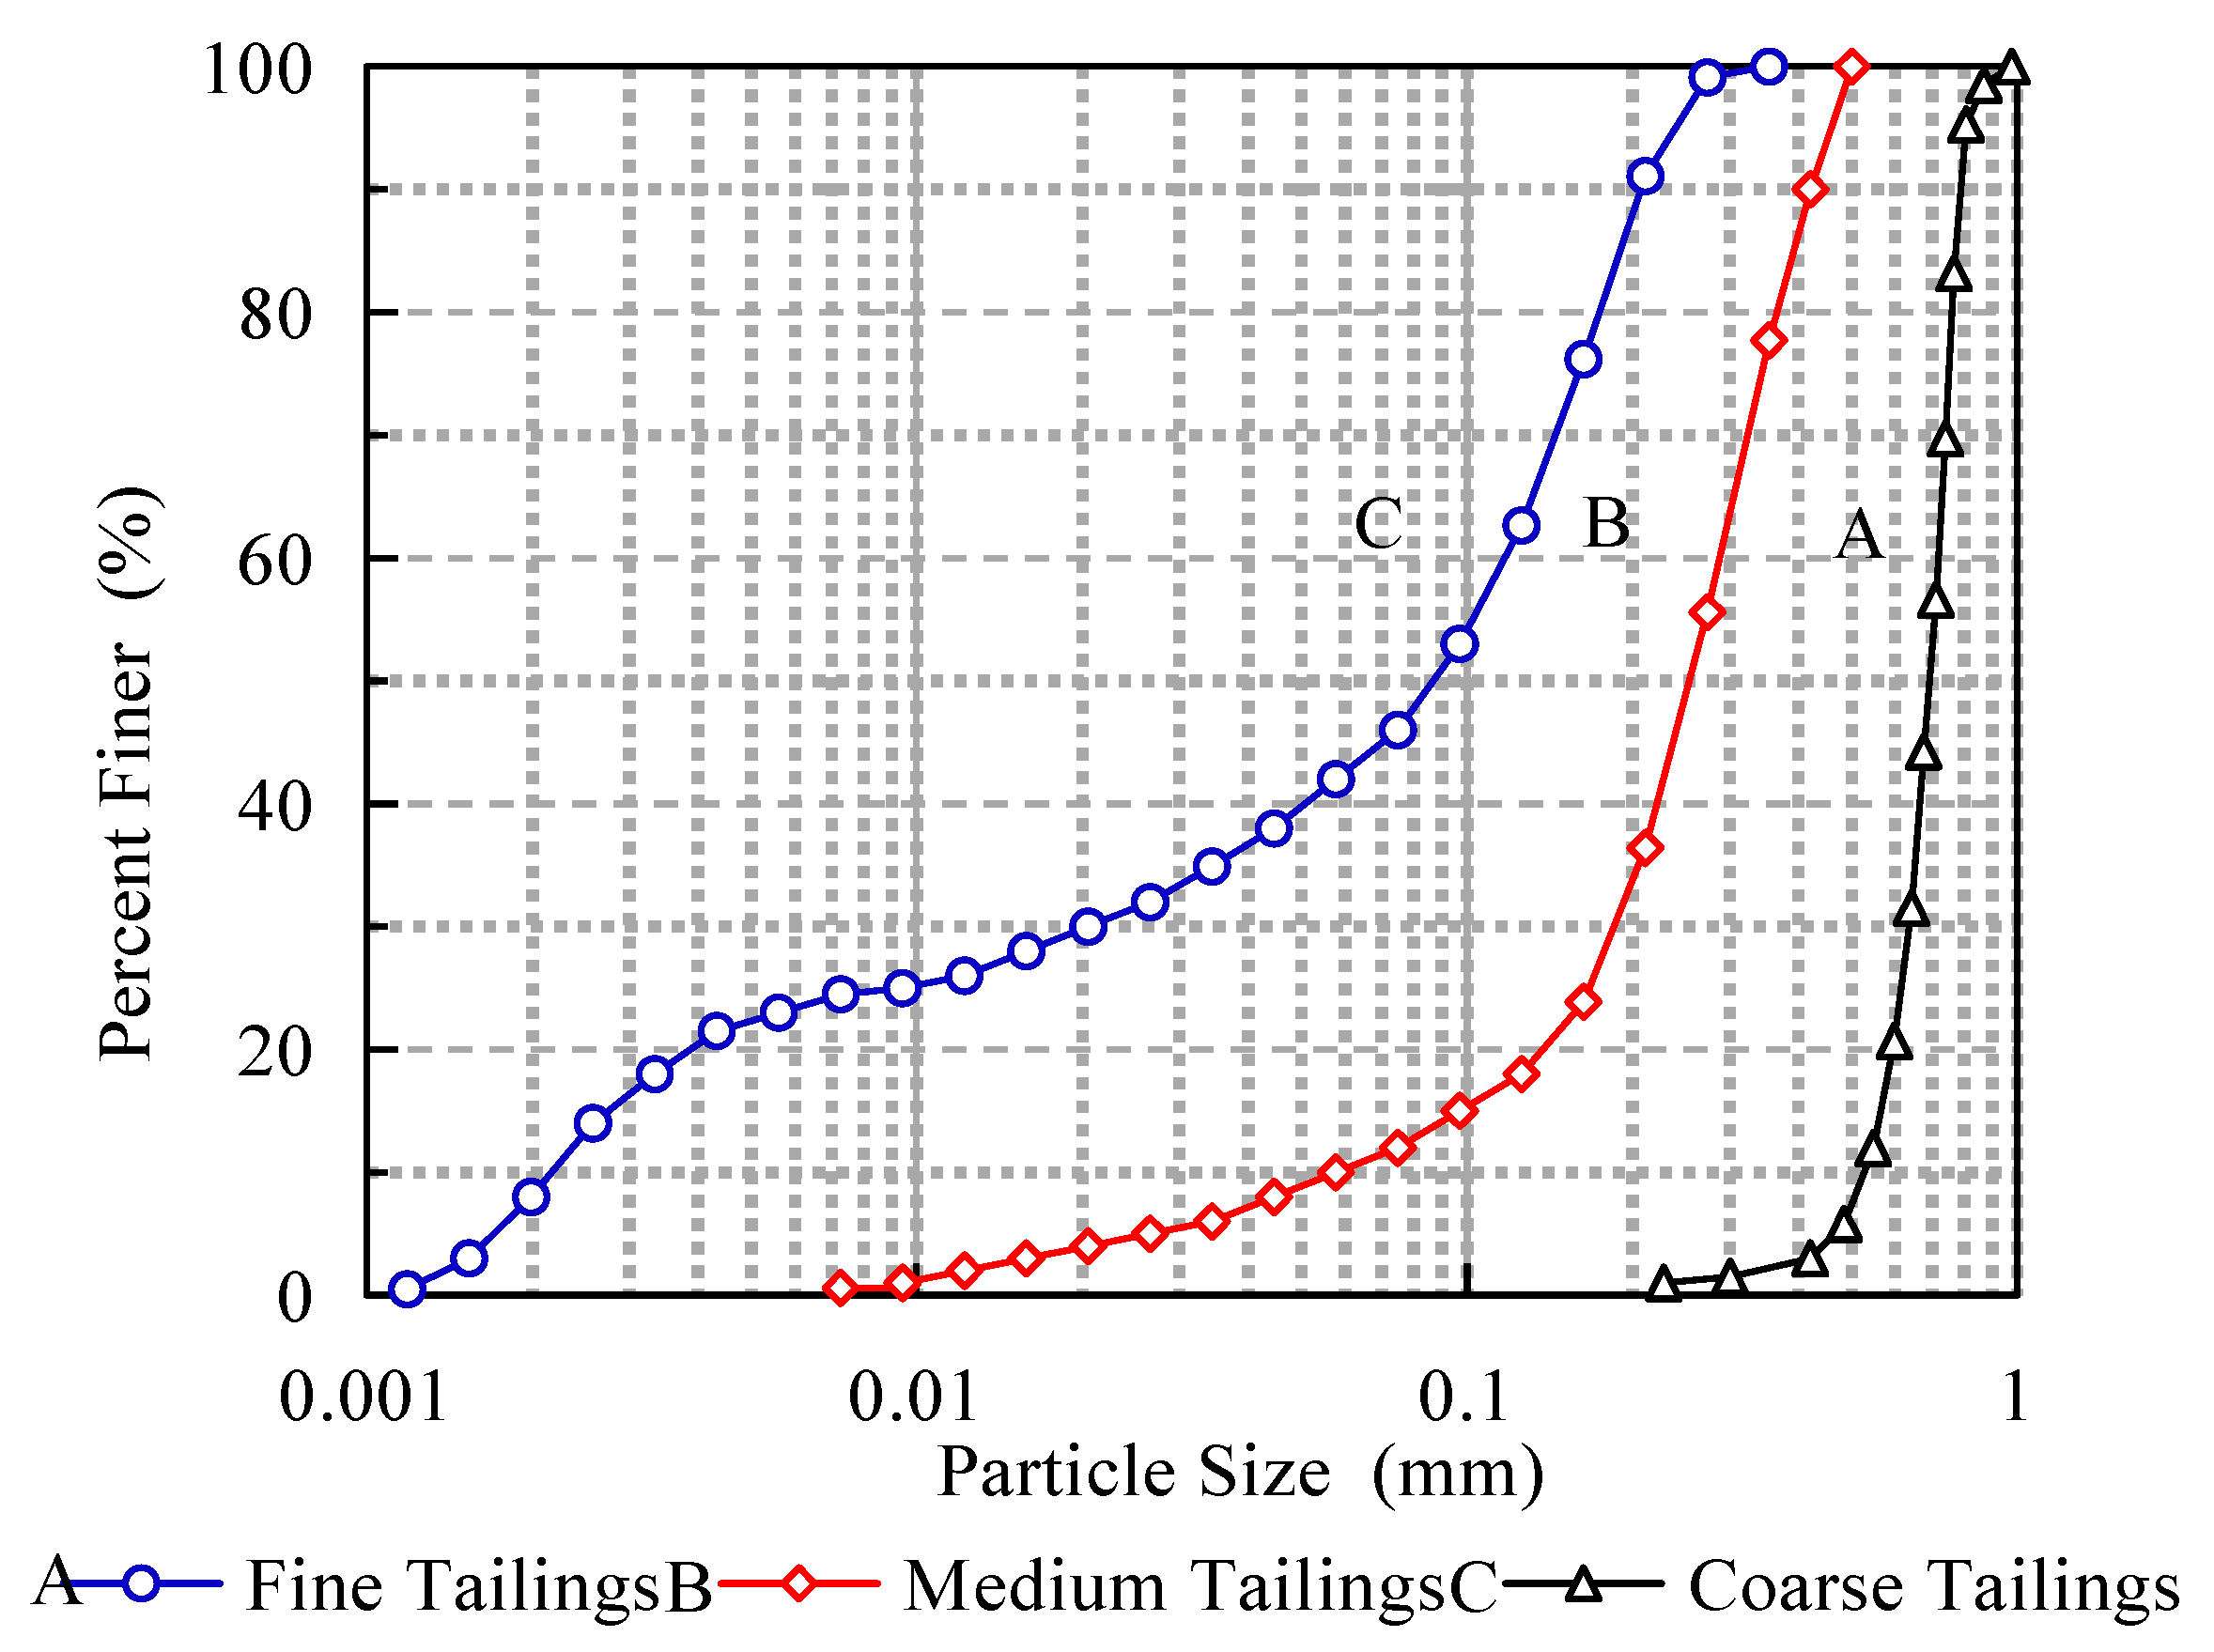
The copper tailings utilized throughout all tests were extracted from a tailings disposal site located in Yunnan Province, China, being classified (GB/T 50123-1999) as silt with sand. The copper tailings particle-size distribution is shown in Figure 3, and the characterization test results are presented in Table 1. The d50 of the coarse tailings, medium-sized tailings and fine tailings are d50 = 0.72 mm, d50 = 0.26 mm, d50 = 0.08 mm, respectively.
According to the similarity theory, the mudflow was initially prepared and premixed with tailings and water at 40% volume concentration utilizing a mixer, then run through a pump to transport the mudflow into the tailings pond until the level reached a 30 cm height. All sensors and cameras were completely preinstalled. Finally, the rectangular gate was opened completely (simulating the sudden dam-break) by the pneumatic cylinder in 0.5 s.
The sensors mentioned above recorded the mudflow velocity, depth, and dynamics pressure in real time during the experiment.
3. Results and Discussion
3.1. Mudflow Flood Hydrograph
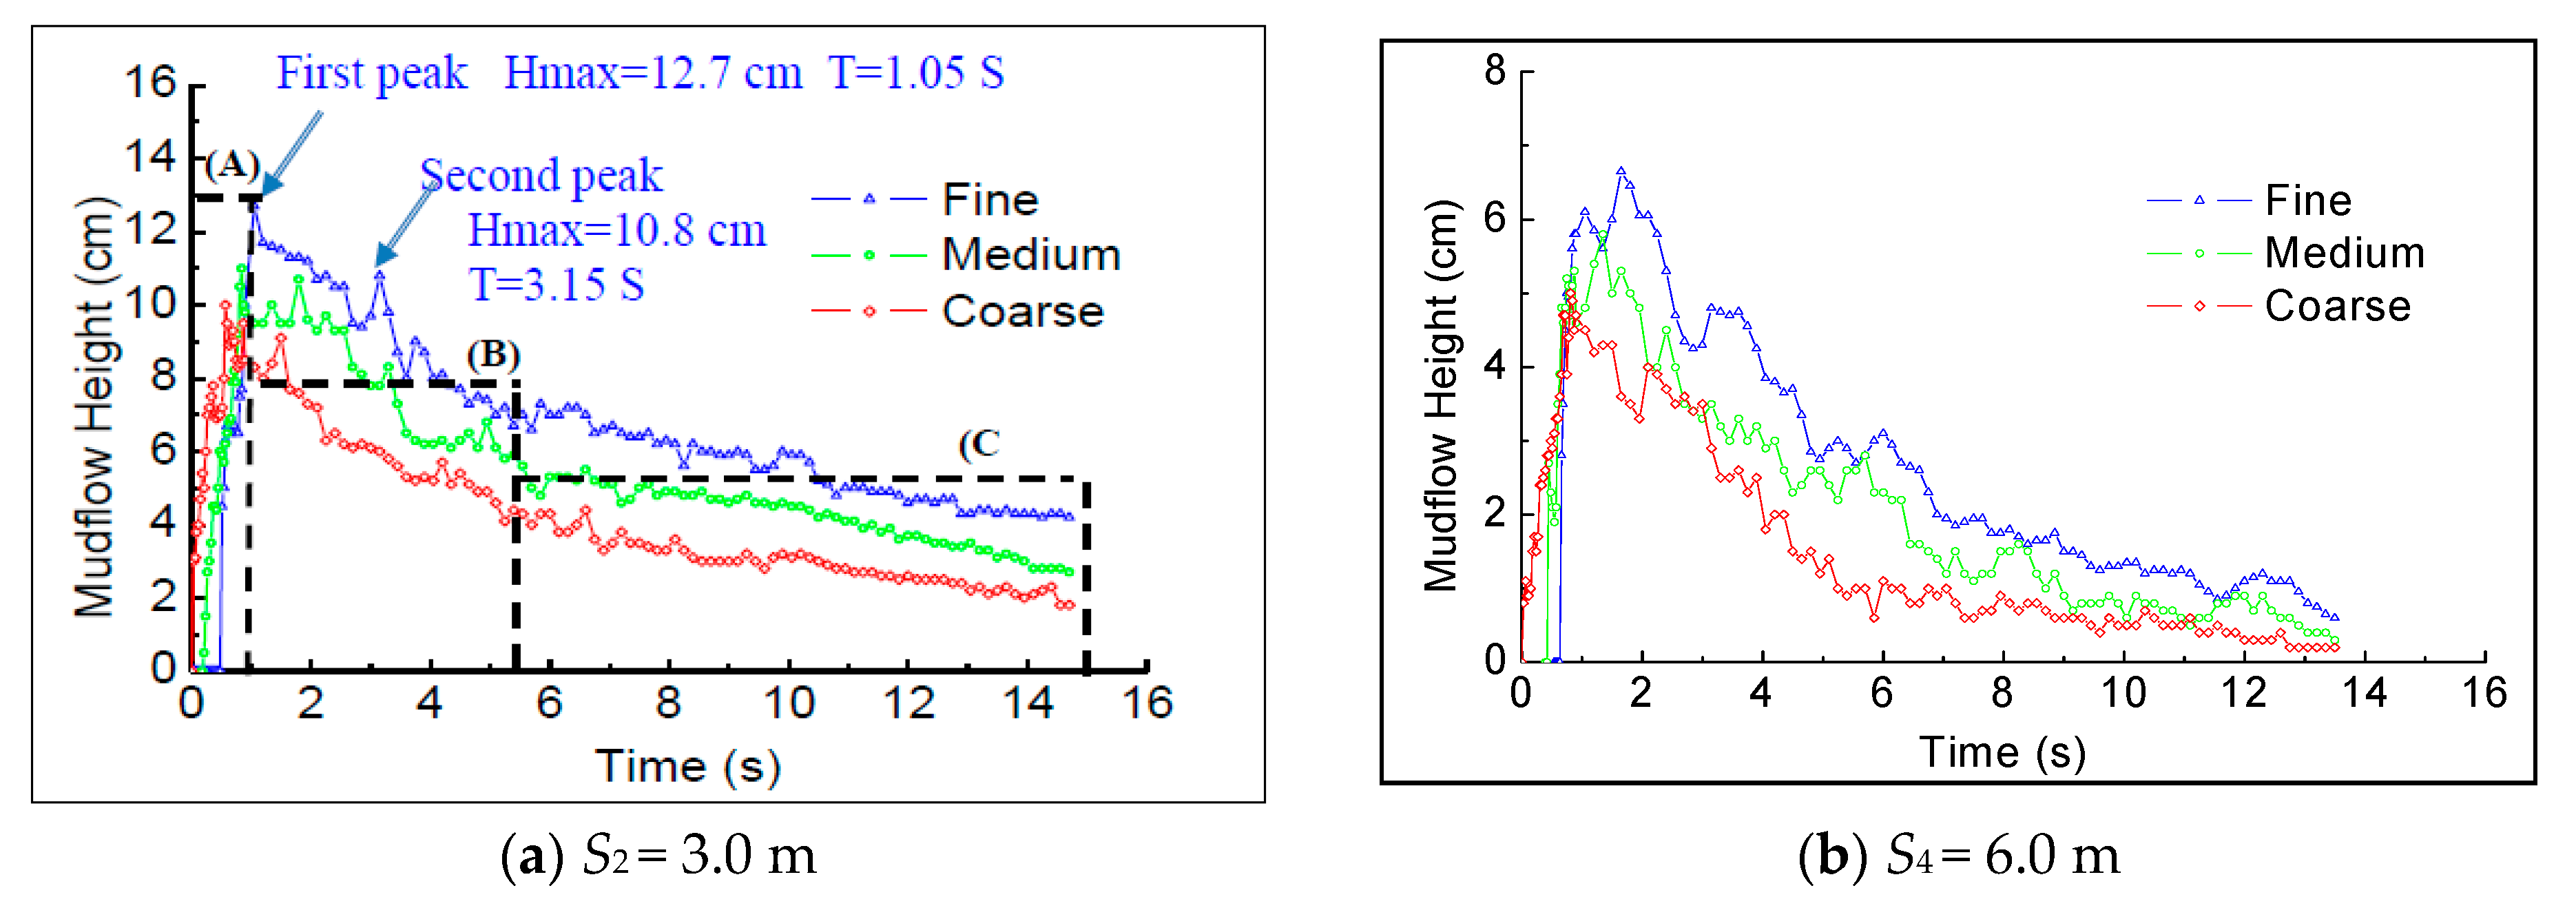
Parallel to the depth of the mudflow wave measurements, the evolution of the free surface profiles were captured using digital cameras capable of recording 300 frames per second (fps) at a resolution of 512 × 384 pixels. To obtain detailed information regarding the complex free surface flow, four digital cameras were used, and lateral views of the flow evolution were taken. The mudflow flood hydrograph at downstream monitoring points was analyzed based on the video images captured during randomly selected experimental runs. For different particle grain sizes, the mudflow flood hydrographs were plotted in Figure 4.
Figure 4 shows the mudflow flood hydro-graph at locations S2 and S4 (3.0 m and 6.0 m downstream from the gate) relating to the tests where H = 30 cm was the initial filling height. The hydro-graph shape comprised of two peaks, with the first reaching 12.7 cm at a time of 1.05 s and the second peak reaching 10.8 cm at a time of 3.15 s (Figure 4a). The first hydrograph peak was composed of a water-dominant flow, mainly from the upper water-laid layer at the tailings pond, whereas the second contained a high tailing load in a high viscosity flow. The mudflow flood hydrograph is divided into three stages: Stage (A), rapid increase; Stage (B), rapid reduction; Stage (C), slow reduction.
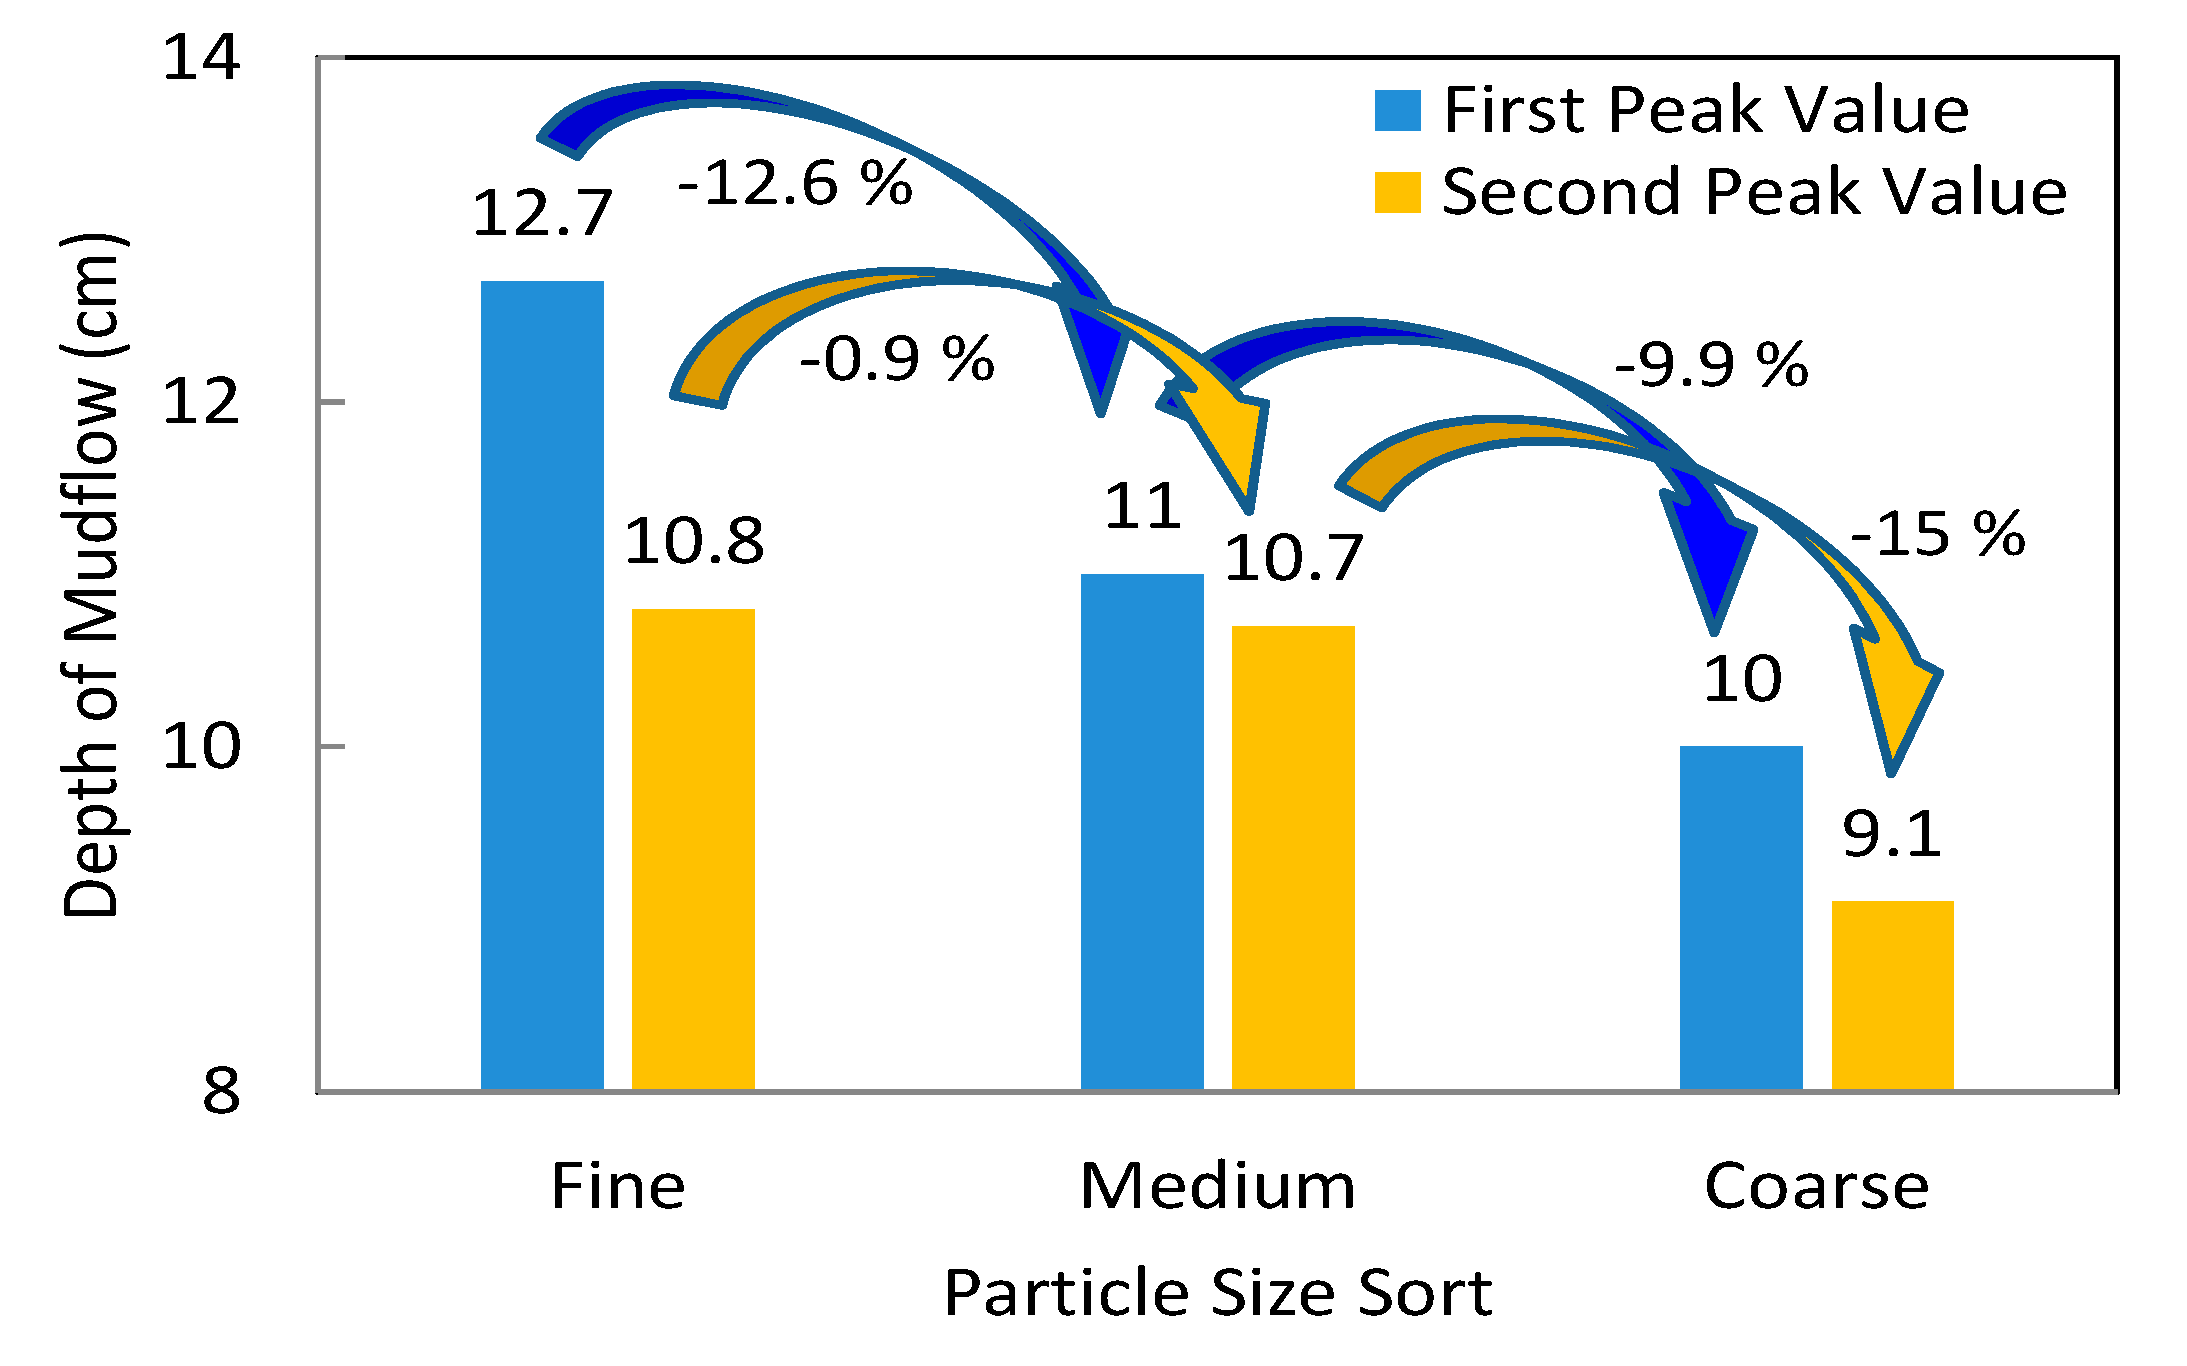
As shown in Figure 5, along with the decrease of tailings particle size, the peak of mudflow depth gradually increases in value. An analysis of the peak value of the location of S2 (3.0 m of downstream of the gate) shows that the first peak values of mudflow depth were 12.7 cm, 11.1 cm, and 10.0 cm, and the second peak values were 10.8 cm, 10.7 cm, and 9.1 cm for fine tailings, medium tailings, and coarse tailings, respectively. Relative to the maximum depth of fine tailings-mudflow, the medium tailings-mudflow, and the coarse tailings-mudflow decreased by 12.6% and 9.9%, respectively. The grain-size affected the maximum depth of tailings-mudflow significantly.
With a decrease in the size of the tailings particles, there is an increase in the number of particles in a constant volume. As a result of this, accordingly the number of interactions between particles increase, leading to an overall increase in viscosity (the resistance to force that causes flow) [25]; the mudflow height will increase in the flume, leading to an increase of the peak value.
3.2. Changes in the Dynamic Pressure of Mudflow
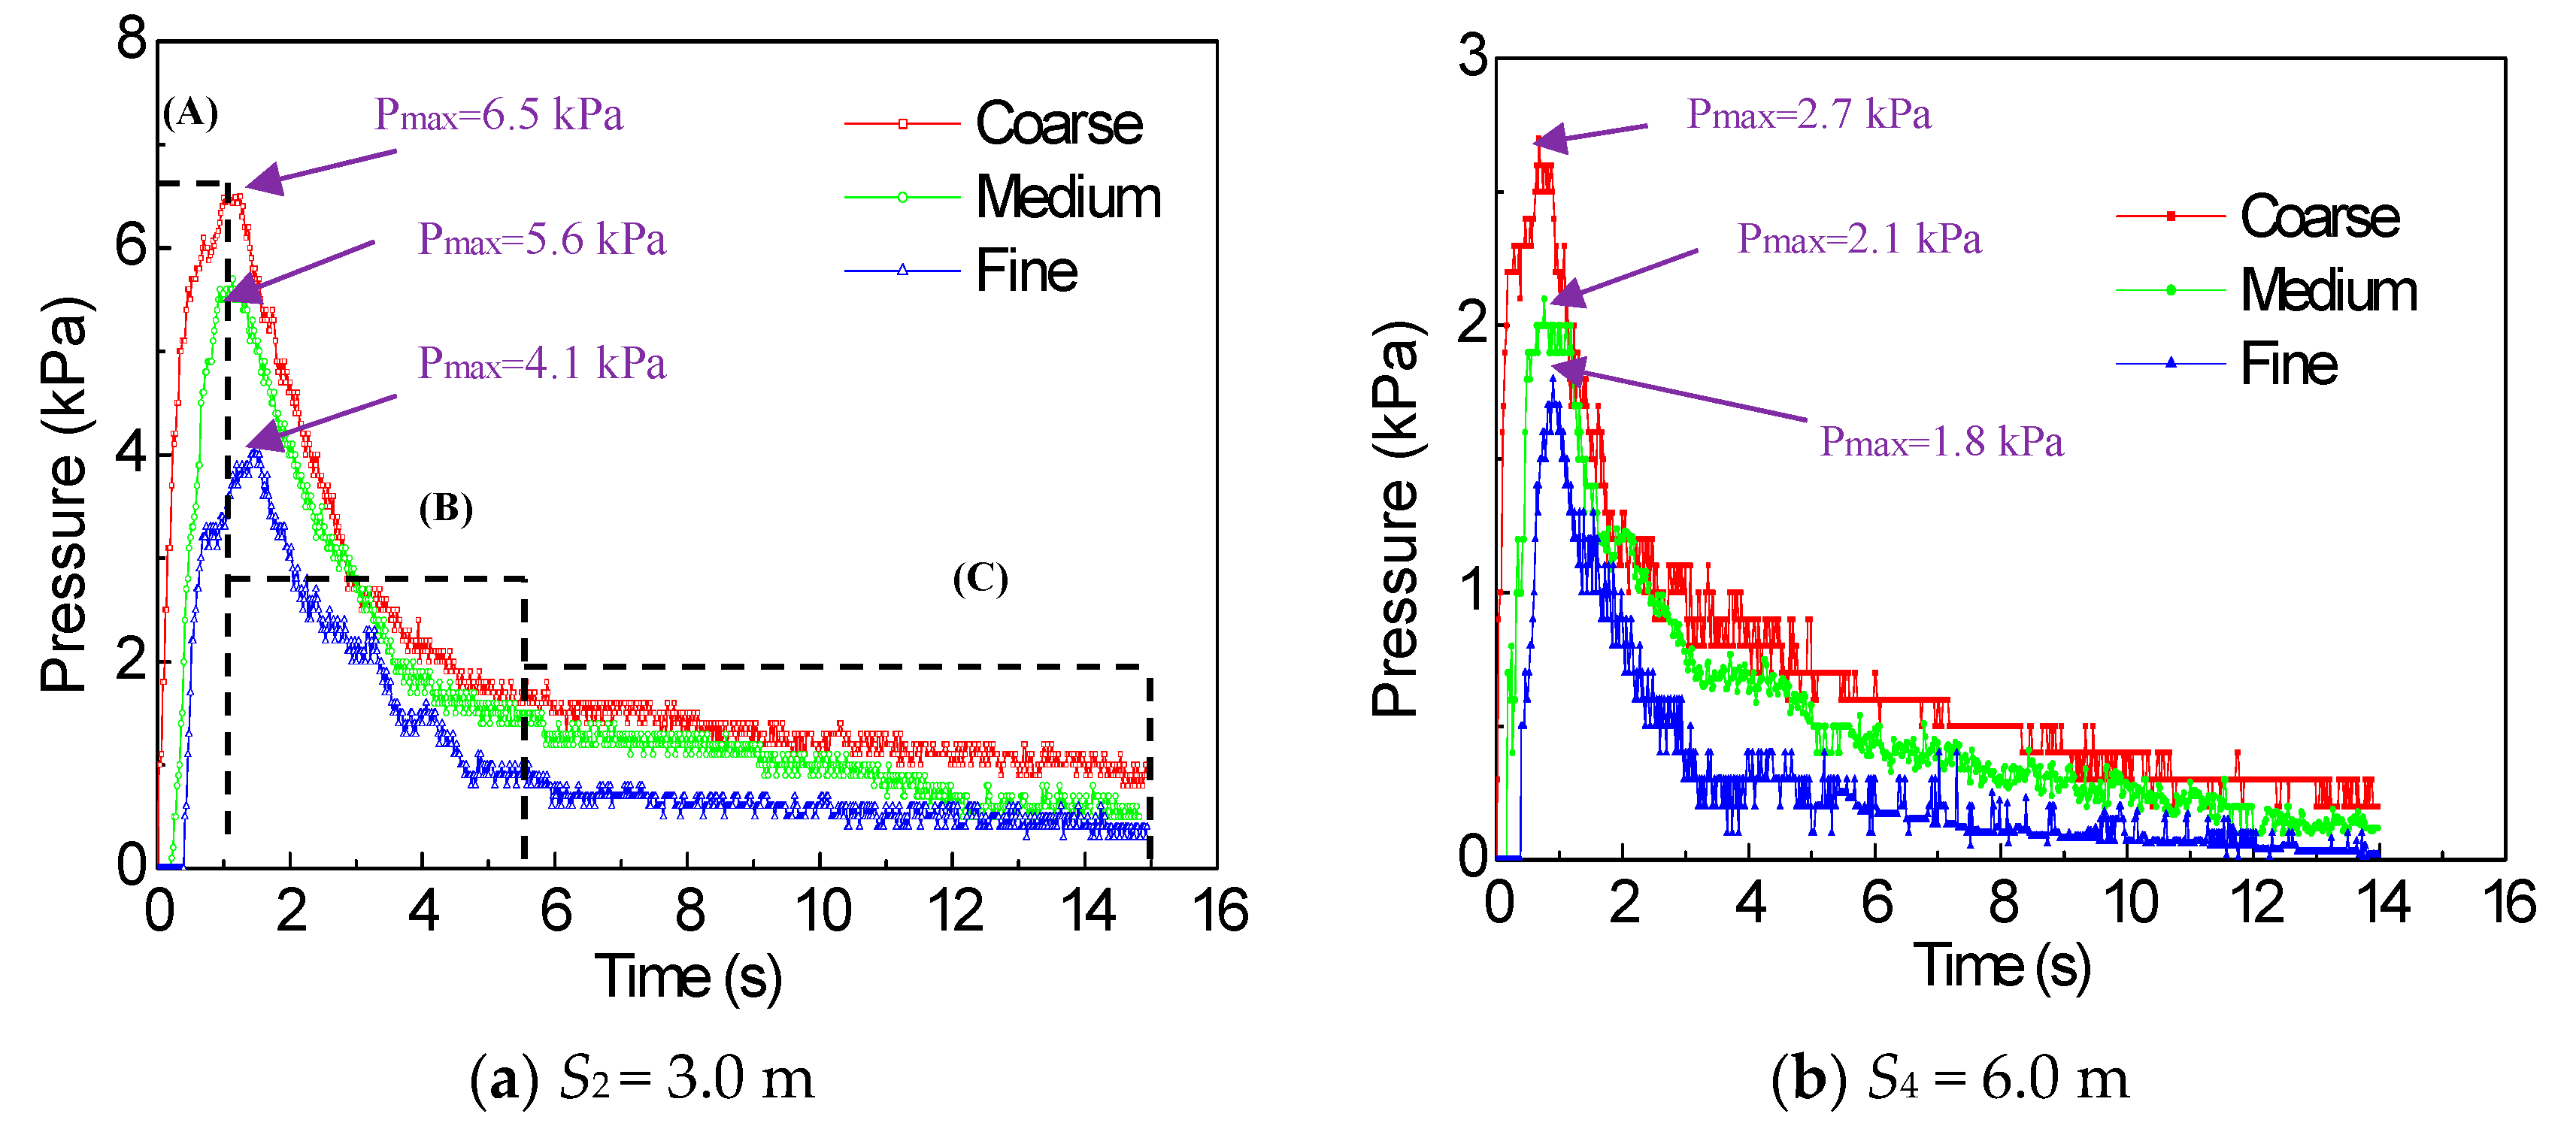
To obtain detailed information regarding the dynamic pressure of mudflow surging from a tailings dam-break during randomly selected experimental runs, four pressure sensors were used, and the dynamic pressure was taken. The dynamic pressure at four specific locations S1, S2, S3, and S4 (1.5 m, 3.0 m, 4.5 m, and 6.0 m downstream of the gate) were analyzed, and the dynamic pressure of mudflow was plotted in Figure 6 corresponding to three different types of tailing particle sizes. Figure 6 shows the dynamic pressure curve at locations S2 and S4 (3.0 m and 6.0 m downstream from the gate) for tests with H = 30 cm as the initial filling height. The dynamic pressure curve consisted of three stages: rapid increase (Stage A), rapid reduction (Stage B), and slow reduction (Stage C).
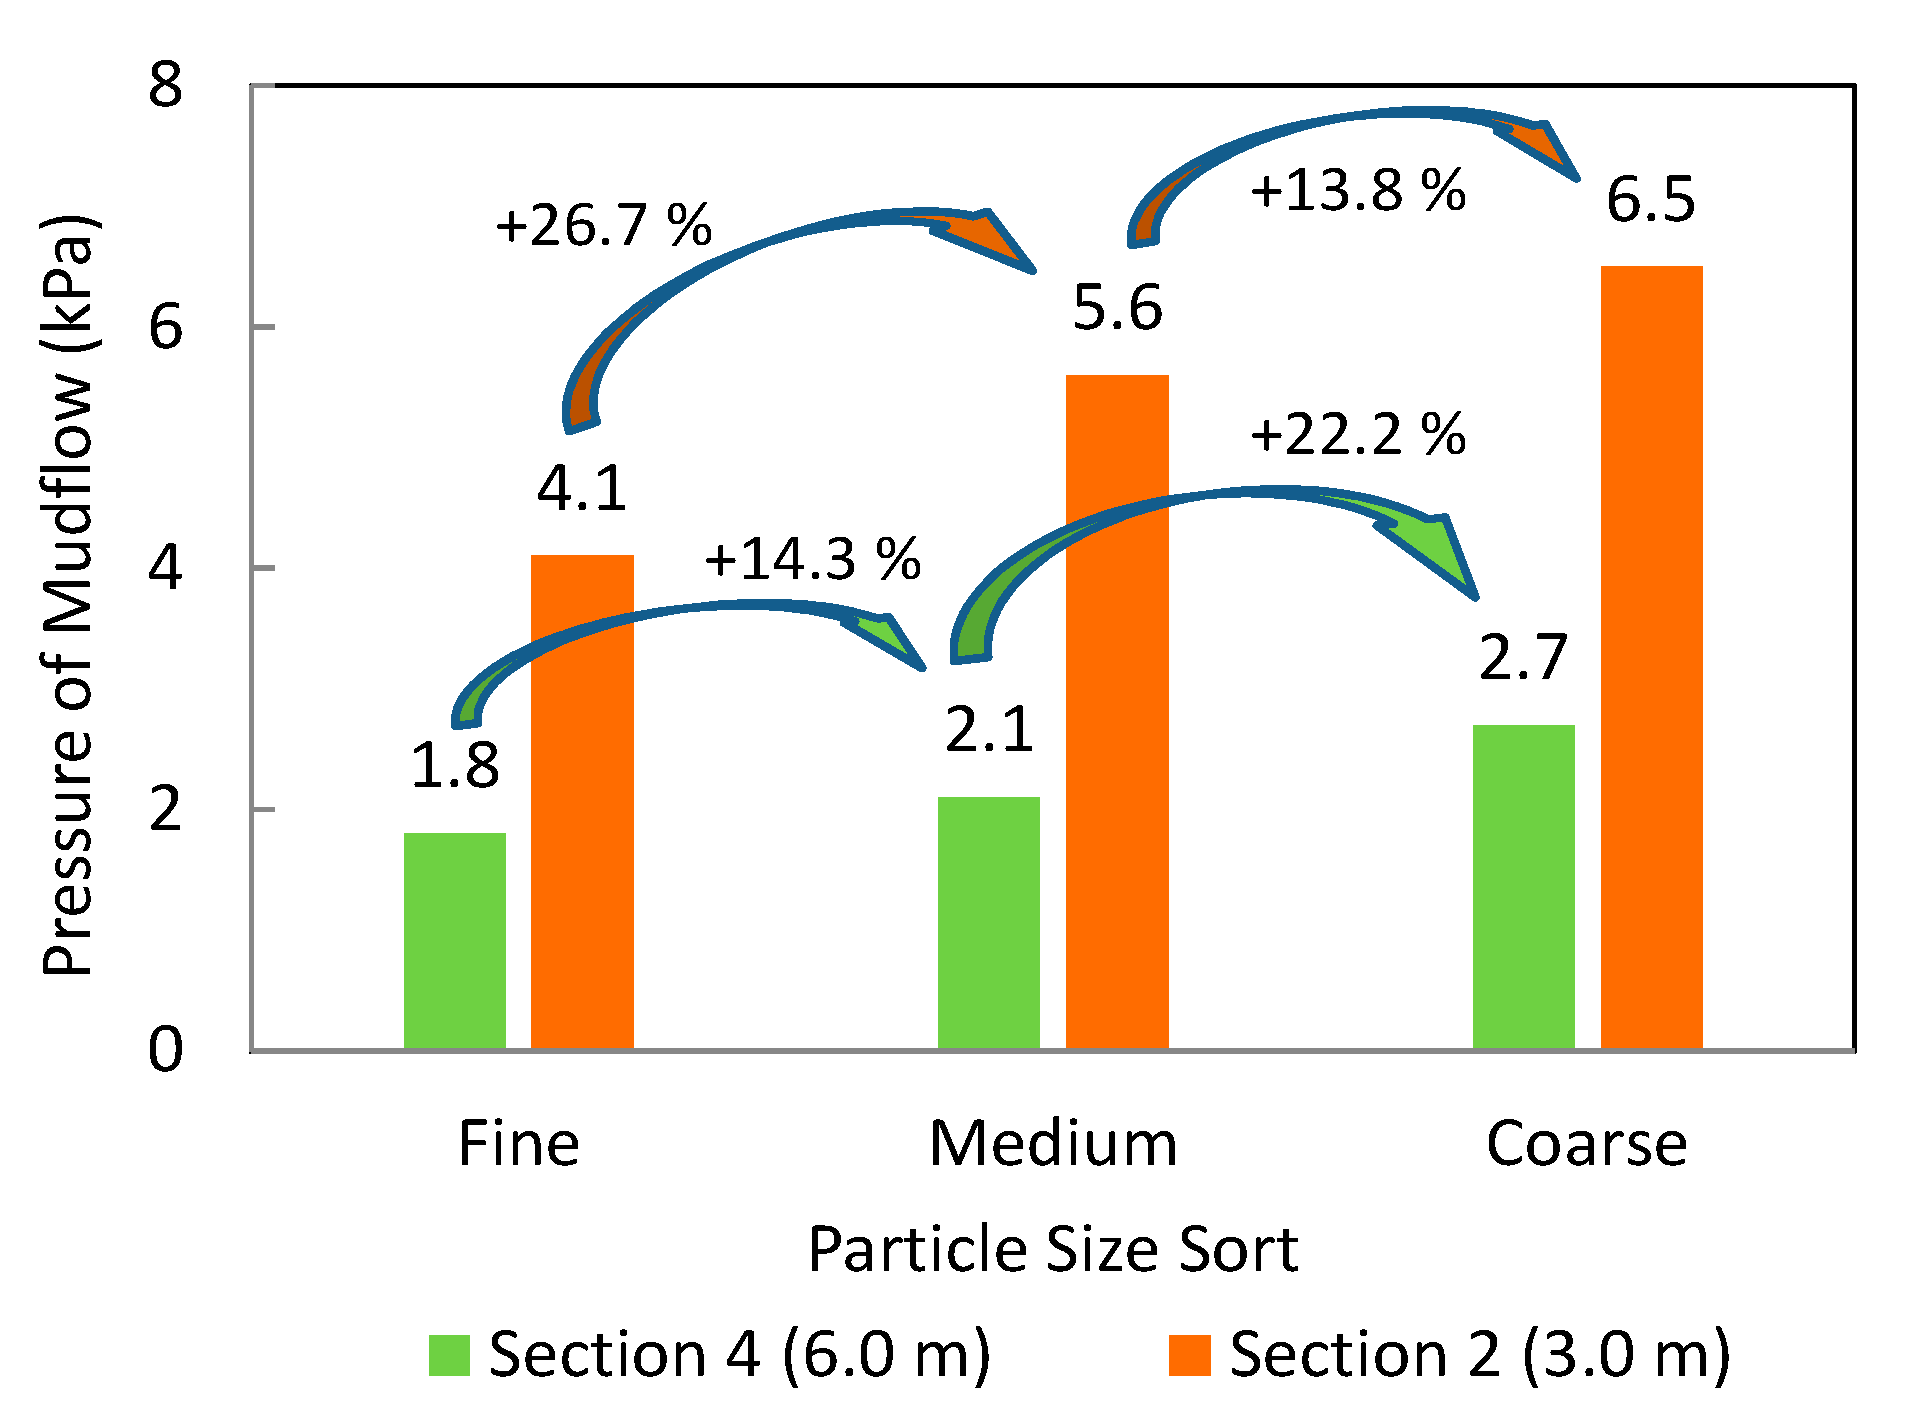
As shown in Figure 7, along with an increase in the article size of the tailings, the peak of dynamic pressure also gradually increased in value. An analysis of the peak value at the location of S2, the peak values of dynamic pressure were 4.1 kPa, 5.6 kPa, and 6.5 kPa for fine tailings, medium tailings, and coarse tailings, respectively. Relative to the maximum pressure of fine tailings-mudflow, the medium tailings-mudflow and the coarse tailings-mudflow increased by 26.7% and 13.8%, respectively. The grain size significantly affected the maximum pressure of tailings-mudflow.
It has been pointed out in Section 3.1 that the smaller the particle size, the smaller the mudflow velocity. The experimental results are explained. According to the relationship between mudflow velocity and impact force in literature [26], the pressure of mudflow is positively correlated with velocity. Therefore, the smaller the particle size, the smaller the velocity, and the smaller the pressure.
3.3. Changes in Velocity of Mudflow
To obtain detailed information on the topic of the velocity of mudflow surging from a tailings dam-break during randomly selected experimental runs, velocity trackers were used, and the velocity was recorded. The velocities at four locations S1, S2, S3, and S4 (1.5 m, 3.0 m, 4.5 m, and 6.0 m downstream of the gate) were analyzed, and the velocity of the mudflow is plotted in Figure 8 corresponding to the three different tailing particle sizes. The initial velocity at different monitoring points is shown in Table 2.
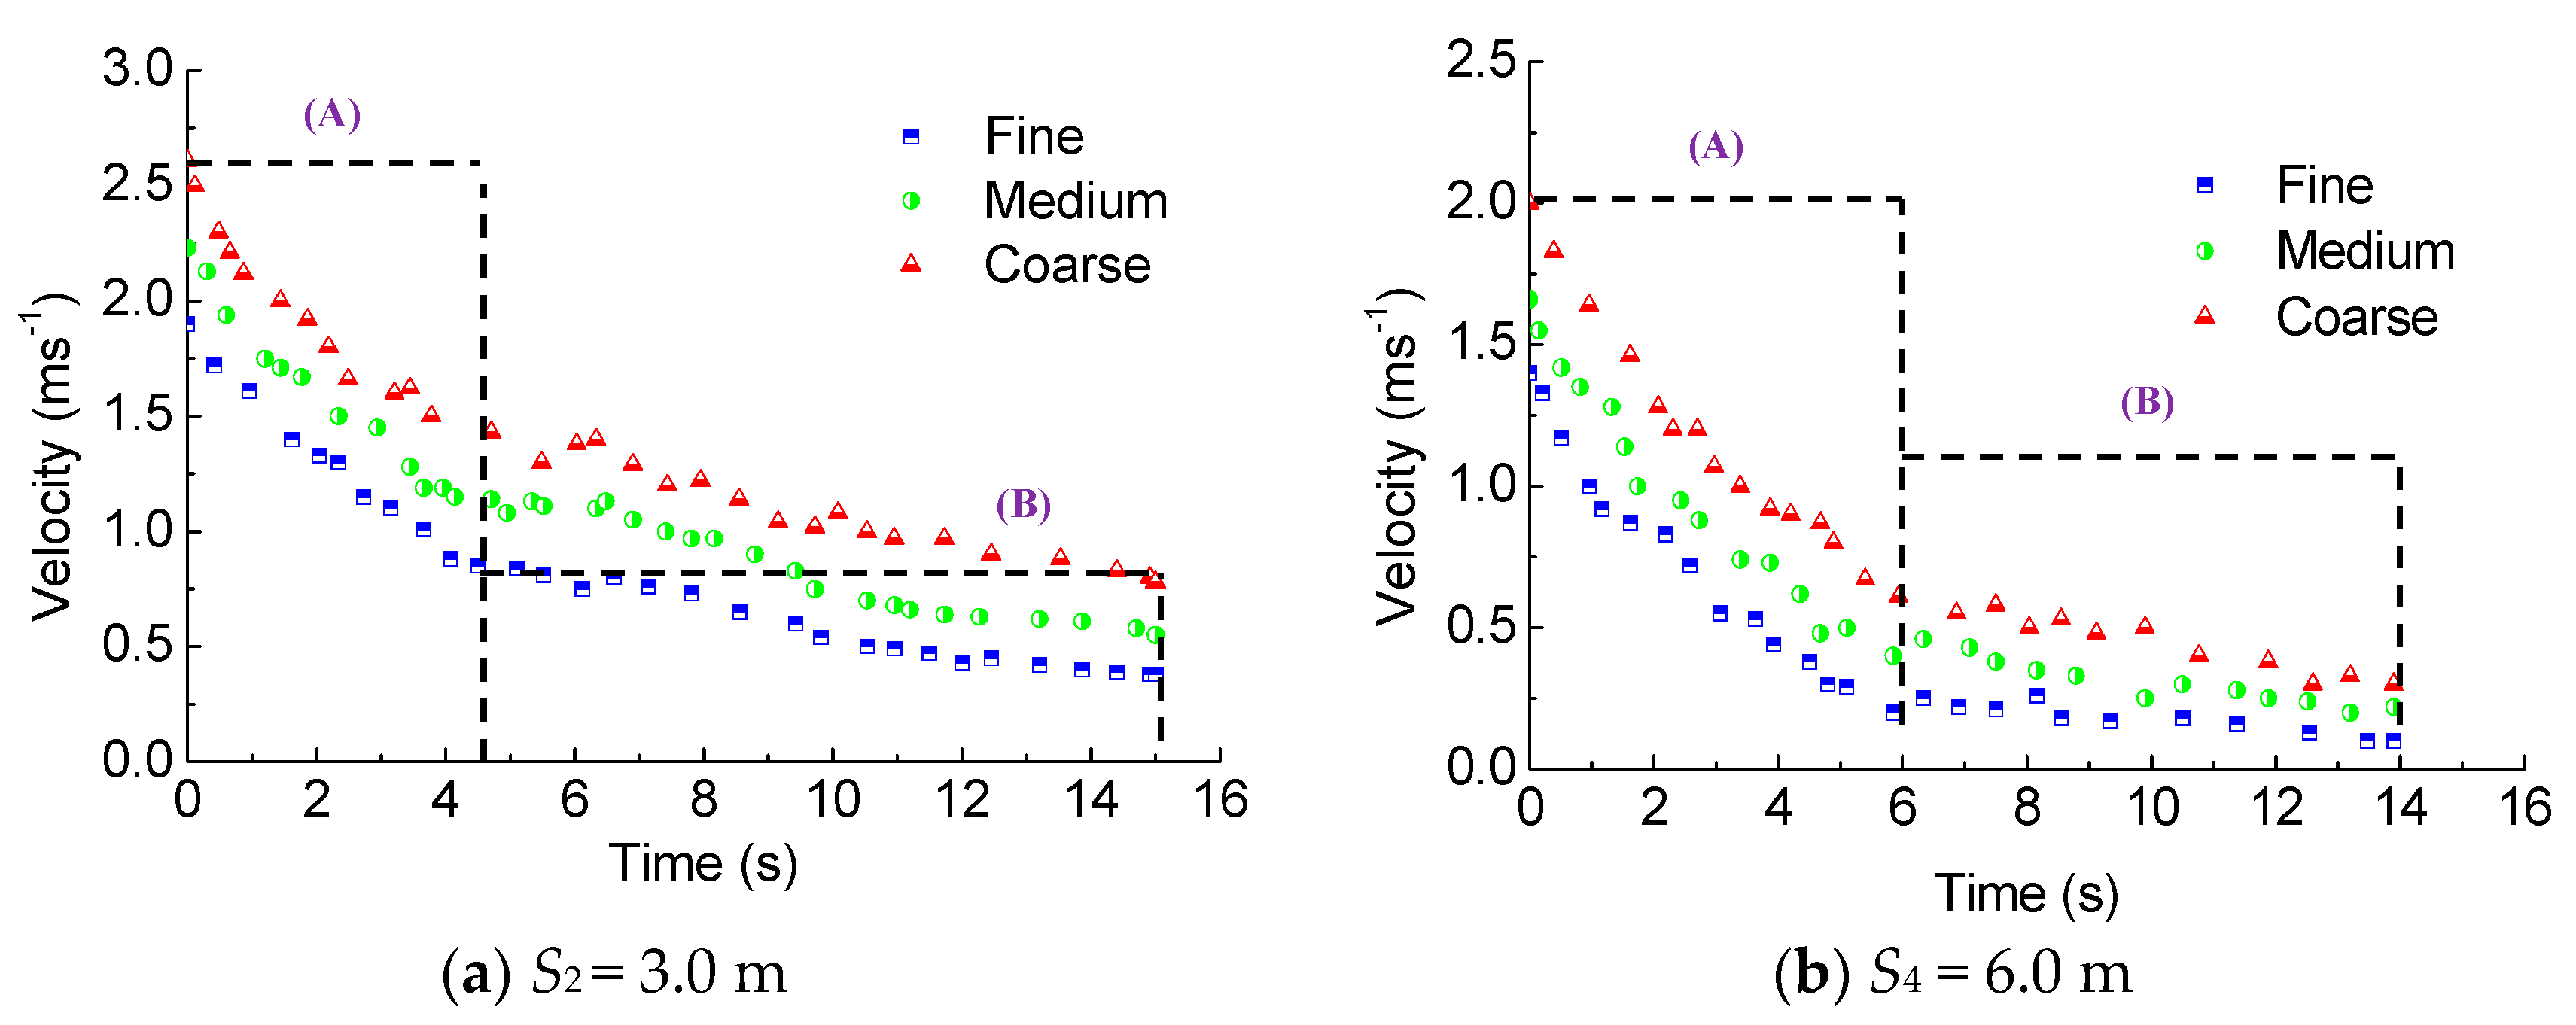
Figure 8 depicts the velocity curve at different monitoring points in the downstream trench. The velocity curve presented two distinct primary stages, namely a rapid reduction stage (A) and a slow reduction stage (B). The velocity is relatively high at the initial stage of the dam-break. At all monitoring points, with an increasing of the particle size of the tailings, the velocity increases simultaneously.
Table 2 indicates the initial velocity at different monitoring points for the three different tailing particle sizes. As shown in Table 2, along with the increase of the particle size of the tailings, the initial peak velocity gradually increases in value. Analysis of the peak value at the location of S2, the peak values of the initial velocity were 1.9 m·s−1, 2.2 m·s−1, and 2.6 m·s−1 for fine tailings, medium tailings, and coarse tailings, respectively.
Similarly, it has been pointed out in Section 3.1 that with a decrease in the size of the tailings particles, there is an increase in the viscosity of mudflow. As a result of this, the liquidity of mudflow is worse, leading to an overall decrease in velocity.
4. Discussion and Conclusions
The findings of this research have provided insights into the hydrodynamic characteristics of mudflow caused by the failure of a tailings dam considering the influence of grain-size. All presented findings are applicable to the prediction of mudflow behavior in terms of time and distance. From the study presented in this paper, the following conclusions may be drawn:
- The hydrograph shape comprised of two peaks. The first hydrograph peak was composed of a water-dominant flow, mainly from the upper water-laid layer of the tailings pond, whereas the second contained a high-tailings load in a high viscosity flow.
- The mudflow flood hydrograph and pressure curve can be divided into three stages: rapid increase stage; rapid reduction stage; slow reduction stage. The velocity curve displayed two obvious primary stages, namely a rapid reduction stage and a slow reduction stage.
- Simultaneous to the increase in the particle-size of the tailings, the peak of dynamic pressure and velocity gradually increase in value. However, the peak of mudflow depth gradually decreases in value. Particle grain size has a significant impact on the hydrodynamic characteristics of tailings-mudflow.
Due to the characteristics of large discharge, strong destructiveness, and sudden occurrence of dam-break mudflow, field observation, and test are difficult to achieve. Therefore, a model test is an important method to study the flow characteristics of mudflow from tailings dam-break at present. This paper researches the effect of grain size on the hydrodynamics of mudflow surge from a tailings dam-break by a self-designed Tailings Dam-Break Model Test System (TDBMTS), it achieves a good result. But there are also some shortcomings in the experiments, the actual downstream groove topography of tailings-dam is generally complex, but this test simplified the downstream groove, which only studied the flow characteristics of mudflow in the case of regular groove, but the change of groove width has a significant impact on the propagation characteristics of mudflow. Meanwhile, the accuracy of measuring instruments needs to be improved to obtain more accurate data. How to solve these problems are worth further exploration.
Author Contributions
Conceptualization, X.J.; Methodology, X.J.; Validation, Y.C., D.X., S.W., W.W. and T.Y.; Supervision, D.J.W.; Writing—Original Draft Preparation, X.J. and Y.C.; Writing—Review and Editing, X.J. and Y.C.
Funding
The research reported in this paper has been funded by the National Natural Science Foundation of China (No.51404049; No.51804051); Natural Science Foundation project of Chongqing Science and Technology Commission (No.cstc2018jcyjAX0231; cstc2016jcyjA0319); China Scholarship Council (No.201608505157); The Post-Funded Projects of Chongqing University of Science and Technology (No.ckhqzz2008005); and grant Chongqing-0009-2018AQ, Chongqing-0004-2017 AQ; the authors would like to thank the reviewers for their constructive comments that improved the paper.
Conflicts of Interest
The authors declare no conflict of interest.
References
- Shikha, V.; Sharad, C. Highlights from the literature on risk assessment techniques adopted in the mining industry: A review of past contributions, recent developments and future scope. Int. J. Min. Sci. Technol. 2016, 26, 691–702. [Google Scholar]
- Ismet, C. Guest editorial-Special issue on dynamic failures in underground mines. Int. J. Min. Sci. Technol. 2018, 28, 719–720. [Google Scholar] [CrossRef]
- Guangming, Y.U.; Chuanwang, S.O.N.G.; Yongzhan, P.A.N.; Liang, L.I. Review of new progress in tailing dam safety in foreing research and current state with development trent in China. Chin. J. Rock Mech. Eng. 2014, 33, 3238–3248. [Google Scholar]
- Li, C.H.; Bu, L.; Chen, L.G. Research situation of the disaster-causing mechanism of tailing dams and its developing trend. Chin. Eng. 2016, 38, 1039–1049. (In Chinese) [Google Scholar]
- Hanson, G.J.; Cook, K.R. Apparatus test procedures and analytical methods. Appl. Eng. Agric. 2004, 20, 455–462. [Google Scholar] [CrossRef]
- Fall, M.; Benzaazoua, M.; Ouellet, S. Experimental characterization of the influence of tailings fineness and density on the quality of cemented paste backfill. Miner. Eng. 2005, 18, 41–44. [Google Scholar] [CrossRef]
- Imteaz, B.; Shahid, A.; Shifullah, K.; Patrick, L. Geotechnical behavior of uranium mill tailings from Saskatchewan, Canada. Int. J. Min. Sci. Technol. 2016, 26, 369–375. [Google Scholar]
- Wijewickreme, D.; Sanin, M.V.; Greenaway, G.R. Cyclic shear response of fine-grained mine tailings. Can. Geotech. J. 2005, 42, 1408–1421. [Google Scholar] [CrossRef]
- Zhang, P.W.; Wu, H.; Hu, L.M.; Xia, Z.R.; Zang, P.Y. Mechanical characteristics of iron mine tailing materials and analysis on deformation and stability of tailing dam. J. Eng. Geol. 2015, 23, 1189–1195. (In Chinese) [Google Scholar]
- Yin, G.Z.; Jing, X.F.; Wei, Z.A.; Li, X.S. Study of model test of seepage characteristics and field measurement of coarse and fine tailings dam. Chin. J. Rock Mech. Eng. 2010, 29, 3710–3718. (In Chinese) [Google Scholar]
- Zhang, C.; Yang, C.H. Effect of fines content on liquefaction properties of tailings material. Rock Soil Mech. 2006, 27, 1133–1137. (In Chinese) [Google Scholar]
- Qiao, L.; Qu, C.L.; Cui, M. Effect of fines content on engineering characteristics of tailings. Rock Soil Mech. 2015, 36, 923–927. (In Chinese) [Google Scholar]
- Jeyapalan, J.K.; Duncan, J.M.; Seed, H.B. Investigation of flow failures of tailings dams. J. Geotech. Eng. 2000, 109, 172–189. [Google Scholar] [CrossRef]
- Jeong, S.W. Grain size dependent rheology on the mobility of debris flows. Geosci. J. 2010, 14, 359–369. [Google Scholar] [CrossRef]
- Charlebois, L.E. On the Flow and Beaching Behaviour of Sub-Aerially Deposited, Polymer-Flocculated Oil Sands Tailings: A Conceptual and Energy-Based Model. Ph.D. Thesis, University of British Columbia, Vancouver, BC, Canada, 2012. [Google Scholar]
- Dutto, P.; Stickle, M.M.; Pastor, M.; Manzanal, D.; Yague, A.; Moussavi Tayyebi, S.; Lin, C.; Elizalde, M.D. Modelling of fluidised geomaterials: The case of the Aberfan and the Gypsum tailings impoundment flowslides. Materials 2017, 10, 562. [Google Scholar] [CrossRef] [PubMed]
- Kwak, M.; James, D.F.; Klein, K.A. Flow behaviour of tailings paste for surface disposal. Int. J. Min. Process. 2005, 77, 139–153. [Google Scholar] [CrossRef]
- Pastor, M.; Blanc, T.; Haddad, B.; Drempetic, V.; Morles, M.S.; Dutto, P.; Stickle, M.M.; Mira, P.; Merodo, J.F. Depth averaged models for fast landslide propagation: Mathematical, rheological and numerical aspects. Arch. Comput. Methods Eng. 2015, 22, 67–104. [Google Scholar] [CrossRef]
- Luo, K.; Zhang, H.; Luo, M.; Wu, X.; Fan, J. Effects of solid particles and wall roughness on turbulent boundary layer in a two-phase horizontal channel flow. Powder Technol. 2019, 353, 48–56. [Google Scholar] [CrossRef]
- Cui, P.; Tang, J.B.; Lin, P. Research progress of resistance character of debris-flow. Adv. Eng. Sci. 2016, 48, 1–11. (In Chinese) [Google Scholar]
- Mangesana, N.; Chikuku, R.S.; Mainza, A.N.; Govender, I.; Van der Westhuizen, A.P.; Narashima, M. The effect of particle sizes and solids concentration on the rheology of silica sand based suspensions. J. S. Afr. Inst. Min. Met. 2008, 108, 237–243. [Google Scholar]
- Li, C.N.; Li, Y.X. Experimental study on particle size influence on debris flow formation type. J. Jiamusi Univ. (Nat. Sci. Ed.) 2014, 32, 24–28. (In Chinese) [Google Scholar]
- Pan, H.-L.; Yang, S.; Ou, G.-Q.; Huang, J.-C. Local Scour and the Laws of Scour Pit’s Shape Downstream of Debris Flow Sabo Dam. J. Mt. Sci. 2013, 10, 1063–1073. [Google Scholar] [CrossRef]
- Jing, X.F.; Pan, C.S.; Xie, D.; Gong, X.L.; Zhang, X.L. Design and verification of similar simulation test bed for debris flow due to dam break of tailings pond. J. Saf. Sci. Technol. 2017, 13, 24–29. [Google Scholar]
- Wang, X.G. Experiment Study on Rheological Properties of Railings and Its Effect Factors; Chongqing Unversity: Chongqing, China, 2016. [Google Scholar]
- Okuda, S.; Okunishi, K.; Suwa, H. Observation of Debris Flow at Kamikamihoei Valley of Mt. Yadedake. In Excursion Guide-Book, Proceedings of the Third Meeting of IGU Commission on Field Experiments in Geomorphology; Disaster Prevention Research Institute Kyoto Unit Japan: Kyoto, Japan, 1980; pp. 127–139. [Google Scholar]
Figure 1.
Tailings Dam-Break Model Test System (TDBMTS).

Figure 2.
Monitoring points’ distribution, (a) lateral view; (b) top view, length in (cm).

Figure 3.
Size distributions of tested copper tailings (sorts A, B, C).

Figure 4.
Mudflow flood hydrograph at locations S2, and S4 (3.0 m and 6.0 m downstream of the gate) for tests with H = 30 cm as the initial filling height. The hydrograph comprises two peaks related to a first water pulse and a second tailings flow. Stage (A): rapid increase; Stage (B): rapid reduction; Stage (C): slow reduction. Note: The time t = 0 in Figure 4a,b are the starting time of mudflow reaching station S2 and S4.

Figure 5.
The depth of mudflow at the section of S2 (3.0 m downstream of the gate).

Figure 6.
Dynamic pressure curve at locations S2, and S4 (3.0 m and 6.0 m downstream of the gate) for tests with H = 30 cm as the initial filling height. The dynamic pressure-history comprises of three stages, stage (A): rapid increase stage; Stage (B): rapid reduction stage; Stage (C): slow reduction stage. Note: The time t = 0 in Figure 4a,b are the starting time of mudflow reaching station S2 and S4.

Figure 7.
Peak value of dynamic pressure at sections S2 and S4 (3.0 m and 6.0 m downstream of the gate).
Figure 7.
Peak value of dynamic pressure at sections S2 and S4 (3.0 m and 6.0 m downstream of the gate).

Figure 8.
Velocity curve of the mudflow flood at locations S2, and S4 (3.0 m and 6.0 m downstream of the gate) for tests with H = 30 cm as the initial filling height. The curve comprises of two stages. Stage (A): rapid reduction stage; Stage (B): slow reduction stage. Note: The time t = 0 in Figure 4a,b are the starting time of tracker reaching station S2 and S4.


Table 1.
Properties of the copper tailings sample.
| Index | Material | ||
|---|---|---|---|
| Tailings A (Coarse) | Tailings B (Medium) | Tailings C (Fine) | |
| Specific gravity (t/m3) | 2.8 | 2.8 | 2.8 |
| Moisture content (%) | 12.5 | 12.1 | 12.8 |
| Porosity | 0.52 | 0.55 | 0.67 |
| Modulus of compression (MPa) | 17.6 | 15.1 | 13.8 |
| Coefficient of compressibility (MPa−1) | 0.078 | 0.086 | 0.135 |
| Permeability coefficient (×10−6 m·s−1) | 9.86 | 6.67 | 1.46 |
| Cohesion (kPa) | 7.5 | 9.9 | 11.4 |
| Internal friction angle (Φ/°) | 31.2 | 28.1 | 23.5 |
| d50 (mm) | 0.72 | 0.26 | 0.08 |
Table 2.
Initial velocity at different sections for the three different particle sizes of the tailings.
Table 2.
Initial velocity at different sections for the three different particle sizes of the tailings.
| Material Types | Front Velocity V (m·s−1) | |||
|---|---|---|---|---|
| S1 = 1.5 m | S2 = 3.0 m | S3 = 4.5 m | S4 = 6.0 m | |
| Tailings A (coarse) | 3.0 | 2.6 | 2.2 | 2 |
| Tailings B (medium) | 2.5 | 2.2 | 1.8 | 1.6 |
| Tailings C(fine) | 2.1 | 1.9 | 1.5 | 1.3 |
© 2019 by the authors. Licensee MDPI, Basel, Switzerland. This article is an open access article distributed under the terms and conditions of the Creative Commons Attribution (CC BY) license (http://creativecommons.org/licenses/by/4.0/).
Share and Cite
MDPI and ACS Style
Jing, X.; Chen, Y.; Xie, D.; Williams, D.J.; Wu, S.; Wang, W.; Yin, T. The Effect of Grain Size on the Hydrodynamics of Mudflow Surge from a Tailings Dam-Break. Appl. Sci. 2019, 9, 2474. https://doi.org/10.3390/app9122474
AMA Style
Jing X, Chen Y, Xie D, Williams DJ, Wu S, Wang W, Yin T. The Effect of Grain Size on the Hydrodynamics of Mudflow Surge from a Tailings Dam-Break. Applied Sciences. 2019; 9(12):2474. https://doi.org/10.3390/app9122474
Chicago/Turabian StyleJing, Xiaofei, Yulong Chen, Dan Xie, David J. Williams, Shangwei Wu, Wensong Wang, and Tianwei Yin. 2019. "The Effect of Grain Size on the Hydrodynamics of Mudflow Surge from a Tailings Dam-Break" Applied Sciences 9, no. 12: 2474. https://doi.org/10.3390/app9122474
Note that from the first issue of 2016, this journal uses article numbers instead of page numbers. See further details here.