Analysis on Mechanical Properties of Recycled Aggregate Concrete Members after Exposure to High Temperatures

1
College of Civil Engineering and Architecture, Guangxi University, Nanning 530004, China
2
Key Laboratory of Disaster Prevention and Structure Safety of Chinese Ministry of Education, Nanning 530004, China
*
Author to whom correspondence should be addressed.
Appl. Sci. 2019, 9(10), 2057; https://doi.org/10.3390/app9102057
Submission received: 28 February 2019
/
Revised: 23 April 2019
/
Accepted: 13 May 2019
/
Published: 18 May 2019
(This article belongs to the Section Civil Engineering)
Abstract
:In order to study the mechanical properties of recycled aggregate concrete (RAC) specimens after exposure to high temperatures, 120 RAC prism specimens, 57 reinforced recycled aggregate concrete (RRAC) specimens, and 56 steel reinforced recycled aggregate concrete (SRRAC) specimens were designed, involving two varying parameters such as recycled coarse aggregate (RCA) replacement percentage and temperature. The performance degradation of RCA materials, RRAC members, and SRRAC members after exposure to high temperatures was analyzed in depth. The research results show that after exposure to high temperatures the surface color of members may change from cinereous to gray-white. Some cracks may appear on surface of members and the mass of members may be lighter. With the increase of the experiencing temperatures, the bearing capacity (compressive, bending, and shearing) of RAC and its members are reduced, but their ductility and energy dissipation capacity have little effect on the change of high temperature. With the increase of the RCA replacement percentage, the mass loss ratio, ultimate bearing capacity, and peak deformation of each RAC and its members increase slightly, and the displacement ductility and energy dissipation capacity of the RRAC members decrease slightly. With the increase in replacement percentage of RCA, mechanical properties of RAC and their members have little effect after exposure to elevated temperatures, and the fluctuation range is within 20%.
1. Introduction
Recycled aggregate concrete (RAC) is a green building material that can realize the recycling of construction waste, save energy, protect the environment, meet the requirements of sustainable development, and have good fiscal, environmental and social benefits [1]. All countries in the world pay great attention to the research and application of RAC. Many scholars have carried out a large number of experiments and theoretical researches, and have obtained many important research results. It is generally accepted that RAC has differences in physical and mechanical properties with ordinary concrete. Compared with ordinary concrete, RAC are more porous and less dense, and RAC are characterized by higher porosity, lower compressive strength, and much higher water absorption [2,3,4,5,6,7]. RAC has been scientifically formulated and produced can be utilized in engineering structures. As early as in the 1970s, Japan formulated the code for the use of recycled coarse aggregate (RCA) and RAC and encouraged its application. In 2000, the reuse rate of waste concrete exceeded 95%. RAC has also been widely utilized in the United States in the 1980s.
Some of the mechanical properties of RAC may be inferior to those of ordinary concrete that contains natural coarse aggregate (NCA), but such properties are sufficient nonetheless for some practical applications of structural concrete [8,9,10,11]. Won-Chang Choi et al. [12] designed and tested seventeen square columns subjected to monotonic concentric compression loads, the results indicated that compressive strength generally decreases with increasing in replacement percentage of RAC. Then, he designed three test beams using the following RCA replacement percentage: 0%, 50%, and 100%, to study the flexural behavior of RAC beams after exposure to sustained loading [13]. Adam M. Knaack et al. [14] investigated the flexural and shear behavior of reinforced recycled aggregate concrete (RRAC) beams, the author concluded that the effect of RCA on the flexural and shear strength of the beams was small. Valeria et al. [15] studied the cyclic loading behavior of beam–column joints, the author found that the joint made of RAC showed adequate structural behavior. The results of the steel-RAC structure have not only been deeply studied at the level of the members (beam, plate, and column), but also the seismic performance test and theory of the relevant specimens have been completed in terms of joints and structural systems. Based on low cyclic loading tests of seven 1:2.5 scaled column specimens, Hui Ma et al. [16] analyzed the seismic performance of steel reinforced recycled aggregate concrete (SRRAC) columns. The results investigated that as the RCA replacement percentage increased, the seismic performance of SRRC columns decreased slightly. Xiao J Z et al. [17] designed and tested four 1:2 scaled frame specimens to study seismic performance, the results indicated the general seismic behavior of a RAC frame structure was declined with an increase of the RCA replacement percentage. Research shows that RAC is feasible in steel-concrete structure.
With the deepening of research and the practical needs of engineering applications, it is necessary to carry out research on mechanical properties of RAC after the fire. After all, the fire is a multi-risk and extremely dangerous disaster.
Zega et al. [18] studied mechanical properties of RAC with replacement percentage of 75% when it was exposed to high temperatures. The results showed that mechanical properties of RAC were better than ordinary concrete after exposure to a temperature of 500 °C for 1 h. Later, they also studied the mechanical properties of RAC with different water-cement ratio (0.40, 0.70) and different coarse aggregate types (granite gravel, siliceous gravel, and quartzite gravel) after exposure to a temperature of 500 °C for 1 h. The results showed that the mechanical properties of quartzite crushed concrete were the best after exposure to elevated temperature [19]. Hachemi et al. investigated the mechanical properties of recycled brick concrete with different water-cement ratio and replacement percentage of 30% under high temperatures. The results also showed that RAC had better mechanical properties than ordinary concrete after exposure to high temperatures [20]. Terro et al. [21] researched the mechanical properties of three kinds of RAC subjected to elevated temperatures, involving aggregates with fine waste glass (FWG), coarse waste glass (CWG), and fine and coarse waste glass (FCWG). The results showed that the RAC with replacement percentage of 10% had better mechanical properties when exposed to high temperatures. In those RAC, recycled fine aggregate concrete had the best mechanical properties under elevated temperature. Xiao et al. [22] studied the mechanical properties of four kinds of RAC blocks with different replacement percentage after exposure to high temperatures, whose replacement percentage were 25%, 50%, 75%, and 100%, respectively. The author concluded that compared with ordinary concrete blocks, RAC blocks had better mechanical properties after exposure to high temperatures. Kou et al. [23] has discussed the mechanical properties of RAC with two kinds of admixtures (fly ash and geopolymer) subjected to high temperatures. The author found that the compressive strength of RAC with admixtures increased when the maximum temperature was 300 °C, while the residual compressive strength of RAC with admixtures decreased greatly for maximum temperatures of 500–800 °C, Kou et al. believed that it was mainly caused by the coarsening of the internal void structure of the RAC at elevated temperatures.
At present, domestic and foreign scholars’ research on the fire behavior of RAC structures is not systematic enough, and the research on the fire resistance and performance after exposure to high temperatures of RAC structures is still in its infancy. Based on this, our group considered change parameters such as the coarse aggregate replacement percentage and experiencing temperatures, the mechanical tests of 120 RAC prism blocks, 25 RRAC short columns, 32 RRAC beams, 24 SRRAC short columns, and 32 SRRAC beams under high temperatures were carried out. Based on the preliminary experimental data, this paper mainly analyzes the degradation law of the mechanical properties of RAC materials, RRAC members (column, beam), and SRRAC members (column, beam) after exposure to high temperatures, and quantitatively analyzes the differences between them, so as to provide reference for further research and engineering application of RAC members.
2. Experimental Program
2.1. Materials
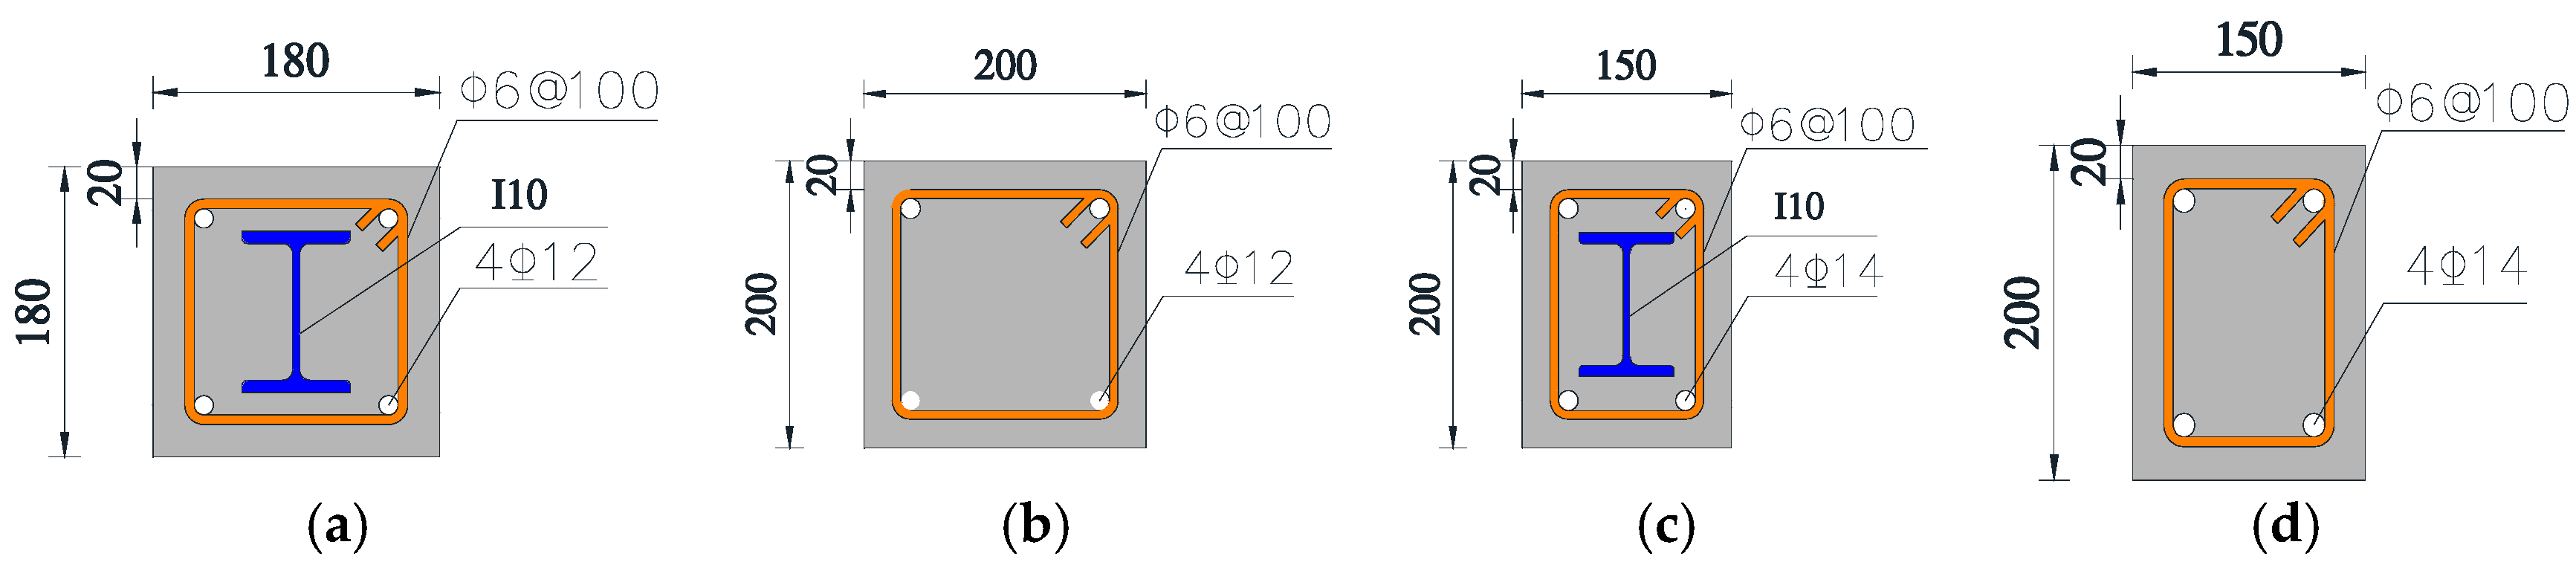
The RCA is produced by mechanically crushing, washing and sifting the waste concrete. The RCA and NCA are sieved under the same conditions, and the particle size is 5–20 mm, and the continuous gradation. The RCA has bulk density of 1432 kg/m3 and water absorption rate of 3.27%. Natural river sand is used as the fine aggregate. Ordinary Portland cement type 32.5 R is used for the specimens with strength grade C30. The mixture ratio design is based on the replacement percentage of 0% of RCA, and the ratio of RCA to NCA is only changed while the total mass of coarse aggregate remains unchanged, and other materials remain unchanged. The mix proportion of recycled concrete is shown in Table 1. Meanwhile, Section steel is I10 of Q235, it has a height of 100 mm, a leg length of 68 mm and a web thickness of 4.5 mm and its yield strength is 423.81 N/mm2 at room temperature. The diameter of longitudinal bar (HRB335) of the columns and beams is 12 mm and 14 mm, respectively. And the diameter of the stirrup bar (HPB300) of the columns and beams is 6 mm. The cross-sectional dimensions and steel distribution (bars) are shown in Figure 1.
2.2. Specimen Preparation
A total of 120 RAC prism specimens (150 mm by 150 mm by 300 mm, 40 groups, 3 in each group, and the data in Table 2 is the average of three identical specimens), 25 RRAC short columns (200 mm by 200 mm by 450 mm), 32 RRAC beam specimens (200 mm by 150 mm by 1100 mm), 24 SRRAC short columns (180 mm by 180 mm by 450 mm) and 32 SRRAC beams (200 mm by 150 mm by 1100 mm) were designed and manufactured. The variation parameters are high temperature (T) and RCA replacement percentage (r). The beams are divided into the bending beam and the shear beam, and the corresponding shear span ratio is 2.0 and 1.2, respectively. The specific design parameters of specimens are shown in Table 2, Table 3, Table 4, Table 5 and Table 6.
2.3. Thermal Exposure
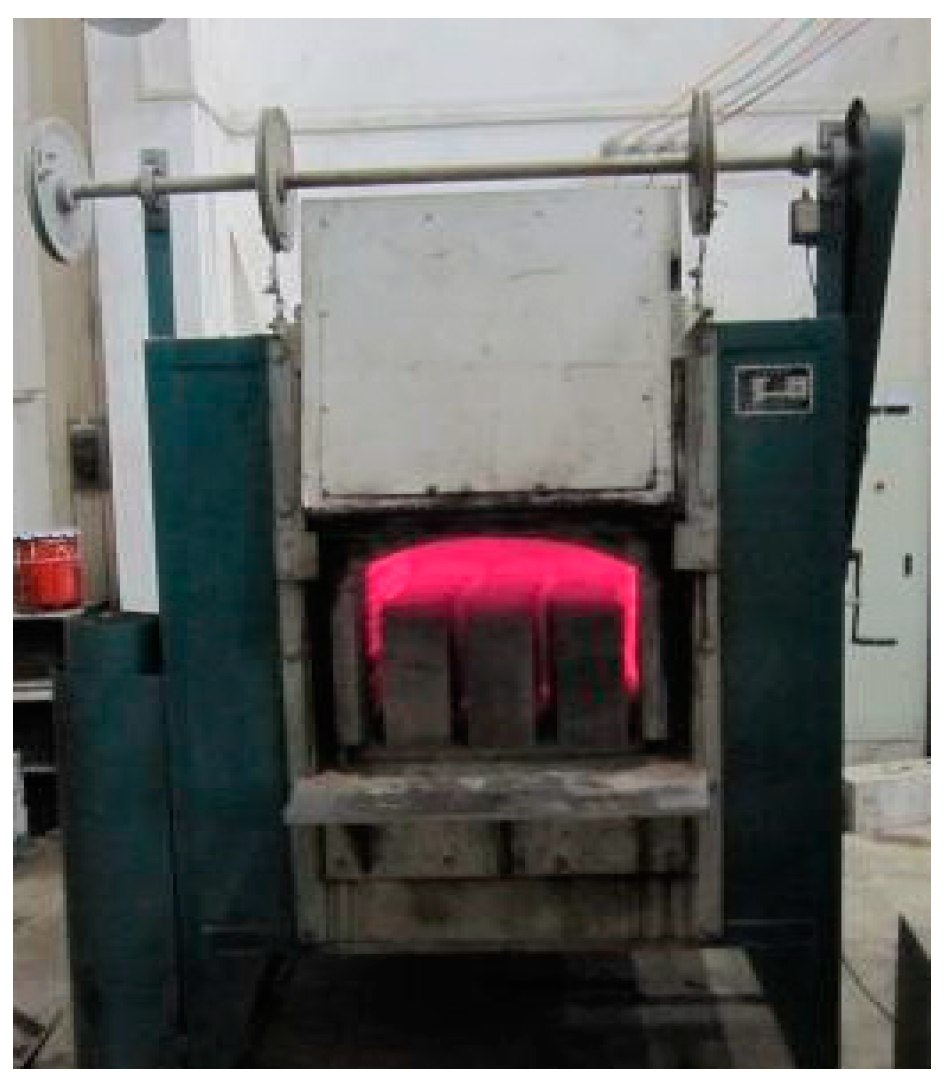
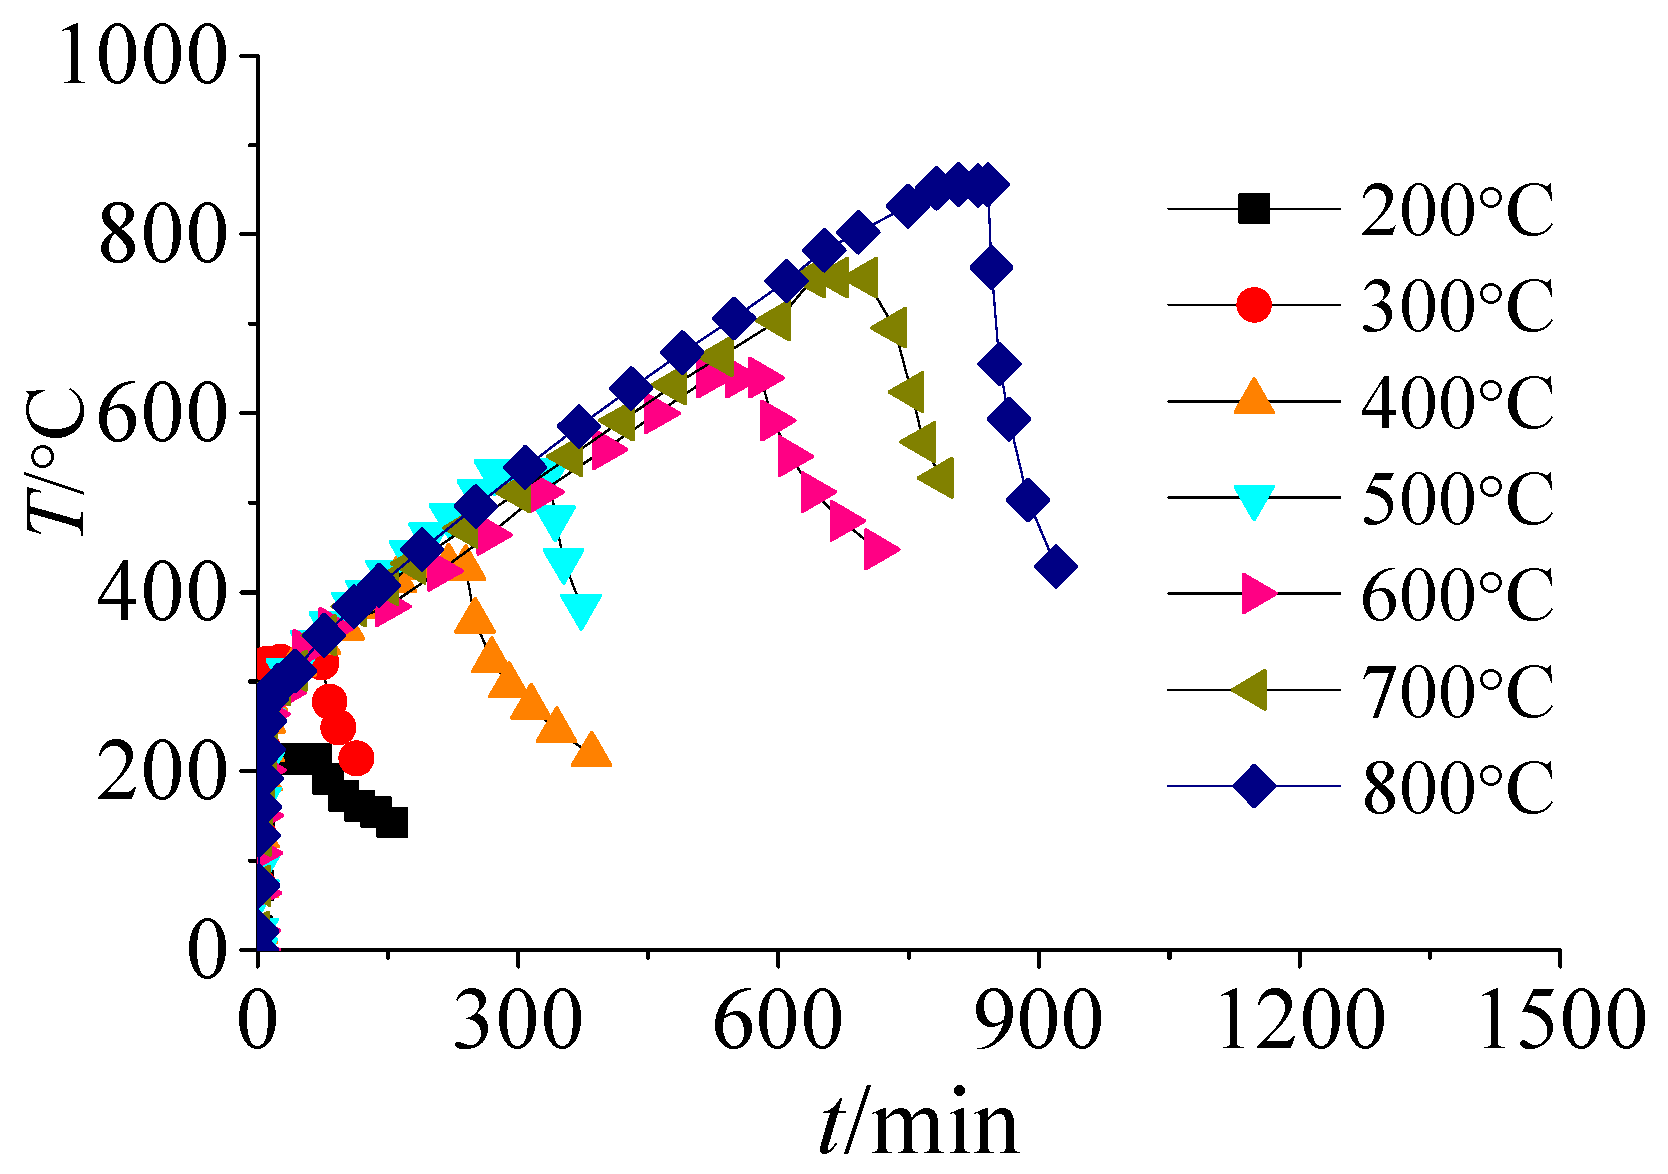
The heating equipment uses RX-45-9 industrial box type resistance furnace manufacturing in Jinan Province, China with a maximum temperature of 950 °C, the furnace size is 1200 mm by 600 mm by 400 mm and the rated power is 45 kW (Figure 2). According to the design of specimens, the target temperature is set separately to increase the temperature in batches. In order to make the temperature distribution inside the specimen uniform, according to the fire-resistant grade provided by the fire protection code of Chinese architectural design, the temperature is raised to the set value and then kept constant for one hour. Then just open the furnace door and let specimens drop to normal temperature under natural conditions. According to its own temperature acquisition system in the resistance furnace, the temperature increase and fall curve of the specimen in the furnace can be obtained as shown in Figure 3.
2.4. Load Equipment and Test Method
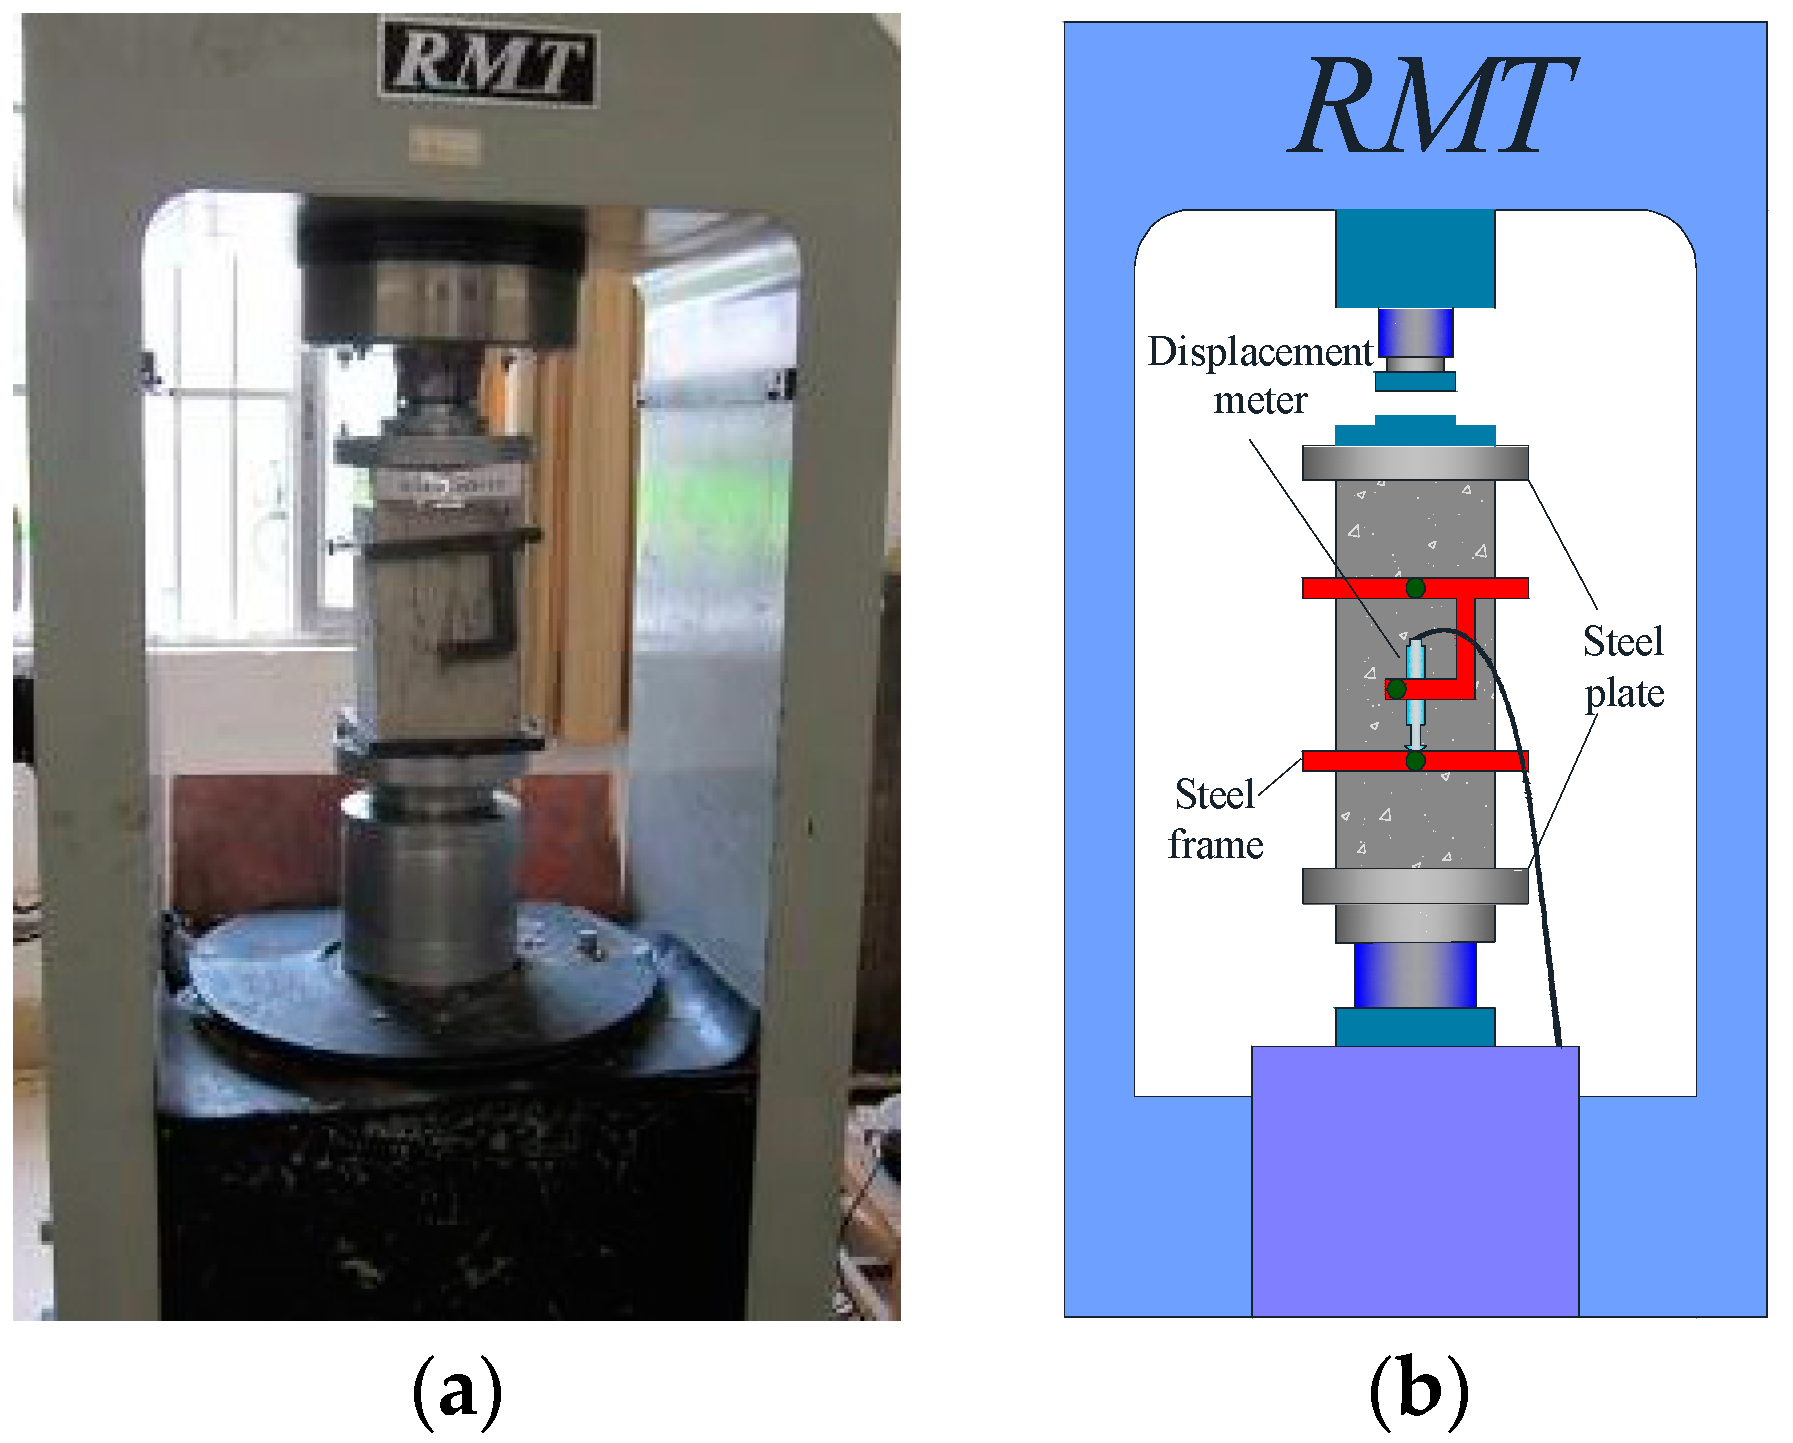
The prism blocks and columns are loaded with axial compression using the RMT-201 mechanical testing machine, as shown in Figure 4. In order to obtain the load-displacement curve of the whole process of the specimen under stress, the test adopts the displacement control loading mode, the loading speed is 0.005 mm/s, and when the load drops to the ultimate load of 75%, the test ends.
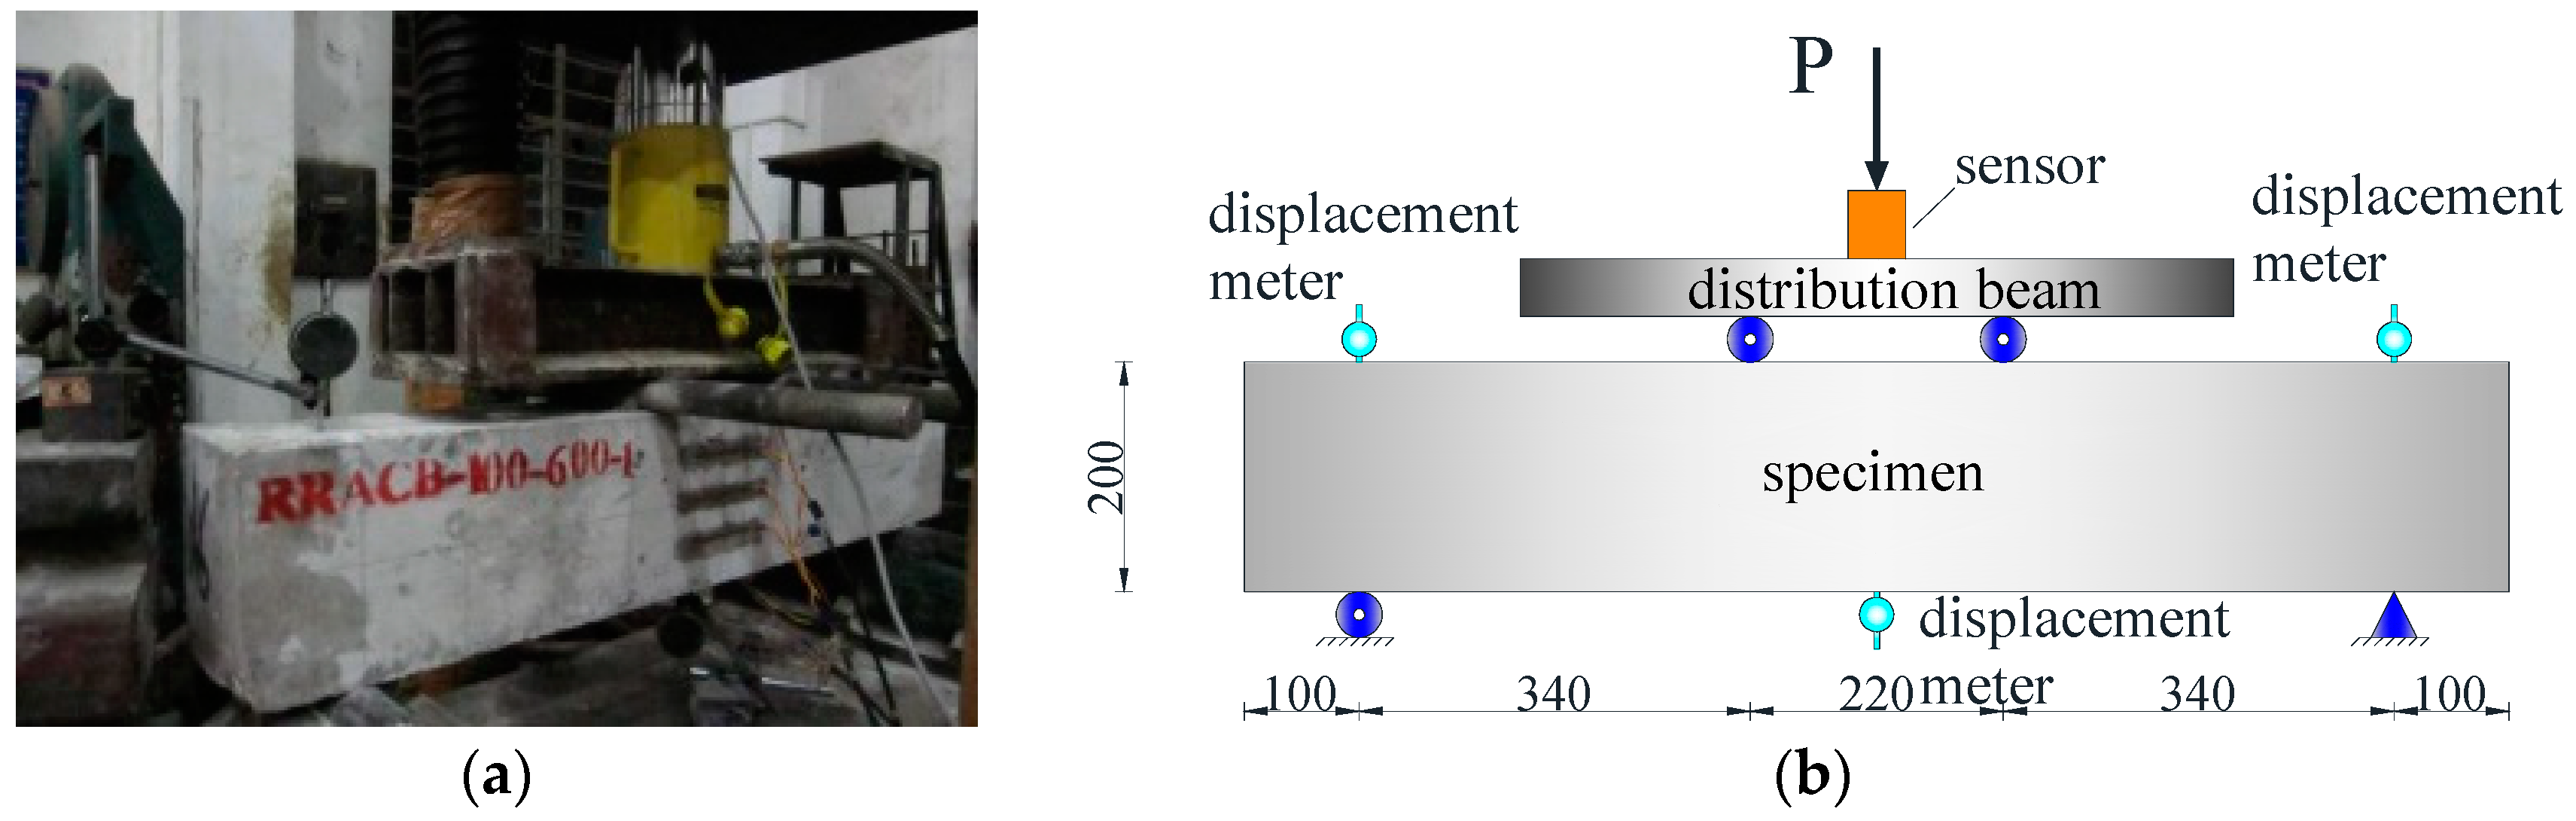
The beams adopt a hybrid control loading system and use a distribution beam to perform two-point symmetric centralized loading. The load rising section adopts load control for grading loading, the step difference is 5 kN, and the holding time of each stage is 3 min. When the estimated ultimate load is approached, it is changed to displacement control with a step difference of 0.5 mm, which is loaded to the specimen to be destroyed. The mid-span deflection of the specimen is measured by arranging the displacement meter, and the loading device and the measuring point arrangement are as shown in Figure 5.
3. Test Results and Analysis
3.1. Change in Appearance
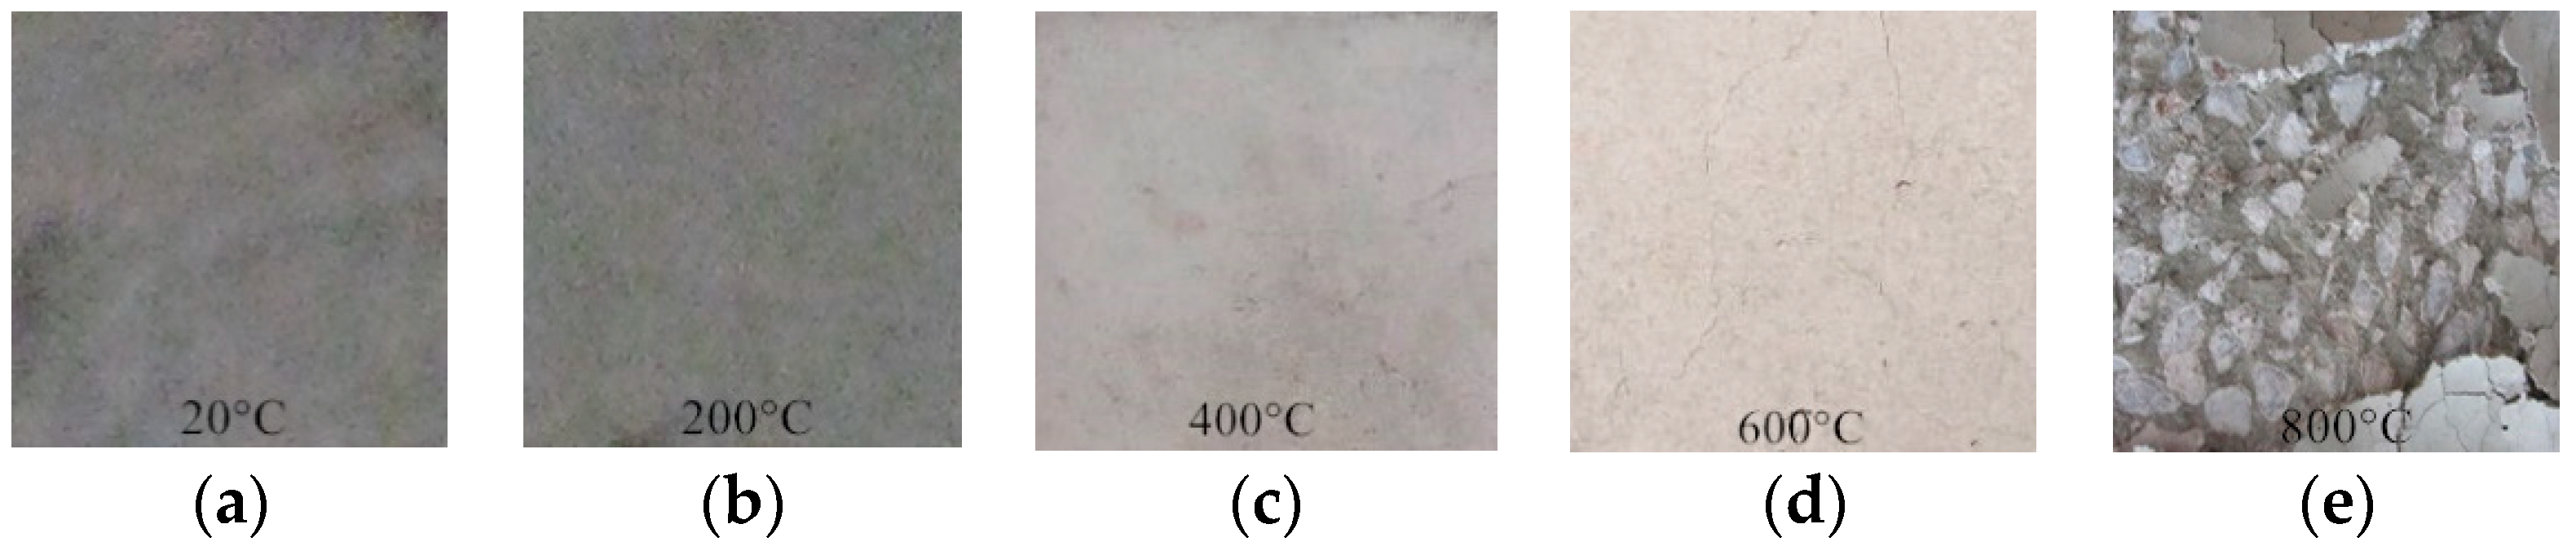
A series of physical and chemical reactions took place internally in the RAC after being subjected to high temperatures. All of prism blocks, beams, and columns showed color changing, concrete surface cracking, and spalling, and the physical phenomena of different types of specimens were basically similar. As the temperature increased, the color changed from deeper to shallow. For maximum temperatures of 200–400 °C, it was cinereous and had no visible cracks. When subjected to 600 °C, the specimens were brownish-grey and there were fine irregular cracks on the surface. When maximum temperature was 800 °C, specimens were gray-white, the surface burst, and the epidermis was loose and lumped off. The apparent morphology of prism specimens after exposure to high temperatures is shown in Figure 6.
3.2. Mass Loss
After specimens are subjected to high temperatures, its mass is reduced. In order to reflect this physical change, the mass loss ratio is defined, where is the original quality of the specimen, and is the mass of the specimen after exposure to high temperatures.
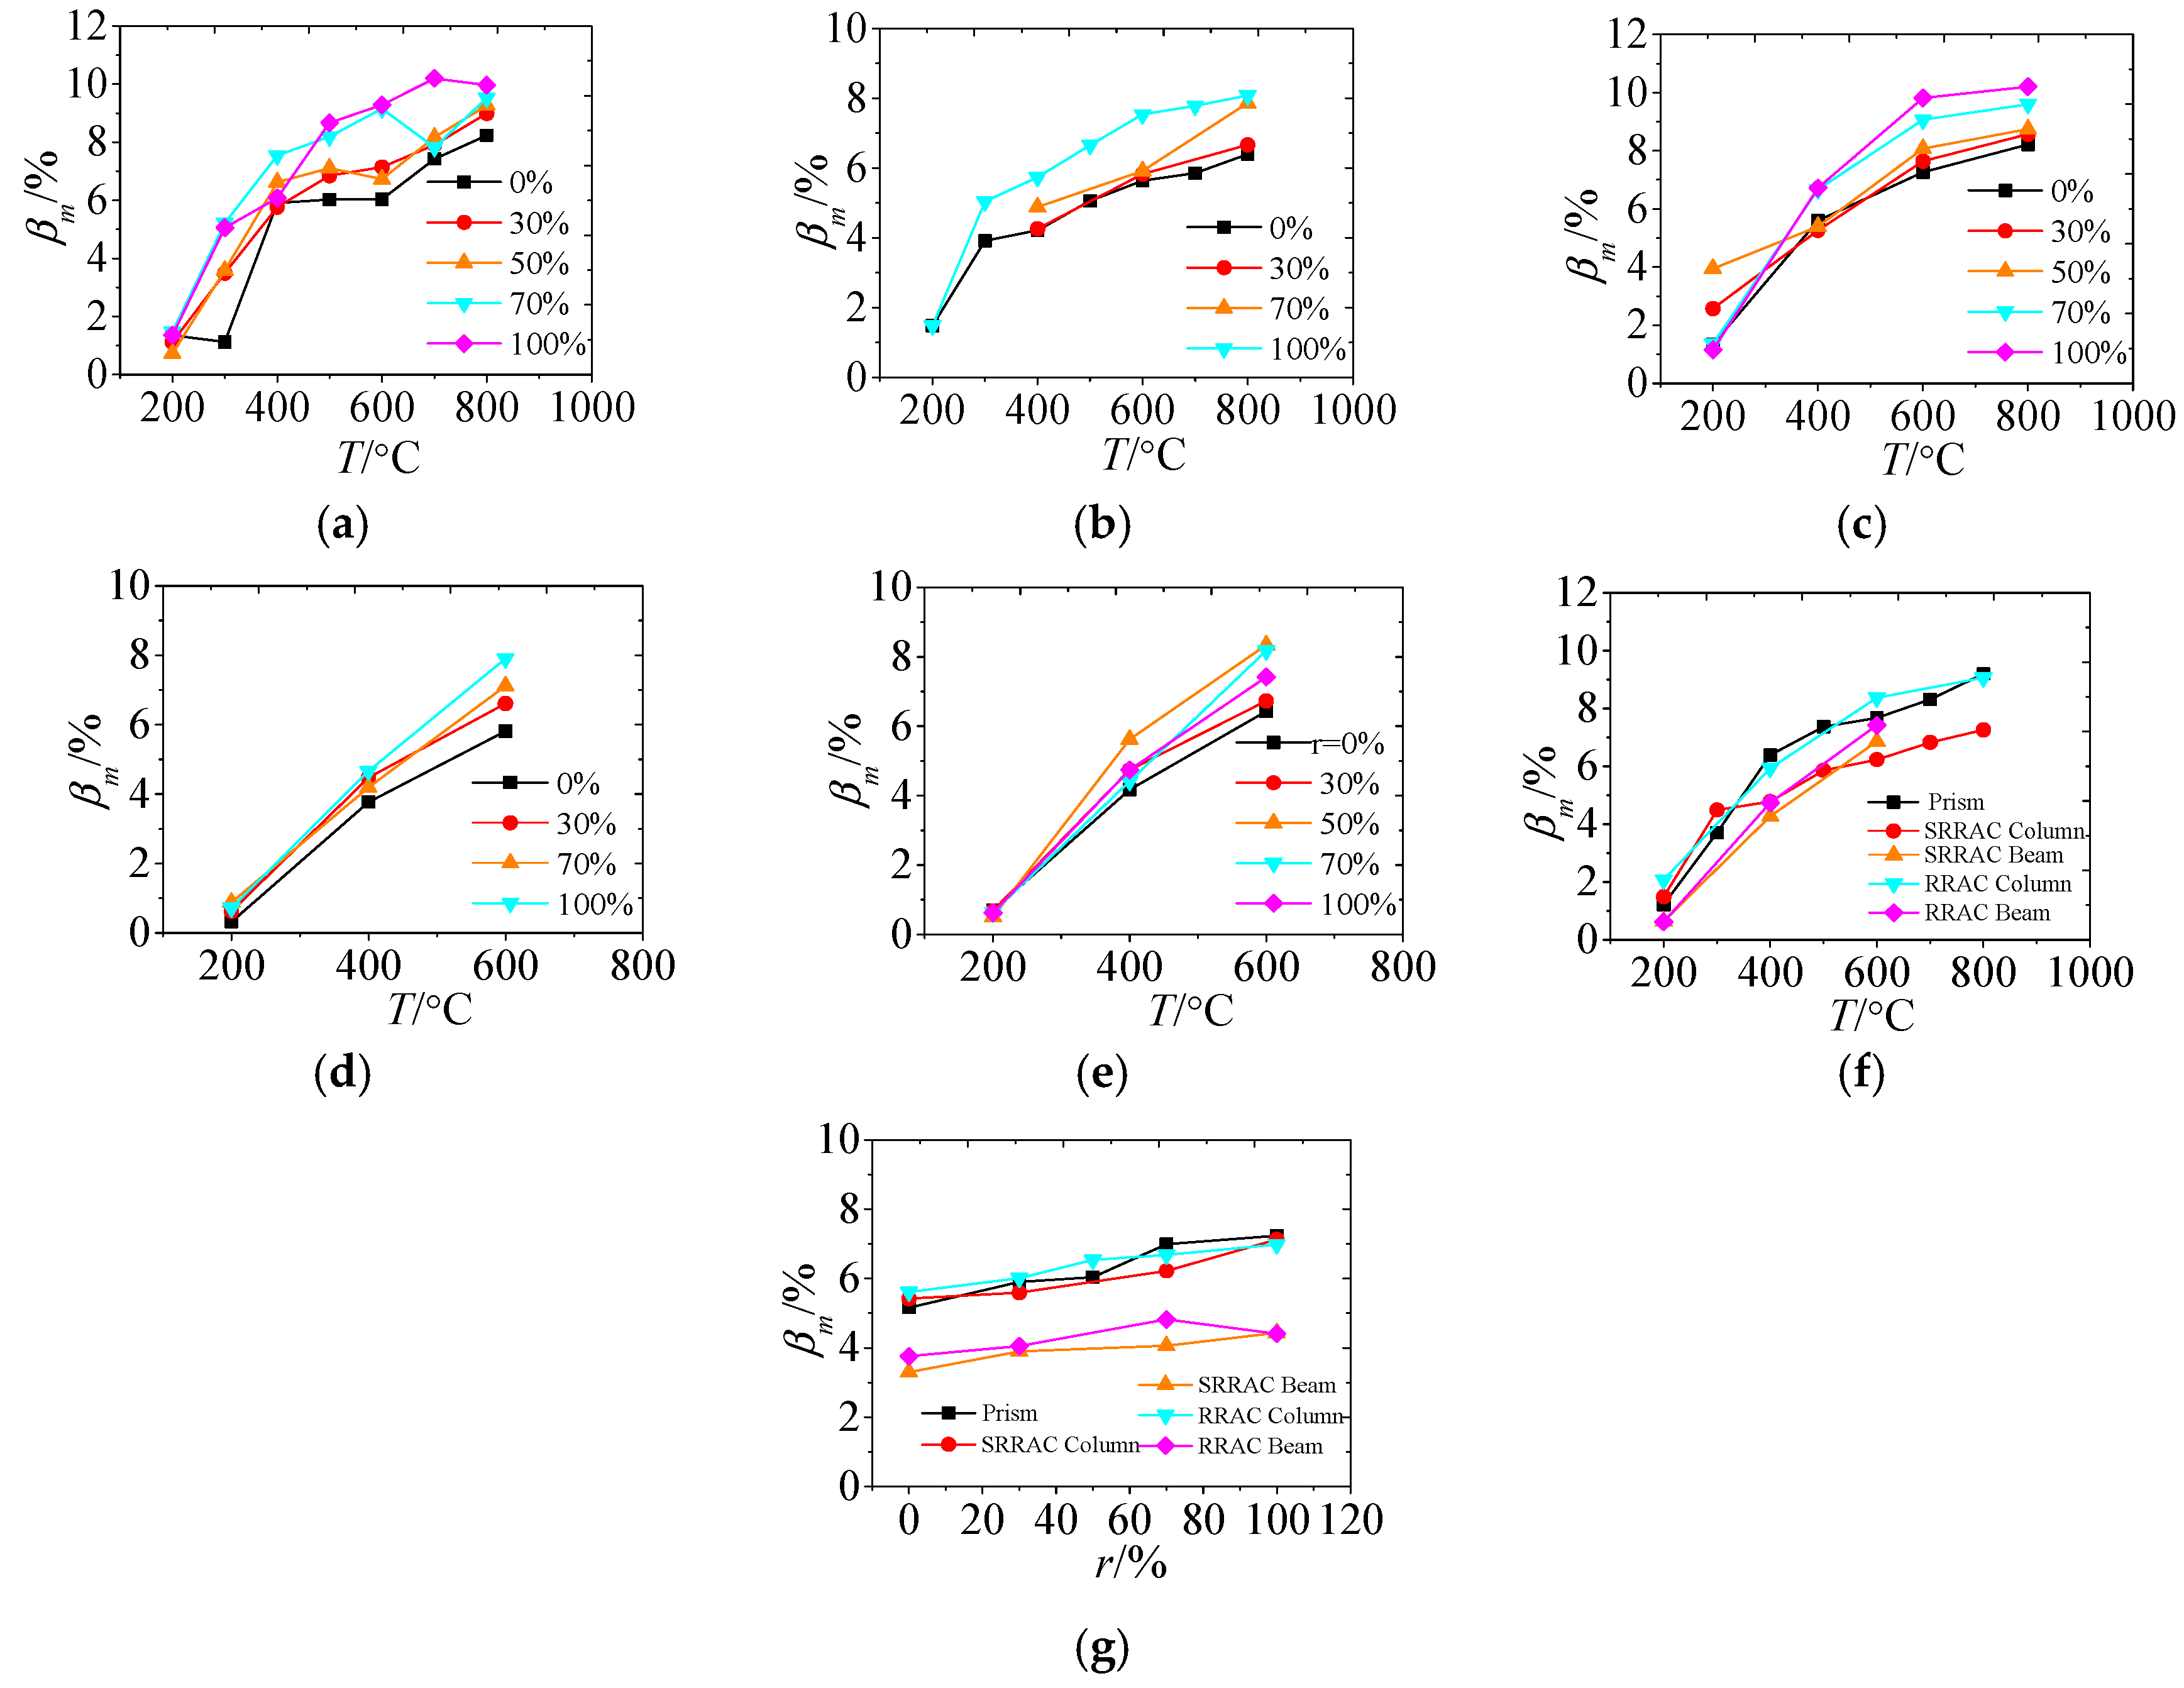
The trend of mass loss ratio of specimens with the temperature experienced is given in Figure 7. It can be observed in the figure that the mass loss ratio of specimens increases with the increase of temperature. For maximum temperatures of 200–400 °C, the value increases the fastest, the reason is that after the temperature reaches 200 °C, the moisture retained in the concrete evaporates and the most combustibles in the concrete burn as they reach the ignition point. During the high temperature action of specimens in the electric furnace, when the temperature rises to 200–400 °C, a large amount of white mist emerges from the electric furnace. This phenomenon reflects that the internal moisture of the RAC is most significantly evaporated in the range of 200–400 °C. When the temperature is larger than 600 °C, the growth rate of mass loss ratio of specimens slows down, indicating that after the temperature increases to a certain extent, the mass loss ratio of specimens tends to be stable due to the exhaustion of moisture and combustibles.
For each type of specimens, the mass loss ratio of all specimens subjected to the same temperature is averaged, and Figure 7f is drawn. It can be seen from the graph that the increase of mass loss ratio of prism specimens is the most significant, and that of beams is the smallest, which may be due to the smallest volume of prism specimens and the easiest influence of high temperature field. The data in Figure 7g has averaged the mass loss ratio of all specimens under the same replacement percentage. It can be seen from the figure that the mass loss ratio increases with the increase of the replacement percentage. This is explained by the large amount of old cement slurry is attached to the surface of the RCA, and more free water can be absorbed during the mixing process. The more the RCA is contained, the more free water absorbs in the RAC, the more water will evaporate after exposure to high temperature, and the mass loss ratio will be greater.
Comparing with SRRAC members, it is found that the mass loss ratio of RRAC members varies roughly the same with the increase of temperature. but the mass loss ratio of RRAC members is slightly larger than that of SRRAC members, which may be due to the fact that SRRAC members are equipped with more steel (the mass of steel is almost unchanged after high temperatures).
3.3. Analysis of Measured Curves
3.3.1. Stress-Strain Curves of RAC Prism Specimens
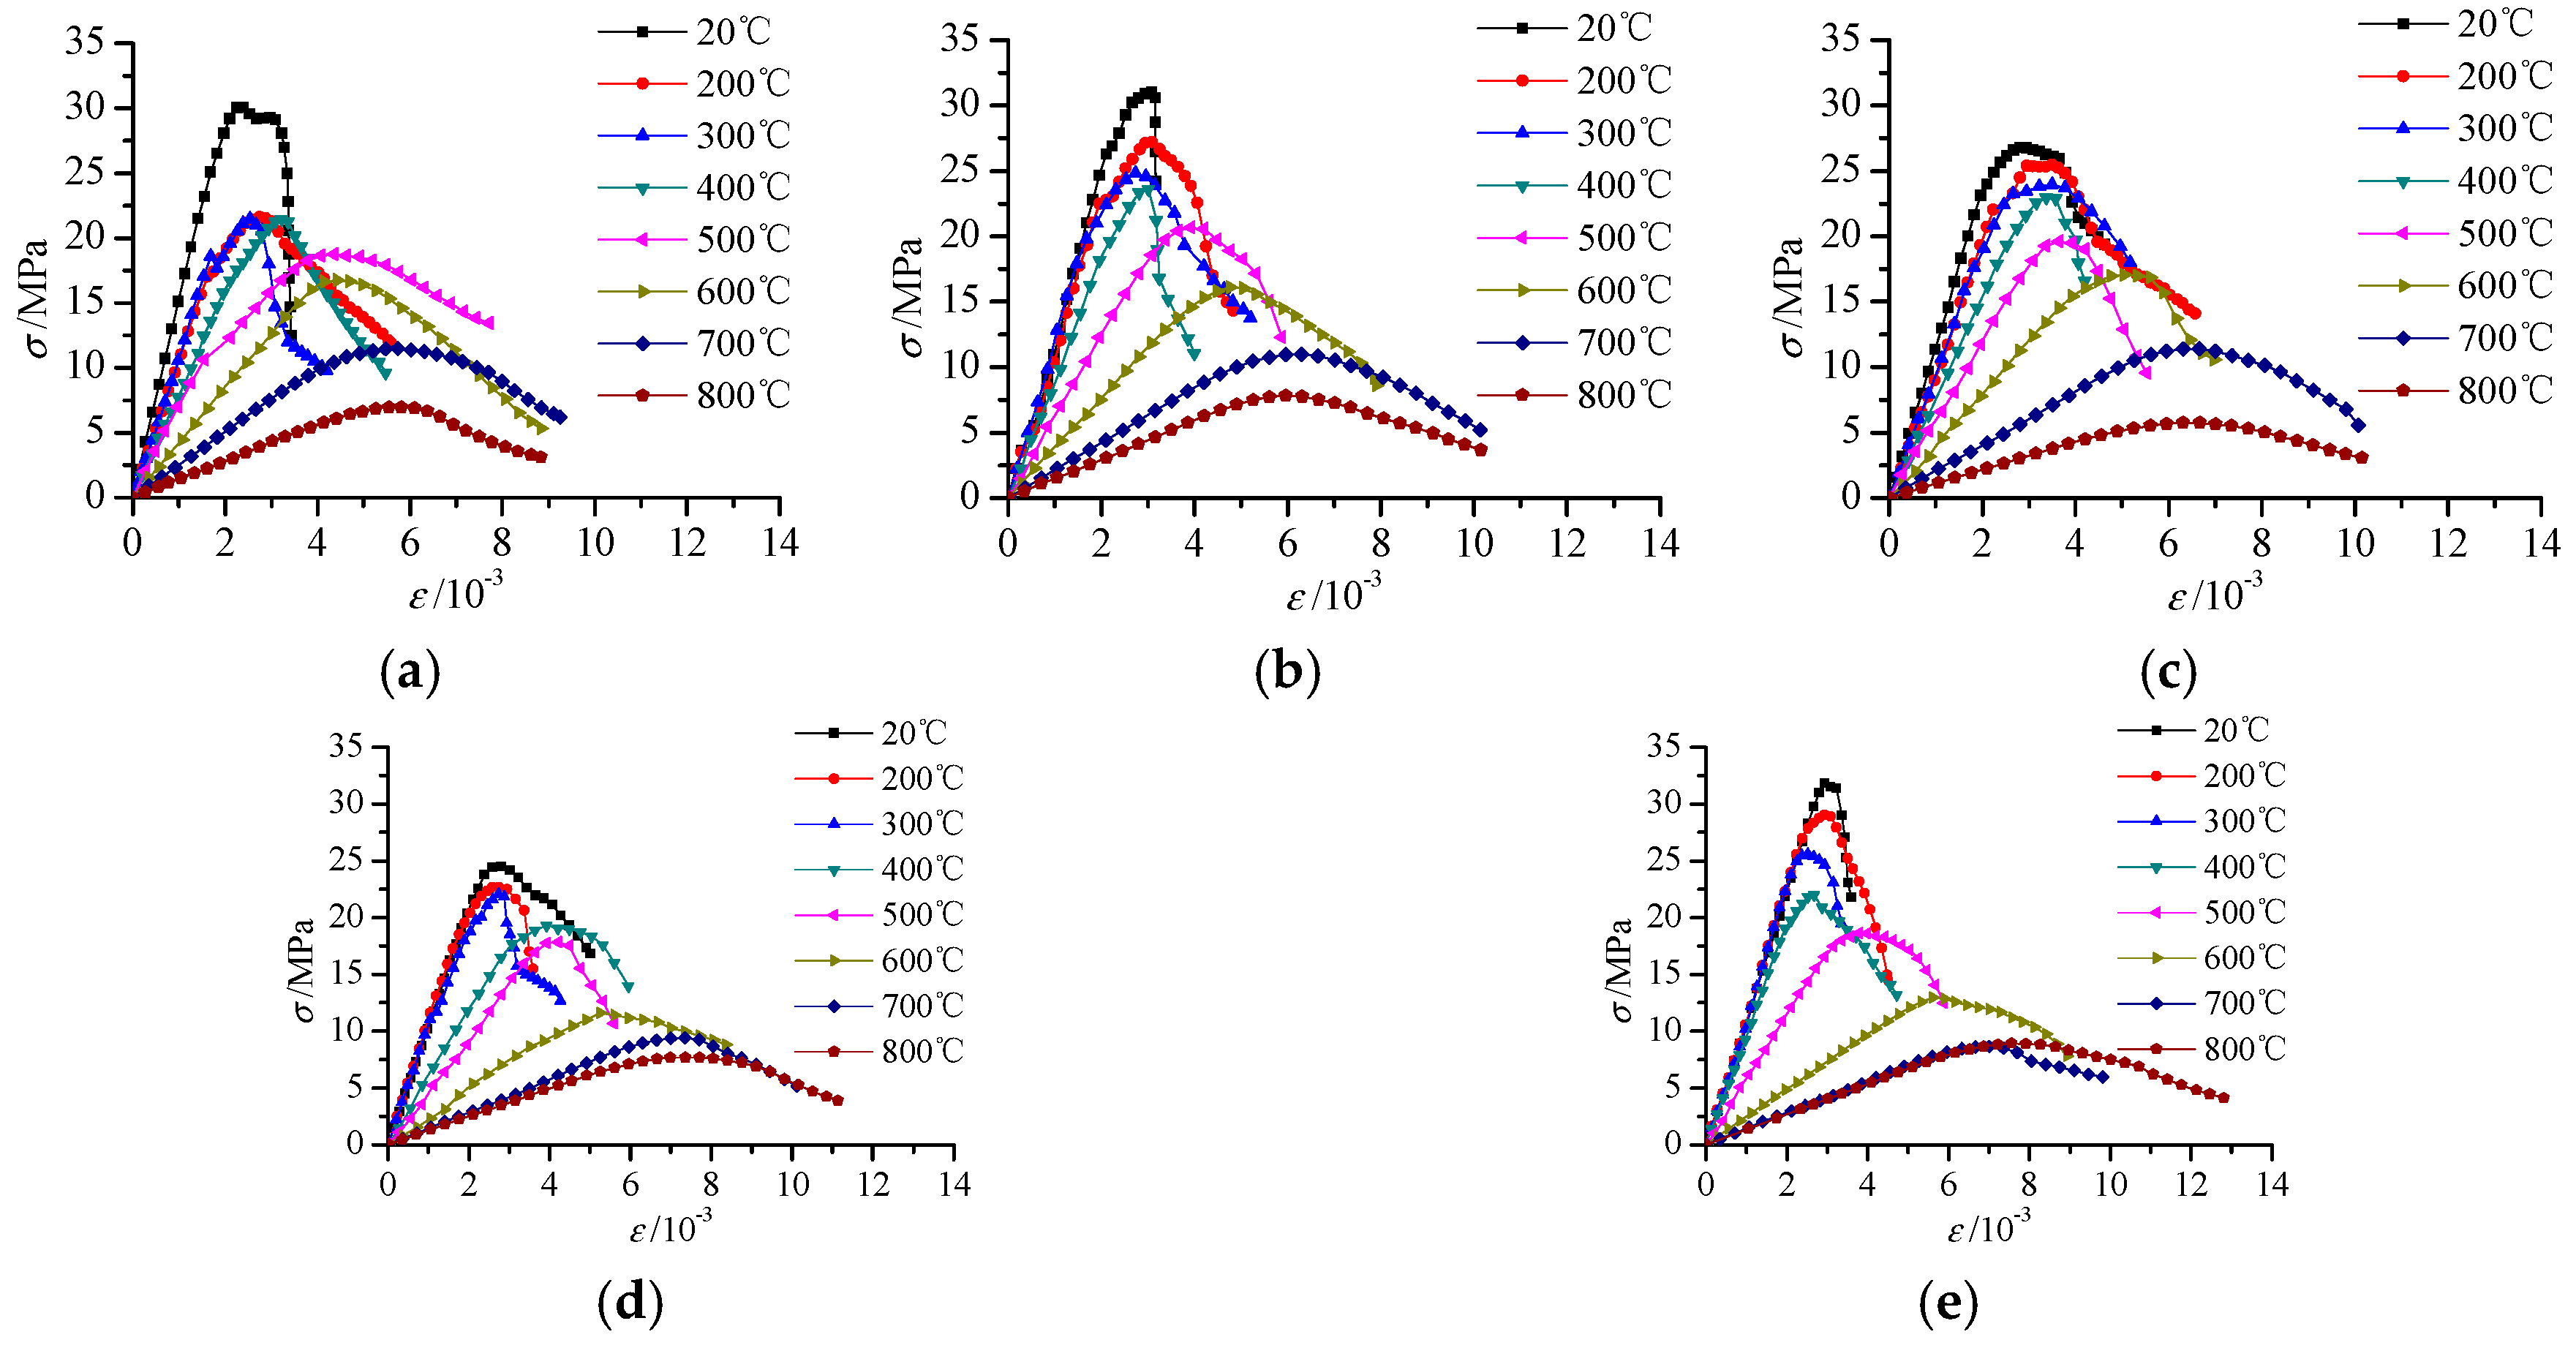
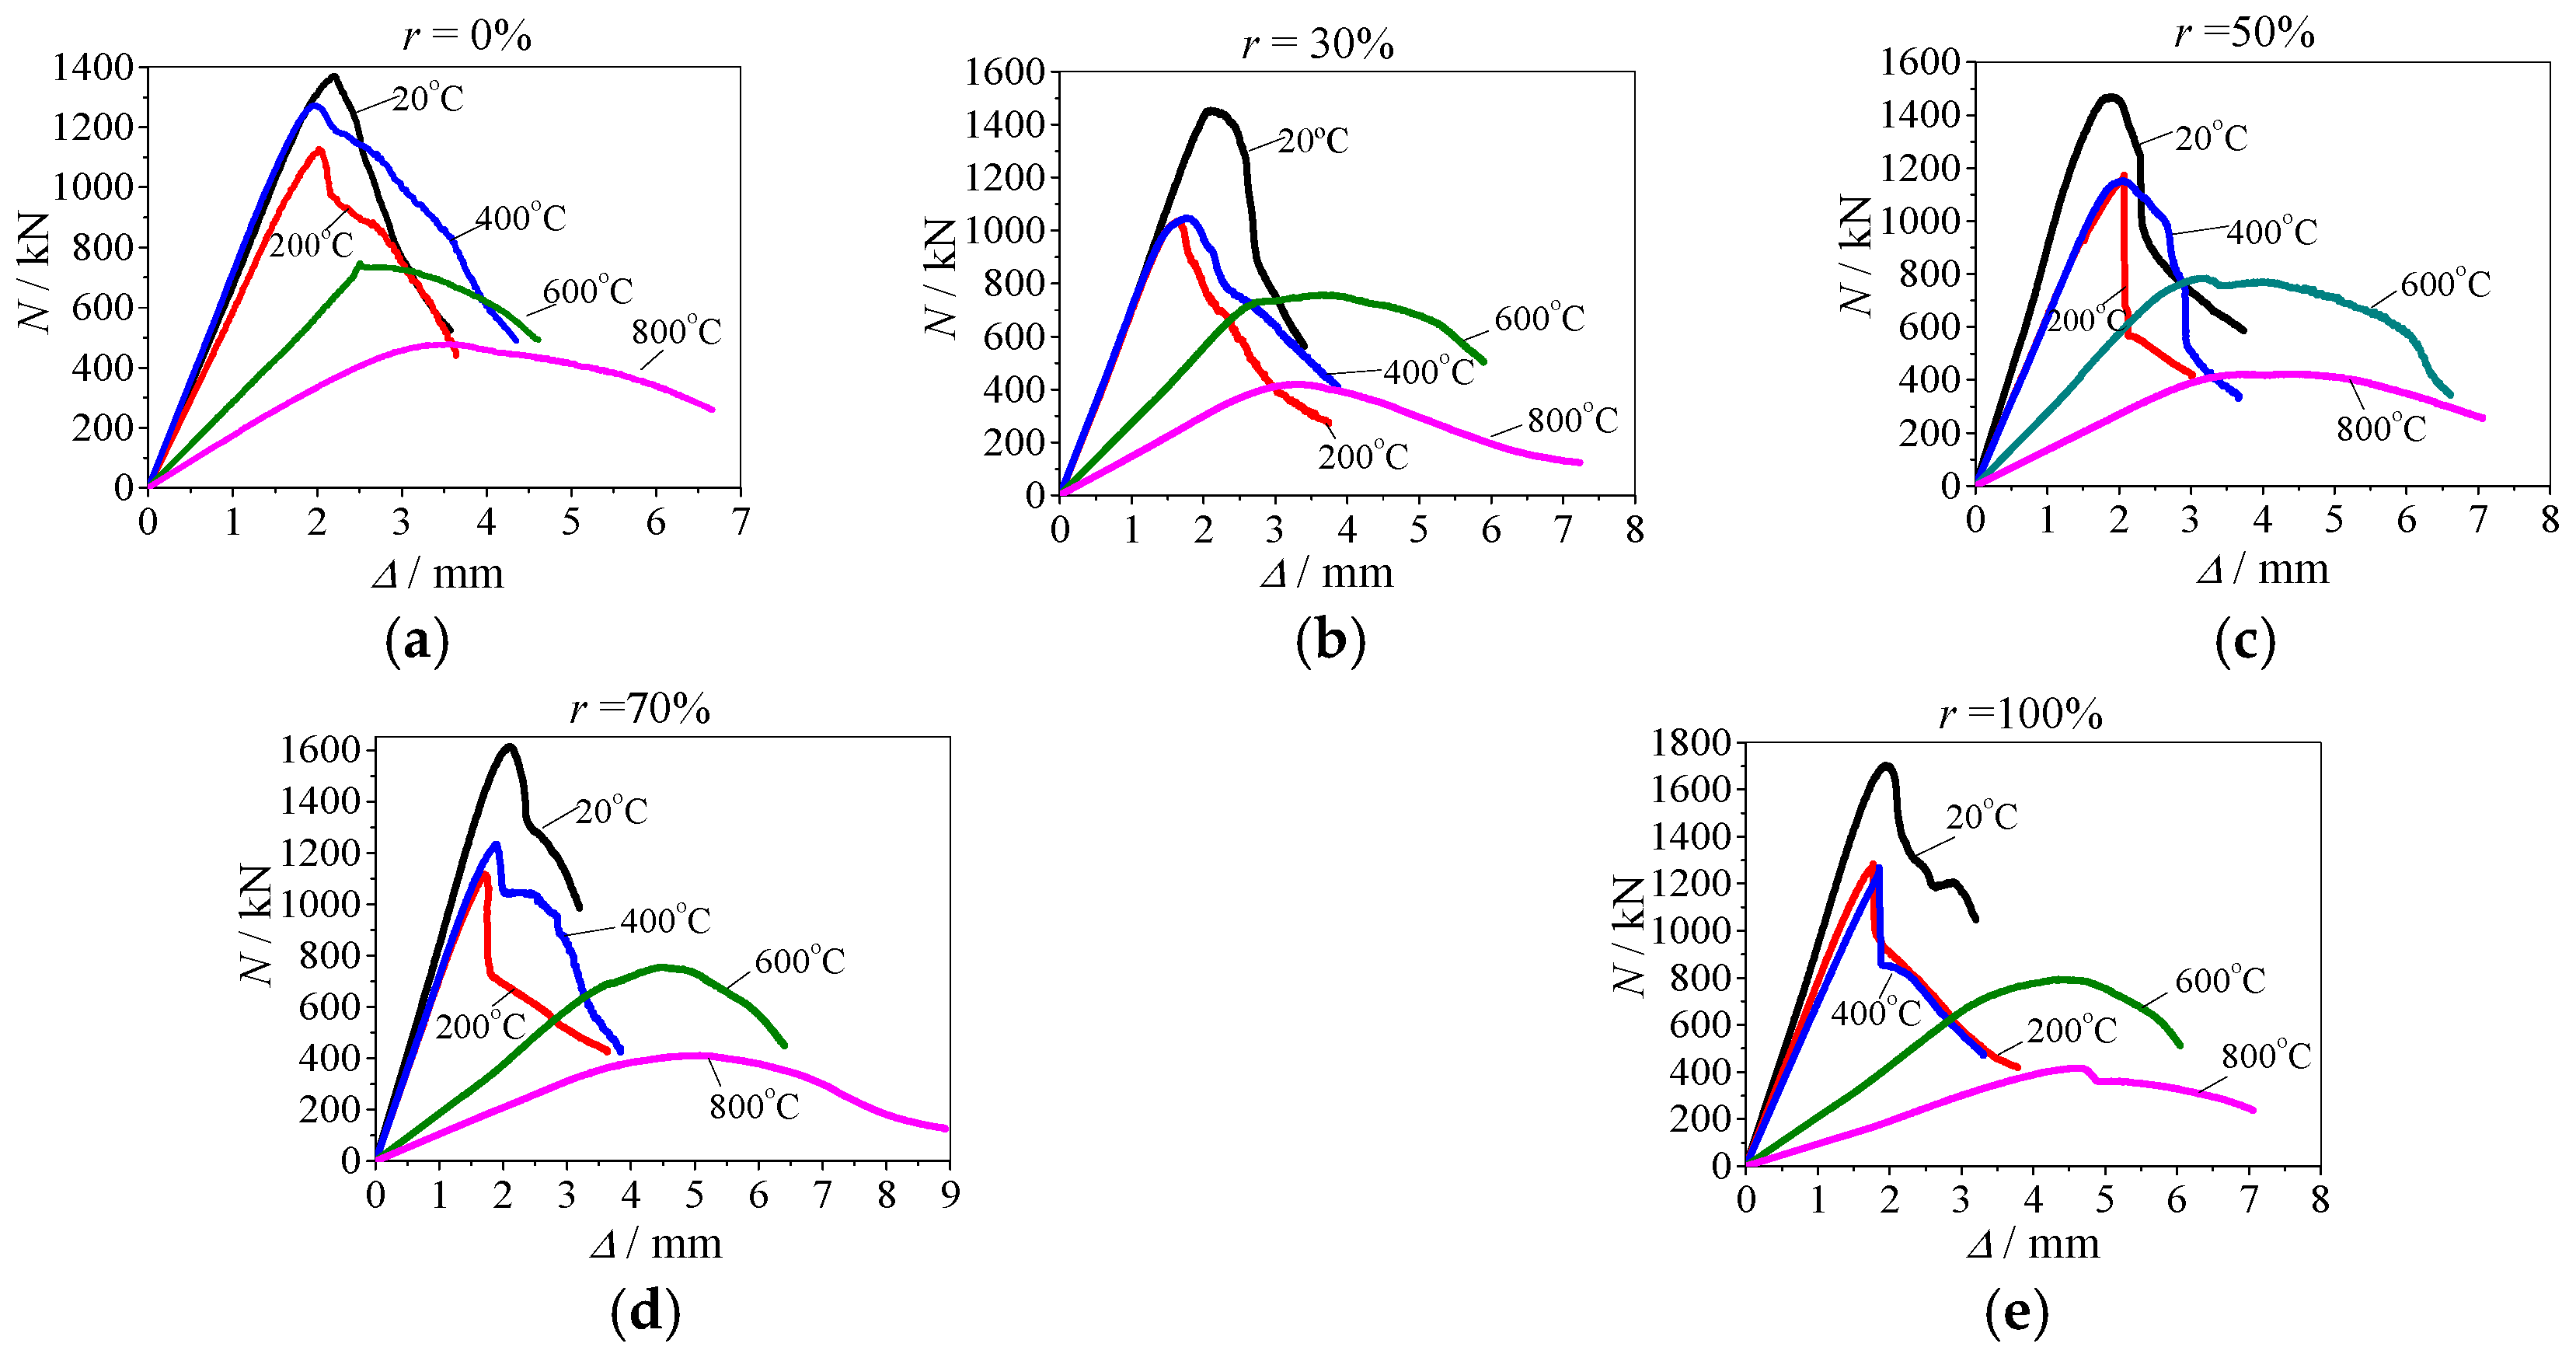
According to the load-displacement curve measured by the test, the stress-strain curve of the RAC prism specimens subjected to high temperatures can be obtained, as shown in Figure 8. It can be seen from the figure that the shape of the stress-strain curves of the RAC subjected to elevated temperature is similar to that of ordinary concrete. As the temperature increases, the peak stress of the curves gradually decreases, the peak strain gradually increases, the descending section of the curves becomes gentle, and the whole curve tends to be flat. As the replacement percentage increases, the effect of temperature on peak strain becomes more and more significant: at room temperature, the peak strain of ordinary concrete and RAC is between 4 × 10⁻³ and 5 × 10⁻³. At 800 °C, the peak strain of ordinary concrete is 7.39 × 10⁻³, the replacement percentage is 30%, 50%, 70% of RAC is 8.78 × 10⁻³, 9.21 × 10⁻³ and 10.74 × 10⁻³ respectively, while the peak strain of RAC with the replacement percentage of 100% is 11.55 × 10⁻³.
3.3.2. Load-Displacement Curves of SRRAC Columns
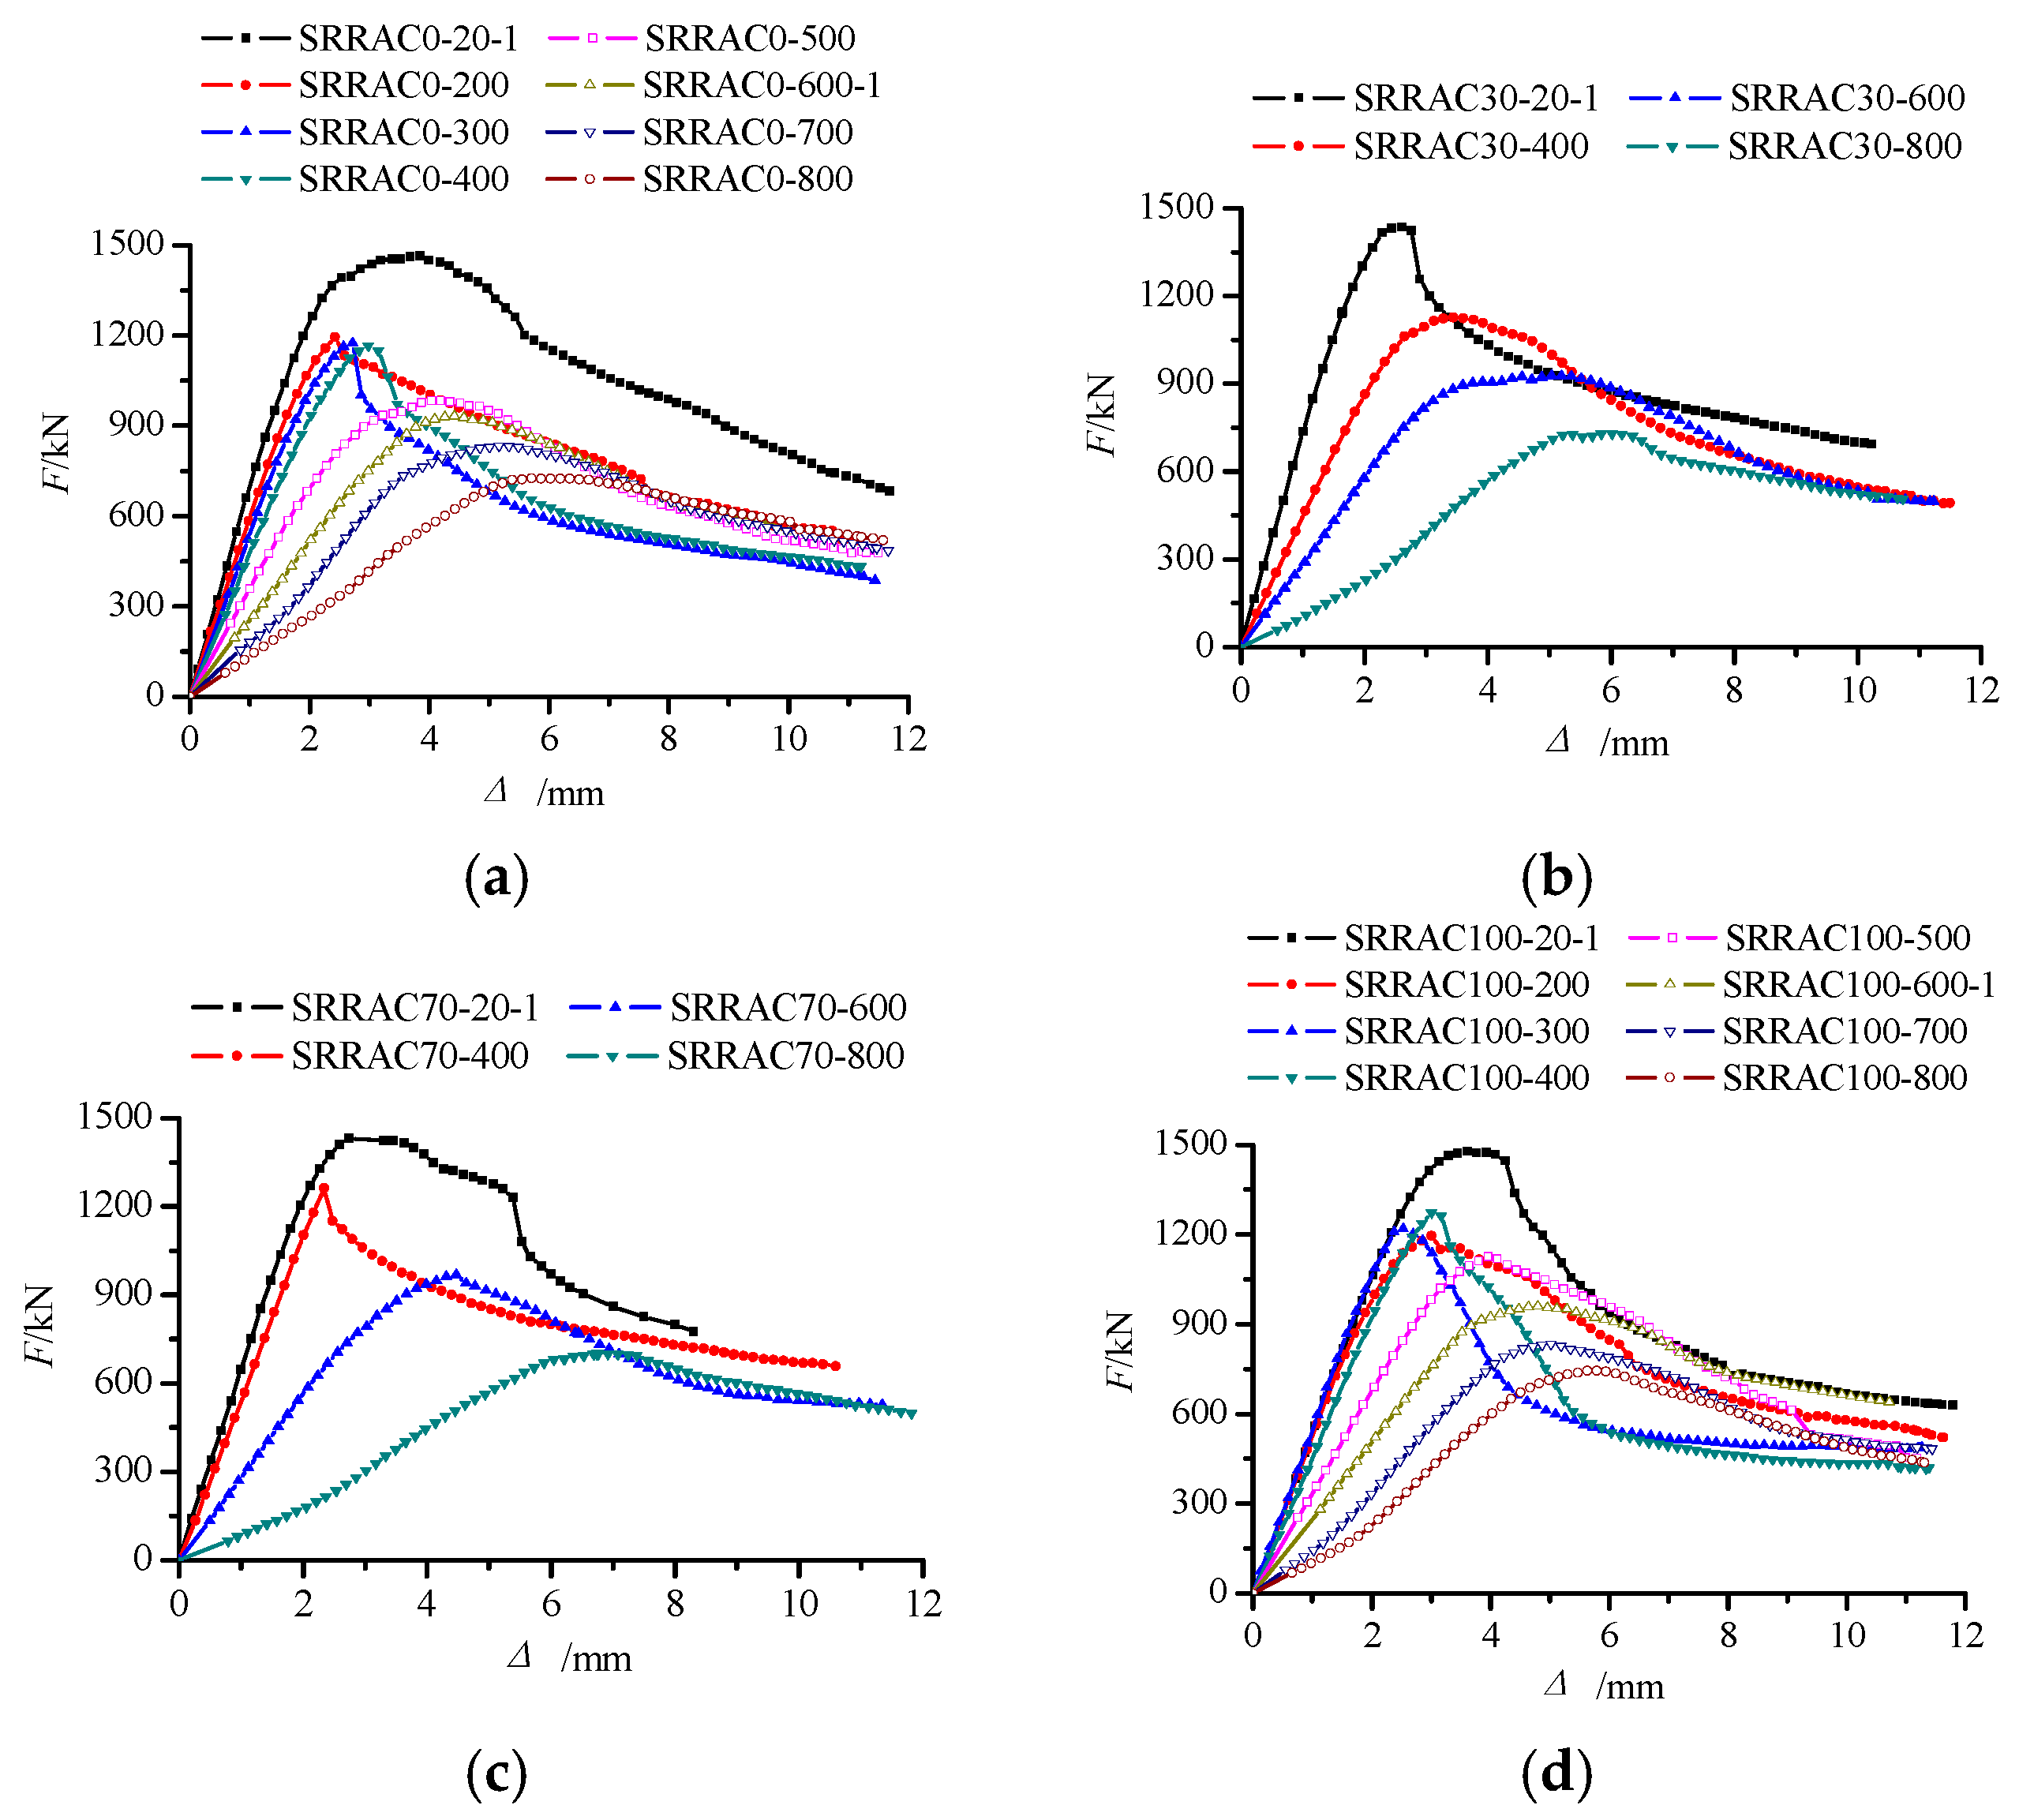
From Figure 9, it can be seen that with the increase of temperature, the load-displacement curve of SRRAC columns tends to be flat, and the peak point gradually decreases and shifts to the right. Loading process of some specimens includes elastic stage, stiffness strengthening stage, elastic-plastic stage, descending stage, and residual stage. The characteristics of each stage are as follows:
- (1)
- Elastic stage: Both the section steel and the concrete are in the elastic deformation range, and the deformation of the two is coordinated, and no crack is generated on the concrete surface.
- (2)
- Elastic-plastic stage: After the load exceeds the elastic limit, due to the occurrence and continuous development of cracks on the concrete surface, the section steel and the longitudinal steel bar gradually yield, and the load-displacement changes nonlinearly. At this stage, the bond crack begins to appear, that is, the bond and slip of the steel and concrete are more obvious.
- (3)
- Stiffness strengthening section: For specimens with a temperature greater than 600 °C, the load-displacement curves of specimens will show a significant increase in curvature before the elastic limit is reached, that is, the stiffness strengthening stage. This is because after the higher temperature, the free water in the internal void of the concrete evaporates, making the concrete loose. During the loading process, as the load increases, the loose concrete is gradually compacted, thus the stiffness of the specimens is improved.
- (4)
- Descending section: After the limit point is exceeded, the bearing capacity of the specimens is obviously reduced due to the gradual withdrawal of the protective layer concrete. The decreasing extent is related to the temperature. The higher the temperature is, the smaller the decreasing amplitude is.
- (5)
- Residual stage: After entering this stage, with the increase of displacement, the decrease of load tends to be gentle, the concrete at longitudinal reinforcement and protective layer has basically withdrawn from work, and the residual strength is provided by section steel and concrete in core area.
3.3.3. Load-Displacement Curves of RRAC Columns
The axial load-displacement curves of the specimens during the whole process of mechanical failure are obtained, as shown in Figure 10. It can be seen from the figure that the load-displacement curves of the specimens change with the increase of temperature, the higher the temperature is, the smaller the peak load will be, but the peak displacement increases, and the descending segment after the peak point tends to be gentle. In addition, when the temperature is higher, the initial secant slope of the curve is smaller.
3.3.4. Load-Deflection Curves of SRRAC Beams
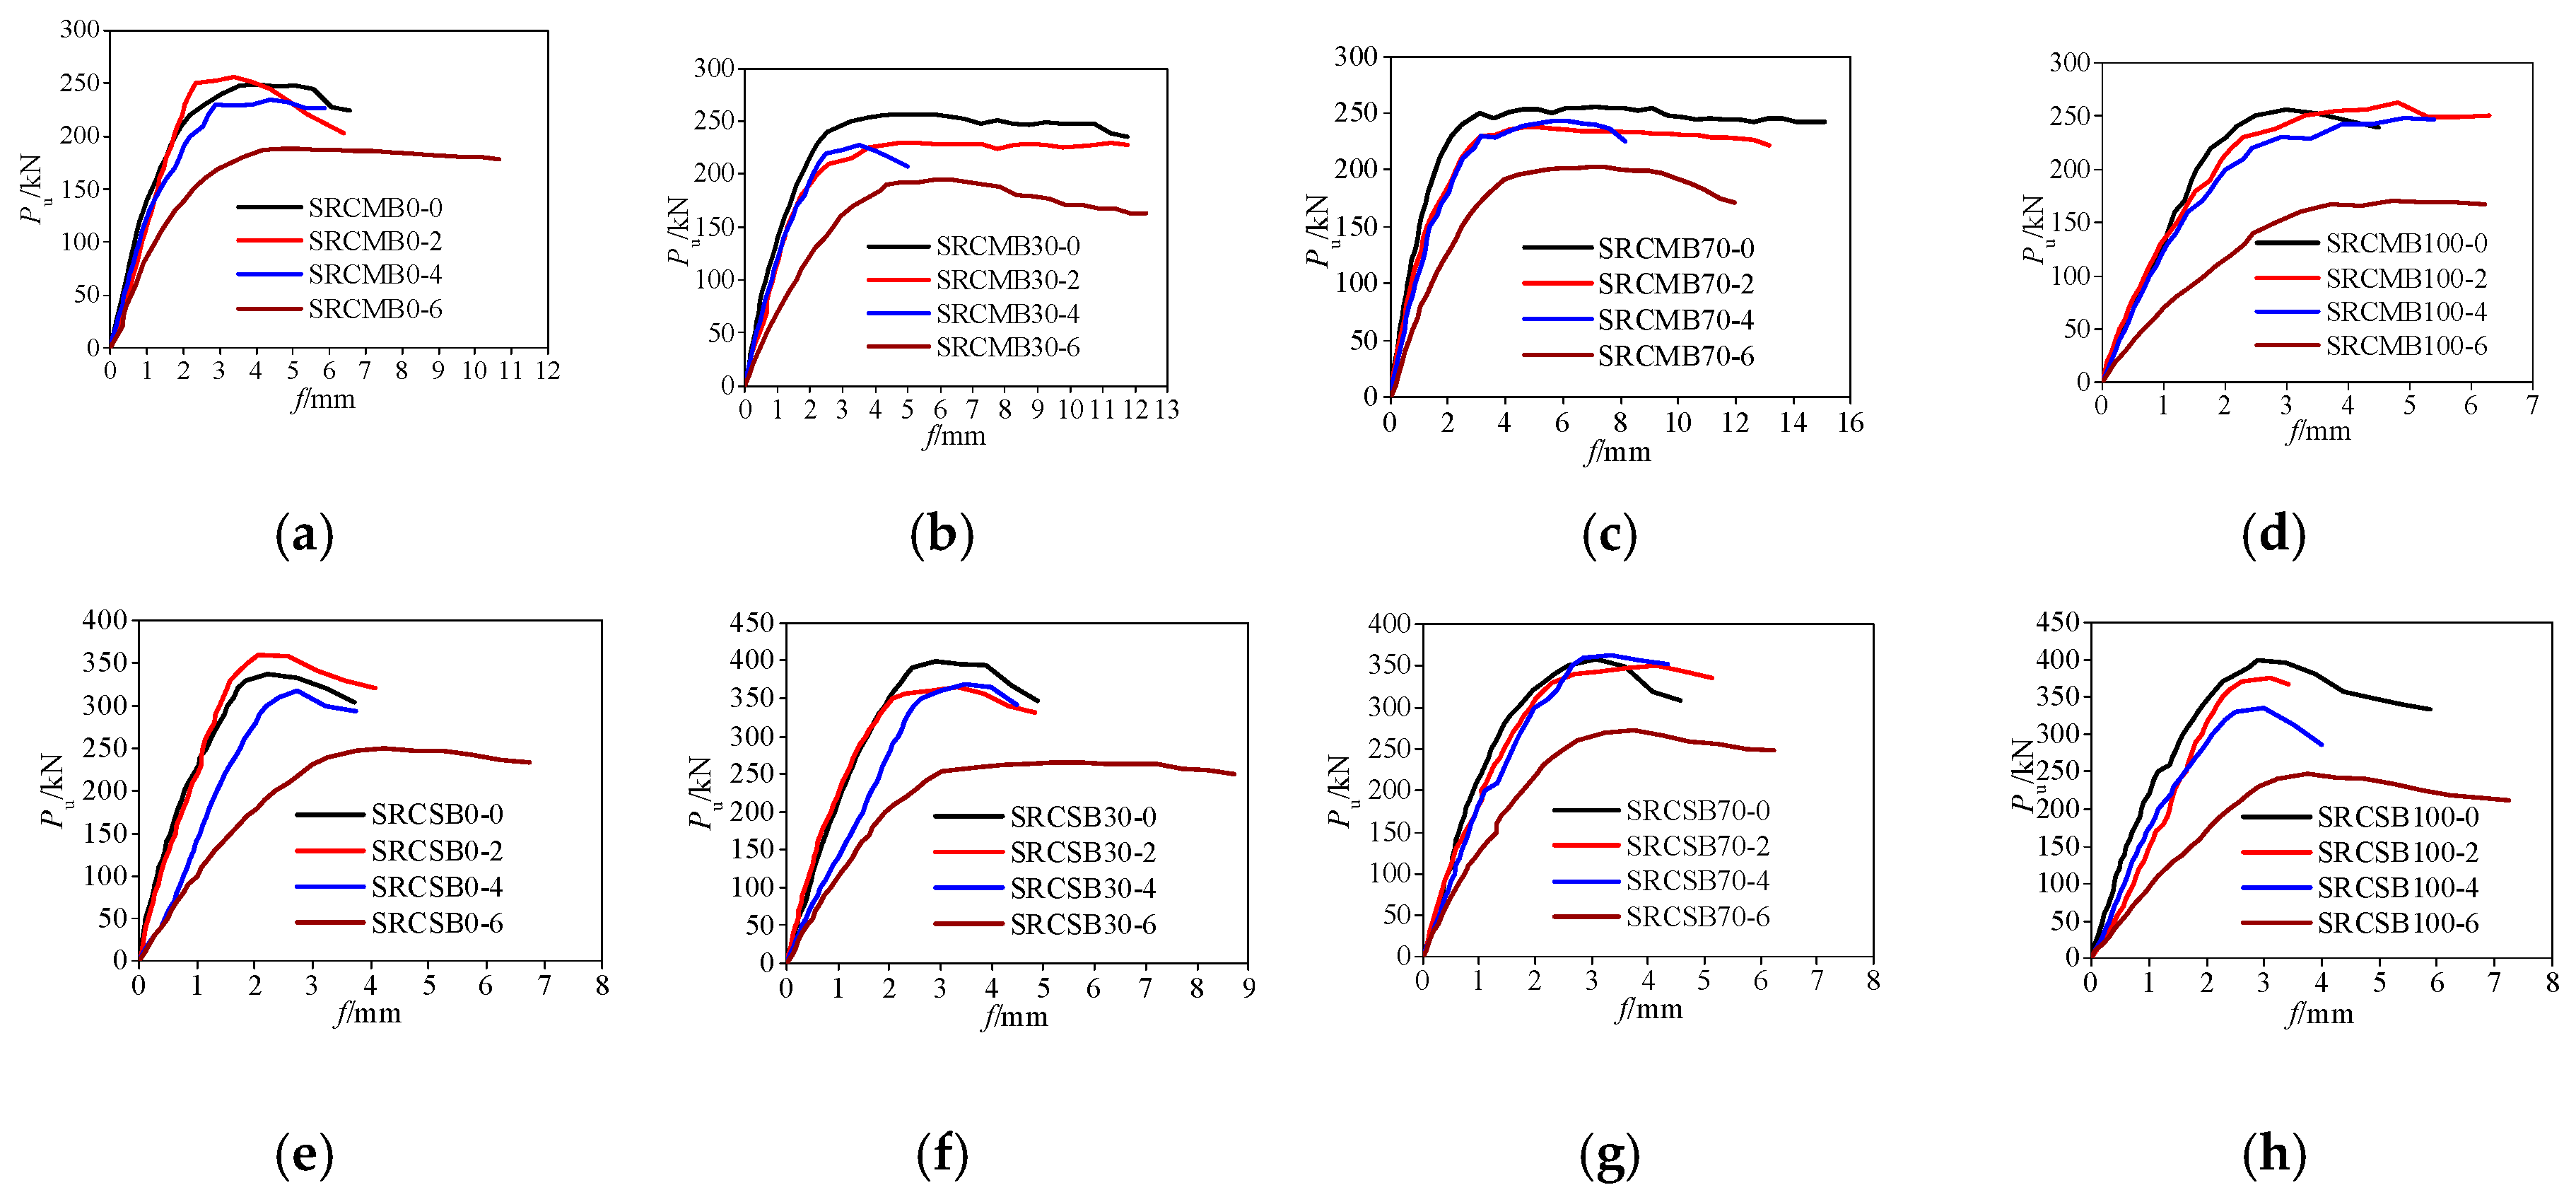
Figure 11 shows the measured load-deflection (P-f) curves of the specimens in mid-span. It can be seen from the graph that the specimens have experienced three stages: elastic stage, elastic-plastic stage, and failure stage. The initial loading stage is elastic, the elastic-plastic is after the cracking, the P-f curve shows a turning point, and after the peak load point, it is the breaking stage.
3.3.5. Load-Deflection Curve of RRAC Beams
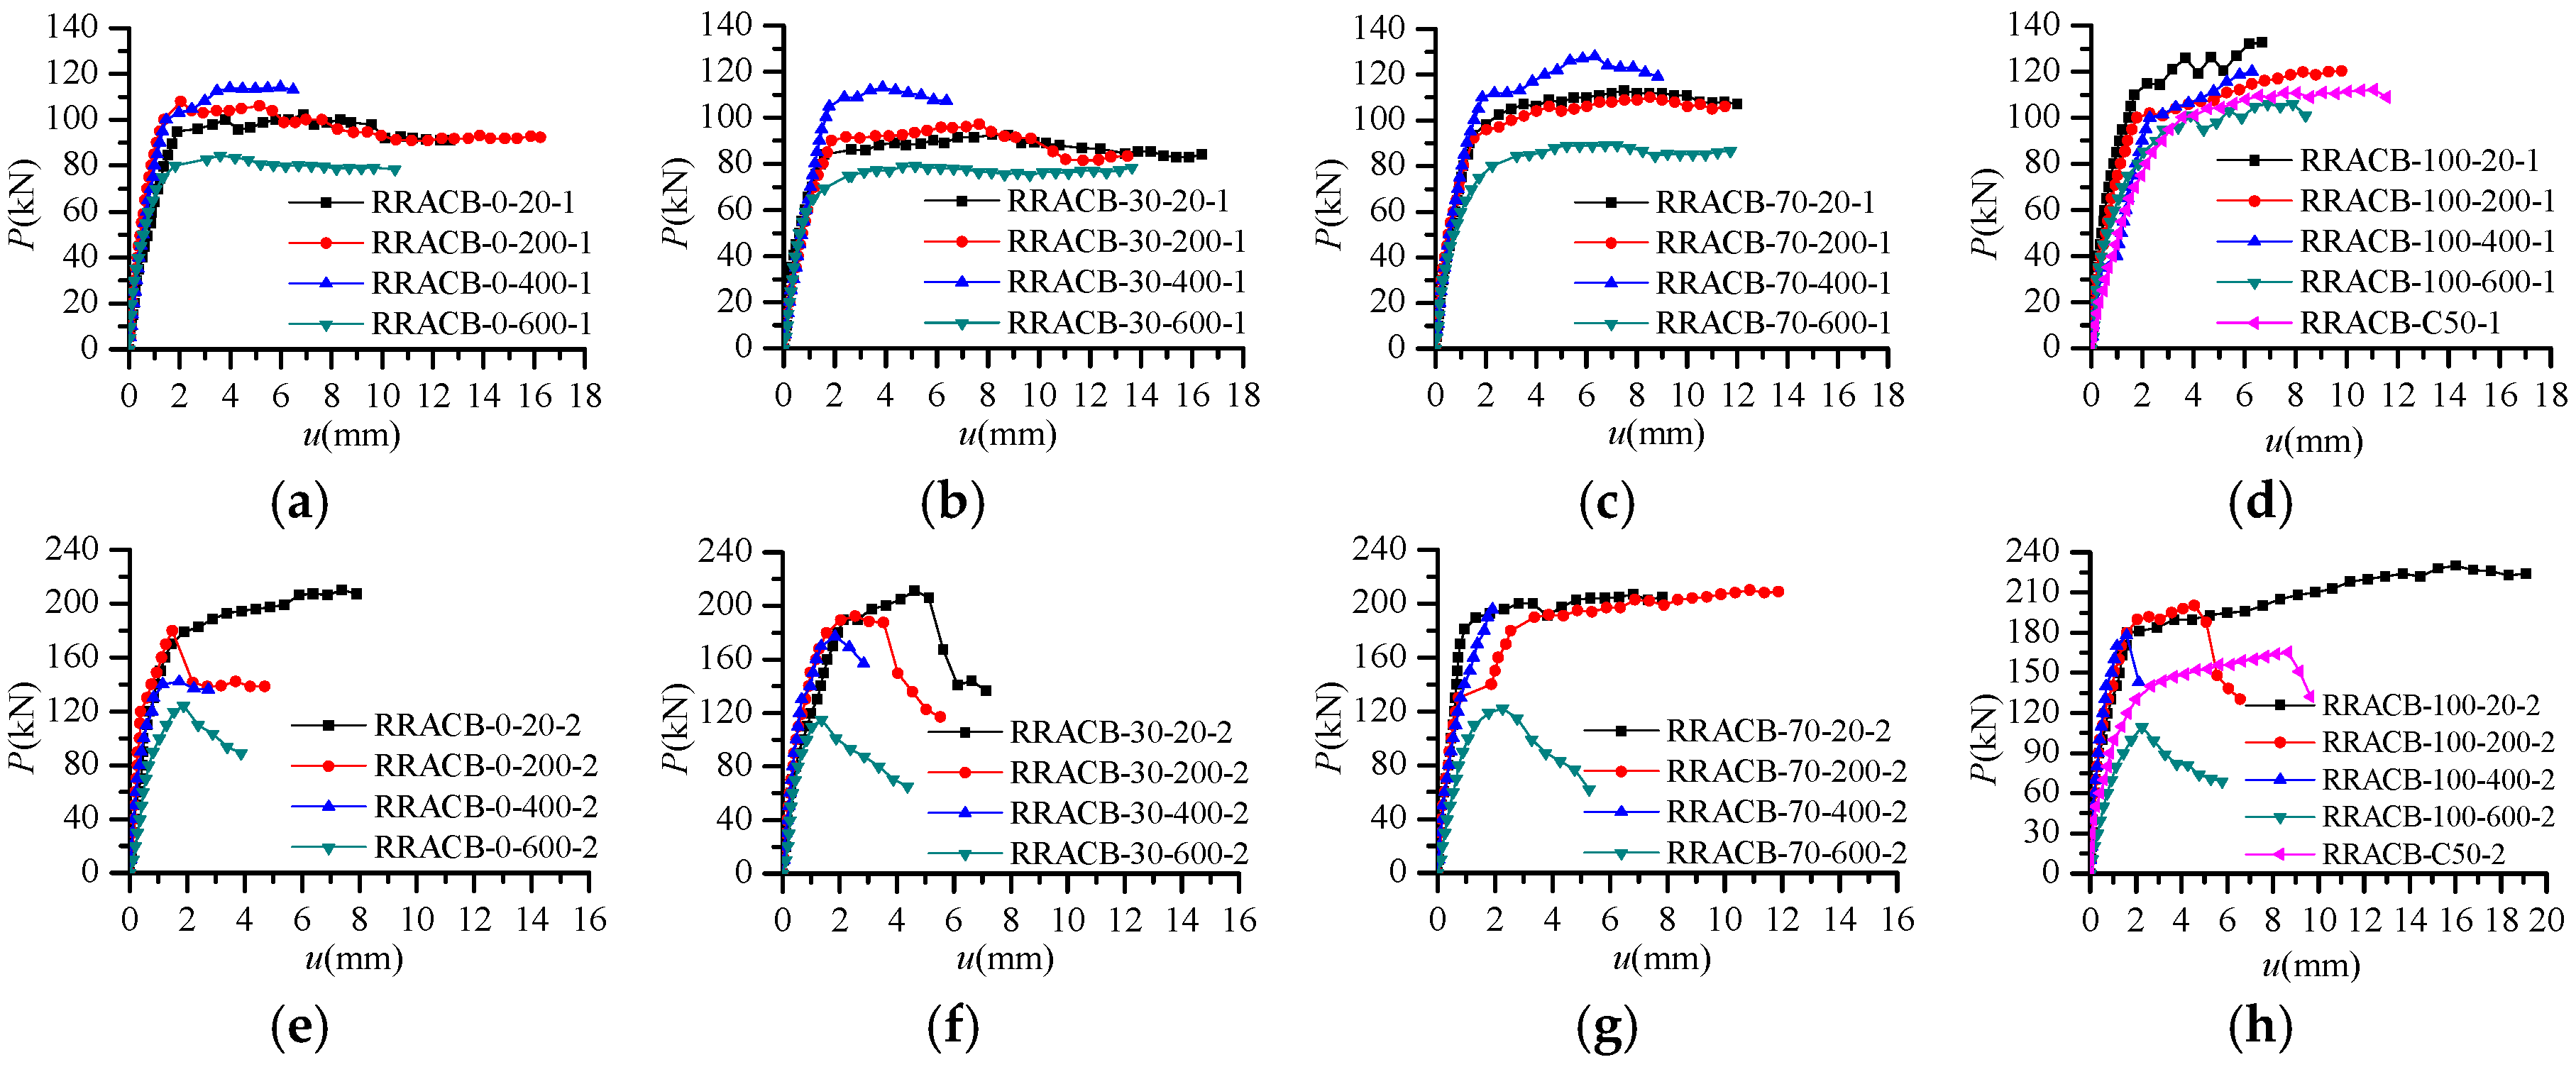
Figure 12 shows the measured load-mid-span deflection curve for each specimen. From the graph, it can be seen that the load-deflection linearly develops at this stage from the start of loading to the concrete cracking. After the crack occurs, the load-deflection curve begins to shift to the deflection side, and the degree of this offset increases with the increase of the load, showing obvious nonlinear characteristics. When the peak load is reached, the specimens enter the failure stage and the curves begin to decrease. Comparing the whole process curves of two kinds of specimens with different shear span ratios, it is found that the specimens with a small shear span ratio have a higher peak load, but it has a faster drop.
3.4. Mechanical Properties
For the qualitative analysis of the degradation of the mechanical properties of RAC and Steel-RAC members after exposure to high temperatures, according to the axial load-displacement curves of prism specimens and short columns, the load-span deflection curves of bending and shear beams, the corresponding mechanical properties of various types of members, such as bearing capacity , peak deformation , displacement ductility coefficient , and energy dissipation coefficient are determined. The variation rules of various mechanical properties are shown in Table 2, Table 3, Table 4, Table 5 and Table 6 and Figure 13, Figure 14, Figure 15 and Figure 16. In order to compare and analyze the performance degradation of different members, the performance indexes of all specimens with different replacement percentage at the same temperature were averaged, and normalized according to performance indexes at room temperature. The degradation coefficients (, , , and ) were obtained. Similarly, the replacement percentage influence coefficients (, , and ) of each performance are defined based on the performance index of the replacement percentage of 0%.
3.4.1. Degradation of Bearing Capacity
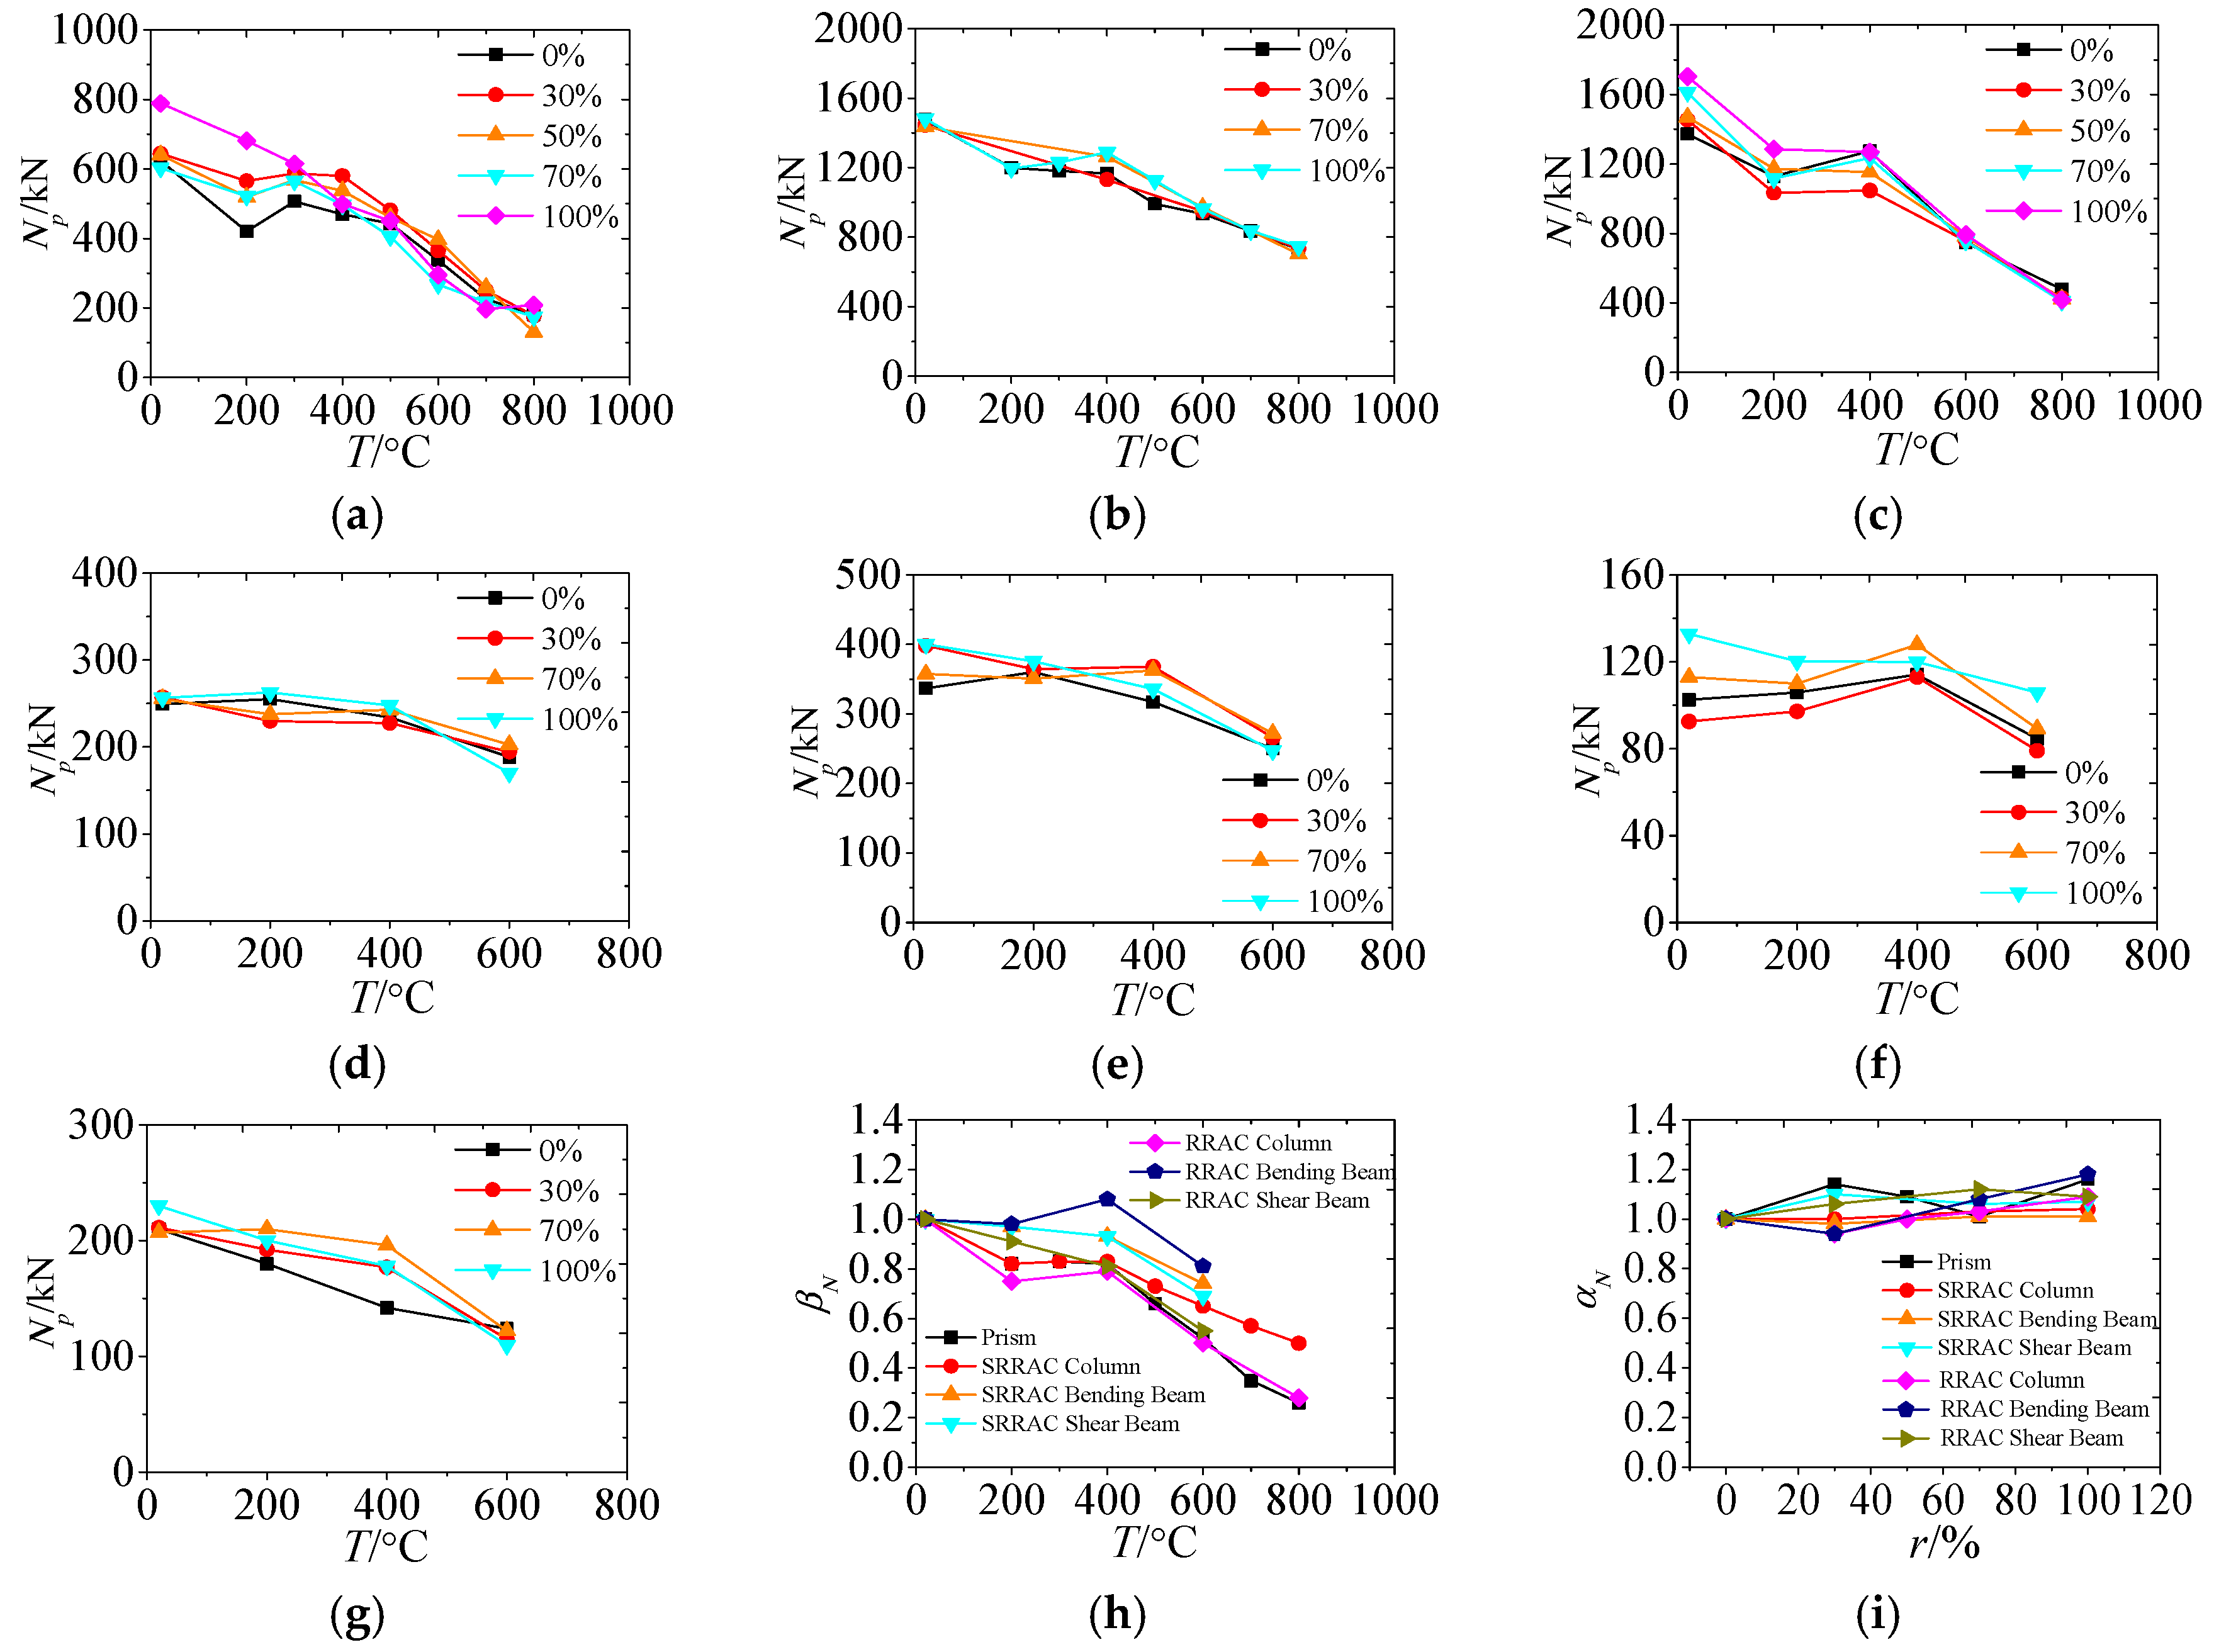
Figure 13 shows the degradation of bearing capacity of each specimen after exposure to different high temperatures. It can be seen from Figure 13a–g that with the increase of high temperatures, the compressive strength of prism specimens shows a significant downward trend. For maximum temperatures of 200–400 °C, the compressive strength of prism specimens decreases by about 18%, that decreases by about 48% when the maximum temperature is 600 °C and the compressive strength is only 26% at normal temperature when the maximum temperature is 800 °C. The strength of prism specimens can directly reflect the material strength of the RCA. The degradation of the compressive strength of the RCA after exposure to elevated temperatures can be attributed to the fact that after the high temperature, the evaporation of free water and bound water in the concrete form the internal interface crack. The cement stone structure is damaged, and the thermal properties of the coarse aggregate and concrete are inconsistent. The micro-deformation caused by thermal expansion and syneresis is uncoordinated, resulting in the continuous development of interfacial cracks. In addition, due to the rapid cooling of the concrete during the cooling process, the central temperature drops slowly, and a non-uniform temperature stress field is formed between the two to generate additional cracks. The higher the temperature experienced, the more significant the damage of these cracks is, and the greater reduction of strength is. It can be observed in Figure 13h that the bearing capacity of different RAC member decreases significantly with the increase of the high temperature experienced, but the decrease is slower than that of prism specimens. Deformation laws of the bending and shear capacity of SRRAC beams are basically the same. When the temperature is lower than 400 °C, the bearing capacity degrades slowly, when the temperature is larger than 400 °C, the degradation accelerates, for the maximum temperature of 600 °C, the degradation amplitude is about 30%, only 50% of prism specimens. However, the law of bending and shear bearing capacity of RRAC beams is different. Bearing capacity of shear beams decreases with the increase of temperature, while the peak load of the bending beams shows a decreasing-increasing-decreasing tendency, fluctuating between −19% and −8%. The degradation of the compressive bearing capacity of RAC columns is similar to that of prism specimens. For exposure temperature greater than 400 °C, the degradation of columns is slower than that of prism specimens. From results of degradation, for SRRAC members subjected to the same high temperature, the bearing capacity of the compressive members is degraded more severely than that of the flexural members. For maximum temperatures of 200–600 °C, for SRRAC members, the degradation coefficient of compressive members is 11%~22% less than that of flexural members, and for RRAC members, the degradation coefficient (βN) of compressive members is 16%~20% less than that of flexural members.
It can be seen from Figure 13i that the replacement percentage of RCA has no significant effect on the compressive strength of RAC after exposure to high temperatures and the bearing capacity of SRRAC members subjected to high temperatures. With the increase of replacement percentage, the strength of prism specimens varies from 1% to 16%. For SRRAC members, the compressive bearing capacity of columns varies from −1% to 4%, the bending capacity of beams varies from −2% to 1%, and the shear capacity of beams varies from 6% to 10%. For RRAC members, the compressive bearing capacity of columns varies from −6% to 9%, the bending capacity of beams varies from −6 to 18%, and the shear capacity of beams varies from 6 to 12%. In general, the strength or bearing capacity of each specimen increases with the increase of the replacement percentage, that is to say, the strength of the RRAC members after subjection to high temperatures is not worse than that of the ordinary concrete member after subjection to high temperatures.
Comparing RRAC members with SRRAC members, it can be seen that the change of the bearing capacity of RRAC columns with the increase of temperature is roughly equivalent to that of SRRAC members, but the bearing capacity degradation of RRAC beams is more serious than that of SRRAC members. The effect of the replacement percentage on the bearing capacity of RRAC members is basically the same as that of SRRAC members.
3.4.2. Peak Deformation
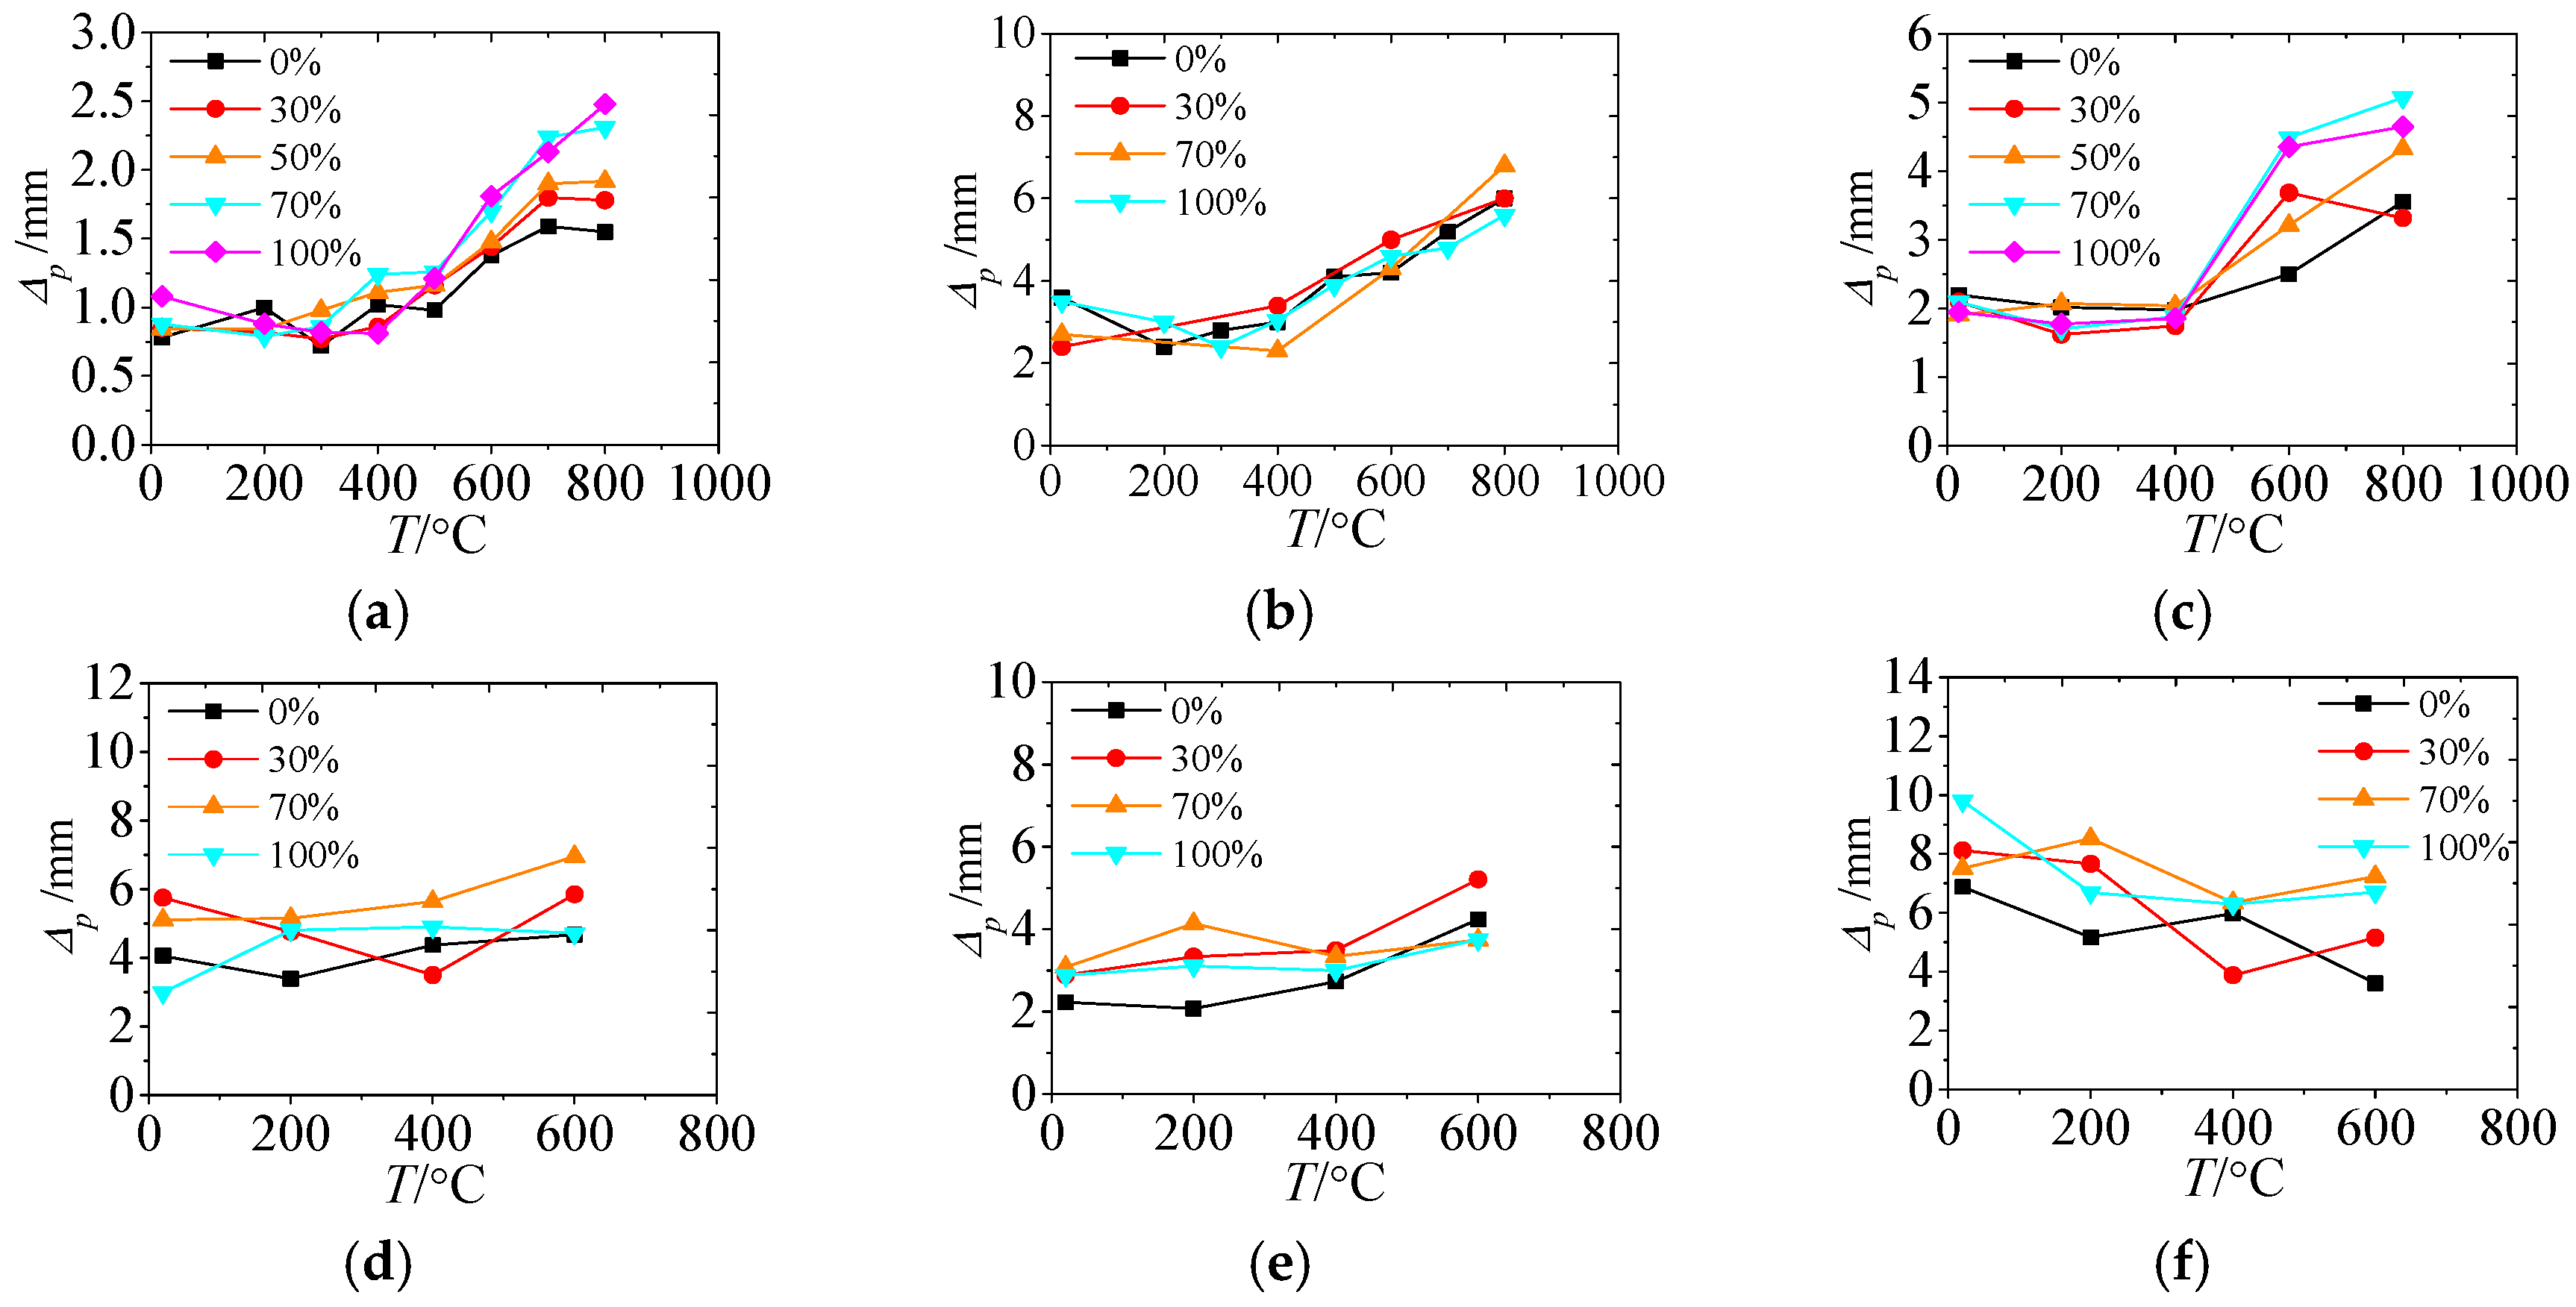
Figure 14 indicates the variation of peak deformation of each member. For prism specimens and columns, the peak deformation refers to the axial deformation corresponding to the peak load. For bending and shear beams, the peak deformation refers to the mid-span deflection corresponding to the peak load. It can be seen from Figure 14 that the peak deformation of specimens, columns and SRRAC beams are not affected obviously by high temperatures when exposure temperatures are lower than 400 °C, but the peak deformation of RRAC beams decreases continuously, ranging from −80% to −13%. When exposure temperatures are larger than 400 °C, the peak deformation of prism specimens, columns and SRRAC shear beams increase rapidly with the high temperature. For maximum temperature of 800 °C, the peak deformation of prism specimens is about 2.26 times that of normal temperature, while the peak deformation of SRRAC bending beams is less affected by temperature. For maximum temperature of 600 °C, the peak deformation is just 1.24 times that of normal temperature. The increase of the peak deformation of prism specimens, columns and SRRAC beams is related to the increase of the internal void and the loose structure of the concrete after subjection to high temperatures, while the decrease of peak deformation of RRAC beams is due to the decrease of ductility and brittle failure with the increase of temperature.
From Figure 14i it can be found that, the effect of replacement percentage on the peak deformation of different member is different. The peak deformation of prism specimens almost increases linearly with the replacement percentage. When the replacement percentage is 100%, the peak deformation is about 1.22 times that of the replacement percentage of 0%. The peak deformation of SRRAC bending and shear beams increases first and then decreases, with the maximum increment of 39% and 32%, respectively. The peak deformation of RRAC bending beams increases with the replacement percentage, the variation range is 15%~37%, and the peak deformation of shear beams reduces first and then increases. The change of the replacement percentage has little effect on the peak deformation of SRRAC columns. When the replacement percentage is 70%, the peak deformation only drops by 4%, while the peak deformation of RRAC columns increases with the increase of the replacement percentage, and the increase range is 2%~24%.
Comparing RRAC members with SRRAC members, it is found that the peak deformation of RRAC columns is almost the same as that of SRRAC members with the increase of temperature, but the deformation capacity of RRAC beams decreases gradually with the increase of temperature, which is beneficial to the improvement of SRRAC members. The effect of replacement percentage on the bearing capacity of RRAC members is roughly the same as that of SRRAC members.
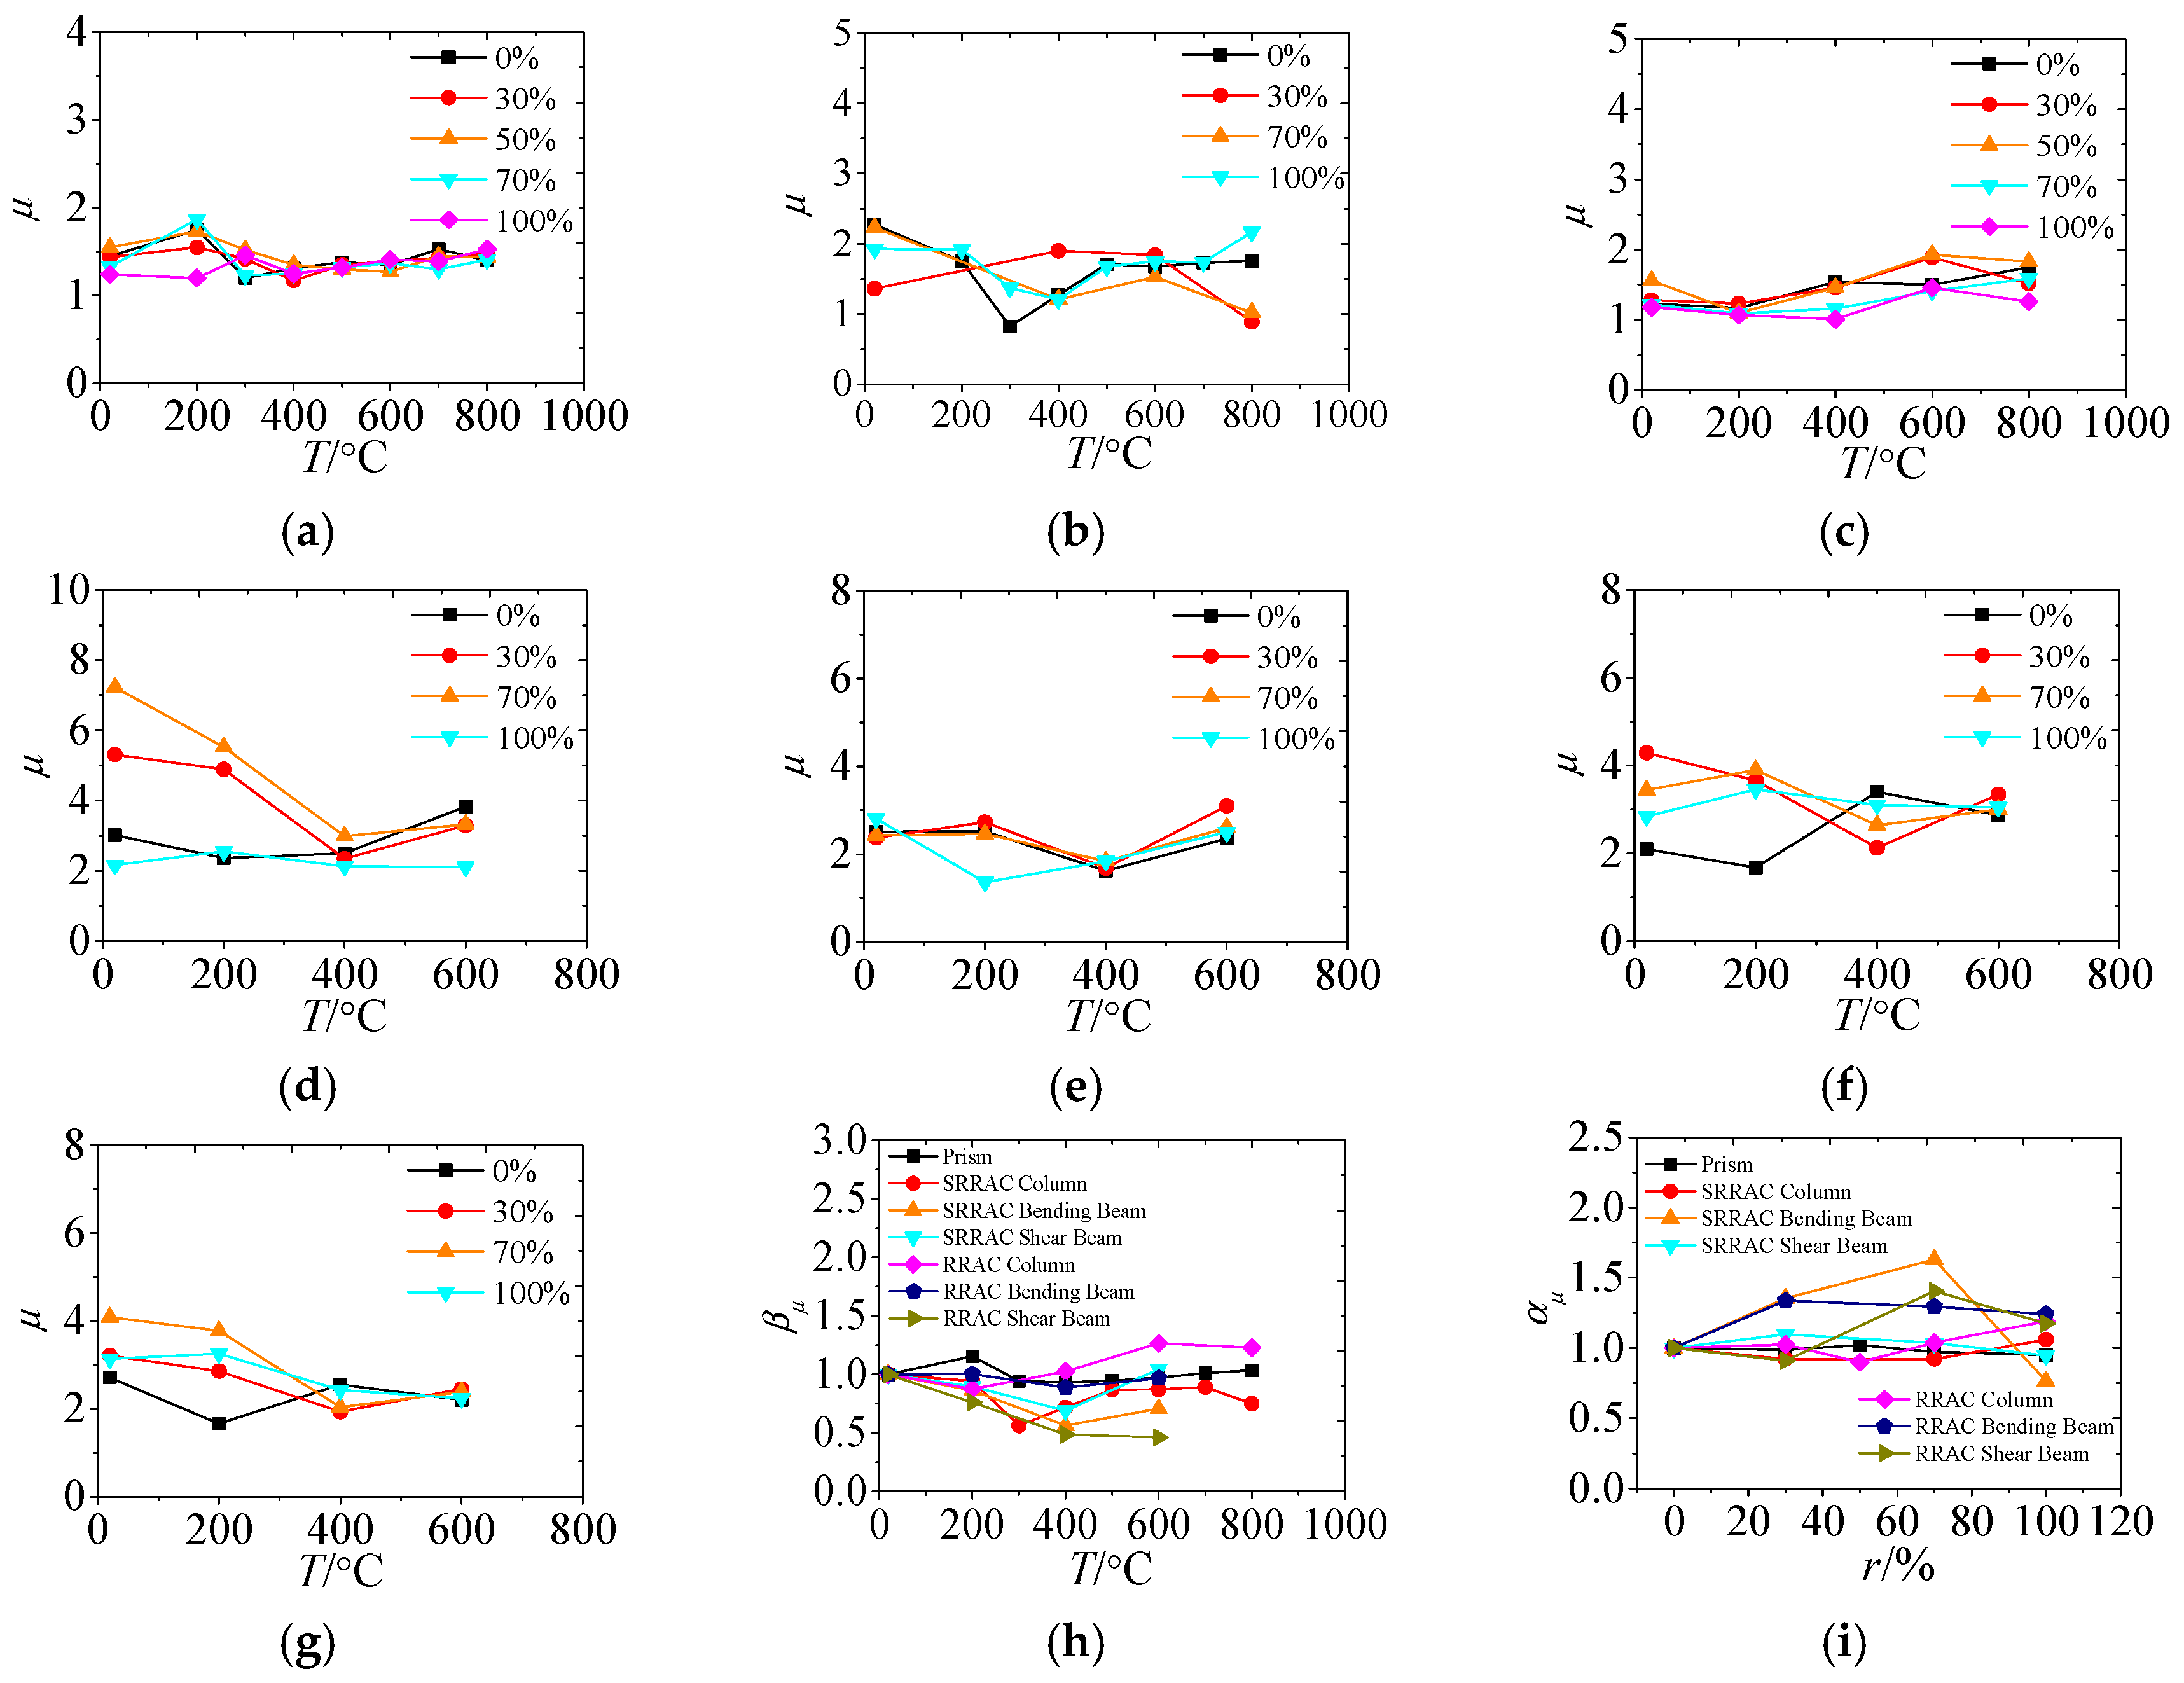
3.4.3. Ductility
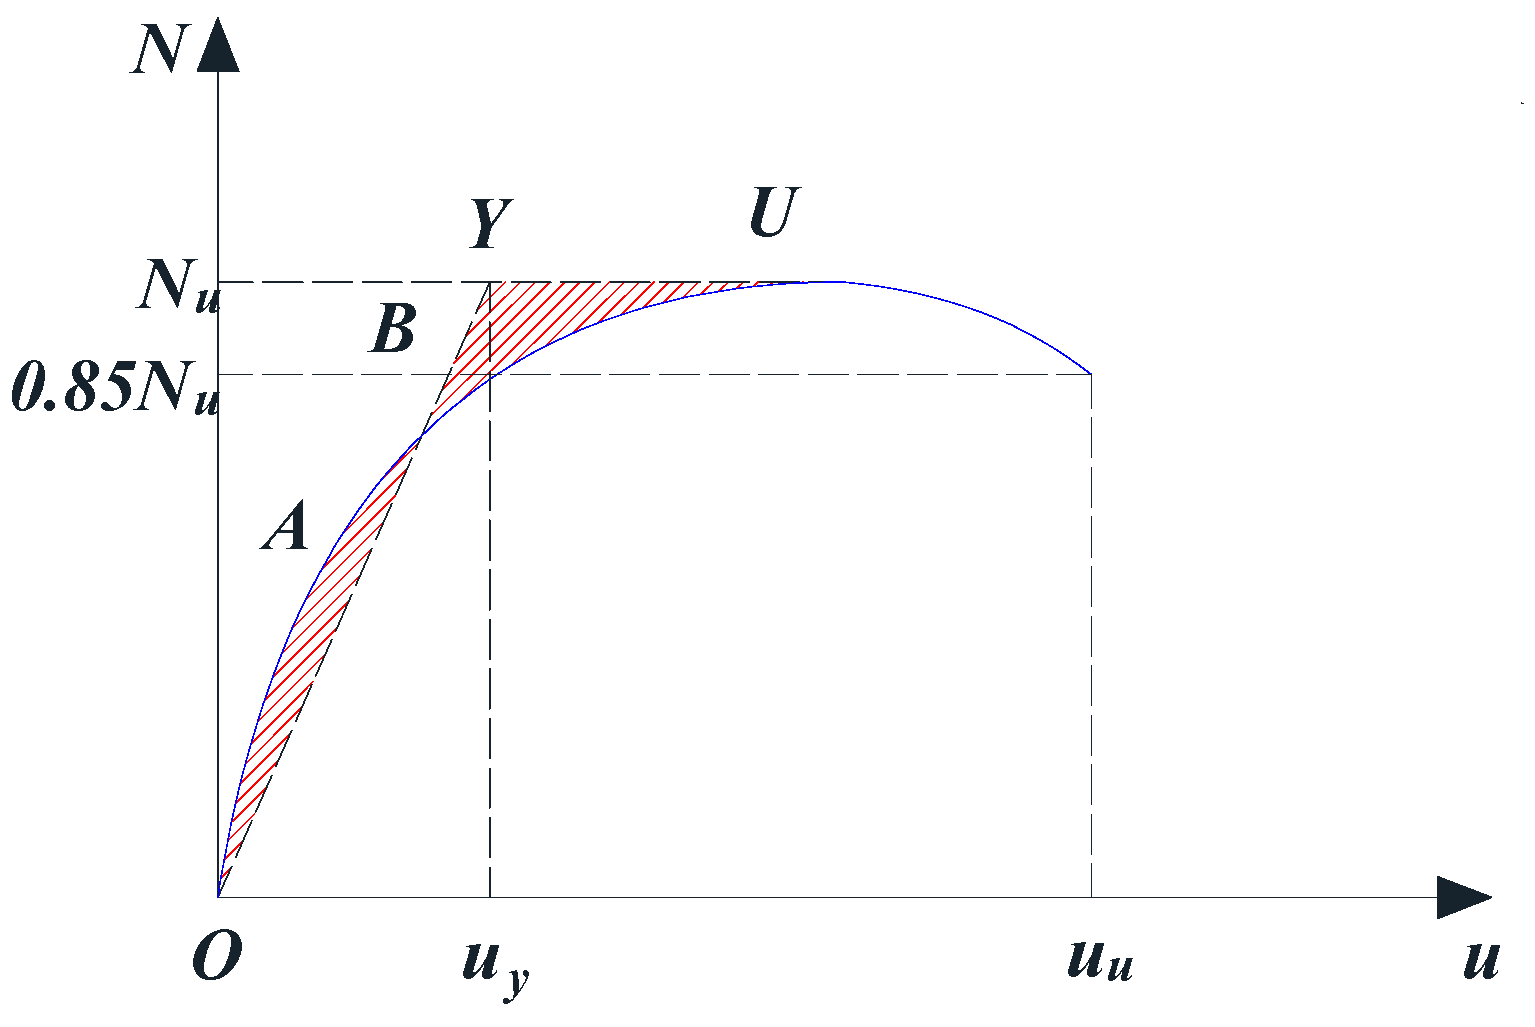
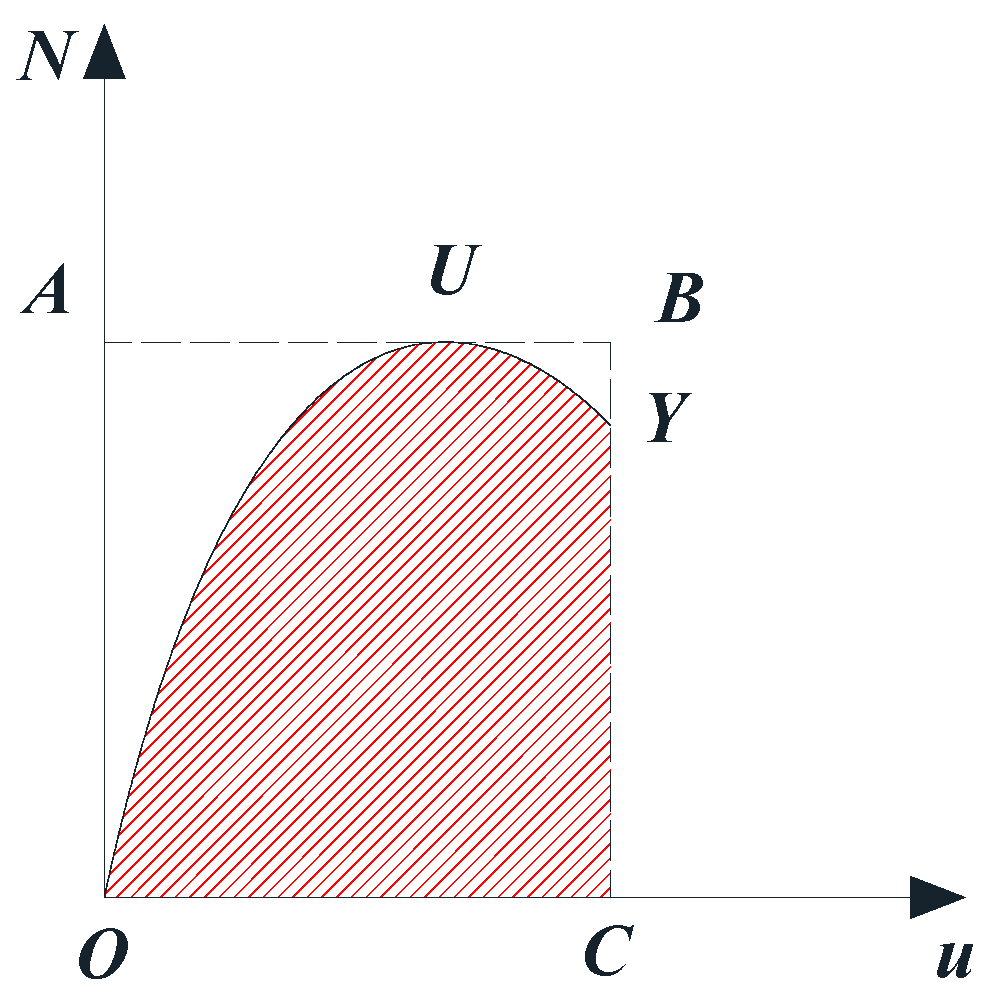
The ductility is expressed by the displacement ductility coefficient. The ductility coefficient (μ = uu/uy) is calculated according to the load-deformation curve. uu is the displacement value of the corresponding point when the peak stress drops to 85% (When the load does not decrease to 85% Nu, the maximum displacement is taken). uy is the initial yield displacement, which is determined by energy equivalence method, as shown in Figure 15, where the dimension of OAB is equal to the dimension of YUB.
It can be observed from Figure 16 that, the variation of the displacement ductility coefficient of each member after experiencing different high temperatures. From Figure 16a–h, it can be seen that the displacement ductility coefficients of each member fluctuate up and down with the maximum temperature. In general, the displacement ductility coefficient of various members decreases with the increase of maximum temperature in the range of 200~400 °C. For the maximum temperature of 400 °C, the displacement ductility coefficients of prism specimens decrease by 10%, the displacement ductility coefficients of SRRAC columns, SRRAC bending beams, and SRRAC shear beams decrease by 28%, 44%, and 31%, respectively. The displacement ductility coefficients of RRAC columns increase by 2%, while the displacement ductility coefficients of RRAC bending beams and RRAC shear beams decreased by 11% and 51%, respectively. When the maximum temperature is larger than 400 °C, the displacement ductility coefficient of each member increases, and the displacement ductility coefficients of SRRAC members and RRAC members vary by −25%~4% and −54%~27%, respectively.
It can be observed from Figure 16i that, the replacement percentage has different effects on the displacement ductility coefficients of different members. The displacement ductility coefficient of prism specimens is less affected by the replacement percentage, and the variation range is −5%~2%. For SRRAC members, the displacement ductility coefficient of bending beams increases first and then decreases, it increases by 63% when the replacement percentage is 70%, and it decreases by 24% when the replacement percentage is 100%. The displacement ductility coefficient of columns and shear beams varies slightly with the replacement percentage, ranging from −5% to 10%. For RRAC members, with the increase of replacement percentage, the displacement ductility coefficient of columns increases first and then decreases, it increases by 10% when the replacement percentage is 50%, and it decreases by 17% when the replacement percentage is 100%. The displacement ductility coefficient of bending beams and shear beams is greatly affected by the replacement percentage, which varies from 24% to 34% and −9% to 41%, respectively. When the replacement percentage is 30%, shear beams decreased by 9%, and the other replacement percentage increased, indicating that the increase of RCA increased the ductility of the beam to some extent.
In summary, compared with SRRAC members, the ductility of RRAC columns and RRAC bending beams is slightly better, but the ductility of RRAC shear beams is worse. The replacement percentage has a greater influence on the displacement ductility coefficient of RRAC shear beams than SRRAC members, and the displacement ductility coefficients of columns and flexural beams are approximately the same with the increase of replacement percentage.
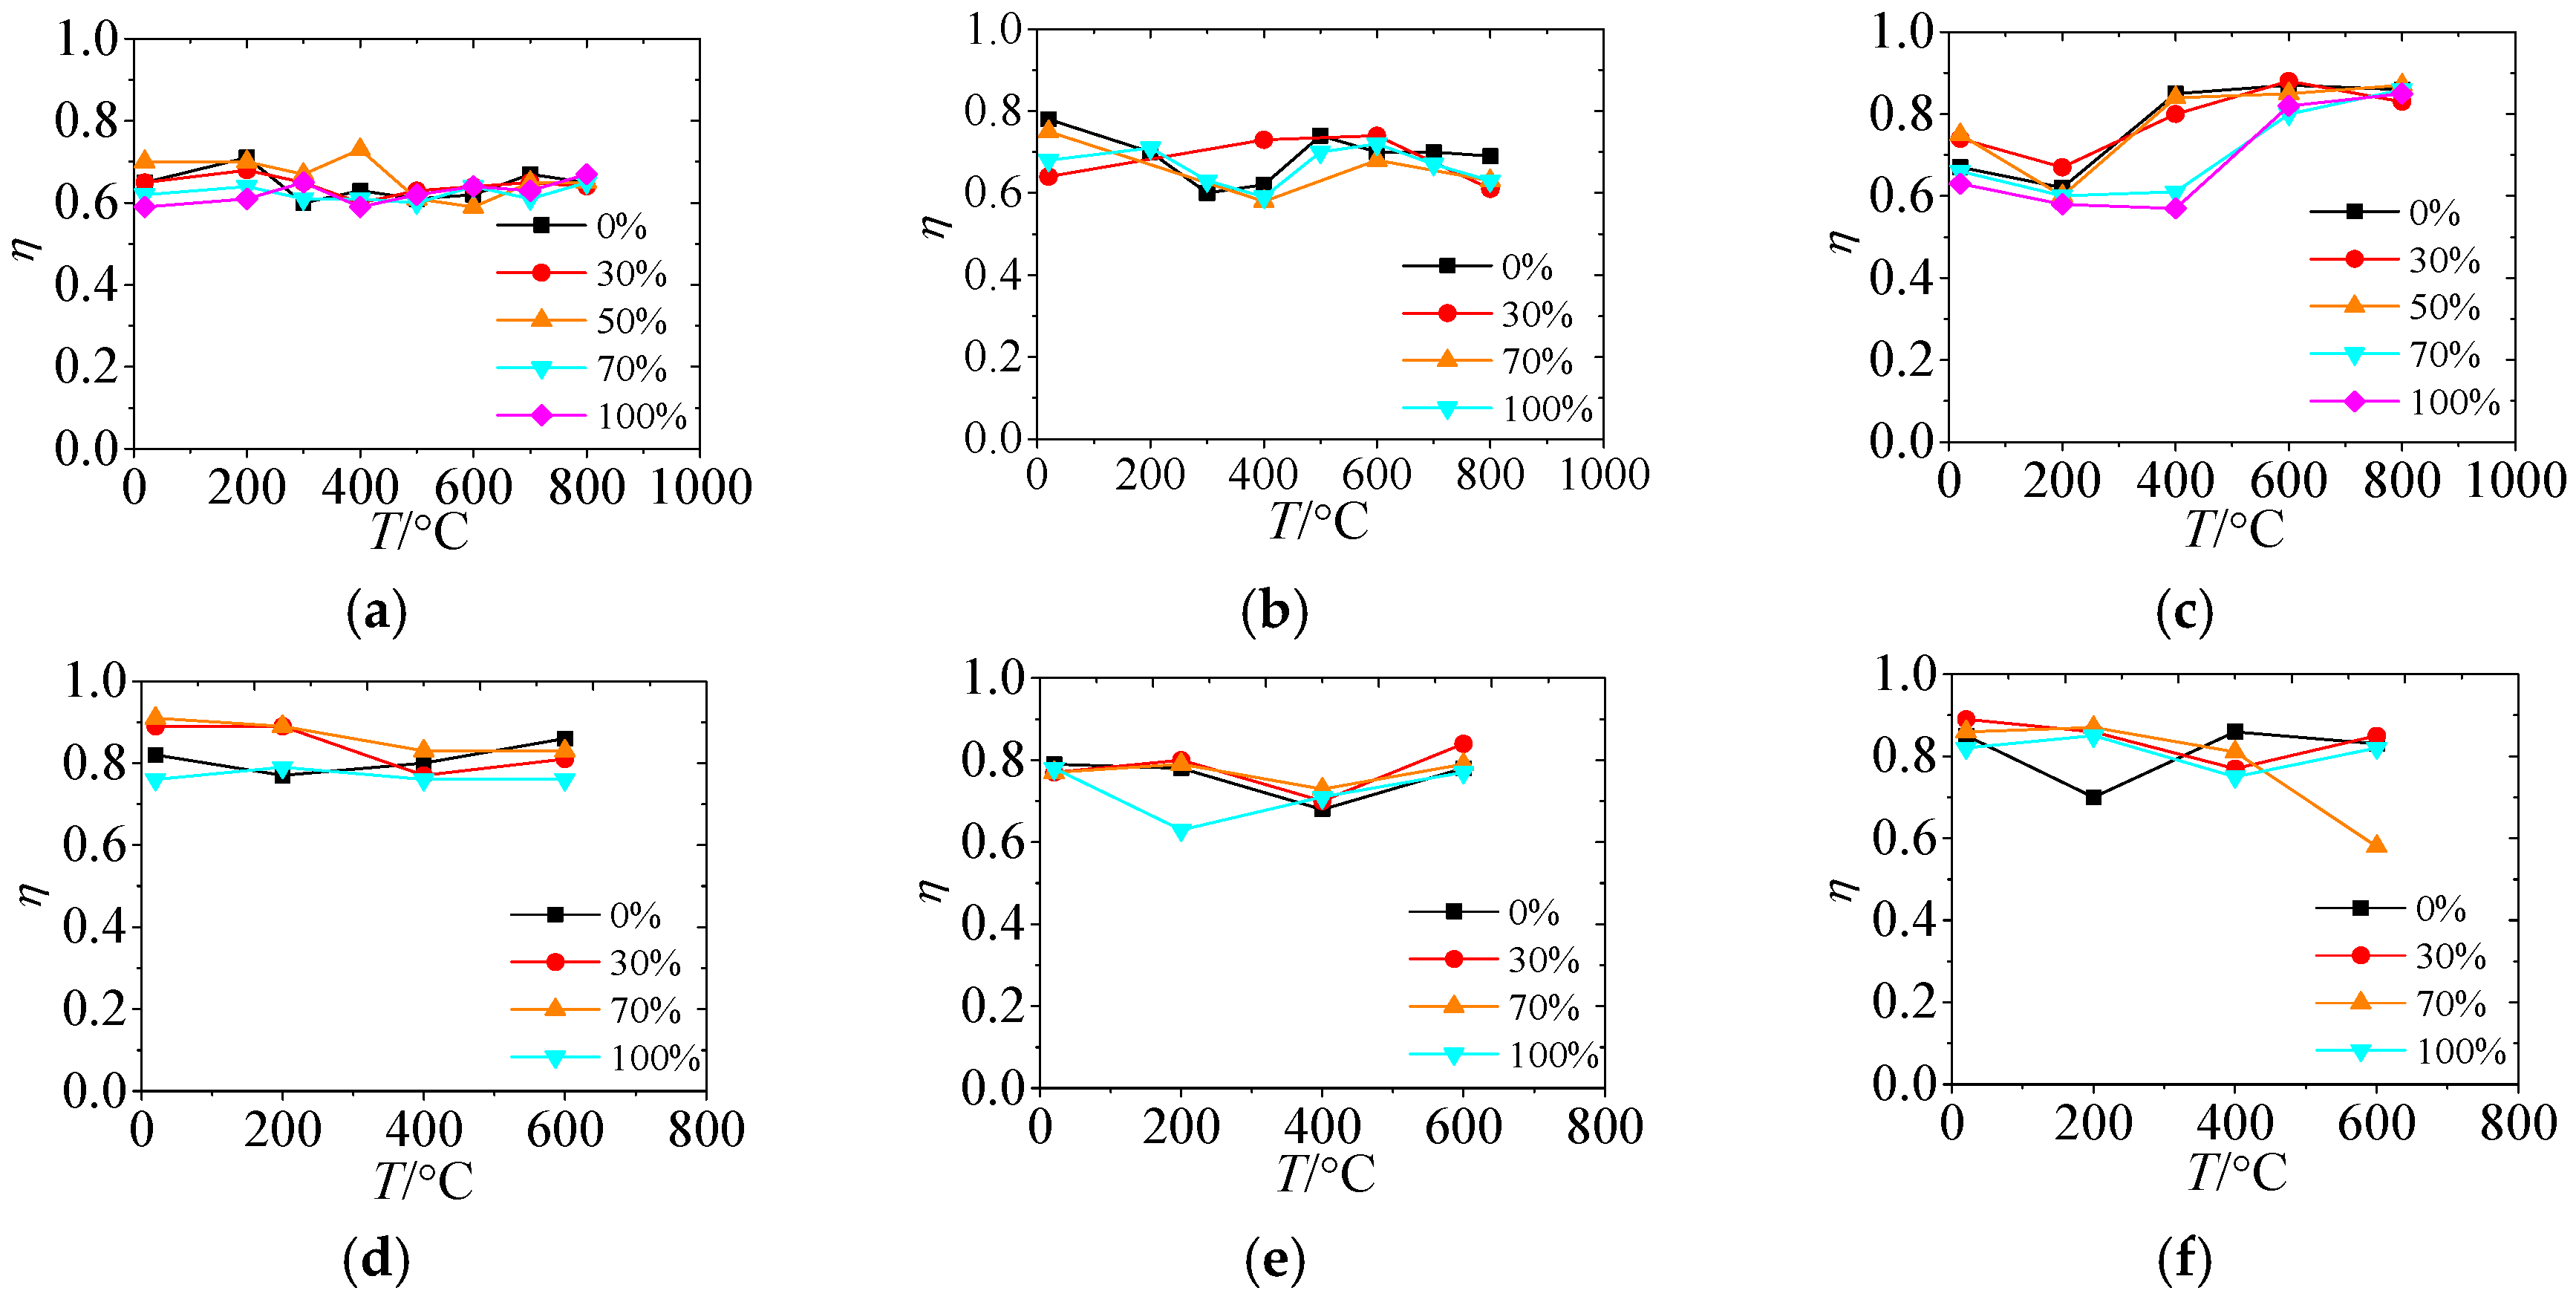
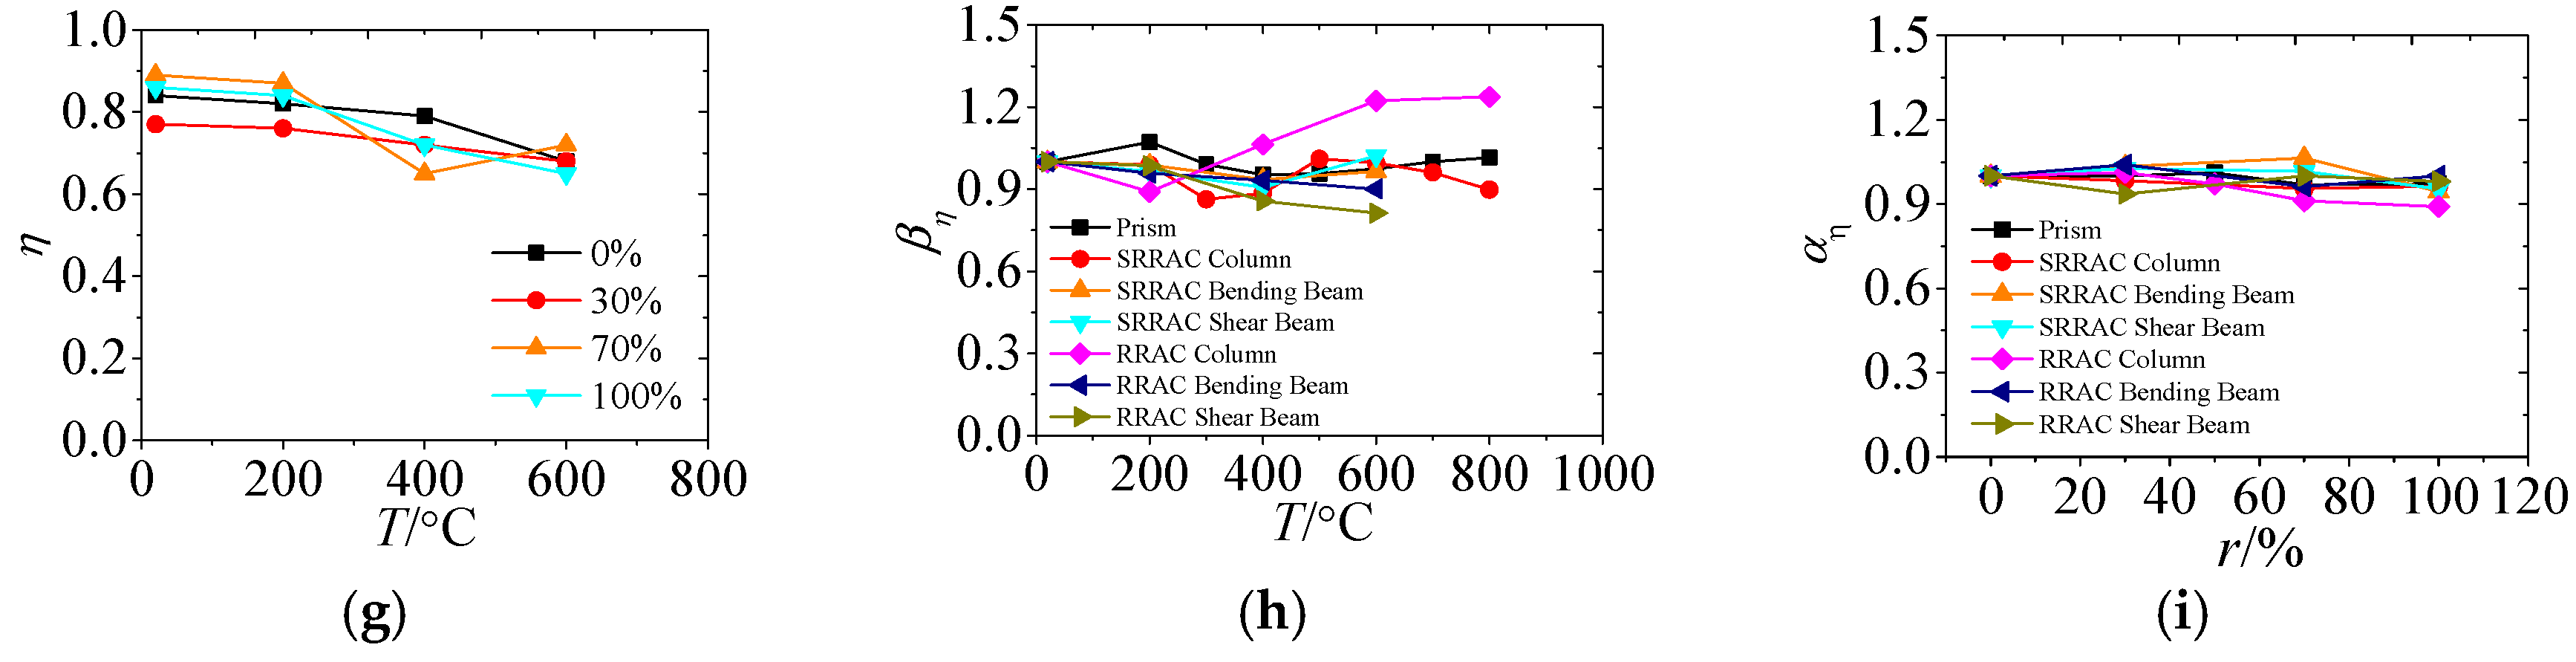
3.4.4. Energy Dissipation
Energy dissipation coefficients (η = SOUYC/SOABC) are calculated according to the load-displacement curve. It can be observed from Figure 17 that SOUYC is the area of the shaded portion surrounded by the load-displacement curve when the load is reduced to 85% of the peak load (when the minimum value of the load in the descending section is greater than 85% of the peak load, the full curve is taken), and SOABC is the area surrounded by the rectangle passing through the peak point (U) and the limit displacement point (Y).
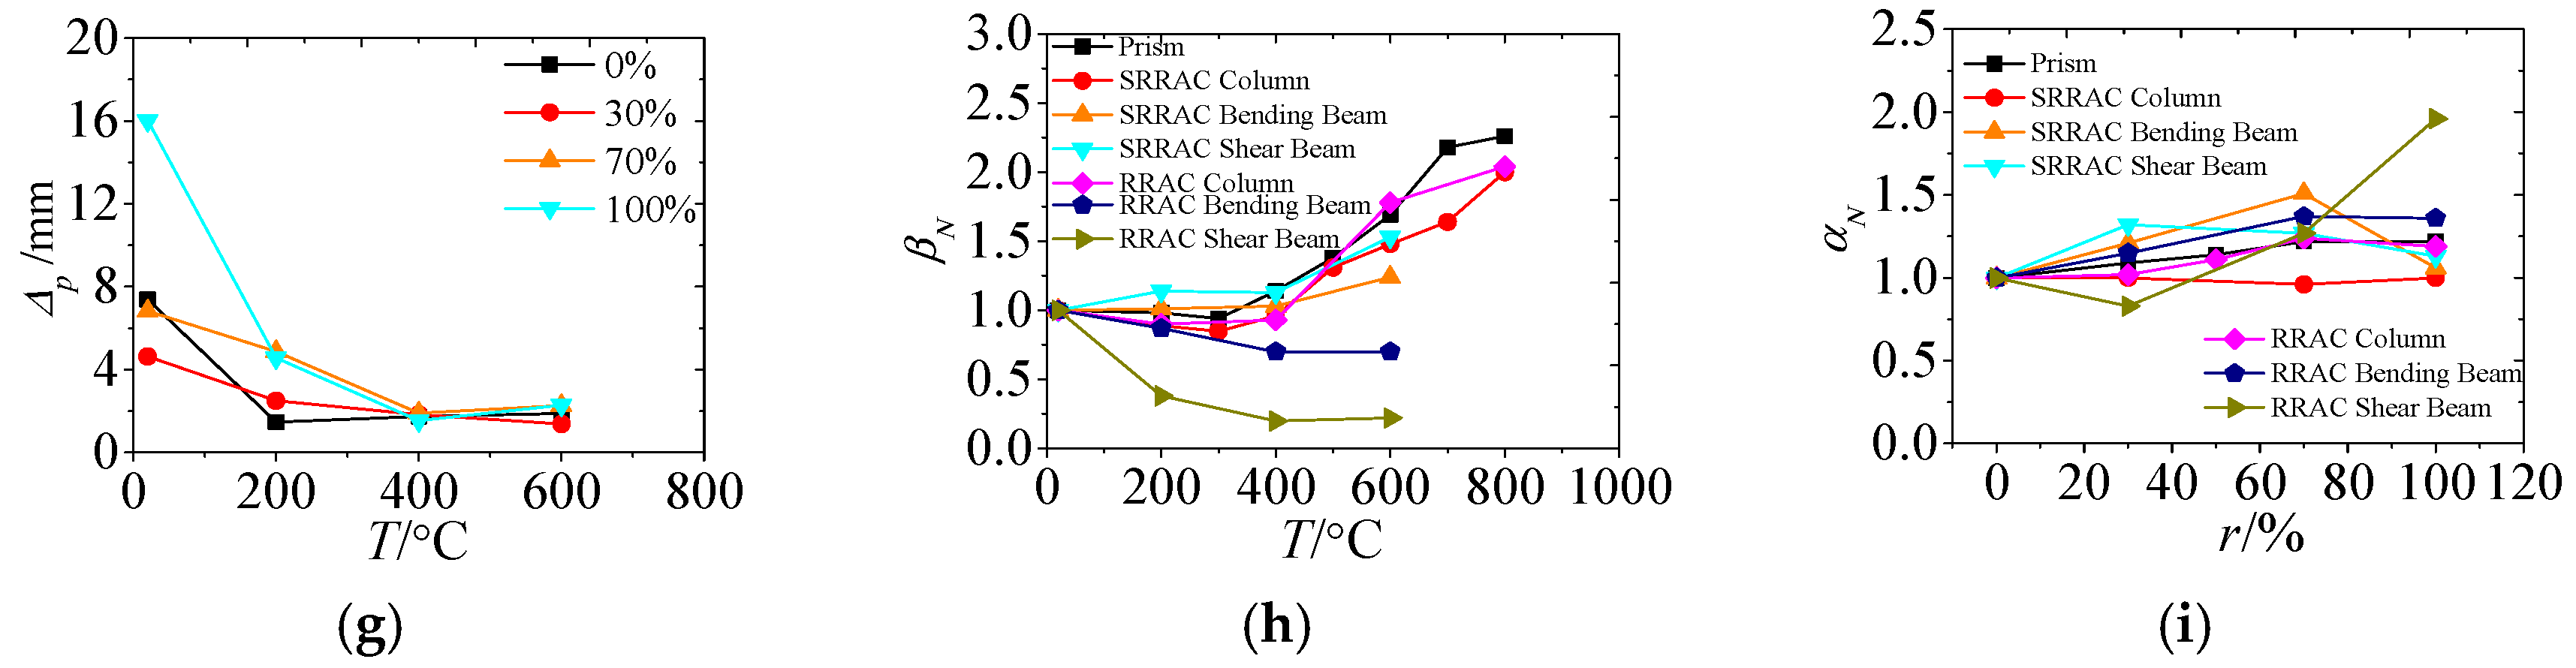
From Figure 18 it can be found that, the energy dissipation of each member after exposure to different high temperature. Figure 18a–h shows the variation law of the energy dissipation coefficient of SRRAC members is similar to that of ductility. It tends to decrease with increasing temperature when exposure temperatures are lower than 400 °C. For the maximum temperature of 400 °C, the decreases of specimens, columns, bending beams, and shear beams are 13%, 11%, 7%, and 10% respectively; and for maximum temperatures of 400 °C–600 °C, the energy dissipation coefficient decreases slightly. When exposure temperatures are larger than 600 °C, the energy dissipation coefficient is gradually increased. With the increase of temperature, the energy dissipation coefficient of RRAC members differs from that of SRRAC members. The trend of the energy dissipation coefficient of columns is increasing-decreasing-increasing, the variation range is −12%~23%, and the energy dissipation coefficient of beams has a tendency to fluctuate.
From Figure 18i can be found that the replacement percentage has different effects on the displacement ductility coefficients of different members. The energy dissipation coefficient of prism specimens and SRRAC members is not obviously affected by the replacement percentage. With the increase of replacement percentage, the energy dissipation coefficient fluctuates within the range of −5.5%~6.5%. The energy dissipation coefficient of RRAC members is also not obviously affected by the replacement percentage. With the increase of replacement percentage, the energy dissipation coefficient fluctuates within the range of −11%~4%, and the energy dissipation coefficient of bending beams and shear beams is −4%~4% and −6.5%~0%, respectively.
In general, the influence of temperature on energy dissipation coefficient of RRAC members is greater than that of SRRAC members, the effect of replacement percentage on the energy dissipation coefficient of RAC members is not obvious.
4. Conclusions
- (1)
- After the RAC undergoes high temperatures, its apparent physical changes are obvious: The color changes from blue ash to grayish white, cracking occurs when the temperature reaches 600 °C and bursting and spalling occurs when the temperature reaches 800 °C, the quality of RAC is reduced, and this phenomenon is more significant with the increase of temperature and replacement percentage.
- (2)
- The mechanical properties of RAC prism specimens and RAC members degrade significantly after subjection to high temperatures, especially the bearing capacity. Among the different member, the shear performance of prism specimens and RRAC beams degrade fastest, while the flexural performance of the RRAC and SRRAC beams degrade slowest.
- (3)
- Among different member, the mass loss ratio of RRAC members is slightly larger than that of SRRAC members with the increase of temperature.
- (4)
- The change of the bearing capacity of RRAC columns with the increase of temperature is roughly the same as that of SRRAC members, but the bearing capacity degradation of RRAC beams is more serious than that of SRRAC members. The effect of the replacement percentage on the bearing capacity of RRAC members is basically the same as that of SRRAC members.
- (5)
- With the increase of temperature, the variation process of the peak deformation of RRAC columns is roughly equivalent to that of the SRRAC members. However, the increase of temperature makes the deformation capacity of RRAC beams gradually decrease, which is beneficial to the improvement of SRRAC members. The effect of the replacement percentage on the bearing capacity of RRAC members is roughly equivalent to that of SRRAC members.
- (6)
- With the increase of temperature, the ductility of RRAC columns and RRAC bending beams is slightly better than that of SRRAC members, but the ductility of RRAC shear beams is worse than that of SRRAC members. The replacement percentage has a greater influence on the displacement ductility coefficient of RRAC shear beams than that of SRRAC members, and the displacement ductility coefficients of columns and flexural beams are approximately the same with the increase of replacement percentage.
- (7)
- The influence of temperature on energy dissipation coefficient of RRAC members is greater than that of SRRAC members, the effect of replacement percentage on the energy dissipation coefficient of RAC members is not obvious.
5. Suggestion
After water cooling of RAC and its structural members, mechanical properties, and safety assessment methods are studied. After all, in real life, fire sprinkler is the most commonly used fire extinguishing method in the world after a fire, and its post-disaster performance is quite different from that of natural fire extinguishing after complete combustion of combustible materials. The temperature process is more rapid and the damage degree to the structural members is greater.
Author Contributions
Z.C. conceived the experiments, Y.L. and P.Y. designed the experiments and wrote the initial draft of the manuscript. Z.C. and J.Z. analyzed the data and wrote the final manuscript.
Funding
This research report was financially supported by the National Natural Science Foundation of China (No. 51578163), the Key Project of Natural Science Foundation of Guangxi Province (No. 2016GXNSFDA380032), and High Level Innovation Group and Outstanding Scholar Programme of Guangxi High Education (No. [2017]38).
Acknowledgments
The authors are very grateful for the support of the above project funds.
Conflicts of Interest
The authors declare no conflict of interest.
References
- Abbas, A.; Fathifazl, G.; Isgor, O.B.; Razaqpur, A.G.; Fouriner, B.; Foo, S. Environmental benefits of green concrete. In Proceedings of the Climate Change Conference, Ottawa, ON, Canada, 2006; pp. 1–8. [Google Scholar]
- Behera, M.; Bhattacharyya, S.K.; Minocha, A.K.; Deoliya, R.; Maiti, S. Recycled aggregate from C&D waste & its use in concrete—A breakthrough towards sustainability in construction sector: A review. Constr. Build. Mater. 2014, 68, 501–516. [Google Scholar]
- Pedro, D.; Brito, J.D.; Evangelista, L. Influence of the use of recycled concrete aggregates from different sources on structural concrete. Constr. Build. Mater. 2014, 71, 141–151. [Google Scholar] [CrossRef]
- Xiao, J.Z.; Li, W.G.; Poon, C.S. Recent studies on mechanical properties of recycled aggregate concrete in China—A review. Sci. China-Technol. Sci. 2012, 55, 1463–1480. [Google Scholar] [CrossRef]
- Topcu, I.B. Physical and mechanical properties of concrete produced with waste concrete. Cem. Concr. Res. 1997, 27, 1817–1823. [Google Scholar] [CrossRef]
- Gomez-Soberon, J.M. Porosity of recycled concrete with substitution of recycled concrete aggregate: An experimental study. Cem. Concr. Res. 2002, 32, 1301–1311. [Google Scholar] [CrossRef]
- Poon, C.S.; Shui, Z.H.; Lam, L. Effect of microstructure of ITZ on compressive strength of concrete prepared with recycled aggregates. Constr. Build. Mater. 2004, 18, 461–468. [Google Scholar] [CrossRef]
- Xiao, J.; Jiabin, L.; Zhang, C. Mechanical properties of recycled aggregate concrete under uniaxial loading. Cem. Concr. Res. 2005, 35, 1187–1194. [Google Scholar] [CrossRef]
- Khatib, J.M. Properties of concrete incorporating fine recycled aggregate. Cem. Concr. Res. 2005, 35, 763–769. [Google Scholar] [CrossRef]
- ACI Committee 555. Removal and reuse of hardened concrete. ACI Mater. J. 2002, 99, 300–325. [Google Scholar]
- Dhir, R.K.; Limbachiya, M.C.; Leelawat, T. Suitability of recycled concrete aggregate for use in BS 5328 designated mixes. Proc. Inst. Civ. Eng. Struct. Build. 1999, 134, 257–274. [Google Scholar] [CrossRef]
- Choi, W.C.; Yun, H.D. Compressive behavior of reinforced concrete columns with recycled aggregate under uniaxial loading. Eng. Struct. 2012, 41, 285–293. [Google Scholar] [CrossRef]
- Choi, W.C.; Yun, H.D. Long-term deflection and flexural behavior of reinforced concrete beams with recycled aggregate. Mater. Des. 2013, 51, 742–750. [Google Scholar] [CrossRef]
- Knaack, A.M.; Kurama, Y.C. Behavior of Reinforced Concrete Beams with Recycled Concrete Coarse Aggregates. J. Struct. Eng. 2015, 141, 1–12. [Google Scholar] [CrossRef]
- Valeria, C.; Viviana, L.; Giacomo, M. Behavior of beam-column joints made of recycled-aggregate concrete under cyclic loading. Constr. Build. Mater. 2011, 25, 1877–1882. [Google Scholar]
- Ma, H.; Xue, J.; Zhang, X. Seismic performance of steel-reinforced recycled concrete columns under low cyclic loads. Constr. Build. Mater. 2013, 48, 229–237. [Google Scholar] [CrossRef]
- Xiao, J.Z.; Sun, Y.D.; Falkner, H. Seismic performance of frame structures with recycled aggregate concrete. Eng. Struct. 2006, 28, 1–8. [Google Scholar] [CrossRef]
- Zega, C.J.; Di Maio, A.A. Recycled concrete exposed to high temperatures. Mag. Concr. Res. 2006, 58, 675–682. [Google Scholar] [CrossRef]
- Zega, C.J.; Di Maio, A.A. Recycled concrete made with different natural coarse aggregates exposed to high temperature. Constr. Build. Mater. 2009, 23, 2047–2052. [Google Scholar] [CrossRef]
- Hachemi, S.; Ounis, A. Performance of concrete containing crushed brick aggregate exposed to different fire temperatures. Eur. J. Environ. Civ. Eng. 2015, 19, 805–824. [Google Scholar] [CrossRef]
- Terro, M.J. Properties of concrete made with recycled crushed glass at elevated temperatures. Build. Environ. 2006, 41, 633–639. [Google Scholar] [CrossRef]
- Xiao, Z.; Ling, T.C.; Poon, C.S.; Kou, S.C.; Wang, Q.; Huang, R. Properties of partition wall blocks prepared with high percentages of recycled clay brick after exposure to elevated temperatures. Constr. Build. Mater. 2013, 49, 56–61. [Google Scholar] [CrossRef]
- Kou, S.C.; Poon, C.S.; Etxeberria, M. Residue strength, water absorption and pore size distributions of recycled aggregate concrete after exposure to elevated temperatures. Cem. Concr. Compos. 2014, 53, 73–82. [Google Scholar] [CrossRef]
Figure 1.
Section size and steel forms of specimens (mm). (a) SRRAC column; (b) RRAC column; (c) SRRAC beam; (d) RRAC beam.
Figure 1.
Section size and steel forms of specimens (mm). (a) SRRAC column; (b) RRAC column; (c) SRRAC beam; (d) RRAC beam.

Figure 2.
Heating equipment.

Figure 3.
Temperature increase in the furnace.

Figure 4.
Test setup and measurement arrangement of block and column. (a) Test setup; (b) Measurement arrangement.
Figure 4.
Test setup and measurement arrangement of block and column. (a) Test setup; (b) Measurement arrangement.

Figure 5.
Test setup and measurement arrangement of beam. (a) Test setup; (b) Measurement arrangement.
Figure 5.
Test setup and measurement arrangement of beam. (a) Test setup; (b) Measurement arrangement.

Figure 6.
Apparent morphology of specimen after high temperatures. (a) 20 °C; (b) 200 °C; (c) 400 °C; (d) 600 °C; (e) 800 °C.
Figure 6.
Apparent morphology of specimen after high temperatures. (a) 20 °C; (b) 200 °C; (c) 400 °C; (d) 600 °C; (e) 800 °C.

Figure 7.
The mass loss. (a) Prism; (b) SRRAC column; (c) RRAC column; (d) SRRAC beam; (e) RRAC beam; (f) Influence of temperature; (g) Influence of replacement percentage.
Figure 7.
The mass loss. (a) Prism; (b) SRRAC column; (c) RRAC column; (d) SRRAC beam; (e) RRAC beam; (f) Influence of temperature; (g) Influence of replacement percentage.

Figure 8.
Stress-strain curves of recycled aggregate concrete (RAC) prism specimens. (a) r = 0%; (b) r = 30%; (c) r = 50%; (d) r = 70%; (e) r = 100%.
Figure 8.
Stress-strain curves of recycled aggregate concrete (RAC) prism specimens. (a) r = 0%; (b) r = 30%; (c) r = 50%; (d) r = 70%; (e) r = 100%.

Figure 9.
Load-displacement curves of SRRAC columns. (a) r = 0%; (b) r = 30%; (c) r = 70%; (d) r = 100%.
Figure 9.
Load-displacement curves of SRRAC columns. (a) r = 0%; (b) r = 30%; (c) r = 70%; (d) r = 100%.

Figure 10.
Load-displacement curves of RRAC columns. (a) r = 0%; (b) r = 30%; (c) r = 50%; (d) r = 70%; (e) r = 100%.
Figure 10.
Load-displacement curves of RRAC columns. (a) r = 0%; (b) r = 30%; (c) r = 50%; (d) r = 70%; (e) r = 100%.

Figure 11.
Load-deflection curves of SRRAC beams. (a) λ = 2.0, r = 0%; (b) λ = 2.0, r = 30%; (c) λ = 2.0, r = 70%; (d) λ = 2.0, r = 100%; (e) λ = 1.2, r = 0%; (f) λ = 1.2, r = 30%; (g) λ = 1.2, r = 70%; (h) λ = 1.2, r = 100%.
Figure 11.
Load-deflection curves of SRRAC beams. (a) λ = 2.0, r = 0%; (b) λ = 2.0, r = 30%; (c) λ = 2.0, r = 70%; (d) λ = 2.0, r = 100%; (e) λ = 1.2, r = 0%; (f) λ = 1.2, r = 30%; (g) λ = 1.2, r = 70%; (h) λ = 1.2, r = 100%.

Figure 12.
Load-deflection curves of RRAC beams. (a) λ = 2.0, r = 0%; (b) λ = 2.0, r = 30%; (c) λ = 2.0, r = 70%; (d) λ = 2.0, r = 100%; (e) λ = 1.2, r = 0%; (f) λ = 1.2, r = 30%; (g) λ = 1.2, r = 70%; (h) λ = 1.2, r = 100%.
Figure 12.
Load-deflection curves of RRAC beams. (a) λ = 2.0, r = 0%; (b) λ = 2.0, r = 30%; (c) λ = 2.0, r = 70%; (d) λ = 2.0, r = 100%; (e) λ = 1.2, r = 0%; (f) λ = 1.2, r = 30%; (g) λ = 1.2, r = 70%; (h) λ = 1.2, r = 100%.

Figure 13.
Influence of variation parameters on bearing capacity degradation. (a) Prism; (b) SRRAC column; (c) RRAC column; (d) SRRAC bending beam; (e) SRRAC shear beam; (f) RRAC bending beam; (g) RRAC shear beam; (h) Temperature; (i) Replacement percentage.
Figure 13.
Influence of variation parameters on bearing capacity degradation. (a) Prism; (b) SRRAC column; (c) RRAC column; (d) SRRAC bending beam; (e) SRRAC shear beam; (f) RRAC bending beam; (g) RRAC shear beam; (h) Temperature; (i) Replacement percentage.

Figure 14.
Influence of variation parameters on bearing peak deformation. (a) Prism; (b) SRRAC column; (c) RRAC column; (d) SRRAC bending beam; (e) SRRAC shear beam; (f) RRAC bending beam; (g) RRAC shear beam; (h) Temperature; (i) Replacement percentage.
Figure 14.
Influence of variation parameters on bearing peak deformation. (a) Prism; (b) SRRAC column; (c) RRAC column; (d) SRRAC bending beam; (e) SRRAC shear beam; (f) RRAC bending beam; (g) RRAC shear beam; (h) Temperature; (i) Replacement percentage.


Figure 15.
Schematic diagram of energy equivalent method.

Figure 16.
Influence of variation parameters on ductility. (a) Prism; (b) SRRAC column; (c) RRAC column; (d) SRRAC bending beam; (e) SRRAC shear beam; (f) RRAC bending beam; (g) RRAC shear beam; (h) Temperature; (i) Replacement percentage.
Figure 16.
Influence of variation parameters on ductility. (a) Prism; (b) SRRAC column; (c) RRAC column; (d) SRRAC bending beam; (e) SRRAC shear beam; (f) RRAC bending beam; (g) RRAC shear beam; (h) Temperature; (i) Replacement percentage.

Figure 17.
Schematic diagram of energy dissipation coefficient.

Figure 18.
Influence of variation parameters on energy dissipation. (a) Prism; (b) SRRAC column; (c) RRAC column; (d) SRRAC bending beam; (e) SRRAC shear beam; (f) RRAC bending beam; (g) RRAC shear beam; (h) Temperature; (i) Replacement percentage.
Figure 18.
Influence of variation parameters on energy dissipation. (a) Prism; (b) SRRAC column; (c) RRAC column; (d) SRRAC bending beam; (e) SRRAC shear beam; (f) RRAC bending beam; (g) RRAC shear beam; (h) Temperature; (i) Replacement percentage.


Table 1.
Mix proportion of recycled concrete.
| r/% | Strength Grade | Water Cement Ratio | Sand Percentage | Mix Proportion: kg/m3 | ||||
|---|---|---|---|---|---|---|---|---|
| Cement | Water | Sand | NCA | RCA | ||||
| 0 | C30 | 0.43 | 0.32 | 500 | 215 | 532 | 1129 | 0 |
| 30 | 790 | 339 | ||||||
| 50 | 565 | 564 | ||||||
| 70 | 339 | 790 | ||||||
| 100 | 0 | 1129 | ||||||
Table 2.
Design parameters and experimental results of prism specimens.
| Specimens Number | r/% | T/°C | βm/% | Np/kN | Δp/mm | μ | η |
|---|---|---|---|---|---|---|---|
| P0-0 | 0 | 20 | - | 623.5 | 0.78 | 1.45 | 0.65 |
| P0-2 | 0 | 200 | 1.35 | 420.1 | 1.00 | 1.75 | 0.71 |
| P0-3 | 0 | 300 | 1.13 | 506.7 | 0.72 | 1.20 | 0.60 |
| P0-4 | 0 | 400 | 5.91 | 469.6 | 1.02 | 1.31 | 0.63 |
| P0-5 | 0 | 500 | 6.03 | 442.6 | 0.98 | 1.38 | 0.61 |
| P0-6 | 0 | 600 | 6.04 | 337.1 | 1.38 | 1.35 | 0.62 |
| P0-7 | 0 | 700 | 7.43 | 225.7 | 1.59 | 1.53 | 0.67 |
| P0-8 | 0 | 800 | 8.24 | 181.1 | 1.55 | 1.40 | 0.65 |
| P30-0 | 30 | 20 | - | 644.0 | 0.85 | 1.44 | 0.65 |
| P30-2 | 30 | 200 | 1.13 | 565.0 | 0.82 | 1.55 | 0.68 |
| P30-3 | 30 | 300 | 3.50 | 586.8 | 0.77 | 1.42 | 0.65 |
| P30-4 | 30 | 400 | 5.77 | 580.3 | 0.86 | 1.17 | 0.60 |
| P30-5 | 30 | 500 | 6.85 | 480.6 | 1.16 | 1.35 | 0.63 |
| P30-6 | 30 | 600 | 7.14 | 365.2 | 1.44 | 1.39 | 0.64 |
| P30-7 | 30 | 700 | 7.91 | 250.2 | 1.80 | 1.43 | 0.65 |
| P30-8 | 30 | 800 | 8.99 | 177.3 | 1.78 | 1.48 | 0.64 |
| P50-0 | 50 | 20 | - | 640.1 | 0.84 | 1.55 | 0.70 |
| P50-2 | 50 | 200 | 0.74 | 518.6 | 0.84 | 1.73 | 0.70 |
| P50-3 | 50 | 300 | 3.60 | 567.7 | 0.98 | 1.52 | 0.67 |
| P50-4 | 50 | 400 | 6.63 | 536.9 | 1.11 | 1.35 | 0.63 |
| P50-5 | 50 | 500 | 7.11 | 460.4 | 1.16 | 1.27 | 0.61 |
| P50-6 | 50 | 600 | 6.73 | 396.7 | 1.48 | 1.30 | 0.59 |
| P50-7 | 50 | 700 | 8.17 | 258.8 | 1.90 | 1.45 | 0.65 |
| P50-8 | 50 | 800 | 9.27 | 130.3 | 1.92 | 1.44 | 0.65 |
| P70-0 | 70 | 20 | - | 602.6 | 0.88 | 1.33 | 0.62 |
| P70-2 | 70 | 200 | 1.48 | 522.2 | 0.79 | 1.87 | 0.64 |
| P70-3 | 70 | 300 | 5.22 | 565.4 | 0.86 | 1.23 | 0.61 |
| P70-4 | 70 | 400 | 7.54 | 496.8 | 1.24 | 1.25 | 0.61 |
| P70-5 | 70 | 500 | 8.19 | 405.0 | 1.26 | 1.32 | 0.60 |
| P70-6 | 70 | 600 | 9.16 | 267.5 | 1.70 | 1.37 | 0.64 |
| P70-7 | 70 | 700 | 7.83 | 216.9 | 2.24 | 1.30 | 0.61 |
| P70-8 | 70 | 800 | 9.52 | 174.8 | 2.31 | 1.41 | 0.65 |
| P100-0 | 100 | 20 | - | 788.6 | 1.08 | 1.24 | 0.59 |
| P100-2 | 100 | 200 | 1.37 | 681.5 | 0.88 | 1.2 | 0.61 |
| P100-3 | 100 | 300 | 5.06 | 614.7 | 0.82 | 1.25 | 0.65 |
| P100-4 | 100 | 400 | 6.08 | 498.8 | 0.81 | 1.46 | 0.59 |
| P100-5 | 100 | 500 | 8.67 | 450.2 | 1.21 | 1.32 | 0.62 |
| P100-6 | 100 | 600 | 9.29 | 295.2 | 1.81 | 1.41 | 0.64 |
| P100-7 | 100 | 700 | 10.20 | 196.7 | 2.13 | 1.39 | 0.63 |
| P100-8 | 100 | 800 | 9.97 | 208.6 | 2.48 | 1.53 | 0.67 |
Note: r represents the replacement percentage, T represents the highest temperature experienced by the specimen, βm represents the mass loss ratio, Np represents the peak load, Δp represents the peak deformation, μ represents the displacement ductility coefficient, η represents the energy dissipation coefficient.
Table 3.
Design parameters and experimental results of steel reinforced recycled aggregate concrete (SRRAC) columns.
Table 3.
Design parameters and experimental results of steel reinforced recycled aggregate concrete (SRRAC) columns.
| Specimens Number | r/% | T/°C | βm/% | Np/kN | Δp/mm | μ | η |
|---|---|---|---|---|---|---|---|
| SRRAC0-20-1 | 0 | 20 | - | 1476.5 | 3.60 | 2.27 | 0.78 |
| SRRAC0-200 | 0 | 200 | 1.49 | 1199.8 | 2.40 | 1.75 | 0.70 |
| SRRAC0-300 | 0 | 300 | 3.92 | 1180.7 | 2.80 | 0.82 | 0.60 |
| SRRAC0-400 | 0 | 400 | 4.22 | 1166.5 | 3.00 | 1.27 | 0.62 |
| SRRAC0-500 | 0 | 500 | 5.06 | 991.3 | 4.10 | 1.71 | 0.74 |
| SRRAC0-600-1 | 0 | 600 | 5.64 | 933.7 | 4.20 | 1.68 | 0.70 |
| SRRAC0-700 | 0 | 700 | 5.86 | 835.1 | 5.20 | 1.73 | 0.70 |
| SRRAC0-800 | 0 | 800 | 6.40 | 729.5 | 6.00 | 1.76 | 0.69 |
| SRRAC30-20-1 | 30 | 20 | - | 1444.4 | 2.40 | 1.36 | 0.64 |
| SRRAC30-400 | 30 | 400 | 4.26 | 1130.9 | 3.40 | 1.90 | 0.73 |
| SRRAC30-600 | 30 | 600 | 5.83 | 949.1 | 5.00 | 1.84 | 0.74 |
| SRRAC30-800 | 30 | 800 | 6.67 | 734.3 | 6.00 | 0.89 | 0.61 |
| SRRAC70-20-1 | 70 | 20 | - | 1433.9 | 2.70 | 2.23 | 0.75 |
| SRRAC70-400 | 70 | 400 | 4.88 | 1262.4 | 2.30 | 1.21 | 0.58 |
| SRRAC70-600 | 70 | 600 | 5.92 | 970.7 | 4.30 | 1.53 | 0.68 |
| SRRAC70-800 | 70 | 800 | 7.87 | 702.9 | 6.80 | 1.02 | 0.63 |
| SRRAC100-20-1 | 100 | 20 | - | 1480.9 | 3.50 | 1.93 | 0.68 |
| SRRAC100-200 | 100 | 200 | 1.49 | 1195.6 | 3.00 | 1.92 | 0.71 |
| SRRAC100-300 | 100 | 300 | 5.05 | 1229.9 | 2.40 | 1.37 | 0.63 |
| SRRAC100-400 | 100 | 400 | 5.74 | 1287.9 | 3.05 | 1.21 | 0.59 |
| SRRAC100-500 | 100 | 500 | 6.66 | 1125.6 | 3.90 | 1.68 | 0.70 |
| SRRAC100-600-1 | 100 | 600 | 7.54 | 963.2 | 4.60 | 1.75 | 0.72 |
| SRRAC100-700 | 100 | 700 | 7.79 | 837.1 | 4.80 | 1.74 | 0.67 |
| SRRAC100-800 | 100 | 800 | 8.08 | 747.3 | 5.60 | 2.17 | 0.63 |
Table 4.
Design parameters and experimental results of reinforced recycled aggregate concrete (RRAC) columns.
Table 4.
Design parameters and experimental results of reinforced recycled aggregate concrete (RRAC) columns.
| Specimens Number | r/% | T/°C | βm/% | Np/kN | Δp/mm | μ | η |
|---|---|---|---|---|---|---|---|
| RRAC0-0 | 0 | 20 | - | 1372.0 | 2.20 | 1.23 | 0.67 |
| RRAC0-2 | 0 | 200 | 1.34 | 1128.1 | 2.02 | 1.17 | 0.62 |
| RRAC0-4 | 0 | 400 | 5.60 | 1273.4 | 1.98 | 1.54 | 0.85 |
| RRAC0-6 | 0 | 600 | 7.26 | 748.1 | 2.50 | 1.50 | 0.87 |
| RRAC0-8 | 0 | 800 | 8.22 | 478.2 | 3.56 | 1.75 | 0.86 |
| RRAC30-0 | 30 | 20 | - | 1454.0 | 2.10 | 1.28 | 0.74 |
| RRAC30-2 | 30 | 200 | 2.57 | 1034.2 | 1.62 | 1.23 | 0.67 |
| RRAC30-4 | 30 | 400 | 5.26 | 1047.2 | 1.75 | 1.46 | 0.80 |
| RRAC30-6 | 30 | 600 | 7.64 | 757.5 | 3.69 | 1.89 | 0.88 |
| RRAC30-8 | 30 | 800 | 8.57 | 428.4 | 3.32 | 1.52 | 0.83 |
| RRAC50-0 | 50 | 20 | - | 1469.0 | 1.91 | 1.56 | 0.75 |
| RRAC50-2 | 50 | 200 | 3.95 | 1172.9 | 2.07 | 1.10 | 0.60 |
| RRAC50-4 | 50 | 400 | 5.39 | 1152.3 | 2.04 | 1.46 | 0.84 |
| RRAC50-6 | 50 | 600 | 8.08 | 784.6 | 3.21 | 1.93 | 0.85 |
| RRAC50-8 | 50 | 800 | 8.75 | 423.2 | 4.33 | 1.83 | 0.87 |
| RRAC70-0 | 70 | 20 | - | 1613.0 | 2.09 | 1.22 | 0.66 |
| RRAC70-2 | 70 | 200 | 1.36 | 1117.1 | 1.71 | 1.09 | 0.60 |
| RRAC70-4 | 70 | 400 | 6.67 | 1233.2 | 1.89 | 1.16 | 0.61 |
| RRAC70-6 | 70 | 600 | 9.07 | 755.6 | 4.49 | 1.41 | 0.80 |
| RRAC70-8 | 70 | 800 | 9.60 | 410.6 | 5.07 | 1.59 | 0.86 |
| RRAC100-0 | 100 | 20 | - | 1702.5 | 1.95 | 1.18 | 0.63 |
| RRAC100-2 | 100 | 200 | 1.15 | 1284.2 | 1.77 | 1.07 | 0.58 |
| RRAC100-4 | 100 | 400 | 6.72 | 1268.6 | 1.86 | 1.01 | 0.57 |
| RRAC100-6 | 100 | 600 | 9.82 | 794.0 | 4.35 | 1.46 | 0.82 |
| RRAC100-8 | 100 | 800 | 10.2 | 417.3 | 4.65 | 1.26 | 0.85 |
Table 5.
Design parameters and experimental results of SRRAC beams.
| Specimens Number | Shear Span Ratio | r/% | T/°C | βm/% | Np/kN | Δp/mm | μ | η |
|---|---|---|---|---|---|---|---|---|
| SRCMB0-0 | 2.0 | 0 | 20 | - | 249.5 | 4.06 | 3.01 | 0.82 |
| SRCMB0-2 | 2.0 | 0 | 200 | 0.32 | 255.4 | 3.39 | 2.36 | 0.77 |
| SRCMB0-4 | 2.0 | 0 | 400 | 3.77 | 234.0 | 4.37 | 2.50 | 0.8 |
| SRCMB0-6 | 2.0 | 0 | 600 | 5.81 | 188.4 | 4.67 | 3.83 | 0.86 |
| SRCMB30-0 | 2.0 | 30 | 20 | - | 257.2 | 5.75 | 5.31 | 0.89 |
| SRCMB30-2 | 2.0 | 30 | 200 | 0.62 | 230.0 | 4.76 | 4.89 | 0.89 |
| SRCMB30-4 | 2.0 | 30 | 400 | 4.47 | 227.6 | 3.50 | 2.34 | 0.77 |
| SRCMB30-6 | 2.0 | 30 | 600 | 6.61 | 194.5 | 5.85 | 3.29 | 0.81 |
| SRCMB70-0 | 2.0 | 70 | 20 | - | 255.3 | 7.11 | 7.23 | 0.91 |
| SRCMB70-2 | 2.0 | 70 | 200 | 0.88 | 237.9 | 5.15 | 5.52 | 0.89 |
| SRCMB70-4 | 2.0 | 70 | 400 | 4.19 | 242.7 | 5.64 | 2.99 | 0.83 |
| SRCMB70-6 | 2.0 | 70 | 600 | 7.12 | 202.8 | 6.95 | 3.32 | 0.83 |
| SRCMB100-0 | 2.0 | 100 | 20 | - | 256.7 | 2.99 | 2.16 | 0.76 |
| SRCMB100-2 | 2.0 | 100 | 200 | 0.72 | 263.0 | 4.80 | 2.55 | 0.79 |
| SRCMB100-4 | 2.0 | 100 | 400 | 4.66 | 248.0 | 4.90 | 2.13 | 0.76 |
| SRCMB100-6 | 2.0 | 100 | 600 | 7.91 | 170.0 | 4.71 | 2.11 | 0.76 |
| SRCSB0-0 | 1.2 | 0 | 20 | - | 336.9 | 2.23 | 2.51 | 0.79 |
| SRCSB0-2 | 1.2 | 0 | 200 | 0.28 | 360.1 | 2.07 | 2.52 | 0.78 |
| SRCSB0-4 | 1.2 | 0 | 400 | 4.03 | 317.1 | 2.73 | 1.62 | 0.68 |
| SRCSB0-6 | 1.2 | 0 | 600 | 5.67 | 250.0 | 4.24 | 2.35 | 0.78 |
| SRCSB30-0 | 1.2 | 30 | 20 | - | 398.4 | 2.89 | 2.37 | 0.77 |
| SRCSB30-2 | 1.2 | 30 | 200 | 0.9 | 364.4 | 3.33 | 2.73 | 0.8 |
| SRCSB30-4 | 1.2 | 30 | 400 | 4.37 | 368.0 | 3.49 | 1.68 | 0.7 |
| SRCSB30-6 | 1.2 | 30 | 600 | 6.78 | 266.0 | 5.21 | 3.10 | 0.84 |
| SRCSB70-0 | 1.2 | 70 | 20 | - | 357.7 | 3.08 | 2.42 | 0.77 |
| SRCSB70-2 | 1.2 | 70 | 200 | 0.86 | 350.9 | 4.14 | 2.46 | 0.79 |
| SRCSB70-4 | 1.2 | 70 | 400 | 3.96 | 362.7 | 3.34 | 1.84 | 0.73 |
| SRCSB70-6 | 1.2 | 70 | 600 | 7.18 | 272.0 | 3.74 | 2.60 | 0.79 |
| SRCSB100-0 | 1.2 | 100 | 20 | - | 400.0 | 2.88 | 2.81 | 0.78 |
| SRCSB100-2 | 1.2 | 100 | 200 | 0.47 | 375.5 | 3.11 | 1.36 | 0.63 |
| SRCSB100-4 | 1.2 | 100 | 400 | 4.83 | 336.0 | 3.00 | 1.84 | 0.71 |
| SRCSB100-6 | 1.2 | 100 | 600 | 7.81 | 247.0 | 3.75 | 2.50 | 0.77 |
Table 6.
Design parameters and experimental results of RRAC beams.
| Specimens Number | Shear Span Ratio | r/% | T/°C | βm/% | Np/kN | Δp/mm | μ | η |
|---|---|---|---|---|---|---|---|---|
| RRACB-0-20-1 | 2.0 | 0 | 20 | - | 102.5 | 6.88 | 2.09 | 0.85 |
| RRACB-0-200-1 | 2.0 | 0 | 200 | 0.89 | 106.0 | 5.16 | 1.67 | 0.70 |
| RRACB-0-400-1 | 2.0 | 0 | 400 | 3.77 | 114.2 | 5.98 | 3.40 | 0.86 |
| RRACB-0-600-1 | 2.0 | 0 | 600 | 6.40 | 84.6 | 3.61 | 2.87 | 0.83 |
| RRACB-30-20-1 | 2.0 | 30 | 20 | - | 92.6 | 8.12 | 4.29 | 0.89 |
| RRACB-30-200-1 | 2.0 | 30 | 200 | 0.49 | 97.2 | 7.66 | 3.66 | 0.86 |
| RRACB-30-400-1 | 2.0 | 30 | 400 | 4.74 | 113.0 | 3.88 | 2.12 | 0.77 |
| RRACB-30-600-1 | 2.0 | 30 | 600 | 6.63 | 79.1 | 5.15 | 3.34 | 0.85 |
| RRACB-70-20-1 | 2.0 | 70 | 20 | - | 113.0 | 7.51 | 3.44 | 0.86 |
| RRACB-70-200-1 | 2.0 | 70 | 200 | 0.44 | 110.0 | 8.52 | 3.90 | 0.87 |
| RRACB-70-400-1 | 2.0 | 70 | 400 | 5.83 | 128.0 | 6.35 | 2.64 | 0.81 |
| RRACB-70-600-1 | 2.0 | 70 | 600 | 8.18 | 89.2 | 7.23 | 3.00 | 0.58 |
| RRACB-100-20-1 | 2.0 | 100 | 20 | - | 132.9 | 9.80 | 2.84 | 0.82 |
| RRACB-100-200-1 | 2.0 | 100 | 200 | 0.56 | 120.3 | 6.69 | 3.46 | 0.85 |
| RRACB-100-400-1 | 2.0 | 100 | 400 | 4.91 | 120.0 | 6.30 | 3.10 | 0.75 |
| RRACB-100-600-1 | 2.0 | 100 | 600 | 8.76 | 106.0 | 6.70 | 3.05 | 0.82 |
| RRACB-0-20-2 | 1.2 | 0 | 20 | - | 210.0 | 7.39 | 3.34 | 0.84 |
| RRACB-0-200-2 | 1.2 | 0 | 200 | 0.48 | 180.0 | 1.47 | 1.66 | 0.82 |
| RRACB-0-400-2 | 1.2 | 0 | 400 | 4.57 | 142.0 | 1.73 | 1.71 | 0.79 |
| RRACB-0-600-2 | 1.2 | 0 | 600 | 6.46 | 124.0 | 1.88 | 1.54 | 0.68 |
| RRACB-30-20-2 | 1.2 | 30 | 20 | - | 211.3 | 4.63 | 2.14 | 0.77 |
| RRACB-30-200-2 | 1.2 | 30 | 200 | 0.86 | 192.3 | 2.50 | 2.06 | 0.76 |
| RRACB-30-400-2 | 1.2 | 30 | 400 | 4.73 | 177.0 | 1.84 | 1.75 | 0.72 |
| RRACB-30-600-2 | 1.2 | 30 | 600 | 6.83 | 115.0 | 1.37 | 1.56 | 0.68 |
| RRACB-70-20-2 | 1.2 | 70 | 20 | - | 207.0 | 6.82 | 4.74 | 0.89 |
| RRACB-70-200-2 | 1.2 | 70 | 200 | 0.55 | 210.0 | 4.87 | 3.65 | 0.87 |
| RRACB-70-400-2 | 1.2 | 70 | 400 | 5.41 | 196.0 | 1.90 | 1.44 | 0.65 |
| RRACB-70-600-2 | 1.2 | 70 | 600 | 8.49 | 122.0 | 2.27 | 1.77 | 0.72 |
| RRACB-100-20-2 | 1.2 | 100 | 20 | - | 230.0 | 16.02 | 3.44 | 0.86 |
| RRACB-100-200-2 | 1.2 | 100 | 200 | 0.69 | 200.0 | 4.57 | 3.05 | 0.84 |
| RRACB-100-400-2 | 1.2 | 100 | 400 | 3.92 | 178.0 | 1.54 | 1.77 | 0.72 |
| RRACB-100-600-2 | 1.2 | 100 | 600 | 7.59 | 109.5 | 2.28 | 1.44 | 0.65 |
© 2019 by the authors. Licensee MDPI, Basel, Switzerland. This article is an open access article distributed under the terms and conditions of the Creative Commons Attribution (CC BY) license (http://creativecommons.org/licenses/by/4.0/).
Share and Cite
MDPI and ACS Style
Chen, Z.; Zhou, J.; Ye, P.; Liang, Y. Analysis on Mechanical Properties of Recycled Aggregate Concrete Members after Exposure to High Temperatures. Appl. Sci. 2019, 9, 2057. https://doi.org/10.3390/app9102057
AMA Style
Chen Z, Zhou J, Ye P, Liang Y. Analysis on Mechanical Properties of Recycled Aggregate Concrete Members after Exposure to High Temperatures. Applied Sciences. 2019; 9(10):2057. https://doi.org/10.3390/app9102057
Chicago/Turabian StyleChen, Zongping, Ji Zhou, Peihuan Ye, and Ying Liang. 2019. "Analysis on Mechanical Properties of Recycled Aggregate Concrete Members after Exposure to High Temperatures" Applied Sciences 9, no. 10: 2057. https://doi.org/10.3390/app9102057
Note that from the first issue of 2016, this journal uses article numbers instead of page numbers. See further details here.