An Investigation of the Effects of Changes in the Indoor Ambient Temperature on Arousal Level, Thermal Comfort, and Physiological Indices †

Abstract
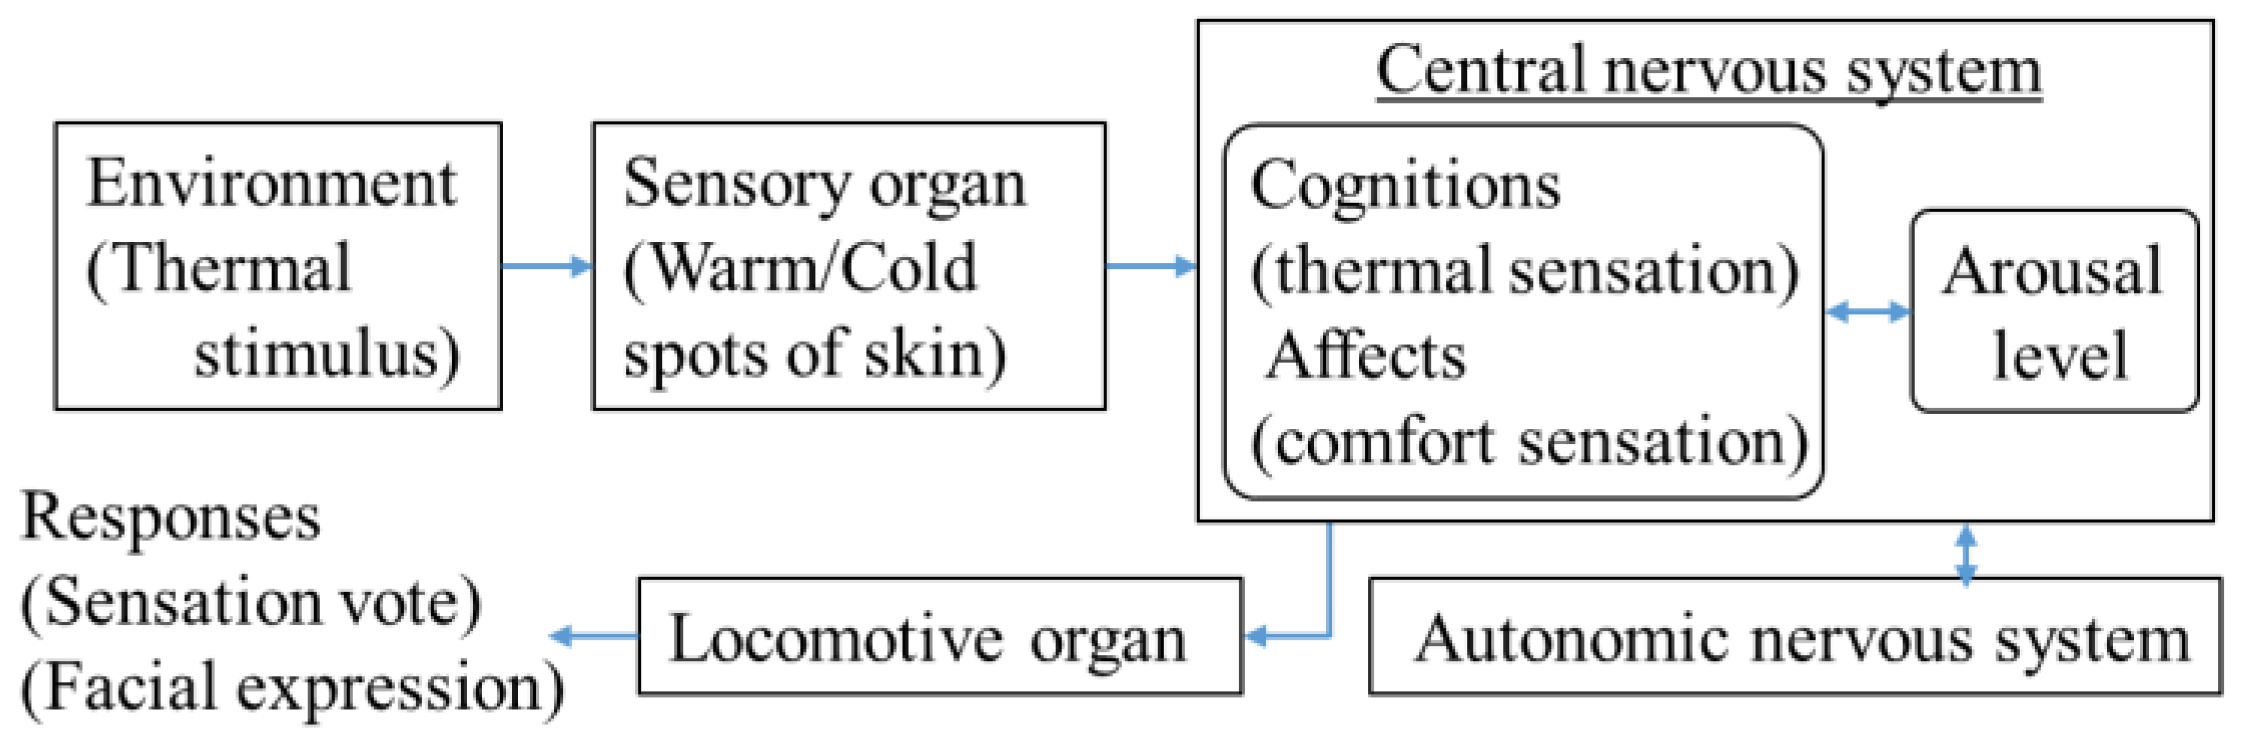
:1. Introduction
2. Strategy
2.1. Investigation of the Effects of Changes in the Indoor Ambient Temperature on Arousal Levels, Thermal Comfort, and Task Performance
2.2. Investigation of the Relation between the Subjective Evaluation Value and Physiological Parameters, and a Recommendation for Evaluation Indices
3. Methodology
3.1. Subjects
3.2. Experimental Task
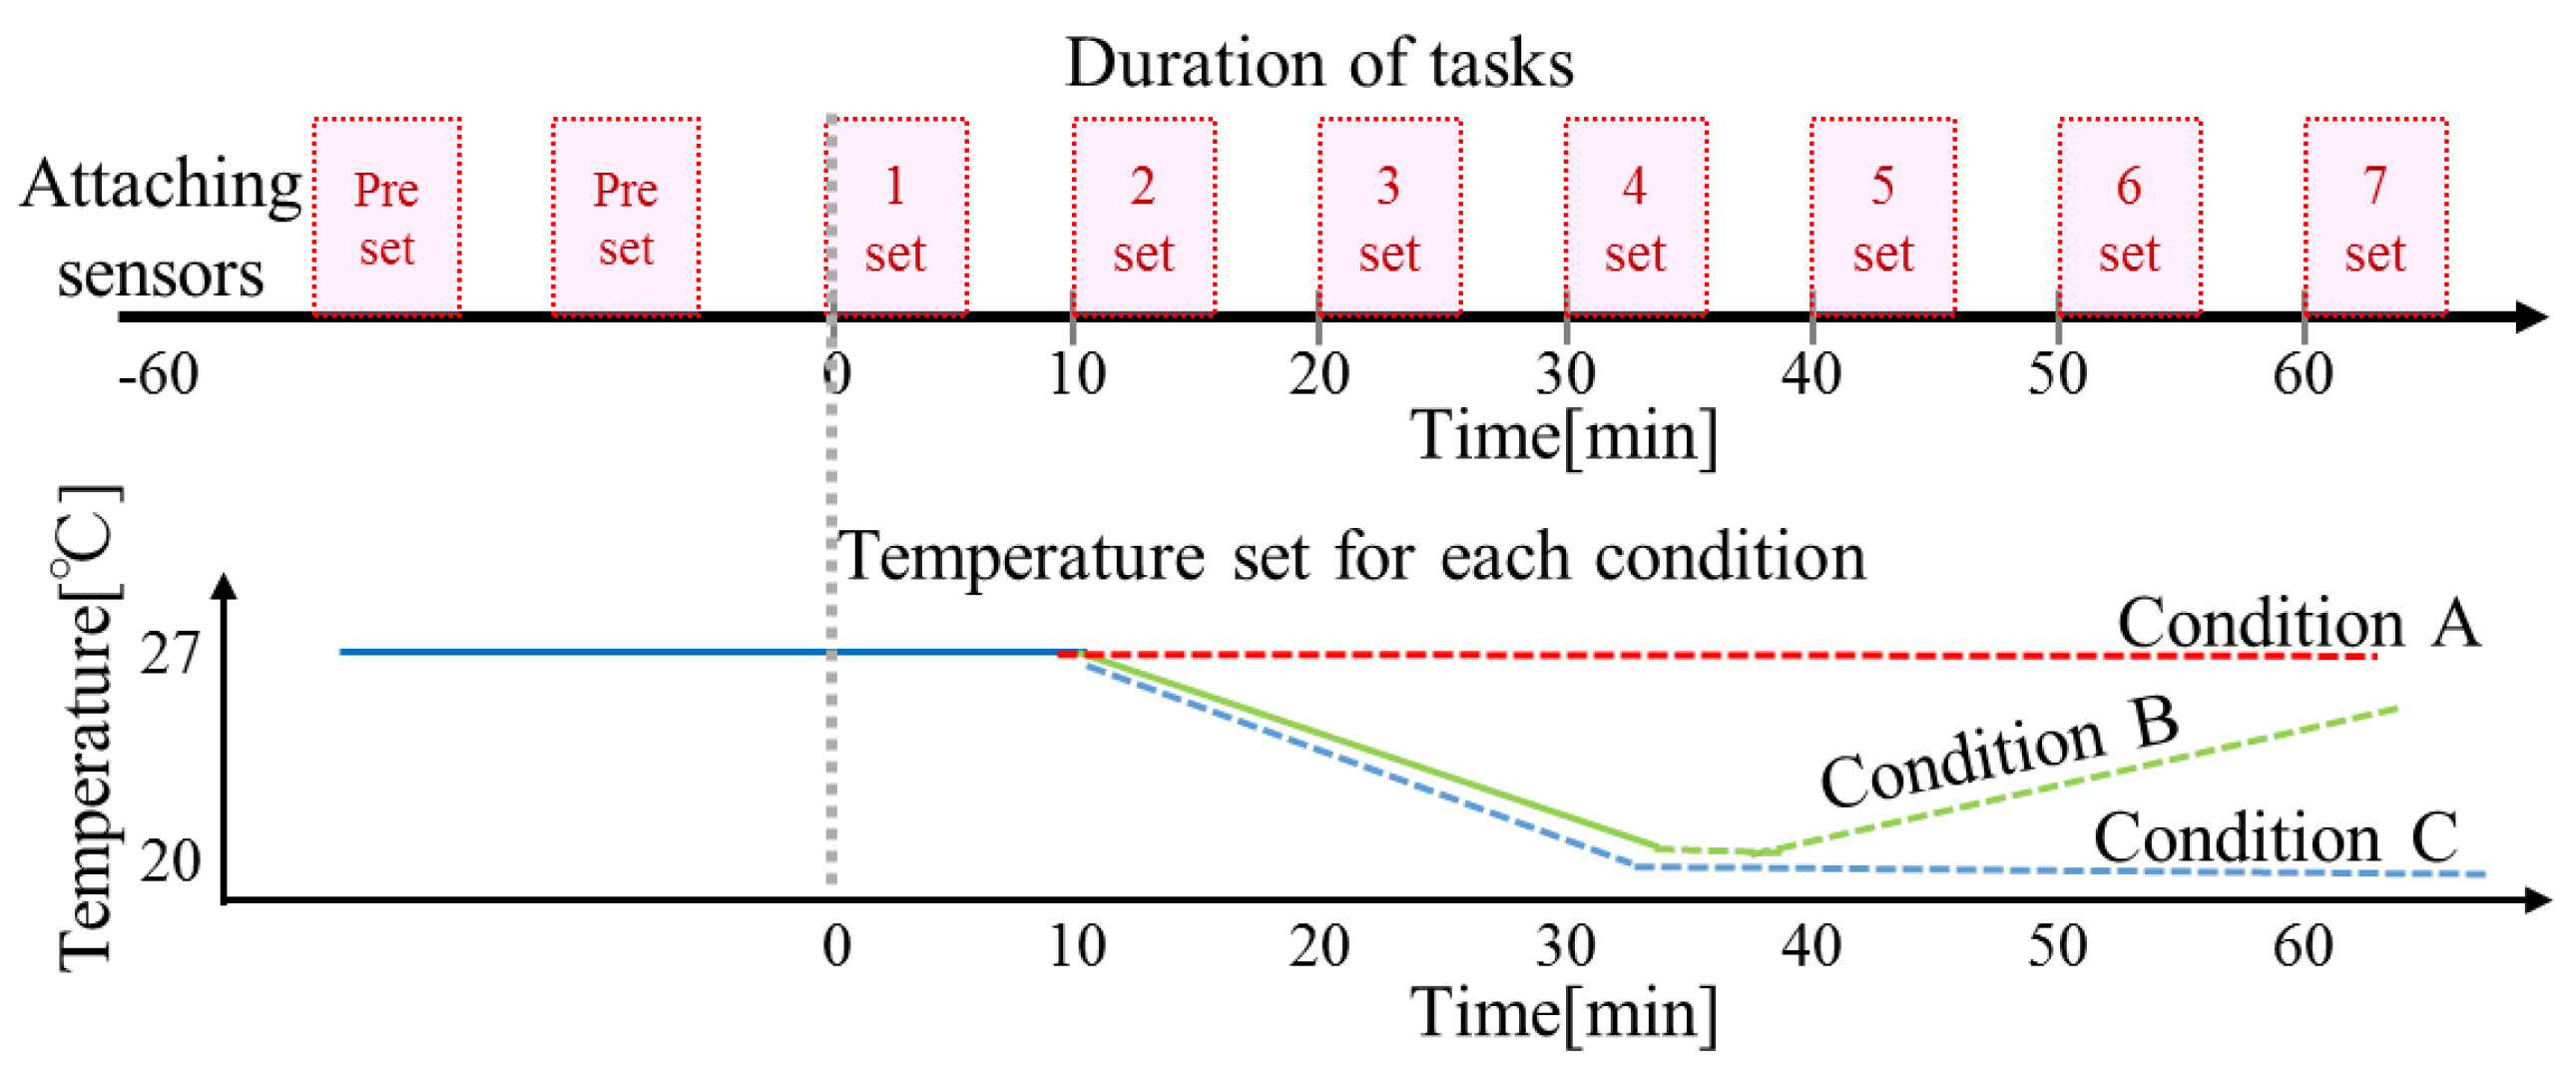
3.3. Experimental Conditions and Experimental Procedure
- Condition A: The indoor ambient temperature was maintained at 27 °C.
- Condition B: The indoor ambient temperature was decreased from 27 °C to 20 °C, and then increased from 20 °C to 27 °C.
- Condition C: The indoor ambient temperature was decreased from 27 °C to 20 °C, and then maintained at 20 °C.
3.4. Measurement
3.4.1. Subjective Evaluation of the Drowsiness Level and the Thermal Comfort Sensation
3.4.2. Physiological Indices
3.4.3. Facial Expression and Task Performance
4. Results and Discussion
4.1. Characteristics of the Arousal Level and Thermal Comfort Corresponding to Changes in the Indoor Ambient Temperature
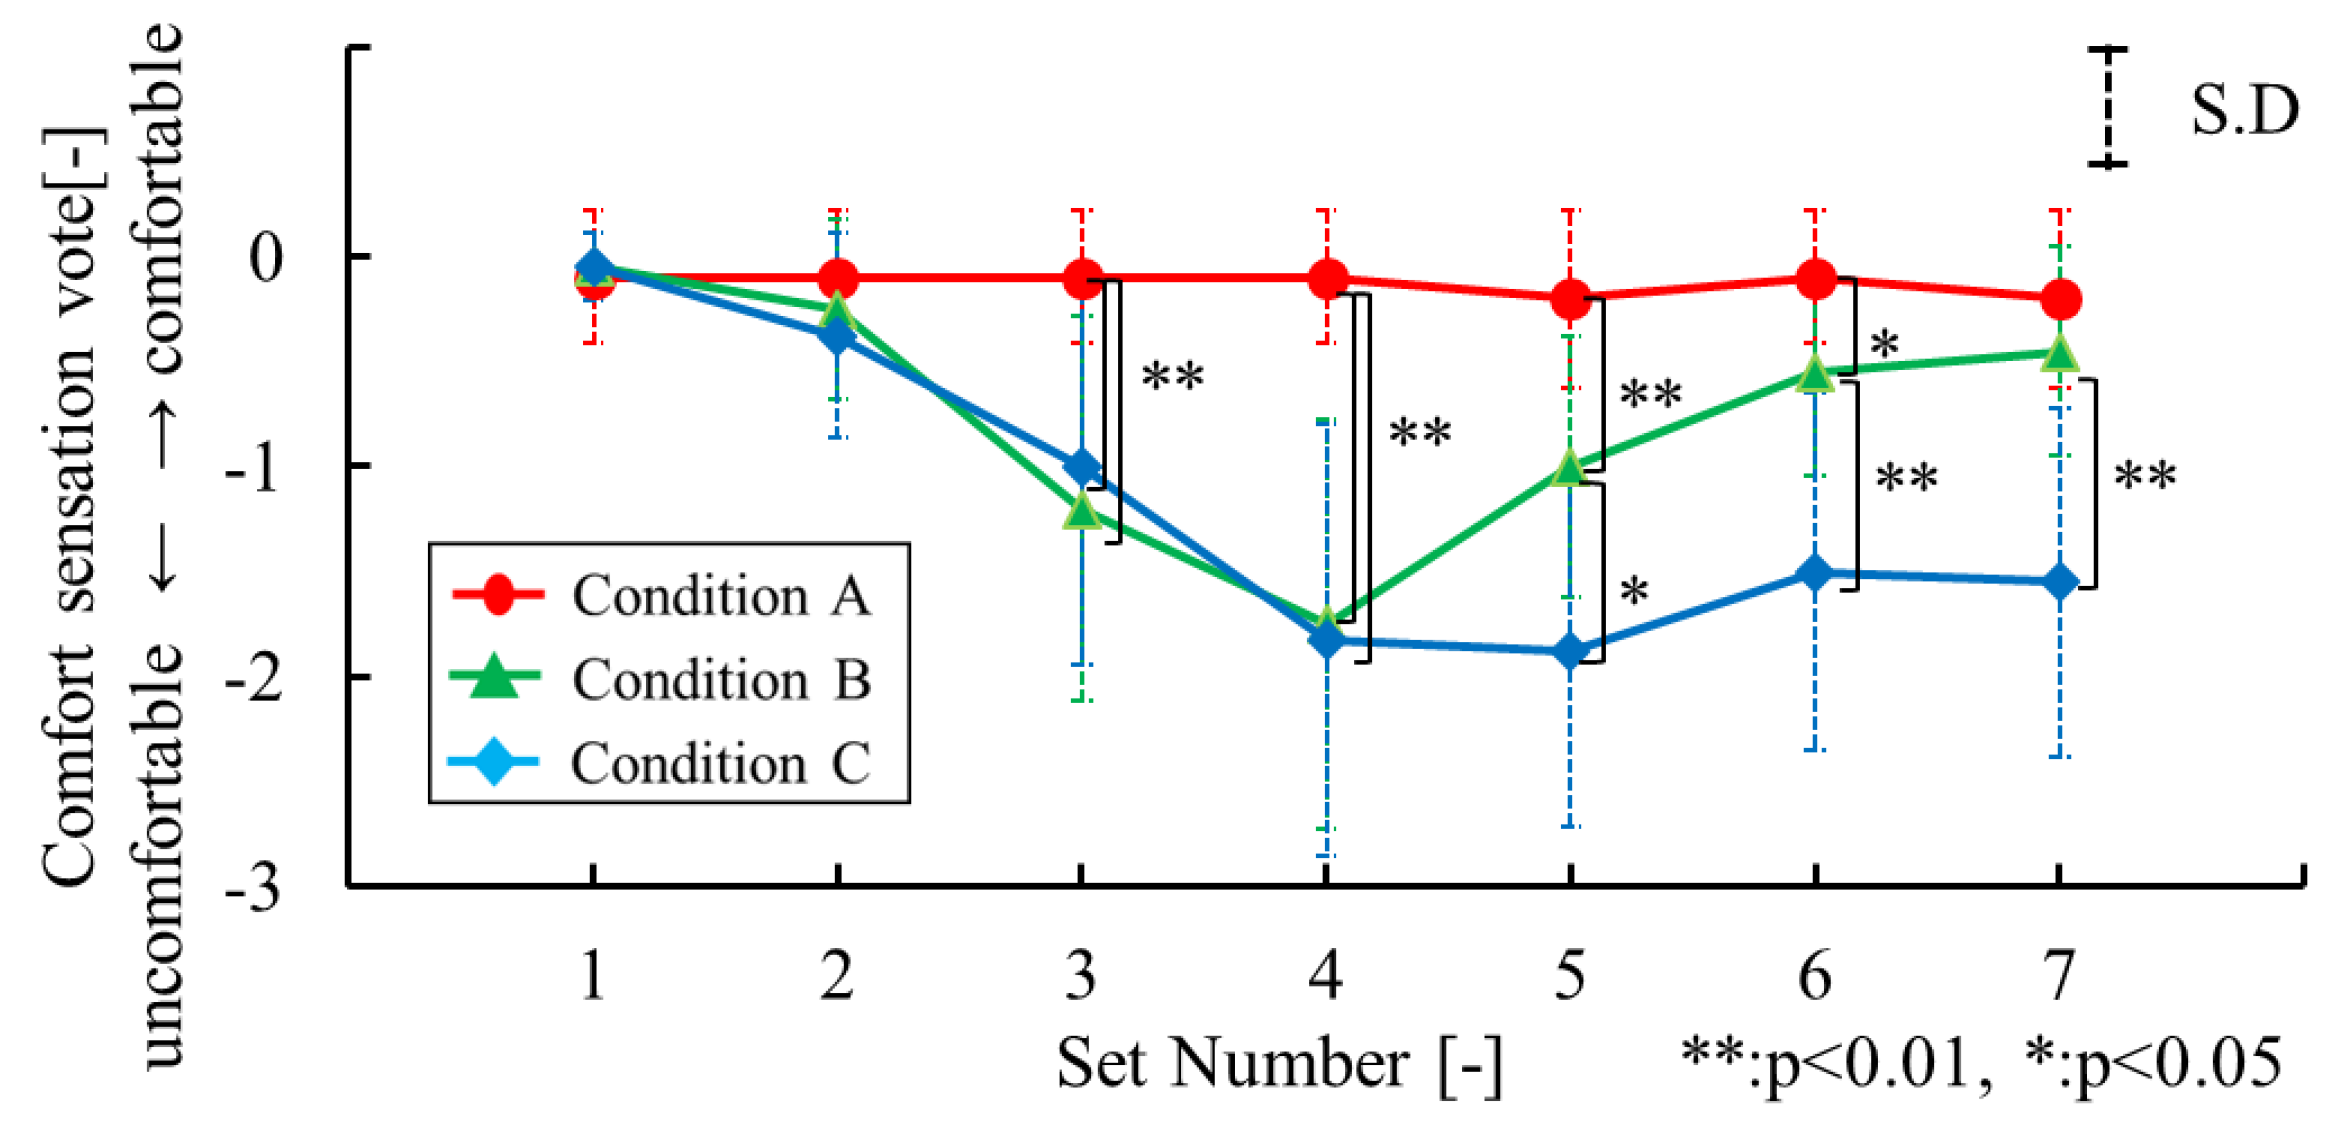
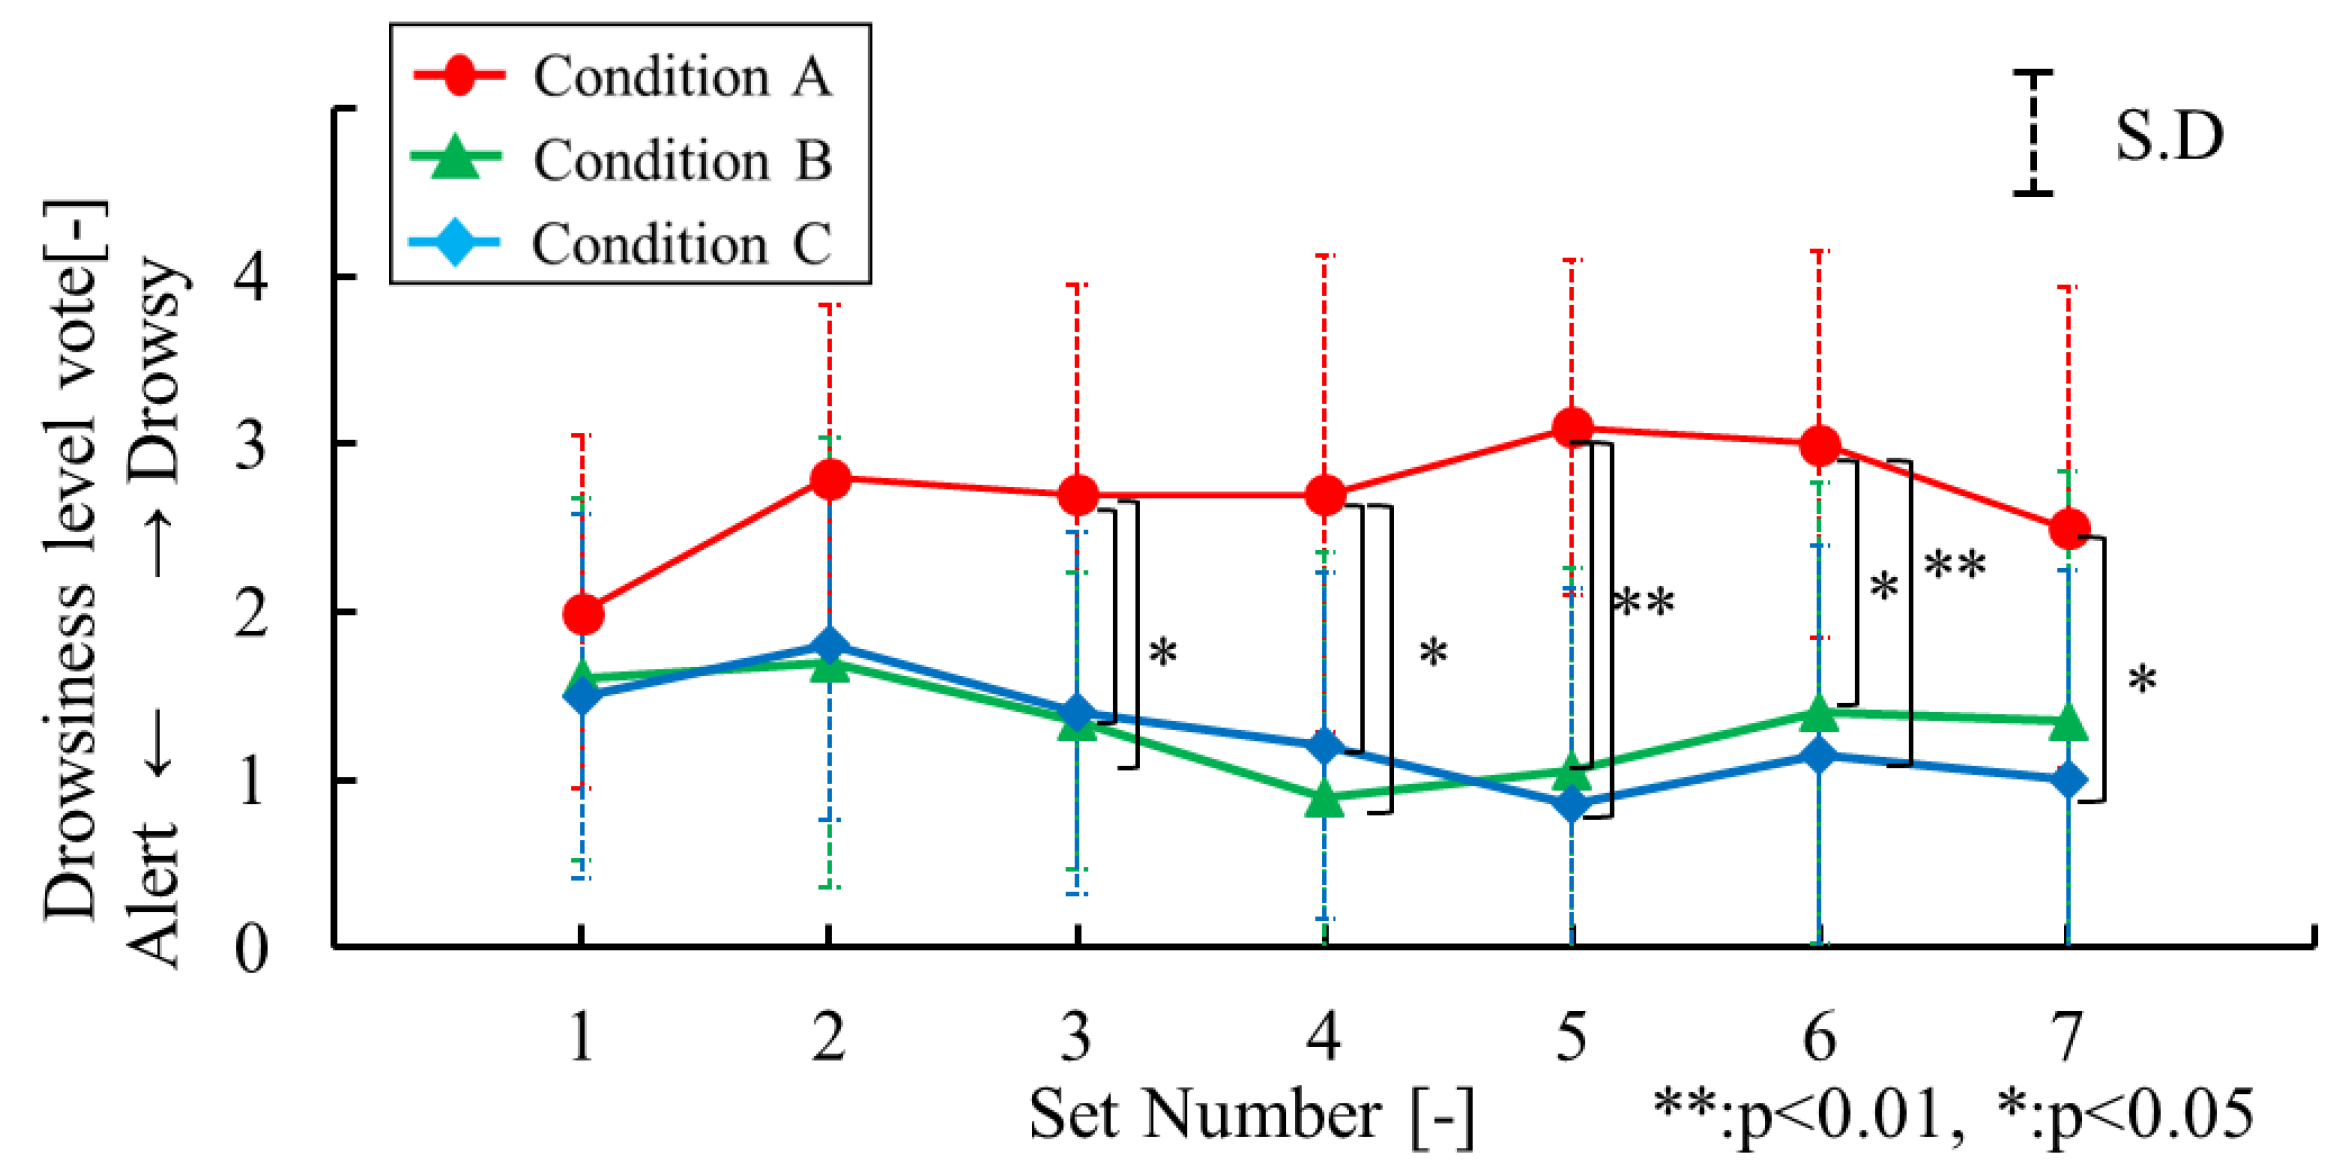
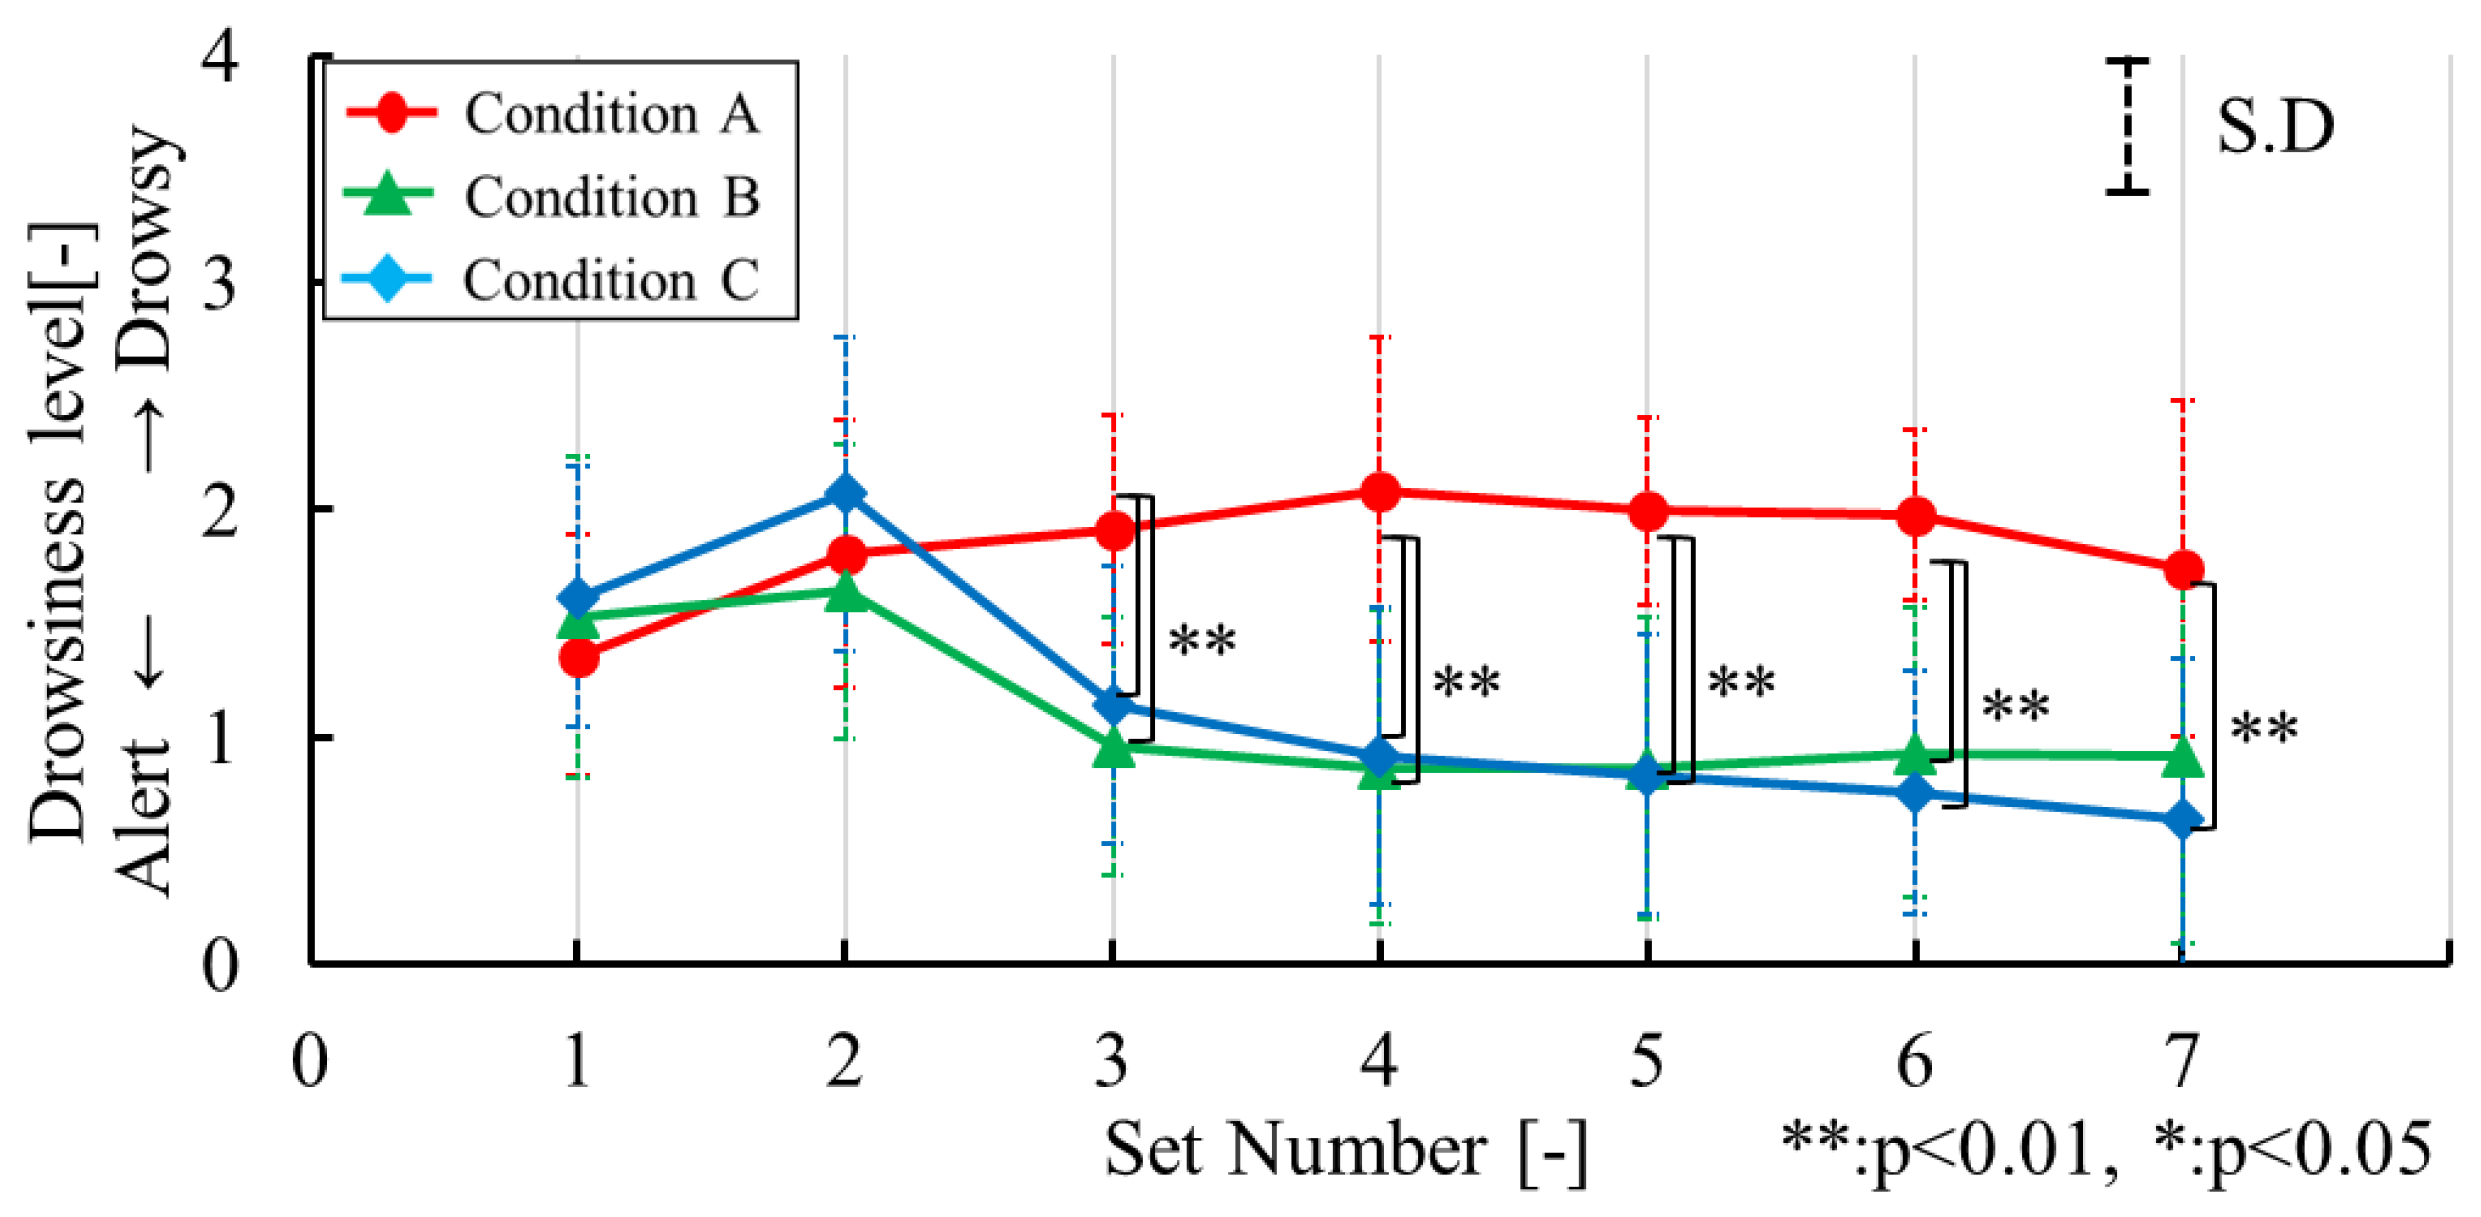
4.1.1. Subjective Evaluation Value
4.1.2. Rating Value of Zilberg’s Drowsiness Level by Observer
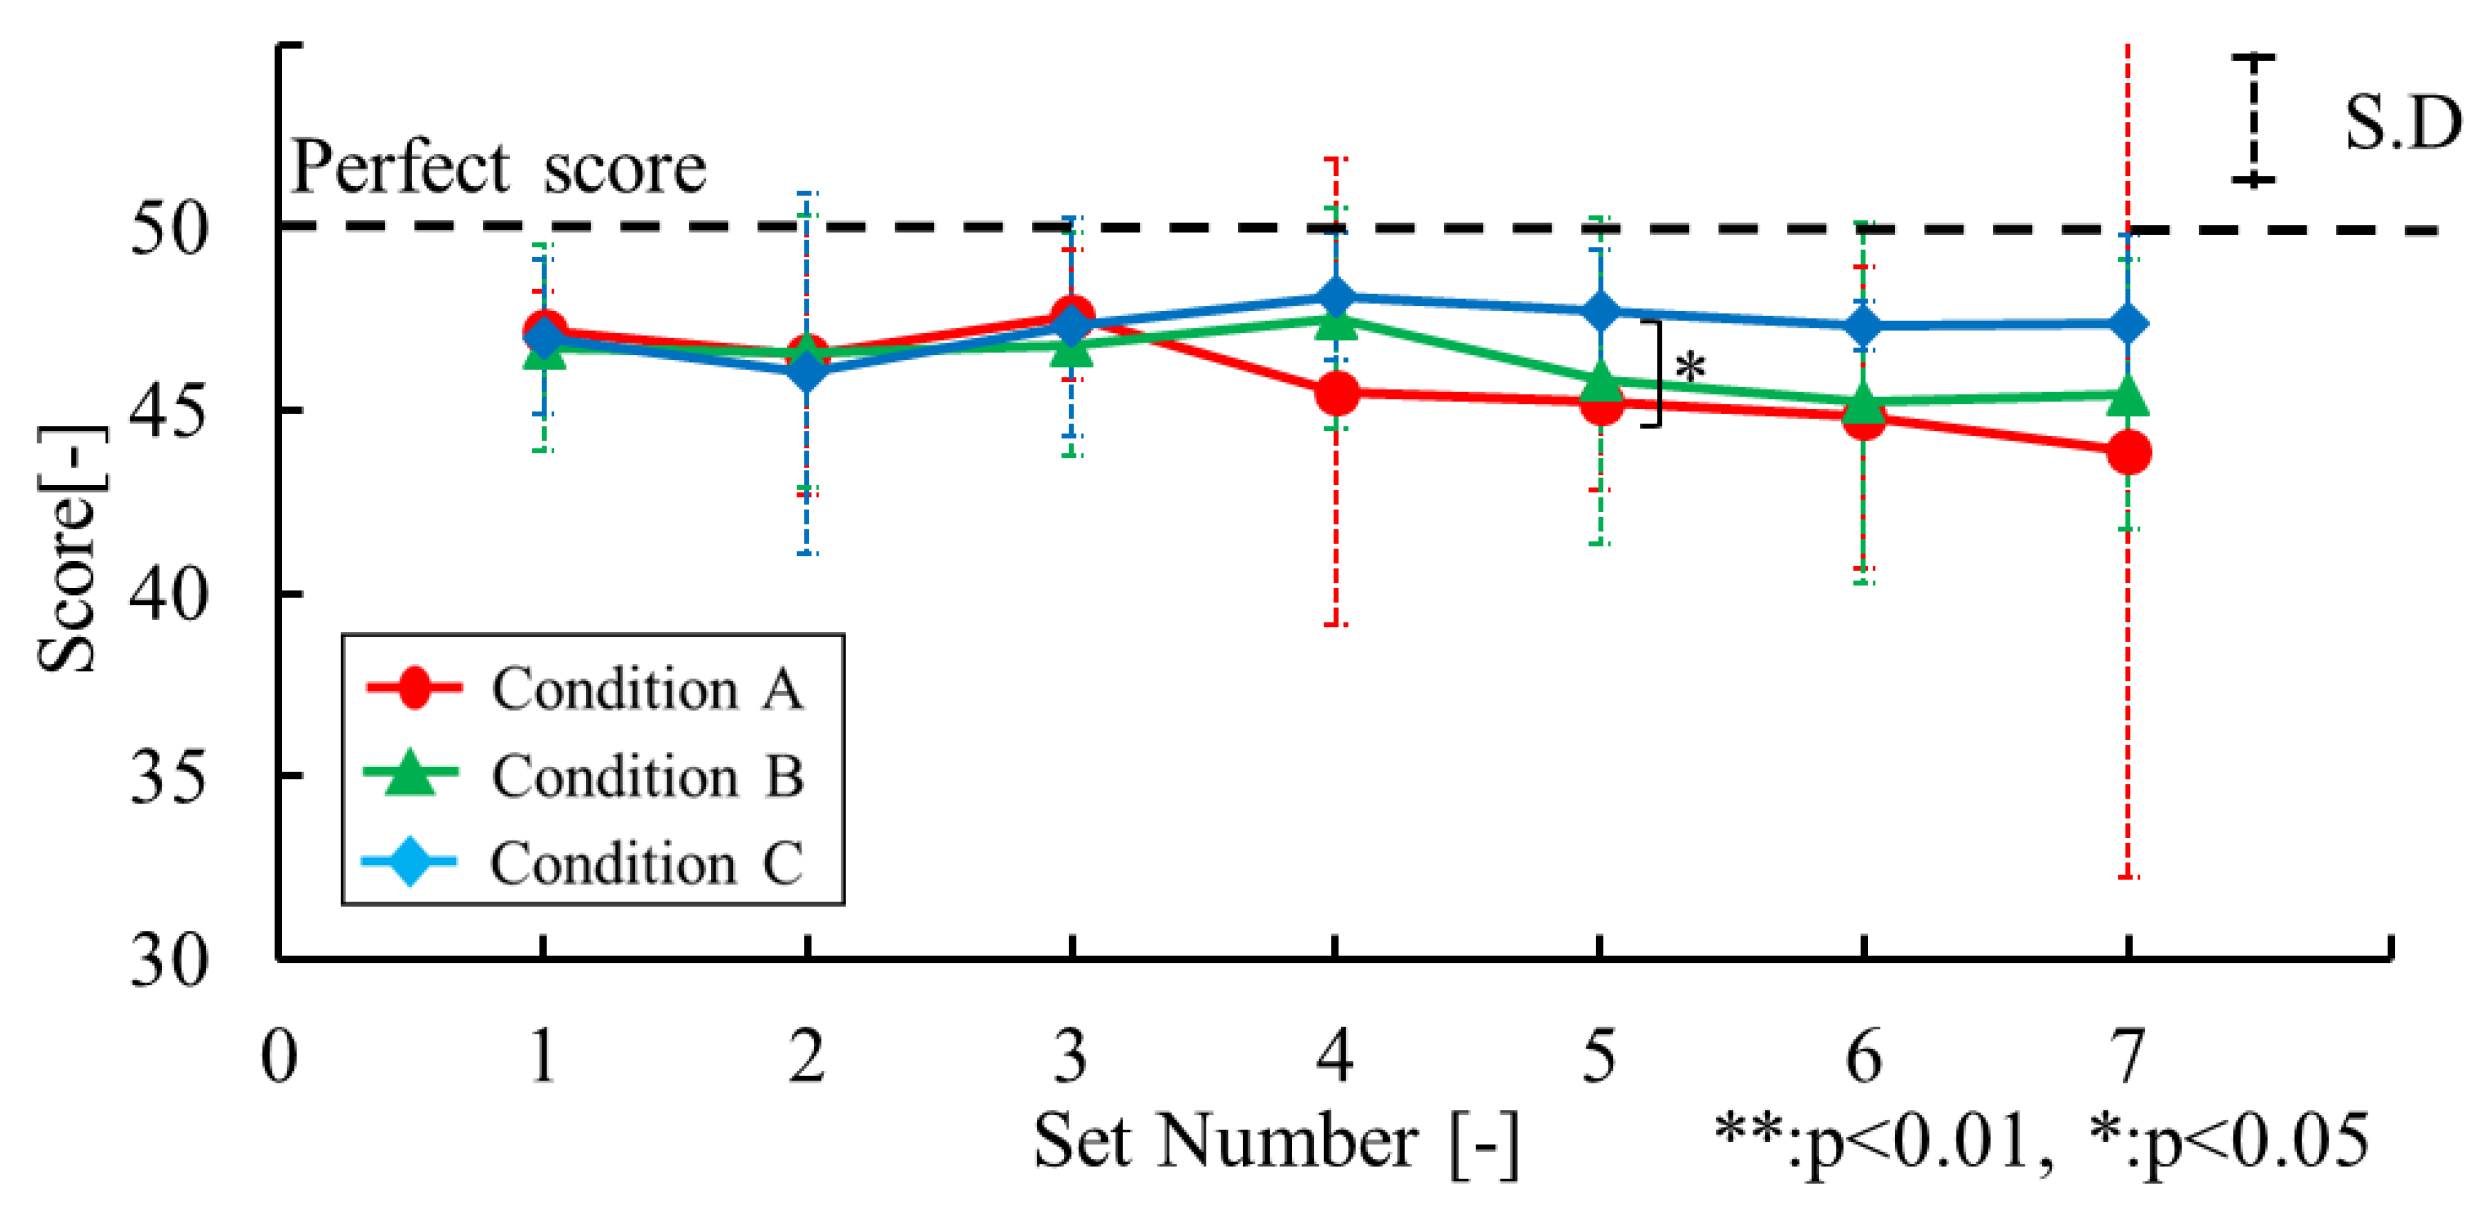
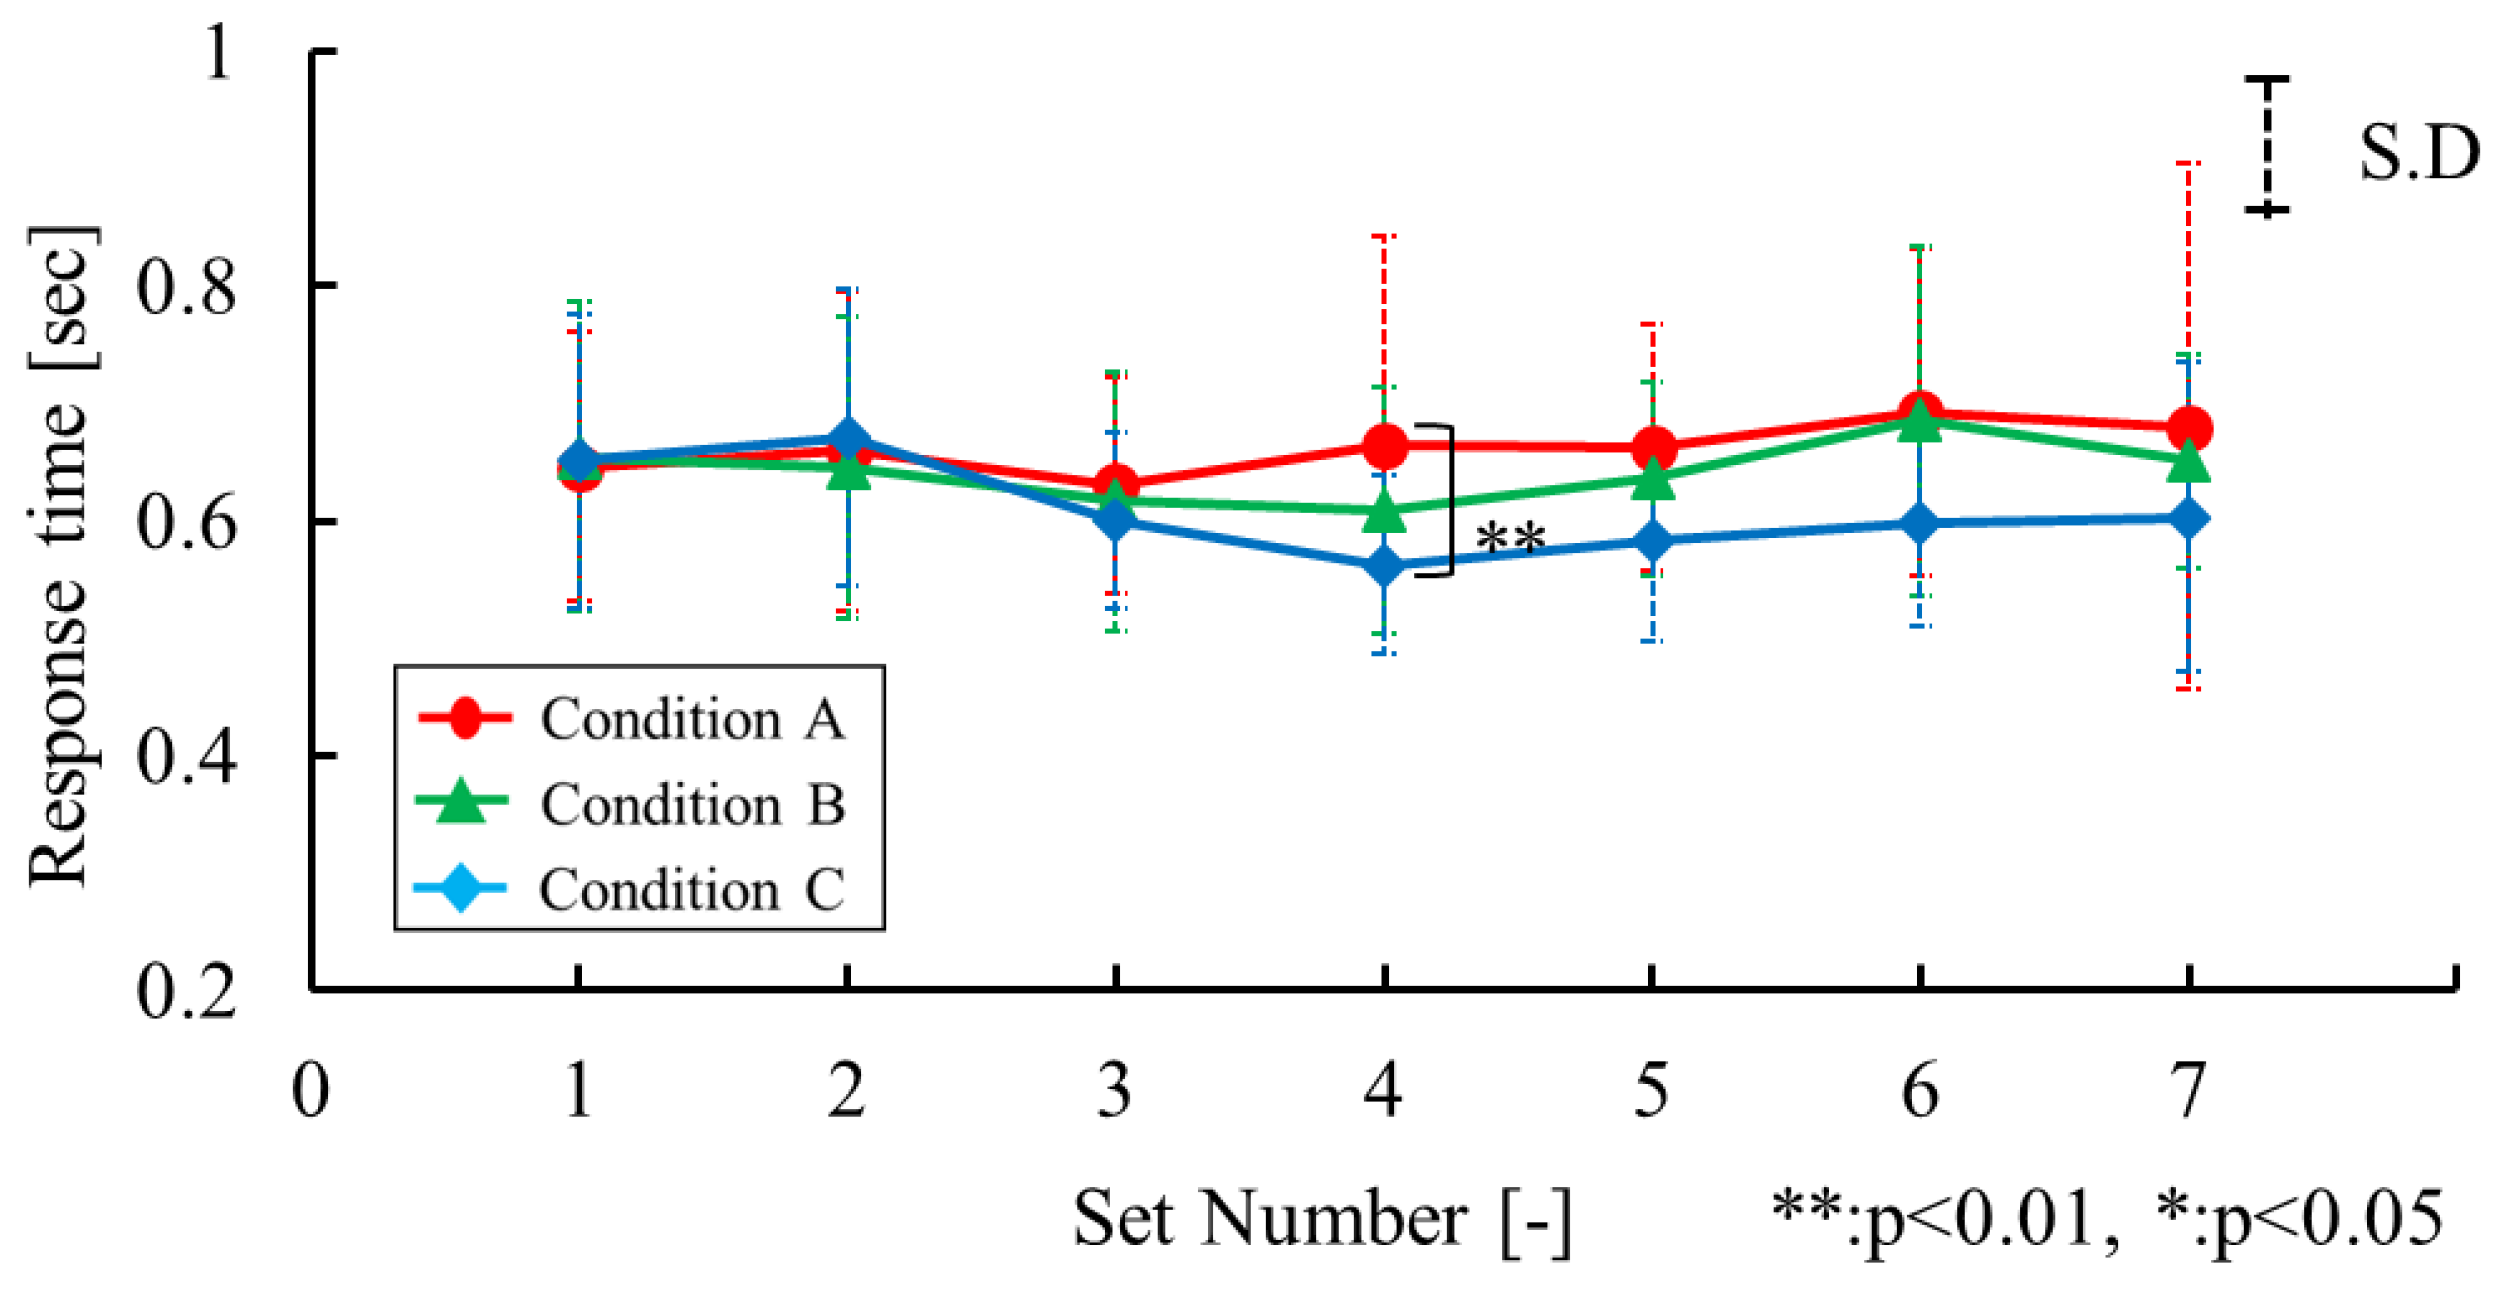
4.1.3. Task Performance of MATH
4.1.4. Consideration of Thermal Stimulation for High Arousal Levels
4.2. Relationship between the Subjective Evaluation Value and Physiological Indices
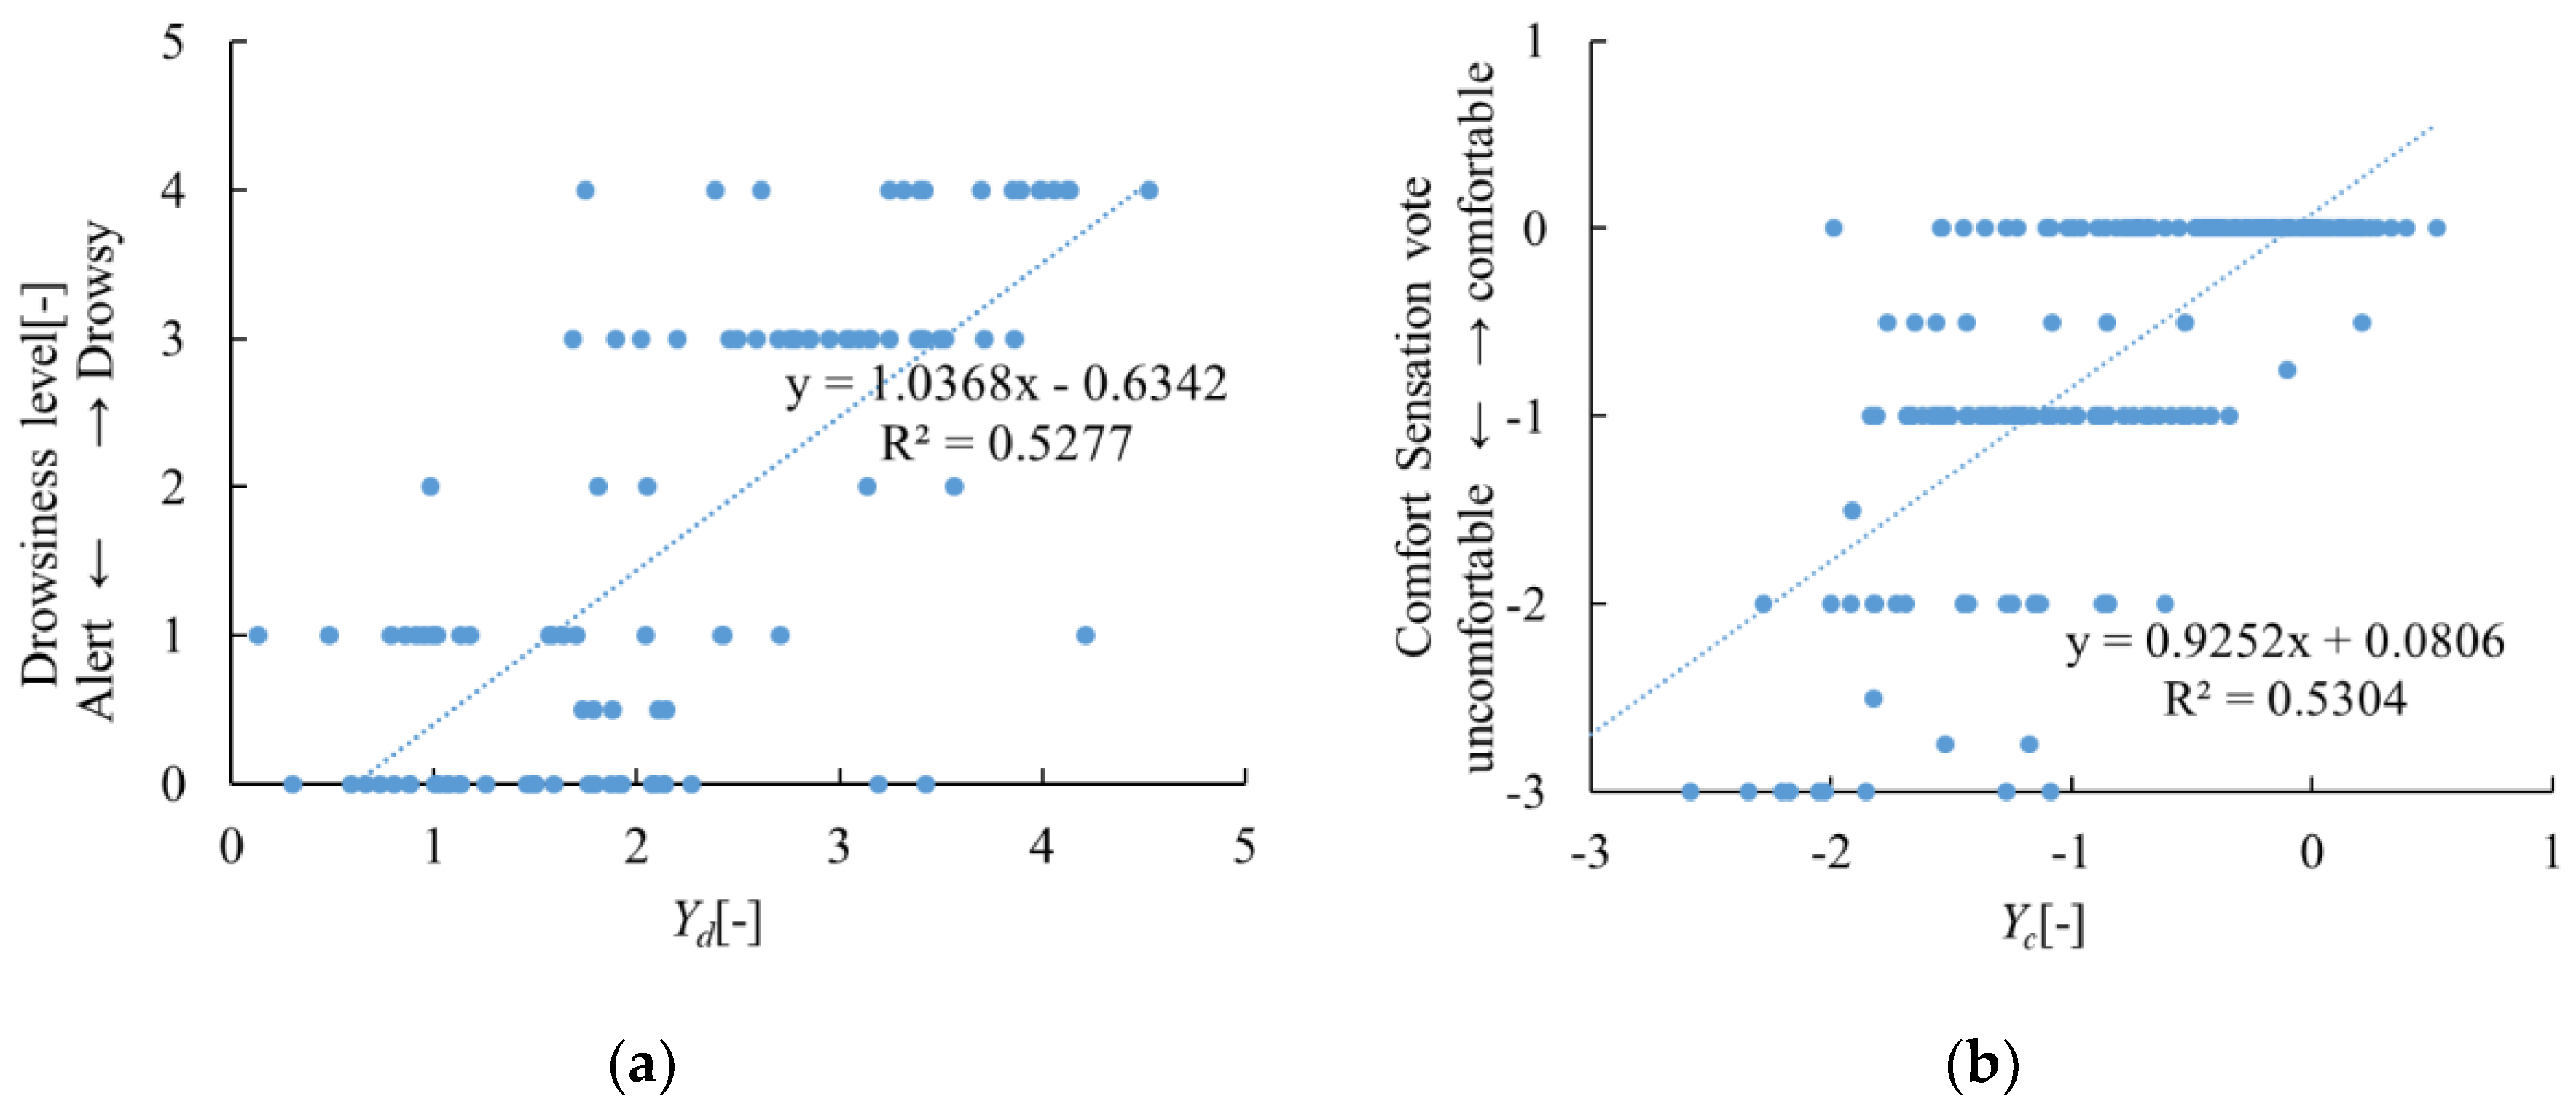
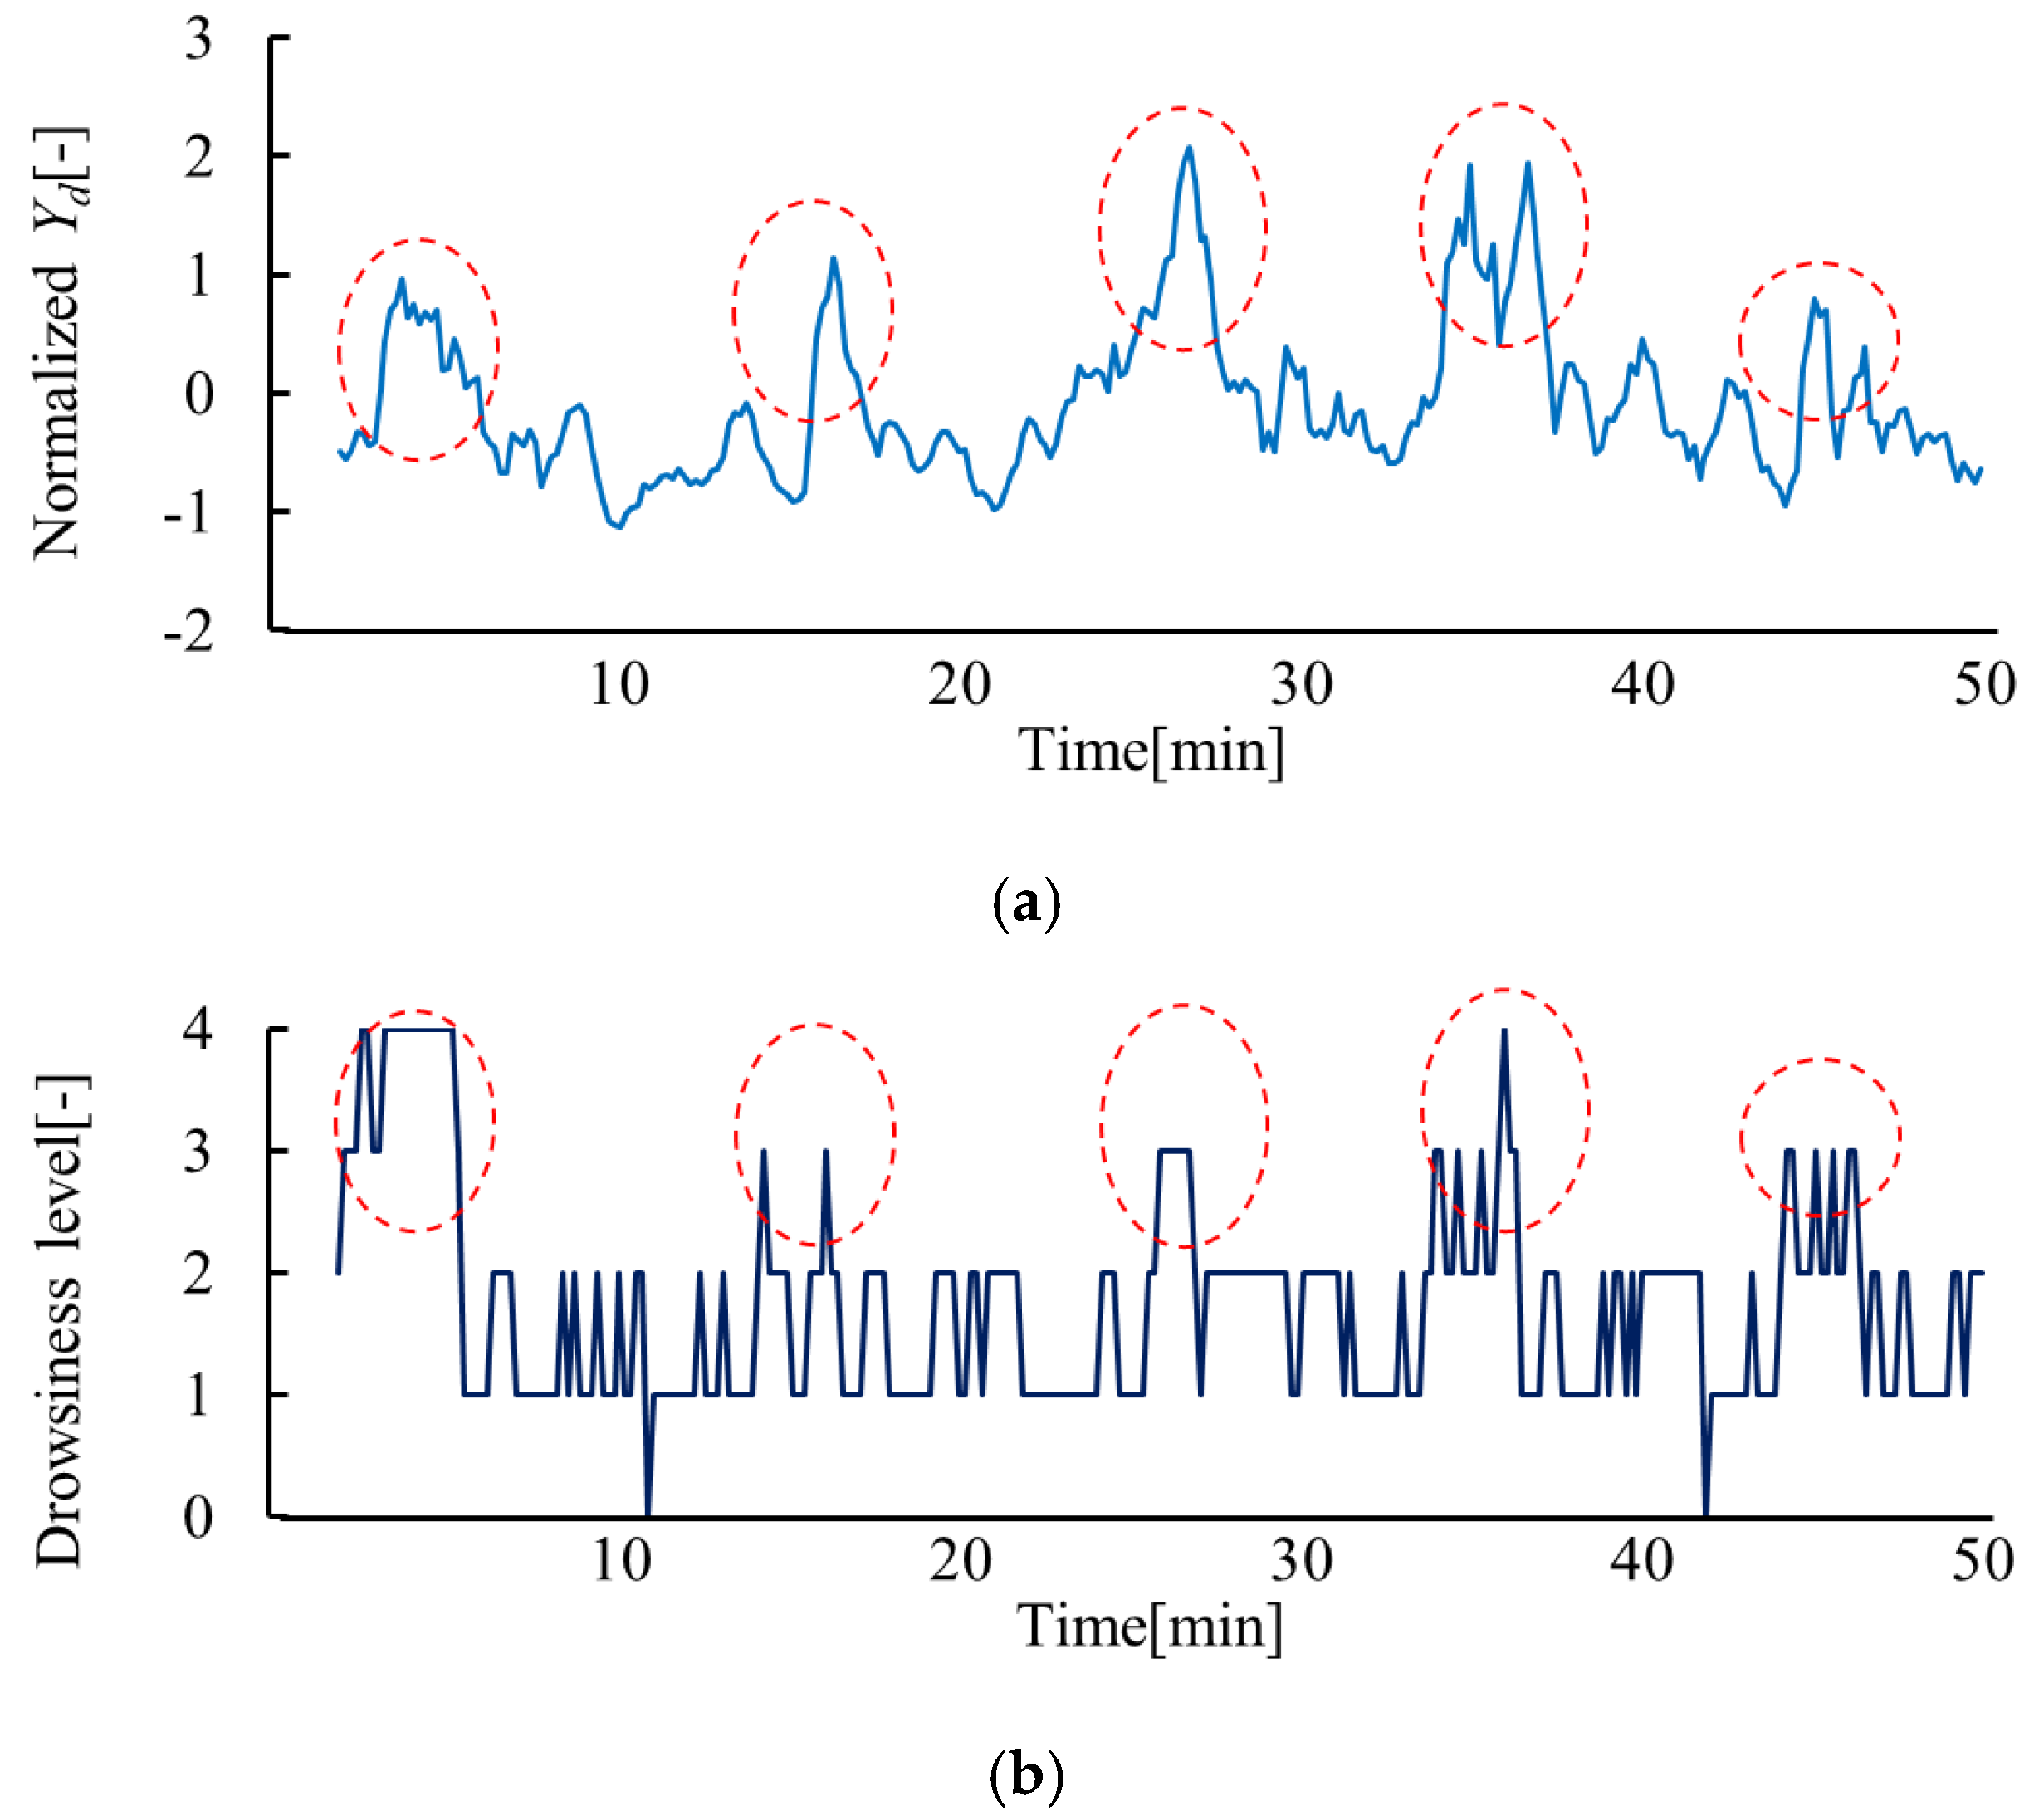
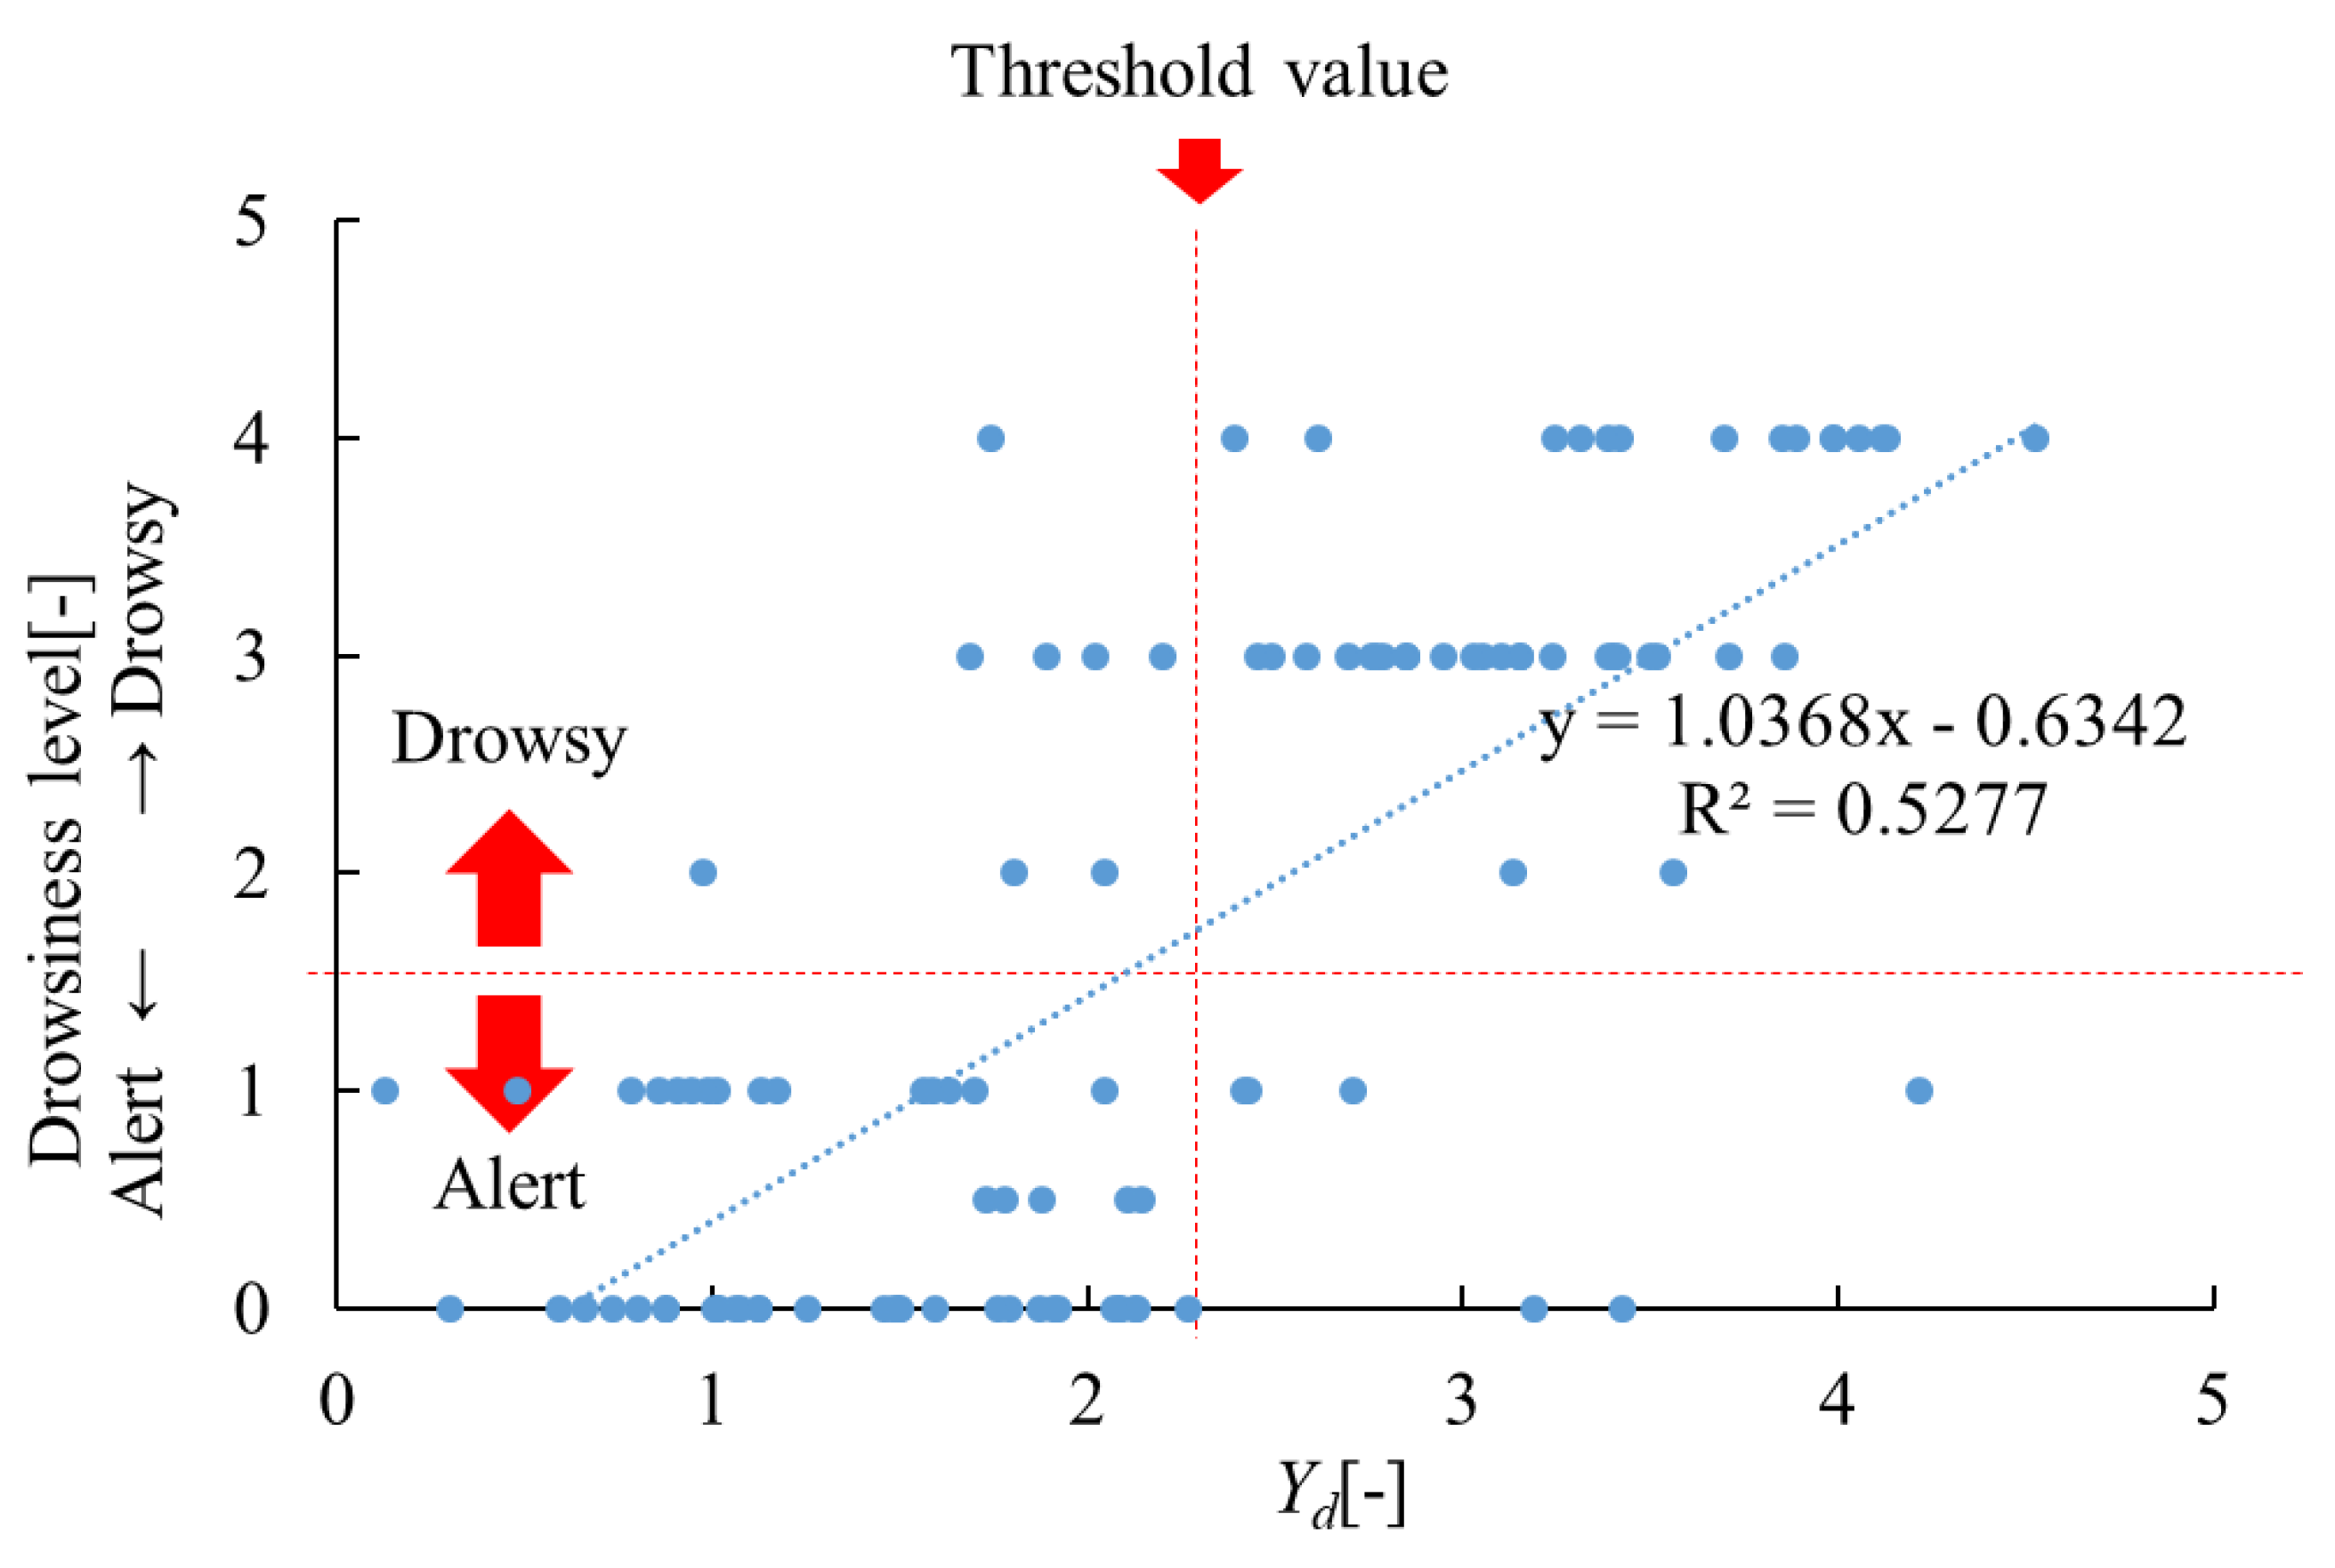
4.2.1. Relationship between the Drowsiness Level and Physiological Indices
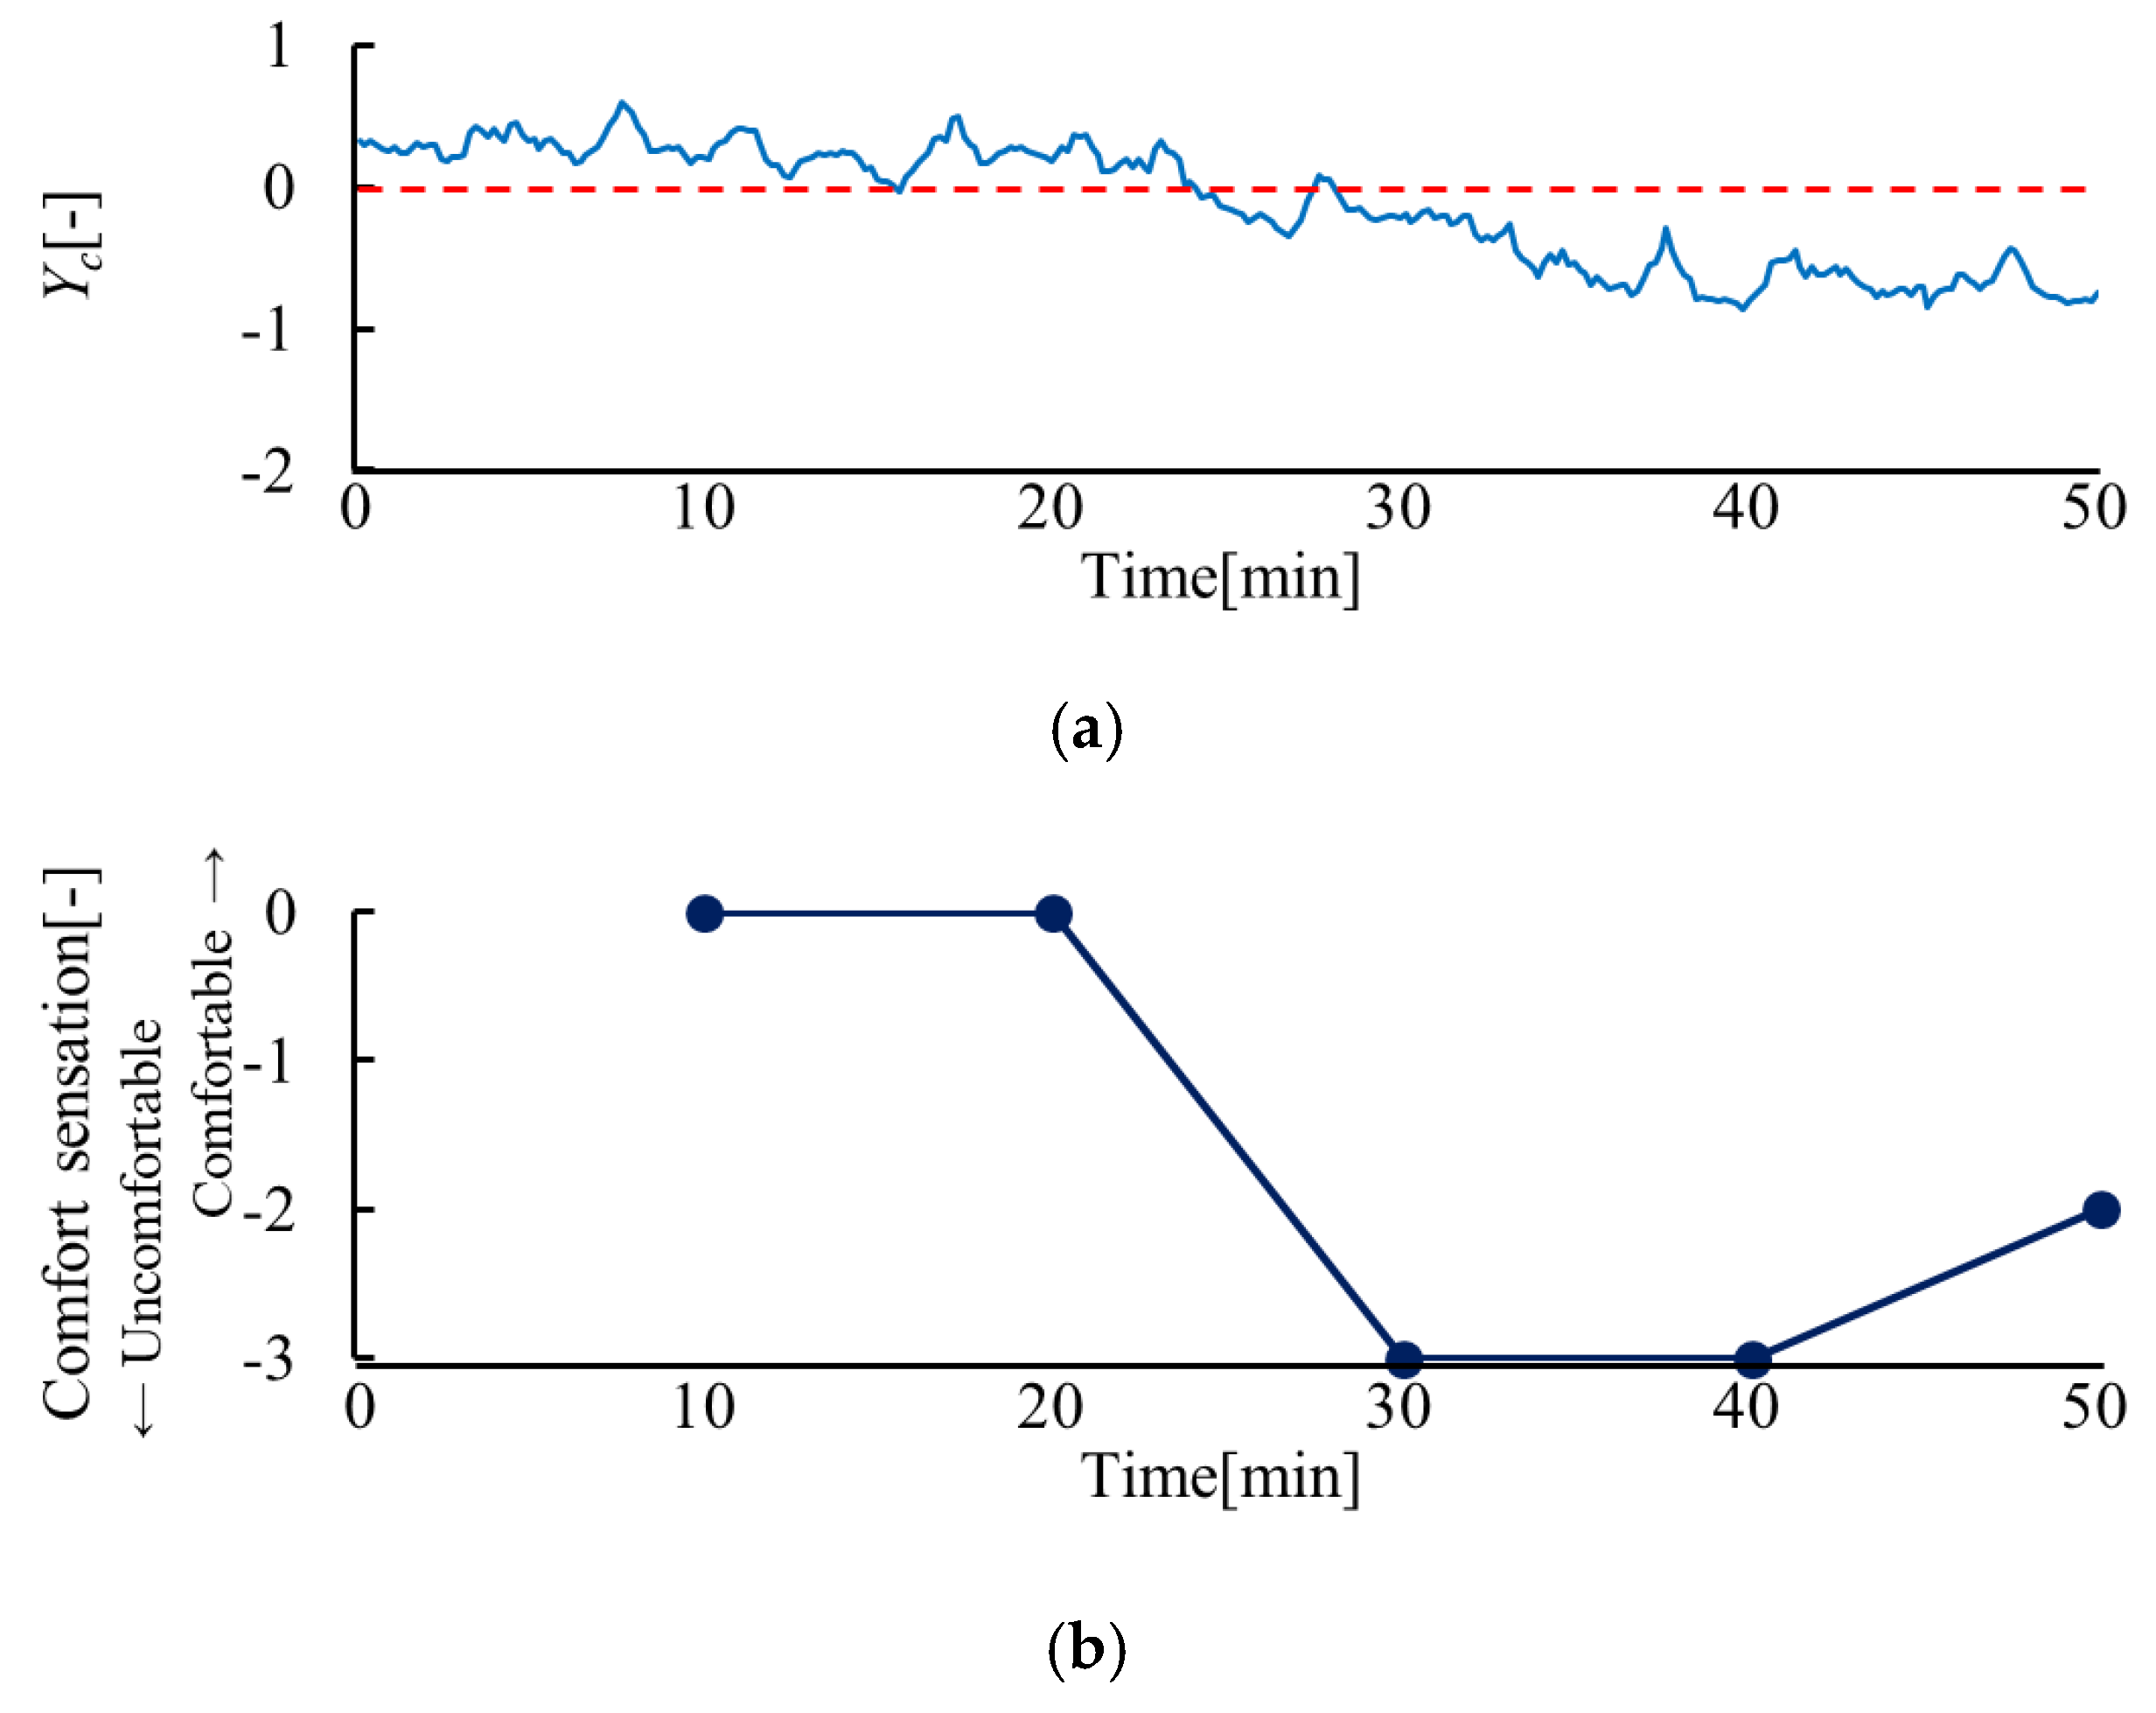
4.2.2. Relationship between Thermal Comfort and Physiological Indices
4.2.3. Calculation of the Evaluation Index Using Multiple Regression Analysis
- Indices that had a significant correlation with the value of subjective evaluation were sorted according to their correlation coefficient from high to low (x1, x2, … x102).
- x1 was selected as the explanatory variable, since it had the highest correlation coefficient with the value of subjective evaluation.
- x2 was selected as the explanatory variable if there was no significant correlation between x2 and x1.
- xn was selected as the explanatory variable if there was no significant correlation between xn and all the parameters selected previously as explanatory variables.
5. Conclusions
- When the indoor ambient temperature decreased and then increased, both the arousal level and thermal comfort of occupants remained at high levels. This result suggests that the hypothesis of this study was verified and changes in the indoor ambient temperature can be used to improve both thermal comfort and the arousal level of occupants.
- We proposed the evaluation indices of thermal comfort and the drowsiness level of occupants. It was observed that the drowsiness level and thermal comfort of occupants can be evaluated quantitatively and continuously using Yd and Yc, which were obtained from the equation consisting of physiological indices in relation to EEGs, ECGs, and skin temperature.
Author Contributions
Funding
Conflicts of Interest
Formula Symbols
| Index | Meaning | Unit |
| MST | Mean skin temperature | °C |
| T1 | Temperature of the forehead | °C |
| T2 | Temperature of the forearms | °C |
| T3 | Temperature of the hands | °C |
| T4 | Temperature of the abdomen | °C |
| T5 | Temperature of the thighs | °C |
| T6 | Temperature of the legs | °C |
| T7 | Temperature of the feet | °C |
| Yc | Index of thermal comfort | |
| Yd | Index of drowsiness level | |
| Xd1 | High alpha content of T7 | |
| Xd2 | Beta content per alpha content of F7 | |
| Xd3 | Beta content of F3 | |
| Xd4 | Low beta content of F7 | |
| Xd5 | Alpha content of Fp1 | |
| Xc1 | Mean skin temperature | °C |
| Xc2 | Alpha content per high beta content of C4 | |
| Xc3 | Alpha content per high beta content of P4 |
References
- ISO7730:2005. Ergonomics of the thermal environment-Analytical determination and interpretation of thermal comfort using calculation of the PMV and PPD indices and local thermal comfort criteria
- De Dear, R.; Brager, G.S. Developing an adaptive model of thermal comfort and preference. ASHRAE Trans. 1998, 104, 145–167. [Google Scholar]
- Yang, Y.; Li, B.; Liu, H.; Tan, M.; Yao, R. A study of adaptive thermal comfort in a well-controlled climate chamber. Appl. Therm. Eng. 2015, 76, 283–291. [Google Scholar] [CrossRef]
- Cannistraro, M.; Cannistraro, G.; Restivo, R. Some Observations on the Influence on Exchanges Radiative. Int. J. Heat Techonol. 2015, 33, 115–122. [Google Scholar] [CrossRef]
- Cannistraro, M.; Lorenzini, E. The Applications of the New Techonologies E-Sensing in Hospitals. Int. J. Heat Techonol. 2016, 34, 551–557. [Google Scholar] [CrossRef]
- Cannistraro, M.; Cannistraro, G.; Restivo, R. Smart Controll of Air Climatization System in Function on the Values of the Mean Local Radiant Temperature. Smart Sci. 2015, 3, 157–163. [Google Scholar] [CrossRef]
- Liu, J.; Yao, R.; McCloy, R. A method to weight three categories of adaptive thermal comfort. Energy Build. 2012, 47, 312–320. [Google Scholar] [CrossRef]
- McIntyre, D.A. Indoor Climate; Applied science publishers: London, UK, 1980. [Google Scholar]
- Gohara, T.; Iwashita, G. Disscussion of relationship between indoor environmental comfort and performance in simple task. J. Environ. Eng. 2003, 572, 75–80. [Google Scholar] [CrossRef]
- ASHRAE-55. Thermal Environmental Conditions for Human Occupancy; American Society of Heating, Refrigerating and Air-conditioning Engineers: Atlanta, GA, USA, 2004. [Google Scholar]
- Kondo, E.; Kurazumi, Y.; Horikoshi, T. Human physiological and psychological reactions to thermal transients with air temperature step changes: A Case of Climacteric Aged Females in Summer. J. Hum. Living Environ. Jpn. 2014, 21, 75–84. [Google Scholar]
- Yoshida, M.; Kato, C.; Kakamu, Y.; Kawasumi, M.; Yamasaki, H.; Yamamoto, S.; Nakano, T.; Yamada, M. Study on Stimulation Effects for Driver Based on Fragrance Presentation. In Proceedings of the MVA2011 IAPR Conference on Machine Vision Applications, Nara, Japan, 13–15 June 2011; pp. 332–335. [Google Scholar]
- Mohri, Y.; Kawaguchi, M.; Kojima, S.; Yamada, M.; Nakano, T.; Mohri, K. Arousal retention effect of magnetic stimulation to car drivers preventing drowsy driving without sleep rebound. Trans. Inst. Electr. Eng. Jpn. 2016, 136, 383–389. [Google Scholar] [CrossRef]
- Mardi, Z.; Naghmeh, S.; Ashtiani, M.; Mikaili, M. EEG-based drowsiness detection for safe driving using chaotic features and statistical tests. J. Med. Signals Sens. 2011, 1, 130–137. [Google Scholar] [PubMed]
- Furman, G.D.; Baharav, A.; Cahan, C.; Akselrod, S. Early detection of falling asleep at the wheel: A heart rate variability approach. Comput. Cardiol. 2008, 35, 1109–1112. [Google Scholar]
- Hardy, J.D.; Dubois, E.F. The technic of measuring radiation and convection. Nutrition 1938, 5, 461–475. [Google Scholar] [CrossRef]
- Yao, Y.; Lian, Z.; Liu, W.; Jiang, C.; Liu, Y.; Lu, H. Heart rate variation and electroencephalograph-the potential physiological factors for thermal comfort study. Indoor Air 2009, 19, 93–101. [Google Scholar] [CrossRef] [PubMed]
- Turner, J.R.; Hewitt, J.K.; Morgan, R.K.; Sims, J.; Carroll, D.; Kelly, K.A. Graded mental arithmetic as an active psychological challenge. Int. J. Psychophysiol. 1986, 3, 307–309. [Google Scholar] [CrossRef]
- SO10551. First edition 1995-05-15, Ergonomics of the thermal environment–Assessment of the influence of the thermal environment using subjective judgement scales.
- Zilberg, E.; Burton, D.; Xu, Z.M.; Karrar, M. Methodology and initial analysis for development of non-invasive and hybrid driver drowsiness detection systems. In Proceedings of the 2nd IEEE International Conference Wireless Broadband and Ultra Wideband Communications, AusWireless, Sydney, Australia, 27–30 August 2007; p. 16. [Google Scholar]
- Gwak, J.S.; Shino, M.; Hirao, A. Eary detection of driver drowsiness using machine learning based on physiological signals, behavioral measures and driving performance. In Proceedings of the 21th IEEE International Conference on Intelligent Transportation Systems, Maui, Hawaii, USA, 4–7 November 2018; pp. 1794–1800. [Google Scholar]


| Model Summary | ||||
| R | 0.8657 | Std. Error | 0.7358 | |
| R2 | 0.7495 | data N | 57 | |
| Adjusted R2 | 0.7249 | |||
| Index | Coefficient | Std.Error | t | p-value |
| Intercept | −3.3123 | 0.4959 | −4.6631 | 2.28 × 10⁻⁵ |
| T7_High-alpha | 0.1338 | 0.0201 | 6.6478 | 1.96 × 10⁻⁸ |
| F7_Beta/Alpha | 2.5196 | 0.3073 | 8.1996 | 7.09 × 10⁻¹¹ |
| F3_Beta | 0.0878 | 0.0245 | 3.5817 | 0.0008 |
| F7_Low beta | −0.2684 | 0.0481 | −5.5791 | 9.29 × 10⁻⁷ |
| Fp1_Alpha | 0.2708 | 0.0315 | 8.5969 | 1.72 × 10⁻¹¹ |
| Model Summary | ||||
| R | 0.7267 | Std. Error | 0.6859 | |
| R2 | 0.5276 | data N | 98 | |
| Adjusted R2 | 0.5125 | |||
| Index | Coefficient | Std.Error | t | p-value |
| Intercept | −23.3721 | 2.5461 | −9.1795 | 1.02 × 10⁻¹⁴ |
| MST | 0.6967 | 0.0765 | 9.1119 | 1.42 × 10⁻¹⁴ |
| C4_Alpha/HB | 0.1718 | 0.0586 | 2.9295 | 0.0043 |
| P4_Alpha/HB | −0.1418 | 0.0296 | −4.7885 | 6.25 × 10⁻⁶ |
© 2019 by the authors. Licensee MDPI, Basel, Switzerland. This article is an open access article distributed under the terms and conditions of the Creative Commons Attribution (CC BY) license (http://creativecommons.org/licenses/by/4.0/).
Share and Cite
Gwak, J.; Shino, M.; Ueda, K.; Kamata, M. An Investigation of the Effects of Changes in the Indoor Ambient Temperature on Arousal Level, Thermal Comfort, and Physiological Indices. Appl. Sci. 2019, 9, 899. https://doi.org/10.3390/app9050899
Gwak J, Shino M, Ueda K, Kamata M. An Investigation of the Effects of Changes in the Indoor Ambient Temperature on Arousal Level, Thermal Comfort, and Physiological Indices. Applied Sciences. 2019; 9(5):899. https://doi.org/10.3390/app9050899
Chicago/Turabian StyleGwak, Jongseong, Motoki Shino, Kazutaka Ueda, and Minoru Kamata. 2019. "An Investigation of the Effects of Changes in the Indoor Ambient Temperature on Arousal Level, Thermal Comfort, and Physiological Indices" Applied Sciences 9, no. 5: 899. https://doi.org/10.3390/app9050899