1. Introduction
Reinforced concrete (RC) is a common material that is used in constructing civil infrastructure, such as buildings and bridges. To resist loading by wind or earthquakes [
1], RC shear walls are widely used in newly constructed building structures to improve their lateral strength, stiffness and energy dissipation capacity. RC structures that are designed according to old standards would be damaged during earthquakes owing to a lack of shear reinforcement and/or insufficient lap-splice length. Such structures may exhibit brittle failure modes and so should be retrofitted to satisfy current standards and survive in future earthquakes. Owing to the high lateral strength and stiffness capacity of RC wall members, post-installed RC infill walls for non-ductile frames is are widely used in seismic retrofitting, especially of low-rise building structures. After a large earthquake event, diagnosing the structural health and/or locating damage to an RC structure are very important to providing early warning information. Large-scale civil infrastructure must have structural health monitoring (SHM) systems for this purpose.
The structural safety or serviceability of the civil structures may be able to be assessed by visual inspection and nondestructive evaluation (NDE) for local monitoring, which can be carried out by qualified engineers. Some NDE methods for local evaluation include the use of ultrasonic and acoustic emissions. The main limitation of visual inspection and some of the traditional approaches is that they require access to potentially damaged regions in a structure, which may be dangerous or impossible. Experience of disasters indicates that despite the best efforts of inspection officials, the prediction of structural failure by inspection remains a difficult task and the detection of structural components in a critical condition is very difficult. These shortcomings have motivated the development of structural health monitoring over recent decades. SHM is the process of using information that is continuously obtained from an array of sensors that are deployed in a structural system to infer its state of structural integrity (damage diagnosis) and estimate its remaining capacity (damage status) (Farrar and Worden [
2], Nagarajaiah and Erazo [
3]). Numerous important issues concerning the safe operation of a concrete structure arise over its life cycle. The aging and deterioration of concrete structures require improvements in their sustainability and resiliency, as well as their ongoing maintenance. In addition to deterioration from long-term use, extreme events (such as earthquakes) pose a threat that may result in sudden drops in performance or safety. Additionally, using a quantifiable method to determine whether a damaged building is safe for reoccupation and whether structures can continue to serve their required functions is difficult. Therefore, the SHM of an RC structure must be performed to detect its damage or determine its health after an earthquake during its service life.
Many investigations of changes in structural vibration properties to detect structural damage to RC structures damage have been performed. Doebling et al. [
4] reviewed the literature in this field. Damage changes the vibration properties of RC structures, including their fundamental frequencies, structural damping ratios and corresponding mode shapes. However, the natural frequencies and mode shapes are not necessarily favorable indices of damage because structural frequencies are frequently not sensitive to minor damage and many measurements must be made to characterize mode shapes accurately. In the last three decades, sensing systems that are based on optical fiber sensors have been used to detect damage and to monitor the health of RC structures, owing to their smallness, immunity to corrosion and ability to be embedded. Many optical fiber sensor-based monitoring systems have been developed for making continuous measurements and real-time assessments of a wide range of structures. Ye et al. [
5] comprehensively reviewed the structural monitoring and detection of civil infrastructure using optical fiber sensing technology. Nagarajaiah and Erazoa [
3], Li et al. [
6] and Kim et al. [
7] have all reviewed the literature on other methods of structural monitoring and damage detection. The piezoelectric sensor is relatively a new technology for structural health monitoring with the advantages of a quick response, availability in various shapes, active sensing, low cost and simplicity of implementation. It has been shown to have great potential in local monitoring and detecting minor to major cracks in concrete structures. Owing to their multiple functions, piezoelectric sensors such as piezoceramic (PZT; lead zirconate titanate) sensors have been used successfully in many SHM applications for RC structures.
Recently, piezoelectric material has been successfully used in SHM because of its aforementioned advantages. Moreover, piezoelectric sensors can be easily post-installed in critical parts of existing structures by mounting them on a surface or embedding them into the inner structure. They can function as actuators or sensors. Accordingly, piezoelectric material has been actively used in research into structural health monitoring. Sun et al. developed novel nondestructive wave-based methods for measuring the modulus of elasticity of concrete using the wave-propagation characteristics and characteristics of the PZT transducer [
8]. Gu et al. [
9], Song et al. [
10], Laskar et al. [
11] and Kong et al. [
12], developed an advanced multifunctional PZT-based sensor, smart aggregate (SA), to diagnose the structural health of RC structures. Liao et al. [
13] used pre-embedded piezoceramic-based sensors to measure dynamic stress and perform the SHM of a single concrete column underground excitation with gradually increasing acceleration. However, for locating probable damage or the failure of the existing structures, post-embedded piezoceramic-based sensors are more suitable than pre-embedded piezoceramic-based sensors. Therefore, Liao et al. [
14] utilized the post-embedded piezoceramic-based sensors for the on-site SHM of the large-scale RC piers of an existing bridge in Taiwan under cyclic loading. A feedback sensing network using active sensing property of SAs to reduce damage-location detection time was established by Chen et al. [
15]. Gao et al. [
16] proposed the concept of smart concrete slab with embedded tubular PZT transducer array for image-based damage detection. Kong et al. [
17,
18] developed a novel embeddable spherical SA to monitor the health of concrete structures, providing a significant improvement in the detection aperture and additional functionality for health monitoring. To reveal the stress wave propagation in concrete structures, Tian et al. [
19] developed a simple and effective absorption attenuation model of stress waves in concrete based on the Rayleigh damping model and Huo et al. [
20] presented a dynamic model of an embeddable PZT transducer with a waterproof layer and a protecting layer. Tian et al. [
21] proposed a method using PZT enabled time-reversal method to monitor the grouting quality. Huo et al. [
22] proposed a method of simultaneously using piezoelectric transducers as strain gauges and acoustic emission sensors to monitor the health of concrete structures. Fan et al. [
23] proposed the relation between the damage volume ratio and the root-mean-square deviation damage index which can be used to predict the collision damage of the RC structures. Additionally, Lu et al. [
24,
25] performed piezoceramic transducers on the successful application of SHM of structures. The use of post-installed surface-mounted PZTs or pre-installed embedded PZTs has recently been extended, not only for the evaluation of the concrete strength gain but also for health monitoring and damage detection. Sabet and Yang [
26] combined smart aggregates (to support the wave transmission technique) with surface-bonded PZTs (to support the wave propagation technique) to investigate both the local and overall conditions of an RC structure. Chalioris et al. [
27] proposed an Electro-Mechanical Admittance (EMA) procedure for detecting and evaluating damage in a shear critical RC beam using the admittance signatures of embedded SA transducers and externally bonded piezoelectric patches. Voutetaki et al. [
28] developed an innovative portable real-time wireless impedance admittance monitoring system for diagnosing damage to shear-critical RC beams. Karayannis et al. [
29] applied the finite element modeling with admittance-based signature data to analyze its accuracy and to evaluate the potential use of this technique to monitor structural damage in real time. Chalioris et al. [
30] experimentally evaluated an innovative portable wireless real-time SHM system for detecting earthquake damage and the structural integrity of RC members in seismically prone regions. More advanced and interesting applications of PZT sensors for SHM and damage detection can be found elsewhere [
31,
32,
33,
34,
35,
36].
Most successful applications of SHM using piezoelectric-based transducers have involved flexural-critical columns or frame specimens. However, a few have involved shear-critical walls subjected to the ground motion. Furthermore, most tests in the investigations cited above focused on the monitoring of damage to whole structures rather than the location of damage. Most wave-based health monitoring methods that involve piezoelectric-based transducers require them to be pre-embedded in the structures before casting. Therefore, the transducer and concrete can be assumed to be well-bonded. Studies of the sensitivity and effectiveness of post-embedded piezoceramic-based transducers for the SHM of existing concrete structures are also very important.
With respect to retrofitted RC members, the interface failure or cracks between two structural members (one existing and one added) are important and affect the effectiveness of the retrofit. Furthermore, interface failure or cracks cannot be observed during renovation as part of retrofitting work. The main purpose of this work is to develop the post-embedded PZT transducers that can be used to identify interface failure or cracks between two structural members in retrofit construction. This work involves an experiment on the SHM of RC walls using post-embedded transducers. Cyclic loading is used to test two specimens with post-embedded piezoceramic-based transducers. Since the failure of an interface between the post-installed wall and the existing structure occurs, one of the specimens has damage in its foundation and boundary column and the other one has damage in the top ends of columns and wall. Waterproof post-embedded transducers are used as actuators and sensors for SHM and damage detection during the cyclic loading test. For specimens under cyclic loading, the post-embedded transducers are utilized to identify crack development in and the health status of, an interface between existing and retrofitted structural members. During the cyclic loading test, the distributed post-embedded transducers in the concrete structures are used to perform SHM. For this purpose, one of the transducers is used as an actuator to generate stress waves, while the others are used as sensors that receive the stress waves. The propagation energy of the waves is attenuated in the presence of cracks or damage. The decreased in the transmission energy is correlated with the severity of the damage. The locations of cracks or damage and their corresponding severity can be estimated by analyzing the received wave signals. Experimental results indicate the effectiveness of the piezoceramic-based method in SHM based on the location of damage in shear-critical RC structures under seismic loading.
2. Experimental Setup for Cyclic Loading Test
In this work, two non-ductile RC frame specimens that are retrofitted by installing a shear wall (RCW1 and RCW2) are tested under cyclic loading. A non-ductile RC frame was constructed first and then rebar connections were post-installed and wall rebar cage were installed, as depicted in
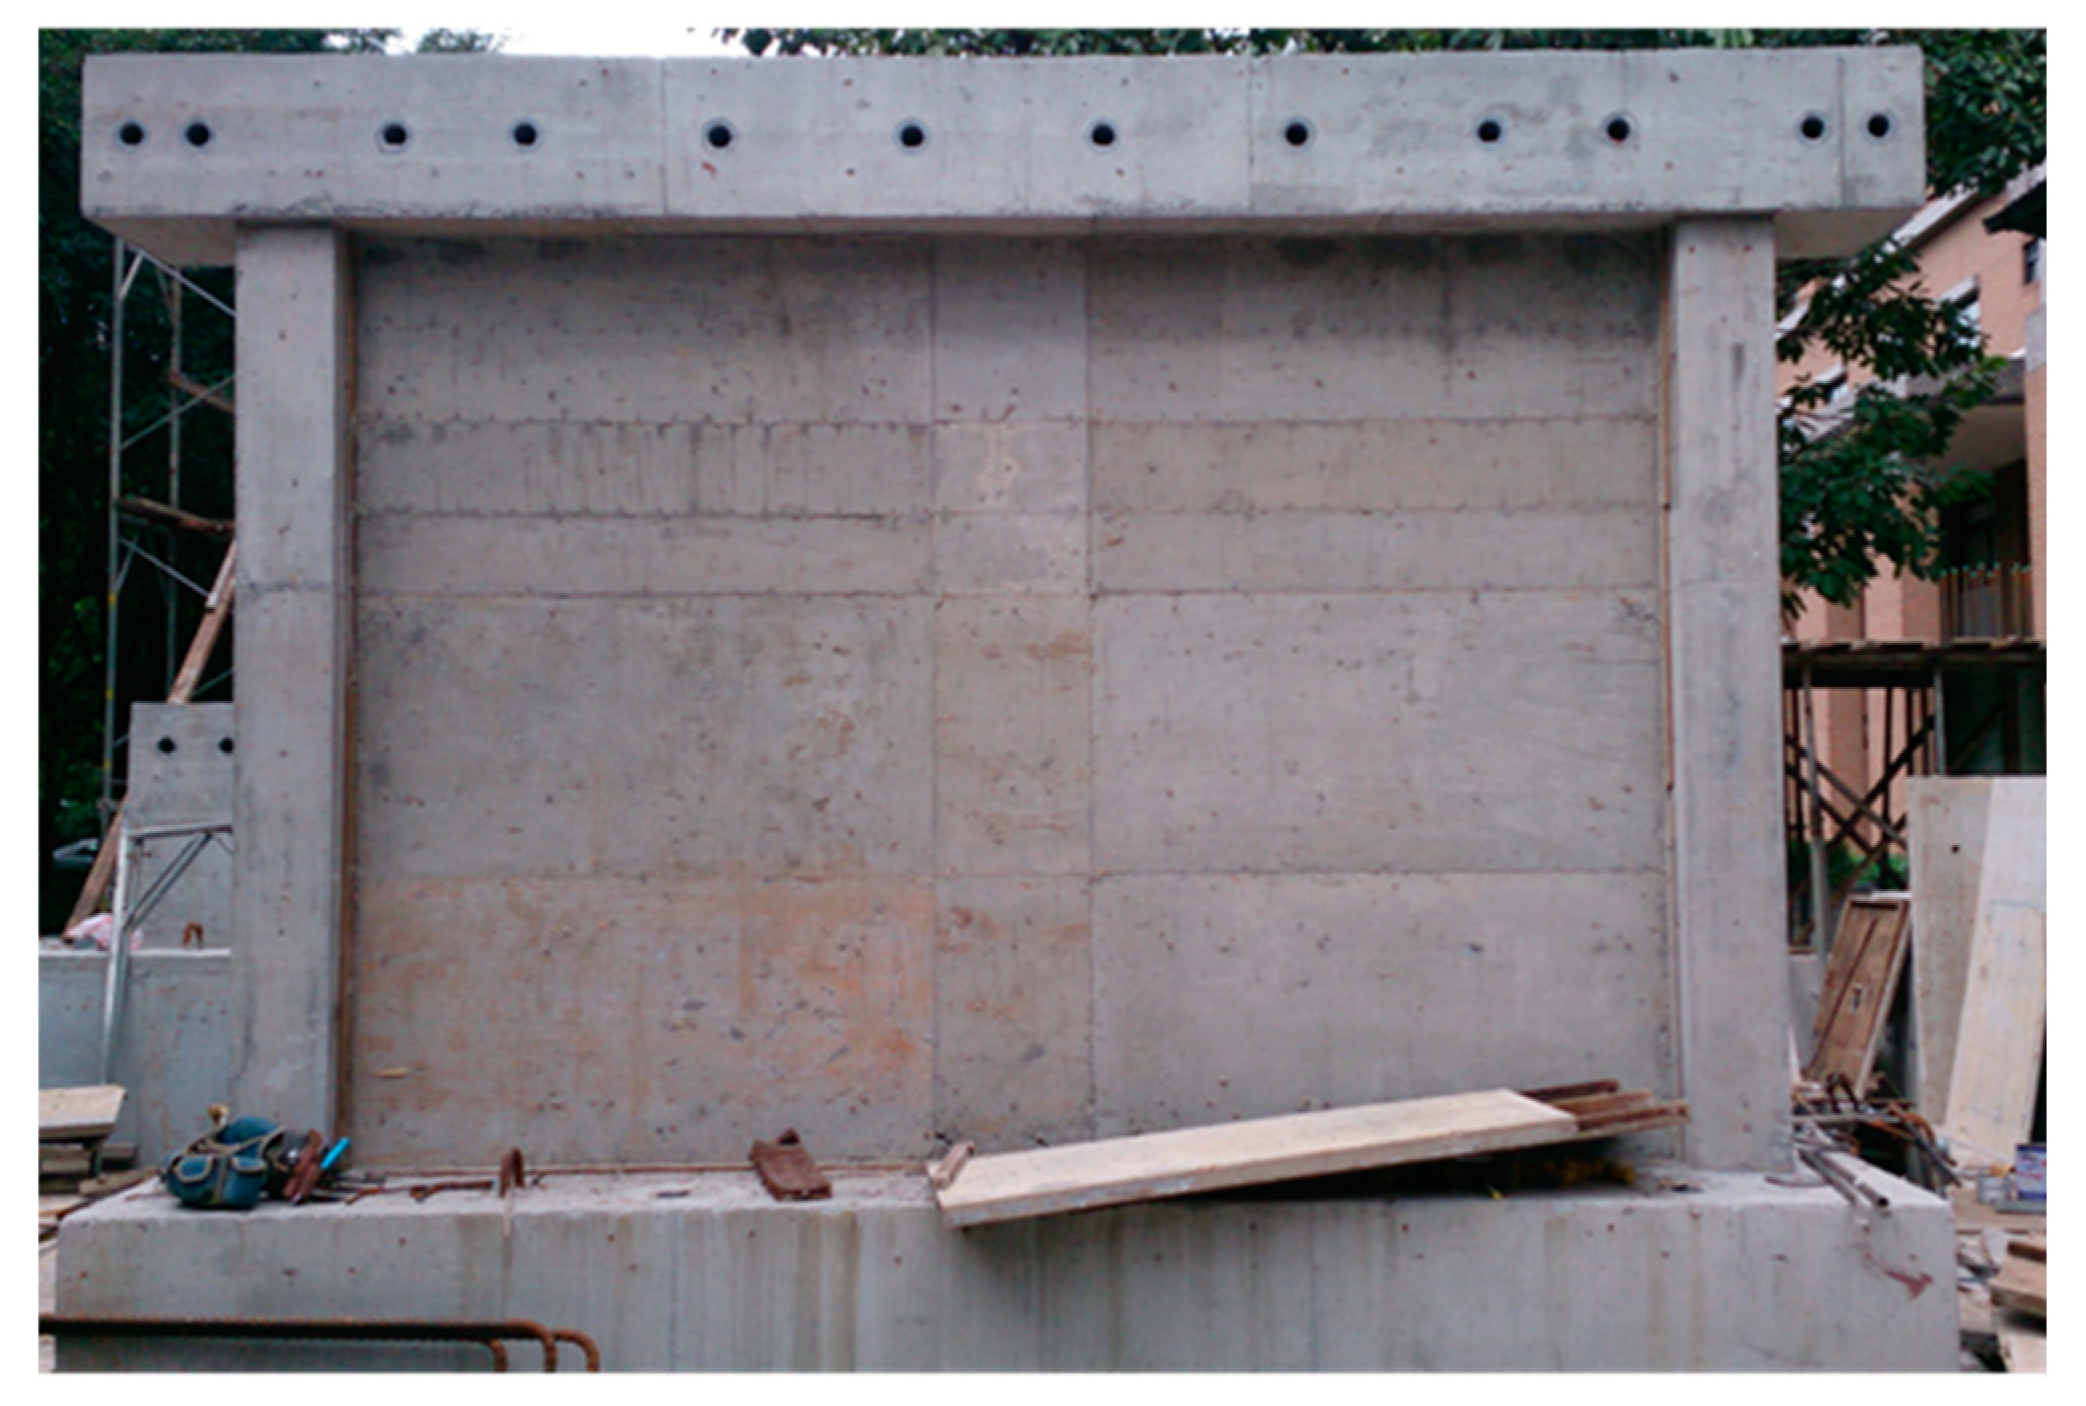
Figure 1. Concrete was finally cast to form an RC shear wall, as presented in
Figure 2.
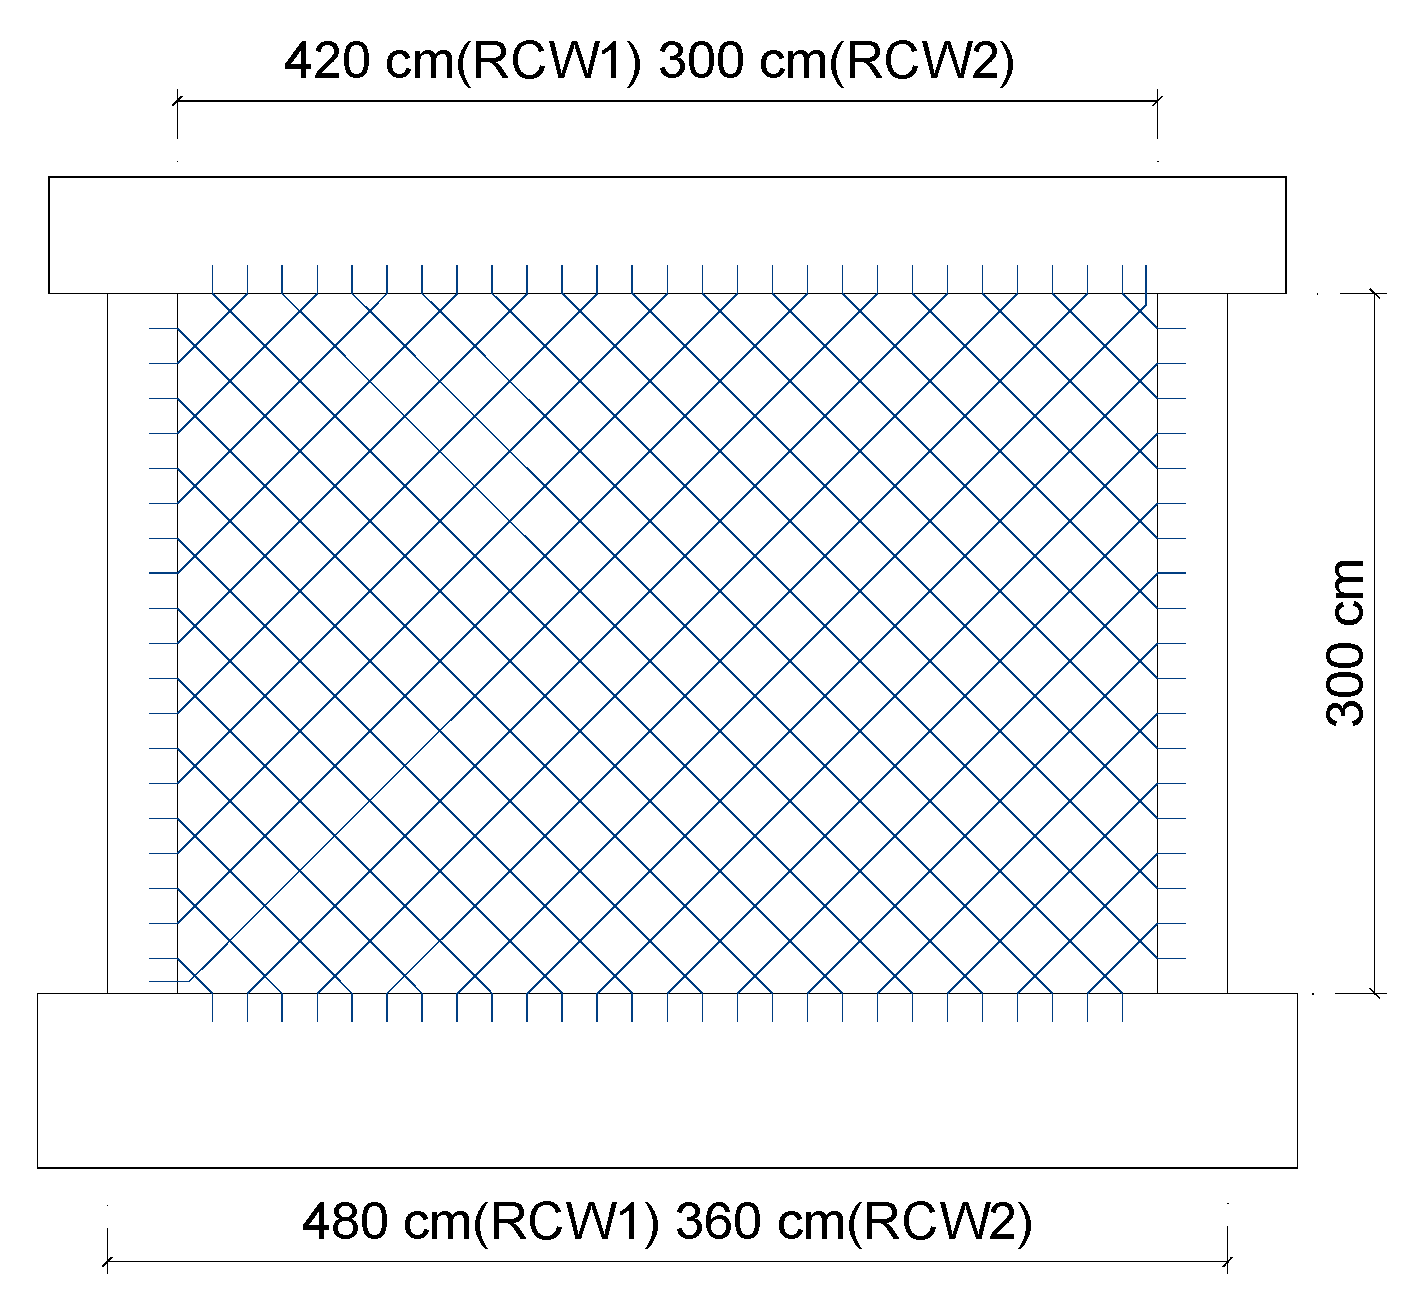
Figure 3 shows the dimensions and wall panel reinforcements of RCW1 and RCW 2; the thickness of the wall panel is 15 cm. To improve ductility, the reinforcements in the wall panels of both RCW1 and RCW2 are set to 45 degrees from horizontal. The reinforcements in the wall panels are arranged identically in both specimens. These two specimens include the boundary columns with a cross-sectional area of
. Each column is designed with main bars of 4-D22 and 8-D19 and a transverse reinforcement of D10@20cm at both ends. The web reinforcement of the shear wall is connected to the existing RC frame using adhesive rebars. The embedded length of the adhesive reinforcement is 12 cm and the lap length of the reinforcements is 30 cm.
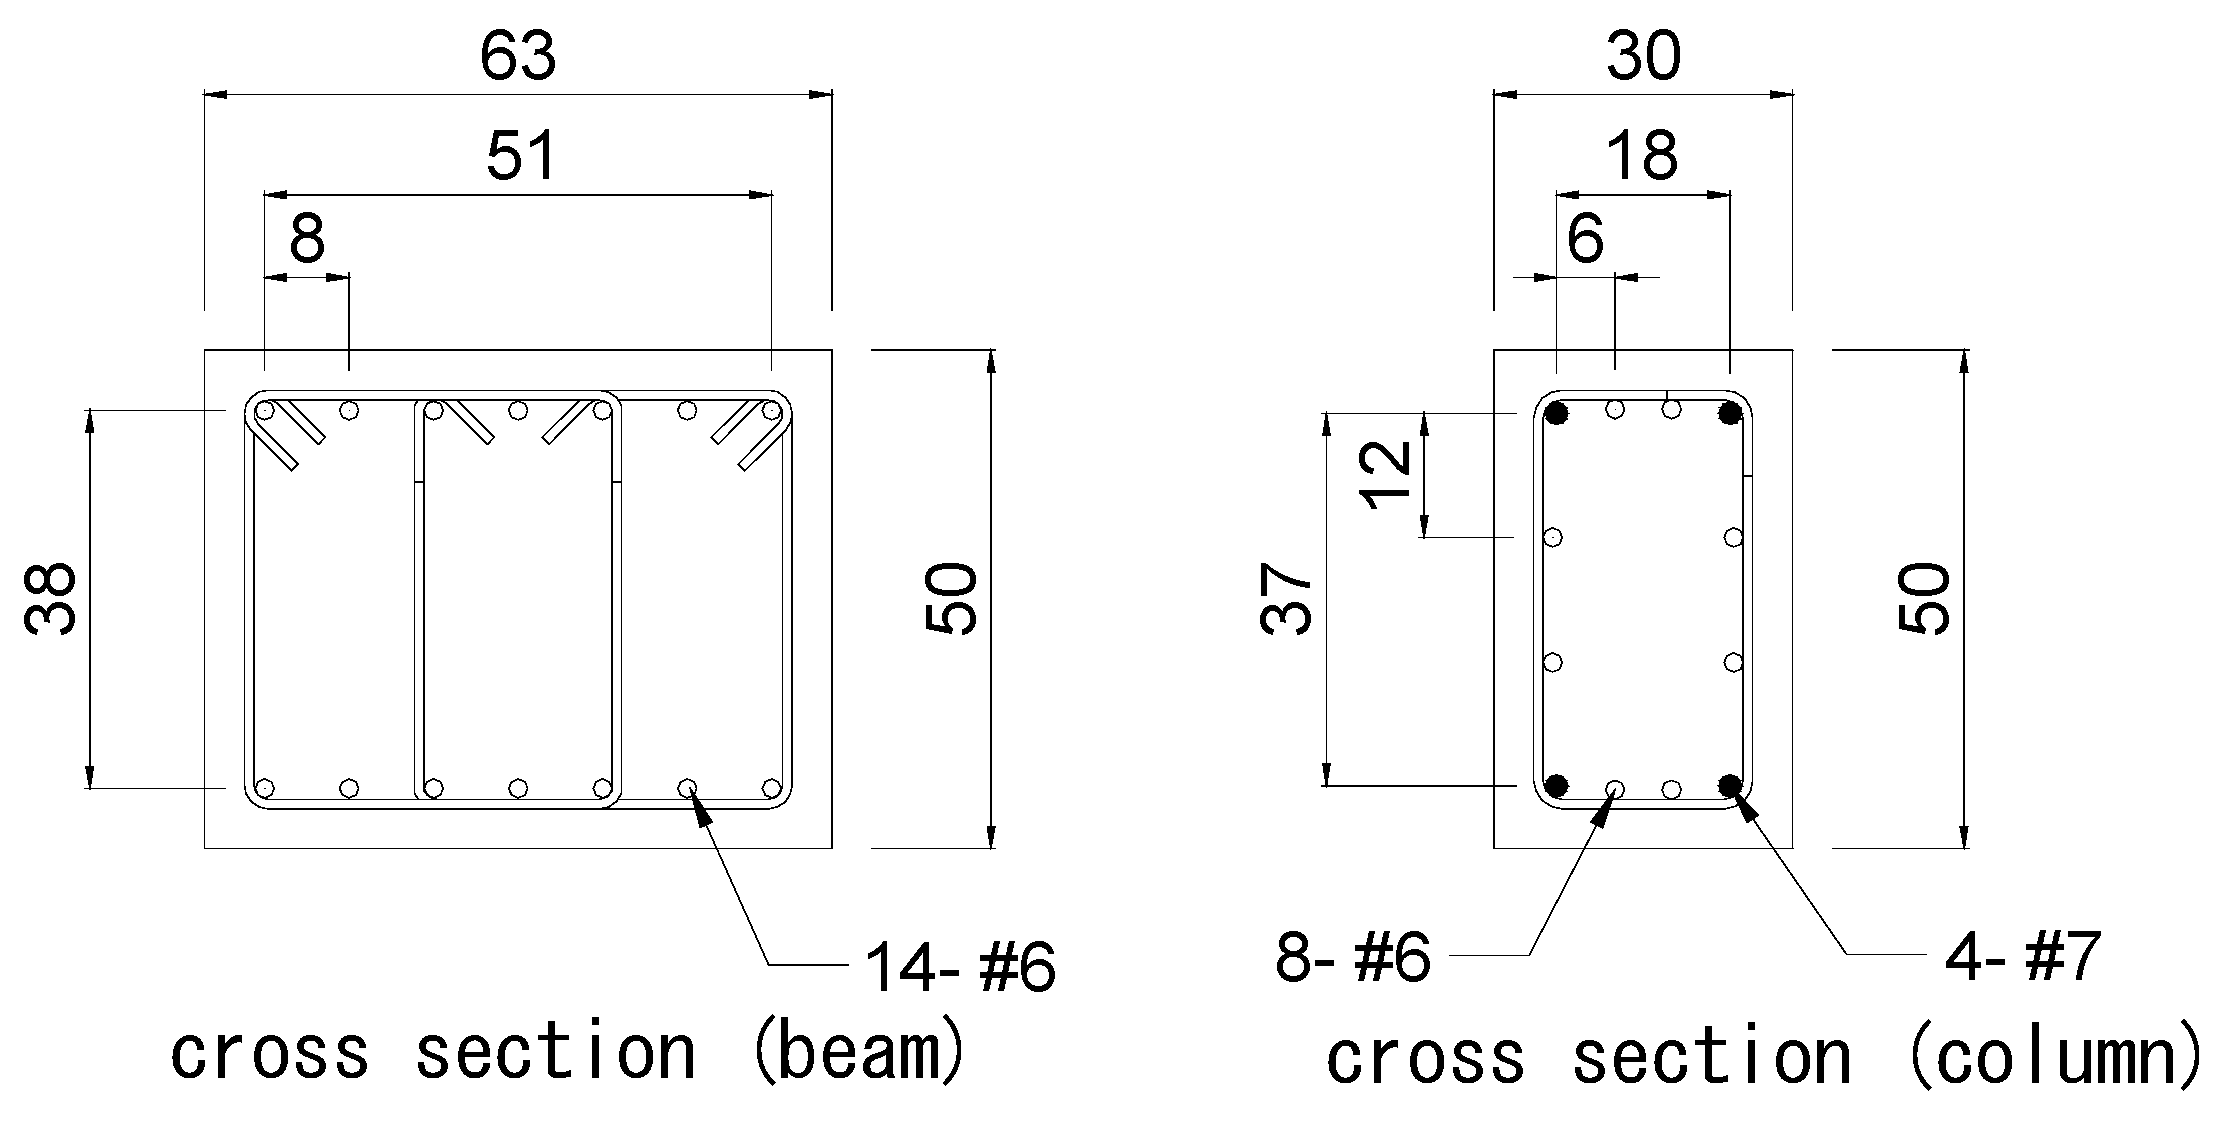
Figure 4 displays the arrangement of reinforcements of the boundary columns and beams.
Table 1 presents the yielding strength and ultimate strength of the reinforcement in the specimens.
Table 2 presents the mean concrete strengths in the wall panel, boundary column and foundation.
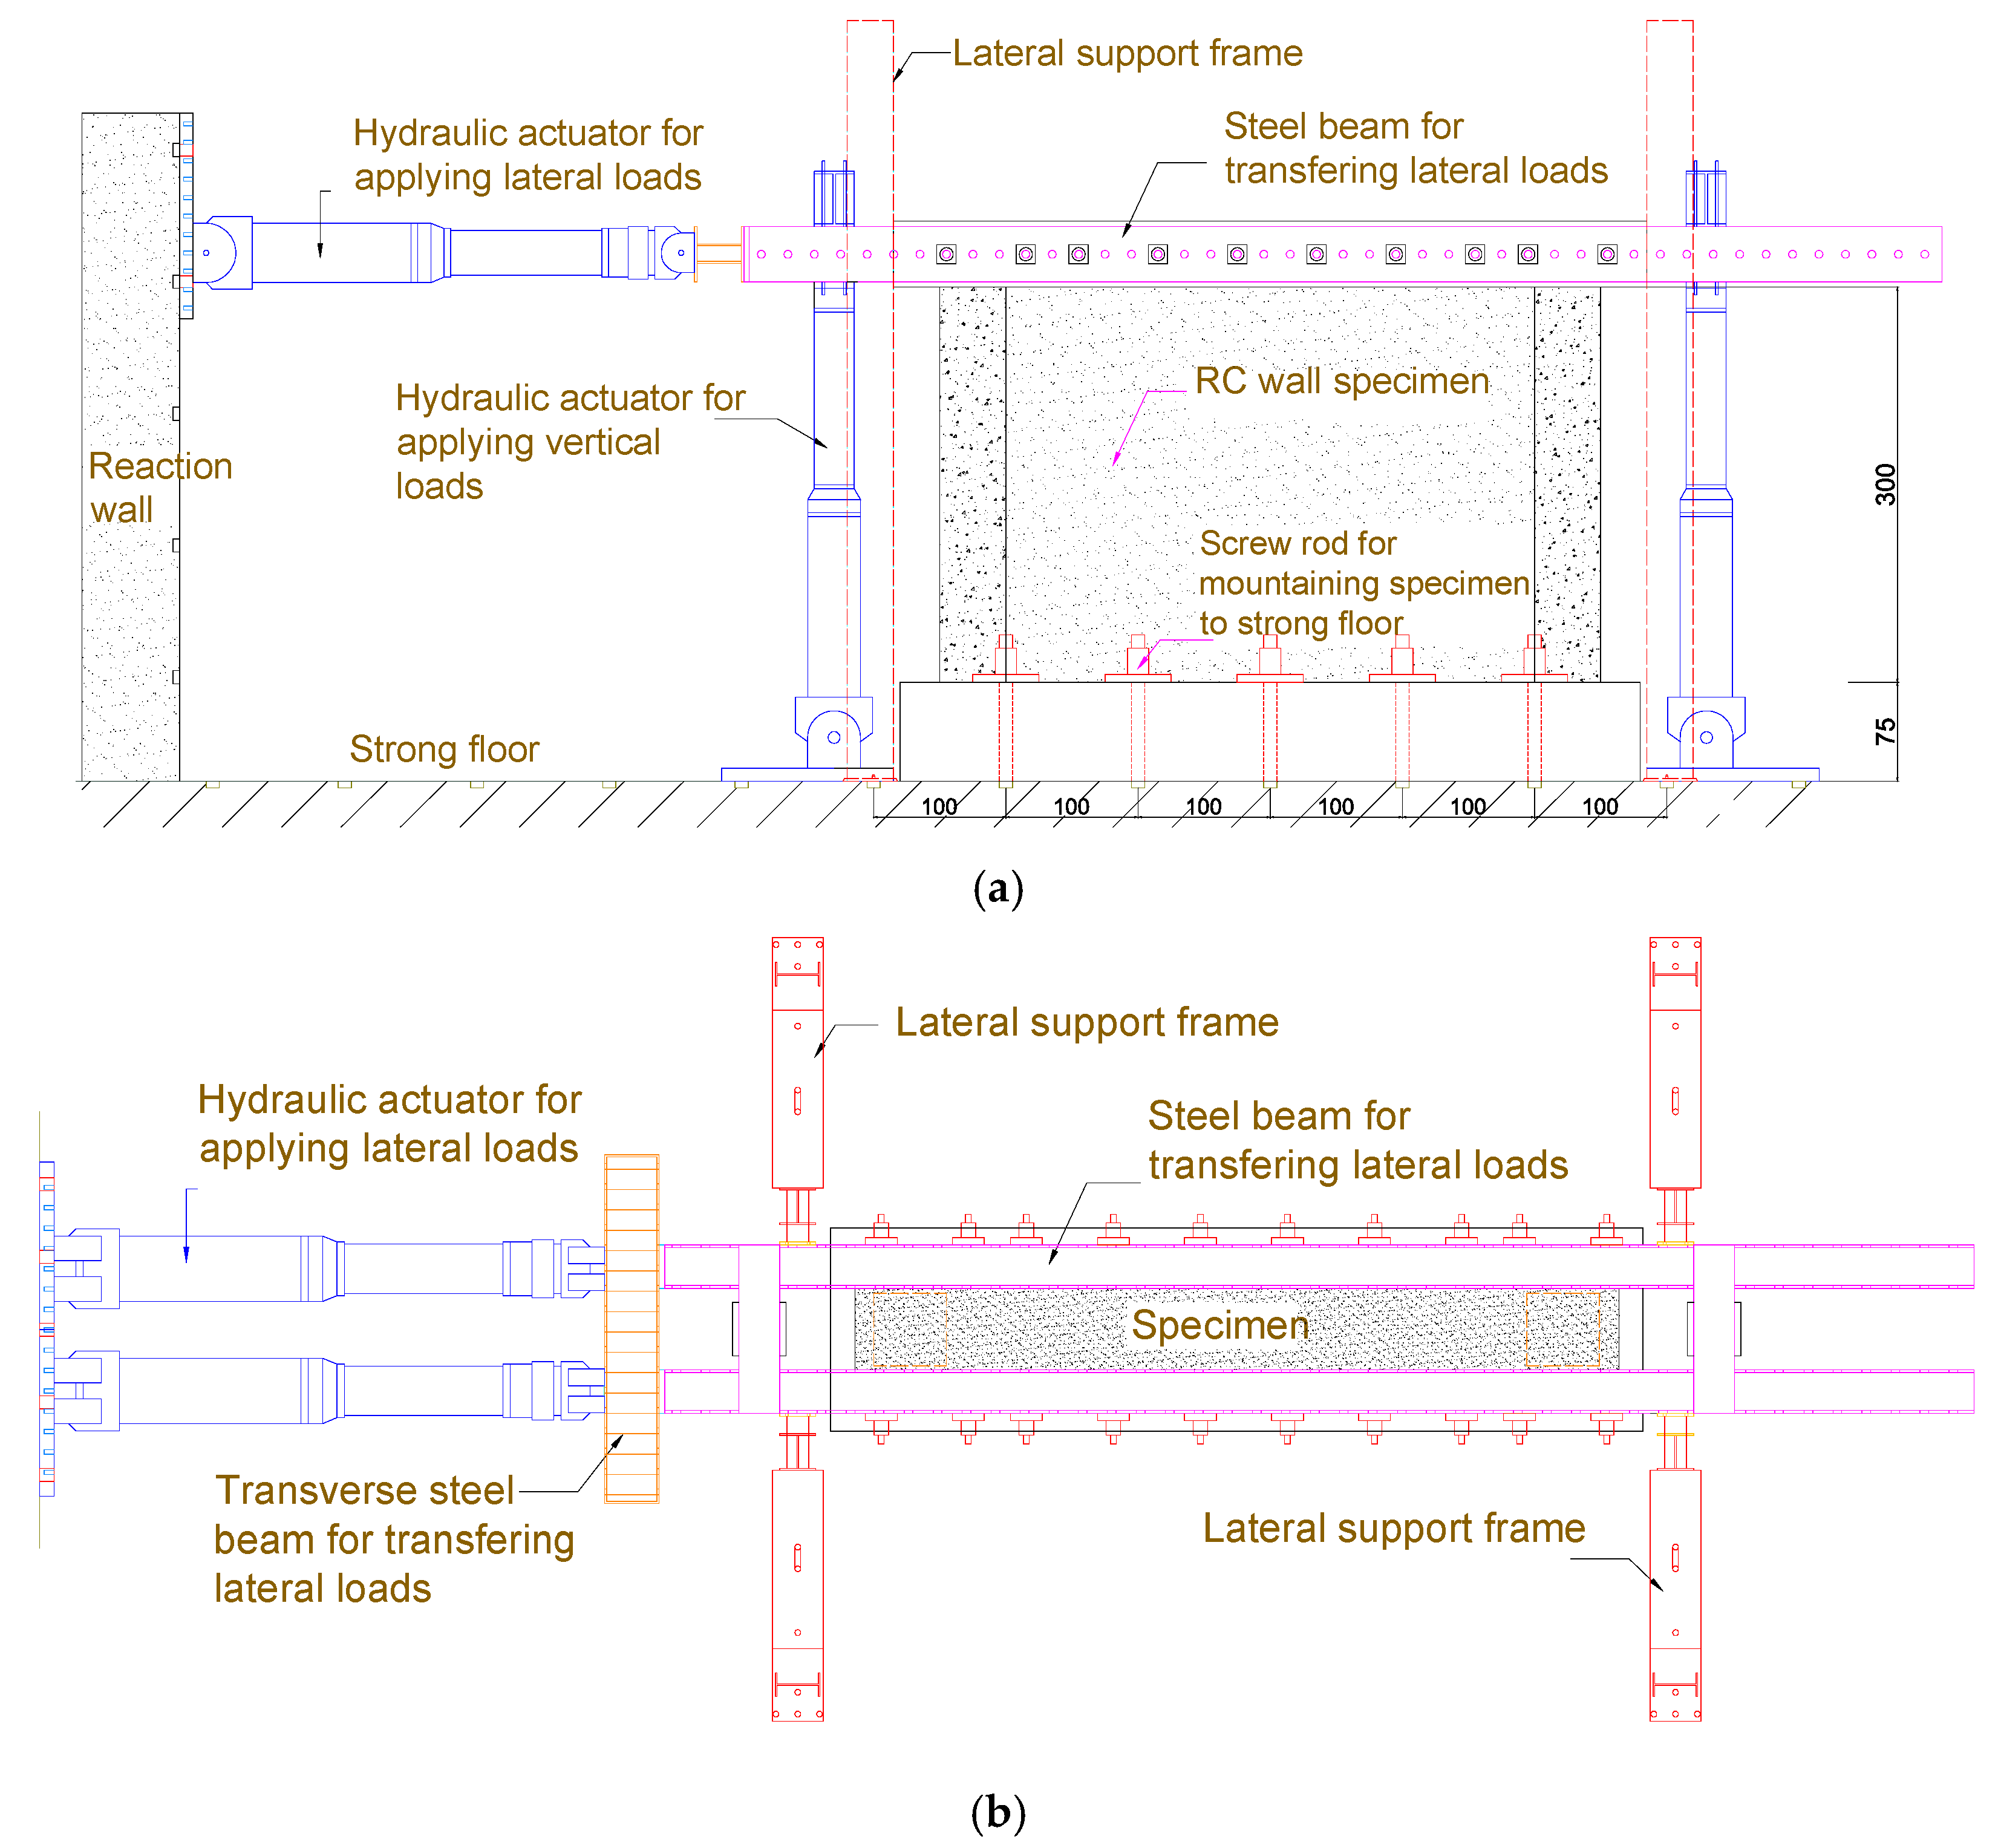
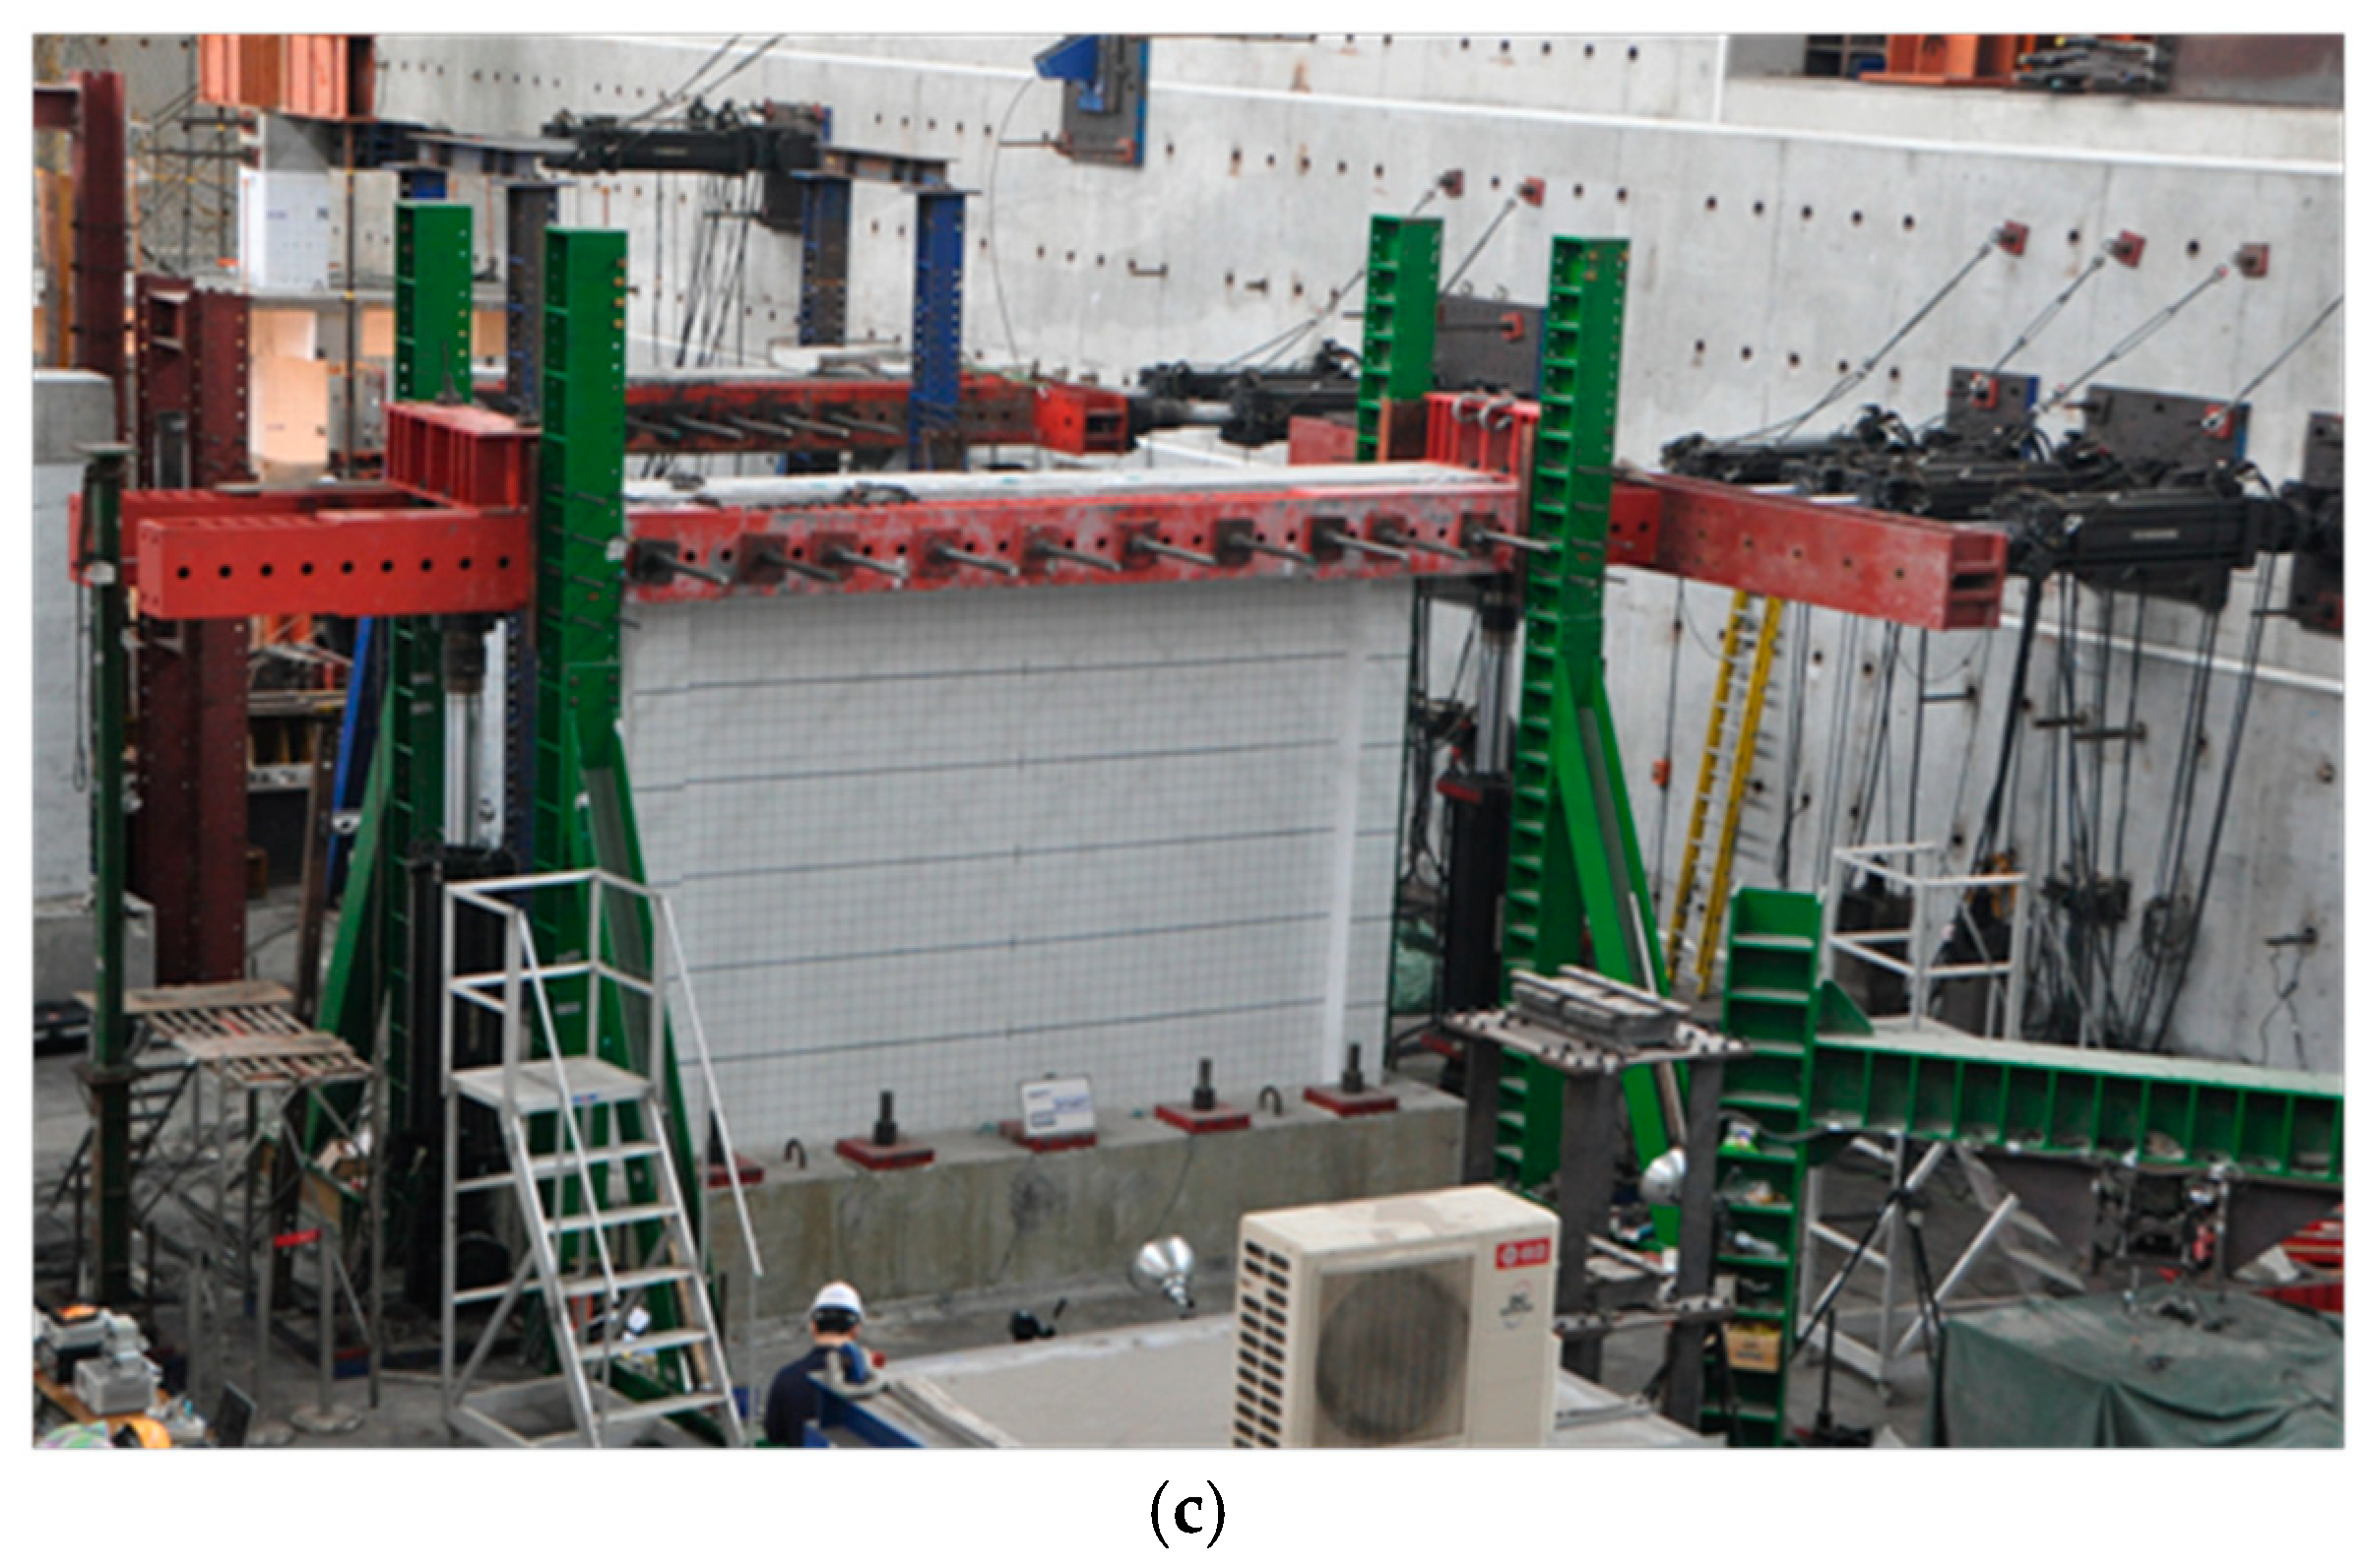
The loading system in this work includes actuators, lateral support frames and a steel rigid beam of loading distribution as shown in
Figure 5. The loading system includes horizontal and vertical actuators to apply horizontal and vertical loading to the tested specimen. Horizontal loading simulates seismic force. Vertical loading simulates a gravitational load. It was applied to 90 tf for vertical of each column using the two vertical hydraulic actuators equipped on the two sides of the wall specimen during the test. Based on the loading-distribution steel rigid beam and steel anchor bolts, horizontal and vertical loadings could be assumed to be uniformly distributed into the beam of the specimen. The load cell on the beam end was used to measure the horizontal loads that were applied by the actuators. Linear variation displacement transducers (LVDT) were used to measure the top and bottom horizontal displacements of the wall panel and a dial gauge was used to monitor the deformation of the foundation.
Figure 5 shows a configuration drawing and photograph of the setup for the reversed cyclic loading test. Steel bracing frames were installed on both sides of the tested specimen to prevent unexpected torsional motion of the wall specimen. A reversed cyclic loading test was carried out with a predetermined increment in drift ratio in each step until the specimen completely failed.
The loading system in this work includes the actuators and a rigid beam of loading distribution, as shown in
Figure 5. The applied loading system in this work includes the horizontal and vertical actuators and could apply the horizontal and vertical loading on a specimen, separately. The horizontal loading could be used to simulate the seismic force. The vertical loading could be used to simulate the gravity load applied into specimens. It was applied 90 tf for vertical of each column using the two vertical hydraulic actuators equipped on the two sides of the wall specimen during the test. Base on the loading distribution steel beam and steel anchor bolts, the horizontal and vertical loading could be assumed uniformly distribute into the beam of specimens. The load cell equipped on the beam end was used to measure the horizontal loads applied by the actuators. The linear variation displacement transducers (LVDT) were used to measure the top and bottom horizontal displacements of the wall panel and the dial gauge was used to monitor the foundation deformation. The configuration drawing and photo of the test setup for the reversed cyclic loading test are shown in
Figure 5. Steel bracing frames were installed on the two sides of the tested specimen to avoid the unexpected torsional motion of the wall specimen. Reversed cyclic loading test was performed with a predetermined increasing drift ratio for each step until the complete failure of the specimen.
In specimen RCW1, the foundation and boundary column were damaged during the test because of the low compressive strength of concrete. In such a design, the existing RC frame is much weaker than the retrofitted member. Therefore, the failure occurs at an interface between the existing RC frame and the retrofitted RC wall. In specimen RCW2, the interface between the top beam and the wall panel was damaged first and then the concrete around the top corner of the wall panel was crushed. Finally, the concrete in the top region of the boundary columns was crushed and severely spalled. In this design, the strength of an interface between the existing RC frame and the retrofitted RC wall is insufficient. Therefore, failure also occurs at an interface between the existing RC frame and retrofitted RC wall.
Piezoceramic-based sensors (PPTs) were post-embedded at predetermined locations after 28 days of concrete casting of the wall panel. The distributed PPTs, labeled with the capital letters “S” and “A” in
Figure 6 and
Figure 7 were used as receivers (sensors) and actuators, respectively. The catalog values of the piezoelectric voltage constants (g
33) and the piezoelectric strain constant (d
33) in the polarization direction for the sensors are 250 × 10
−4 Vm/N and 43 × 10
−11 m/V, respectively; and those for the actuators are 140 × 10
−4 Vm/N and 65 × 10
−11 m/V, respectively. For the post-embedded transducers in the existing RC structures, the size of the SA adopted in the research [
9,
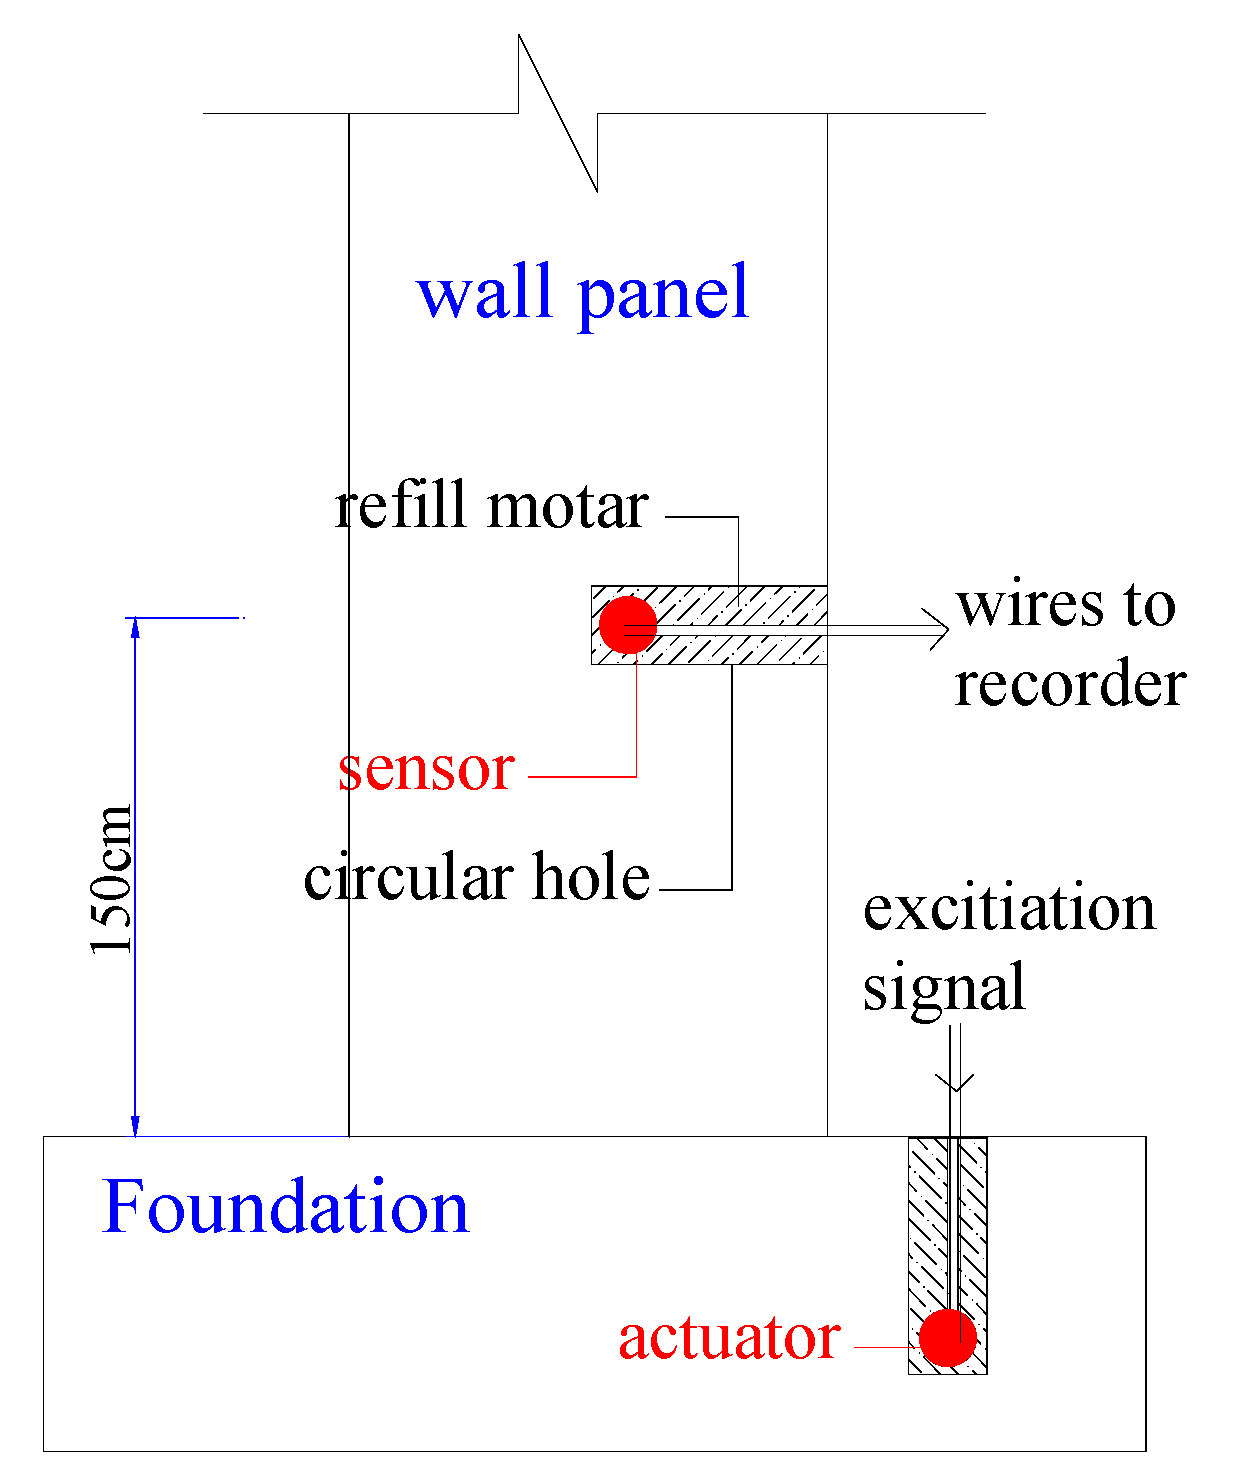
10] is too large for post-embedding them into the RC structures. Therefore, piezoceramic patches that were coated only with a waterproof layer were directly embedded into the structures as sensors and/or actuators for SHM. The transducers are installed by drilling small holes in the wall, top beam and foundation. The depth and diameter of each drilled hole are approximately 8 cm 1.2 cm, respectively. The transducers with a waterproof layer are then placed in the holes, which are refilled with non-shrinking cement mortar.
Figure 6 displays the configuration of the installation of the post-embedded transducers.
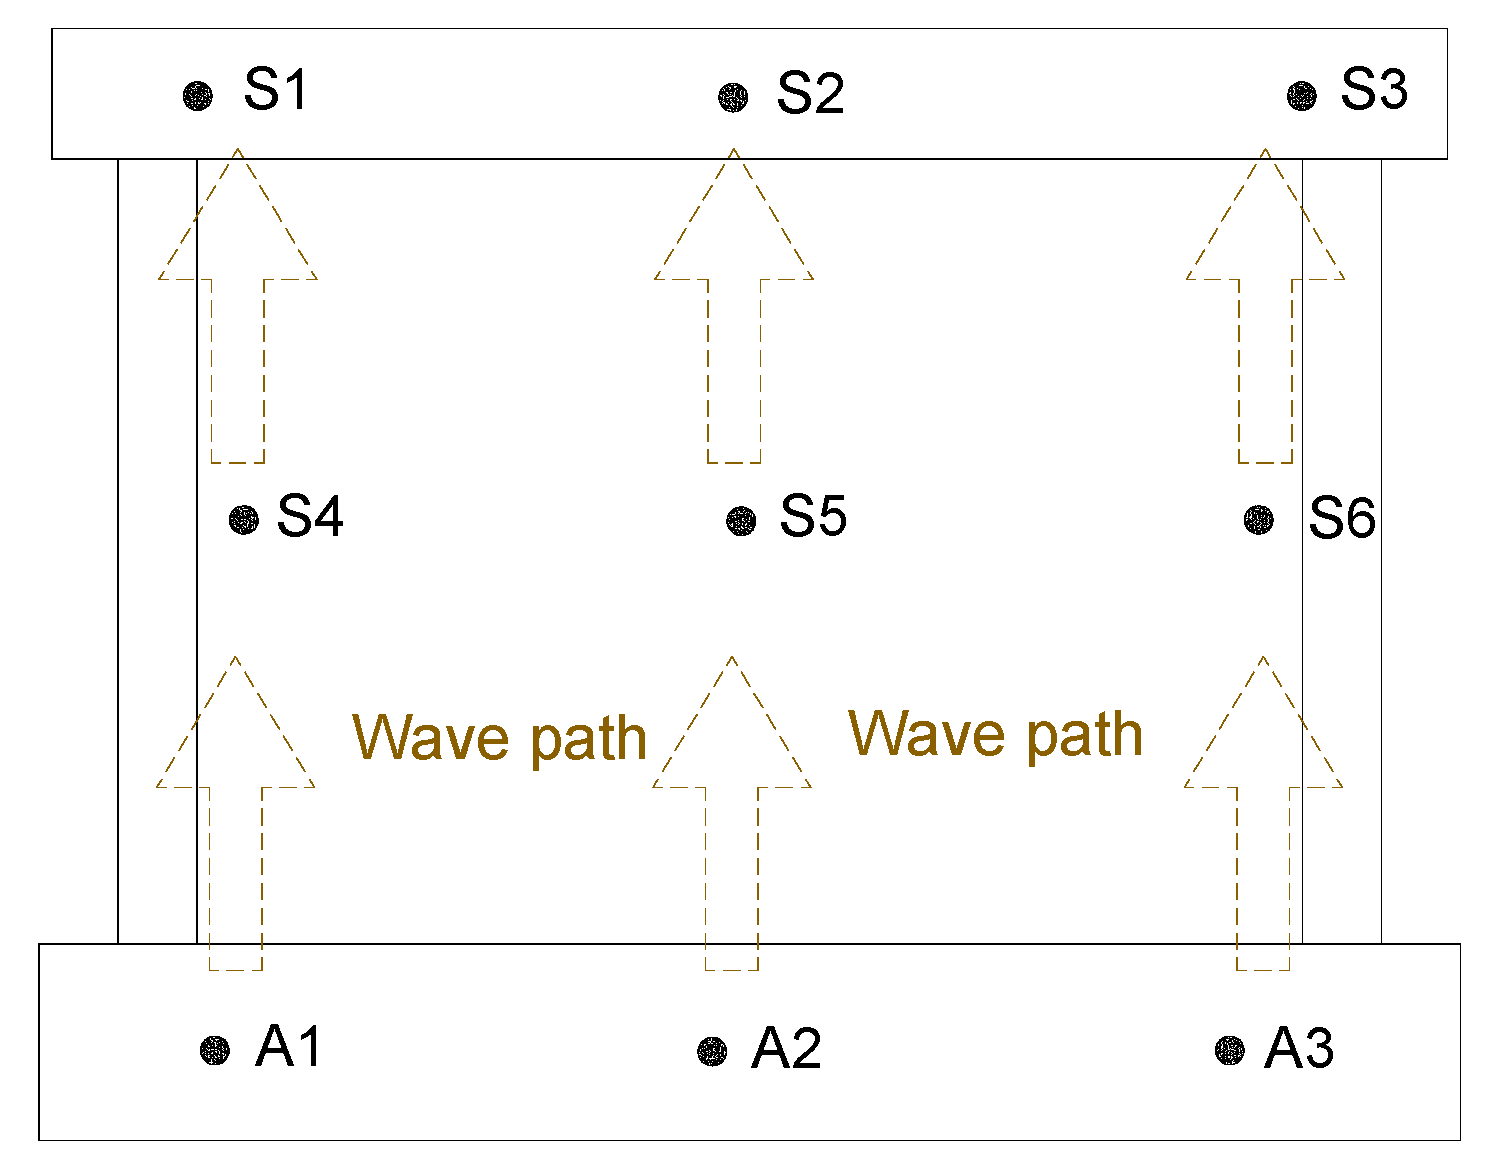
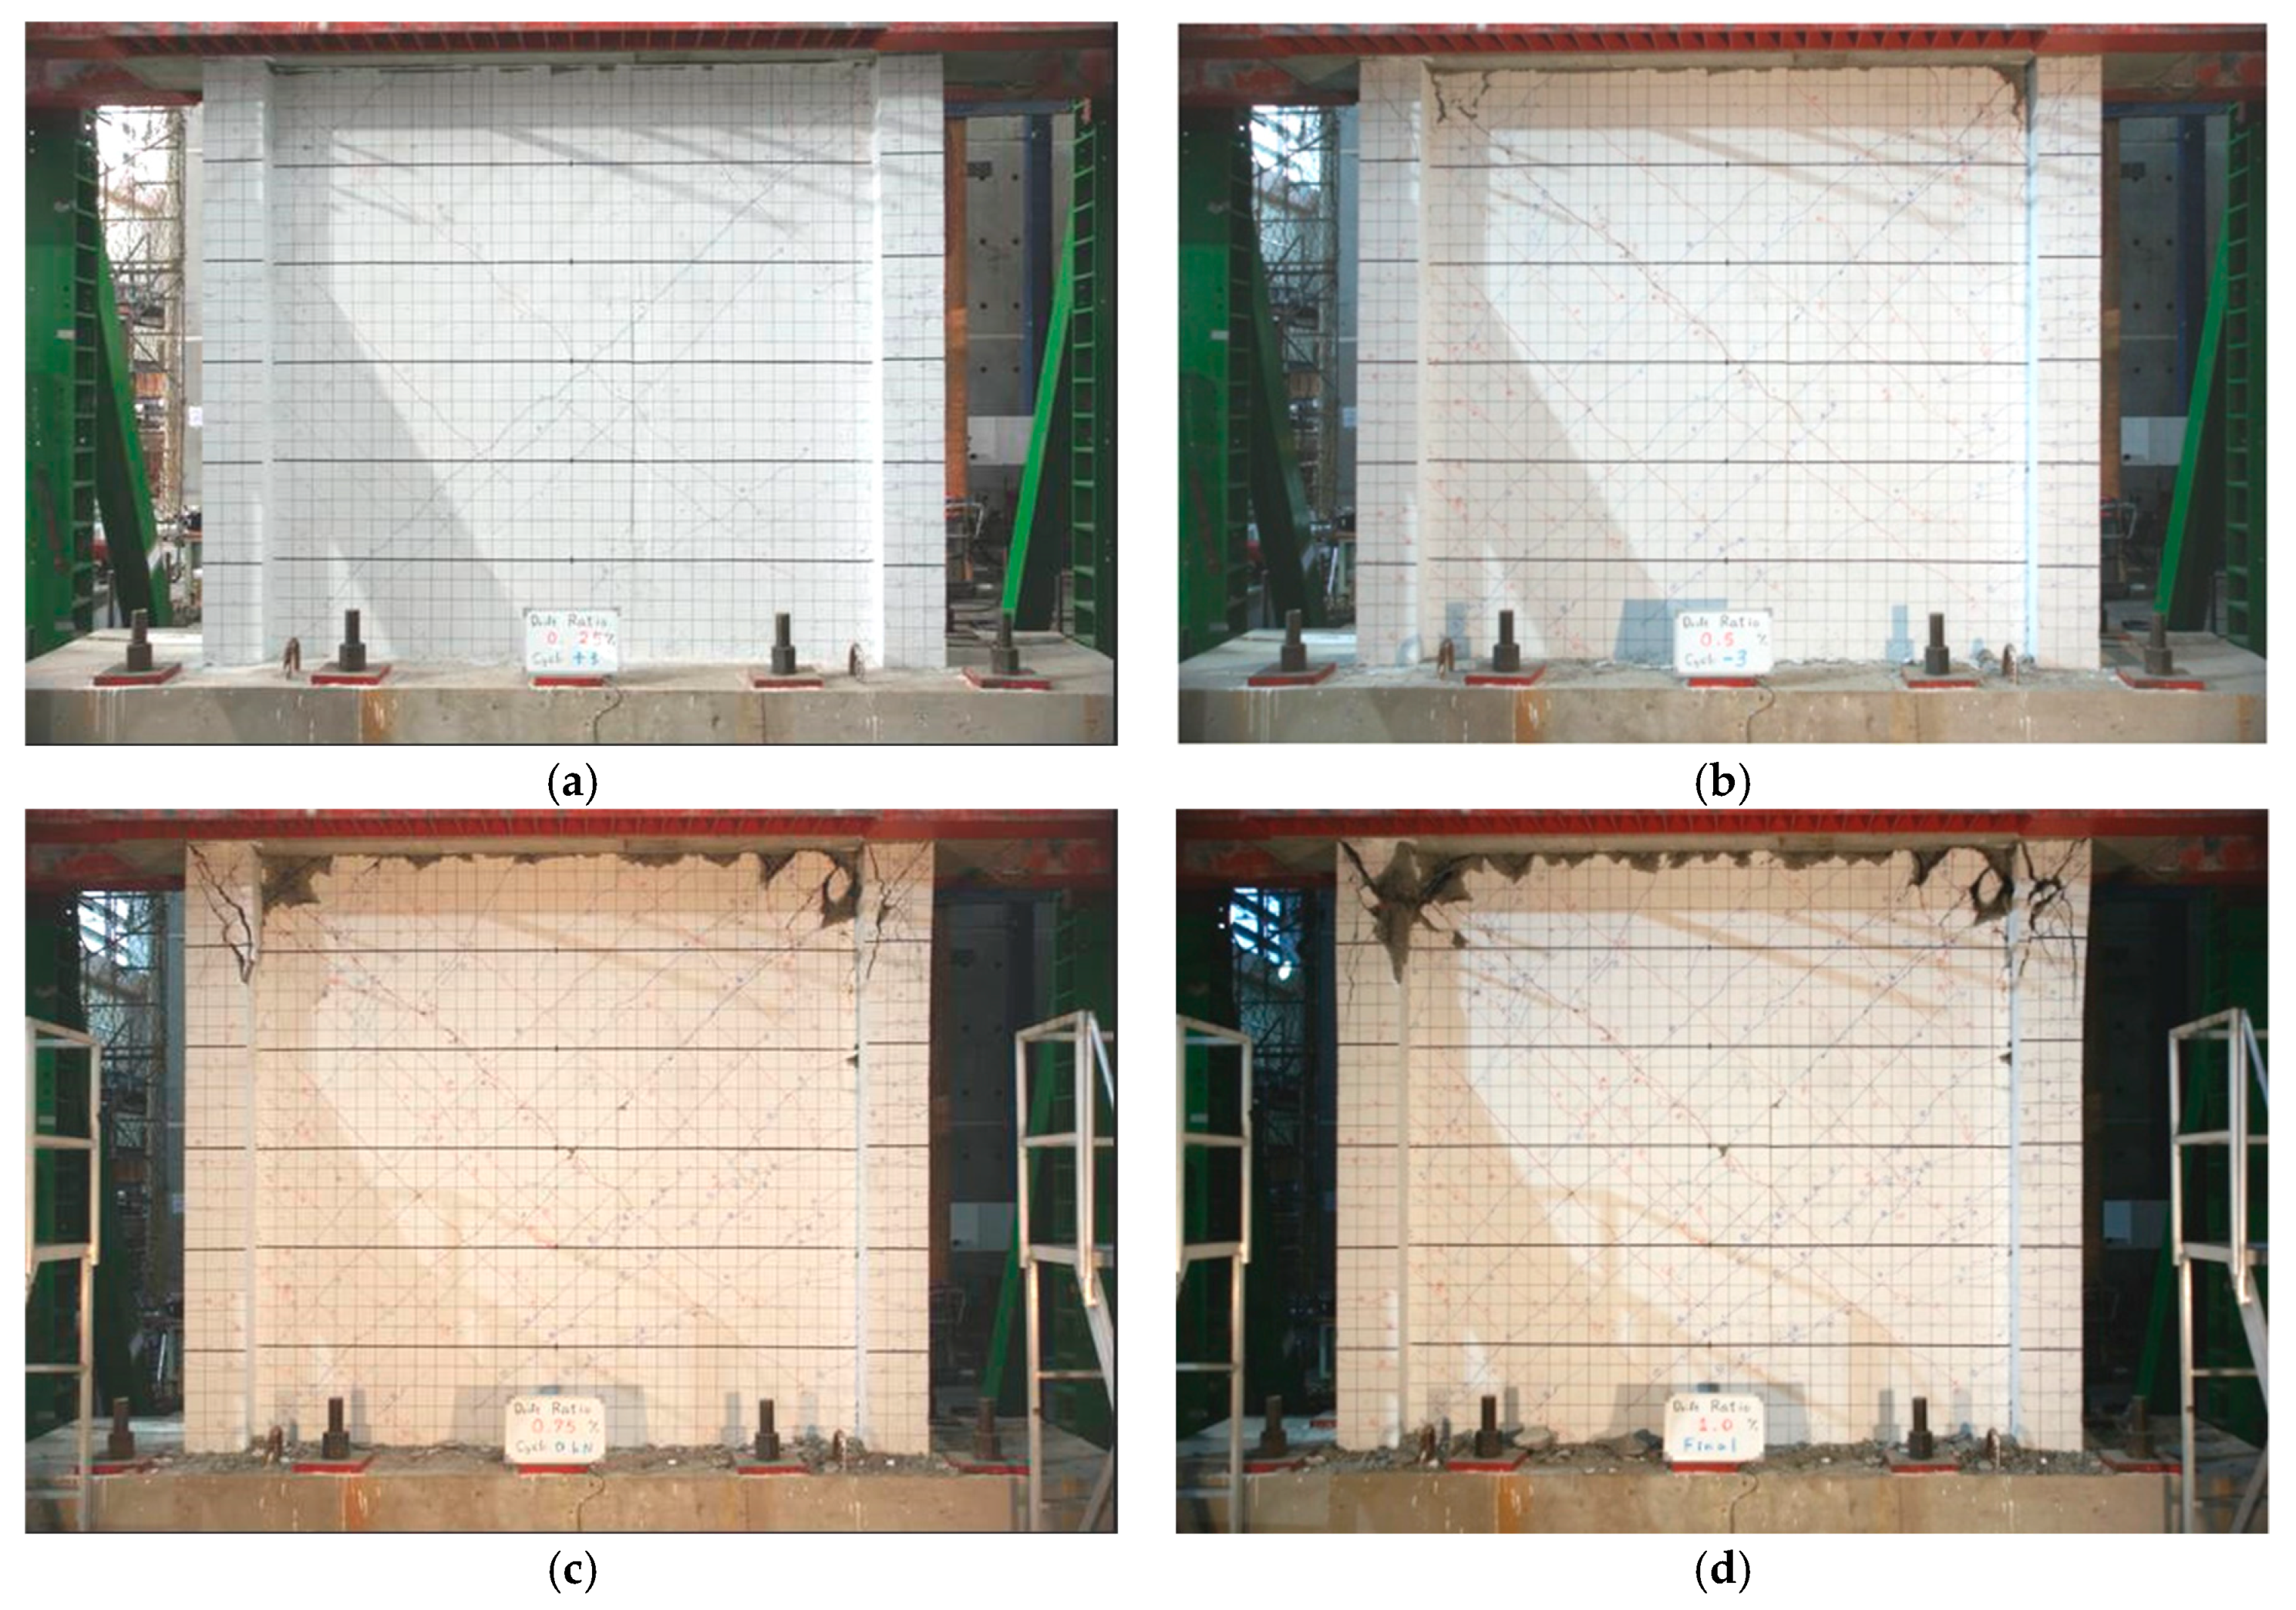
Figure 7 shows the locations of the PPTs in the foundation, wall and foundation. The wave paths for monitoring are also shown in figure. Each specimen has nine PPTs as depicted in
Figure 7. Six (S1–S6) are embedded as sensors in the top beam and in the middle-height region of the wall panel. The others (A1–A3) are set in the foundation as actuators. Wave signals that are received from the sensors are used to assess the state and location of damage throughout the wall structure.
The adopted piezoceramic-based sensing system has a favorable high-frequency response and provides active sensing. Its high-frequency response property can be used to detect very minor damage and/or small cracks that cannot be identified by visual inspection. In the active sensing, one PPT actuator can send the desired excitation stress waves so that other PPT sensors can receive response signals. Analyzing the received stress wave signals provides information about the structural health of the tested RC wall structure, including the severity of cracks and/or damage status.
3. Health Monitoring and Test Results
The structural health monitoring test is based on the use of some PPTs as actuators to generate propagation stress waves and others as sensors to receive the waves. The amplitude of propagation waves is attenuated by the presence of cracks and damage inside the concrete wall structure, causing the transmitted energy of the propagation waves to decline as their amplitude decreases. Therefore, the drop in propagation wave amplitude or transmission energy between the healthy and damaged states of the structure is related to the severity of the cracks or damage inside it. The transmission energy that is received by the sensor is given by
where
ti and
tf are the times for starting and end of the measurement, respectively,
v express the filtered piezoelectric signal that passed the band-pass filter with a bandwidth from 0.98
to 1.02
Hz, where
is the excitation frequency of the actuator.
Eh is the transmission energy of the sensor when the structure is healthy and is evaluated using Equation (1).
Ei is the transmission energy of the damaged RC wall structure after the test run
i. The energy-based damage index (D.I.) of the RC wall structure after the test run
i is given by
This damage index yields the damage status to the structure based on the transmission energy difference between the healthy and damaged states. A damage index close to zero expresses that the RC wall is in a healthy state or has only negligible damage. A damage index of close to unity means that the structure is very seriously damaged.
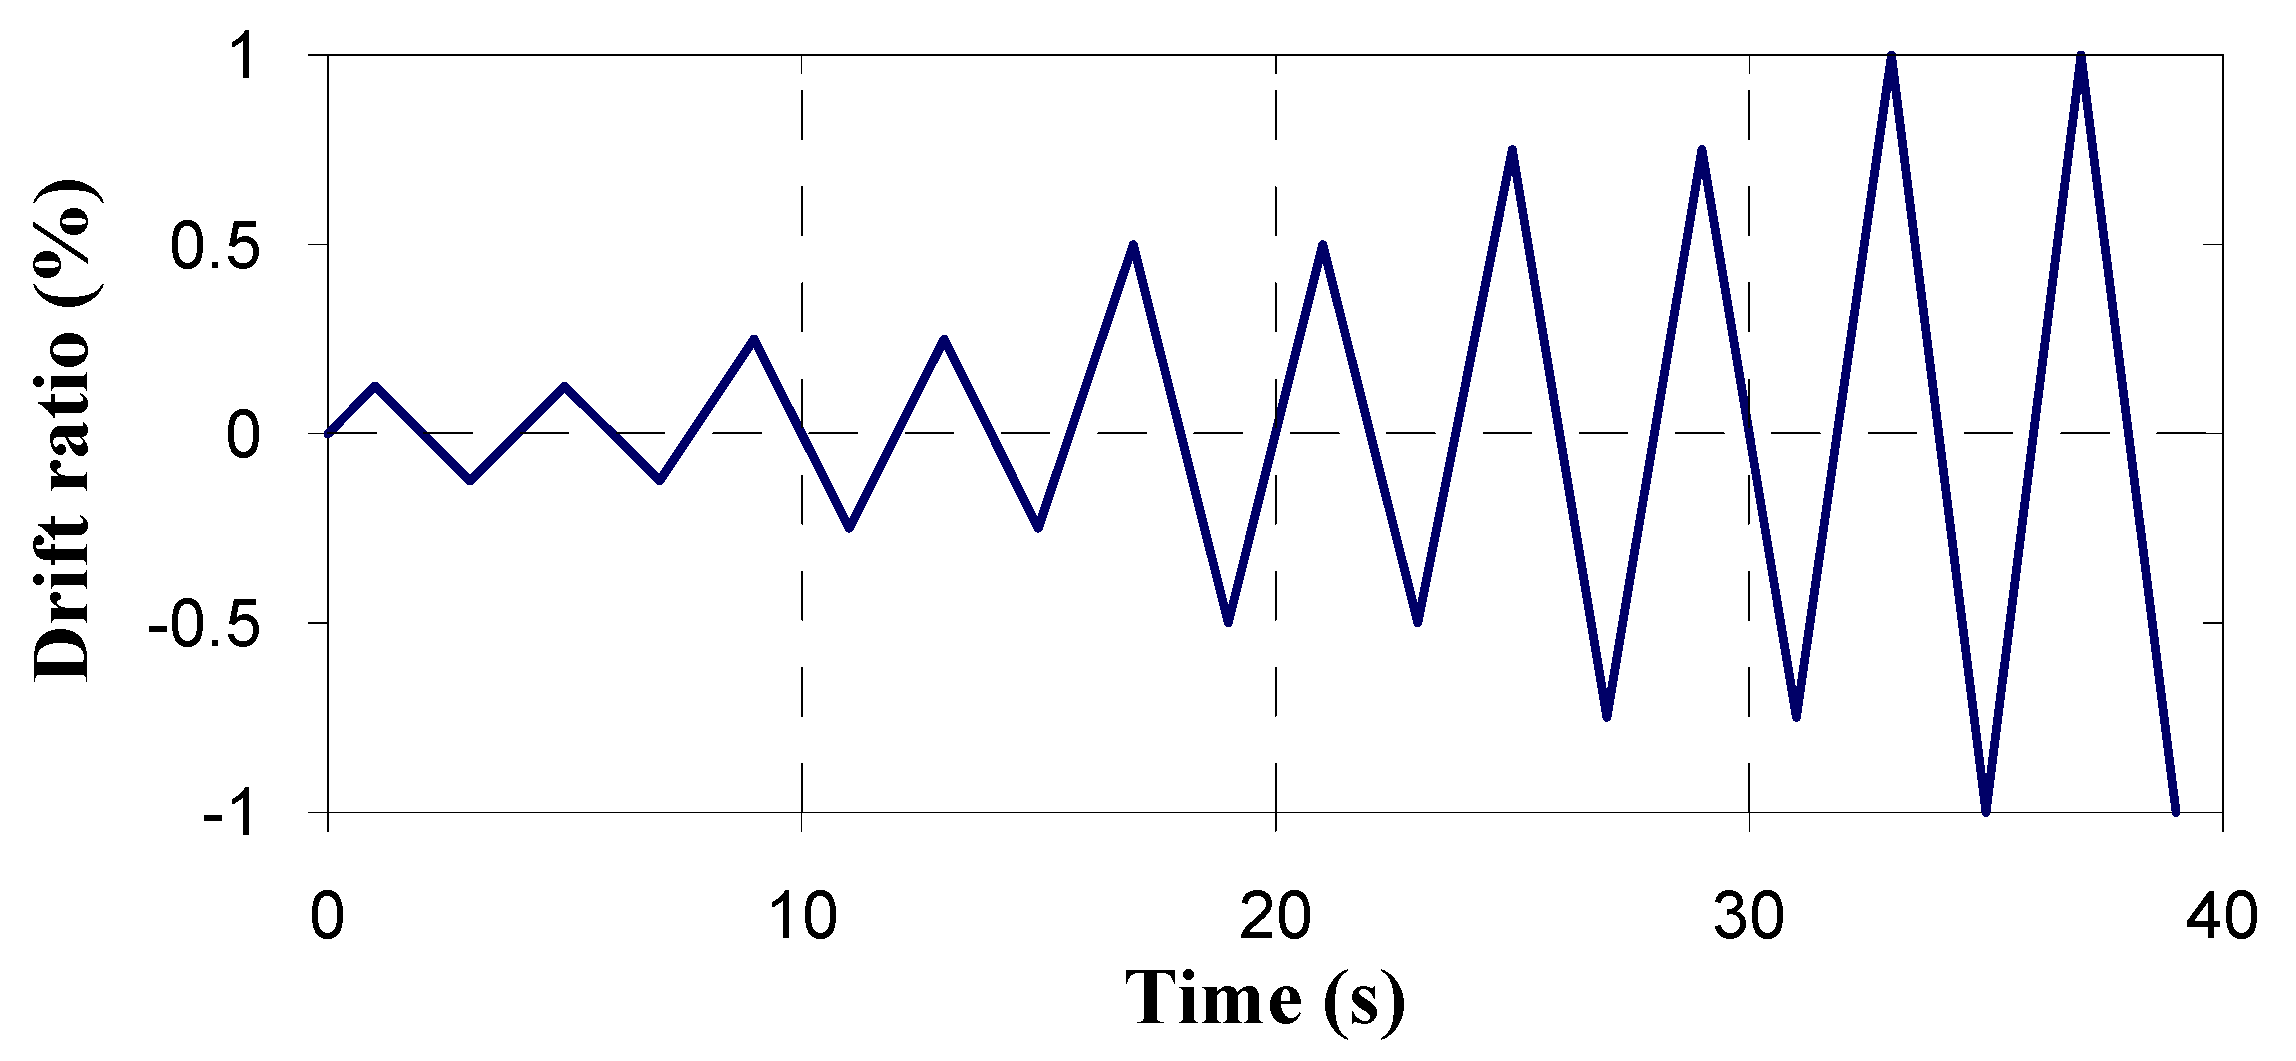
This work applied the cyclic horizontal loads on the top beam of the specimens using the displacement control, as shown in
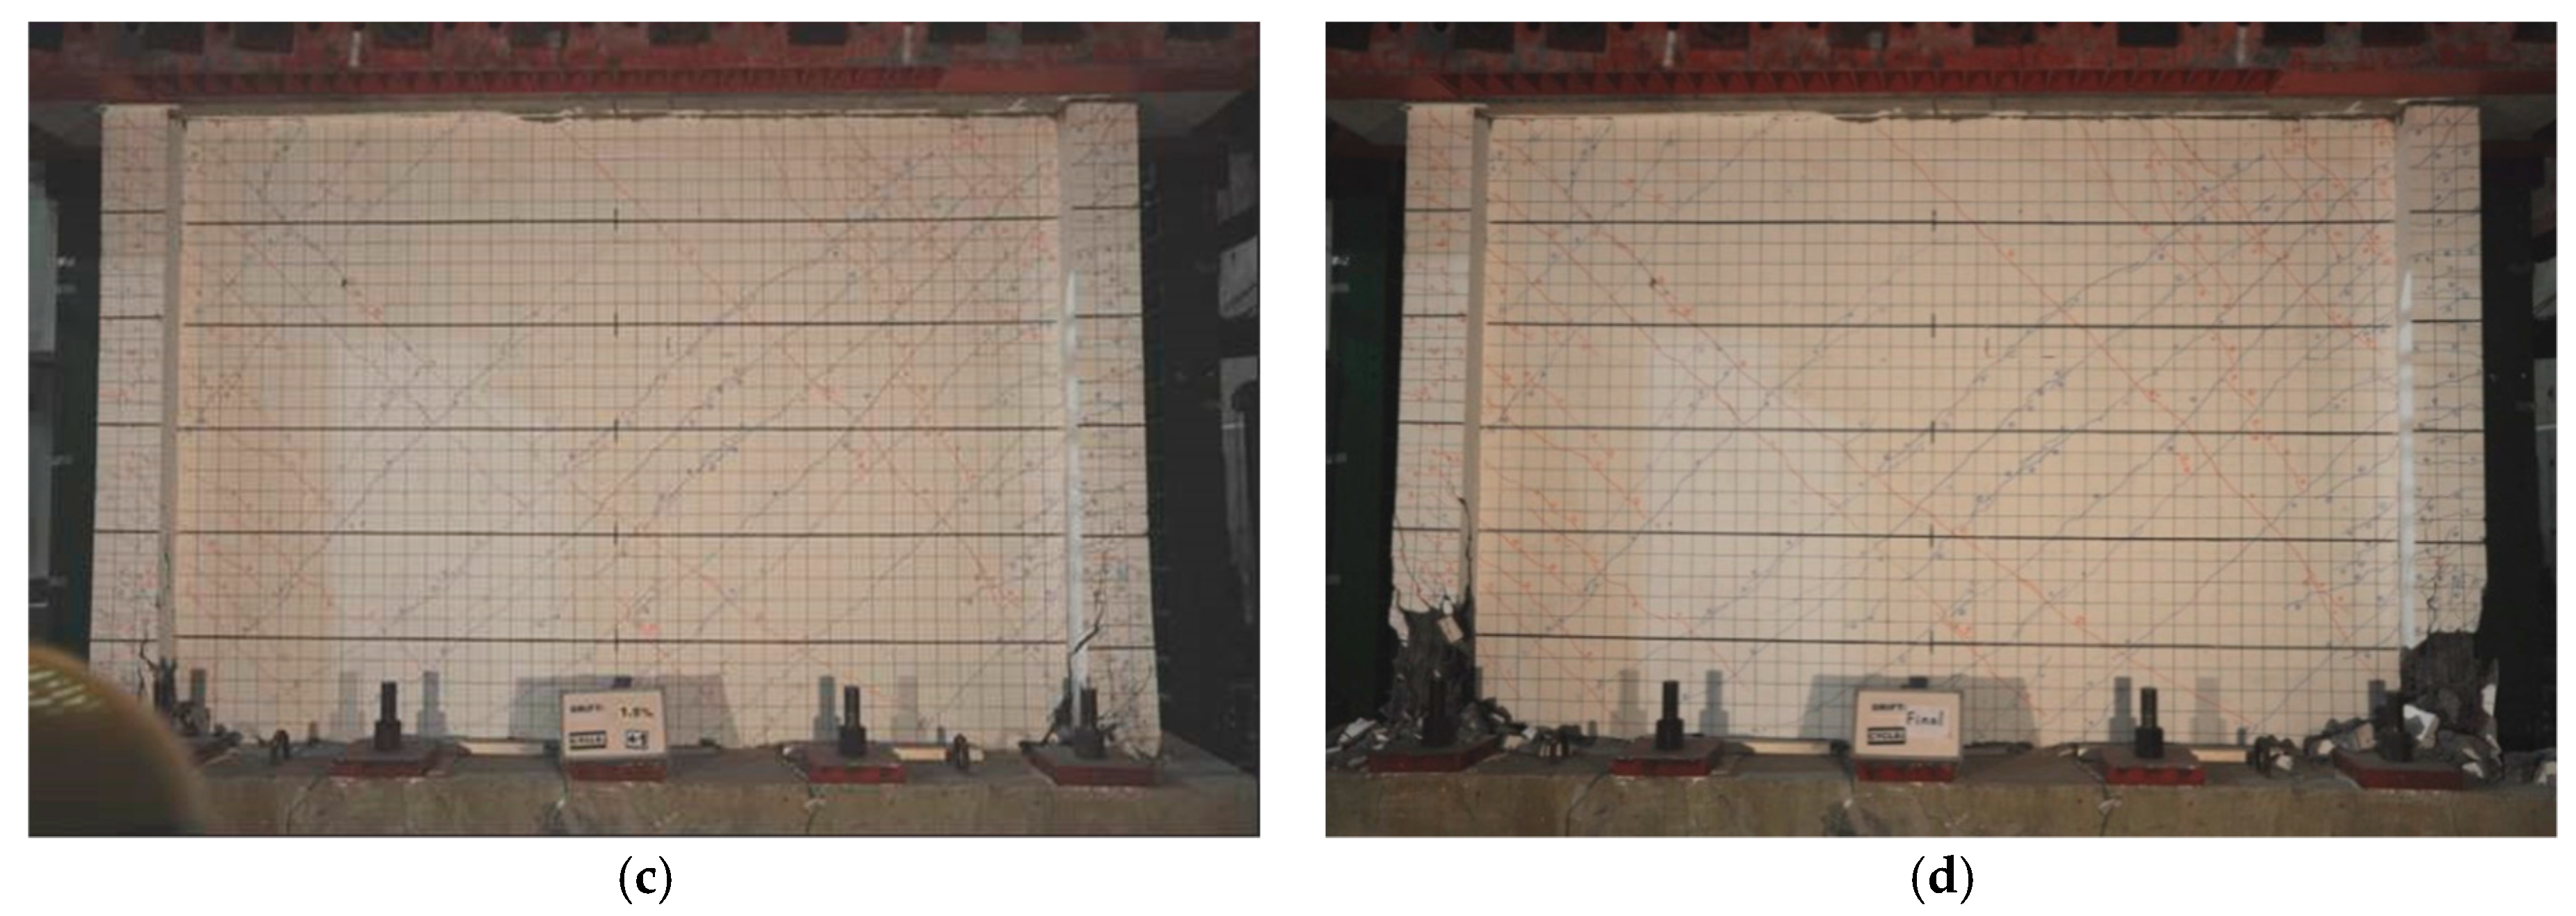
Figure 8. For the specimen of RCW1 at the drift ratio of 0.25%, the slight cracks developed horizontally at the bottom end of the boundary columns. Additionally, the cracks with an inclination angle close to 45 degrees distributed uniformly in the region of the wall panel. At the drift ratio of 0.5%, the crack development is similar to the drift of 0.25%. However, the foundation and bottom end of the boundary columns have slight spalling of concrete cover since their compressive strength of concrete is relatively lower than the wall panel.
Figure 9 shows the cracking patterns at each drift level and the final failure status of the specimen at the drift ratio of 1.0% and the concrete at the bottom end of the boundary columns and foundation crushed in the second cycle. The experimental results showed which the foundation of the existing RC frame is much weaker than the retrofitted RC wall. Then, the failure could be found at the interface of the foundation of the existing RC frame and the retrofitted RC wall. The major cracks could be found on the positions of the foundation of the existing RC frame under the boundary columns. Due to the specimen was failed in bending behavior, the middle part of the interface of the foundation of the existing RC frame and the retrofitted RC wall was not found with too many cracks.
For the specimen of RCW2 at the drift ratio of 0.25%, the crack development is similar with RCW1. When the drift ratio reached 0.5%, the extended cracks with the width of 1 mm at the interface between the RC wall panel and top beam are observed.
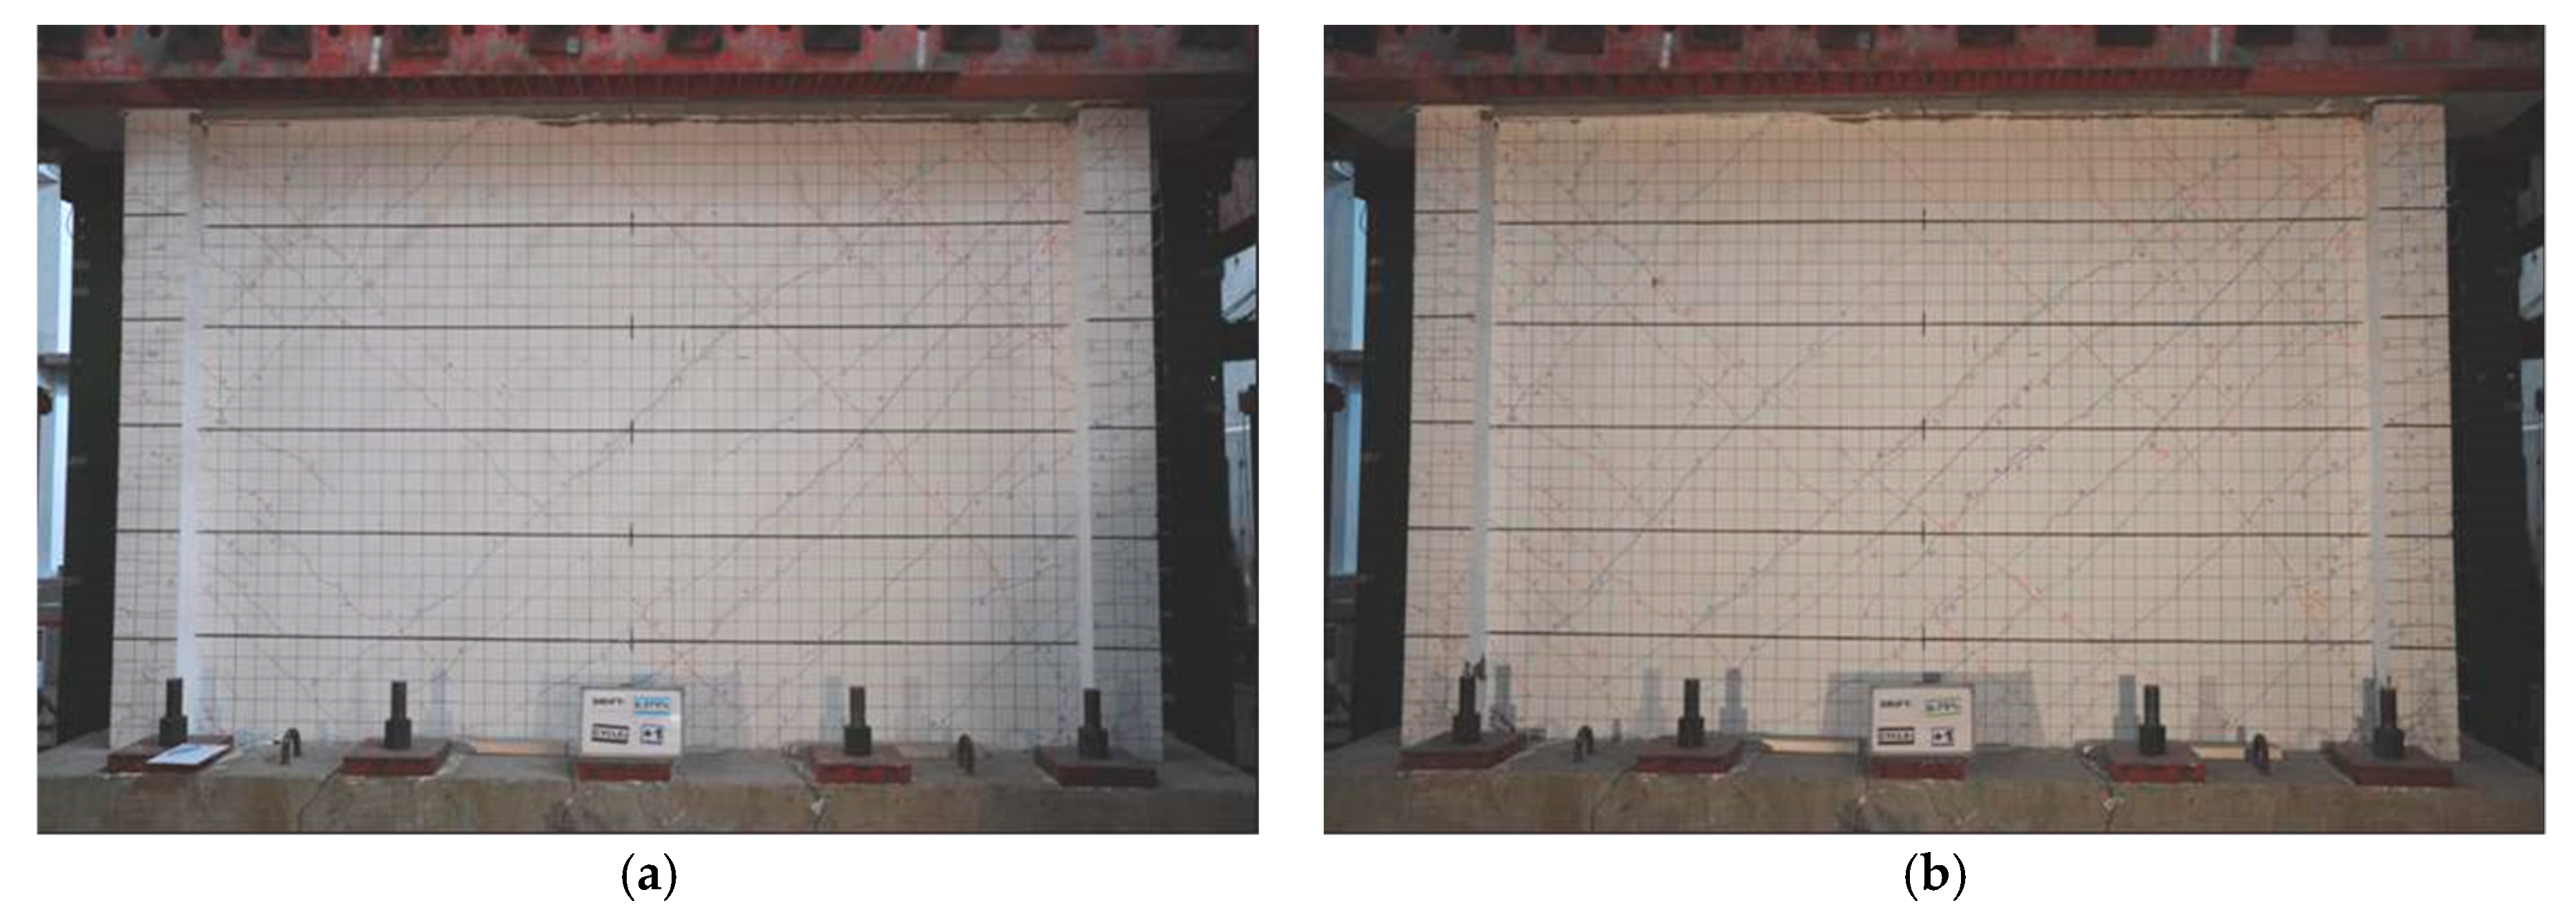
Figure 10 shows the cracking patterns at each drift level and the final failure status of the specimen. The failure mode of RCW2 occurs at the drift ratio of 1.0% in which the concrete at the top end of the boundary columns and at the wall top corner crushed in the second cycle. This experimental results showed that the strength of the interface of existing RC frame and the retrofitted RC wall is not strong enough to transfer the shear force. Then, the failure could be found at the interface of the beam of the existing RC frame and the retrofitted RC wall. The failure of the interface of the beam and the wall was also resulting in the failure of boundary columns.
Piezoelectric-based sensing was used to perform the SHM of the tested RC wall after specific drift during the test. The energy-based damage index, given by Equation (2), was used to quantify the severity of structural damage. For the excitation stress wave signal of the PPT actuator, a swept sine wave with a wide frequency range provided a favorable excitation for monitoring purposes because it contained low to high-frequency response signals [
10]. Since, the 60 Hz AC electrical power in the lab strongly interfered with the data acquisition system at repeated frequencies such as 60 Hz, 120 Hz, 180 Hz,… Therefore, the swept sine wave excitation could not be used for this test. Instead of the swept sine wave, single frequency sinusoidal waves with frequencies of 100 Hz, 1 kHz and 5 kHz and with a duration of 10 s were used as excitation stress waves for the PPT actuator in this health monitoring experiment. An NI (National Instrument, Inc.) system was adopted to send out the stress wave of the PPT actuator and to receive the transmitted stress wave from the PPT sensor. The excitation signals that were generated from the function generator were 10 V (peak to peak) and were amplified by the power amplifier up to 100 V. The sampling frequency of the signals received by each PPT sensor channel was 50 kHz, obtained using an NI-DAQ-6259 data acquisition system.
For each specimen, when a specified drift ratio is reached under cyclic loading, the PPTs are used to conduct SHM and to locate damage in the specimen.
Figure 11 shows the concept of local damage detection; the wall panel is divided into three regions (path) and each region has a main actuator. The severities of damage in the difference regions are compared and serious damage is located. First, actuator A1, as depicted in
Figure 7 and
Figure 11, is used to generate a stress wave with frequencies of 100 Hz, 1 kHz and 5 kHz. Sensors S1 and S4, which are embedded in the wall panels and beams at a middling height, receive the stress waves. The damage index in Equation (2) is calculated and the damage state in each of the propagation paths from A1 to S4, A2–S5 and A3–S6, is identified. Comparing the damage indices that are obtained upon excitation by A1, A2 and A3 reveals the severity of damage in each path and allows serious damage to be located. In SHM using a piezoelectric-based sensing system, the arrangement of actuators and sensors may strongly influence the obtained values of the damage index. Since the damage status of a structure member between an actuator and sensor differs, then damage index is affected by the locations of sensor and actuator. Therefore, the proposed method is better suited to diagnosing local damage to a structure as in this test than to diagnosing the overall damage to the entire structure. For example, in this investigation, actuator A2 was installed in the middle of the foundation and sensor S2 was installed in the center of the wall panel. The signal that was excited by A2 and received by S2 can be used to detect the local damage status of the lower center of the wall panel. Although the sensitivity limit and resolution of the sensing system may be influenced by the propagation distance of the excitation wave, the test results demonstrate that the proposed damage index reflects the severity of structural damage.
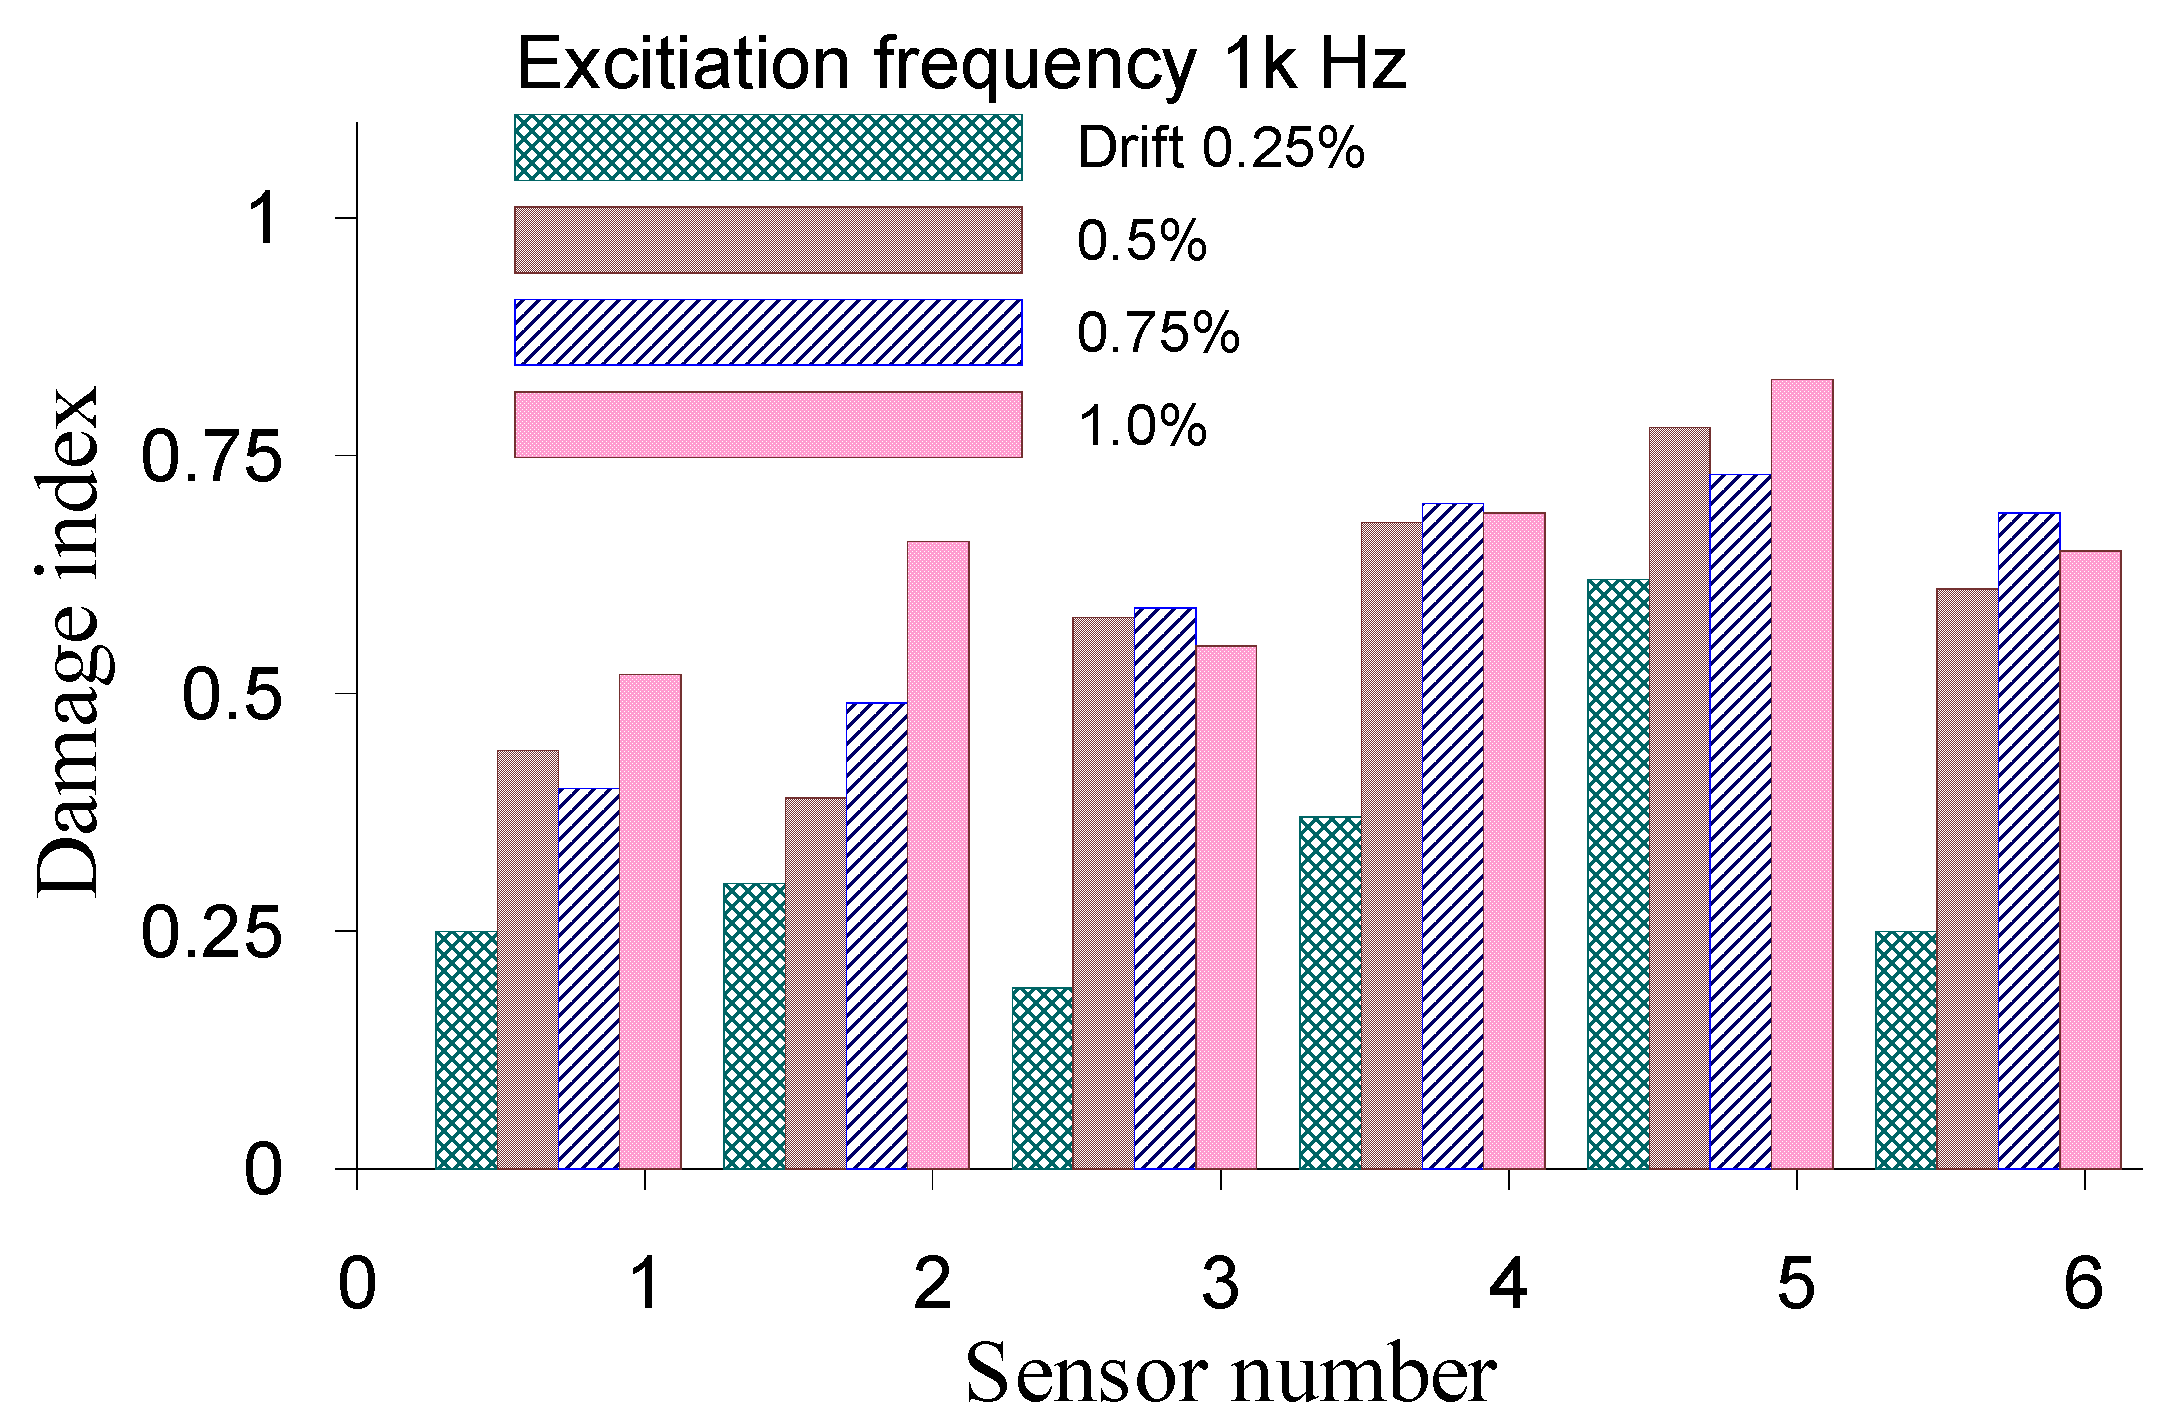
Since the results obtained from the excitation frequency of 5000 Hz is similar to 1000 Hz, the work only demonstrates the results obtained from the excitation frequencies of 100 Hz and 1000 Hz.
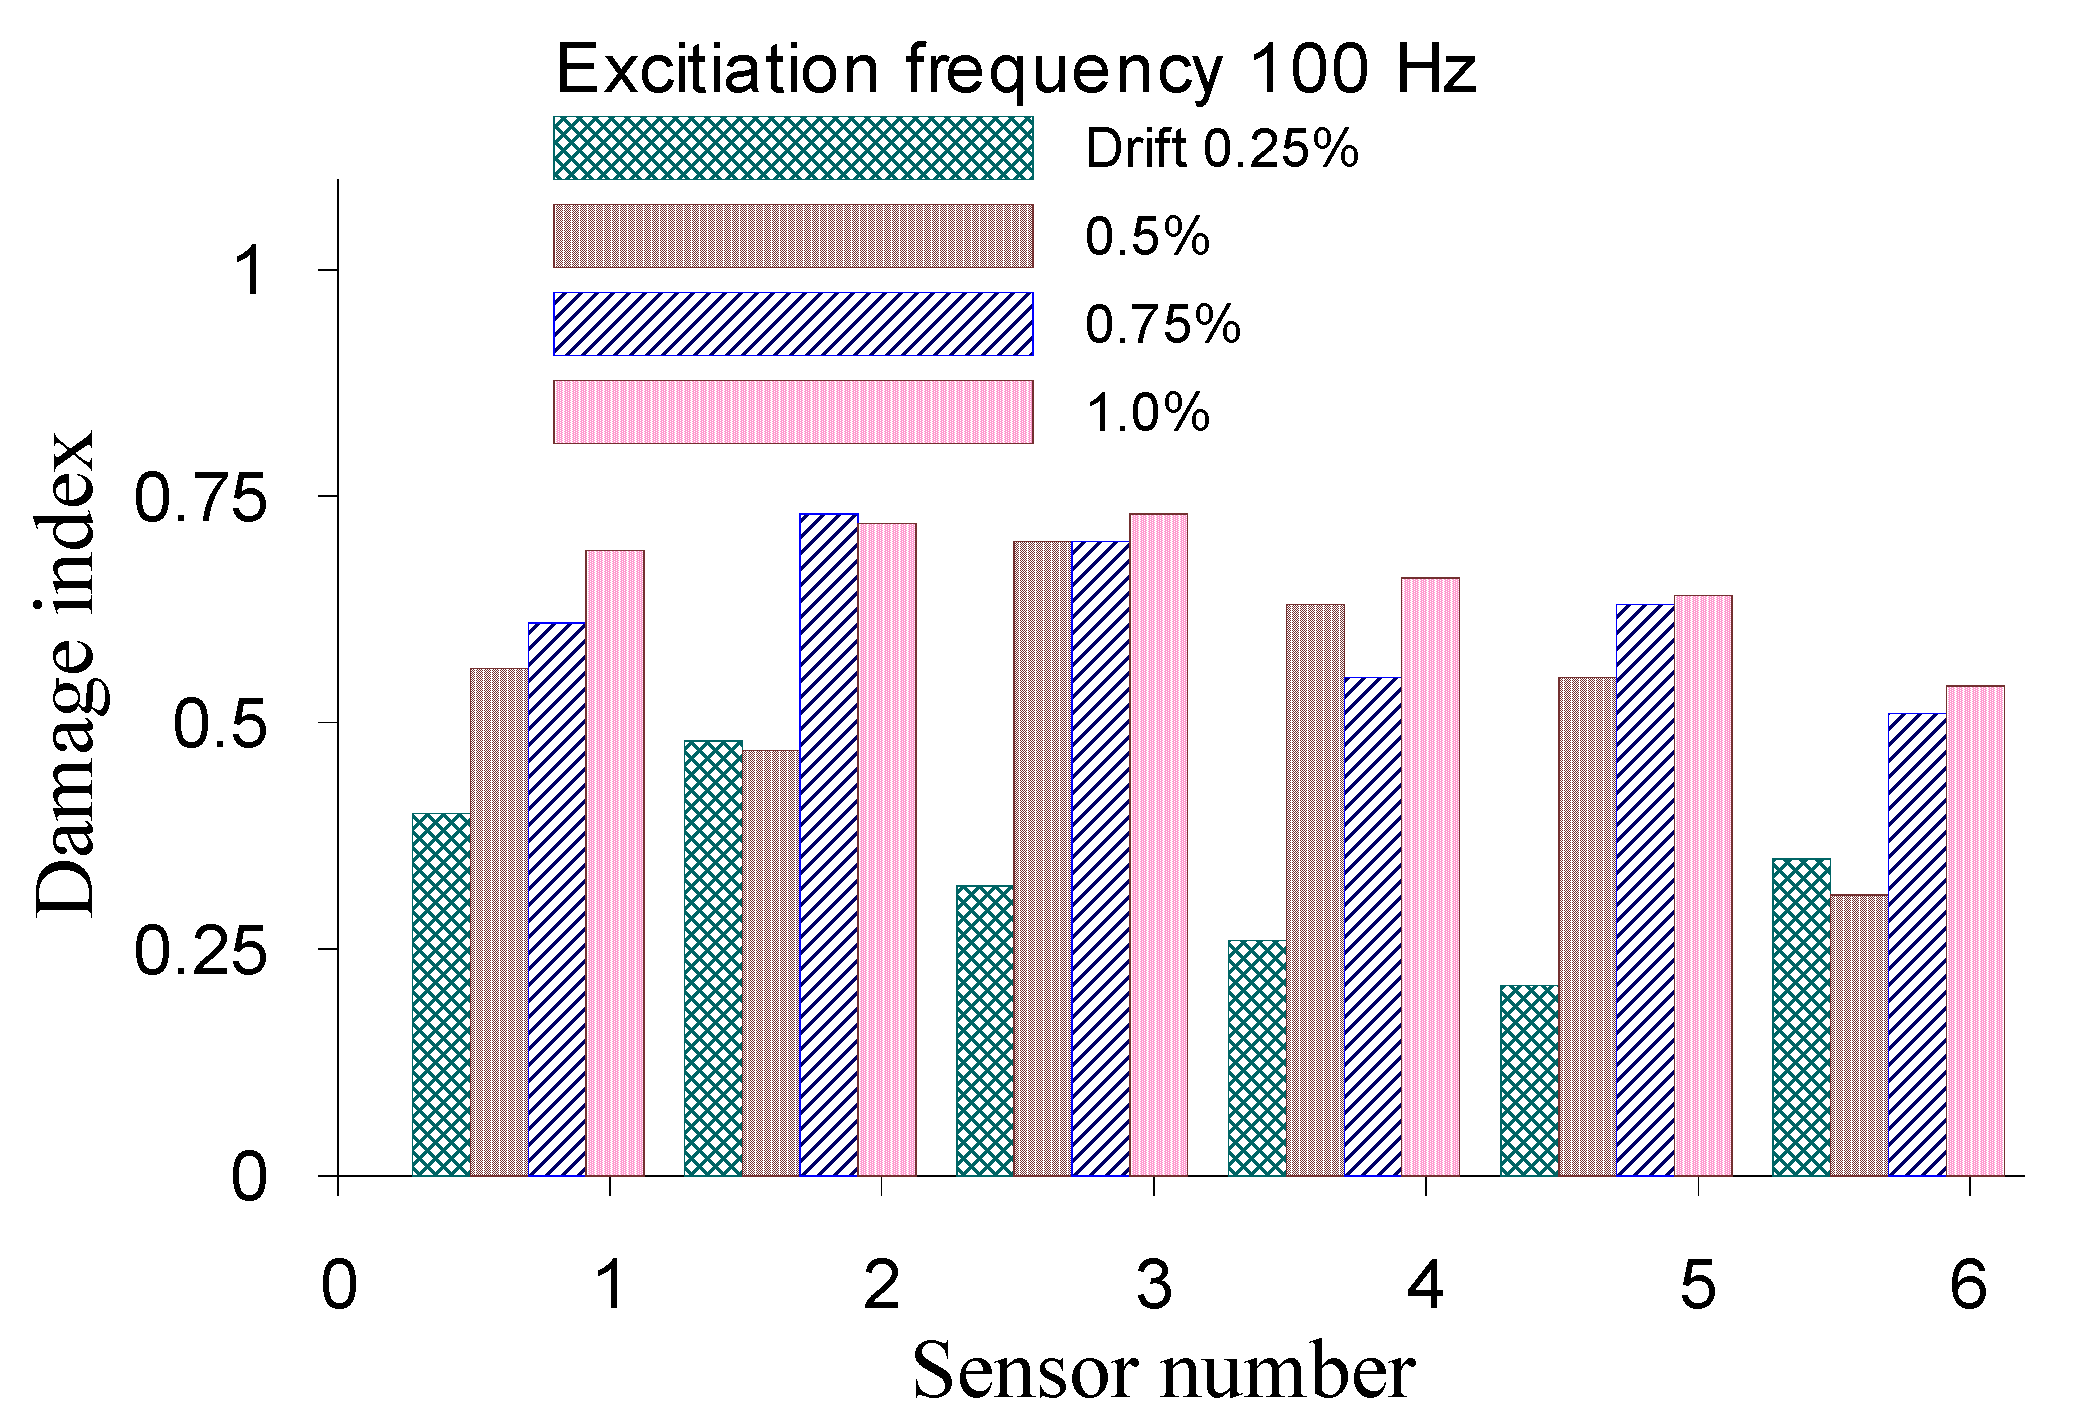
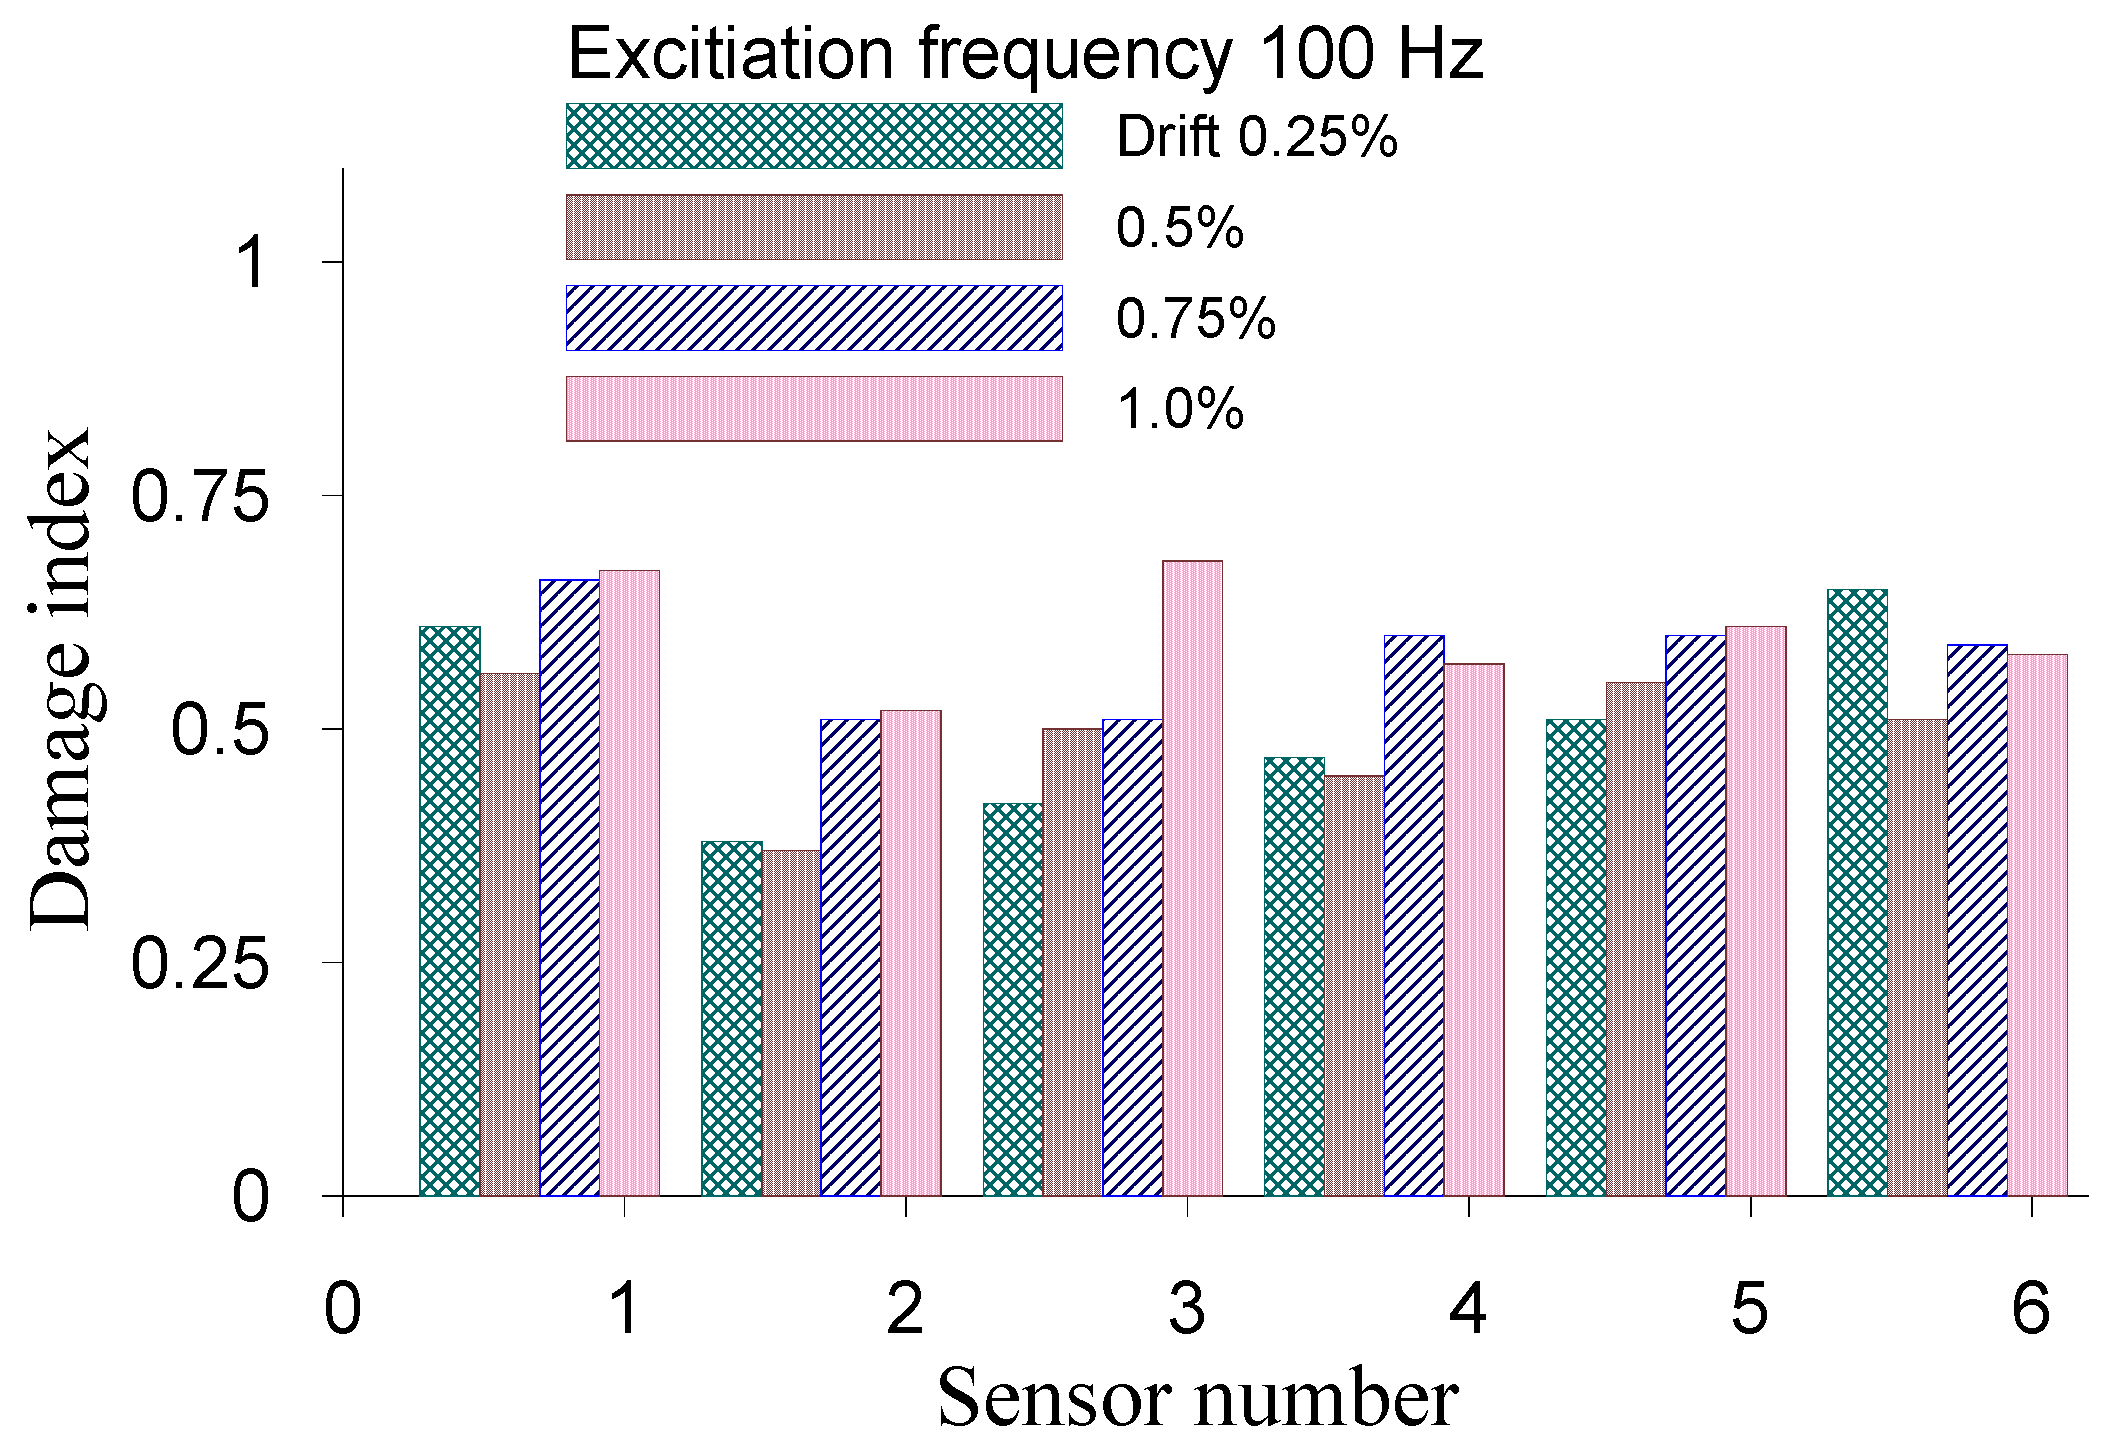
Figure 12 and
Figure 13 show the damage indices of the sensors of RCW1 at various drift ratios under the various excitation frequencies of 100 Hz and 1000 Hz. According to these figures, the damage indices and damage state of each sensor in various frequencies have an increasing trend with the drift ratio increasing. In
Figure 13, the damage indices of the sensors of S1, S4, S3 and S6 at the drift ratio of 1.0% are relatively higher than those of the sensors of S2 and S5. It can be observed that the damage state in the two sides of the wall are more serious than the center area. Additionally, the results have a high correlation with the final failure pattern of the specimen including the concrete crush in the bottom region of the boundary columns. However, the damage indices obtained from the excitation frequency of 100 Hz, as shown in
Figure 12, cannot identify the location with the serious damage. The experimental results have demonstrated the effectiveness of the proposed damage index that can be used to evaluate the damage state of an RC wall structure. Additionally, the piezoceramic transducers have the ability to identify the serious damage location using the excitation waves with high frequency.
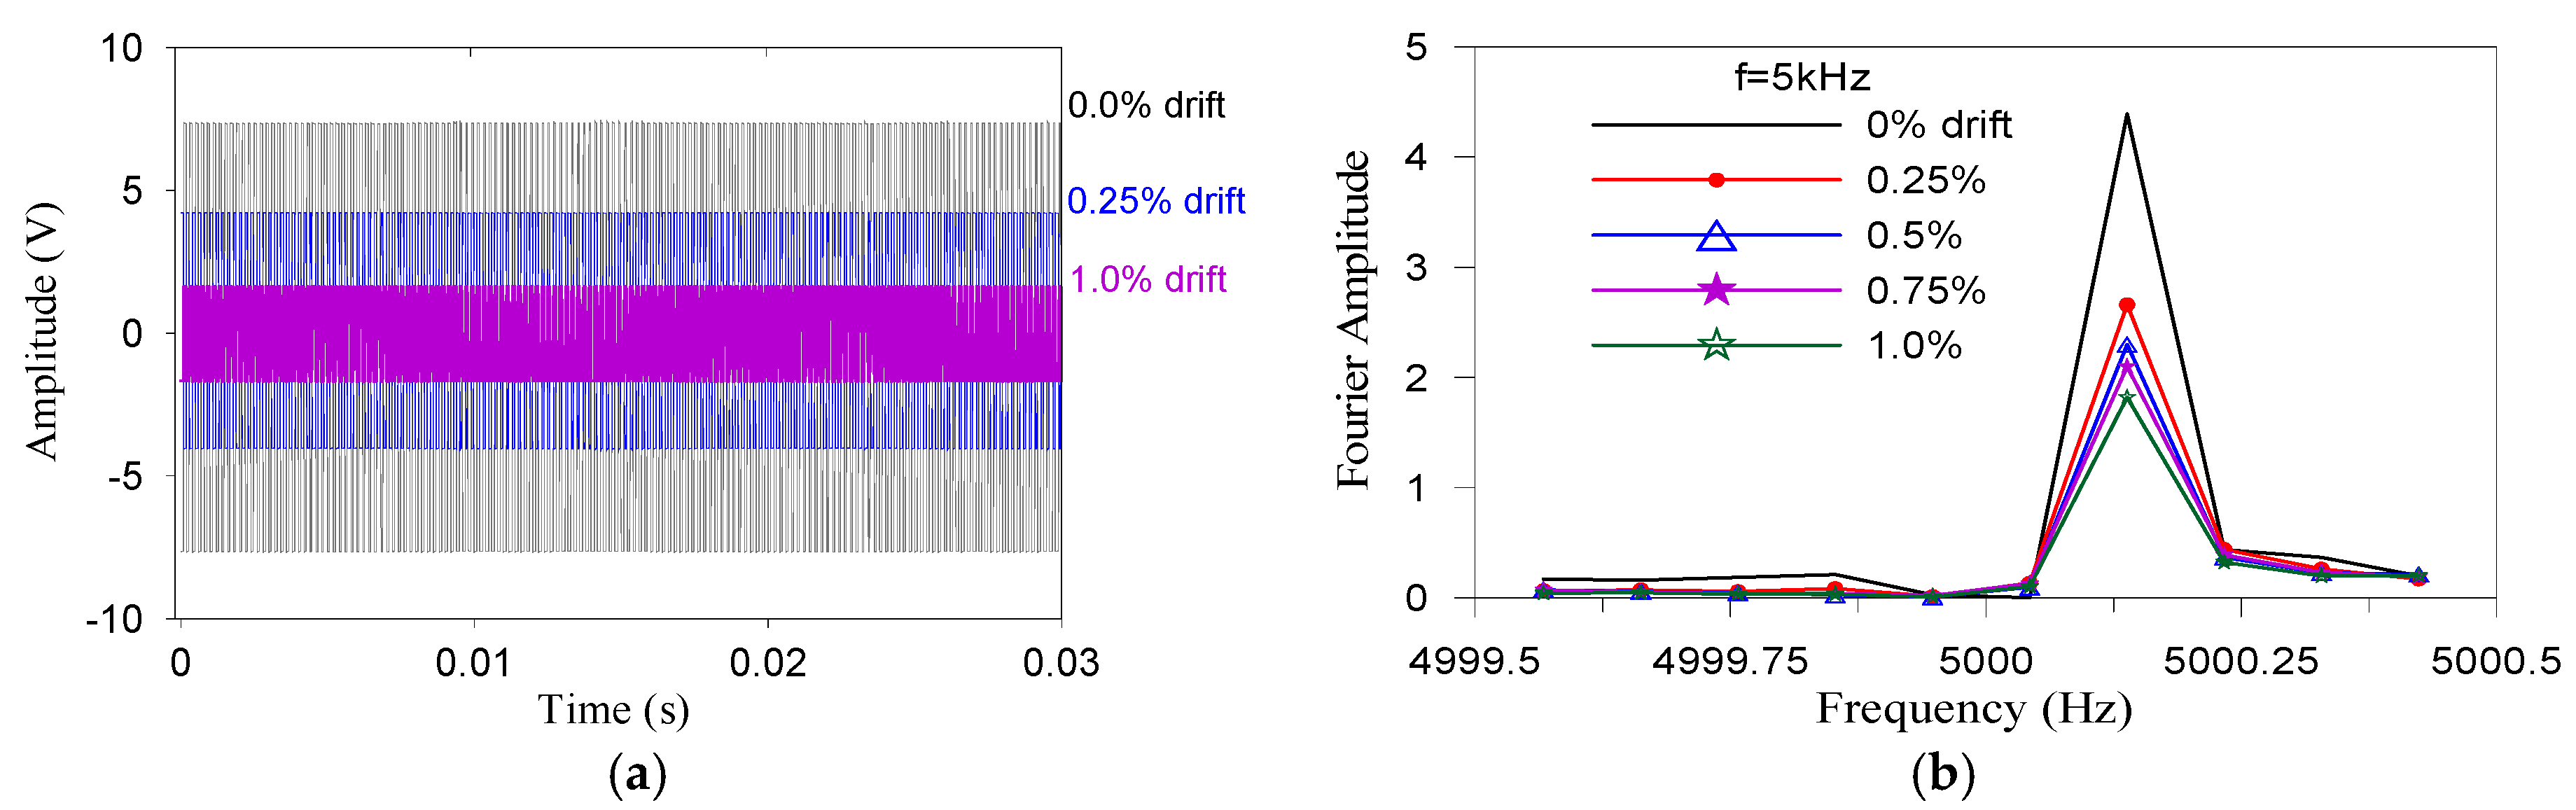
The loss of energy of a propagating stress wave that is caused by cracks or damage can be interestingly investigated in the frequency domain. For single-frequency excitation waves, the Fourier amplitude is concentrated around the designated excitation frequency in the frequency spectrum, so variation in the Fourier amplitude of received signals in the frequency spectrum can reveal the severity of damage in terms of the damage index that is defined in Equation (2).
Figure 14 plots the time history of received sensor voltage and its corresponding Fourier amplitudes of sensor S4 under excitation by actuator A1 (frequency 5 kHz). The Fourier amplitudes around the frequency 5 kHz clearly decrease as the drift ratio of the specimen increases, indicating again that the transmission energy of the stress waves is attenuated by cracks and damage.
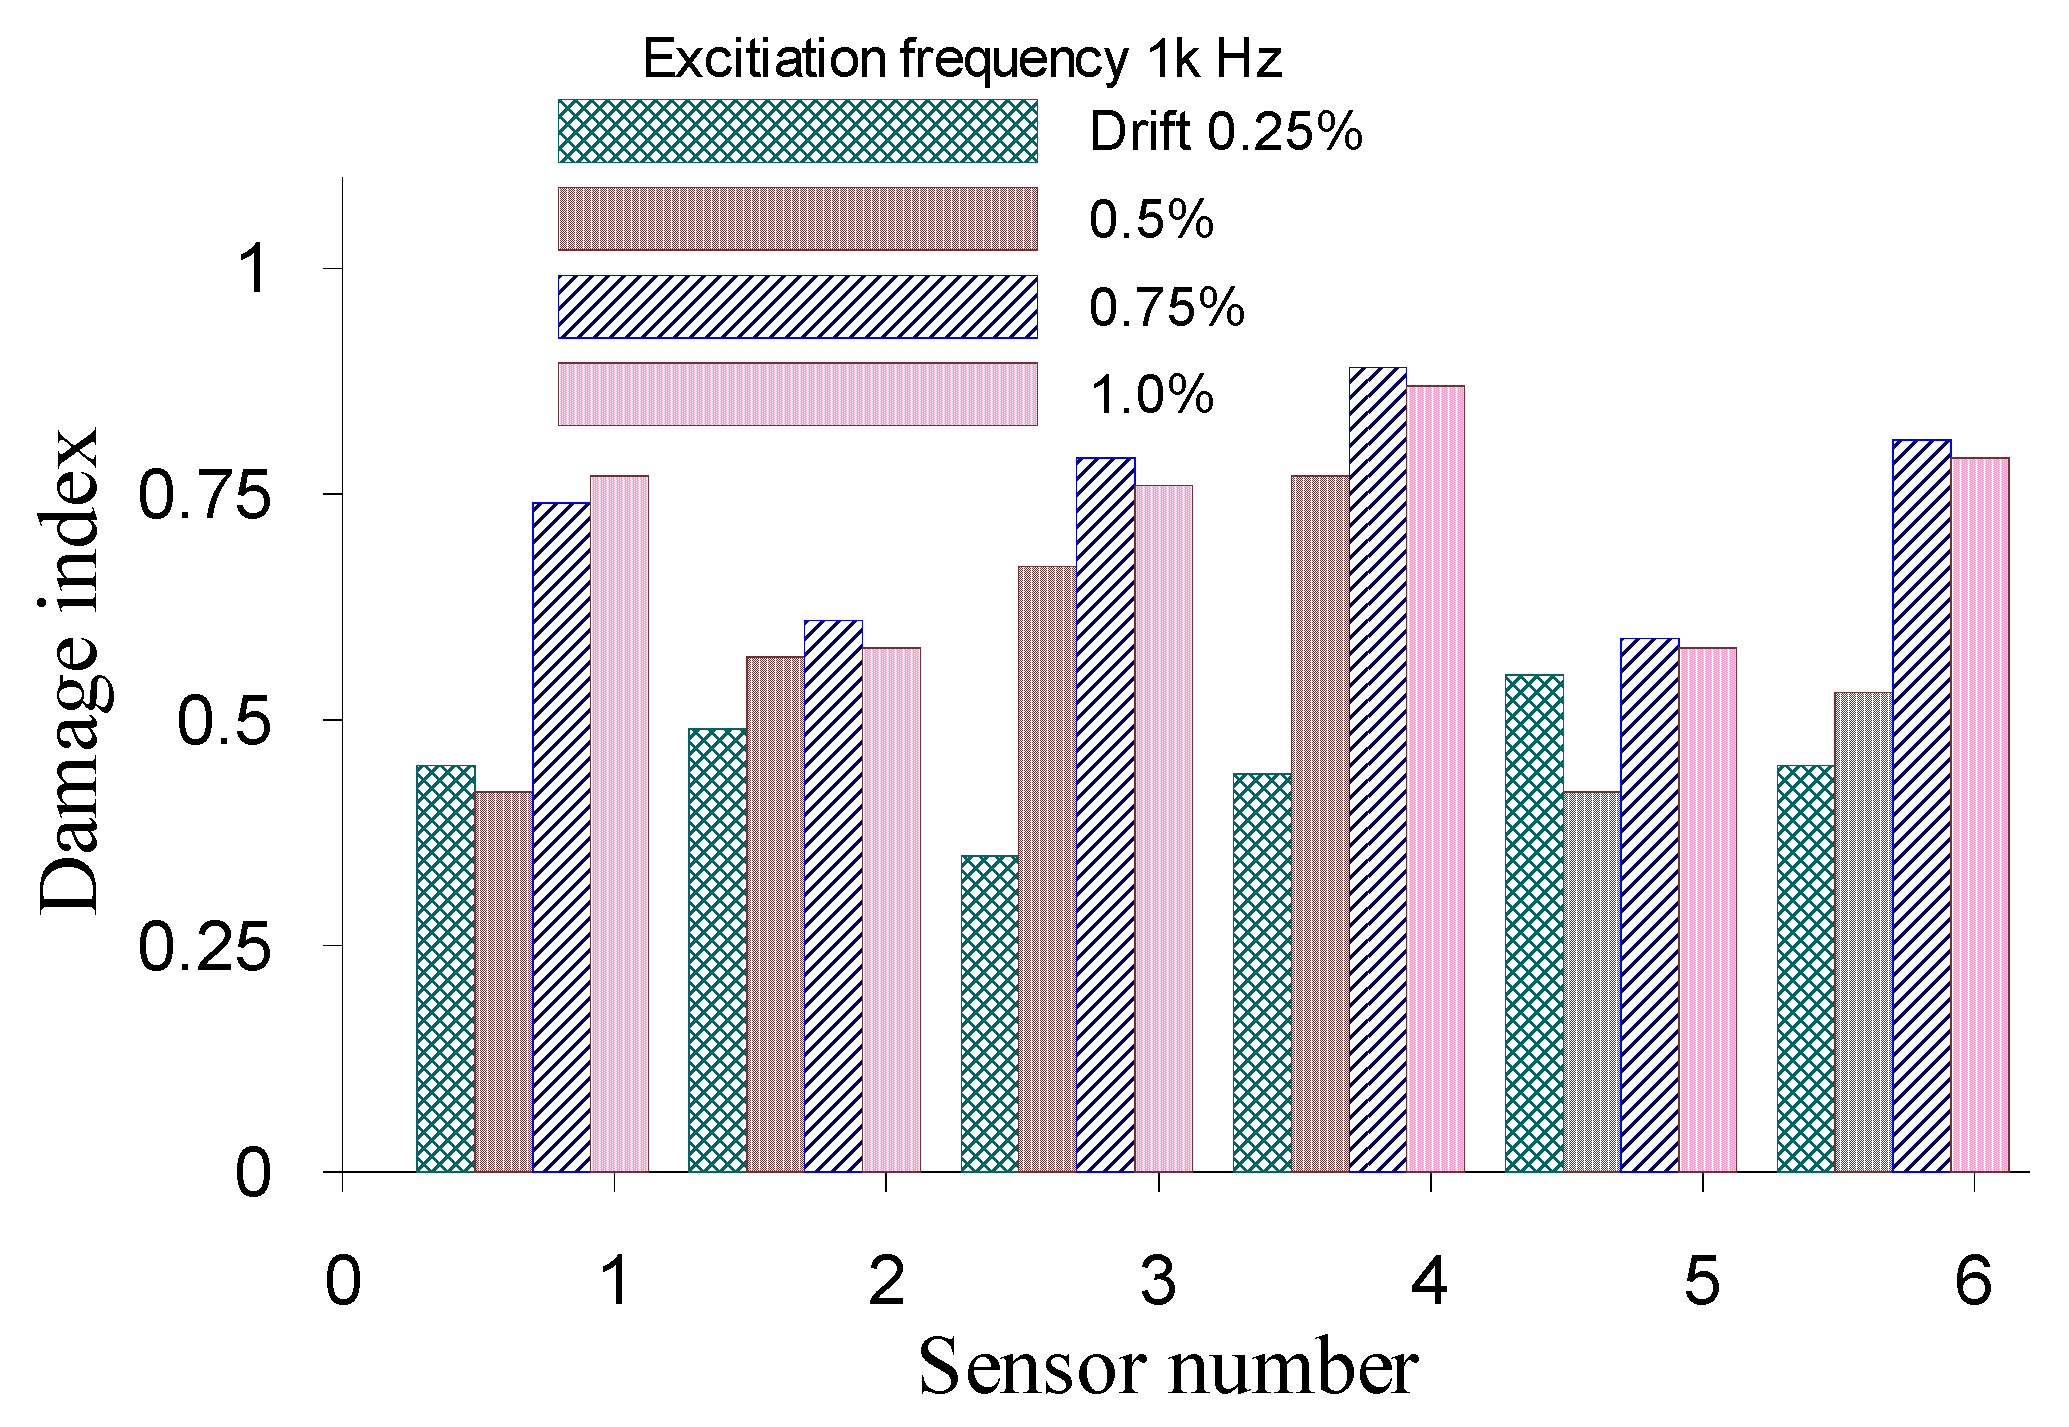
Figure 15 and
Figure 16 plot the testing results of specimen RCW2 at various drift ratios under excitation frequencies of 100 Hz and 1000 Hz, respectively. As the drift ratio increases, the damage indices of each PZT sensor increase, revealing a trend similar to that in
Figure 12 and
Figure 13. According to
Figure 16, the damage indices of sensors S4-S6 at the final drift ratio of 1.0% are higher than those of sensors S1–S3, mainly because the damage state in the upper region of the wall is more serious than that in the bottom region. The results are also strongly correlated with the final failure pattern of the specimen, including concrete spalling in the top region of the wall panel and crushing of the concrete in the boundary columns. Minor interface cracks between the existing top beam and the wall panel are observed at a drift ratio 0.25% during the test. The damage index of sensor S5 in
Figure 16 is obviously higher than the indices of other sensors, especially sensor S2, at this drift ratio. This result is consistent with experimental observations and demonstrates that a PPS sensor can effectively detect interface cracks between structural members. Experimental results demonstrate that the piezoceramic-based method not only provides sensitive structural health monitoring but also is effective in the location of damage in concrete wall structures.


