Non-Uniform Distribution of Contamination on Composite Insulators in HVDC Transmission Lines


State Key Laboratory of Power Transmission Equipment & System Security and New Technology, Chongqing University, Chongqing 400044, China
*
Authors to whom correspondence should be addressed.
Appl. Sci. 2018, 8(10), 1962; https://doi.org/10.3390/app8101962
Submission received: 17 September 2018
/
Revised: 9 October 2018
/
Accepted: 12 October 2018
/
Published: 17 October 2018
Abstract
:Featured Application
The proposed pollution non-uniformity coefficient K provides guidance for insulation design and field anti-pollution works, which helps prevent the occurrence of pollution flashover accidents.
Abstract
In recent years, the air particulate pollutants formed by the combustion of fossil fuels and the emission of industrial waste gases have constantly been produced, and the polluted particles deposit also seriously affects social production and people’s lives. For instance, pollution-induced flashover is seriously threatening the safe operation of the power system, while insulator pollution non-uniformity has great influence on the flashover voltage of insulators. Therefore, in this paper both field contamination experiments of HVDC (High Voltage Direct Current) transmission lines and wind tunnel contamination simulation tests were conducted, and pollution non-uniformity coefficient KT/B, KW/L and KH/M were proposed and obtained. The results showed that the degree of contamination on top surface and leeward side is heavier than that on bottom surface and windward side. Thus, in the DC energized condition, contamination along the string is also non-uniform, and serious pollution occurs mainly in the high voltage terminal. In order to explain the uneven distribution phenomenon along the string, the coupling-physics model of composite insulator string was established and using the finite element method, the electric field around the insulator was simulated. Furthermore, basing on the field charging theory, the value of electric field force on particles around the insulator surface was calculated and the mechanism of non-uniformity along the insulator sting was then explained. The results are very important for guiding insulation design and field anti-pollution works.
1. Introduction
Because of the deterioration of the atmosphere environment in China, the operating HVDC transmission lines are still under high pollution flashover risks [1,2]. Pollution flashover of insulator is a serious threat to safe operation of the power grid. It risks causing large-scale power outages, and badly impacting development of the social economy [3,4,5]. The primary cause of pollution flashover is contaminants accumulating and depositing on the insulator surface. Besides this, it is important to further study insulator contamination rules to better guide the anti-pollution works of transmission line and substation outdoor insulation.
Plenty of research [6,7,8] has been done through simulation and pollution tests to reveal insulator contamination mechanisms. Literature [6] has put forward a power law relationship between the pollution accumulation rate and wind velocity through a simplified wind tunnel contamination experiment. Literature [7] built a pollution deposit model of rail insulator using a gas–solid aerosol flow simulation to show the rules of wind velocity affecting pollution deposits and distribution. Through a simulation and wind tunnel test, literature [8] concluded that the DC voltage results in a larger contaminant deposition rate of particles on the insulator surface and a larger increasing rate than AC voltage and non-energized conditions.
Not only does the contamination degree have an effect on flashover voltage, but also the contamination non-uniformity has great influence on flashover voltage, many documents have conducted in-depth research on this [9,10,11,12,13,14,15,16]. In literature [9], we can find that the uniform distribution of the pollution has given a weaker dielectric rigidity than the one obtained in non-uniform pollution. Besides, the influence of non-uniform pollution distribution on DC composite insulators on their flashover performance was analyzed [10], and a correction formula for the non-uniform pollution flashover voltage was proposed. The test results showed that the flashover voltage U50 decreases with the increase of T/B, where T/B is ratio of the salt deposit density (SDD) on the top surface to that on the bottom surface. Similar conclusions can be found in references [11,12].
In literature [13], DC pollution flashover tests of insulators under fan-shaped non-uniform pollution were presented, and the influence of fan-shaped non-uniform pollution on flashover voltage, arc propagation, and critical leakage distance were investigated. Research results indicate that a reduction in the ratio W/L from 1/1 to 1/15 gave a median 35% ± 4% decrease in flashover strength, where W/L is ratio of the salt deposit density (SDD) on the windward surface to that on the leeward surface. Thus, in literature [14], artificial pollution tests of 4 types of porcelain and glass insulators with ring-shaped non-uniform pollution were carried out. Experimental results indicate that the non-uniform pollution degree K (the SDD ratio of inner part to outer part) has significant effects on insulator flashover performance. AC (Alternating Current) pollution flashover tests of 7-unit insulators in all three different non-uniform pollution conditions were carried out in reference [15]. The results indicate that the increase of uneven pollution degree J (J = SDD2/SDD1, SDD1 and SDD2 represent different parts of the insulator’s SDD, specifically, SDD2 represents SDD of bottom surface, leeward side, inner ring side, SDD1 represents SDD of top surface, windward side, outer ring side respectively.) from 1 to 15 will give a 39% raise of U50 under non-uniform pollution on top and bottom surfaces, a 23% decrease for fan-shaped non-uniform pollution and a 21% higher U50 with ring-shaped non-uniform pollution.
What is more noteworthy is that, in literature [16], the effect of pollution non-uniformity distribution on the insulators performance under ac voltage has been studied with three types of distribution: Transversal, periodic longitudinal and non-periodic longitudinal. Transversal and periodic longitudinal distribution are similar to W/L and T/B non-uniform pollution noted above. However, the effect of non-periodic longitudinal distribution on the insulator’s performance is indeed a new discovery, which showed that this category has allowed the identification of the existence of a minimum voltage of about 42% of those acquired under uniform distribution.
From the above analysis, we can see that the contamination non-uniformity did have great influence on flashover voltage, but few of the reports on pollution non-uniformity in energized condition were presented. Natural exposure tests with −280 kV DC voltage energization were carried out for 5 years in reference [17]. The results show that insulators near the line and ground sides of a string collect more contaminant than the middle when DC voltage is applied. However, the specific values and influencing factors of non-uniformity are not given.
In this paper, both field contamination experiments of HVDC transmission lines and wind tunnel contamination simulation tests in dc energized condition were conducted, and pollution non-uniformity coefficients KT/B, KW/L and KH/M were proposed and obtained. Thus, the effects of particle diameter, wind velocity and relatively humidity on pollution non-uniformity were quantitatively computed. In order to explain the uneven distribution phenomenon along the string, the coupling-physics model of composite insulator string was established. Furthermore, basing on field charging theory, the mechanism of non-uniformity along insulator sting was then revealed. Research results are valuable for field pollution level mapping works and for DC lines outdoor insulation design.
2. Natural Pollution Test in the Operating HVDC Transmission Lines
2.1. The Sample Arrangement and Contamination Distribution
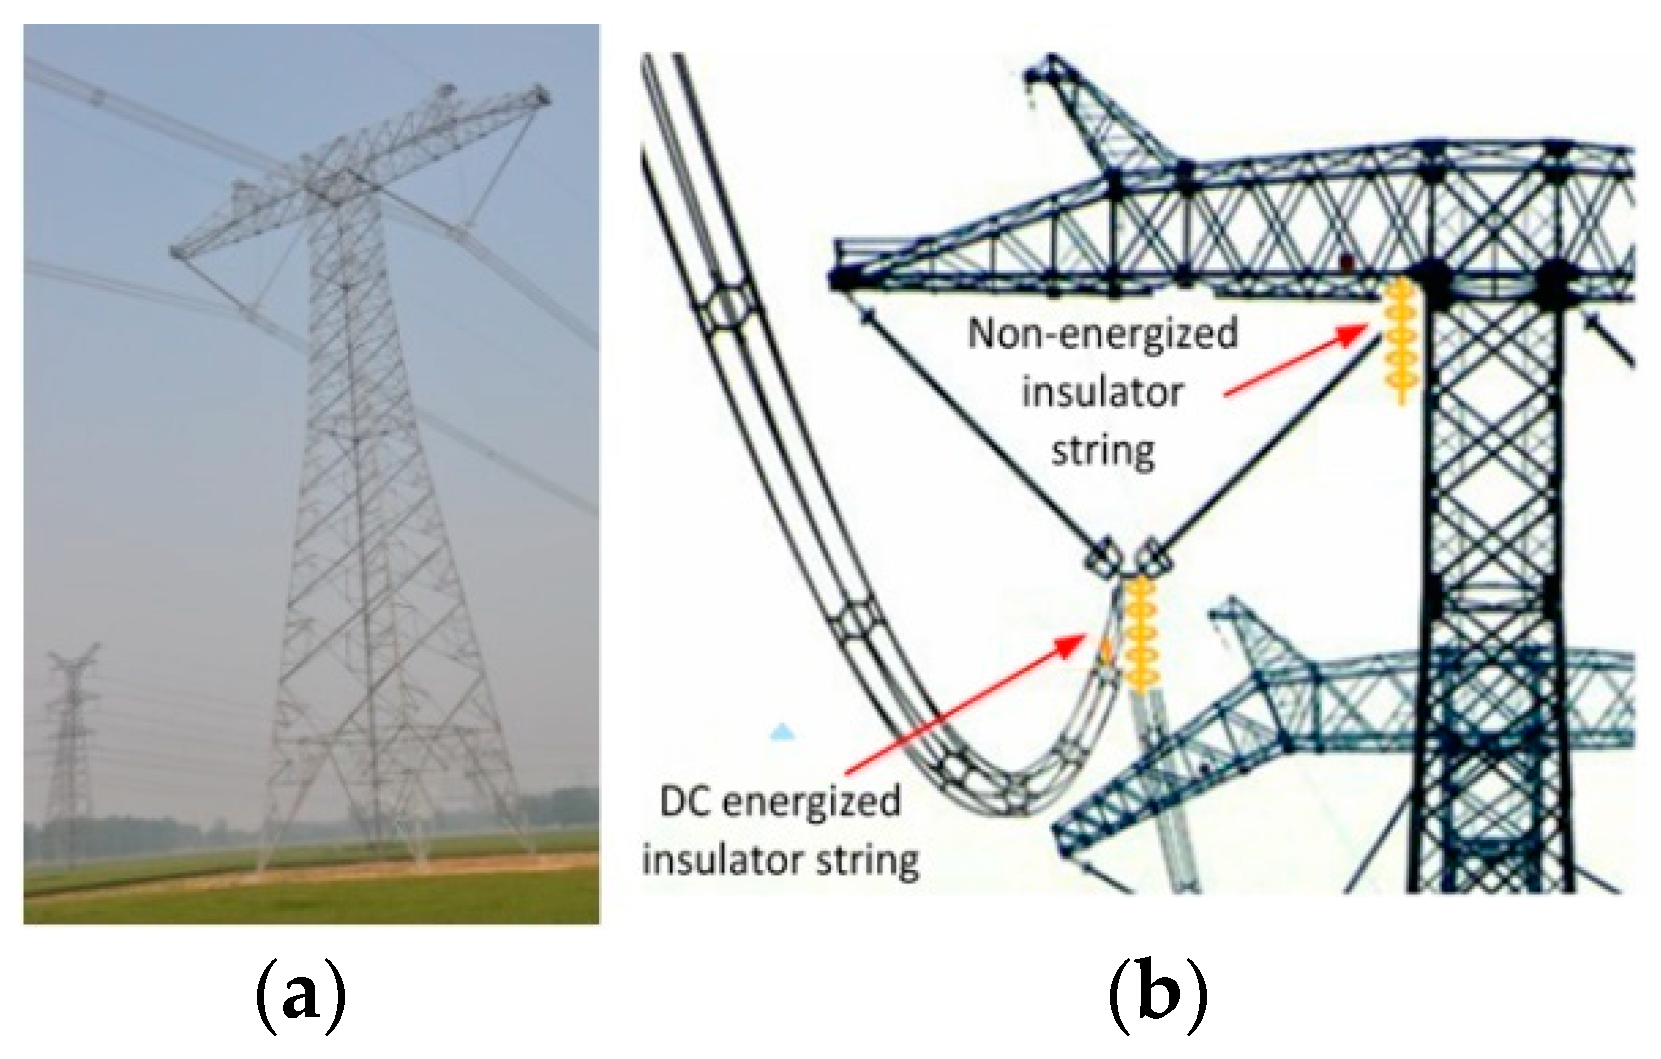
The contamination samples were typical type suspension composite insulators arranged in different towers in a certain ±800 kV HVDC transmission line corridor. The tower views and diagram of test samples arrangement were shown in Figure 1. The sample arrangement and test procedures were based exactly on guideline [18].
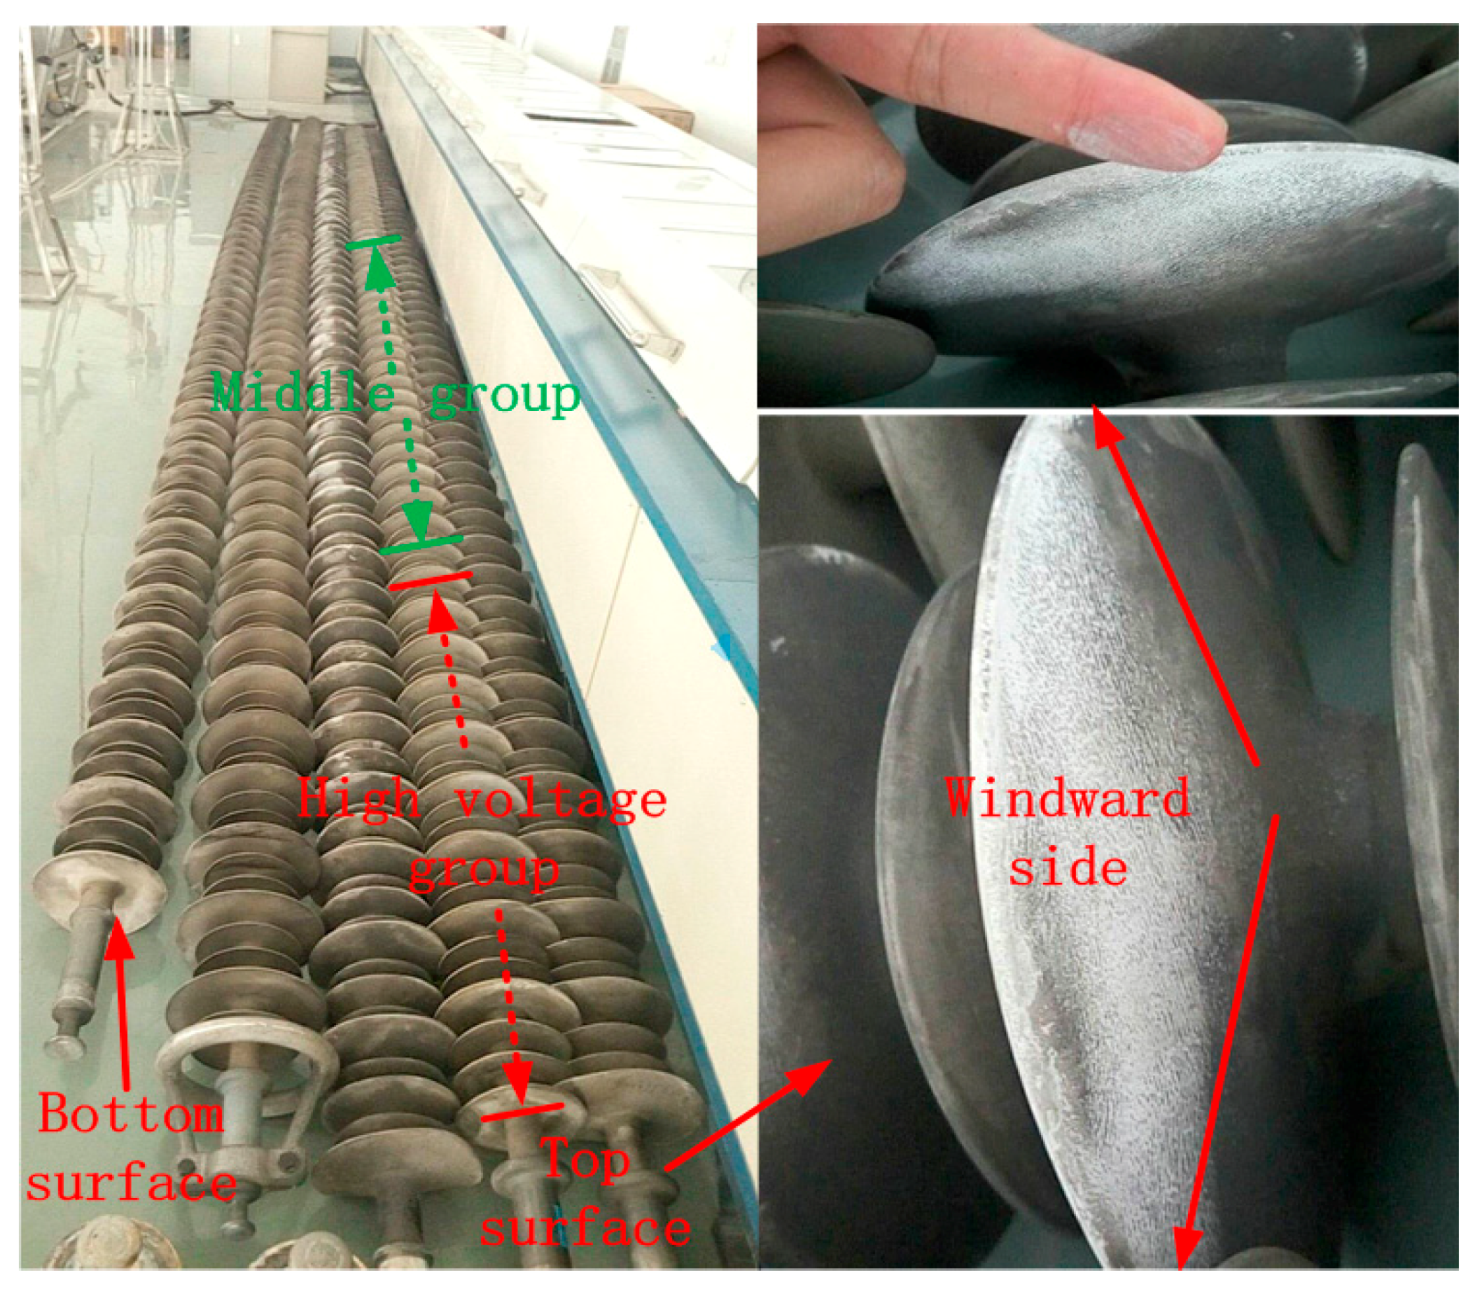
The contamination period was from March 2014 to November 2017. According to the meteorological monitoring statistics near that location, the frequency of wind speed within 0.5–5.4 m/s reaches 95% during test period. And basing on the TSP (total suspended particles) monitoring data near that area, the cumulative probability of particles dp ≤ 50 μm is about 90%, and PM10 hold the majority of the TSP. After the contamination period, contamination distribution on insulator surface were obtained, as is shown in Figure 2.
The following phenomena can be observed. Contamination distribution on insulator surface is non-uniform. Contamination degree on top surface and leeward side is heavier than that on bottom surface and windward side. Thus, in the DC energized condition, contamination along the string is also non-uniform, and serious pollution occurs mainly in the high voltage terminal and ground terminal. In order to quantify contamination non-uniformity, ESDD (equivalent salt deposit density, mg/cm2) and NSDD (non-soluble pollution deposit density, mg/cm2) of the samples will be measured.
2.2. Contamination Non-Uniformity of Operating HVDC Composite Insulator
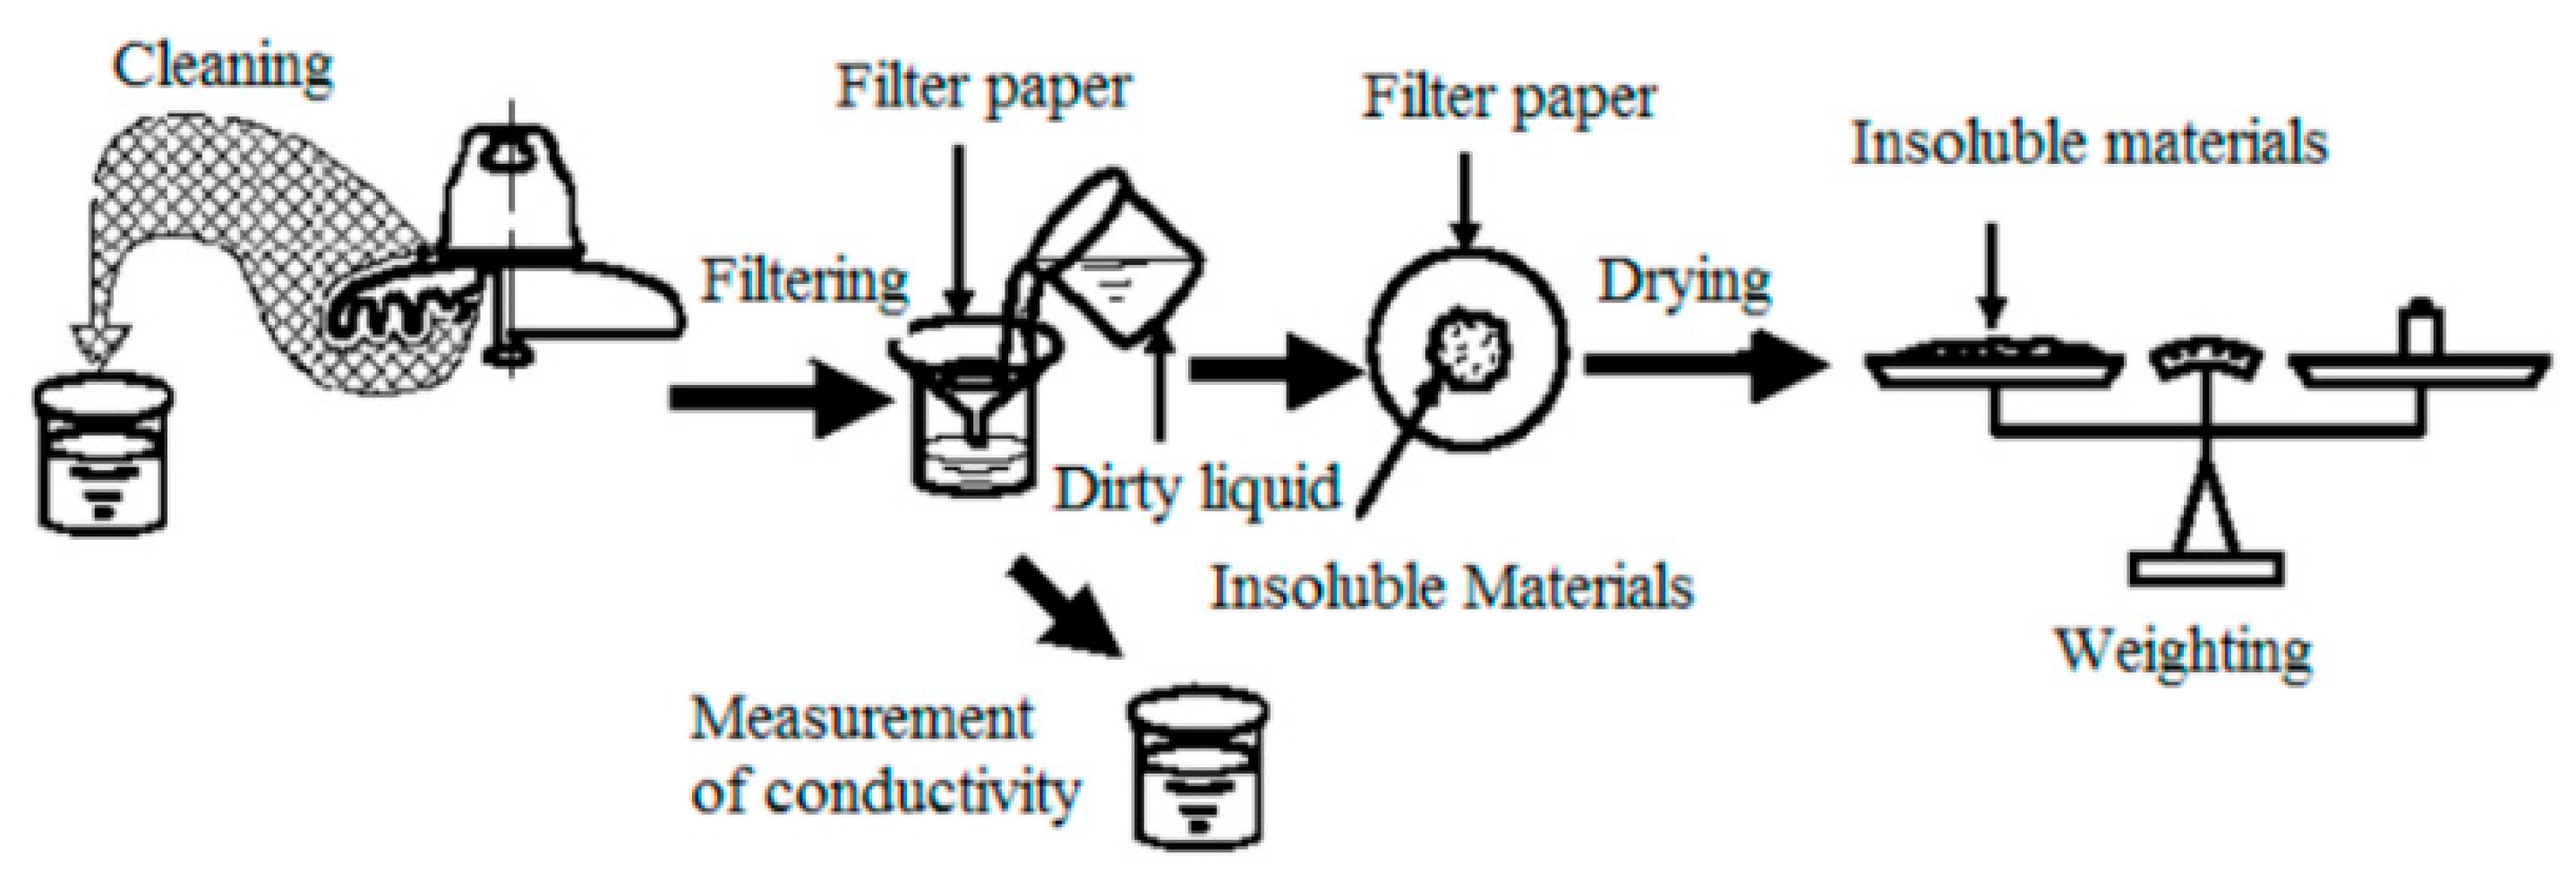
Following the guidelines in literature [18], ESDD and NSDD of the samples were measured based on the method shown in Figure 3: Firstly, moderately purified water was used to clean up the surface of the polluted insulator, then the conductivity of the dirty liquid after filtering was measured, the salt quantity attached to surface of each group sheds was calculated separately, and finally, based on the areas of the insulator surface, the converse salt quantity to ESDD was calculated; the dirty liquid was filtered after cleaning the insulator, then the insoluble materials were left on the filtering paper to dry and were weighed. Lastly, referring to the surface area, the converse of the quantity of insoluble materials to NSDD was calculated.
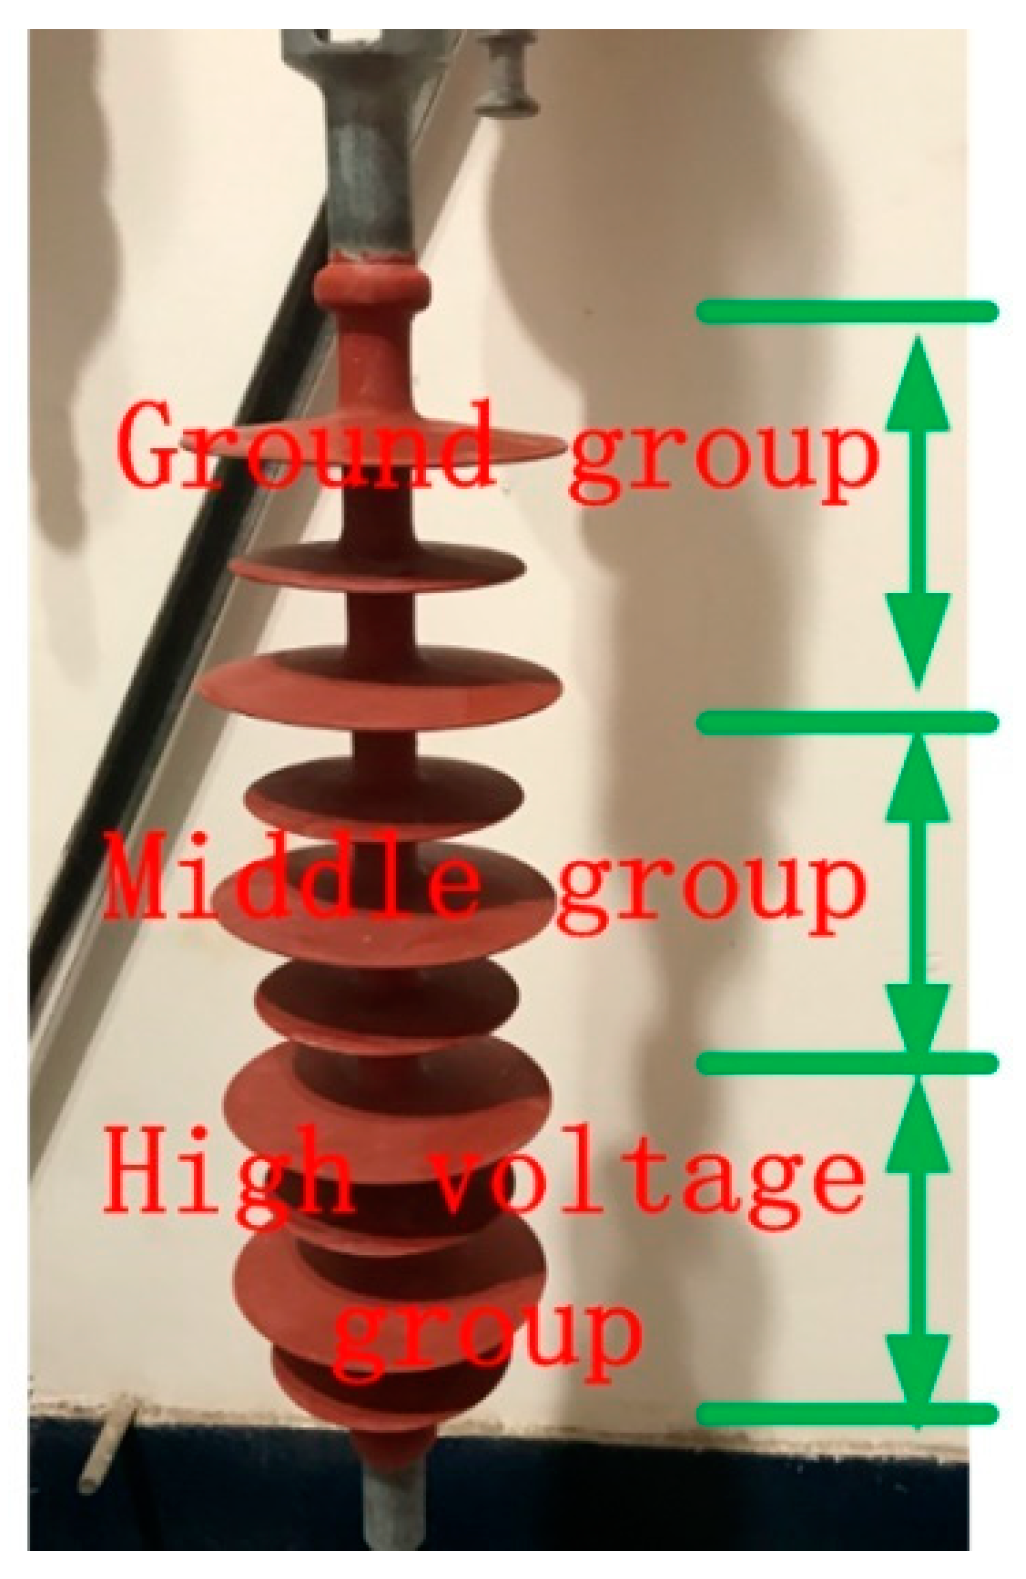
In this test, 64 series of measurements were made. Each group was taken for calculating contamination non-uniformity of top surface and bottom surface, windward side and leeward side, high voltage groups and middle groups respectively. The SDD and relative standard deviation error (σ) were calculated by the equation as follows:
where SDDi is a calculated SDD from test results, and n is the number of measurements made.
To better understand contamination non-uniformity of insulators, KT/B, KW/L, KH/M, K*T/B, K*W/L and K*H/M were proposed and calculated as follows:
where NSDDT, NSDDB, NSDDW, NSDDL, NSDDH and NSDDM, are the NSDD of top surface, bottom surface, windward side, leeward side, high voltage group and middle group respectively, as is ESDD. The Contamination degree and calculated K are shown in Table 1.
It can be seen from the table that both KT/B and K*T/B are around 1/0.51, which means that the amount of contamination on the top surface is 2 times than that of the bottom surface. Thus, KW/L, K*W/L, KH/M, K*H/M are 1/1.45, 1/1.46, 1/0.61, 1/0.62 respectively, from this we can get two conclusions, on the one hand, the contamination on insulator surfaces is very uneven, on the other hand, the value of K and K* is almost equal. The above data is very important for guiding insulation design and field anti-pollution works.
The measurement of contamination non-uniformity on insulator surface in operating HVDC transmission lines is complicated and dangerous work which needs plenty of manpower. But by using wind tunnel simulation method the factors of particle diameter, wind velocity, relative humidity and electric field can also be considered. It may be a useful way for obtaining contamination non-uniformity K, without so much time-consuming, danger and sometimes irregular field pollution measurements. Because the non-uniformity of NSDD is almost equal to that of ESDD, only the non-uniformity of NSDD is considered in the wind tunnel simulation.
3. Contamination Test in Wind Tunnel
3.1. Samples
The sample was big-small sheds composite insulators named Type-A. The technical parameters and structure of the sample are shown in Table 2 and Figure 4, in which H is structure height, D is big-shed diameter, and d is small-shed diameter.
The contaminants were simulated by SiO2 powder. After screening, 250 mesh, 400 mesh, 800 mesh and 2000 mesh SiO2 powder samples were obtained for wind tunnel contamination test. The optical microscope magnification of SiO2 powder sample is shown in Figure 5 and diameter situations of tested SiO2 powder are shown in Table 3, where d is the particle diameter.
3.2. Experimental Devices
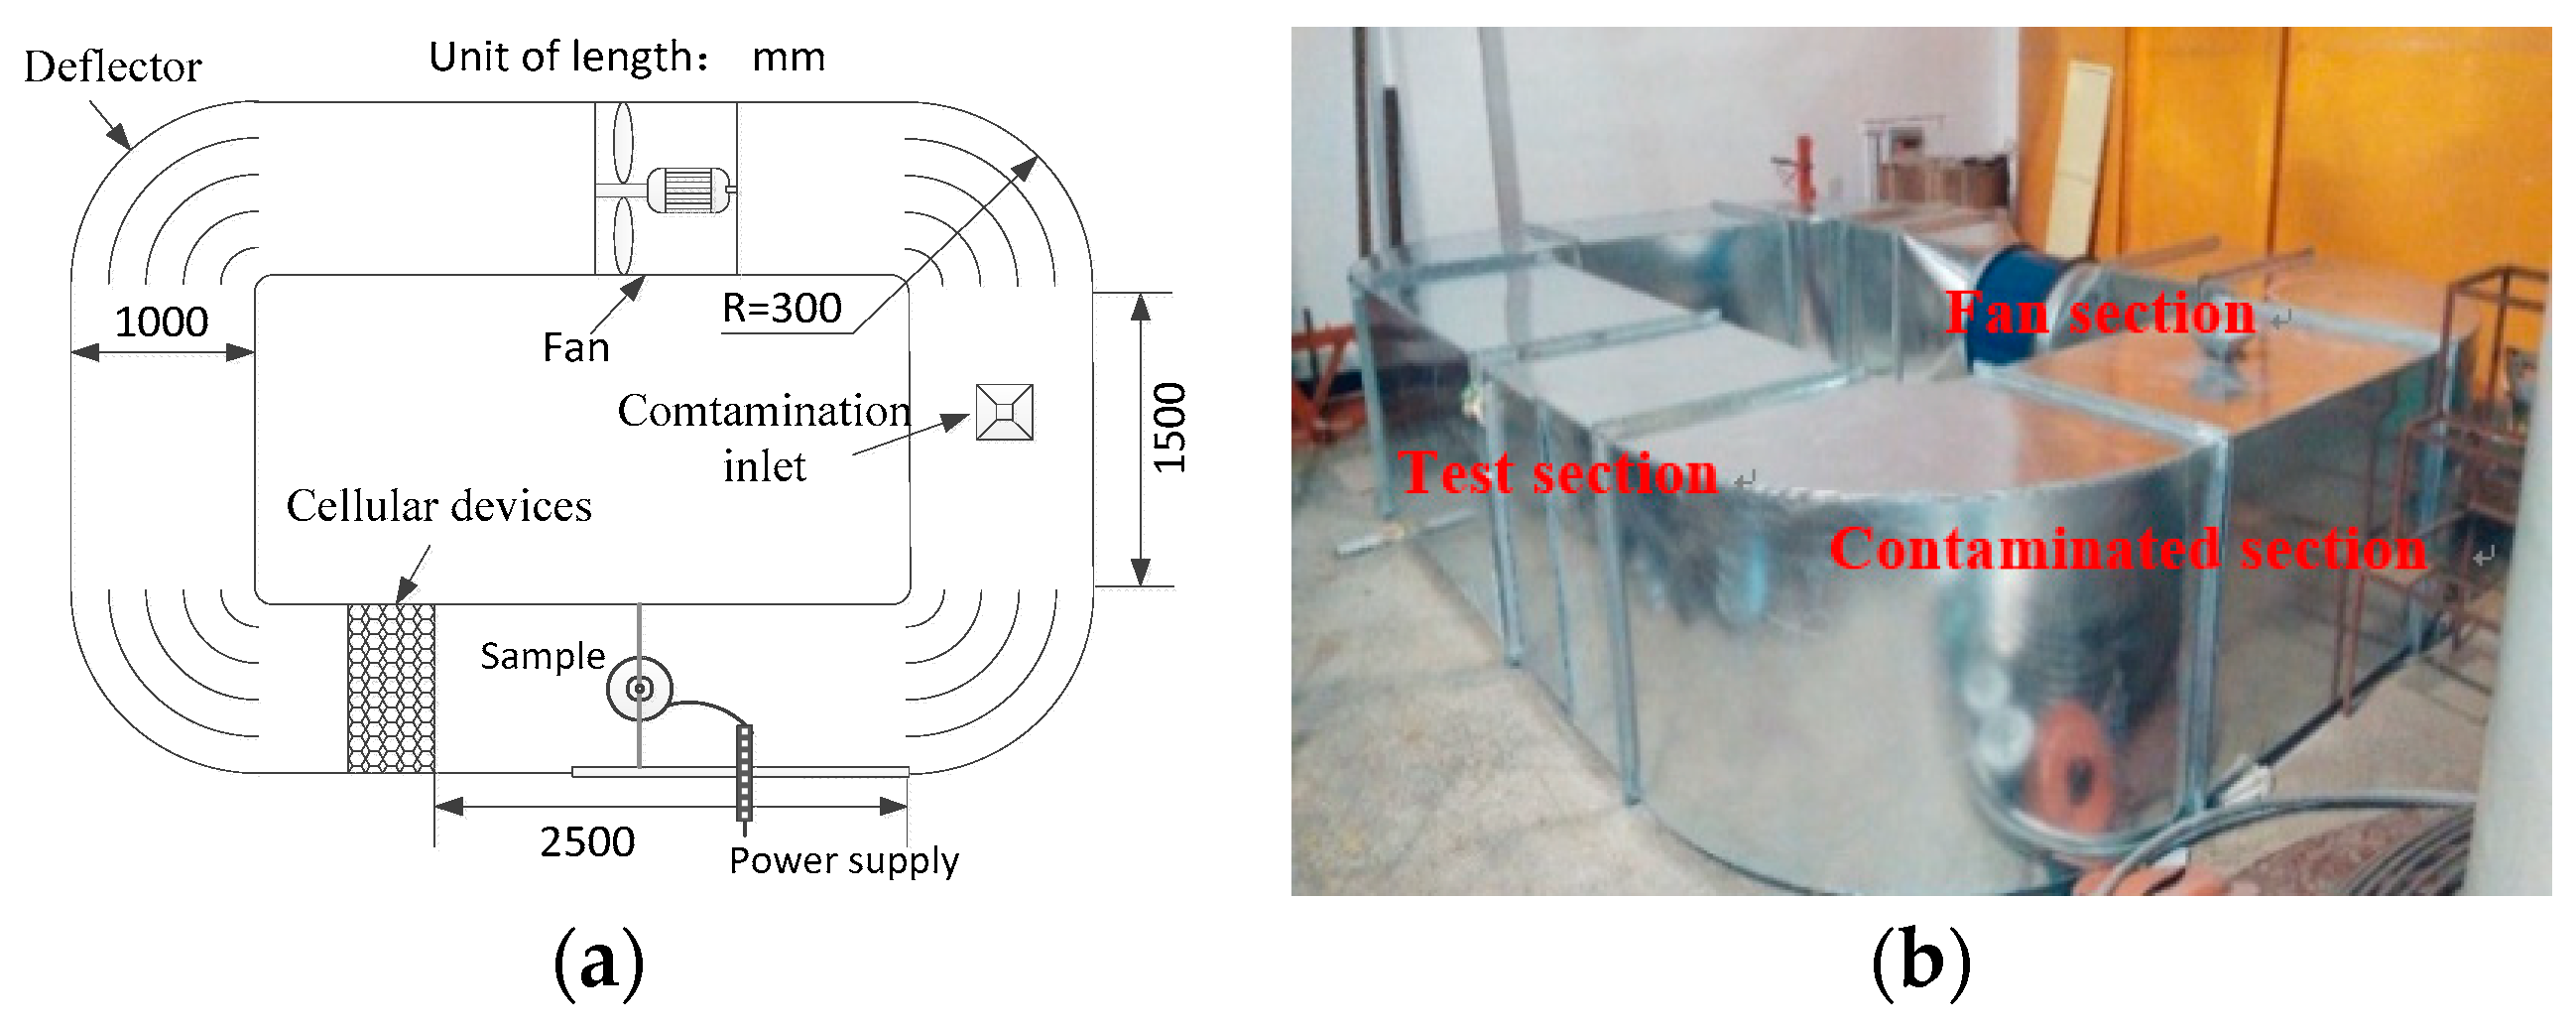
The tests were carried out in a circulating wind tunnel, as shown in Figure 6. The test power is provided by the YDTW-50/50kVA test transformer. The range of wind speed in the wind tunnel is 0–7 m/s and the adjustable accuracy is 0.1 m/s. It is mainly composed of contaminated section, fan section and test section. The front end of the test section is equipped with a six angle cellular devices to reduce the air flow turbulence, a deflector for equalizing airflow is installed at the corner of the wind tunnel. Other equipment includes frequency converter, anemometer, electronic balance of 0.1 mg accuracy, temperature hygrometer, air particulate matter collection instrument, scrubbing tools, Ultrasonic fog generator, etc.
3.3. Experimental Methods
The wind tunnel contamination test procedure is as follows: Before the test, wash the insulators samples thoroughly with Na3PO4 solution to remove all traces of grease and dirt on insulators surface, and then put the insulators in a dry and clean place and let them dry naturally to prepare for the test.
During the test, firstly control the parameters such as wind speed, particle (SiO2) concentration in the wind tunnel to be stable and meet the test setup requirements, then suspend samples into the wind tunnel, where the concentration of particles in the wind tunnel is 15 mg/m3, the diameter of the particles is 250, 400, 800 and 2000 meshes respectively, the wind velocity is 1 m/s, 3 m/s, 5 m/s and 7 m/s respectively, relatively humidity is 60%, 70%, 80% and 90% respectively. Finally electrify the insulator with voltage of DC + 35 kV. Contamination particles were accumulated in 8 h.
4. Simulation Test Results
4.1. The Contamination Distribution of Insulators in Wind Tunnel
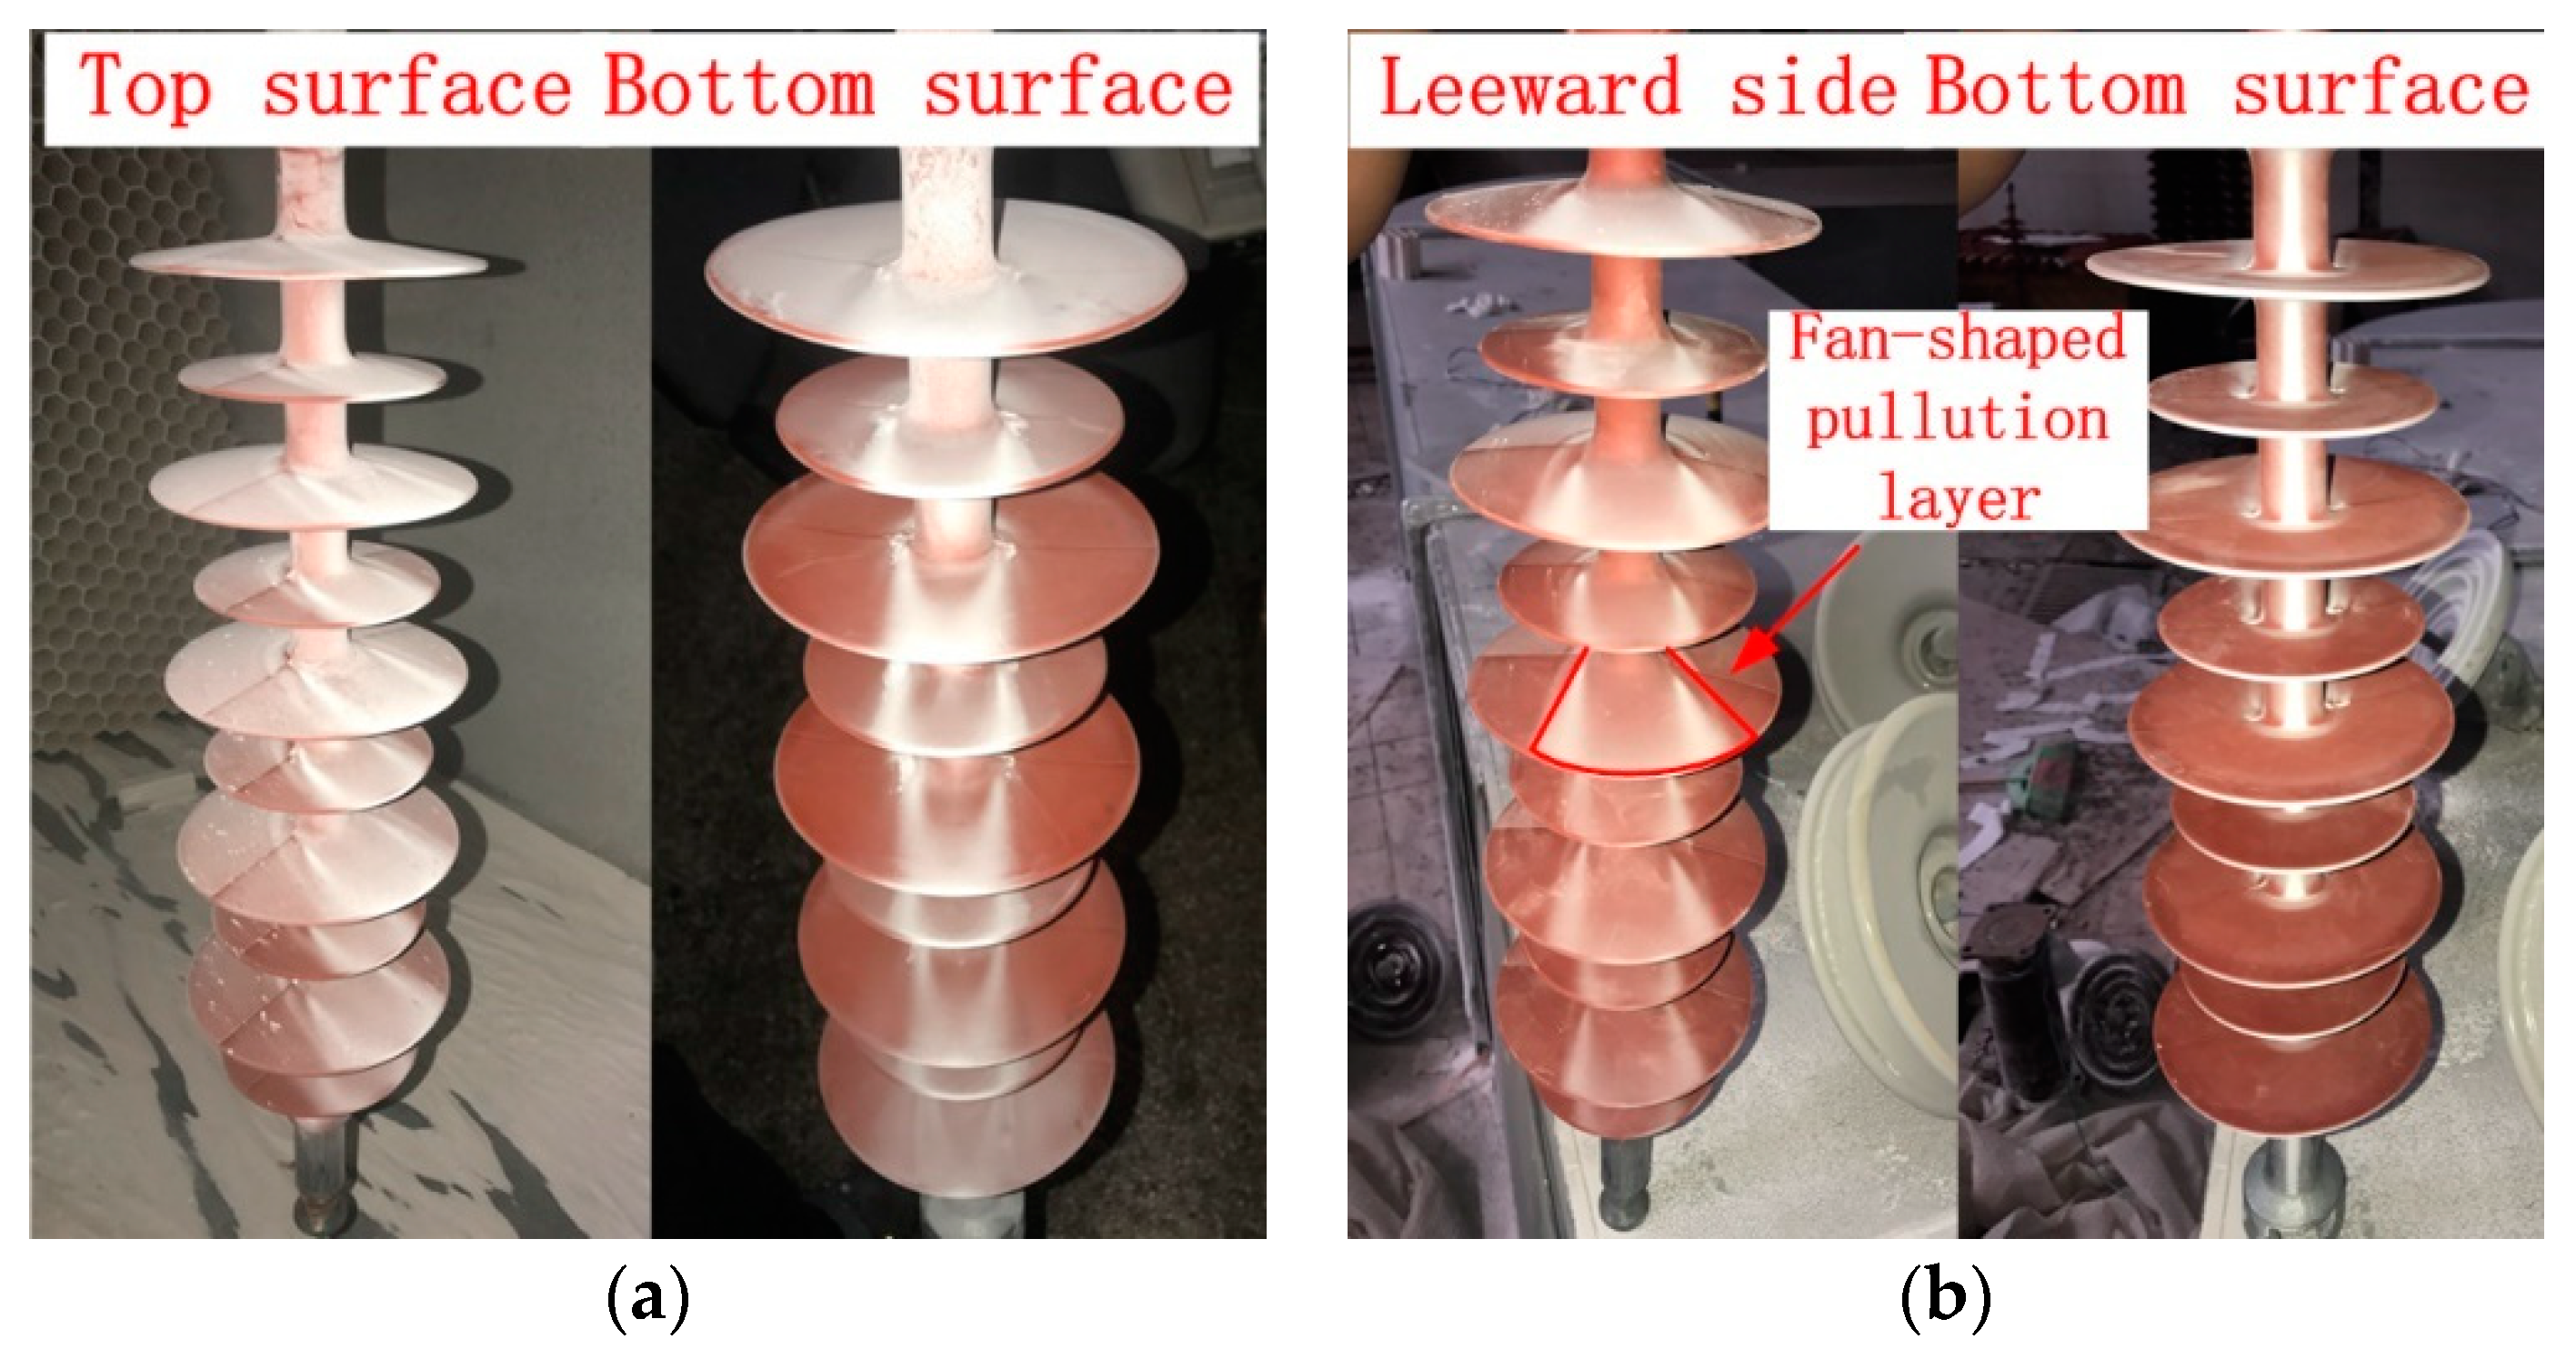
When the wind speed is 5 m/s, the diameter of the particles is 400 meshes, relatively humidity is 60% in non-energized condition, the contamination distribution of Type-A is shown in Figure 7a. When electrify the insulator with voltage of DC + 35 kV, the contamination distribution of Type-A is shown in Figure 7b.
From the test results, conclusions can be made as follows:
- (1)
- As is shown in Figure 7a, contamination distribution is obviously non-uniform on insulator surface. Contamination degree of leeward side of insulator is greater than that of windward side and fan-shaped pollution layer gets formed at leeward side. Thus, the contamination degree of the top surface is higher than that of the bottom surface. In the position towards air flow, a thicker pollution layer will also get formed at round bar. This is due to the air pressure in the position direct to the incoming air flow getting increased, causing more pollution particles to adhere on the insulator surface.
- (2)
- As is shown in Figure 7b, the effect of DC voltage on the contamination degree is obvious. Contamination degree in the dc energized condition is heavier than that in a non-energized condition. Besides this, contamination distribution along the insulator sting is obviously uneven, and the contamination degree of the high voltage area is much heavier than that of the middle area along the insulator sting, which is consistent with that observed at the operating HVDC transmission lines.
4.2. Effect of Wind Speed on Contamination Non-Uniformity
When the test is completed, turn off the power and take the sample out of the tunnel, brush the contamination into a beaker and then filter and weigh the contamination. Then KT/B, KW/L, KH/M were calculated in Formula (1). When the wind speed is 1 m/s, 3 m/s, 5 m/s and 7 m/s respectively, the diameter of the particles is 250 meshes, relative humidity is 60% in DC energized condition, and the results are shown in Table 4.
As is shown in Table 4, average NSDD of the Type-A increased with the increase of the wind speed. NSDD increases from 0.12 to 0.32 when the wind speed increases from 1 m/s to 7 m/s, which illustrates that increased wind speed contributes to contamination. Besides this, the KT/B value remains almost constant and stable at around 0.5. However, the KW/L value presents a downward trend, which means that the contamination growth rate of the leeward side is larger than that of the windward side with the increase of wind speed. It is noteworthy that when the wind speed is small, such as 1 m/s, the amount of contamination accumulated on the windward side is greater than that on the leeward side, but the opposite is true when the wind speed is higher. Besides this, the KH/M value also presents a downward trend, which indicates that with the increase of wind speed, the effect of electric field on the growth of contamination at high voltage terminal is weakened.
4.3. Effect of Particles Diameter on Contamination Non-Uniformity
When the wind speed is 5 m/s, the diameter of the particles is 250, 400, 800 and 2000 meshes respectively, and relative humidity is 60% in DC energized condition. The results are shown in Table 5.
As is shown in Table 5, decreased particle diameter contributes to contamination. When particle diameter decreased from 46.5 to 4.2 μm, NSDD increased by 66.6%. Thus, particle diameter has an effect on all three kinds of non-uniformity. With the decrease of particle diameter, KT/B value is closer to 1. For example, KT/B changed from 1/0.51 to 1/0.66 when particle diameter decreased from 46.5 to 4.2 μm. Which shows that the larger the particles diameter is, the more obvious the non-uniformity degree of contamination on top and bottom surfaces is. Large particles are not easily adhered to the lower surface due to gravity, which can explain the change of KT/B.
Similarly, with the decrease of particle diameter, KW/L value is also closer to 1, for example, KW/L changed from 1/1.45 to 1/1.36 when particle diameter decreased from 46.5 to 4.2 μm, which means that the contamination growth rate of the leeward side is lower than that of the windward side with the decrease of particle diameter. This is because small particles are more prone to cake in the position towards air flow, and a thicker pollution layer will get formed at round bar (windward side).
However, non-uniformity degree (KH/M) of contamination on high voltage group and middle group along insulator string is more obvious with the decrease of particle diameter, which illustrates that the effect of electric field force on the contamination of smaller particles is more obvious.
4.4. Effect of Relatively Humidity on Contamination Non-Uniformity
When the wind speed is 5 m/s, the diameter of the particles is 250 meshes, relatively humidity is 60%, 70%, 80% and 90% respectively in DC energized condition, the results are shown in Table 6.
As is shown in Table 6, increased relatively humidity contributes to contamination. When relative humidity increased from 60% to 90%, NSDD increased by 23.8%. The change of relative humidity has little effect on KT/B and KW/L. With the increase of relative humidity, the KT/B value remains almost constant and stable at around 0.5, with the KW/L value stable at around 1/1.44.
The change of relative humidity has a certain effect on KH/M, which is mainly manifested in the increase of humidity making the K value trend closer to 1. The mechanism of the effect of humidity on KH/M has not been studied. Based on the results, this paper only gives a theory that the change of relative humidity will affect the charge of the polluted particles, which caused the change of electric field force on polluted particles. As a result, the variation of contamination non-uniformity along insulator sting is caused.
5. Discussion
This paper presents the pollution non-uniformity on insulator surface, then pollution non-uniformity coefficient KT/B, KW/L and KH/M were proposed and obtained. Previous research drew a conclusion that wind causes non-uniform distribution of pollution on the surfaces. However, there is no literature to explain the mechanism of uneven distribution along the string. Therefore, this chapter mainly explains this phenomenon by calculating the electric field force on contamination particles, then future research directions are also expounded.
5.1. Numerical Calculation and Analysis of Electric Field Force
The uneven distribution of contamination along insulator string is due to the influence of electric field force on contamination particles. Before calculating the electric field force, we need to get the electric field distribution around the insulator. The electric field distribution of insulator strings is solved by COMSOL, the control equations of computational domain under DC electric field are as follows.
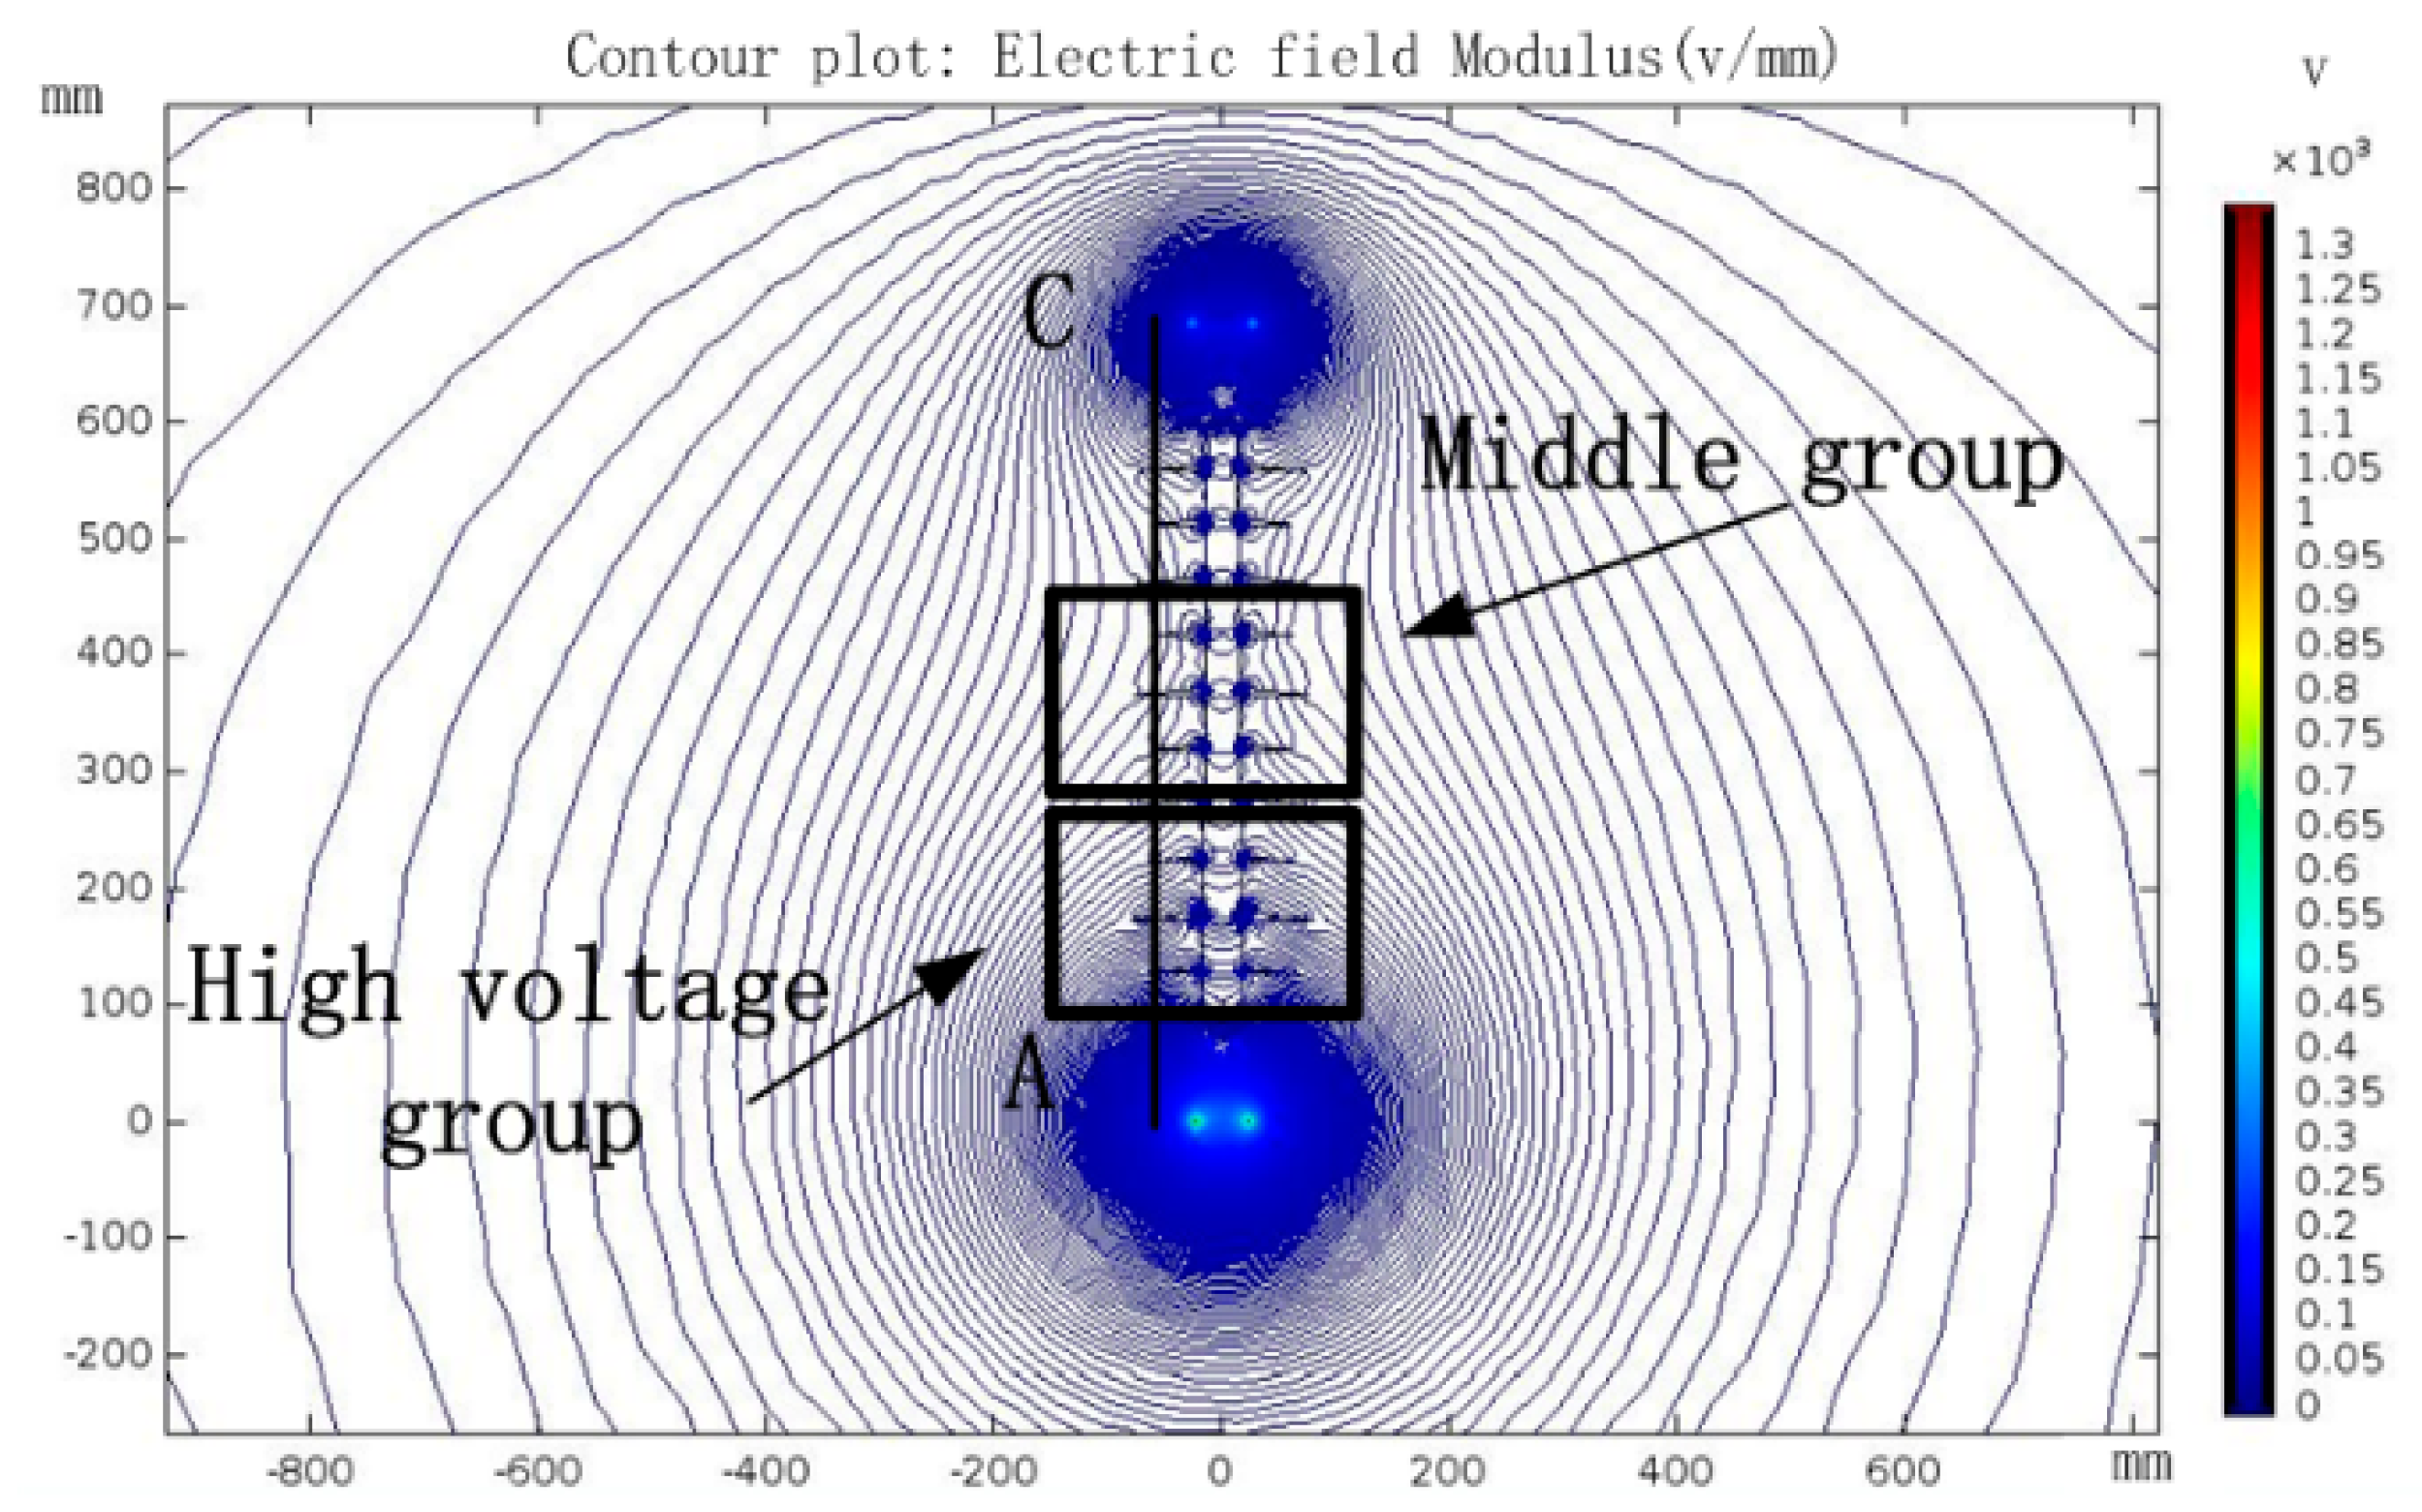
where E is the electric field strength, in V/m; D is the electric flux density, in C/m2; U is the potential value, in V; and the ε0 is the absolute dielectric constant of the vacuum, taking a value of 8.85 × 10⁻¹² F/m; ε1 is relative dielectric constant of the medium, its value of silicon rubber insulator is 3.3; ρ is charge density, in C/m3. The contour line of the calculated electric field around Type-A is shown in Figure 8.
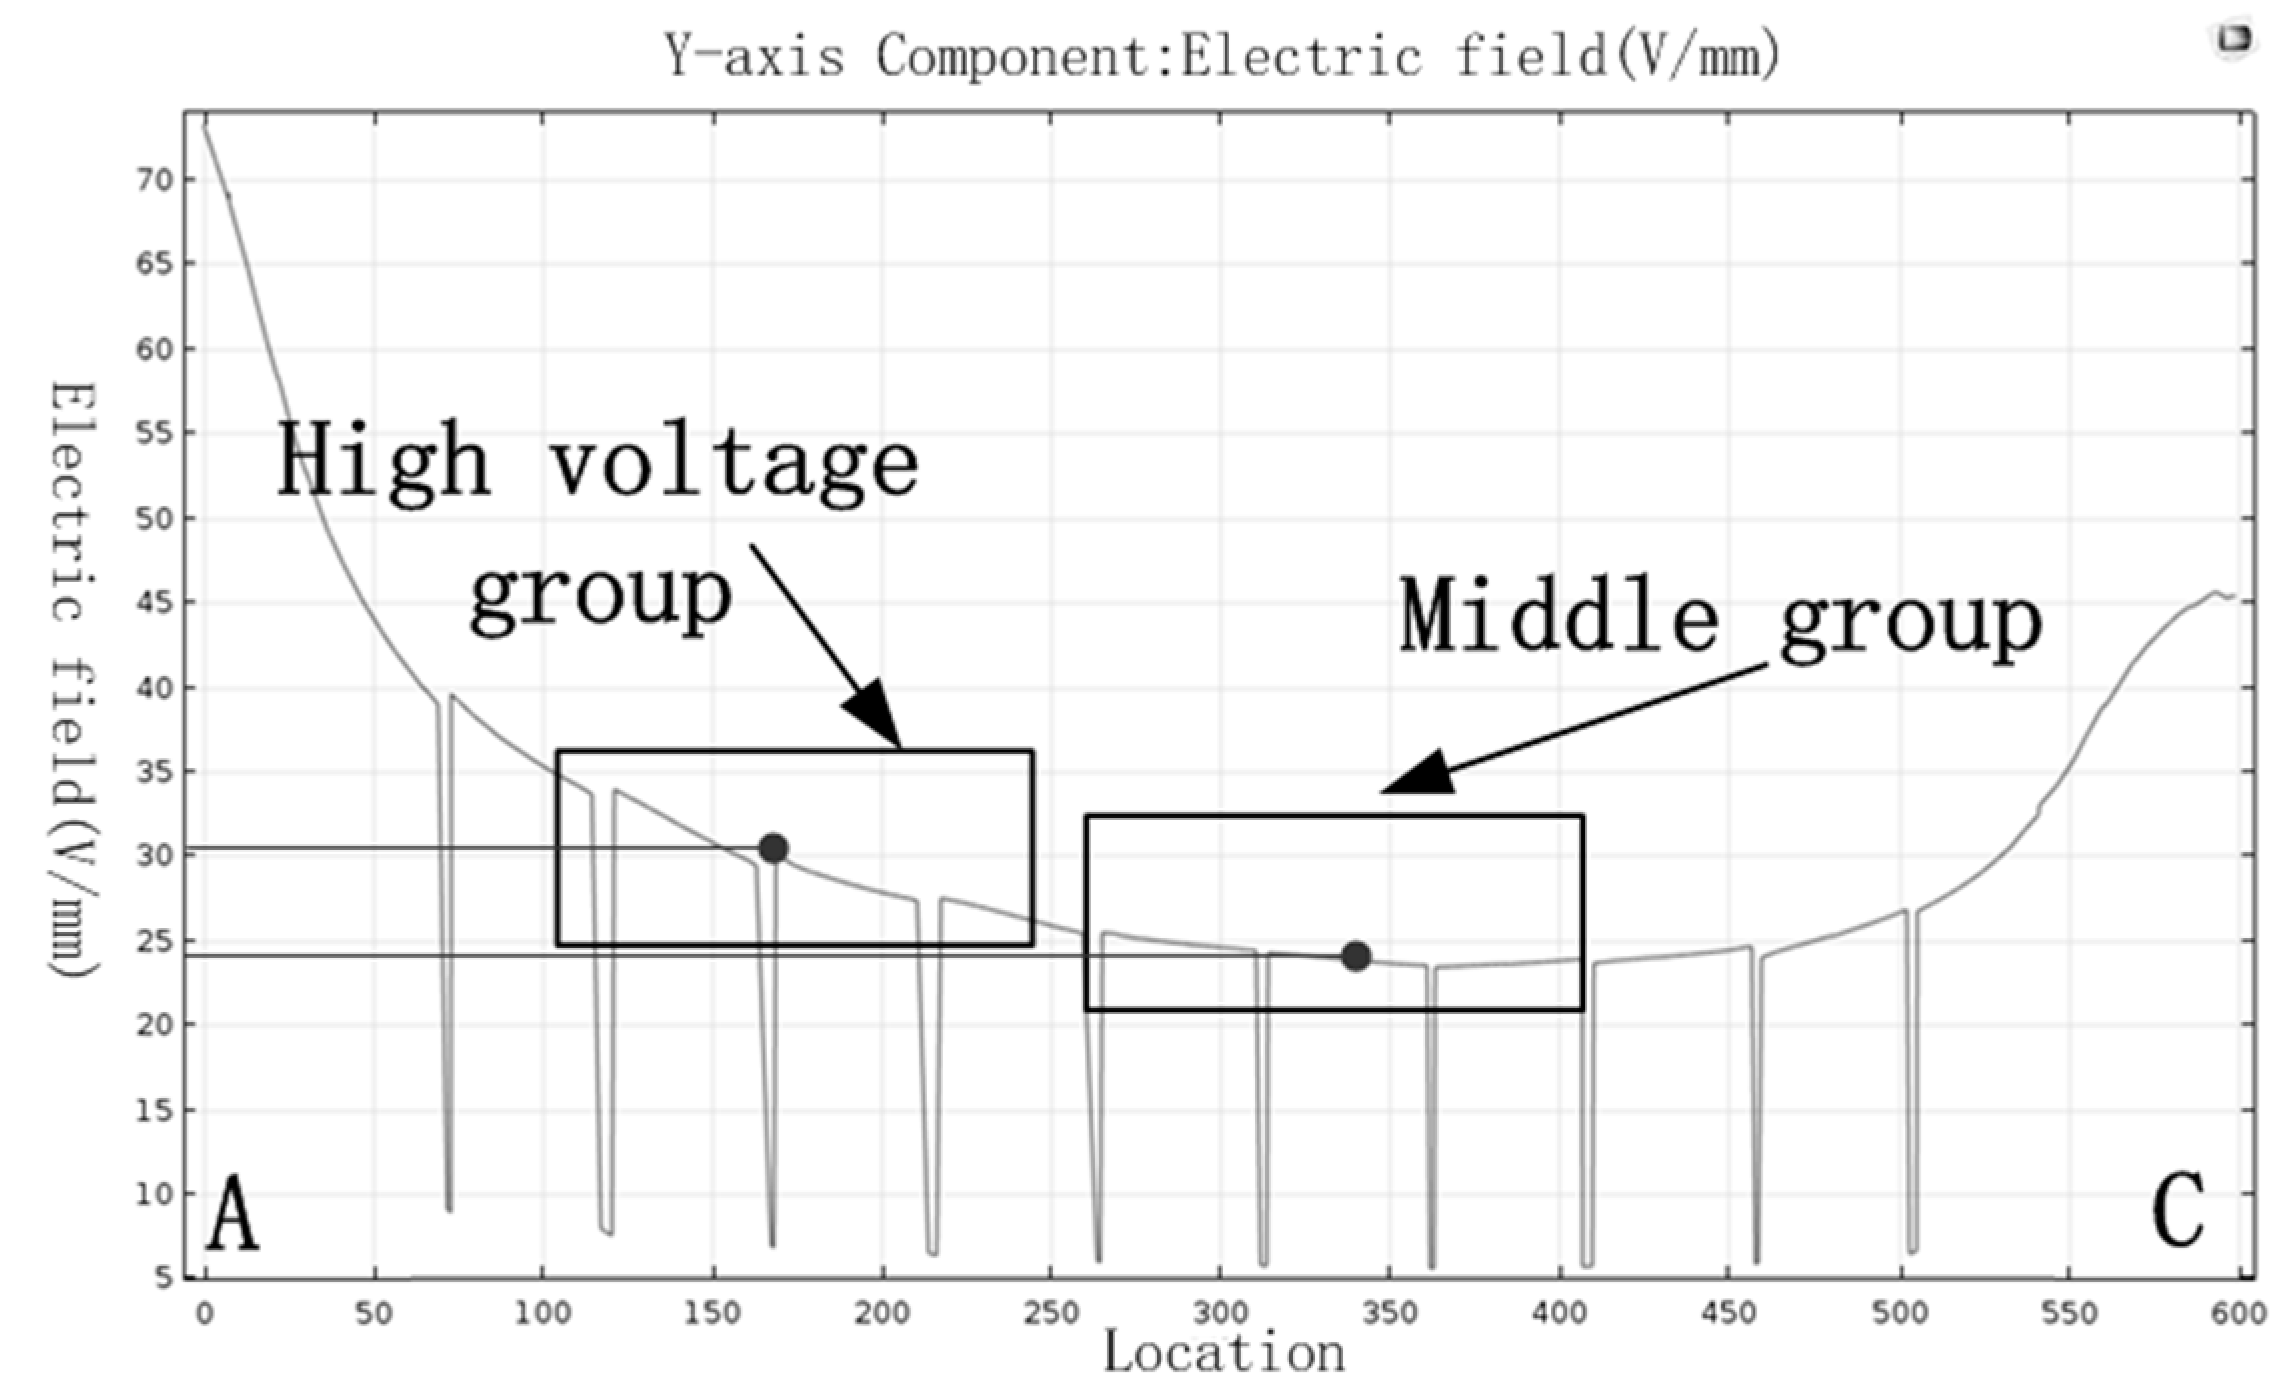
The electric field around insulators is distributed unevenly along the insulator surface, and the electric field at the high and low ends is larger. The maximum value occurs at the surface of the steel foot close to the high voltage end, reaching 13 kV/cm. The increase of contamination on the surface of the insulator is mainly caused by the force of the electric field in the vertical direction, because the vertical force will deflect the polluted particles into the insulator surface so as to increase the contamination amount. Therefore, we calculate Y axis component of electric field of the path A-C, as shown in Figure 9.
It can be seen from the graph that the Y axis components of electric field at high voltage group and middle group are 0.305 kv/cm, 0.24 kv/cm, respectively. Based on the calculated field strength, we calculate the forces acting on the vertical direction of contamination particles.
The movement of air ions will cause neutral atmosphere dust to be charged. Research shows that [19] 31% of the fly ash particles in nature have positive charges, 26% of fly ash particles have negative charges, and 43% of particles are not charged. The saturated charge of contaminated particles can be approximately expressed as:
where Qp is quantity of electric charge of particle, in C; E is the electric field intensity in V/m; e is elementary charge; dp is particle diameter, in m; εp is the relative dielectric constant of particles, its value of SiO2 is 4.5. In order to simplify the analysis, only the extreme case of saturated electricity is considered, so Formula (5) is used to characterize the quantity of electric charge of polluted particles. The electric field force on polluted particles is expressed as Formula (6).
where fe is electric field force. The calculated electric field force in the vertical direction on particle (take the diameter of 200 meshes as example) at the high voltage group and middle group are 1.67 × 10⁻¹⁰ N and 7.18 × 10⁻¹¹ N respectively. We can see that the calculated electric field force in the vertical direction on particle at the high voltage group is almost 1.6 times larger than that at the middle group. In order to further illustrate the influence of electric field force on the movement of particles around insulators, we estimate the acceleration of particles in vertical direction. The formula for calculating the quality of particles is as follows.
where ρp is the density of particles, its value of SiO2 is 2320 kg/m3. The particles are subjected to gravity and aerodynamic drag on the Y axis. It is observed from experiments that the movement of particles near insulator is basically horizontal under non-energized condition, so there is balance force on particles in the direction of Y axis, which means that fw = −fg, where fw is aerodynamic drag on particles and fg is gravity of particles. The formula for calculating the acceleration of particles is as follows.
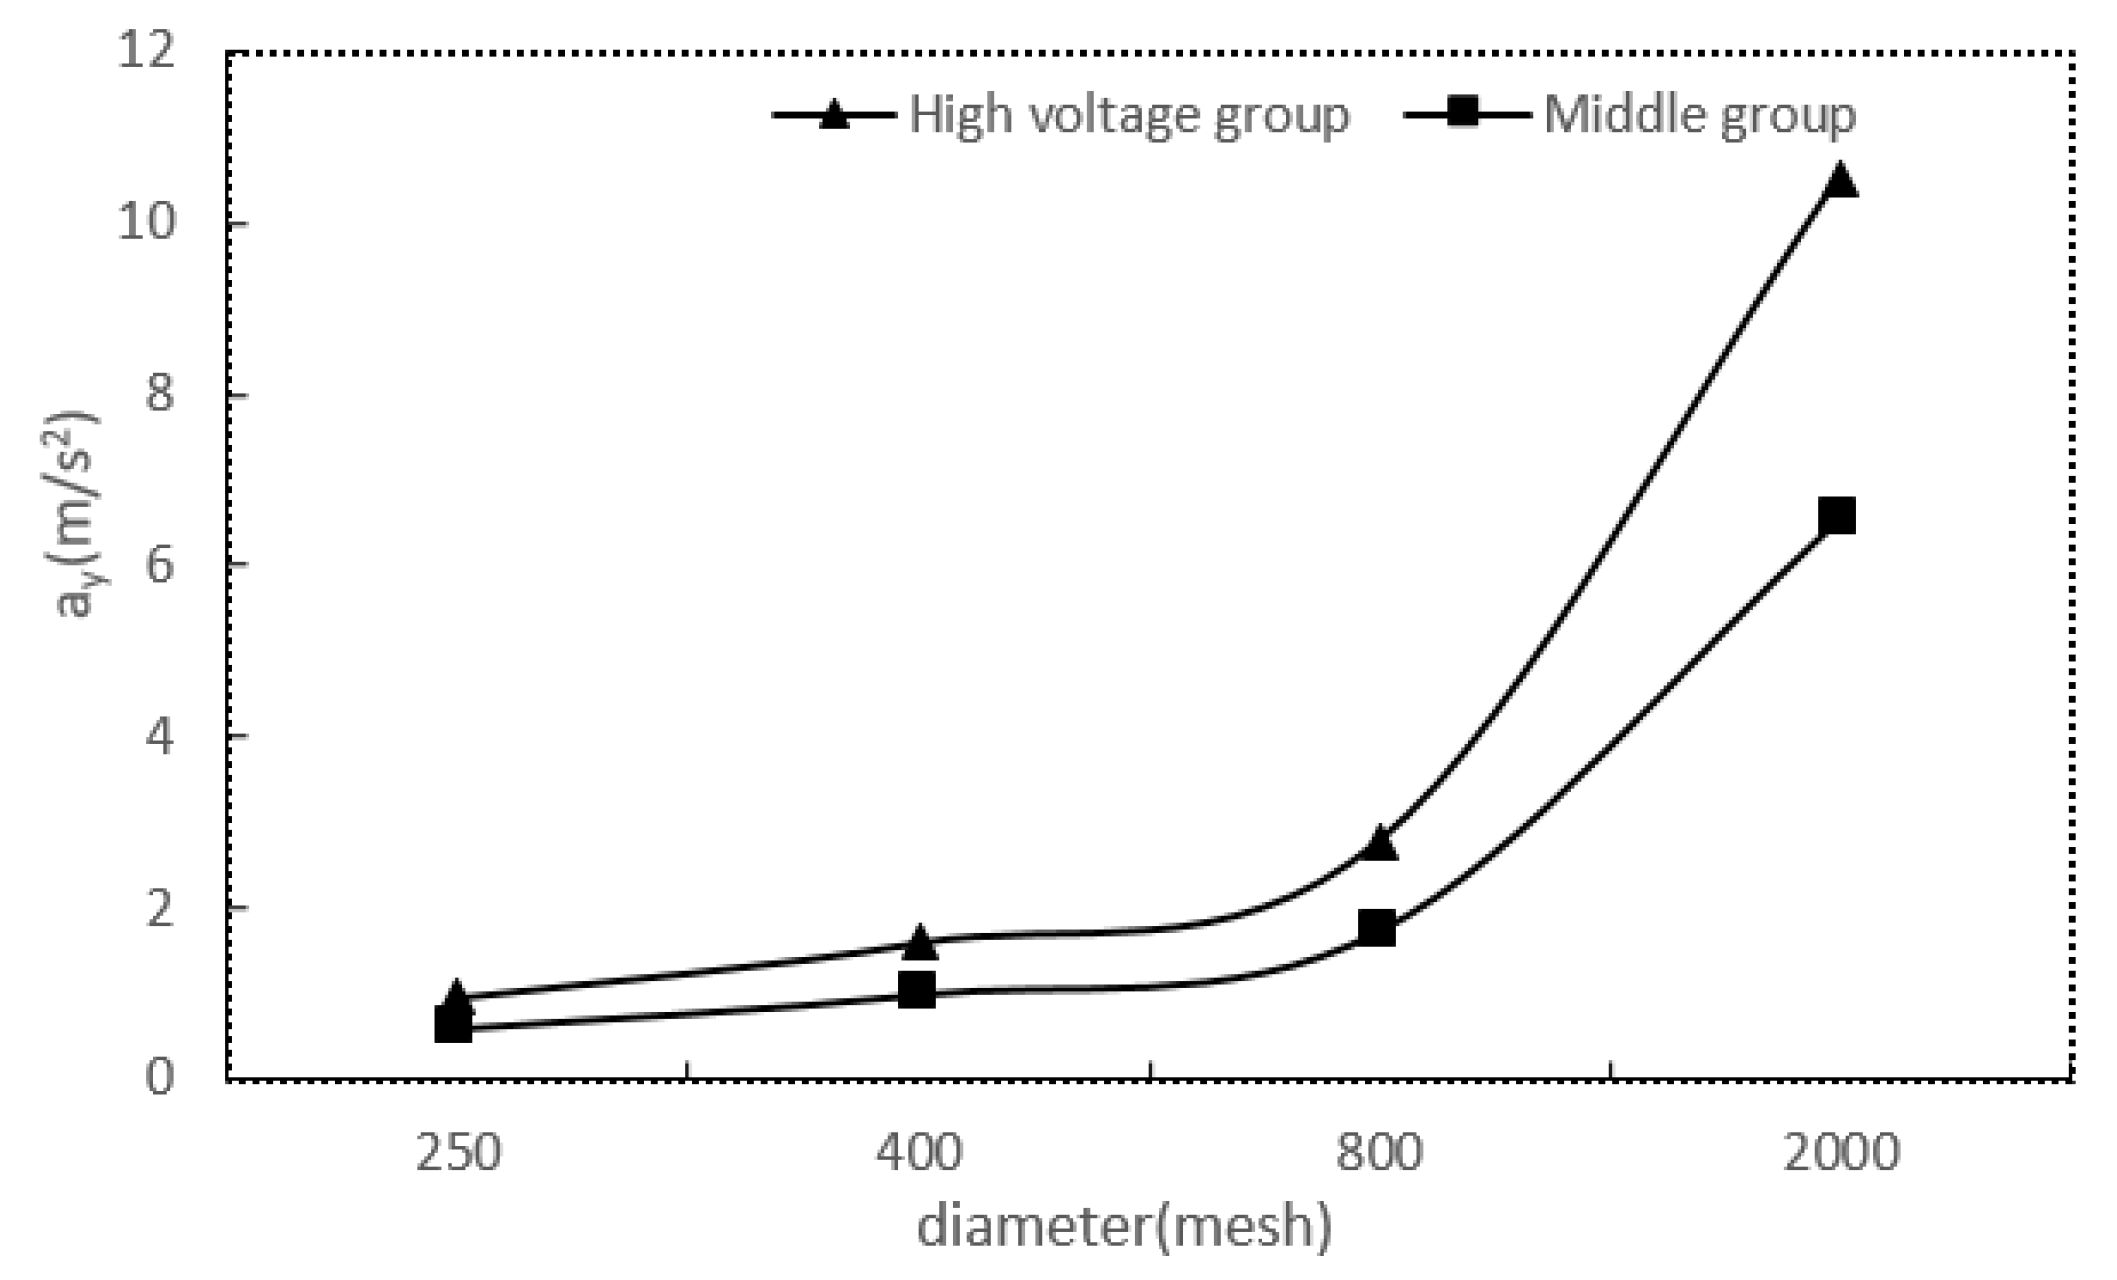
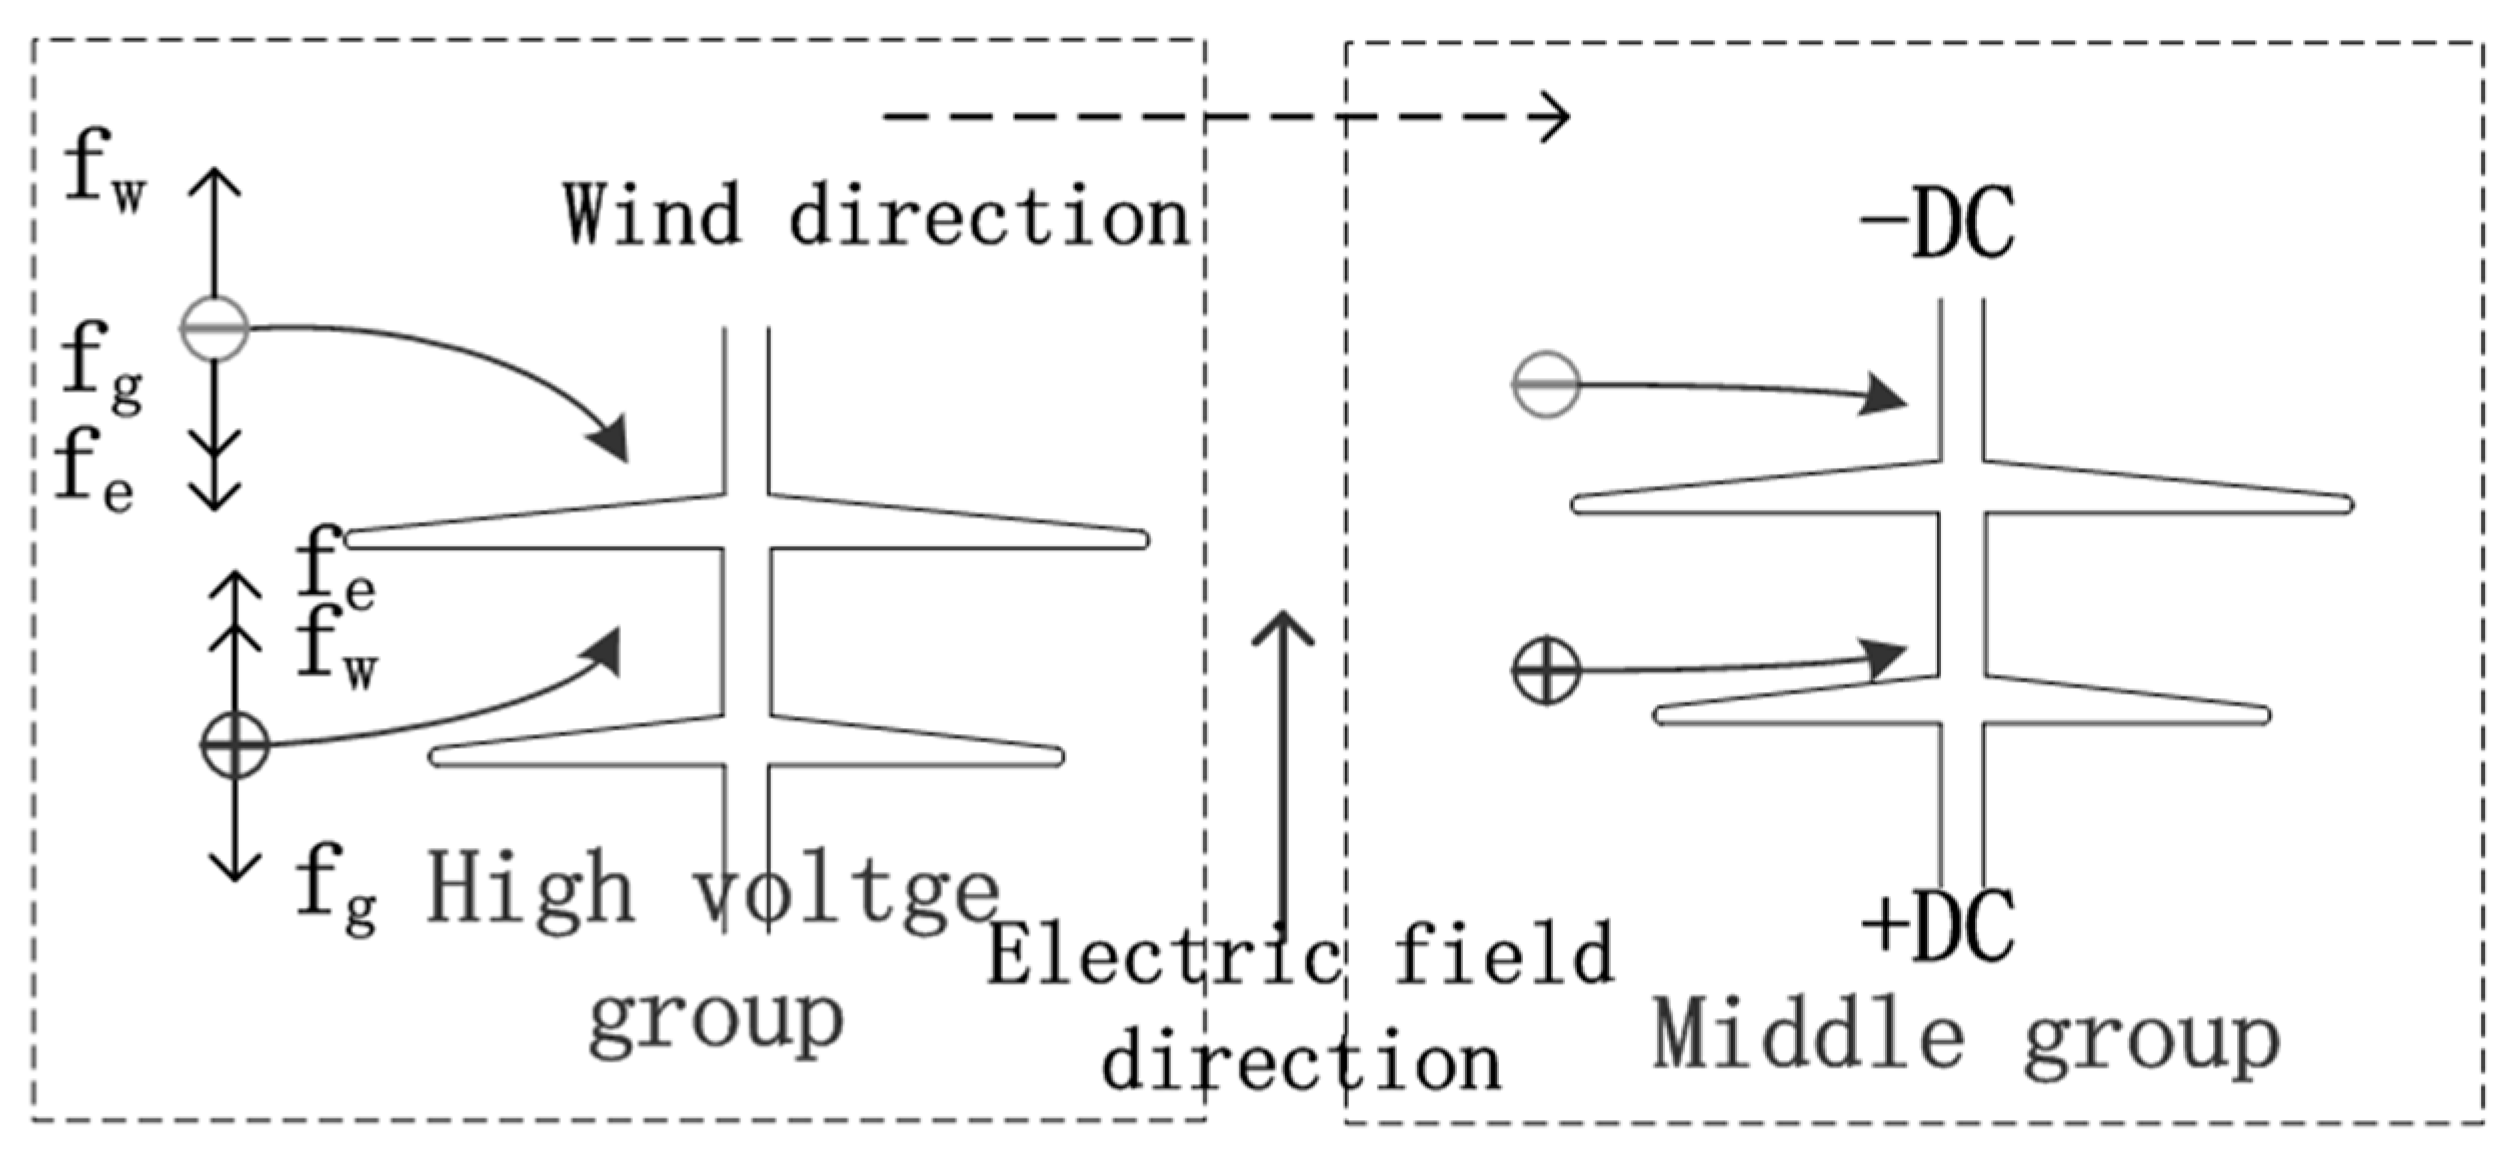
where f is the resultant force, which is approximately equal to the force of the electric field in the direction of Y axis. The calculated acceleration of different meshes particles at the high voltage group and middle group are shown in Figure 10. The calculated results show that the acceleration in vertical direction of the particles at the high voltage group is about 1.62 times that at the middle group. This calculated value is very close to the actual KH/M value. Then, we can get the trajectory trend of charged particles, as shown in the Figure 11. “+” represents a particle with positive charge and “−” represents a particle with negative charge.
It can be seen from Figure 11 that the charged particle moves toward the shed’s surface due to the effect of the electric field force, increasing the probability of particles hitting the sheds surface of the insulator. Thus, the amplitude of particle deflection at the high voltage group is greater than that at the middle group due to a larger acceleration of particles, causing the increasing probability of sorption of contamination particle, which explained the cause of non-uniform contamination distribution along the string.
Besides, after calculating the electric field around the field insulators, we have to transfer the situation from the field insulators to our model. According to the steps of Section 5.1 above, the acceleration in vertical direction of the particles can be obtained. The calculated results show that the acceleration in vertical direction of the particles at the high voltage group is about 2.51 times that at the middle group. Which means that KH/M in theory is about 1/0.40, we can see clearly that there is about 35% error in the result of the field test. This shows that the model is more accurate in the application of wind tunnel contamination, however there are still some errors in the application of field contamination. The main reason for the error is that the scouring of the rainwater reduced contamination inhomogeneity of field insulators between the high voltage group and middle group.
5.2. Future Research Directions
On the basis of the traditional research on insulator contamination, this paper has conducted deep research, but further work also need to be done to apply the research results to the operation of the power system. Firstly, based on the results of this study, we should continue to study the characteristics of pollution flashover (in non-uniform contamination distribution condition) and try to predict the pollution flashover voltage. Secondly, the contamination prediction model is still needed, and then the pollution prediction model is combined with the pollution flashover prediction model. Finally, the pollution flashover warning can be realized and measures can be taken in advance to prevent the pollution flashover accident.
6. Conclusions
This paper presents the pollution non-uniformity on insulator surface from both field contamination experiments of HVDC transmission lines and wind tunnel contamination simulation tests, as well as the mechanism of non-uniformity along insulator sting. Conclusions can be made that:
- (1)
- The contamination on insulator surfaces is very non-uniform in operating HVDC transmission lines, the non-uniformity is mainly reflected in three aspects, such as the top and bottom surface, windward and leeward side, high voltage group and middle group area. The value of KT/B, KW/L, KH/M are 1/0.49, 1/1.45, 1/0.61 respectively. Besides this, the value of K* and K is almost equal.
- (2)
- The effects of particles diameter, wind velocity and relatively humidity on pollution non-uniformity were quantitatively computed through wind tunnel simulation results. With the increase of wind speed (particles diameter is 250 meshes, RH is 60%), KT/B value remains almost constant and stable at around 0.5. However, the KW/L value (within 1/0.81–1/1.75) and KH/M value (within 1/0.49–1/0.71) presents a downward trend.With the decrease of particles diameter (wind speed is 5 m/s, RH is 60%), the KT/B value (within 1/0.51–1/0.66) and KW/L (within 1/1.45–1/1.36) value are closer to 1, which means non-uniformity becomes smaller, while the KH/M value (within 1/0.65–1/0.58) is the opposite.The change of relative humidity has little effect on KT/B and KW/L. With the increase of relative humidity (wind speed is 5 m/s, particles diameter is 250 meshes), KT/B and KW/L values remain almost constant and stable at around 1/0.5, 1/1.44 respectively. However, with the increase of humidity, the KH/M value (within 1/0.65–1/0.72) is closer to 1.
- (3)
- The electric field around insulators is unevenly distributed around the insulator surface, causing different electric field force and the acceleration on particles in vertical direction at high voltage group and middle group area, which is the cause of the non-uniform distribution of contamination along the insulator string.
Author Contributions
Z.Z. and X.Q. conceived the overall outline of the manuscript and all the authors contributed to the writing and revision of the paper.
Funding
This research was funded by Project [No. 2018CDYJSY0055] Supported by the Fundamental Research Funds for the Central Universities and Science and Technology Foundation of the State Grid Corporation of China [No. SGTYHT/14-JS-188].
Conflicts of Interest
The authors declare no conflict of interest.
References
- Jiang, X.; Yuan, J.; Zhang, Z.; Hu, J.; Shu, L. Study on Pollution Flashover Performance of Short Samples of Composite Insulators Intended for ±800 kV UHV DC. IEEE Trans. Dielectr. Electr. Insul. 2007, 14, 1192–1200. [Google Scholar] [CrossRef]
- Lin, Y.; Hao, Y.P.; Li, L.C.; Zhao, Y.M. Comparison of pollution flashover performance of porcelain long rod, disc type, and composite UHVDC insulators at high altitudes. IEEE Trans. Dielectr. Electr. Insul. 2012, 19, 1053–1059. [Google Scholar] [CrossRef]
- Baker, A.C.; Farzaneh, M.; Gorur, R.S.; Gubanski, S.M.; Hill, R.J.; Karady, G.G.; Schneider, H.M. Insulator selection for AC overhead lines with respect to contamination. IEEE Trans. Power Deliv. 2009, 24, 1633–1641. [Google Scholar] [CrossRef]
- Zhang, Z.; Jiang, X.; Chao, Y.; Sun, C.; Hu, J. Influence of Low Atmospheric Pressure on AC Pollution Flashover Performance of Various Types Insulators. IEEE Trans. Dielectr. Electr. Insul. 2010, 17, 425–433. [Google Scholar] [CrossRef]
- Gouda, O.E.; El Dein, A.Z. Laboratory simulation of naturally polluted high-voltage transmission line insulators. IET Gener. Transm. Distrib. 2014, 8, 321–327. [Google Scholar] [CrossRef]
- Ravelomanantsoa, N.; Farzaneh, M.; Chisholm, W.A. A Simulation Method for Winter Pollution Contamination of HV Insulators. In Proceedings of the 2011 EIC, Annapolis, MD, USA, 5–8 June 2011; pp. 373–376. [Google Scholar] [CrossRef]
- Sun, J.; Gao, G.; Zhou, L.; Wu, G. Pollution accumulation on rail insulator in high-speed aerosol. IEEE Trans. Dielectr. Electr. Insul. 2013, 20, 731–738. [Google Scholar] [CrossRef]
- Lv, Y.; Li, J.; Zhan, X.; Pang, G. A simulation study on pollution accumulation characteristics of XP13-160 porcelain suspension disc insulator. IEEE Trans. Dielectr. Electr. Insul. 2016, 23, 2196–2206. [Google Scholar] [CrossRef]
- Aouabed, F.; Bayadi, A.; Satta, S.; Boudissa, R. Conductivity effect on the flashover voltage of polluted polymeric insulator under AC voltage. In Proceedings of the 2010 45th International Universities Power Engineering Conference, Cardiff, Wales, UK, 31 August–3 September 2010; pp. 1–5. [Google Scholar]
- Jiang, X.; Wang, S.; Zhang, Z.; Hu, J.; Hu, Q. Investigation of Flashover Voltage and Non-uniform Pollution Correction Coefficient of Short Samples of Composite Insulator Intended for ±800 kV UHVDC. IEEE Trans. Dielectr. Electr. Insul. 2010, 17, 71–79. [Google Scholar] [CrossRef]
- Kumar, K.; Prakash, N.B.; Divya, S. Investigation of non-uniform pollution performance on RTV coated bushing. In Proceedings of the IEEE International Conference on Electrical, Computer and Communication Technologies, Coimbatore, India, 5–7 March 2015. [Google Scholar] [CrossRef]
- Sima, W.; Yuan, T.; Yang, Q.; Xu, K.; Sun, C. Effect of non-uniform pollution on the withstand characteristics of extra high voltage (EHV) suspension ceramic insulator string. IET. Gener. Transm. Distrib. 2010, 4, 445–455. [Google Scholar] [CrossRef]
- Zhang, Z.; Zhang, D.; You, J.; Zhao, J.; Jiang, X.; Hu, J. Study on the DC Flashover Performance of Various Types of Insulators with Fan-Shaped Non-uniform Pollution. IEEE Trans. Power Deliv. 2015, 30, 1871–1879. [Google Scholar] [CrossRef]
- Zhang, Z.; Wei, D.; Zhang, D.; Jiang, X.; Li, Y. Effects of ring-shaped non-uniform pollution on outdoor insulation electrical property. IEEE Trans. Dielectr. Electr. Insul. 2017, 24, 3603–3611. [Google Scholar] [CrossRef]
- Zhang, Z.; You, J.; Wei, D.; Jiang, X.; Zhang, D. Investigations on AC pollution flashover performance of insulator string under different non-uniform pollution conditions. IET. Gener. Transm. Distrib. 2016, 10, 437–443. [Google Scholar] [CrossRef]
- Boudissa, R.; Bayadi, A.; Haddad, A.; Baersch, R. Effect of pollution distribution class on insulators flashover under AC voltage. Electr. Power Syst. Res. 2013, 104, 176–182. [Google Scholar] [CrossRef]
- Takasu, K.; Shindo, T.; Arai, N. Natural contamination test of insulators with DC voltage energization at inland areas. IEEE Trans. Power Deliv. 1988, 3, 1847–1853. [Google Scholar] [CrossRef]
- Q/GDW 1152.2—2014. Pollution Classification and External Insulation Selection for Electric Power System, Part II: DC System; State Grid Corporation of China: Beijing, China, 2015. [Google Scholar]
- White, H.J. Industrial Electrostatic Precitiptators; Addison-Wesley: Reading, UK, 1963. [Google Scholar]
Figure 1.
Field pollution test of transmission line operating insulators. (a) the ±800 kV transmission line view; (b) Diagram natural contamination insulator string sample arrangement.
Figure 1.
Field pollution test of transmission line operating insulators. (a) the ±800 kV transmission line view; (b) Diagram natural contamination insulator string sample arrangement.

Figure 2.
Field pollution test of transmission line operating insulators.

Figure 3.
The flowchart of the measuring of the ESDD and NSDD.

Figure 4.
Structure of the samples.

Figure 5.
SiO2 powder samples used in the tunnel test: (a) optical microscope; (b) 250 and 2000 mesh powder specimen enlargement.
Figure 5.
SiO2 powder samples used in the tunnel test: (a) optical microscope; (b) 250 and 2000 mesh powder specimen enlargement.

Figure 6.
Wind tunnel test device. (a) Diagram of wind tunnel; (b) Wind tunnel.

Figure 7.
The contamination distribution of different insulators. (a) Sample in non-energized condition; (b) Sample with voltage of DC + 35 kV.
Figure 7.
The contamination distribution of different insulators. (a) Sample in non-energized condition; (b) Sample with voltage of DC + 35 kV.

Figure 8.
Contour line of the electric field around Type-A.

Figure 9.
Y axis component of electric field.

Figure 10.
The calculated Y-axis acceleration.

Figure 11.
The trajectory trend of charged particles.


Table 1.
Contamination degree and non-uniformity results for field operating insulators.
| NSDD (mg/cm2) | NSDDT | NSDDB | NSDDW | NSDDL | NSDDH | NSDDM |
| Average value | 0.342 | 0.167 | 0.208 | 0.301 | 0.316 | 0.193 |
| σ | 13.5% | 11.1% | 8.6% | 9.6% | 9.3% | 8.2% |
| ESDD (mg/cm2) | ESDDT | ESDDB | ESDDW | ESDDL | ESDDH | ESDDM |
| Average value | 0.061 | 0.031 | 0.037 | 0.054 | 0.056 | 0.035 |
| σ | 13.6% | 9.1% | 8.8% | 10.5% | 10.2% | 8.7% |
| K | KT/B | K*T/B | KW/L | K*W/L | KH/M | K*H/M |
| Average value | 1/0.49 | 1/0.51 | 1/1.45 | 1/1.46 | 1/0.61 | 1/0.62 |
Table 2.
Structure parameters of the tested insulators.
| Sample | Material | Parameters (mm) | ||
|---|---|---|---|---|
| D | d | H | ||
| Type-A | Silicon rubber | 135 | 105 | 660 |
Table 3.
Diameter situations of tested SiO2 powder.
| Powder Specification (mesh) | d (10%) | d (50%) | d (90%) | D50 (μm) |
|---|---|---|---|---|
| 250 | 35.3 | 46.5 | 57.8 | 46.5 |
| 400 | 22.3 | 27.7 | 35.2 | 27.7 |
| 800 | 11.8 | 15.9 | 17.6 | 15.9 |
| 2000 | 2.8 | 4.2 | 5.8 | 4.2 |
Note: d (10%), 10% particle size is smaller than this value; d (50%), 50% particle size is smaller than this value; d (90%), 90% particle size is smaller than this value, D50, average particle size, cumulative probability distribution of particle size is 50%.
Table 4.
Average NSDD, KT/B, KW/L, KH/M under different wind speed.
| Wind Speed (m/s) | 1 | 3 | 5 | 7 |
|---|---|---|---|---|
| NSDD (mg/cm2) | 0.12 | 0.16 | 0.21 | 0.32 |
| σ | 5.7% | 6.8% | 7.3% | 6.5% |
| KT/B | 1/0.48 | 1/0.52 | 1/0.51 | 1/0.55 |
| KW/L | 1/0.81 | 1/1.22 | 1/1.45 | 1/1.75 |
| KH/M | 1/0.49 | 1/0.56 | 1/0.65 | 1/0.71 |
Table 5.
KT/B, KW/L, KH/M with different particles diameter.
| D50 (μm) | 46.5 | 27.7 | 15.9 | 4.2 |
|---|---|---|---|---|
| NSDD (mg/cm2) | 0.21 | 0.25 | 0.30 | 0.35 |
| σ | 7.7% | 5.5% | 4.2% | 3.6% |
| KT/B | 1/0.51 | 1/0.56 | 1/0.62 | 1/0.66 |
| KW/L | 1/1.45 | 1/1.42 | 1/1.40 | 1/1.36 |
| KH/M | 1/0.65 | 1/0.63 | 1/0.60 | 1/0.58 |
Table 6.
KT/B, KW/L, KH/M under different relatively humidity.
| Relatively Humidity | 60% | 70% | 80% | 90% |
|---|---|---|---|---|
| NSDD (mg/cm2) | 0.21 | 0.23 | 0.25 | 0.26 |
| Σ | 4.1% | 5.6% | 7.2% | 7.7% |
| KT/B | 1/0.51 | 1/0.51 | 1/0.53 | 1/0.49 |
| KW/L | 1/1.45 | 1/1.44 | 1/1.45 | 1/1.43 |
| KH/M | 1/0.65 | 1/0.67 | 1/0.70 | 1/0.72 |
© 2018 by the authors. Licensee MDPI, Basel, Switzerland. This article is an open access article distributed under the terms and conditions of the Creative Commons Attribution (CC BY) license (http://creativecommons.org/licenses/by/4.0/).
Share and Cite
MDPI and ACS Style
Zhang, Z.; Qiao, X.; Yang, S.; Jiang, X. Non-Uniform Distribution of Contamination on Composite Insulators in HVDC Transmission Lines. Appl. Sci. 2018, 8, 1962. https://doi.org/10.3390/app8101962
AMA Style
Zhang Z, Qiao X, Yang S, Jiang X. Non-Uniform Distribution of Contamination on Composite Insulators in HVDC Transmission Lines. Applied Sciences. 2018; 8(10):1962. https://doi.org/10.3390/app8101962
Chicago/Turabian StyleZhang, Zhijin, Xinhan Qiao, Shenghuan Yang, and Xingliang Jiang. 2018. "Non-Uniform Distribution of Contamination on Composite Insulators in HVDC Transmission Lines" Applied Sciences 8, no. 10: 1962. https://doi.org/10.3390/app8101962
Note that from the first issue of 2016, this journal uses article numbers instead of page numbers. See further details here.