Article

Severely Damaged Reinforced Concrete Circular Columns Repaired by Turned Steel Rebar and High-Performance Concrete Jacketing with Steel or Polymer Fibers

1
College of Civil Engineering, Fuzhou University, Fuzhou 350108, China
2
Department of Architecture, Roma Tre University, 00153 Rome, Italy
3
Department of Engineering and Geology, University of Chieti and Pescara, 65127 Pescara, Italy
4
Department of Engineering, University of Modena and Reggio, 41125 Modena, Italy
*
Author to whom correspondence should be addressed.
Appl. Sci. 2018, 8(9), 1671; https://doi.org/10.3390/app8091671
Submission received: 25 August 2018 / Revised: 10 September 2018 / Accepted: 10 September 2018 / Published: 15 September 2018
(This article belongs to the Section Materials Science and Engineering)

Abstract

:
A new strategy that repairs severely damaged reinforced concrete (RC) columns after an earthquake is proposed as a simpler and quicker solution with respect to the strategies currently available in the literature. The external concrete parts are removed from the column surface along the whole plastic hinge region to uncover the steel reinforcement. The transverse steel is cut away, and each longitudinal rebar is locally substituted by steel rebar segments connected by welding connections to the original undamaged rebar pieces outside the intervention zone. The new rebar segments have a reduced diameter achieved by turning to ensure plastic deformation only in the plastic hinge, protecting the original rebar and the welding connections. The connection is specifically designed to be effective and simple, and is directly realized on column reinforcement. Finally, the removed concrete is restored by a jacket built with high-performance concrete with steel or polymer fibers. The use of concrete with high volume fraction of polymer fibers to repair the column is investigated for the first time in this paper. This concrete was characterized by compression and flexural tests in the laboratory and its mechanical characteristics were compared with those of the concrete with steel fibers, which are being increasingly used in construction. The repair strategy was applied to two RC columns (1:6 scaled bridge piers), tested by asymmetric cyclic tests. The results show that the column strength, stiffness, and ductility were restored, and the energy dissipation capacity improved. The experimental evidence was investigated by fiber models in OpenSees.

1. Introduction

In seismic regions such as Italy, the evaluation of the capacity and fragility of structural and infrastructural systems subjected to seismic events [1,2,3,4,5,6,7,8,9], and implementing proper survey programs to monitor the evolution of their capabilities [10,11] are important for preventing severe seismic damage being observed in recent seismic events [12] by means of retrofitting interventions [13,14,15,16,17,18,19,20,21,22,23,24,25,26,27,28,29,30,31].
Repair strategies to restore or improve the seismic capacity of reinforced concrete (RC) components, usually seriously damaged after a strong earthquake [32,33,34,35,36,37,38,39,40,41,42,43,44], may significantly reduce the economic, social, and environmental impacts with respect to reconstruction. Repairs should be performed simply and quickly on construction sites to assure that the strategy is appropriate also in case of bridges that are strategic for the emergency response.
In the literature, the repair of RC components is usually performed in case of modest damage (local concrete spalling or modest deformation of the steel reinforcement) when the deformed rebar can be straightened, and the cover can be restored by simple mortar patches. Finally, an external fiber reinforced polymer (FRP) is applied to improve the shear strength and the ductility of the component [33].
However, serious damage, which includes high deformation of longitudinal rebar in tension or in compression, steel reinforcement rupture, and concrete core crashing in compression, may arise: (1) In the plastic hinge region of the RC components designed by capacity design criteria after a strong earthquake; (2) in the most stressed zones of the RC components not properly designed or built for the seismic action after a moderate earthquake; and (3) along the RC component when the corrosion of the steel reinforcement is severe.
Damaged rebar substitution is problematic because anchoring new rebar in the existing foundation is difficult, and new rebar may congest the existing steel reinforcement and complicate the concrete pouring to restore the removed concrete parts. The substitution of the damaged rebar segments only in the plastic hinge using new rebar segments may minimize these problems. The new segments can be connected to the existing anchorages and to the rebar part outside the plastic hinge region, and the use of rebar segments can limit the congestion of the steel reinforcement. The protection of the rebar connections then become one of the most important design targets.
A review of the literature provided few solutions for the local substitution of the broken rebar. Therefore, new research efforts are necessary. These research studies presented different solutions to connect new rebar to the existing rebar. The rebar substitution performed by Cheng et al. [35] used special dog-bone bars connected by welding to the existing rebar and guaranteed plastic deformation along the plastic hinge only. This dog bone was a special piece built in the laboratory, so the proposed connection with the original rebar can be problematic on actual construction sites. Lavorato et al. [36] successfully tested a local rebar substitution using stainless steel rebar to improve the durability of the intervention. A new rebar connection system using asymmetric lateral welding showed possible failure in the case of high levels of rebar deformation. Rodrigues et al. [37] locally substituted the damaged rebar parts with identical rebar segments connected by different connection systems by welding. This resulting solution was effective, but the column core was entirely removed to ensure adequate proper work space, and the use of steel segment rebar with the same size and mechanical characteristics of the existing rebar may not guarantee plasticization in the plastic hinge only—away from the original anchorages of the rebar—because the strength of the new steel segments may be statistically higher than that of the original rebar. Lavorato and colleagues [24,31] simplified Cheng et al.’s dog-bone solution and locally substituted the rebar with turned rebar segments connected by a butt head and lateral welding chords along a steel coupler. This strong connection system ensured plastic dissipation in the plastic hinge region only and the protection of the existing rebar (anchorages and existing undamaged rebar part outside the plastic hinge).
In the present paper, a new repair strategy for severely damaged RC components is proposed to simplify the solutions presented in the literature. The strategy includes: (1) The removal of the external concrete part around the column in the plastic hinge region to permit the local rebar substitution; (2) the cleaning of the residual concrete from the rebar surface; (3) shaping the surface of the concrete core to improve the interlock between existing and new concrete parts; (4) substitution of the damaged longitudinal rebar parts with new shaped rebar segments, tested successfully by Lavorato et al. [31]; and (5) constructing a concrete jacket by means of high-performance fiber reinforced concrete (HPFRC) with steel or polymer fibers to restore the removed concrete parts and to ensure seismic retrofitting (column shear strength and ductility improvements).
The rebar substitution was performed as outlined by Lavorato and colleagues [24,31], and because this process is simple, it is effective, rapid, and adaptable to each specific intervention, allowing cost savings.
The novelty of the proposed repair strategy is the use of steel or polymer fibers in the concrete to restore the removed concrete parts. For that reason, the new concrete jacket does not change the component cross-section dimensions after the repair. The fibers improve the compressive and tensile strength of the concrete due to the fiber tensile strength in the concrete cracks (fiber bridging effect) and increases the component durability by reducing the shrinkage cracking, spalling, and thermal cracking [45]. The concrete jacket used to restore the concrete parts improves the shear strength and the ductility of the repaired RC component [38,39,40,41]. In fact, the fibers additionally contribute to the shear strength of the RC component by bridging the cracks and confining the concrete to a distributed transversal reinforcement, improving the ductility of the repaired component.
The transverse steel is not necessary and therefore the concrete cast is simplified. The external FRP wrapping is not necessary, so the cost and time required for intervention can be considerably reduced. The repair solution can be performed in four-to-five-days, and it is also applicable for quick emergency responses after a strong earthquake for structures such as bridges that can be critical in the net of structures and infrastructure [1,2,3,4,5,6,7,8].
The remainder of this paper is organized as follows. First, the results of the tests performed at the Fuzhou University (China) laboratory on the HPFRC concrete with steel or polymer fibers, used to repair the RC component concrete parts, and considering different fiber volume fractions, are presented. This study evaluates the concrete workability in casting the new concrete part and the variation in the concrete mechanical characteristics for different types and fiber contents to select the proper fiber content (Section 2). In particular, compression (Section 2.2.1) and bending tests (Section 2.2.2) are carried out to determine the concrete compressive and the tensile strengths and the load crack tip opening displacement (CTOD) curves, respectively. Next, equations are presented to determine the tensile strength of the fiber concretes based on the bending tests in Section 2.3 and the design equations, used to evaluate the shear strength of the repaired circular columns, are discussed in Section 3. A bridge, with a configuration typical of highway bridges around the world, is selected for a case study presented in Section 4. In the same section, two RC columns (the as-built columns), which represent the shorter pier of a bridge by proper scale factors [36], are built to be severely damaged in the plastic hinge region using cyclic tests in the laboratory according the test protocol presented in Section 5. The displacement-controlled method is used to apply an asymmetric displacement history to the top of the two columns. This history is representative of that recordable when the bridge is subjected to a strong, and then a very strong, seismic event. Then, the damaged columns are repaired using the proposed strategy, which are again tested applying the same cyclic displacement history used to damage the as-built columns (Section 5). Construction details and in situ operative difficulties are evaluated from an engineering point of view. The experimental results obtained by the cyclic tests on the as-built and repaired columns are presented in Section 6. In this section, the responses of the as-built and the repaired columns are presented in terms of the maximum base shear and ductility (Section 6.1), stiffness evolution (Section 6.2), dissipated energy (Section 6.3), hysteretic damping (Section 6.4), shear strength (Section 6.5) according to the guideline equations (Section 3), concrete jacket circumferential strain (Section 6.6), and the column damage and failure mode (Section 6.7). The comparisons among the as-built and the repaired columns permitted us to evaluate the effectiveness of the proposed repair strategy. In Section 7, a fiber model of the column section, built in the Open System for Earthquake Engineering Simulation (OpenSees, UC Berkeley, Berkeley, CA, USA) [46] was validated based on the experimental results. This model permitted us to numerically investigate, in detail, the maximum base shear measured experimentally. Finally, the conclusions in Section 8 show that the repair strategy is effective, rapid, and feasible on construction sites. The stiffness, maximum base shear, and displacement ductility were restored, and the energy dissipation capacity improved. The design code equations can correctly predict the column shear strength, and therefore can be a valid tool for designers.

2. High-Performance Fiber Reinforced Concrete to Repair RC Components

2.1. Concrete Mix Design

The repair strategy involves restoring the removed concrete parts using a high-performance fiber reinforced concrete (HPFRC) jacket with steel or polymer fibers.
The high-performance fiber reinforced concrete with steel fiber was labelled by the abbreviation UHS, whereas the high-performance fiber reinforced concrete with polymer fiber was labelled by the abbreviation UHP. Due to their durability, polymer fibers are interesting for structural use because they can guarantee their full characteristics during the entire structure lifespan, even if exposed to sun, wind, and rain.
Different steel or polymer fibers volume fractions were studied to determine the optimal concrete mix for structural use in the repair of RC components. The high-performance concrete (HPC) premix consisted mainly of Portland cement, silica fume, crushed quartz, and sand. Similar to ultra-high-performance concrete (UHPC), if a coarse aggregate is used, the interfacial transition zone (ITZ) between the coarse aggregate and mortar is weak, which decreases the strength of the concrete. Therefore, coarse aggregate was not used in HPC to ensure that the HPC would have high compressive strength [47]. The concrete mix design included: 1 part ordinary Portland cement (P.O.) 42.5, 0.3 parts silica fume (30%, particle size 0.1–0.2 μm, density 2.0 g/cm3), 1.2 parts sand from the Minjiang River (dimension of smaller particle equal to 0.63 mm and density of 2.6 g/cm3), 0.025 parts superplasticizers (polycarboxylate, PCE; reduction water up to 25%), and water. The water/cement ratio was 0.26 due to the use of the superplasticizers properly calibrated as a function of the fiber type and the fibers volume content to ensure the performance of the concrete (such as the ability to pass), similar to the performance a self-compacting concrete (SCC) in the fresh state.
Three steel fiber volume fractions (1, 2, or 3%) were investigated to select the proper UHS to repair the column. The steel fibers were 13 mm long, had an equivalent diameter of 0.2 mm, ultimate tensile strength of 2000 MPa, and a modulus of elasticity of 200 GPa.
After the study on the concrete with steel fibers, two concretes with polymer fiber volume fractions of 2% and 4% were studied to select the optimal UHP to repair the column. The 2% value was selected to compare the results of concrete with steel and polymeric fiber, whereas the 4% is the maximum value that ensures the workability and cast of the concrete in modest volumes.
The polymer fibers were structural fibers iBETON produced by Istrice (Fili & Forme Srl, Modena, Italy) according the Italian National Unification association (UNI) standards UNI EN 14889-2 [48], designed to improve the durability and mechanical properties of concrete. The fibers high-volume fraction of 4% had not been previously investigated for structural use. These fibers were composed of polymer material with high density and resistance, 29 mm long, had an equivalent diameter of 0.77 mm, ultimate tensile strength of 520 MPa, and modulus of elasticity of 4.1 GPa.
The concretes had a mix design that guaranteed optimal placement and consolidation under their weight without any vibration operation, excellent deformability, and were cohesive and able to avoid segregation or bleeding.

2.2. Concrete Mechanical Characterization

Compression and bending tests were carried out on concrete cubes and beams on each concrete mix design selected in Section 2 to investigate the material behavior, respectively. This mechanical characterization permitted us to identify the optimal steel and polymer fiber volume fraction for structural use for the repair of RC components, and the concrete mechanical properties necessary to predict the flexural and shear strength of the repaired components using design equations.

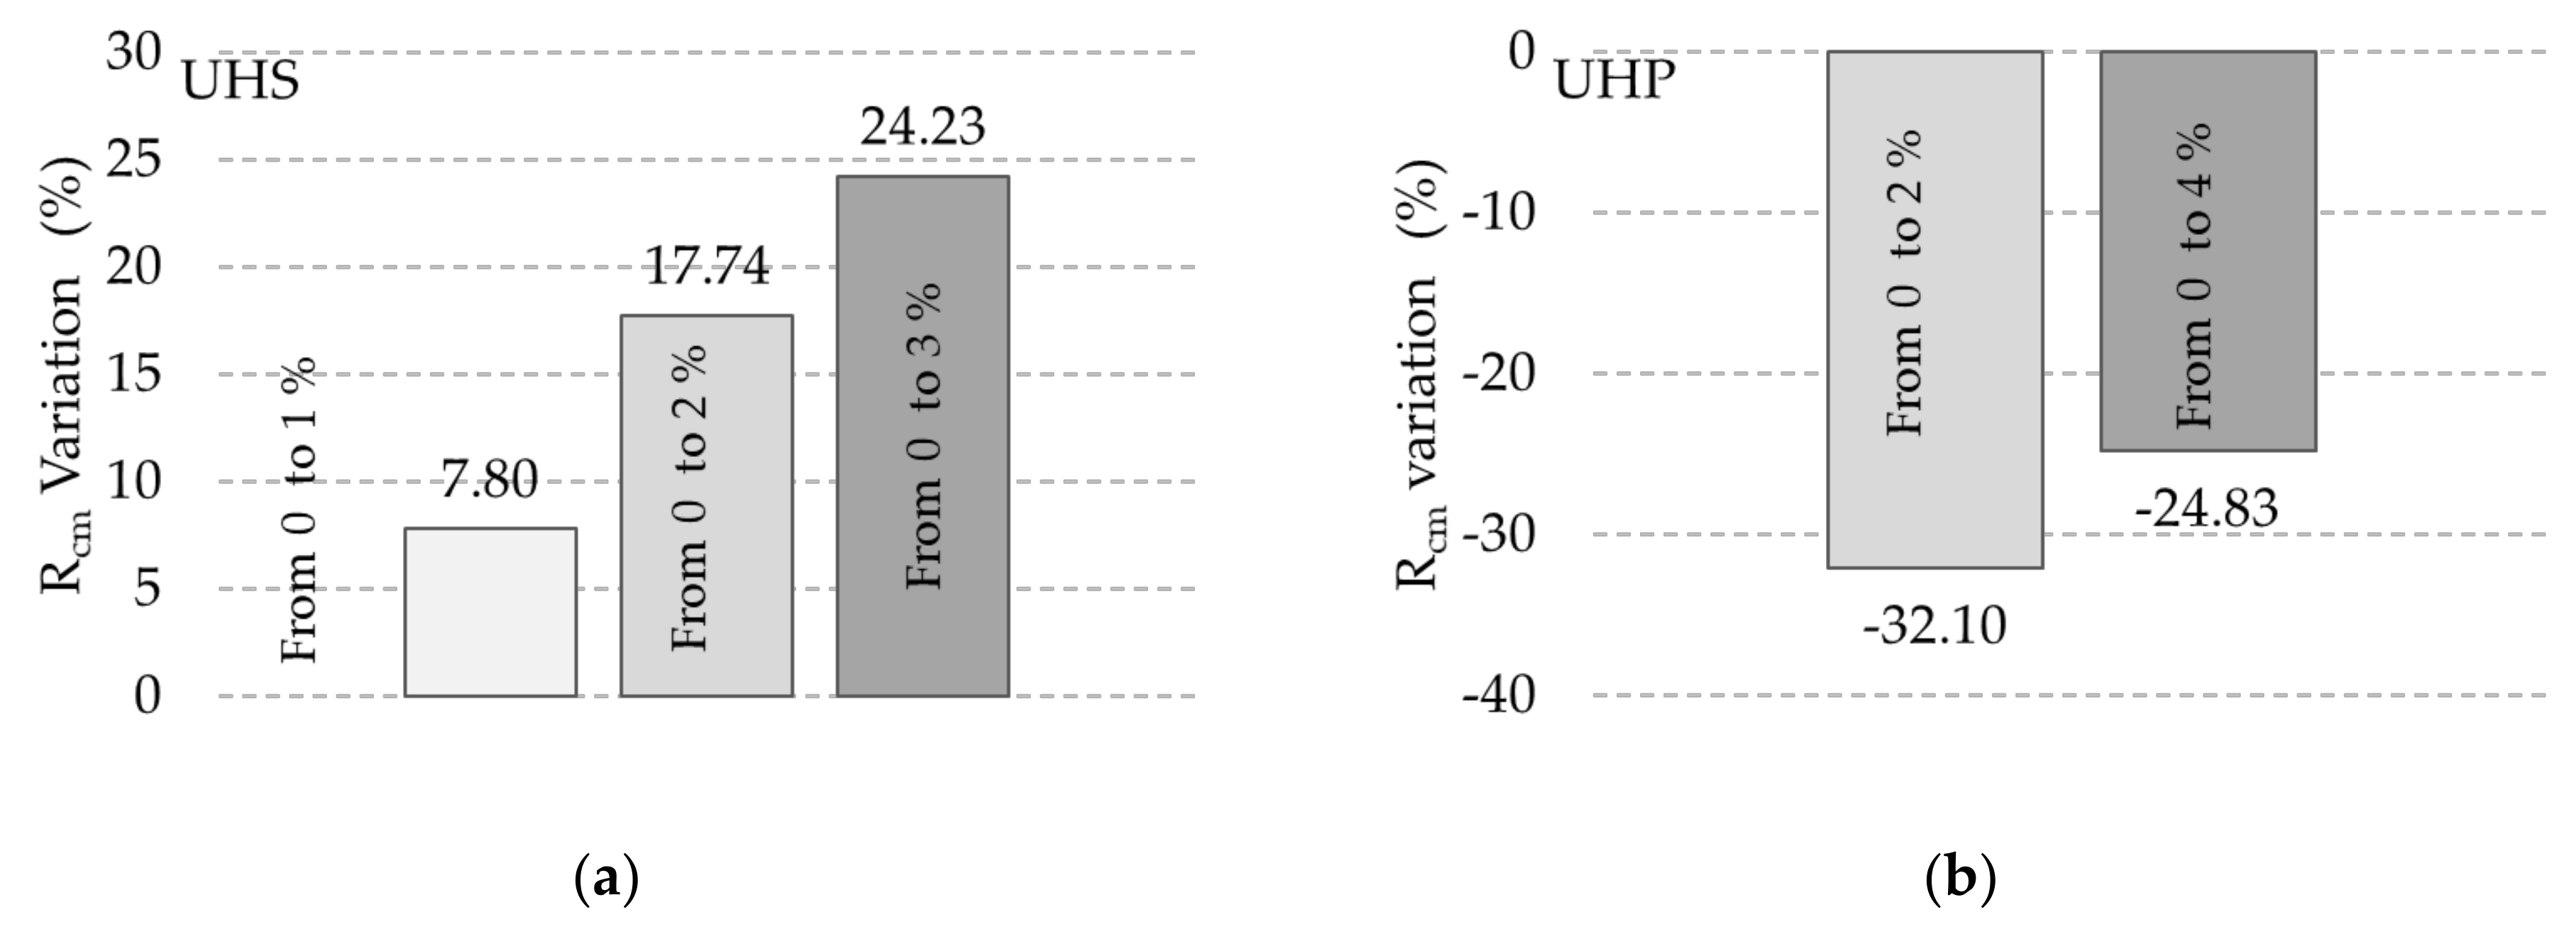
2.2.1. Compression Test

The compression tests were performed on concrete cubes 100 × 100 × 100 mm3 after seven days of standard curing to evaluate the performance of the material after the rapid repair strategy. The material mechanical characteristics were identified for concrete without fibers, with steel (UHS), or with polymer (UHP) fibers considering: (1) Four cubes for each fiber fraction (0, 1, 2, and 3%) for concrete with steel fibers (UHS), and (2) four cubes for each fiber fraction (0, 2, and 4%) for concrete with polymer fibers (UHP).
First, the UHS concrete cubes and then the UHP ones were created. The mix design of the concrete matrix was the same for the two concretes. Then, the UHS specimens were tested by an available test apparatus using a force-controlled test method until specimen rupture, applying a vertical load on the specimen with a constant rate of 11.3 kN/s. Next, the UHP specimens were tested by a new test apparatus using a displacement-controlled test method until specimen rupture, by applying constant displacements with a velocity of 1.5 mm/min.
The compressive strength was evaluated without differences using the two test methods. The mean compressive strength values are provided for the UHS and the UHP cubes in Table 1.
The concrete specimens without fiber were built to determine the strengths of the concrete matrixes of the UHS and the UHP, which showed different mean values of compressive strength (Table 1). The results in Table 1 require further investigation because the UHS and the UHP concretes were created at different times. The steel and the polymer fibers had different mechanical properties (Section 2.1). Therefore, the UHS cubes with 2% steel fiber showed a mean compressive strength that is twice that of the UHP cubes with the same fiber volume fraction because the steel and polymer fibers mechanical characteristics, in term of strength, were different (Section 2.1).
In terms of the compression strength variation with the fiber volumetric fraction:
(1)
The concrete with steel fibers (UHS) showed an increase in strength as the fiber volume fraction increased (Figure 1a). That phenomenon was not constant but it tended to reduce increasing the fiber percentage.
(2)
The concrete with polymer fibers (UHP) presented a decrease in the strength when the fiber volume fraction increased (Figure 1b).
The reduction of the polypropylene-based fiber reinforced concrete compressive strength compared to the plain concrete may be due to several different effects. One could be due to the lower Young’s modulus of the polymer (E = 4100 MPa), compared to that of the matrix (not measured, but in the order of 40,000–45,000 MPa) [49], which induces stress concentrations, leading to early cracking. That is not the case of using steel fiber characterized by higher modulus (E = 200,000 MPa). As investigated by previous researchers, it can be also related to the interfacial transition zone (ITZ) effect [50] and to the hydrophobic nature of polymer fibers that could produce a void between the fiber and the concrete matrix, reducing the resisting area of concrete specimen. The low bond strength produces breaks in the bond between the aggregate and the cement and creates a large surface area of material breaking in the cement bond that was also observed in Richardson’s work [51]. Further experimental studies are necessary to better investigate the reduction of the compressive strength observed for concrete with polymer fibers.
In terms of the failure mode, the specimens without fibers presented the typical double-pyramid collapse with cracks inclined at 45 degrees and an expulsion of the external concrete (Table 1).
Conversely, in the fiber-reinforced specimens with steel or polymer fibers, there was no expulsion of material. The fibers bridged the cracks, the material maintained its integrity and was able to transmit stresses through the bridged cracks. Therefore, the expected rupture of the specimens containing fibers presented clearly visible vertical cracks and no separation of the cube parts due to the bridging effect of the fibers (Table 1).

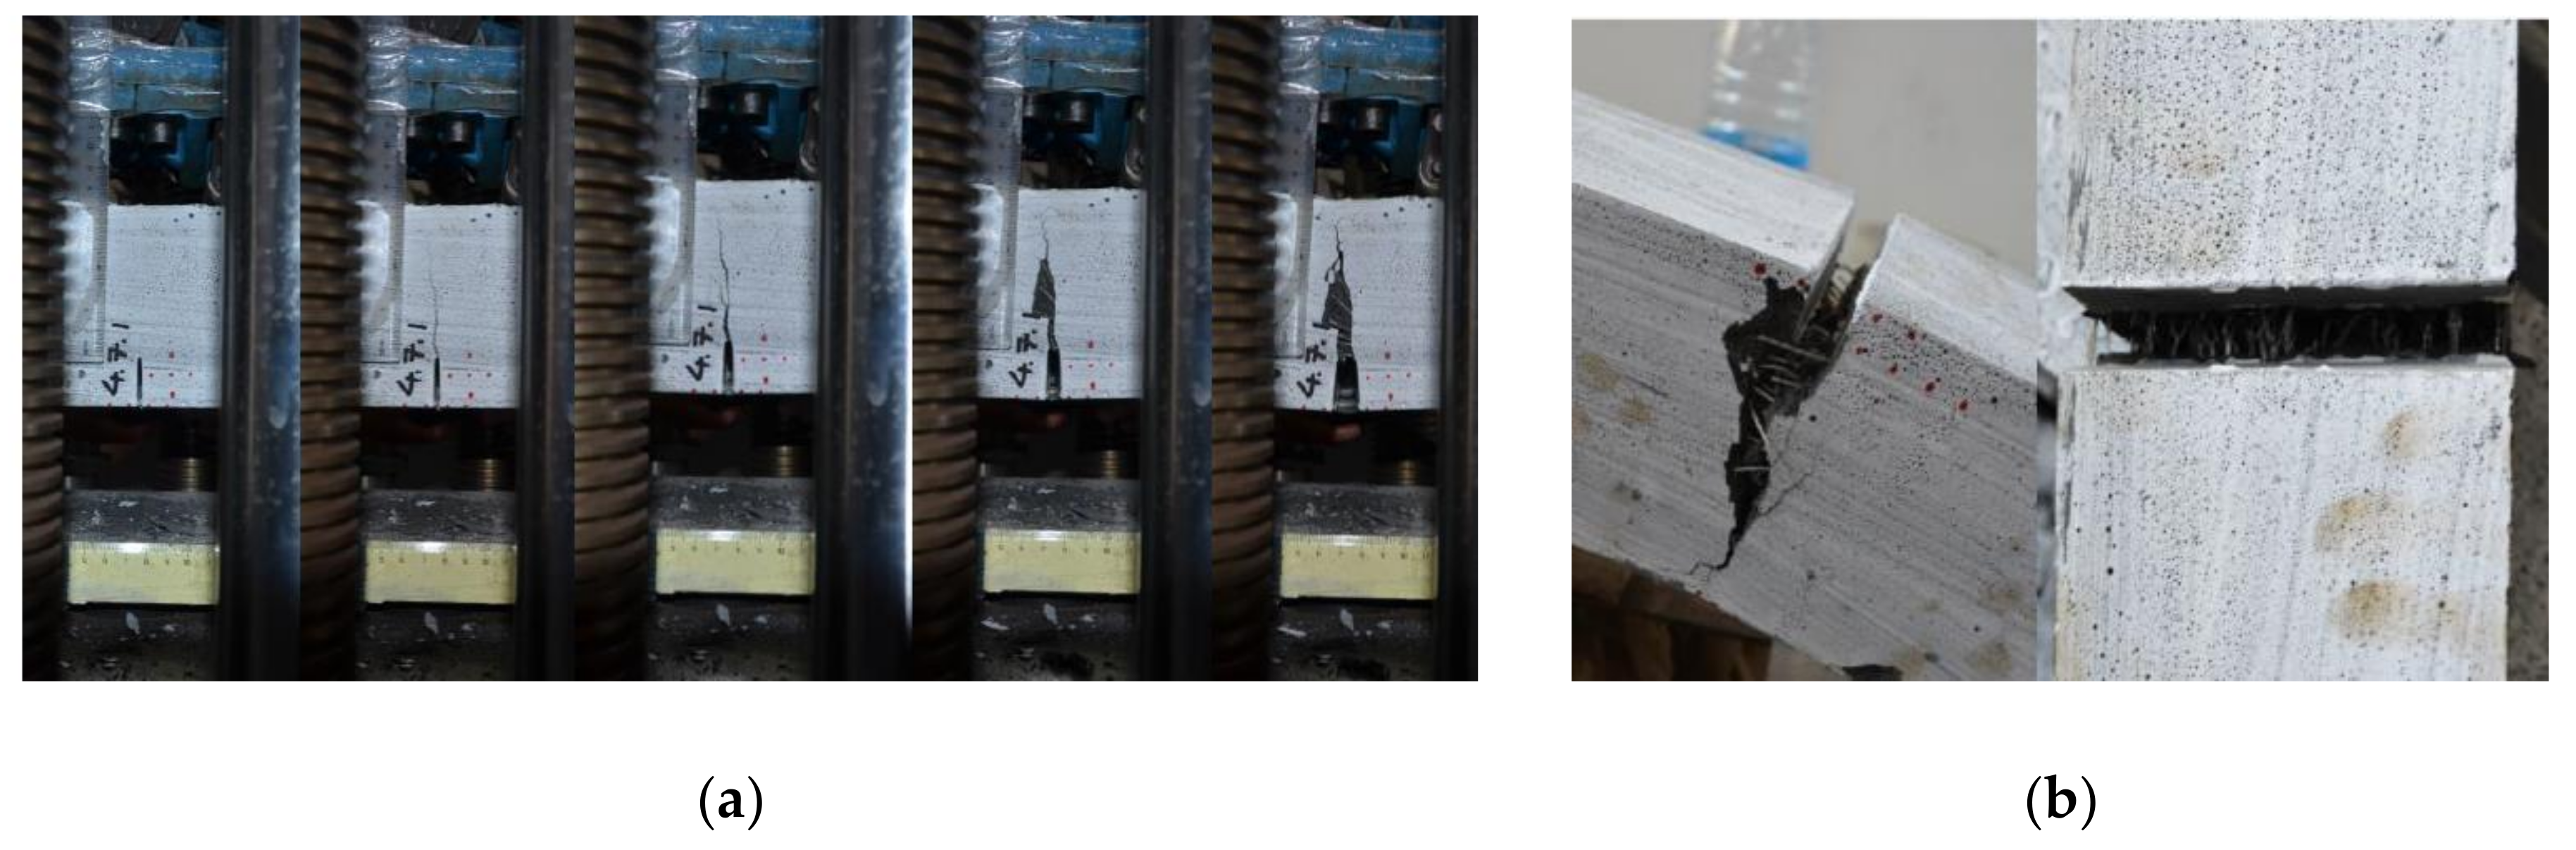
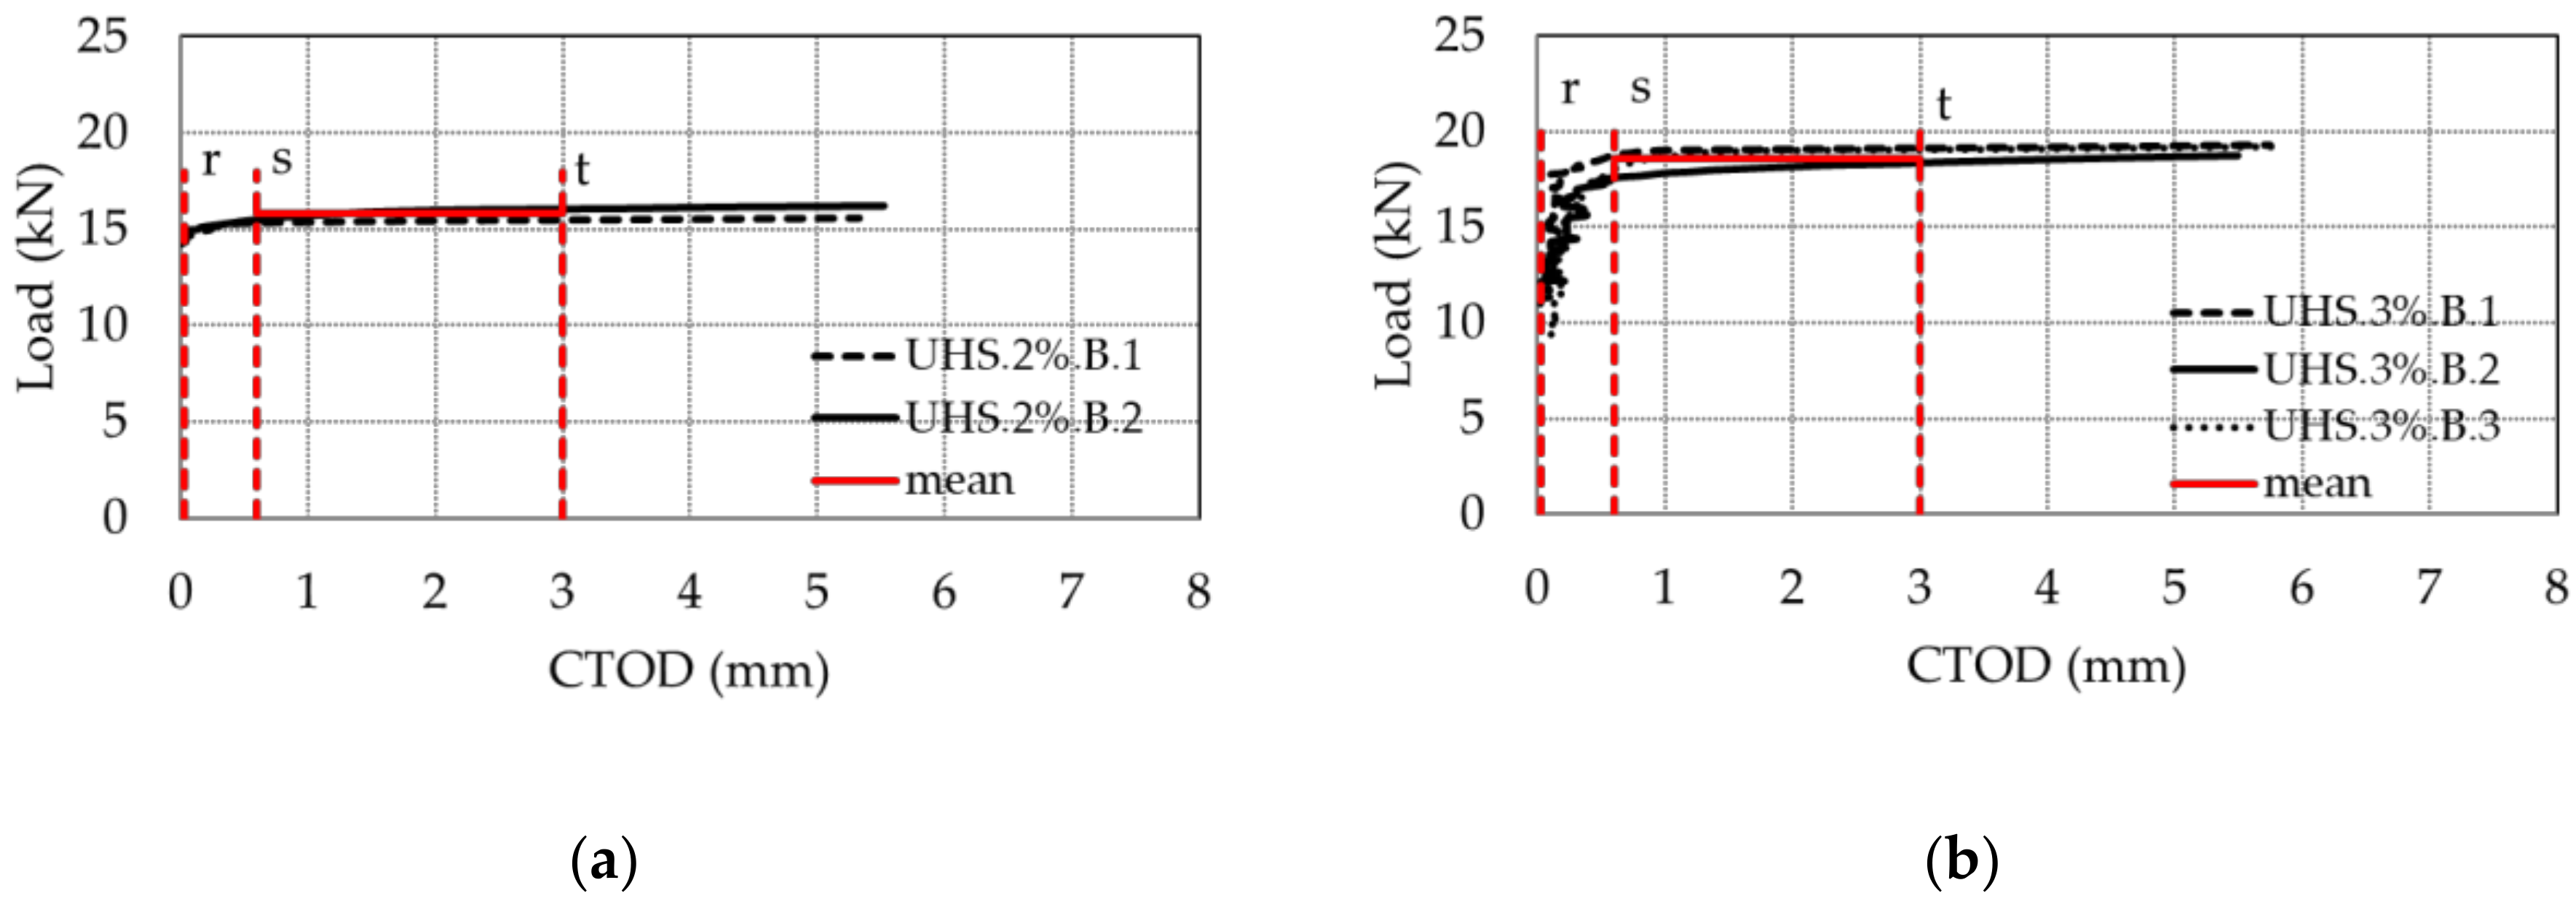
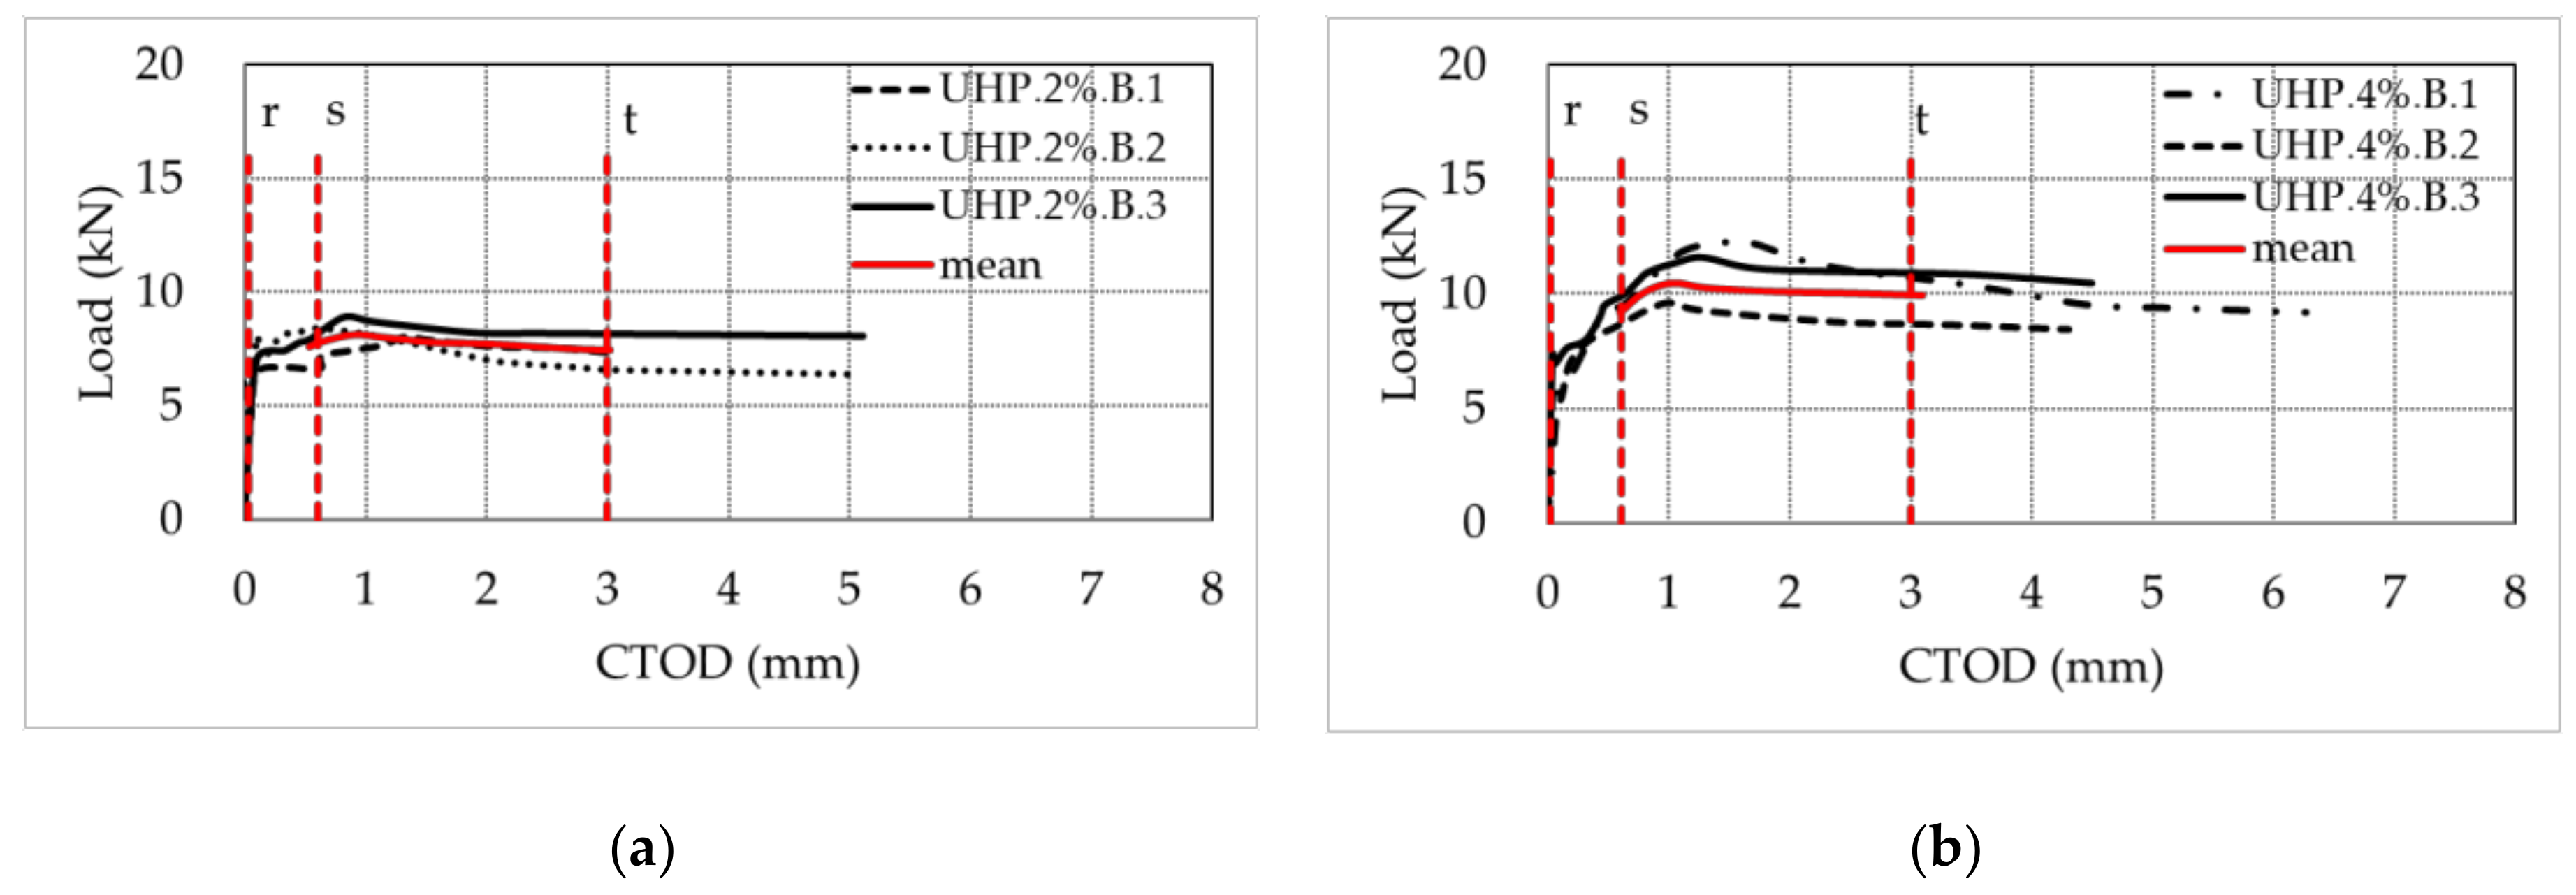
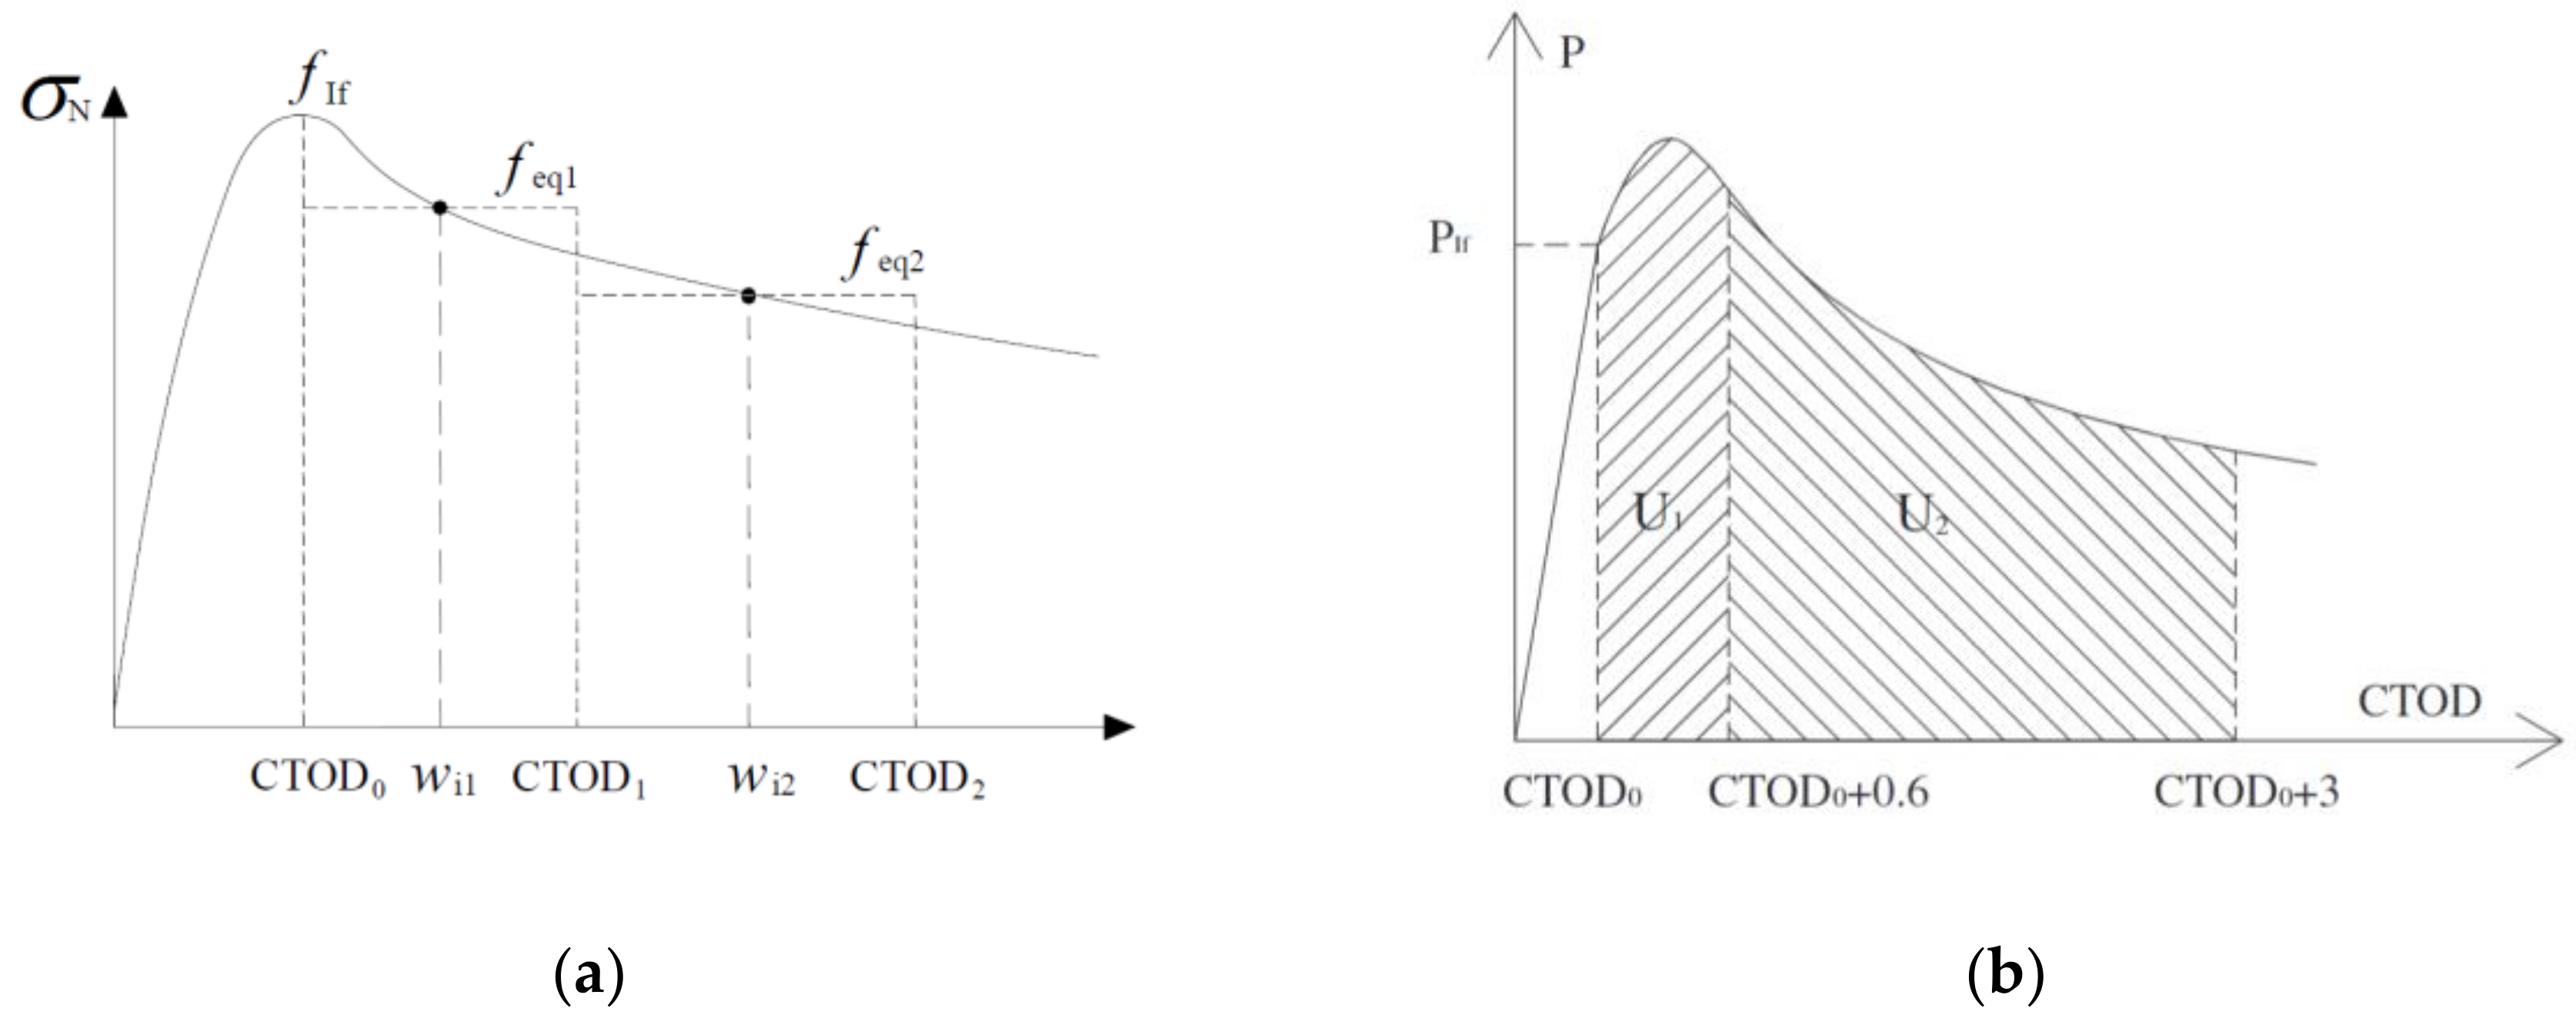
2.2.2. Bending Tests

Four-point bending tests on a notched concrete beam (Figure 2a) were performed to identify the load crack tip opening displacement (CTOD) curves. CTOD measures the relative displacement of two points on the opposite edges at the top of a notch created at the beam midspan, measured while the load is increased (Figure 2b). The bending tests were performed on beam specimens 100 × 100 × 400 mm3 after seven days of curing. The tested concrete beams included: (1) Three beams for each fiber content (1, 2, and 3%) for concrete with steel fibers (UHS); and (2) three beams for each fiber content (2 and 4%) for concrete with polymer fibers (UHP). The beam dimensions followed the standards indicated in UNI-11039 [52] or RILEM TC162-TDF (2003) [53] and had a ratio of length/lateral side (h/L, Figure 2b) equal to four.
The notch size was determined by Equation (1), as suggested by CI-S-002-2003 [54], which was equal to 30 mm.
a 0 = 0.3 h 0.01 h
The four-points bending tests were carried out using the force-controlled method to test the UHS beams with a constant load rate of 0.07 kN/s by the available test apparatus, and by the displacement-controlled method to test the UHP beams with a constant displacement rate of two mm/min using a new test apparatus. The opening velocity of the cracks and the load corresponding to different deformations were measured. The displacement-controlled method permitted us to observe the softening beam behavior, usually recorded for concrete with polymer fibers.
The CTOD was measured by means of two linear variable differential transformers (LVDT) on each lateral side of the UHS beam at the notch, and the elaboration of the film recorded by a camera placed in front of one side of the beam that took photos automatically every five seconds starting exactly when the load control machine was turned on (Figure 3a). As a reference for both the crack opening and the deflection, two rules, one vertical and one horizontal, were applied. On the other side of the beam, a graded camera allowed us to detect CTOD with an accuracy of 0.5 mm by shooting a video of the notch. The frames obtained from the camera were processed and the CTOD was measured every five seconds. To synchronize crack opening data with the displacement-load data, the first crack opening was used as the reference time control, considering that the camera was always switched on at the same time of the displacement control machine.
The typical crack for the notched beam with fibers bridging effect after the test is showed in Figure 3b.
The load-CTOD curves for the UHS beams with 2% and 3% fiber volume fractions are depicted in Figure 4 and the equivalent stress (feq2) and the ultimate residual tensile strength (fFtu), according Equations (5) and (6) in Section 2.3 (CNR-DT 204/2006 [55]), respectively, are shown in Table 2. The energy U2 in Equation (5) was calculated in the range of 0.6 mm to 3 mm below the mean experimental curve (red line in Figure 4) (mean of the applied loads on the tested beams) and below the minimum experimental curve (curve with lowest experimental loads).
There was a modest variation in the tensile strength of the UHS beams when the fiber content increased from 2% to 3%. The maximum flexural strength of each beam corresponded to a CTOD value of about 1.5 mm for the 2% fibers fraction and may exceed 2.5 mm for the 3% concrete. This value is a little greater than the value expected for a beam with a notch of 2.5 mm and with a 2% fibers fraction, which ranged around 0.5 to 1 mm in Finazzi et al. [56].
The load-CTOD curves for the UHP beams with 2% and 4% fiber volume fractions are provided in Figure 5 and the equivalent stress (feq2) and ultimate residual tensile strength (fFtu), according Equations (5) and (6) in Section 2.3 (CNR-DT 204/2006 [55]), respectively, are shown in Table 3. The energy U2 in Equation (5). was calculated in the range of 0.6 mm to 3 mm below the mean experimental curve (red line in Figure 5; mean of the applied loads on the tested beams) and below the minimum experimental curve (curve with minimum experimental loads).
A high fiber content (4%) reduced the crack opening and the propagation velocity; the fibers bridged the cracks, allowing the transmission of the tensile stresses through the openings. As can be seen from the softening curves of the UHP beams, the material reached high deformation levels up to 5 mm and 6 mm for 2% and 4% polymer fiber volume fractions, respectively.
The most important effect due to the fiber addition was not the increased flexural strength, but the reduction in the opening and propagation velocity of the cracks. The maximum flexural resistance of each beam produced a CTOD value that reached 1.5 mm for the 2% fiber percentage, and even exceeded 1.64 mm for the 4% fiber content. This value is a little greater than the values expected for a beam with a notch of 25 mm and a volumetric percentage of 2% fiber, which ranged around 0.5 to 1 mm in Finazzi et al. [56].
Therefore, the UHS beams with 2% steel fiber showed a mean tensile strength which is twice that of the UHP cubes with the same fiber volume fraction because the steel and polymer fibers mechanical characteristics, in term of strength, were different (Section 2.1).
After the mechanical characterization of these concretes, the materials selected to repair RC components were:
(1)
Concrete with 2% volume fraction of steel fibers because this fiber content is a typical value used in the literature [38,39,40,41,42] that considerably improves the concrete mechanical characteristics. A greater volume content produces a further increase in the compressive and tensile strength of the concrete but causes segregation during concrete mix and casting.
(2)
Concrete with 4% volume fraction of polymer fibers to guarantee concrete workability and cast of the new concrete part and greater possible values of ductility measured on the load-CTOD curve, tensile strength, and the equivalent strength. This volume fraction is equivalent to one proposed in the literature [38,39,40,41,42] and was studied for the first time in the present study.

2.3. Code Equation to Determine the Tensile Strength

It’s well known that fiber reinforced concrete (FRC) shows a good tensile strength. In the retrofitting technology proposed in this research, FRC is used to increase the shear resistance of the pier and so to improve its seismic capacity. In the literature, many models have been proposed to predict the shear resistance.
The one presented in CNR-DT 204/2006 guideline [55] and described in Section 3 can be a valid tool to calculate the shear strength contribution given by the fibers. This model is calibrated on the base of the ultimate residual tensile strength fFtu—using the equations presented in this sub-section.
This guideline calculates the tensile residual strength using a linear elastic or a rigid-plastic model for the softening material behavior. The linear elastic model identifies two values, fFts and fFtu, based on serviceability (SLE) and ultimate state (SLU) limit, respectively. They can be defined by the equivalent values of flexural resistances (feq1, feq2) through Equations (2) and (3)
f Fts = 0.45 · f eq 1
f Ftu = k · [ f Fts w u w i 2 · ( f Fts 0.5 ·   f eq 2 + 0.2 · f eq 1 ) ] 0
where feq1 and feq2 are the significant post-cracking equivalent resistances for the SLE and for the SLU, respectively, k is a coefficient equal to 0.7 if the section is entirely subjected to traction, otherwise it is equal to 1, wi2 is the mean value of the crack opening corresponding to feq2, and wu is the ultimate crack opening value.
For the four-points bending test on notched samples, according to UNI 11039 [52], the characteristic values of equivalent strengths, feq1 and feq2, are evaluated at crack opening intervals 0 ≤ w ≤ 0.6 mm and 0.6 ≤ w ≤ 3.0 mm. The equivalent strengths can be obtained by Equations (4) and (5) in UNI 11039 [52].
f eq 1 = L b ( h a ) 2 · U 1 0.6
f eq 2 = L b ( h a ) 2 · U 2 2.4
where b is the section beam width; L, a, and h are the beam geometries in Figure 2b; and U1 [10−3 J] and U2 [10−3 J] are the areas underlined beneath the load-CTOD curve in the CTOD range of 0.025–0.625 mm and 0.625–3.025 mm, respectively, as shown in Figure 6a,b. Such equivalent strengths are fqu1 and feq2, which correspond, respectively, to crack openings. wi1 is equal to 0.3 mm (used for the SLE, according to Eurocode 2 [57]) and wi2 is equal to 1.8 mm, corresponding to the average values in the selected ranges (employed for the SLU condition).
This study aims to define a simple tool useful to designers to predict the shear strength improvement given by the new concrete jacket adopted in the retrofitting technology. For that reason, the rigid-plastic model introduced in CNR DT 204/2006 [55] is selected as it allows defining the fFtu on the base of the feq2 using Equation (6). The predicted fFtu value resulted smaller than the one predicted by Equation (3), and therefore, the predicted shear strength of the concrete jacket with fiber is safer.
f Ftu = f eq 2 3
The characteristic tensile strength fctk is given by Equation (7), which is computed starting from the average tensile strength fctm obtained by Equation (8) for concrete with fck > 50 MPa, as indicated in Italian construction code NTC 2018 [58].
f ctk = 0.7 · f ctm
f ctm = 2.12 · ln [ 1 + f cm 10 ]

3. Design Equation for the HPFRC Concrete Jacketing
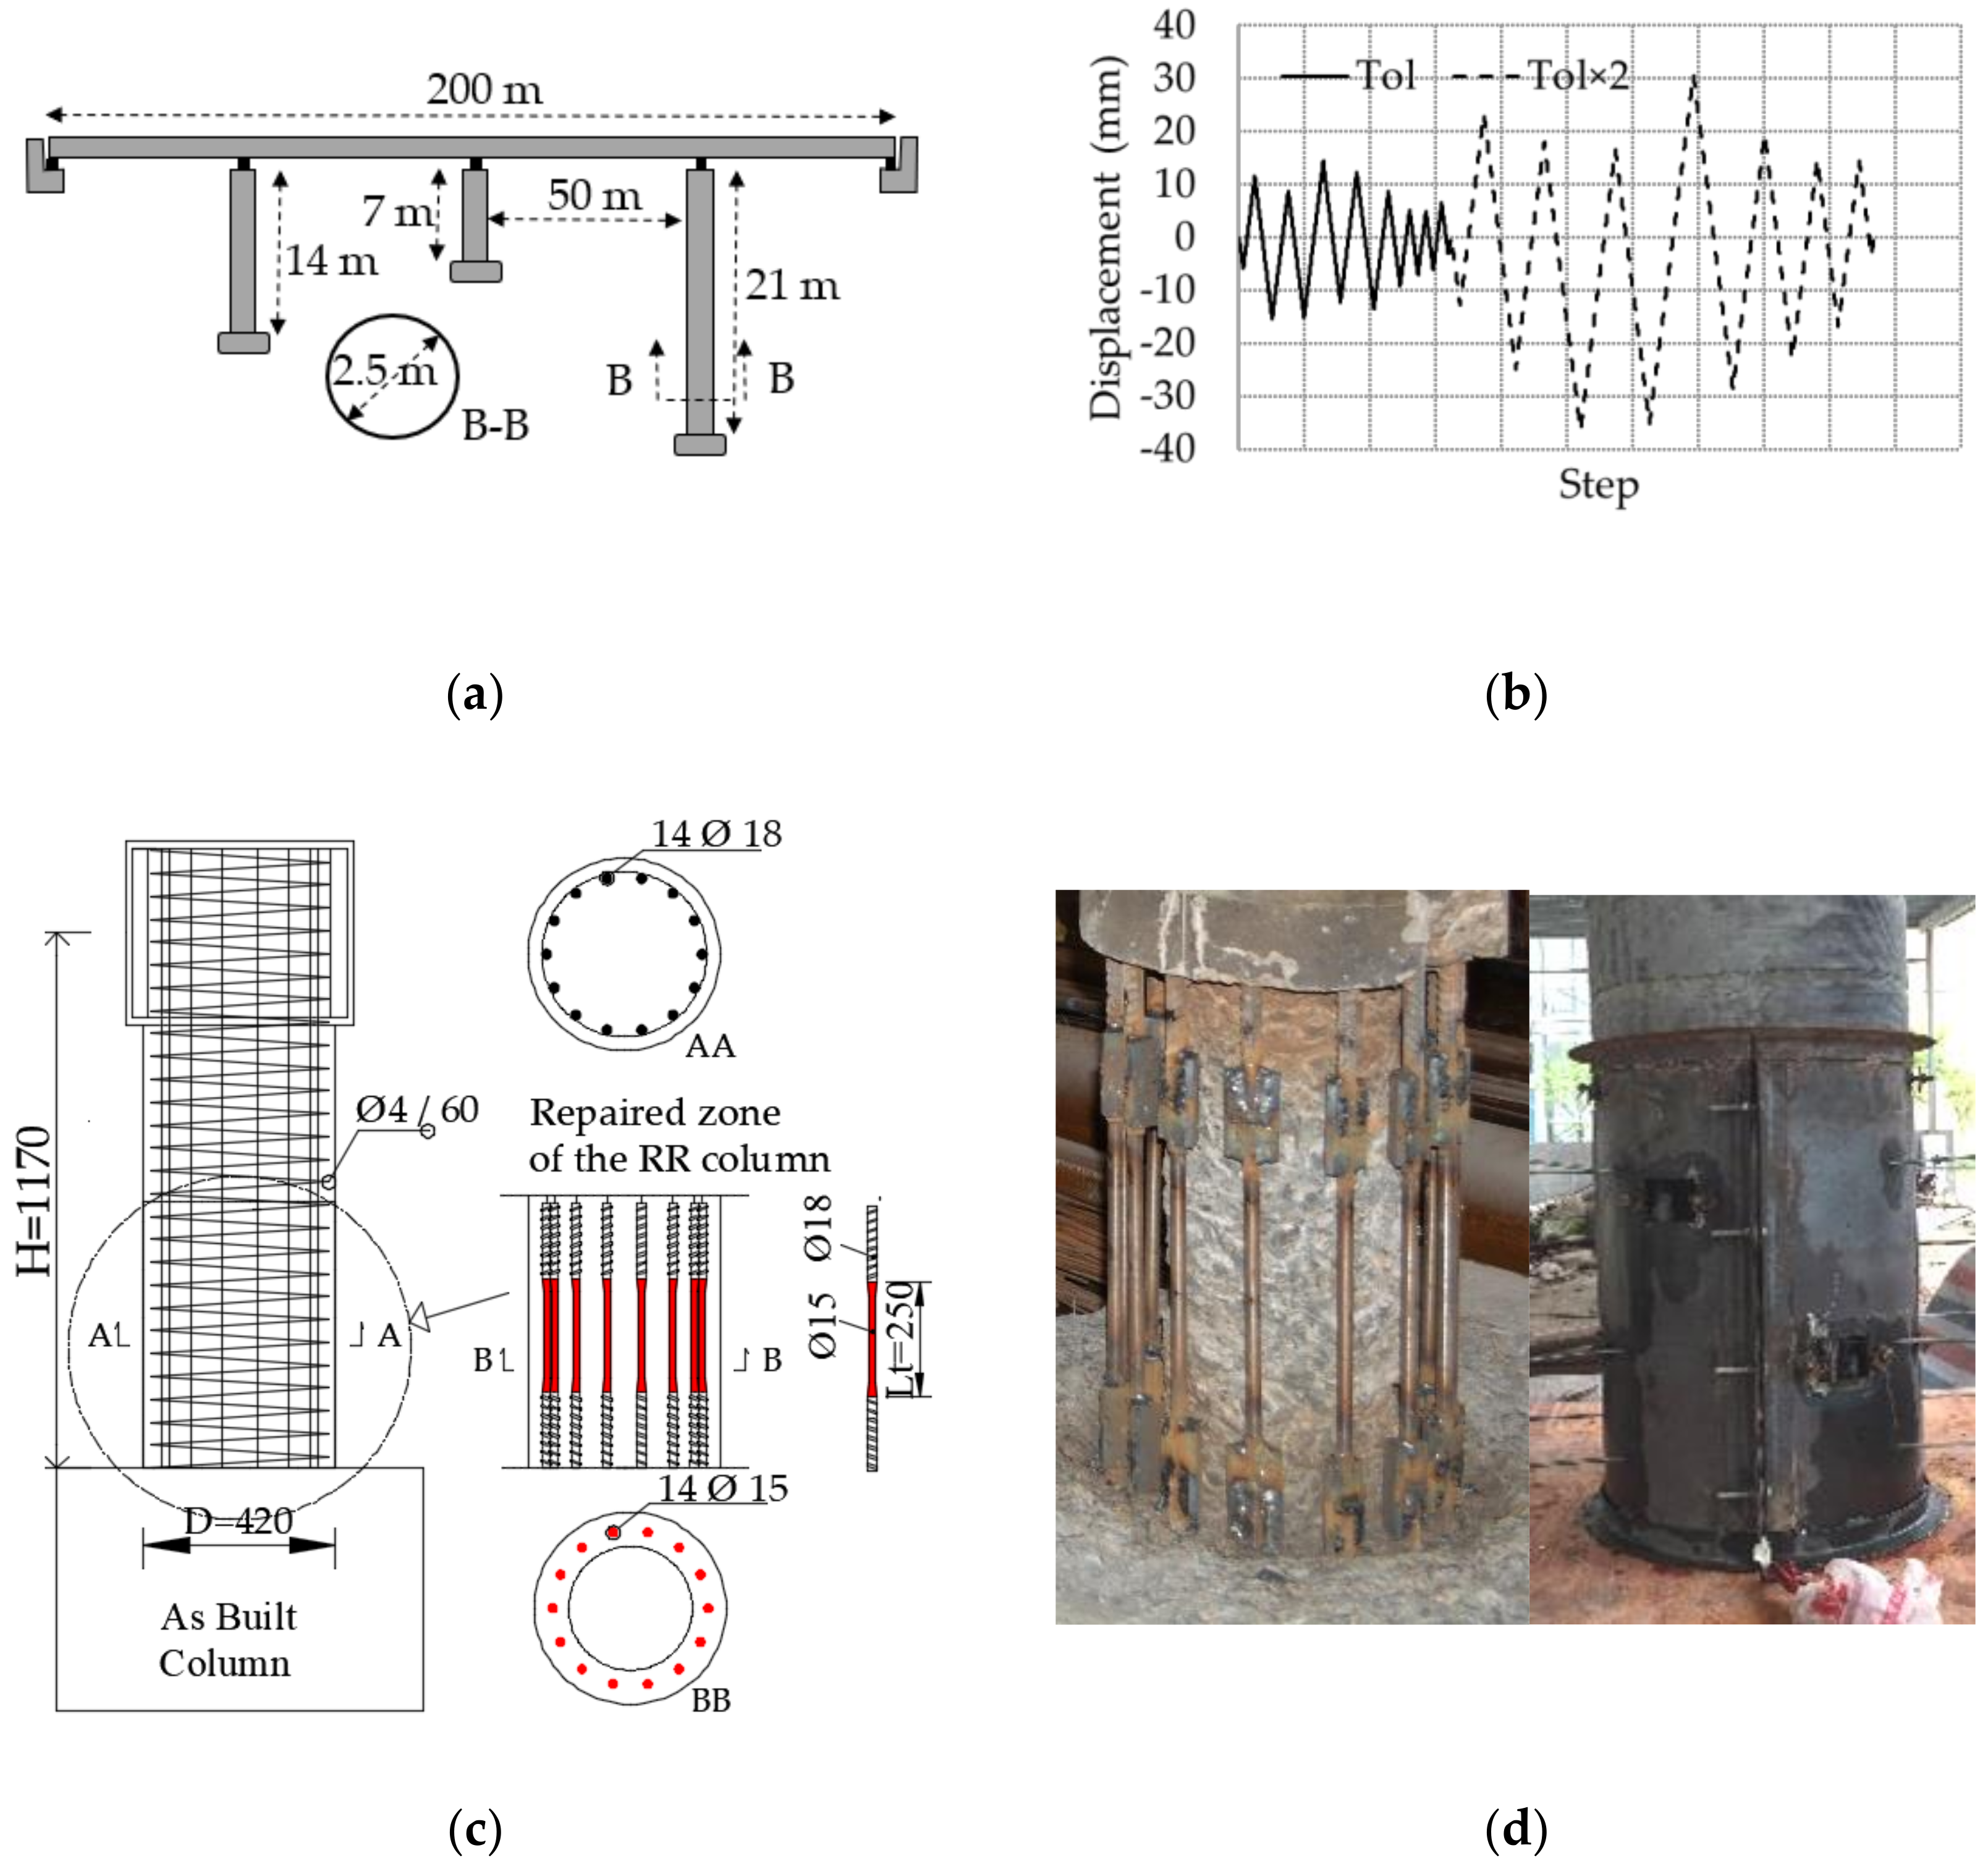
The repair strategy, which does not replace the removed transverse steel reinforcement; it restores the removed concrete parts with a thickness of about 100 mm in the entire plastic hinge region with an HPFRC jacket. This jacket does not modify the column dimension. The shear strength of the repaired RC components (VRd) can be calculated by Equation (9).
V Rd = V Rd , cj + V Rd , cc
where VRd,cj is the contribution of the concrete jacket and VRd,cc is the contribution of the original column core.
The jacket contribution may be calculated by Equation (10) in CNR-204/2006 [55]:
V Rd , cj = [ 0.18 γ C k · ( 100 · ρ l · ( 1 + 7.5 · f Ftuk f ctk ) · f ck ) 1 3 + 0.15 · σ cp ] · b w · d
where γc is the partial factor, ρl is the reinforcement ratio for the longitudinal reinforcement in tension, fck is the cylindrical characteristic compression strength of the concrete, k = 1 + √(200/d) is the factor that considers the size effect, σcp is the average stress acting on the concrete cross section, fctk is the characteristic tensile strength of the concrete matrix, fFtuk is the characteristic value of the ultimate residual tensile strength, bw is the beam width, and d is the distance from the extreme compression fiber to the centroid of tension steel reinforcement.
The repaired columns jacket had a hallow section with a thickness (tcj) equal to 100 mm, which is the thickness of the external removed concrete parts. The product bw∙d in Equation (10) should be substituted by the area Ae calculated by Equation (11), proposed by Priestley et al. [59] for hollow sections.
A e = ( 1 + ( D i D ) 2 ) · ( 1 D i D ) ( 1 + ( D i D ) 3 ) A n
where D is the external diameter of the column, Di is the inside diameter of the section and An is the net area of the concrete section.
Alternatively, it can be assumed that bw = 2∙tcj and d = 0.8∙D according the Canadian standards (CSA) [60] and the American standards (ACI design codes) [61,62].
The shear strength contribution of the original specimen concrete core (VRd,cc) can be evaluated by Equation (12), presented by Sezen et al. [63]:
V Rd , cc = 0.167 · ( 1 + N ( 14 · A g ) ) · f c · b w · d
where bw∙d is assumed to be equal to 80% of the area of the column core, N is the axial load on column, Ag is the gross section of column, and r and rs are the radii of the section and of the circular layer where the longitudinal steel rebar is located, respectively.

4. Case Study

A RC bridge with an irregular configuration, typical of many highway bridges around the world (Figure 7a), was designed according to Chinese codes [64,65,66] using the spectrum in Lavorato et al. [24], and a horizontal elastic spectrum reduction factor equal to three for ductile design and deck vertical loads of 200 kN/m.
The design materials included Chinese strength grade C30 concrete (cylindrical characteristic compressive strength fck = 20.1 MPa), Chinese steel mark HRB335E (characteristics yield strength fy = 335 MPa) for the longitudinal rebar, and Chinese steel mark Q235A for the transversal steel reinforcement.
The transversal steel spacing was not designed using the capacity design criteria because many existing bridges have insufficient shear reinforcement, so seismic retrofitting is often needed. For example, 50% of bridges constructed between 1989 and 2008, and 40% before 1989 in China before the introduction of the actual seismic code JTG/T-B02/01/2008 [66] present this deficiency.
The present study focuses on the seven-meter pier of the bridge, the most stressed and damaged one after a strong seismic event. Two RC circular columns, P16A and P16B—the as-built columns (ASB)—were designed to represent the seven-meter pier of the bridge, and were selected as the case study. Proper scale factors [36] were applied to the pier concrete and steel reinforcement geometries.
These scale factors ensure global similarity (flexural and shear strength) between the pier and scaled column using the same design materials without scaling the concrete aggregates and steel rebar geometries. This permitted us to inexpensively test scaled RC columns to obtain results that could be extended to the corresponding seven-meter pier.
The geometries and the steel reinforcement details of the scaled RC columns are provided in Figure 7c.
Pieces of HRB335E steel rebar, used to realize the longitudinal reinforcement of the RC columns, were tested at the laboratory of Fuzhou University. The stress strain curves for two rebar specimens (NSR1 and NSR2 in Figure 8) showed a mean yield stress fsy of 450 MPa and a mean maximum stress fsu of 600 MPa.
The C30 concrete, used to build the columns, was tested by compression tests on a 100 × 100 × 100 mm3 cube after 28 days of standards curing in the Fuzhou University laboratory. The resulting mean compressive strength Rcm was 31 MPa.
This concrete is a self-compacting concrete (SCC), which simplifies the concrete casting and mix design, consisting of two types of coarse aggregates, sand, cement, mineral admixture, polycarboxylic acid superplasticizer, and a water/cement ratio of 0.56.
The as-built (ASB) columns, P16A and P16B, were severely damaged by the cyclic tests described in Section 5, and were then repaired using the proposed repair strategy. The axial load at the top of the column was not applied during the repair operations to simulate the unloading of the RC component during repair by props to ensure safe repair operations.
The 100 mm thick external concrete part of the column was removed along the column, up to a height from the base of the column about 500 mm; this height is higher than the theoretical plastic hinge length (Figure 7d). The removal was performed around the whole column surface to expose the transverse steel and the longitudinal rebar. In the plastic hinge region, the transverse steel and each longitudinal rebar were cut. This operation was performed on damaged or intact rebar to be sure that the plastic deformations were distributed in the plastic hinge along the new rebar segments only. The ends of the existing rebar, caused by the rebar cutting at the foundation and above the plastic hinge zone, and should be undamaged and straight to perform the new rebar connection. Next, the roughness of the concrete surface on the column core was improved by mechanical shaping to ensure proper interlock between new and existing concrete parts. Finally, the substitution of the removed the rebar (Section 4.1) and the concrete parts (Section 4.2) were performed.
The repaired columns (RR columns), at a scale of 1:6 (R16), were named using the labels in Table 4. The new longitudinal rebar had the same geometries, so there is no information for this rebar in the label. The type of HPFRC, with either steel or polymer fibers used to restore the concrete parts, is indicated with UHS or UHP, respectively.

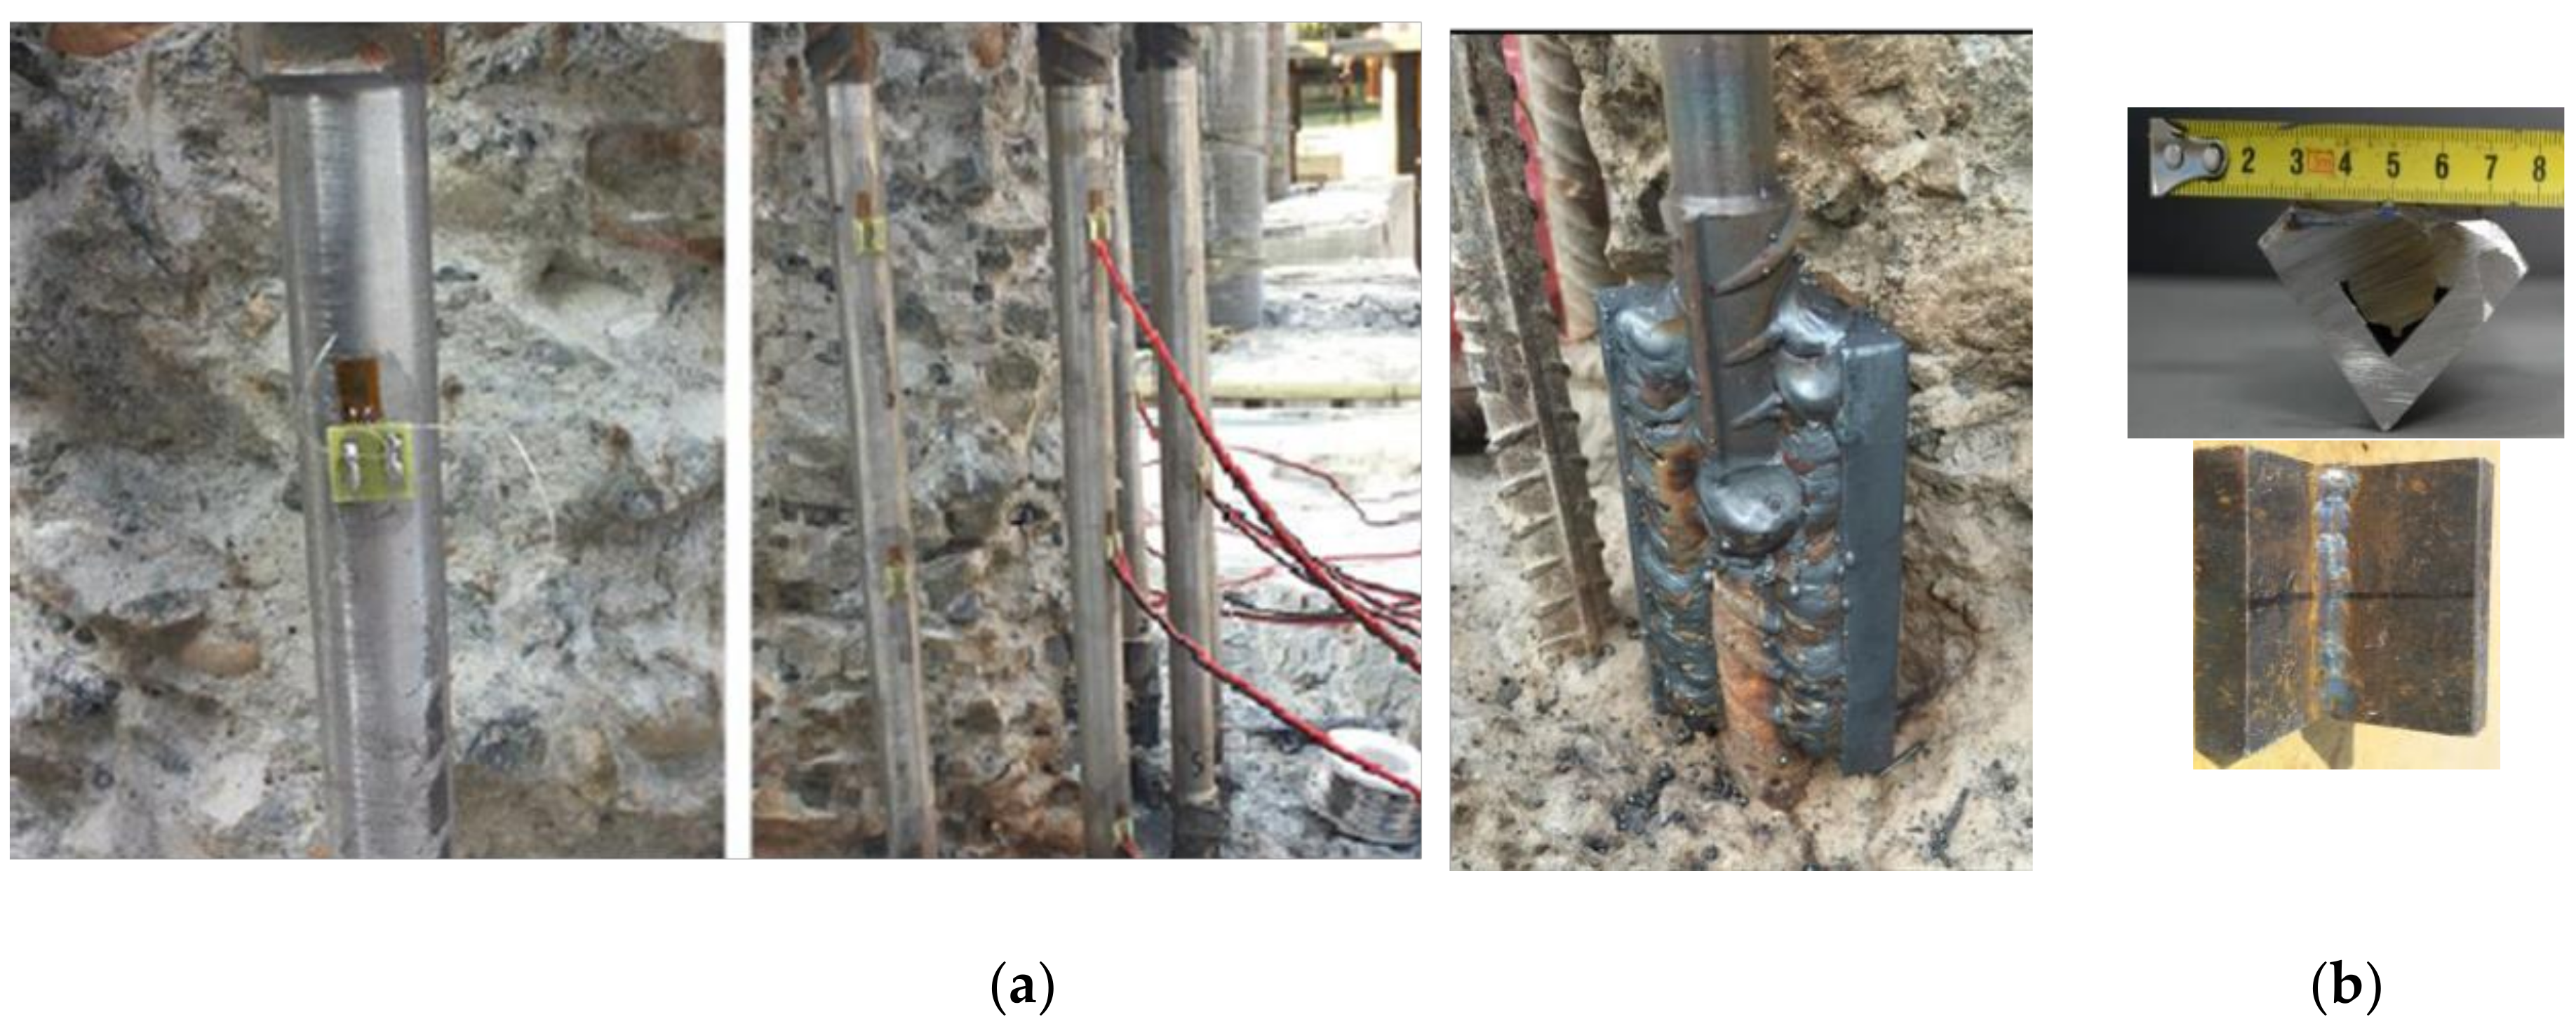
4.1. Longitudinal Rebar Substitution

The new rebar segments obtained from the rebar used to build the ASB column reinforcements had a diameter of 18 mm, yield stress of 450 MPa, and a maximum stress of 600 MPa. Segments of rebar were cut to a length of about 500 mm to substitute the removed pieces. This length was greater than the theoretical plastic hinge length calculated by the formulation in Paulay et al. [67] to permit the connection among the new and existing rebar.
The plastic deformation can be distributed in the plastic hinge only if the yield force in the anchorages (the most stressed part of the original rebar) is higher than the maximum force in the new rebar segment at rupture (in plastic range). This can be obtained by turning the central part of the new segments along a length equal to the plastic hinge length to reduce the rebar diameter from 18 mm to 15 mm. Partial factors should be selected by the designer to guarantee the proper definition of this reduction, considering the knowledge of the materials properties and the possible material over-strength.
Four turned rebar pieces (TSR 1, TSR 2, TSR 3, and TSR 4; Figure 8) were tested to check the tensile behavior after turning. These rebars showed practically the same mechanical characteristics measured for the non-turned rebar (NSR 1, NSR 2; Figure 8). The geometries of the turned rebar are summarized in Table 4.
The new rebar segments were connected to the existing rebar by a butt welding chord and two symmetric lateral welding chords along a steel coupler (Figure 9a,b). The transversal area of the connection (Figure 9b) was designed to ensure that the yield force in the connection was greater than the maximum force in the new rebar segment at rupture. Partial factors should be selected by the engineer/architect to guarantee the proper definition of the coupler and welding chord sections, considering the knowledge of the materials properties and possible material over-strength.
The geometries of the steel coupler and of the welding chords are shown in Figure 9b. This steel coupler was realized by welding two steel plates. The connection required three steps: (1) The new rebar segments were located along the same axis of the existing rebar, (2) the coupler was placed behind the rebar, and (3) the welding chords were built among rebar and coupler and between the rebar’s end (Figure 9a). This operation was carried out on the front side of the connection.

4.2. Concrete Restoration by HPFRC Jacket

HPFRC was used to restore the removed concrete parts without modifying the column dimensions (Figure 7d). The jacket of the R16-UHS column was built with HPFRC with 2% steel fiber volume fraction (UHS), whereas the jacket of the R16-UHP column was built with HPFRC with a 4% polymer fiber volume fraction (UHP). The choice of these two volume contents is explained in Section 2.2.
The jacket building was performed in three steps: (1) A steel formwork was placed at the base of the column and sealed properly to avoid concrete pouring out of the formwork; (2) new concrete was poured through one hole placed in the upper part of the scaffold using a steel groove; and (3) after one day, formwork was removed and the new concrete had no segregation defects (Figure 7d).
The behavior of new and old concrete parts under fire conditions is being investigated in an ongoing research study that is not presented here. This study is attempting to determine if the new UHPC would spall more under fire conditions than normal strength concrete (NSC). This will permit us to define a proper mix design for new concrete that is able to minimize undesirable behaviors under fire conditions

5. Experimental Validation of the Repair Strategy
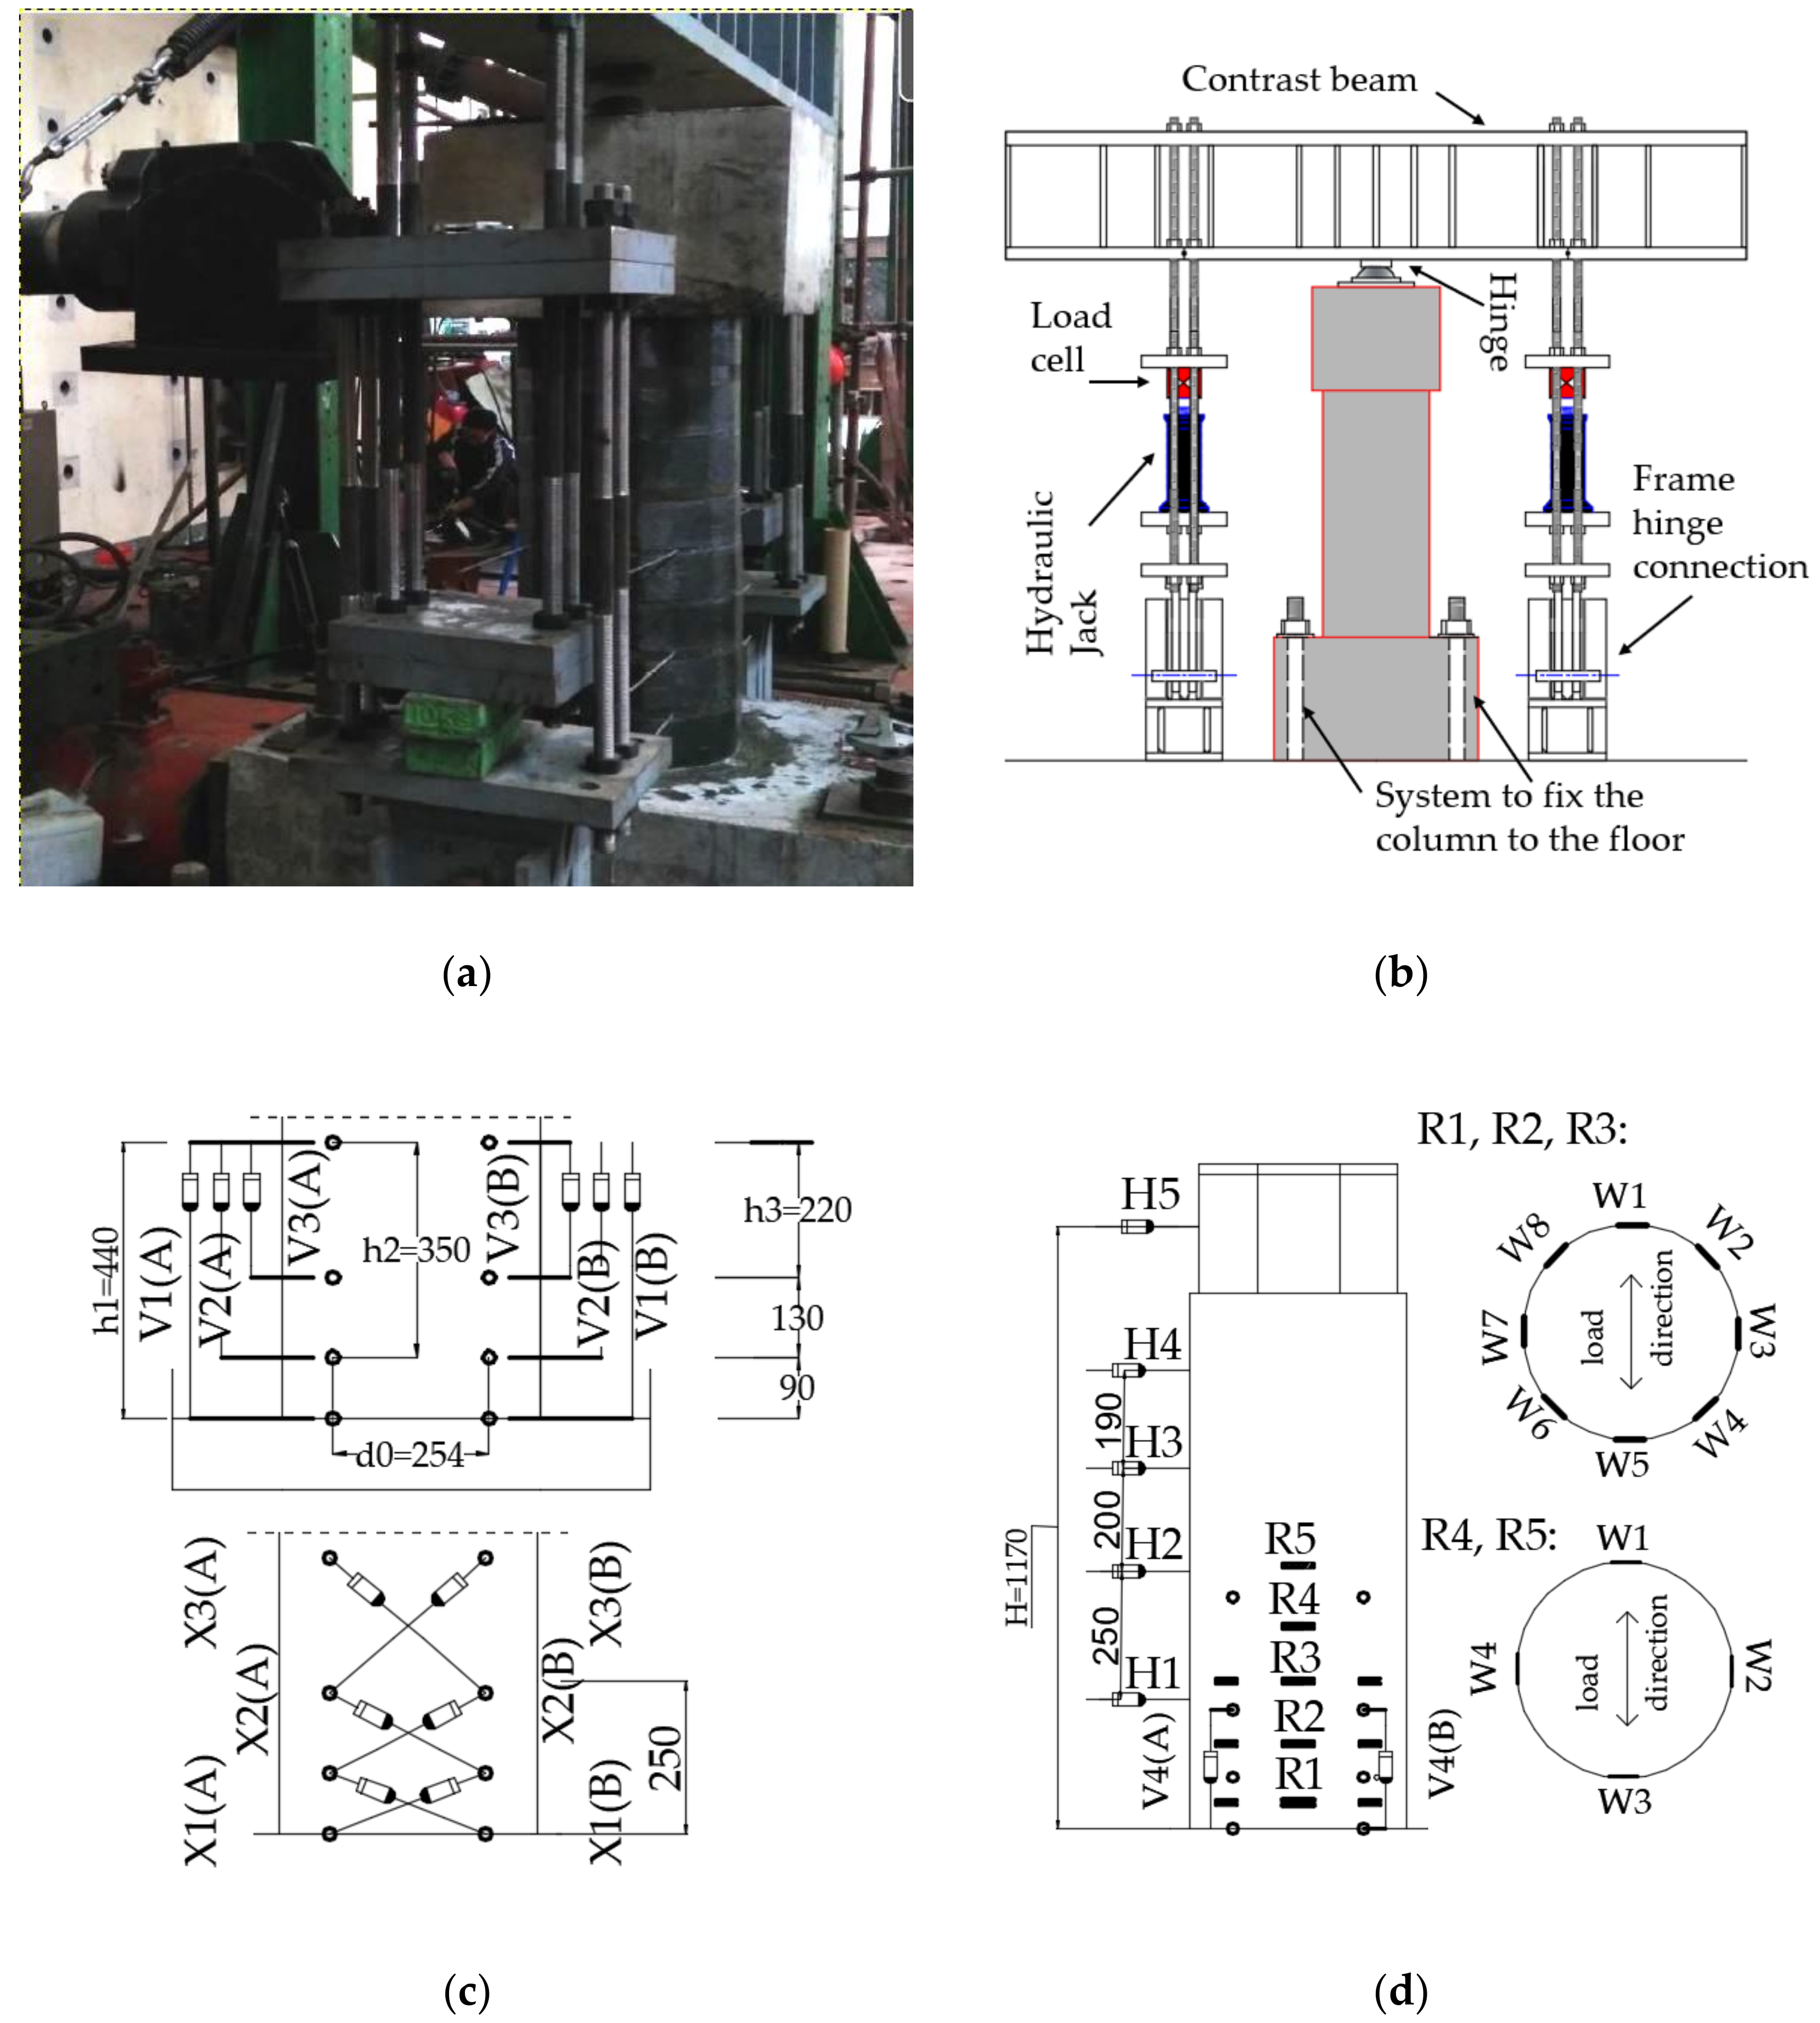
5.1. Test Setup

The test apparatus was designed to test column specimens representative of a bridge pier. It was composed of (Figure 10a,b): A steel frame pinned to the floor to apply the constant vertical load P by two 600 kN hydraulic jacks, a 500 kN MTS Systems Corporation hydraulic actuator to impose the horizontal displacement progression on the top of the column, a steel structure to fix the column foundation to the laboratory floor, and an acquisition system to record forces, displacements, and strains during the test.
The data acquired were (Figure 10c,d): The vertical elongation (V, potentiometers) near the column base to obtain the curvature of the base sections, the horizontal elongation (H, lvdts) near the column base to obtain the deformed shape of the columns, the diagonal elongation (X, potentiometers) near the column base to measure the shear cracks opening, and the strains on the concrete jacket to evaluate the jacket strains.
Eight strain gauges (W) were placed along three circumferences (R1, R2, and R3 in Figure 10d) at the base of the columns and four strain gauges were placed on two circumferences (R4 and R5 in Figure 10d).

5.2. Test Protocol

Cyclic tests were carried out on the ASB and RR columns at the sustainable and innovative bridge engineering research center (SIBERC) Laboratory of Fuzhou University (China) using the same test protocol. First, the vertical constant load P = 266 kN was applied on the column top by the steel frame in Figure 10a,b. This load is the vertical load due to the bridge deck weight on a scale of 1:36, using the adopted scale factors in Lavorato et al. [36]. Then, the horizontal displacement progression outlined in Figure 7b was applied to the column top by the hydraulic actuator shown in Figure 10a. The cyclic displacement progression used was the one recorded on the column top in Lavorato et al. [36] during a pseudo dynamic test performed on a bridge with the same configuration as the one studied here (Figure 7a). The tested column was the one repaired following the previous proposed strategy in Lavorato et al. [36].
The pseudo dynamic test permitted us to investigate the behavior of the full-scale RC bridge that was numerically simulated, except for a pier that was tested on a scale of 1:6 at the proof testing and research in structures and materials laboratory (PRISMA) at the Department of Architecture of the University of Roma Tre. For that reason, the selected displacement history was representative of the one recorded on the pier when the bridge was subjected to an earthquake. This test protocol permitted us to study the response of the columns when asymmetric displacements in the two load directions were applied, as in case of an earthquake. Usually, the cyclic test on columns is performed by imposing symmetric displacements in the two load directions with increasing amplitude, which is not representative of an earthquake excitation.
The first part (Tol) and the second part (Tol × 2) of the displacement history (Figure 7b) were recorded on the column when the Tolmezzo accelerogram from the earthquake in Italy in 1976, and the Tolmezzo accelerogram scaled to double were applied to the bridge in sequence. The Tolmezzo earthquake was selected because it produces a peak response on the acceleration spectrum for the bridge with a period of 0.7 s. For that reason, the Tol part is representative of a strong earthquake for the studied bridge, whereas the Tol × 2 part is representative of a very strong aftershock. The Tol and Tol × 2 parts have five cycles characterized by great displacement values, which permit the study of low cycle fatigue response of the column.
Preliminary elastic cyclic tests on the columns permitted us to evaluate the column yield displacement that was equal to ~5 mm for each column. The selected displacement history permitted us to investigate the column response at large displacement ductility values (~6–7).

6. Test Results

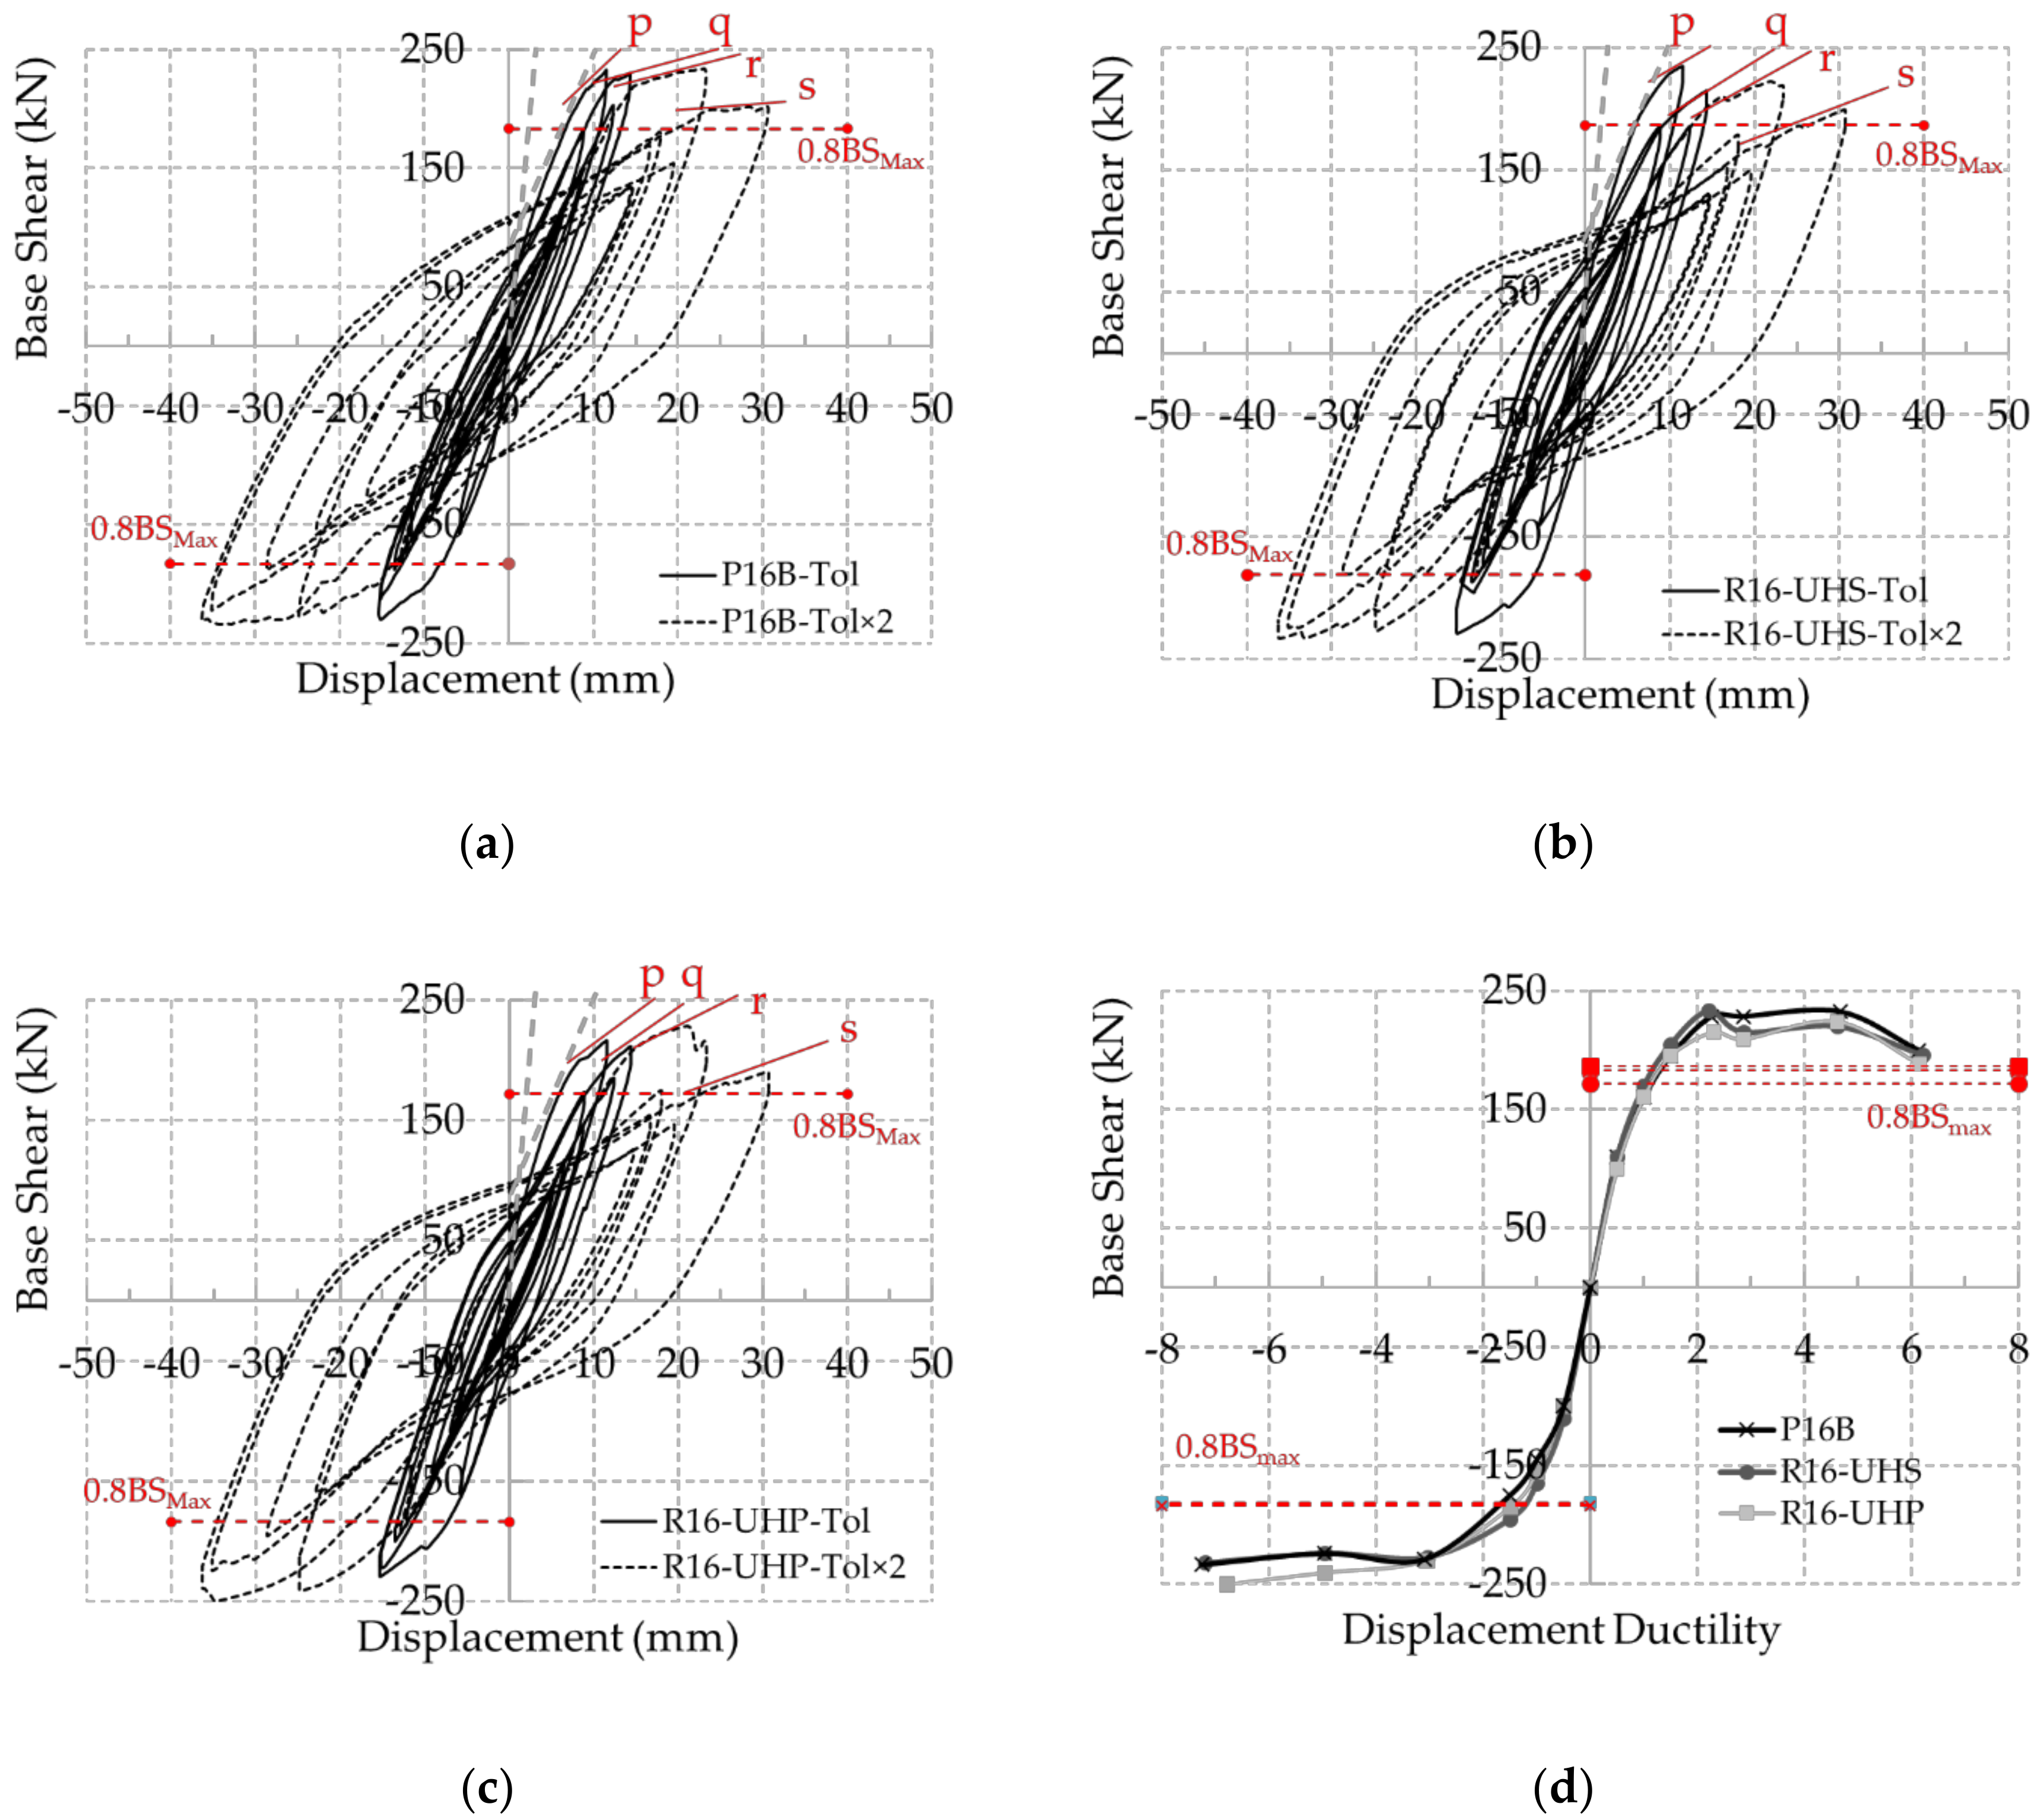
6.1. Columns Hysteretic Response

The hysteretic responses of the column P16B (ASB column) and columns R16-UHS and R16-UHP (the repaired RR columns) in terms of horizontal displacement of the column top and the corresponding base shear (BS) are given in Figure 11a–c, respectively. The maximum BS values (BSmax) for the RR columns were similar to the one recorded on the ASB column; therefore, the repair strategy was able to restore the strength of the columns. There was no abrupt falling of the BS values during the entire displacement progression. Therefore, the connection and the new rebar segments could sustain low cycle fatigue demand and high displacement ductility requests (up to ~6–7).
The area of the hysteretic cycles of the RR columns was wider than that of the ASB; there was no pinching of the cycles due to shear rupture. The steel or the polymer fibers added to the concrete jacket, improved the column seismic performance in terms of dissipated energy (Section 6.3) and guaranteed the column flexural failure mode (Section 6.7). The repaired column with polymer fibers (4% of volume fraction) showed very similar behavior to the one measured on the repaired column with steel fibers (2% volume fraction).
The ultimate displacement (Δu) may be assumed to be equal to the displacement that produced a decreasing BS value equal to 0.8 BSmax after the peak value BSmax. The results recorded in the positive load direction are discussed in detail because worse degradation of the column behavior was evident in this direction. The reduction of the BS values to 0.8 BSmax was not observed at the maximum applied displacement in the positive direction for each column. Therefore, the ASB and the RR columns showed at least the same displacement ductility as ca. 6. In fact, the yield displacement (Δy) was equal to ca. 5 mm for each column because it depended on Equation (13) in Paulay et al. [67]: The column section diameter (D), the column height (H), and the yield stress of the steel rebar (εy) were the same for each column.
Δ y = 1 3 · ϕ y · H 2 ;   ϕ y = 2.35 ε y / D
The RR columns showed hardening behavior along line ‘s’ in Figure 11b,c greater than the one of the ASB column along the line ‘s’ in Figure 11a. This means that the displacement ductility (μΔ = Δuy) can be greater than the one of the ASB column. The repair strategy was able to restore and probably improve the displacement ductility of the RR columns.
The RR columns had new rebar segments with the same steel mechanical properties, but with a reduced diameter. Therefore, the maximum force in the rebar under tension was smaller than in the original rebar under tension. As a consequence, the flexural strength and the maximum BS values of the RR columns should be smaller than that of the ASB column. The restored BS values can be explained by the contribution of the new concrete part (HPFRC jacket). In fact, the HPFRC concrete had high compressive strength (Section 2). Therefore, the compressed part of the section of the RR columns were shorter compared with the ASB columns. The inner lever arm length increased for the RR columns and balanced the rebar diameter reduction. As such, the flexural strength and the corresponding maximum BSs was similar to the ASB. This was reproduced numerically in the fiber analyses in Section 7.

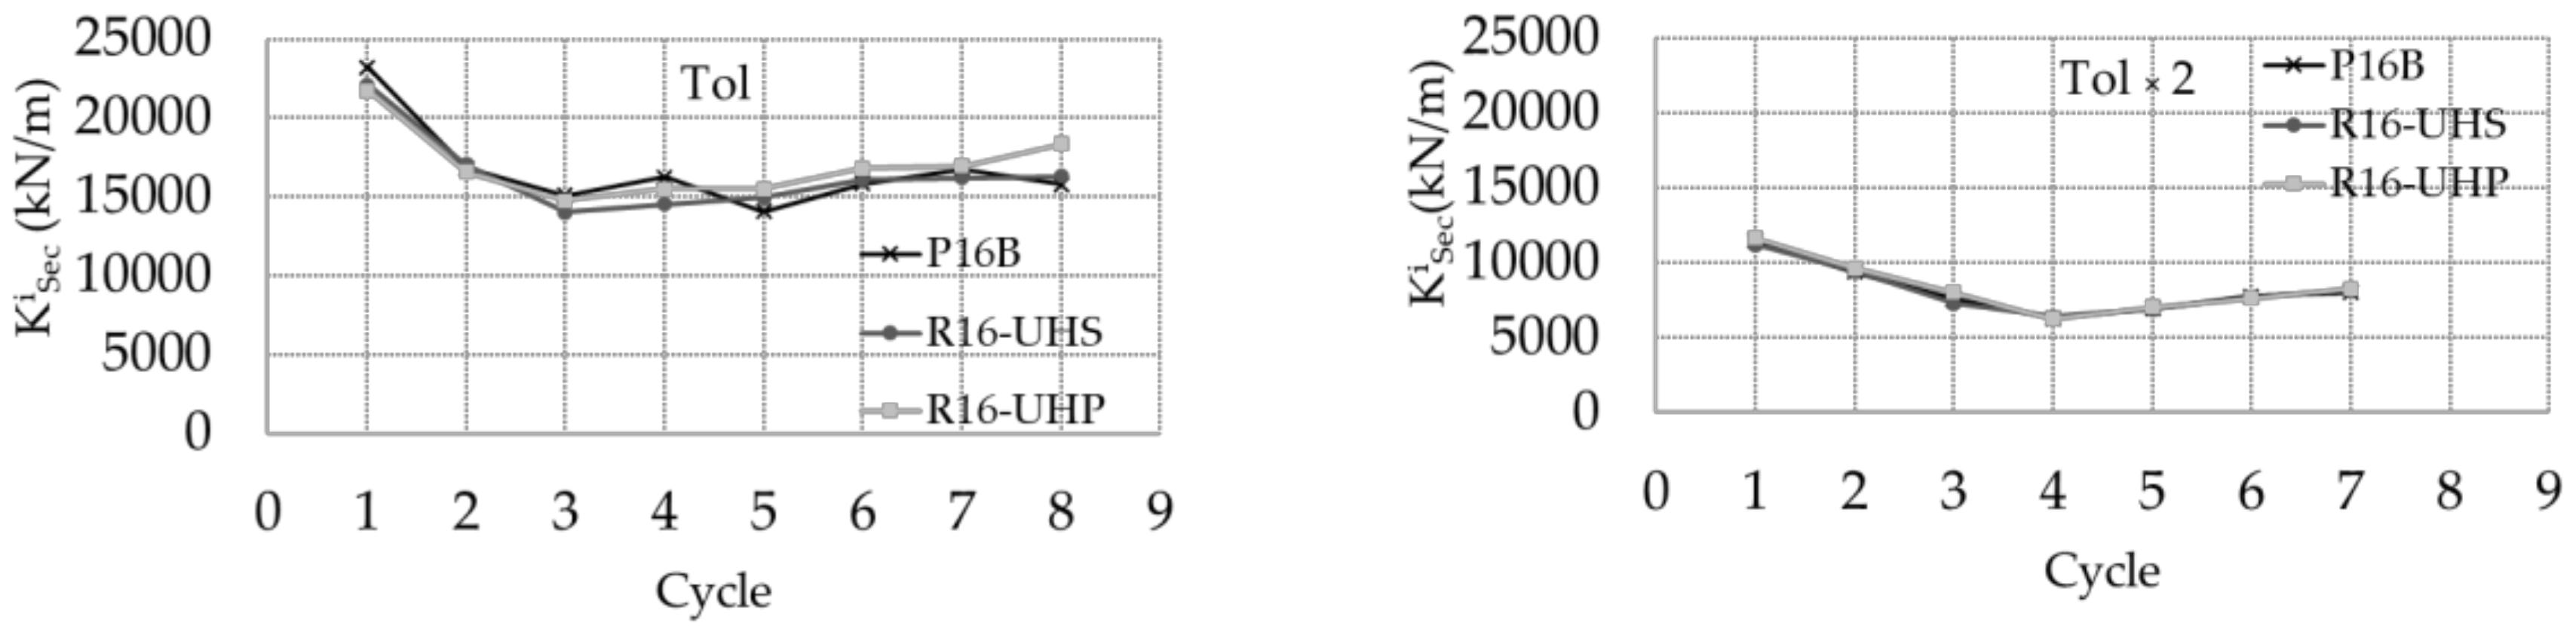
6.2. Stiffness Evolution

The RR columns presented an initial tangent stiffness (Ktang) for the first displacement in a negative direction, similar to the ones recorded on the ASB column, even if the RR columns had a cracked core (Table 5). This means that the RR columns presented the same initial elastic behavior as the ASB columns, and therefore the same elastic dynamic response (period) because the mass at the top of the column was the mass of the deck, which did not change after repair.
The envelop curves for the tested columns were obtained starting from the cyclic hysteric responses of each column in Figure 11a–c and are shown in Figure 11d. The initial tangent stiffness, and the stiffness after concrete cracking in the positive and negative directions, was practically the same for each column (the ASB and the RR columns), even if the core of the damaged columns was not repaired by resin injection [36].
The restoring of the stiffness can be explained considering the column rigid base rotation due to strain penetration along the longitudinal rebar anchorages. This rotation is important for the elastic range of the ASB column, but it can be considerably reduced by the new turned rebar segments. In fact, the turned part with the reduced diameter moved the plastic deformation along this segment part; therefore, the anchorages strain penetration is reduced. This was confirmed by the damage survey on the RR columns shown in Section 6.7, where there is no main base crack typical of strain penetration rotation.
The stiffness degradation due to the damage under cyclic loading was evaluated for each column considering the peak-to-peak secant stiffness of each cycle of the imposed displacement history (Figure 12). The secant stiffness calculated for the first cycle (K1sec) of the Tol displacement history was similar for each column (Table 5). The repair strategy was able to restore the initial column capacity in terms of strength because the same displacements were applied to each column during the tests. It is evident that the secant stiffness variation of the RR columns was similar to that observed for the ASB column. The evolution of the secant stiffness (Figure 12) provides information about the evolution of the BS from cycle to cycle because each column was subjected the same displacement history. The repair strategy was able to restore capacity in terms of strength because the variation in the BS during the test was very similar for the ASB and RR columns. For the Tol part of the displacement history (Figure 7b), the main secant stiffness variation was observed during the first three cycles and then remained practically constant. For the Tol × 2 part of the displacement history (Figure 7b), the main secant stiffness variation was observed during the first four cycles and then increased a little, probably due to the effect of steel rebar hardening.
The evolution of the tangent stiffness calculated along the final part of each positive half cycle is shown by the inclination angle of the lines p, q, r, and s in Figure 11a–c. Only the positive load direction was considered because, along this direction, the stiffness variation of the ASB column variation was more evident. The ASB column showed an abrupt decrease in the tangent stiffness from the line ‘p’ to the line ‘q’ at a displacement of 13 mm (Figure 11a), due to the cover spalling because the cover was not confined. In distinction, the RR columns did not show significant variation in the tangent stiffness up to displacements greater than 30 mm.
The repair strategy improved the response of the column because it increased the flexural strength during the tests. Both steel and polymer fiber permitted the same restoration of the ASB column capacity in term of stiffness.

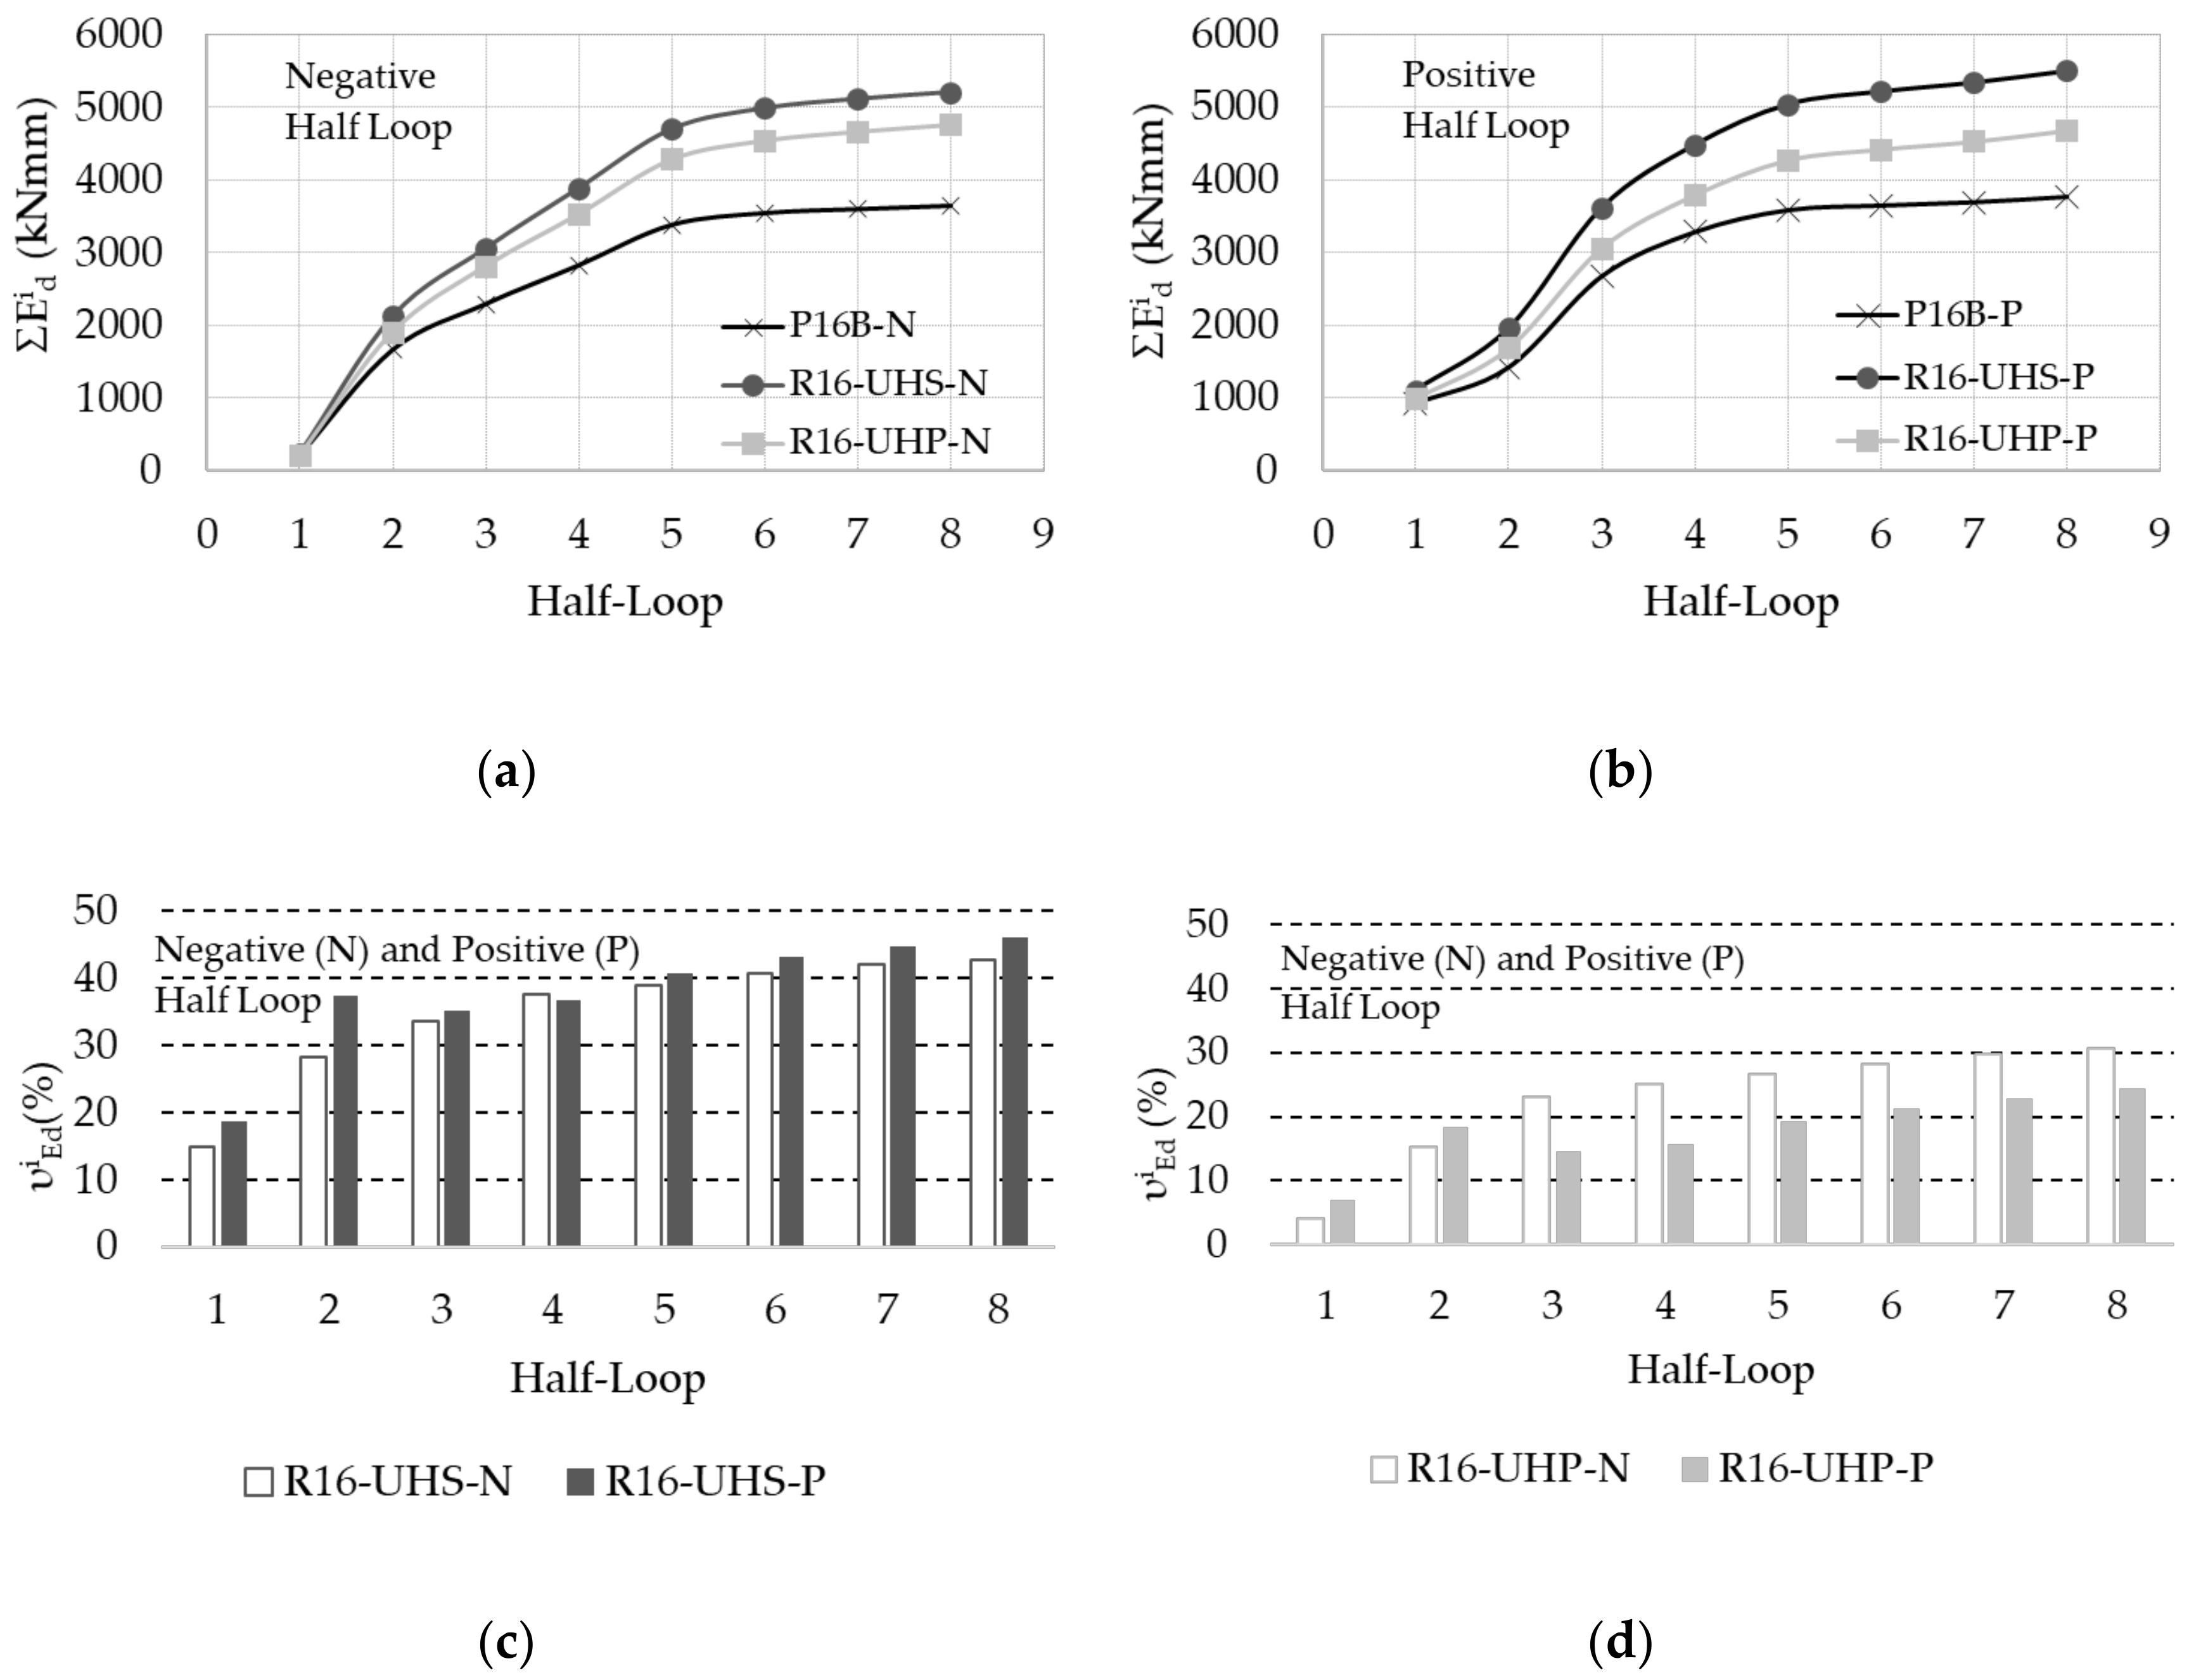
6.3. Dissipated Energy

In the case of seismic loads, the imposed displacements are asymmetric, and the loops may not be closed. The dissipated energy ( E d i ) should be evaluated appropriately for each half loop (i) during the test as the area of the ith half loop, in Equation (14) in Rodrigues et al. [68], as indicated in Figure 13.
E d i =   A H a l f L o o p i
The cumulative energies (ΣEid) calculated for the ASB and the RR columns for the negative and the positive half loops were obtained as the sum of the dissipated energy E d i during the Tol part of the displacement history, and are given in Figure 14a,b.
The repair strategy improved the energy dissipation capacity of the column during the tests, both in the negative direction. The polymer fibers ensured considerable improvement but it was a little smaller than the one produced by the steel fibers in the negative direction. The polymer fiber produced a good improvement but with a greater difference with respect to the one produced by the steel fibers in the positive direction.
The parameter υ Ed i defined in Equation (15) is an estimation of the variation in the dissipated energy after column repair for each half cycle.
υ Ed i = E d , RR i E d , ASB i E d , ASB i
where E d , RR i and E d , ASB i are the dissipated energy of the RR column and the ASB columns for each cycle, respectively. The parameter υiEd was calculated for each negative and positive half loop in: (1) Figure 14c for the RR column repaired by concrete with steel fibers (UHS); and (2) Figure 14d for the RR column repaired by concrete with polymer fibers (UHP).
The response of the columns subjected to low cycle fatigue excitation can be evaluated considering the first five cycles (Figure 7b) during the application of the Tol part of the deformation history. The mean value of υiEd calculated during the first five cycles was, for the negative half loops, 30.5% for R16-UHS and 18.8% for column R16-UHP, and for the positive half loops, 33.7% for R16-UHS and 15.0% for the column R16-UHP. This means that the polymer and steel fibers may increase the column energy dissipation capacity, but the steel fibers were more efficient, especially in the positive direction when the mean variation in the energies obtained for the column with polymer fibers (UHP) was less of the half of that obtained for the column with steel fibers (UHS). The mean value of υ Ed i calculated during the Tol part of the displacement history was, for the negative half loops, 34.8% for R16-UHS and 22.8% for the column R16-UHP; and for the positive half loops, 37.8% for R16-UHS and 17.9% for R16-UHP.
The column with either steel or polymer fiber modestly improved the energy dissipation capacity after low cycle fatigue excitation in each load direction. Similar consideration to those discussed for the low cycle fatigue response can be provided by considering the entire Tol displacement history.

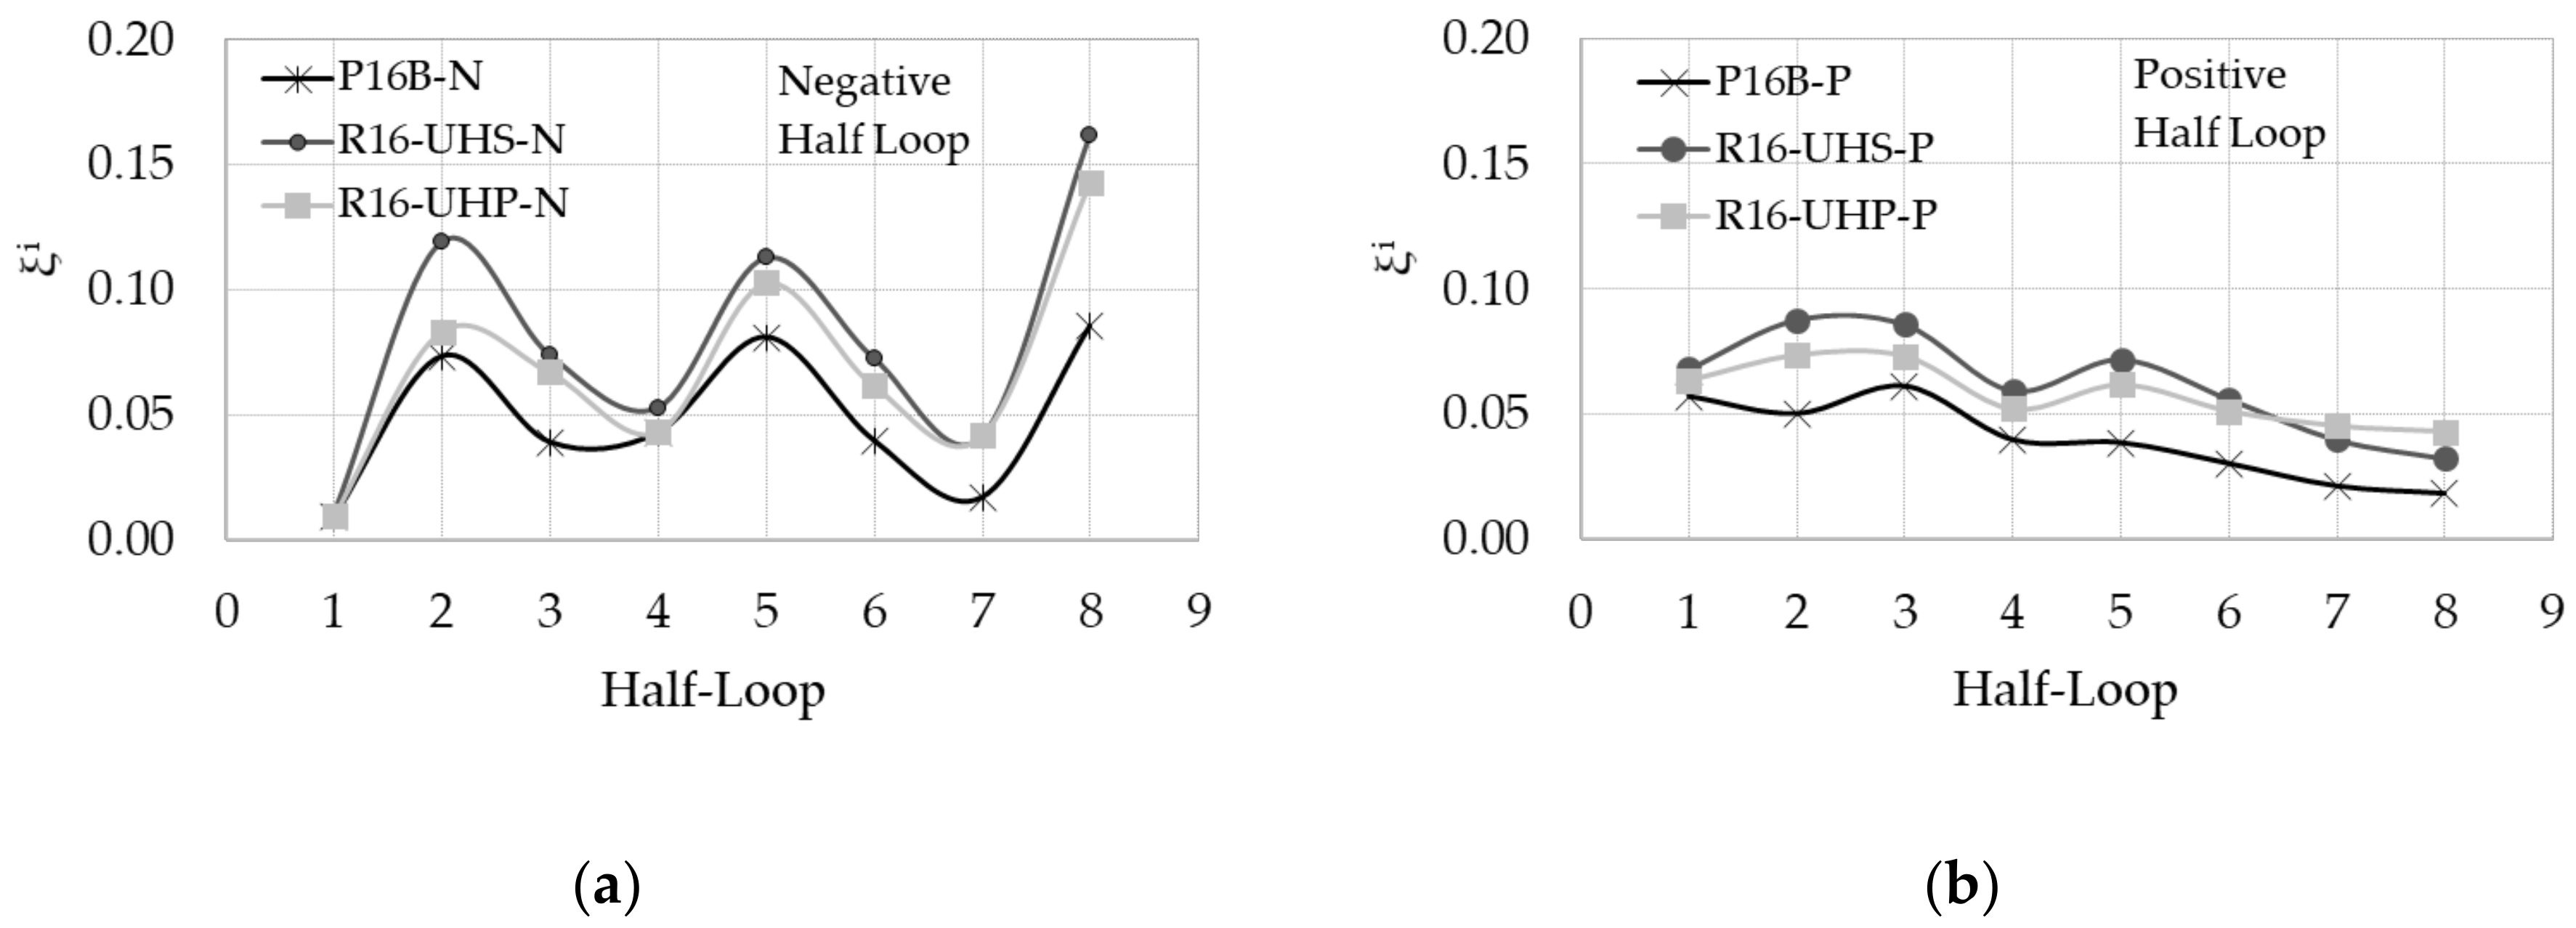
6.4. Hysteretic Damping and Force Reduction Factor

The hysteretic damping ( ξ i ) should be evaluated for each half-loop of the force–displacement curves according the next steps [68]. First, each half-cycle is identified, delimited by a pair of zero-force points (Figure 13). For each force-displacement half-cycle, the maximum generalized force ( F max i ) and the maximum generalized displacement ( D max i ) are evaluated, which allows for the calculating of the elastic strain energy (ES0). For each half-cycle, the dissipated energy (Eid) is computed by performing the integral of the force-displacement curve leading to the Ahalf-loop value (Figure 13).
Finally, the hysteretic damping ( ξ i ) can be calculated by Equation (16) for each half cycle.
ξ i = E d i 2 · π · D max i · F max i
where F max i and D max i are the maximum displacements and force for each half cycle, respectively (Figure 13). The values of the hysteretic damping ( ξ i ) are given in Figure 15a,b for the ASB column (P16B) and the repaired columns (R16-UHS and R16-UH) for the negative (Figure 15a) and the positive (Figure 15b) half loops.
The parameter υ ξ i defined by Equation (17) estimates the variation in the damping after column repair.
υ ξ i = ξ RR i ξ ASB i ξ ASB i
The parameter υiξ was calculated for each negative and positive half loop in: (1) Figure 15c for the RR column repaired by concrete with steel fibers (UHS); and (2) Figure 15d for the RR column repaired by concrete with polymer fibers (UHP).
The response of the columns subjected to low cycle fatigue excitation was evaluated considering the first five cycles (Figure 7b) during the application of the Tol part of the deformation history. The mean value of υiξ calculated during the first five cycles was 46.6% for R16-UHS and 23.8% for R16-UHP for the negative half loops, and 54.6% for R16-UHS and 34.3% for R16-UHP in the positive half loops. This means that the polymer and steel fibers may increase the hysteretic damping, but the steel fibers were more efficient. The mean value of υiξ calculated during the Tol part of the displacement history was, for the negative half loops, 69.3% for R16-UHS and 49.0% for R16-UHP; and for the positive half loops, 65.5% for R16-UHS and 61.6% for R16-UHP. The column with steel or polymer fiber showed a modest improvement in hysteretic damping after low cycle fatigue excitation in each load direction. A similarity to those discussed for the low cycles fatigue response can be drawn, considering the whole Tol displacement history.
Finally, the reduction factor (η) of the elastic demand (elastic response spectrum), which is used in many applications of structural engineering to estimate the force reduction for effect of damping [58,69], can be evaluated by Equation (18).
= 10 5 + ξ eq
The η value was calculated using the equivalent damping (ξeq) [68] during the first five half cycles (low cycles fatigue column response). The equivalent damping is equal to the sum of the elastic damping, usually assumed to be 5%, and the hysteretic damping (ξ). The total hysteretic damping for each cycle was obtained as the sum of the half loop damping calculated for the positive and the negative load directions. The mean values of the total hysteretic damping were: 0.1 for P16B (the ASB column), 0.15 for R16-UHS, and 0.13 for R16-UHP (the RR columns). The corresponding η values were: 0.71 for P16B (the ASB column), 0.64 for R16-UHS, and 0.67 for R16-UHP (the RR columns). The repair strategy using steel or polymer fibers ensured a greater reduction in the elastic demand compared to that obtained for the ASB column. There was no appreciable difference between the column repaired by steel or polymeric fibers.

6.5. Shear Strength of Columns
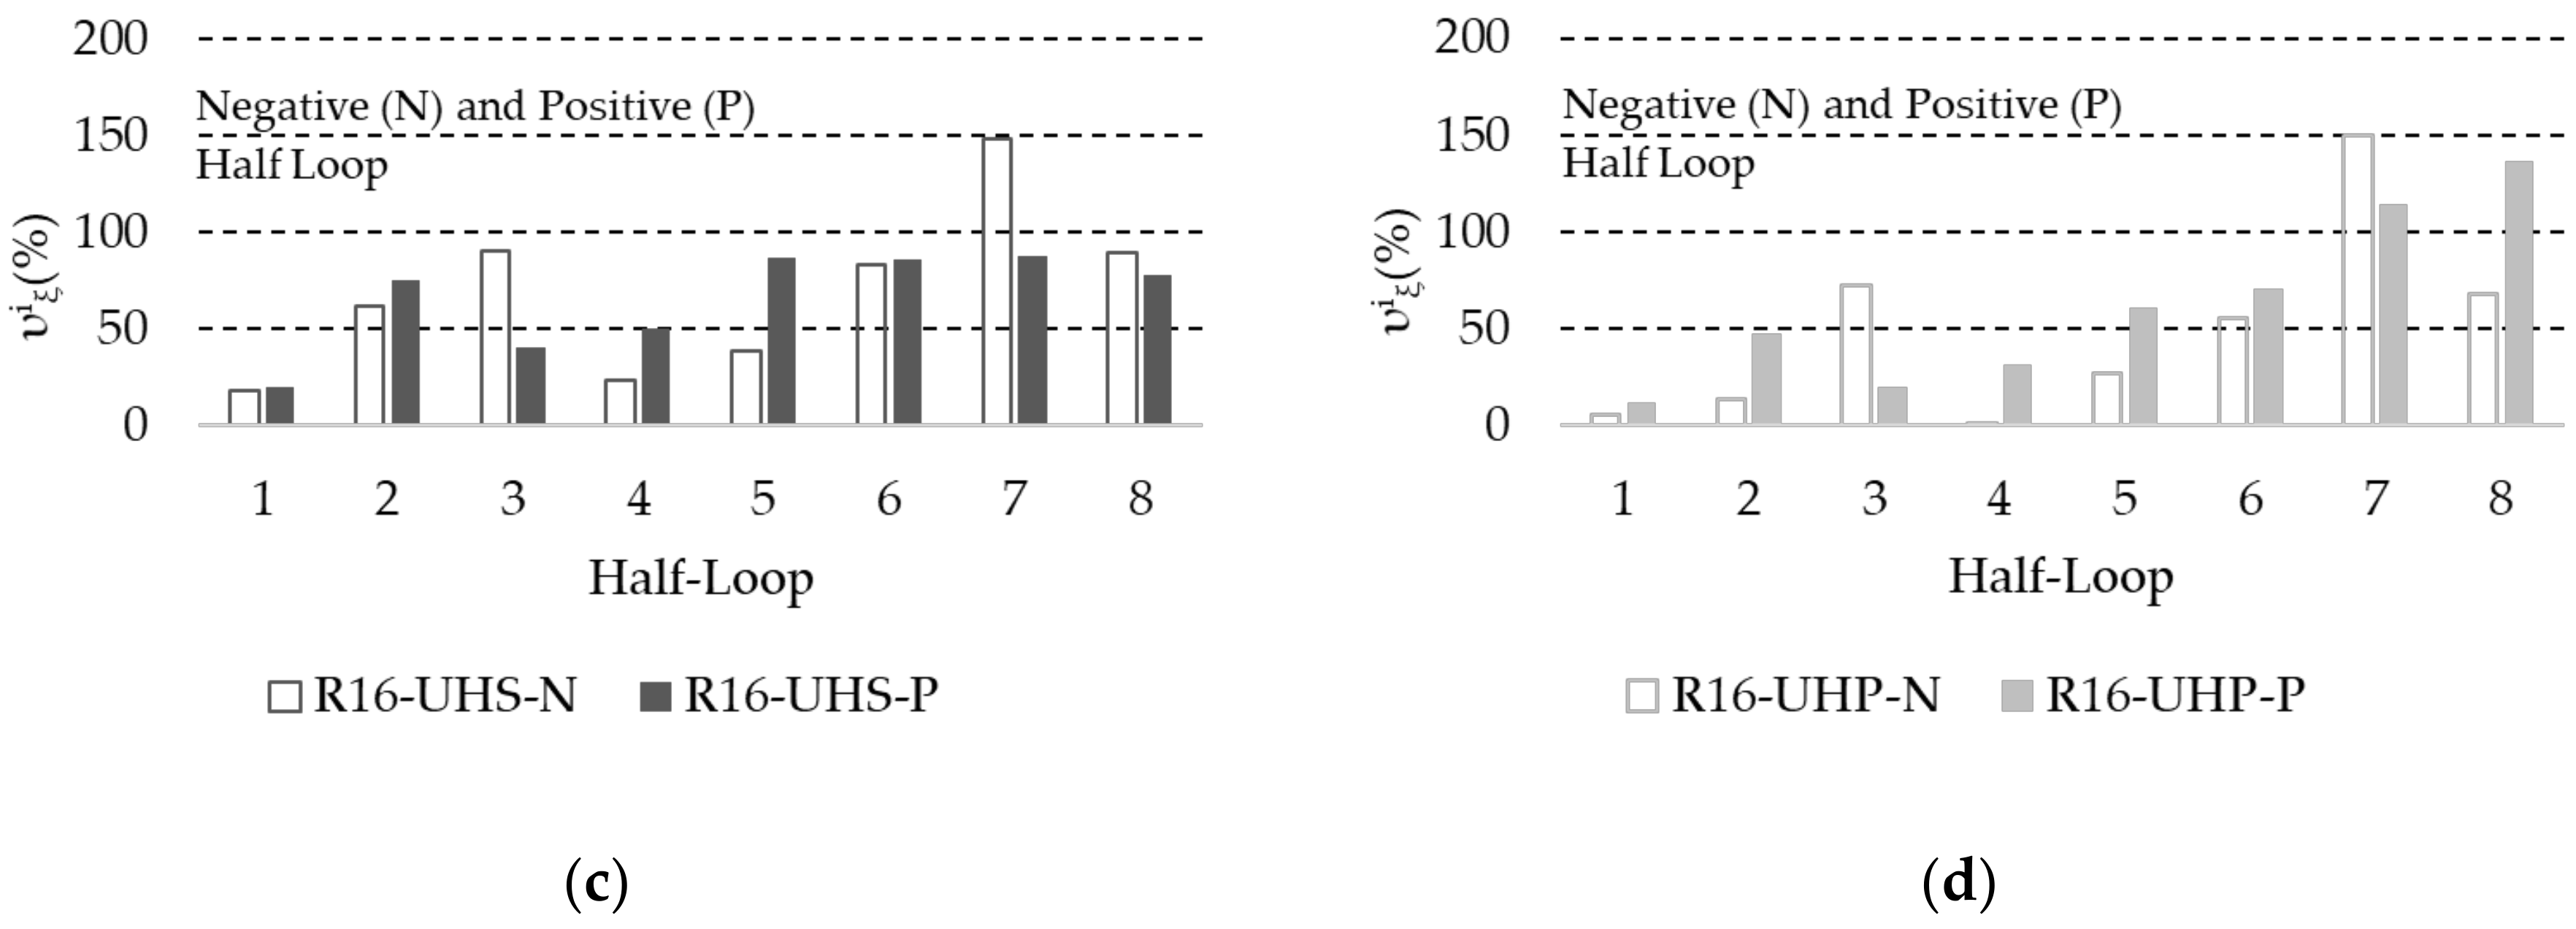
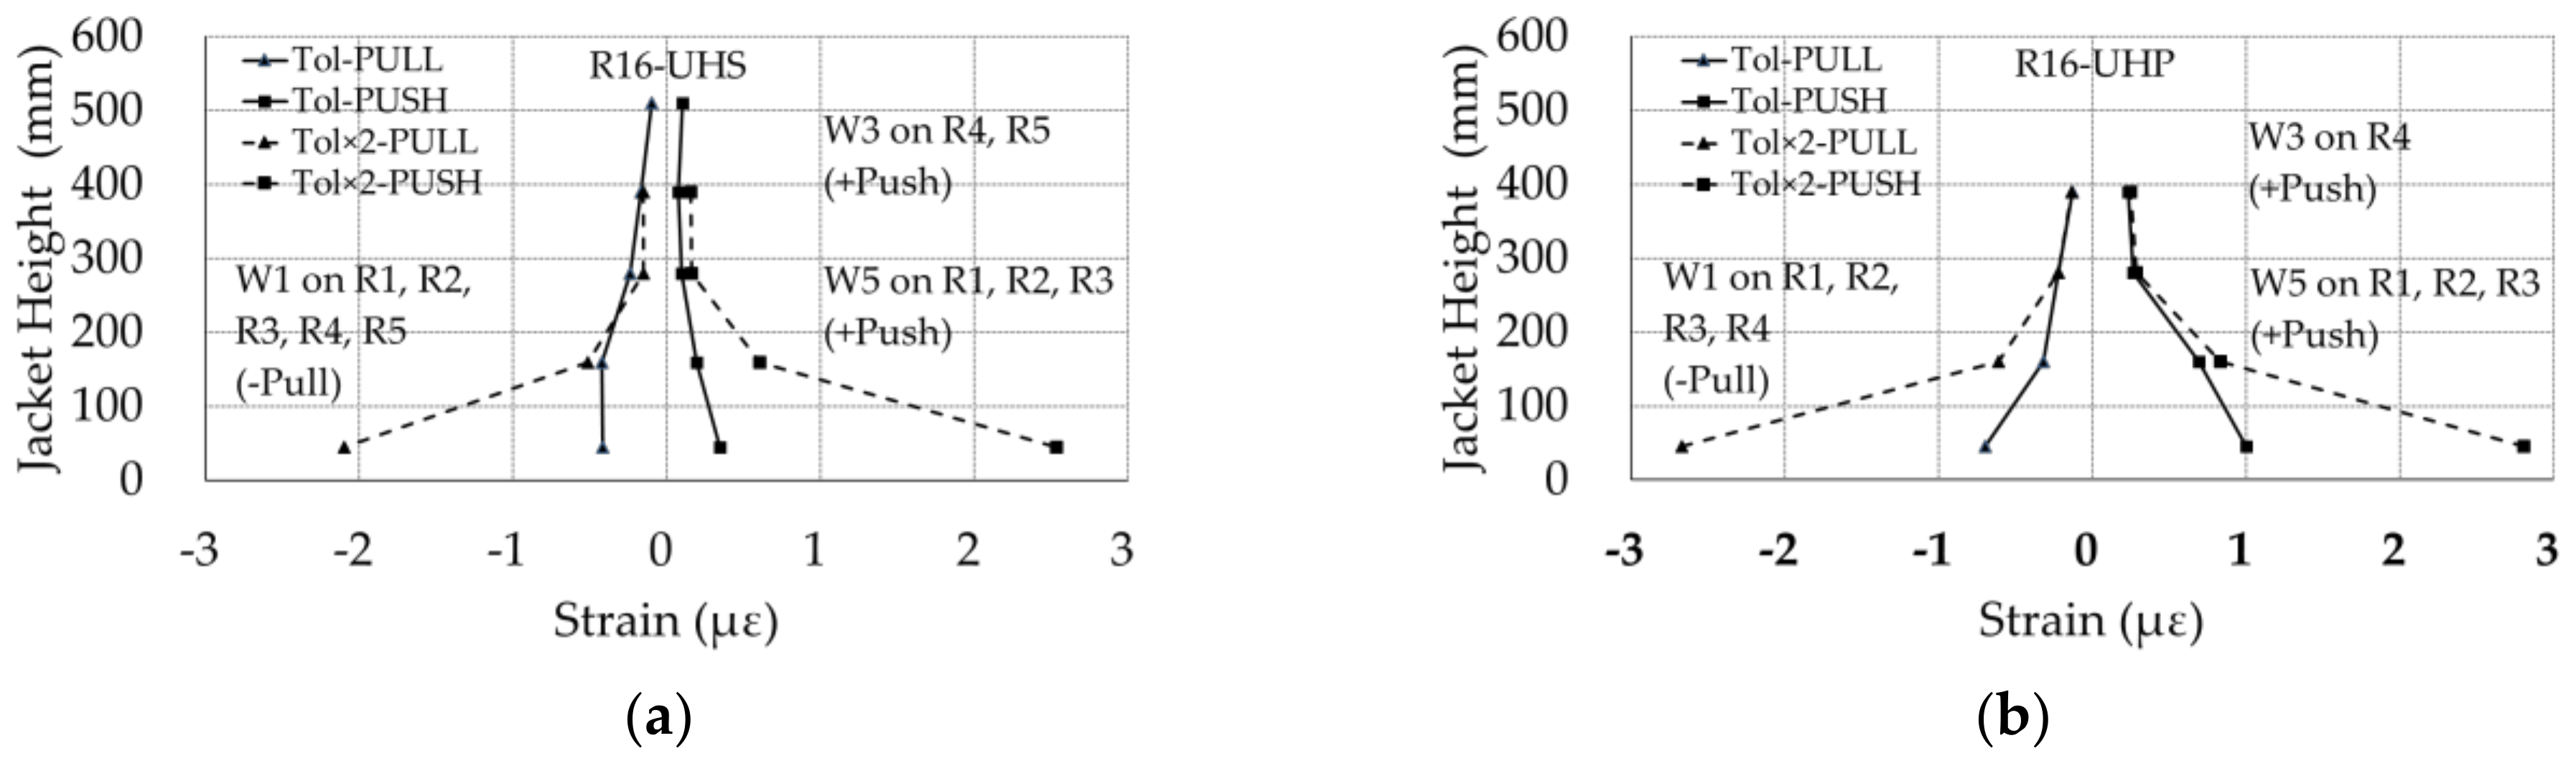
The shear strength of the repaired column was evaluated by Equations (9)–(12) and the results are given in Table 6. The concrete core contribution (VRd,cc) was the same for each RR column and was calculated by Equation (12), assuming: bw∙d is equal to 80% of the concrete core area, the experimental mean compressive strength of the concrete used to build the ASB column Rcm was 31 MPa, and the ratio N/Ag calculated with Ag equal to the area of the ASB column cross-section had the mean compressive stress on the core-section.
The concrete jacket contribution (VRd,cj) was calculated by Equation (10), assuming bw∙d is equal to Ae in Equation (11), the mean experimental UHS and UHP concrete mechanical characteristics given in Section 2, the partial coefficient (ϒc) is equal to one, and ten rebar under tension according the predicted height of the section zone in compression by the results of the numerical analyses in Section 7.
In Table 6, the RR columns shear strengths were compared with the maximum base shear values (BSmax), measured during the tests in the positive direction, where the columns behaviors were worse in terms of base shear. The predicted values of the shear strength are safe and therefore the guideline equation can be used to predict the shear strength of the repaired columns. In fact, the columns did not show shear failure during the test, and the predicted shear strength resulted greater than the maximum base shear measured experimentally on each repaired column.
Finally, the concrete jacket contribution (VRd,cj) was calculated using Equation (10), but assuming the minimum experimental concrete characteristics in Section 2 and the shear area given by CSA and ACI design codes [60,61,62], it is smaller than the value given by Equation (11).
The results in Table 6 show that the code equations can predict the shear strength of the column using both the mean and the minimum value of the parameters. Only the jacket can ensure the necessary shear strength.
Neglecting the uncertain contribution of the column core, which is usually not repaired, can make the prediction safer. However, further studies are necessary to study this contribution.

6.6. Jacket Strains

The circumferential strains were measured for the RR columns on the concrete jacket surface using the strain gauges placed at the positions given in Figure 10d. There were five sections at different heights along the jacket height with strain gauges placed along the section circumference (Figure 10d). The strain gauges labelled as W1 and W5 on the circumferences R1, R2, and R3 and the strain gauges W1 and W3 on the circumference R4 and R5 measured the maximum strains during the tests, as they were located along the column load direction.
For each measurement section, the mean value of the strains measured by W1 and W5 on R1, R2 and R3 and W1 and W3 on R4 and R5 during the Tol and Tol × 2 tests are shown in Figure 16a,b for the RR columns. For each RR column, there was great variation in the jacket strains along the column region at a height of about 150 mm from the column base, aligned with the turned steel segments. This is an experimental measure of the plastic hinge length, which can result in up to half of the theoretical length of 250 mm. For that reason, the length of the turned segment may be shortened, reducing time, cost, and impacts of the repair strategy. The concrete jacket with polymer fibers showed larger circumferential strain compared with the jacket with steel fibers, due to the different deformation capacities of the fibers and the different fiber volume fractions.

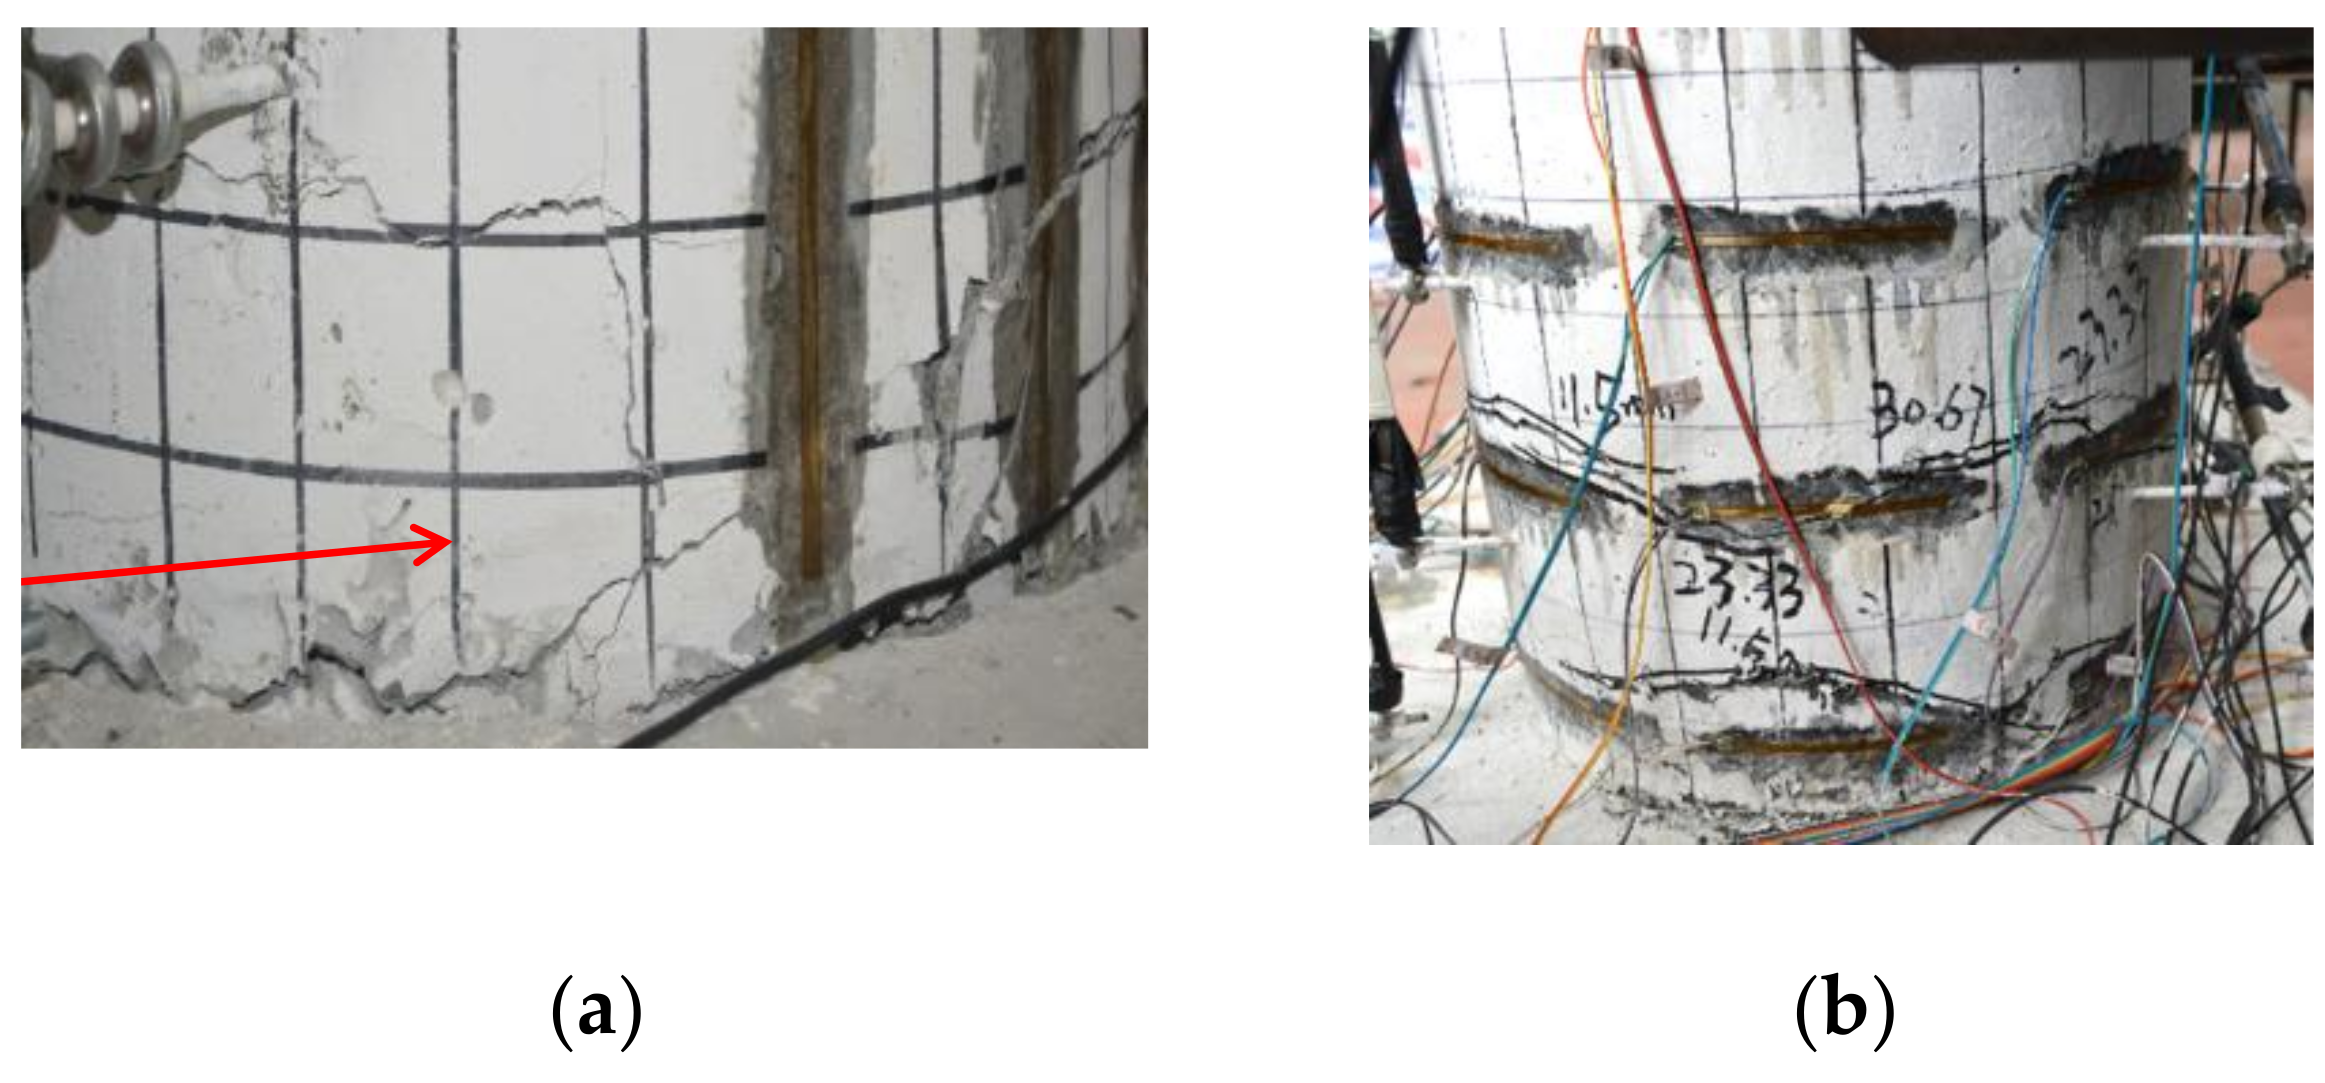
6.7. Damage to the Columns

After the tests, the RR columns presented flexural cracks only at sections with turned rebar (Figure 17b). Therefore, the concrete jacked with steel or polymer fibers was able to increase the shear strength of the column. The concrete crack width was small at the base of the RR columns, so the base rotation due to the strain penetration was small. Conversely, a wide crack opened at base of the ASB column (Figure 17a) and the base rigid rotation due to strain penetration was considerable. The plastic deformations of the RR longitudinal rebar moved away from the original anchorages, which resulted in less stress.
The rigid strain penetration rotations moved above the lower rebar connection where the moment was large, and the rebar diameter was smaller (turned rebar). The strain penetration rigid rotations of the RR column were smaller than in the ASB column because the maximum force in the turned rebar segment was smaller than in the anchorages, and the anchorage of the turned segment corresponded to the connection zone with a surface greater than that of the original rebar. For the same total displacement applied on each column, the reduction in the strain penetration displacement in the RR columns probably increased the plastic part of the displacement, and thereby the column dissipation capacity. The reduction in the strain penetration increased the initial tangent stiffness of the column and therefore the reduced stiffness—measured at the end of the test on the ASB column—was improved restoring the ASB stiffness before the test.
After the removal of the concrete cover, the connections and the new rebar were intact without buckling deformation in compression or the local high concentration of steel plastic deformations [36]. The new rebar segments effectively distributed the plastic deformation only in the plastic hinge. The connection and the original rebar also showed no plastic deformation or failure after the application of a strong earthquake Tol × 2.

7. Numerical Investigation

Numerical analyses were carried out by means of fiber models of the ASB and RR column sections built in The Open System for Earthquake Engineering Simulation (OpenSees) [38]. The aim of this study was to explain the experimental base shear measured for the RR columns (Section 7.2).

7.1. Numerical Fiber Models and Section Analisys

The section with the lower flexural strength was selected for each tested column where the applied moments were larger at the base of the column; the section without the turned rebar segments for the ASB column (AA, Table 7) and that with the turned rebar segments (BB, Table 7) for the RR columns. These sections were selected because the maximum column base shear was associated with the maximum flexural strength of the weaker section (flexural failure in Section 6.7) and the column damage was distributed along the more stressed column part with the weaker sections.
Three section models were built with two concrete patches (P1, P2) and 14 steel fibers. The concrete patches were a ring region (P2) and a circular region (P1) divided in fibers. The 14 steel fibers were used to simulate the longitudinal rebar in each section (Table 7) with the diameter and the configuration outlined in Table 7. P1 simulated the column core, whereas P2 was used to model the unconfined concrete cover of the ASB column or the HPFRC jacket of the RR columns with steel or polymer fibers (Table 7). The nonlinear behavior of the sections was modelled by the nonlinear stress-strain behavior of the fibers. Four multilinear models were simulated:
(1)
The stress-strain model for the concrete confined by a few stirrups (region P1 and P2 of the AA section, Table 7) on the base of previously reported models [70];
(2)
The experimental stress-strain curve for the UHS concrete used to repair the column R16-UHS (region P2 of the BB section, Table 7);
(3)
The experimental stress-strain curve for the UHP concrete used to repair the column R16-UHP (region P2 of the BB section, Table 7);
(4)
The skeleton curve that approximates the experimental curves obtained for the turned and unturned steel rebar in Figure 8.
The concrete behavior of the P1 part of the RR columns sections (original ASB column core) was modelled by the same model used for the P1 part of the ASB column.
The stress-strain curves of the concrete and the steel fibers were simulated in OpenSees by the uniaxial hysteretic material model, which is a multilinear model defined by three stress-strain points. The numerical analyses were performed by applying the experimental vertical axial loads section that was applied on the column (266 kN), and by increasing the curvatures of the section monotonically.
A zero-length rotational-spring element was created in OpenSees to perform the moment-curvature analysis of the section. After the application of a user-defined constant axial load (column vertical load), the section was subjected to a linearly-increasing moment up to a user-defined maximum curvature. The Displacement Control integrator was used to determine the necessary load factor to apply to create the imposed displacement. The energy convergence test was used, and a tool command language (TCL) procedure permitted us to change the values of the tolerance, the solution algorithm (Newton, Newton with Initial Tangent, Broyden, Newton With Line Search), and the number of the iteration steps until the solution convergence was attained.

7.2. Maximum Flexural Strength

The results of these analyses for each column are shown in Table 7 in terms of the maximum moment on the section (Mmax_num), the corresponding maximum shear (Fmax_num) at the base of the column, and the height of the section compression zone (zc_num).
In Table 7, the maximum base shear obtained by the section analysis (Fmax_num) is similar to the maximum base shear measured on the column during the experimental test (BSmax). For that reason, the numerical model can be considered a valid tool to study the column behavior in terms of forces.
The height zc_num of the zone in compression was obtained from the output of the fiber in tension and compression, assuming the plane section behavior, and is given in Table 7 for each section. The zc_num values for the RR sections showed that the section region in compression included a very modest part of the original column core with respect to the ASB column section. This was obvious because the high value of the compressive strength of the HPFRC was used to build the jacket decreased the height zc_num. The reduction in zc_num increased the section lever arm because the longitudinal rebar number and position were the same for the ASB and the RR columns. The increase in the inner lever arm balanced the decrease in the resulting maximum tensile force in the longitudinal rebar due to the rebar diameter reduction. This was a numerical check of the experimental evidence provided in Section 6.1. The damaged core of the RR columns did not collaborate much in the section and therefore the stress-strain model calibration for the core concrete fiber was unimportant.

8. Conclusions

A rapid repair strategy was presented and applied, on a 1:6 scale, to severely damaged RC columns of bridge piers. The strategy included the removal of the concrete and the steel transverse reinforcement in the plastic hinge region to expose all the longitudinal rebar, the use of a turned rebar segment to substitute the damaged part of the longitudinal rebar, and the building of a concrete jacket using HPFRC with steel or polymer fibers to restore the concrete parts and to improve the seismic performance of the column (ductility and shear strength).
For the first time, a HPFRC with polymer fiber was designed using a high volume fiber fraction (4%), which was investigated for structural use. This material presented good mechanical characteristics. The material ductility was at least comparable with that of HPFRC with steel fibers, with a modest reduction in the strength for compression, but was still acceptable for structural use given the base high strength of the concrete matrix. Good strength in tension and very good ductility in tension and compression were observed. This material can be a valid alternative to the use of HPFRC with steel fibers because the polymer fibers ensured greater durability, lower weight, and cost savings.
Further experimental studies are necessary to better investigate the reduction of the compressive strength observed for concrete with polymer fibers probably due to: (1) The lower Young’s modulus of the polymer compared to that of the matrix; and (2) the earlier cracking related to the interfacial transition zone (ITZ) effect, and to the hydrophobic nature of polymer fibers that could produce a void between the fiber and the concrete matrix.
Cyclic tests were carried out on two RC columns (the ASB columns) that were severely damaged and were repaired following the proposed strategy using HPFRC with steel (2%) or polymer fibers (4%). The results showed that the repair strategy can be applied with success in a short time (four-to-five-days) on the RC columns.
The use of the HPFRC jacket permitted considerable cost and time savings because new transverse steel and external FRP reinforcement were not necessary. The shear strength of columns can be predicted correctly by the code equations proposed by CNR DT 204/2006 [55], and additionally for hollow circular sections by using a proper shear area. The shear strength of the concrete jacket can ensure adequate shear strength due to the steel or the polymeric fiber contributions. The shear strength of the original core, which is usually not repaired because the repair is difficult, provides a contribution. However, this contribution is uncertain and further research efforts are necessary. For that reason, neglecting the uncertain contributions of the column core can improve the safety of the prediction.
The reduction in the diameter of the new rebar segments by turning guarantee the proper plastic deformation along the plastic hinge region only, without rebar ruptures, which also occurred under high displacement ductility (>6); and the reduction in the stresses on the original anchorages, which are used to anchor the new rebar segments. The length of the plastic hinge was smaller than the theoretical length because the rigid rotations, due to the strain penetration, moved away from the anchorages and were reduced by the turning rebar. The connection among the new segments and the existing undamaged rebar parts in the columns, realized by a simple steel coupler and butt head and lateral welding joints, was efficient because the connections were intact at the end of the tests.
The repair strategy restored the strength, secant, initial tangent stiffness, and ductility of the column. The stiffness recovery was obtained without performing resin injection in the cracked concrete core, but was probably due to the reduction in the base rotation due to the strain penetration. The jacket with steel (2%) or polymer fibers with a high fiber fraction (4%) showed the same recovery and improvement capacity. For the RR columns, the tangent stiffness at the maximum base shear of each cycle did not decrease much from cycle to cycle and were greater than the ASB column. Even if the maximum investigated displacement was smaller than the ultimate displacement, the displacement ductility of the RR column may be greater than the ASB column because the RR column showed limited degradation of the hardening behavior.
The strategy ensured the improvement of the seismic capacity of the repaired column because: (1) The dissipated energy and the damping of the RR columns were greater than those of the ASB columns. HPFRC with polymer fiber showed a lower dissipation capacity with respect to the steel fibers. The repaired columns can ensure a greater reduction of the elastic design force. (2) The HPFRC jacket with steel or polymer fibers guaranteed the necessary shear strength because shear failure was not observed during the test.
The high compressive strength of the HPFRC reduced the height of the compression zone in the section. The original cracked core contribution was modest; therefore new concrete parts could only meet the seismic demand. The inner lever arm section increased and balanced the reduction in the maximum steel tensile force in the new rebar segments with a reduced diameter. This was also verified numerically by OpenSees section analyses.
The repair strategy should also be tested that considers a deformation history that is representative of the bridge response in other scenarios, such as non-synchronous seismic action [71,72,73,74,75], because the distance between the pier foundations can be large; and for near-fault earthquake excitation [76,77], which produces a bridge response different to those due to synchronous far fault earthquakes. Finally, the repair strategy should also be applied to integral bridges, which present a peculiar problem in the case of severe damage [78,79].

Author Contributions

All authors substantially contributed to this work. D.L. and J.X. were the scientific coordinator of the research, designed the experimental campaign and analyzed the results. C.N., B.B. and A.M.T. supervised all the research and revised the results. G.C.M., A.V.B., I.V. contributed on the interpretation of the results and S.S. on the experimental tests. T.J. supervised the development of the HPFRC. All authors helped with the writing of the paper and give final approval of the version to be submitted and any revised versions.

Funding

The authors gratefully acknowledge the funding received by The Laboratories University Network of Seismic Engineering (ReLUIS) thanks to the research project ReLUIS/DPC 2016–2018. The research was supported by the National Natural Science Foundation of China (51508103), National Natural Science Foundation of China (51778148), Fujian Provincial Education Department Research Foundation for Young Teacher (JA15074), and Recruitment Program of Global Experts Foundation (TM2012-27). The authors would also like to acknowledge the Sustainable and Innovative Bridge Engineering Research Center (SIBERC) of the College of Civil Engineering, Fuzhou University (Fuzhou, China) and the PRISMA lab of the Dept. of Architecture at Roma Tre University, (Rome, Italy). Authors thank Kerakoll S.p.A. and ISTRICE (Fili & Forme Srl) for having provided the materials for the development of the HPFRC.

Conflicts of Interest

The authors declare no conflict of interest.

References

  1. Nuti, C.; Santini, S.; Vanzi, I. Damage, Vulnerability and Retrofitting Strategies for the Molise Hospital System Following the 2002 Molise, Italy, Earthquake. Earthq. Spectra 2004, 20, S285–S299. [Google Scholar] [CrossRef]
  2. Rasulo, A.; Goretti, A.; Nuti, C. Performance of Lifelines during the 2002 Molise, Italy, Earthquake. Earthq. Spectra 2004, 20, S301–S314. [Google Scholar] [CrossRef]
  3. Nuti, C.; Rasulo, A.; Vanzi, I. Seismic safety evaluation of electric power supply at urban level. Earthq. Eng. Struct. Dyn. 2007, 36, 245–263. [Google Scholar] [CrossRef]
  4. Nuti, C.; Rasulo, A.; Vanzi, I. Seismic assessment of utility systems: Application to water, electric power and transportation networks. In Safety, Reliability and Risk Analysis: Theory, Methods and Applications, Proceedings of the Joint ESREL and SRA-Europe Conference, Valencia, Spain, 22–25 September 2009; CRC Press-Taylor & Francis Group: Boca Raton, FL, USA, 2009; Volume 3, pp. 2519–2529. [Google Scholar]
  5. Nuti, C.; Rasulo, A.; Vanzi, I. Seismic safety of network structures and infrastructures. Struct. Infrastruct. Eng. 2010, 6, 95–110. [Google Scholar] [CrossRef]
  6. Vanzi, I.; Marano, G.C.; Monti, G.; Nuti, C. A synthetic formulation for the Italian seismic hazard and code implications for the seismic risk. Soil Dyn. Earthq. Eng. 2015, 77, 111–122. [Google Scholar] [CrossRef]
  7. Braga, F.; Gigliotti, R.; Monti, G.; Morelli, F.; Nuti, C.; Salvatore, W.; Vanzi, I. Post-seismic assessment of existing constructions: Evaluation of the shakemaps for identifying exclusion zones in Emilia. Earthq. Struct. 2015, 8, 37–56. [Google Scholar] [CrossRef]
  8. Braga, F.; Gigliotti, R.; Monti, G.; Morelli, F.; Nuti, C.; Salvatore, W.; Vanzi, I. Speedup of post earthquake community recovery: The case of precast industrial buildings after the Emilia 2012 earthquake. Bull. Earthq. Eng. 2014, 12, 2405–2418. [Google Scholar] [CrossRef]
  9. Fiorentino, G.; Nuti, C.; Squeglia, N.; Lavorato, D.; Stacul, S. One-dimensional nonlinear seismic response analysis using strength-controlled constitutive models: The case of the leaning tower of Pisa’s subsoil. Geosciences 2018, 8, 228. [Google Scholar] [CrossRef]
  10. Forte, A.; Santini, S.; Fiorentino, G.; Lavorato, D.; Bergami, A.V.; Nuti, C. Influence of materials knowledge level on the assessment of the shear strength characteristic value of existing RC beams. In Proceedings of the 12th Fib International PhD-Symposium in Civil Engineering, Prague, Czech Republic, 29–31 August 2018; pp. 979–986. [Google Scholar]
  11. Lavorato, D.; Bergami, A.V.; Forte, A.; Quaranta, G.; Nuti, C.; Monti, G.; Santini, S. Influence of materials knowledge level on the assessment of the characteristic value of the shear strength of existing RC beams. In Proceedings of Italian Concrete Days 2016; Lecture Notes in Civil Engineering; Springer: Cham, Switzerland, 2016; pp. 535–547. [Google Scholar]
  12. Fiorentino, G.; Forte, A.; Pagano, E.; Sabetta, F.; Baggio, C.; Lavorato, D.; Nuti, C.; Santini, S. Damage patterns in the town of Amatrice after august 24th 2016 central Italy earthquakes. Bull. Earthq. Eng. 2018, 16, 1399–1423. [Google Scholar] [CrossRef]
  13. Bergami, A.V.; Forte, A.; Lavorato, D.; Nuti, C. Proposal of a incremental modal pushover analysis (IMPA). Earthq. Struct. 2017, 13, 539–549. [Google Scholar] [CrossRef]
  14. Pelliciari, M.; Marano, G.C.; Cuoghi, T.; Briseghella, B.; Lavorato, D.; Tarantino, A.M. Parameter Identification of Degrading and Pinched Hysteretic Systems Using a Modified Bouc–Wen Model. Struct. Infrastruct. Eng. 2018. [Google Scholar] [CrossRef]
  15. Marano, G.C.; Pelliciari, M.; Cuoghi, T.; Briseghella, B.; Lavorato, D.; Tarantino, A.M. Degrading bouc-wen model parameters identification under cyclic load. Int. J. Geotech. Earthq. Eng. 2017, 8, 60–81. [Google Scholar] [CrossRef]
  16. Nuti, C.; Vanzi, I. To retrofit or not to retrofit? Eng. Struct. 2003, 25, 701–711. [Google Scholar] [CrossRef]
  17. Bergami, A.V.; Nuti, C. A design procedure of dissipative braces for seismic upgrading structures. Earthq. Struct. 2013, 4, 85–108. [Google Scholar] [CrossRef]
  18. Lavorato, D.; Nuti, C.; Santini, S. Experimental investigation of the shear strength of RC beams extracted from an old structure and strengthened by carbon FRP u-strips. Appl. Sci. 2018, 8, 1182. [Google Scholar] [CrossRef]
  19. Imperatore, S.; Lavorato, D.; Nuti, C.; Santini, S.; Sguerri, L. Shear behavior of existing RC T-beams strengthened with CFRP. In Proceedings of the Assessment, Upgrading and Refurbishment of Infrastructures (IABSE 2013), Rotterdam, The Netherlands, 6–8 May 2013. [Google Scholar]
  20. Imperatore, S.; Lavorato, D.; Nuti, C.; Santini, S.; Sguerri, L. Shear Performance of Existing Reinforced Concrete T-Beams Strengthened with FRP. In Proceedings of the 6th International Conference on FRP Composites in Civil Engineering, CICE 2012, Rome, Italy, 13–15 June 2012. [Google Scholar]
  21. Imperatore, S.; Lavorato, D.; Nuti, C.; Santini, S.; Sguerri, L. Numerical Modeling of Existing RC Beams Strengthened in Shear with FRP U-Sheets. In Proceedings of the 6th International Conference on FRP Composites in Civil Engineering (CICE 2012), Rome, Italy, 13–15 June 2012. [Google Scholar]
  22. Lavorato, D.; Bergami, A.V.; Fiorentino, G.; Fiore, A.; Santini, S.; Nuti, C. Experimental tests on existing RC beams strengthened in flexure and retrofitted for shear by C-FRP in presence of negative moments. Int. J. Adv. Struct. Eng. 2018, 10, 211–232. [Google Scholar] [CrossRef]
  23. Zhou, Z.; Lavorato, D.; Nuti, C.; Marano, G.C. A Model for Carbon and Stainless-Steel Reinforcing Bars Including Inelastic Buckling for Evaluation of Capacity of Existing Structures. In Proceedings of the COMPDYN 2015—5th ECCOMAS Thematic Conference on Computational Methods in Structural Dynamics and Earthquake Engineering, Crete, Greece, 25–27 May 2015; National Technical University of Athens: Athens, Greece, 2015; pp. 876–886. [Google Scholar]
  24. Lavorato, D.; Nuti, C.; Santini, S.; Briseghella, B.; Xue, J. A Repair and Retrofitting Intervention to Improve Plastic Dissipation and Shear Strength of Chinese RC Bridges. In Proceedings of the IABSE Conference, Geneva 2015: Structural Engineering: Providing Solutions to Global Challenges-Report, Geneva, Switzerland, 23–25 September 2015; pp. 1762–1767. [Google Scholar]
  25. Lavorato, D.; Nuti, C.; Santini, S. Experimental Investigation of the Seismic Response of Repaired r.c. Bridges by Means of Pseudodynamic Tests. In Proceedings of the IABSE Symposium on Large Structures and Infrastructures for Environmentally Constrained and Urbanised Areas, Venice, Italy, 22–24 September 2010; pp. 448–449. [Google Scholar]
  26. Albanesi, T.; Lavorato, D.; Nuti, C.; Santini, S. Experimental program for pseudodynamic tests on repaired and retrofitted bridge piers. Eur. J. Environ. Civ. Eng. 2009, 13, 671–683. [Google Scholar] [CrossRef]
  27. Albanesi, T.; Lavorato, D.; Nuti, C.; Santini, S. Experimental Tests on Repaired and Retrofitted Bridge Piers. In Proceedings of the International FIB Symposium 2008—Tailor Made Concrete Structures: New Solutions for our Society, Amsterdam, The Netherlands, 19–21 May 2008; p. 151. [Google Scholar]
  28. Zhou, Z.; Nuti, C.; Lavorato, D. Modeling of the Mechanical Behavior of Stainless Reinforcing Steel. In Proceedings of the 10th fib International, PhD Symposium in Civil Engineering, Universite Laval, QC, Canada, 21–23 July 2014; pp. 515–520. [Google Scholar]
  29. Lavorato, D.; Nuti, C. Pseudo-Dynamic Testing of Repaired and Retrofitted RC Bridges. In Proceedings of the fib Symposium Prague 2011: Concrete Engineering for Excellence and Efficiency, Prague, Czech Republic, 8–10 June 2011; pp. 451–454. [Google Scholar]
  30. Lavorato, D.; Nuti, C. Seismic Response of Repaired Bridges by Pseudodynamic Tests. In Bridge Maintenance, Safety, Management and Life-Cycle Optimization, Proceedings of the 5th International Conference on Bridge Maintenance, Safety and Management, Philadelphia, PA, USA, 11–15 July 2010; CRC Press: Boca Raton, FL, USA, 2010; pp. 2368–2375. [Google Scholar]
  31. Lavorato, D.; Bergami, A.V.; Nuti, C.; Briseghella, B.; Xue, J.; Tarantino, A.M.; Marano, G.C.; Santini, S. Ultra-High-Performance Fibre-Reinforced Concrete Jacket for the Repair and the Seismic Retrofitting of Italian and Chinese RC Bridges. In Proceedings of the 6th International Conference on Computational Methods in Structural Dynamics and Earthquake Engineering (COMPDYN 2017), Rhodes Island, Greece, 15–17 June 2017; National Technical University of Athens: Athens, Greece, 2017; Volume 1, pp. 2149–2160. [Google Scholar] [CrossRef]
  32. Massicotte, B.; Boucher-Proulx, G. Seismic retrofitting of bridge piers with UHPFRC jackets. In Designing and Building with UHPFRC; Toutlemonde, F., Resplendino, J., Eds.; John Wiley & Sons, Inc.: Hoboken, NJ, USA, 2013; pp. 531–540. [Google Scholar]
  33. Ma, C.-K.; Apandi, N.M.; Sofrie, C.S.Y.; Ng, J.H.; Lo, W.H.; Awang, A.Z.; Omar, W. Repair and rehabilitation of concrete structures using confinement: A review. Constr. Build. Mater. 2017, 133, 502–515. [Google Scholar] [CrossRef]
  34. Sun, Z.; Li, H.; Bi, K.; Si, B.; Wang, D. Rapid repair techniques for severely earthquake-damaged circular bridge piers with flexural failure mode. Earthq. Eng. Eng. Vib. 2017, 16, 415–433. [Google Scholar] [CrossRef]
  35. Cheng, C.-T.; Yang, J.-C.; Yeh, Y.-K.; Chen, S.-E. Seismic performance of repaired hollow-bridge piers. Constr. Build. Mater. 2003, 17, 339–351. [Google Scholar] [CrossRef]
  36. Lavorato, D.; Nuti, C. Pseudo-dynamic tests on reinforced concrete bridges repaired and retrofitted after seismic damage. Eng. Struct. 2015, 94, 96–112. [Google Scholar] [CrossRef]
  37. Rodrigues, H.; Furtado, A.; Arêde, A.; Vila-Pouca, N.; Varum, H. Experimental study of repaired RC columns subjected to uniaxial and biaxial horizontal loading and variable axial load with longitudinal reinforcement welded steel bars solutions. Eng. Struct. 2018, 155, 371–386. [Google Scholar] [CrossRef]
  38. Di Carlo, F.; Meda, A.; Rinaldi, Z. Numerical cyclic behaviour of un-corroded and corroded RC columns reinforced with HPFRC jacket. Compos. Struct. 2017, 163, 432–443. [Google Scholar] [CrossRef]
  39. Beschi, C.; Meda, A.; Riva, P. Column and joint retrofitting with high performance fiber reinforced concrete jacketing. J. Earthq. Eng. 2011, 15, 989–1014. [Google Scholar] [CrossRef]
  40. Ilki, A.; Demir, C.; Bedirhanoglu, I.; Kumbasar, N. Seismic retrofit of brittle and low strength RC columns using fiber reinforced polymer and cementitious composites. Adv. Struct. Eng. 2009, 12, 325–347. [Google Scholar] [CrossRef]
  41. Del Zoppo, M.; Di Ludovico, M.; Balsamo, A.; Prota, A. Comparative analysis of existing RC columns jacketed with CFRP or FRCC. Polymers 2018, 10, 361. [Google Scholar] [CrossRef]
  42. Lanzoni, L.; Soragni, M.; Tarantino, A.M.; Viviani, M. Concrete Beams Stiffened by Polymer-Based Mortar Layers: Experimental Investigation and Modeling. Constr. Build. Mater. 2016, 105, 321–335. [Google Scholar] [CrossRef]
  43. Forcellini, D.; Tarantino, A.M. Assessment of Stone Columns as a Mitigation Technique of Liquefaction-Induced Effects during Italian Earthquakes (May 2012). Sci. World J. 2014, 2014, 216278. [Google Scholar] [CrossRef] [PubMed]
  44. Tarantino, A.M. Equilibrium Paths of a Hyperelastic Body Under Progressive Damage. J. Elast. 2014, 114, 225–250. [Google Scholar] [CrossRef]
  45. Saradar, A.; Tahmouresi, B.; Mohseni, E.; Shadmani, A. Restrained shrinkage cracking of fiber-reinforced high-strength concrete. Fibers 2018, 6, 12. [Google Scholar] [CrossRef]
  46. McKenna, F.; Fenves, G.L.; Filippou, F.C. OpenSees: Open System for Earthquake Engineering Simulation; Pacific Earthquake Engineering Research Center: Berkeley, CA, USA, 2002; Available online: http://opensees.berkeley.edu (accessed on 9 November 2018).
  47. Garas, V.Y.; Kahn, L.F.; Kurtis, K.E. Short-term tensile creep and shrinkage of ultra-high performance concrete. Cem. Concr. Compos. 2009, 31, 147–152. [Google Scholar] [CrossRef]
  48. UNI EN 14889-1:2006. Fibres for Concrete—Part 1: Steel Fibres-Definitions, Specification and Conformity. Available online: http://store.uni.com/ (accessed on 14 September 2018).
  49. Lanzoni, L.; Nobili, A.; Tarantino, A.M. Performance evaluation of a polypropylene-based draw-wired fibre for concrete structures. Constr. Build. Mater. 2012, 28, 798–806. [Google Scholar] [CrossRef]
  50. Bentur, A.; Mindess, S. Fibre Reinforced Cementitious Composites, 2nd ed.; CRC Press: Boca Raton, FL, USA, 2007; ISBN 9780415250481. [Google Scholar]
  51. Richardson, A.E. Compressive strength of concrete with polypropylene fibre additions. Struct. Surv. 2006, 24, 138–153. [Google Scholar] [CrossRef] [Green Version]
  52. UNI 11039. Steel Fibre Reinforced Concrete—Part I: Definitions, Classification Specification and Conformity—Part II: Test Method for Measuring First Crack Strength and Ductility Indexes. Italian Board for Standardization. 2003. Available online: http://store.uni.com/ (accessed on 14 September 2018).
  53. RILEM TC 162-TDF: Test and Design Methods for Steel Fibre Reinforced Concrete’-Sigma-Epsilon-Design Method-Final Recommendation. Available online: https://www.rilem.net/ (accessed on 14 September 2018).
  54. CI-S-002-2003 Method of Test for Load-Displacement Curve of Fiber Reinforced Concrete by Use of Notched Beam, Japan Concrete Institute Standard. 2003. Available online: http://www.jci-net.or.jp/ (accessed on 14 September 2018).
  55. CNR-DT 204/2006 Guide for the Design and Construction of Fiber-Reinforced Concrete Structures; Italian National Research Council (CNR). 2006. Available online: https://www.cnr.it/ (accessed on 14 September 2018).
  56. Finazzi, S.; Paegle, I.; Fischer, G.; Minelli, F. Influence of Bending Test Configuration on Cracking Behavior of FRC; In Proceedings of the 3rd All-Russia (International) Conference on Concrete and Reinforced Concrete, Moscow, Russian, 12–16 May 2014.
  57. Eurocode 2: Design of Concrete Structures—Part 1-1: General Rules and Rules for Buildings. Available online: http://eurocodes.jrc.ec.europa.eu/ (accessed on 14 September 2018).
  58. NTC 2018. Decreto 17 Gennaio 2018. Aggiornamento delle Norme Tecniche per le Costruzioni. Gazzetta Ufficiale della Repubblica Italiana. Serie Generale n.42 del 20-02-2018-Suppl. Ordinario n. 8. Available online: http://www.gazzettaufficiale.it/ (accessed on 14 September 2018).
  59. Priestley, M.J.N.; Seible, F.; Xiao, Y.; Verma, R. Steel jacket retrofitting of reinforced concrete bridge columns for enhanced shear strength—Part 2: Test results and comparison with theory. ACI Struct. J. 1994, 91, 537–551. [Google Scholar]
  60. CSA A23.3-04. Design of Concrete Structures; Standard CAN/CSA A23.3-04; Canadian Standards Association: Mississauga, ON, Canada, 2004; Available online: https://www.scc.ca/en/ (accessed on 14 September 2018).
  61. ACI 318-11. Building Code Requirements for Structural Concrete (ACI 318-11) and Commentary; American Concrete Institute (ACI): Detroit, MI, USA, 2011; Available online: https://www.concrete.org/ (accessed on 14 September 2018).
  62. ACI 371R. Guide for the Analysis, Design, and Construction of Concrete Pedestal Water Towers. Reported by ACI Committee 371. 1998. Available online: https://www.concrete.org/ (accessed on 14 September 2018).
  63. Sezen, H.; Moehle, J.P. Shear strength model for lightly reinforced concrete columns. J. Struct. Eng. 2004, 130, 1692–1703. [Google Scholar] [CrossRef]
  64. JTG D60-2004. General Code for Design of Highway Bridges and Culverts. Available online: http://www.gbstandards.org/ (accessed on 14 September 2018).
  65. JTG D62-2004. Code for Design of Highway Reinforced Concrete and Prestressed Concrete Bridge and Culverts. Available online: http://www.gbstandards.org/ (accessed on 14 September 2018).
  66. JTG/T B02-01-2008. Guidelines for Seismic Design of Highway Bridges; China Architecture & Buliding Press: Beijing, China, 2008; Available online: http://www.gbstandards.org/ (accessed on 14 September 2018).
  67. Paulay, T.; Priestley, M.J.N. Seismic Design of Reinforced Concrete and Masonry Buildings; John Wiley & Sons: New York, NY, USA, 2009; ISBN 9780471549154. [Google Scholar]
  68. Rodrigues, H.; Furtado, A.; Arêde, A. Experimental evaluation of energy dissipation and viscous damping of repaired and strengthened RC columns with CFRP Jacketing under biaxial load. Eng. Struct. 2017, 145, 162–175. [Google Scholar] [CrossRef]
  69. Eurocode 8: Design of Structures for Earthquake Resistance 2004. Available online: http://eurocodes.jrc.ec.europa.eu/ (accessed on 14 September 2018).
  70. Hosotani, M.; Kawashima, K. Stress-strain model for concrete cylinders confined by both carbon fiber sheets and hoop reinforcement. Jpn. Soc. Civ. Eng. 1998, 1999, 25–42. [Google Scholar] [CrossRef]
  71. Nuti, C.; Vanzi, I. Influence of earthquake spatial variability on differential soil displacements and SDF system response. Earthq. Eng. Struct. Dyn. 2005, 34, 1353–1374. [Google Scholar] [CrossRef]
  72. Nuti, C.; Vanzi, I. Design of Bridges for Non Synchronous Seismic Motion. In Proceedings of the AIP Conference, Reggio Calabria, Italy, 8–11 July 2008; AIP: Reggio Calabria, Italy, 2008; pp. 666–673. [Google Scholar] [CrossRef]
  73. Lavorato, D.; Vanzi, I.; Nuti, C.; Monti, G. Generation of Non-Synchronous Earthquake Signals. In Springer Series in Reliability Engineering; Gardoni, P., Ed.; Springer: London, UK, 2017; pp. 169–198. [Google Scholar]
  74. Lavorato, D.; Bergami, A.V.; Rago, C.; Ma, H.-B.; Nuti, C.; Vanzi, I.; Briseghella, B.; Zhuo, W.-D. Seismic behaviour of isolated RC bridges subjected to asynchronous seismic input. In COMPDYN 2017, Proceedings of the 6th International Conference on Computational Methods in Structural Dynamics and Earthquake Engineering, Rhodes Island, Greece, 15–17 June 2017; National Technical University of Athens: Athens, Greece, 2017; pp. 2214–2226. [Google Scholar]
  75. Lavorato, D.; Fiorentino, G.; Bergami, A.V.; Ma, H.-B.; Nuti, C.; Briseghella, B.; Vanzi, I.; Zhou, W.-D. Surface generation of asynchronous seismic signals for the seismic response analysis of bridges. In COMPDYN 2017, Proceedings of the 6th International Conference on Computational Methods in Structural Dynamics and Earthquake Engineering, Rhodes Island, Greece, 15–17 June 2017; National Technical University of Athens: Athens, Greece, 2017; pp. 2203–2213. [Google Scholar]
  76. Ma, H.B.; Zhuo, W.-D.; Lavorato, D.; Fiorentino, G.; Nuti, C.; Sabetta, F. Seismic response analysis of continuous highway bridges under near-fault ground motions. In COMPDYN 2017, Proceedings of the 6th International Conference on Computational Methods in Structural Dynamics and Earthquake Engineering, Rhodes Island, Greece, 15–17 June 2017; National Technical University of Athens: Athens, Greece, 2017; pp. 2138–2148. [Google Scholar]
  77. Ma, H.B.; Zhuo, W.-D.; Fiorentino, G.; Lavorato, D.; Nuti, C.; Sun, Y. Seismic responses of regular highway bridges under near-fault ground motions (COMPDYN 2017). In COMPDYN 2017, Proceedings of the 6th International Conference on Computational Methods in Structural Dynamics and Earthquake Engineering, Rhodes Island, Greece, 15–17 June 2017; National Technical University of Athens: Athens, Greece, 2017; pp. 2119–2137. [Google Scholar]
  78. Munoz, M.; Briseghella, B.; Nuti, C.; Xue, J. Semi static loads in an integral abutment bridge. In Proceedings of the IABSE Conference 2016: Bridges and Structures Sustainability—Seeking Intelligent Solutions, Guangzhou, China, 8–11 May 2016; International Association for Bridge and Structural Engineering: Zurich, Switzerland, 2016; pp. 61–69. [Google Scholar]
  79. Munoz, M.; Briseghella, B.; Xue, J.; Smaldini, P.; Nuti, C. A probabilistic evaluation of an integral abutment bridge. Maintenance, Monitoring, Safety, Risk and Resilience of Bridges and Bridge Networks. In Proceedings of the 8th International Conference on Bridge Maintenance, Safety and Management (IABMAS 2016), Foz do Iguaçu, Brazil, 26–30 June 2016; pp. 792–796. [Google Scholar]
Figure 1. Mean cube compressive strength variation increasing the fiber volume fraction: (a) concrete reinforced with steel fibers (UHS) and (b) concrete reinforced with polymer fibers (UHP) after seven days of curing.
Applsci 08 01671 g001
Figure 2. Bending test on high-performance fiber reinforced concrete (HPFRC) with different polymer fiber volume fractions: (a) Beam with notch and (b) four-points bending test scheme.
Applsci 08 01671 g002
Figure 3. Bending tests on HPFRC beams: (a) Crack opening measured on a notched beam with a 4% volumetric fraction of polymer fibers, and (b) fibers crack bridge effect.
Applsci 08 01671 g003
Figure 4. Load-crack tip opening displacement (CTOD) curves for the notched UHS beams with (a) 2% and (b) 3% volumetric fraction of steel fiber. The incorrect test for one beam with 2% fiber fraction is not reported.
Applsci 08 01671 g004
Figure 5. Load-CTOD curves for the notched beam with (a) 2% and (b) 4% volumetric fractions of polymer fibers.
Applsci 08 01671 g005
Figure 6. (a) Tensile strength based on the bending test results; (b) load-CTOD curve example. Figures extracted from CNR DT 204/2006 [55] and from UNI 11039-2 (2003) [52].
Applsci 08 01671 g006
Figure 7. (a) Bridge geometries, (b) applied displacement history to test the scaled pier, (c) geometries and reinforcement of the 1:6 scale pier (mm), and (d) proposed repair strategy: Rebar substitution and concrete jacket building.
Applsci 08 01671 g007
Figure 8. New rebar segments tested in tension: Not turned (NSR) and turned (TSR) segments; skeleton curve (Skel) to calibrate the steel material model in OpenSees.
Applsci 08 01671 g008
Figure 9. Damaged longitudinal rebar substitution: (a) Turned rebar geometries; and (b) rebar connection geometries.
Applsci 08 01671 g009
Figure 10. Cyclic test apparatus: (a) Photo of the Fuzhou University laboratory, (b) design scheme, and (c) applied instrument to measure at the column base: Vertical (V) and diagonal (X) deformations; (d) horizontal (H) and concrete jacket strains (W).
Applsci 08 01671 g010
Figure 11. Experimental hysteretic response of: (a) the As-built column (P16B); (b) the repaired column by concrete jacket with steel fiber (R16-UHS); (c) the repaired column by concrete jacket with polymer fiber (R16-UHP) during the tests Tol and Tol × 2; (d) Experimental envelope curve for each tested column.
Applsci 08 01671 g011
Figure 12. Experimental secant stiffness (kisec) measured at each cycle for the column P16B (the ASB column) and the RR columns R16-UHS and R16-UHP during the Tol and Tol × 2 parts of the displacement history.
Applsci 08 01671 g012
Figure 13. Example of damping determination for a hysteretic force (F) displacement (D) half-cycles.
Applsci 08 01671 g013
Figure 14. Cumulative dissipated energy (ΣEid) calculated during the displacement history part Tol for the ASB column (P16B) and the repaired columns (R16-UHS, R16-UHP): (a) For the negative (N), and (b) for the positive (P) half loops. Dissipated energy variation ( υ Ed i ) for: (c) the column R16-UHS and (d) the column R16-UHP.
Applsci 08 01671 g014
Figure 15. Hysteretic damping (ξi) for each half loop during Tol deformation history of the ASB column (P16B) and the RR columns (R16-UHS, R16-UHP) for the negative (a) and the positive (b) half loops. Damping increase ( υ ξ i ) for: (c) the column R16-UHS and (d) the column R16-UHP.
Applsci 08 01671 g015aApplsci 08 01671 g015b
Figure 16. Experimental circumferential strain on the concrete jacket of the RR columns with: (a) steel fibers (R16-UHS) or (b) polymer fibers (R16-UHP).
Applsci 08 01671 g016
Figure 17. Damage at the end of the cyclic tests on: (a) The ASB column and (b) the RR columns.
Applsci 08 01671 g017
Table 1. Mean cube compressive strength (Rcm) for concrete with steel or polymer fibers considering different fiber volume fractions (Vol) and standard deviation (SD) of the compressive strengths after seven days of curing.
SpecimenVol
(%)
Rcm
(MPa)
SDFiberSpecimen
Failure Mode
No fiber093.62.6 Applsci 08 01671 i001 Applsci 08 01671 i002
Steel1100.93.0
Steel2110.22.7
Steel3116.33.7
No fiber075.74.0 Applsci 08 01671 i003 Applsci 08 01671 i004
Polymer251.43.9
Polymer456.94.2
Table 2. Bending test on the concrete reinforced with steel fibers (UHS): CNR DT 204/2006 [55] equivalent stress (feq2), ultimate residual tensile strength (fFtu), and mean tensile strength (fctm).
Steel Fiber Volume Fractionfeq2 (MPa)fFtu (MPa)fctm (MPa)
2% Mean (Min.)12.2 (12.2)4.1 (4.1)4.9
3% Mean (Min.)15.1 (14.8)5.0 (4.9)5.0
Table 3. Bending test on the concrete reinforced with polymer fibers (UHP): CNR DT 204/ 2006 [55] equivalent stress (feq2), ultimate residual tensile strength (fFtu), and mean tensile strength (fctm).
Polymer Fiber Volume Fractionfeq2 (MPa)fFtu (MPa)fctm (MPa)
2% Mean (Min.)6.1 (5.7)2.0 (1.9)3.5
4% Mean (Min)8.2 (7.1)2.7 (2.4)3.7
Table 4. Reinforced concrete (RC) pier scaled 1:6 (columns): Length (Lt) and diameter (ϕt) of the turned rebar segments (mm); HPFRC jacket with steel (UHS) or polymer (UHP) fibers. Vol is the volumetric fraction of fibers.
ColumnLtϕtConcrete
Jacket
Trans.
Steel Reinforced
P16A, P16B018No fibersϕ 4/60
R16-UHS250152% vol
steel fiber
-
R16-UHP250154% vol
Polymer fiber
-
Table 5. Experimental results: Displacement ductility (μΔ), maximum base shear (BSmax), and tangent stiffness (Ktang) in a negative direction; secant stiffness (K1sec) for the first cycle of Tol as part of the displacement history (Figure 7b).
SpecimenLoad DirectionμΔBSmax
(kN)
Ktang
(kN/m)
K1sec
(kN/m)
P16BPos.6229.0 22,485.5
Neg.>7–229.053,846.1
R16-UHSPos.>6233.0-22,011.8
Neg.>7–227.053,846.2
R16-UHPPos.>6215.0 21,271.7
Neg.>7–229.651,851.85
Table 6. Repaired column shear strength: concrete core contribution (VRd,cc), concrete jacket contribution (VRd,cj), column shear strength (VRd), minimum values of the jacket contribution (VRd,cjmin), and of the shear strength (VRdmin).
ColumnR16-UHSR16-UHP
VRd,cc29.229.2
VRd,cj
(VRd,cjmin)
254.5
(234.5)
230.2
(206.1)
VRd
(VRdmin)
283.7
(263.7)
259.4
(235.3)
BSmax186.4172.0
Table 7. Numerical fiber section analyses by OpenSees [46]: height of the section compression zone (zc_num), numerical maximum moment (Mmax_num), numerical (Fmax_num) and experimental (BSmax) maximum base shear for the ASB (P16B), and the repaired (R16-UHS, R16-UHP) columns.
HeaderP16BR16-UHSR16-UHPFiber Sections Concrete Stress–Strain Curves
zc_num
(mm)
130.878.9107.2 Applsci 08 01671 i005 Applsci 08 01671 i006
Mmax_num (kNm)276.7267.6241.5
Fmax_num
(kN)
237.1229.3207.6
BSmax
(kN)
229.0233.0215.0

