Degradation Classification of 3D Printing Thermoplastics Using Fourier Transform Infrared Spectroscopy and Artificial Neural Networks


Electro Ceramic Center, Department of Automotive Engineering, Dong-Eui University, 176 Eomgwangro, Busanjin-gu, Busan 47340, Korea
Appl. Sci. 2018, 8(8), 1224; https://doi.org/10.3390/app8081224
Submission received: 23 June 2018
/
Revised: 17 July 2018
/
Accepted: 21 July 2018
/
Published: 25 July 2018
(This article belongs to the Special Issue 3D Printing of Metals)
Abstract
:Fused deposition modeling (FDM) is the most popular technology among 3D printing technologies because of inexpensive and flexible extrusion systems with thermoplastic materials. However, thermal degradation phenomena of the 3D-printed thermoplastics is an inevitable problem for long-term reliability. In the current study, thermal degradation of 3D-printed thermoplastics of ABS and PLA was studied. A classification methodology using deep learning strategy was developed so that thermal degradation of the thermoplastics could be classified using FTIR and Artificial Neural Networks (ANNs). Under given data and predefined rules for ANNs, ANN models with nine hidden layers showed the best results in terms of accuracy. To extend this methodology, other thermoplastics, several new datasets for ANNs, and control parameters of ANNs could be further investigated.
1. Introduction
3D printing, also known as additive manufacturing (AM), has been used in automotives, aerospace, mechanical systems, medicine, biological systems, food supply chains, and so on [1,2]. The key advantage of 3D printing is the capability to economically build complex shapes using a wide variety of materials. By using this technology, consumers and industries can rapidly make a prototype in early-stage product design. Seven 3D printing processes have been categorized by ASTM International: material extrusion, powder bed fusion, vat photo-polymerization, material jetting, binder jetting, sheet lamination, and directed energy deposition. Among them, fused deposition modeling (FDM) or fused filament fabrication (FFF), which belongs to the material extrusion process, is becoming the most popular due to its inexpensive and flexible extrusion systems including thermoplastic materials. However, thermal degradation phenomena of the 3D-printed thermoplastics is an inevitable problem for long-term reliability. This study focuses on thermal degradation of the thermoplastics, which is one of the causes of failure.
To characterize thermoplastics and polymers with thermal degradation, researchers have used Fourier transform infrared spectroscopy (FTIR), differential scanning calorimetry (DSC), thermogravimetric analysis (TGA), thermomechanical analysis (TMA), dynamic mechanical analysis (DMA), scanning electron microscopy (SEM), X-ray photoelectron spectroscopy (XPS), and so on. Pan et al. [3] developed a novel system of poly(lactide acid)-d-alpha-tocopheryl polyethylene glycol 1000 succinate (PLA-TPGS) nanoparticles(NPs) for quantum dot (QD) formulation to improve imaging effects. They used FTIR and XPS to analyze the surface chemistry of the samples. Song et al. [4] reported biodegradable lactic-acid-based telechelic pre-polymers incorporating CNTs characterized by FTIR, TGA, DSC, POM, and so on. Wu and Liao [5] reported the production of new biodegradable nanocomposites from polyactide (PLA), tetraethoxysilane (TEOS), and wood flour (WF) using an in-sihi sol-gel process and a melt blending method. They used FTIR to characterize SiO2, PLA, and hybrids. They found that the PLA-g-AA/SiO2 hybrid could enhance the thermal and mechanical properties of PLA. Chaunier et al. [6] tried to make 3D-printed structure using maize protein as biopolymers. They used DSC and DMA to obtain glass transitions and the thermos-mechanical properties of Zein-based materials and applied direct beam X-ray scattering (WAXS) and FTIR to characterize the structure of Zein during processing. Semba et al. [7] investigated mechanical properties of PLA resin blended with PCL resin. Samples were fabricated using injection molding. They found that the carbonyl groups of the blend material with DCP (dicumyl peroxide) enhanced the viscous property in the PCL phase and the interfacial adhesion in the dual phase nature of the PLA/PCL blend using FTIR spectroscopy. Holland and Hay [8] studied that the thermal degradation of poly(vinyl alcohol) using thermal analysis–FTIR (TA-FTIR), thermogravimetry (TG) and DSC. Liu et al. [9] reported pyrolysis profiles of plastic blends such as ABS/PVC, ABS, PA5, and ABS/PC using thermogravimetric-FTIR (TG-FTIR). Among several methods, FTIR is a nondestructive technique used to obtain an infrared spectrum of absorption or transmission of the thermoplastics. The molecular bond structure could be observed so that material identification, contamination, degradation, and chemical contact are quantitatively characterized using FTIR. However, the information from FTIR is hard to be understood for novices and a feature extraction of FTIR is not easy without a priori knowledge. To overcome these problems, researchers have adopted machine learning or deep learning techniques with FTIR. Ellis et al. [10] used FTIR and the machine learning method to detect microbial spoilage of beef. Argyri et al. [11] used FTIR and artificial neural networks (ANNs) to detect meat spoilage. Sattlecker et al. [12] used FTIR and a support vector machine (SVM) strategy to classify different types and stages of breast cancer.
In this study, thermal degradation of 3D-printed thermoplastics was investigated and classified using FTIR and ANNs. Among the several 3D printing thermoplastics, acrylonitrile butadiene styrene (ABS) and polylactic acid (PLA), which are popular materials for FDM, were used.
2. Methodology
2.1. Fused Deposition Modeling
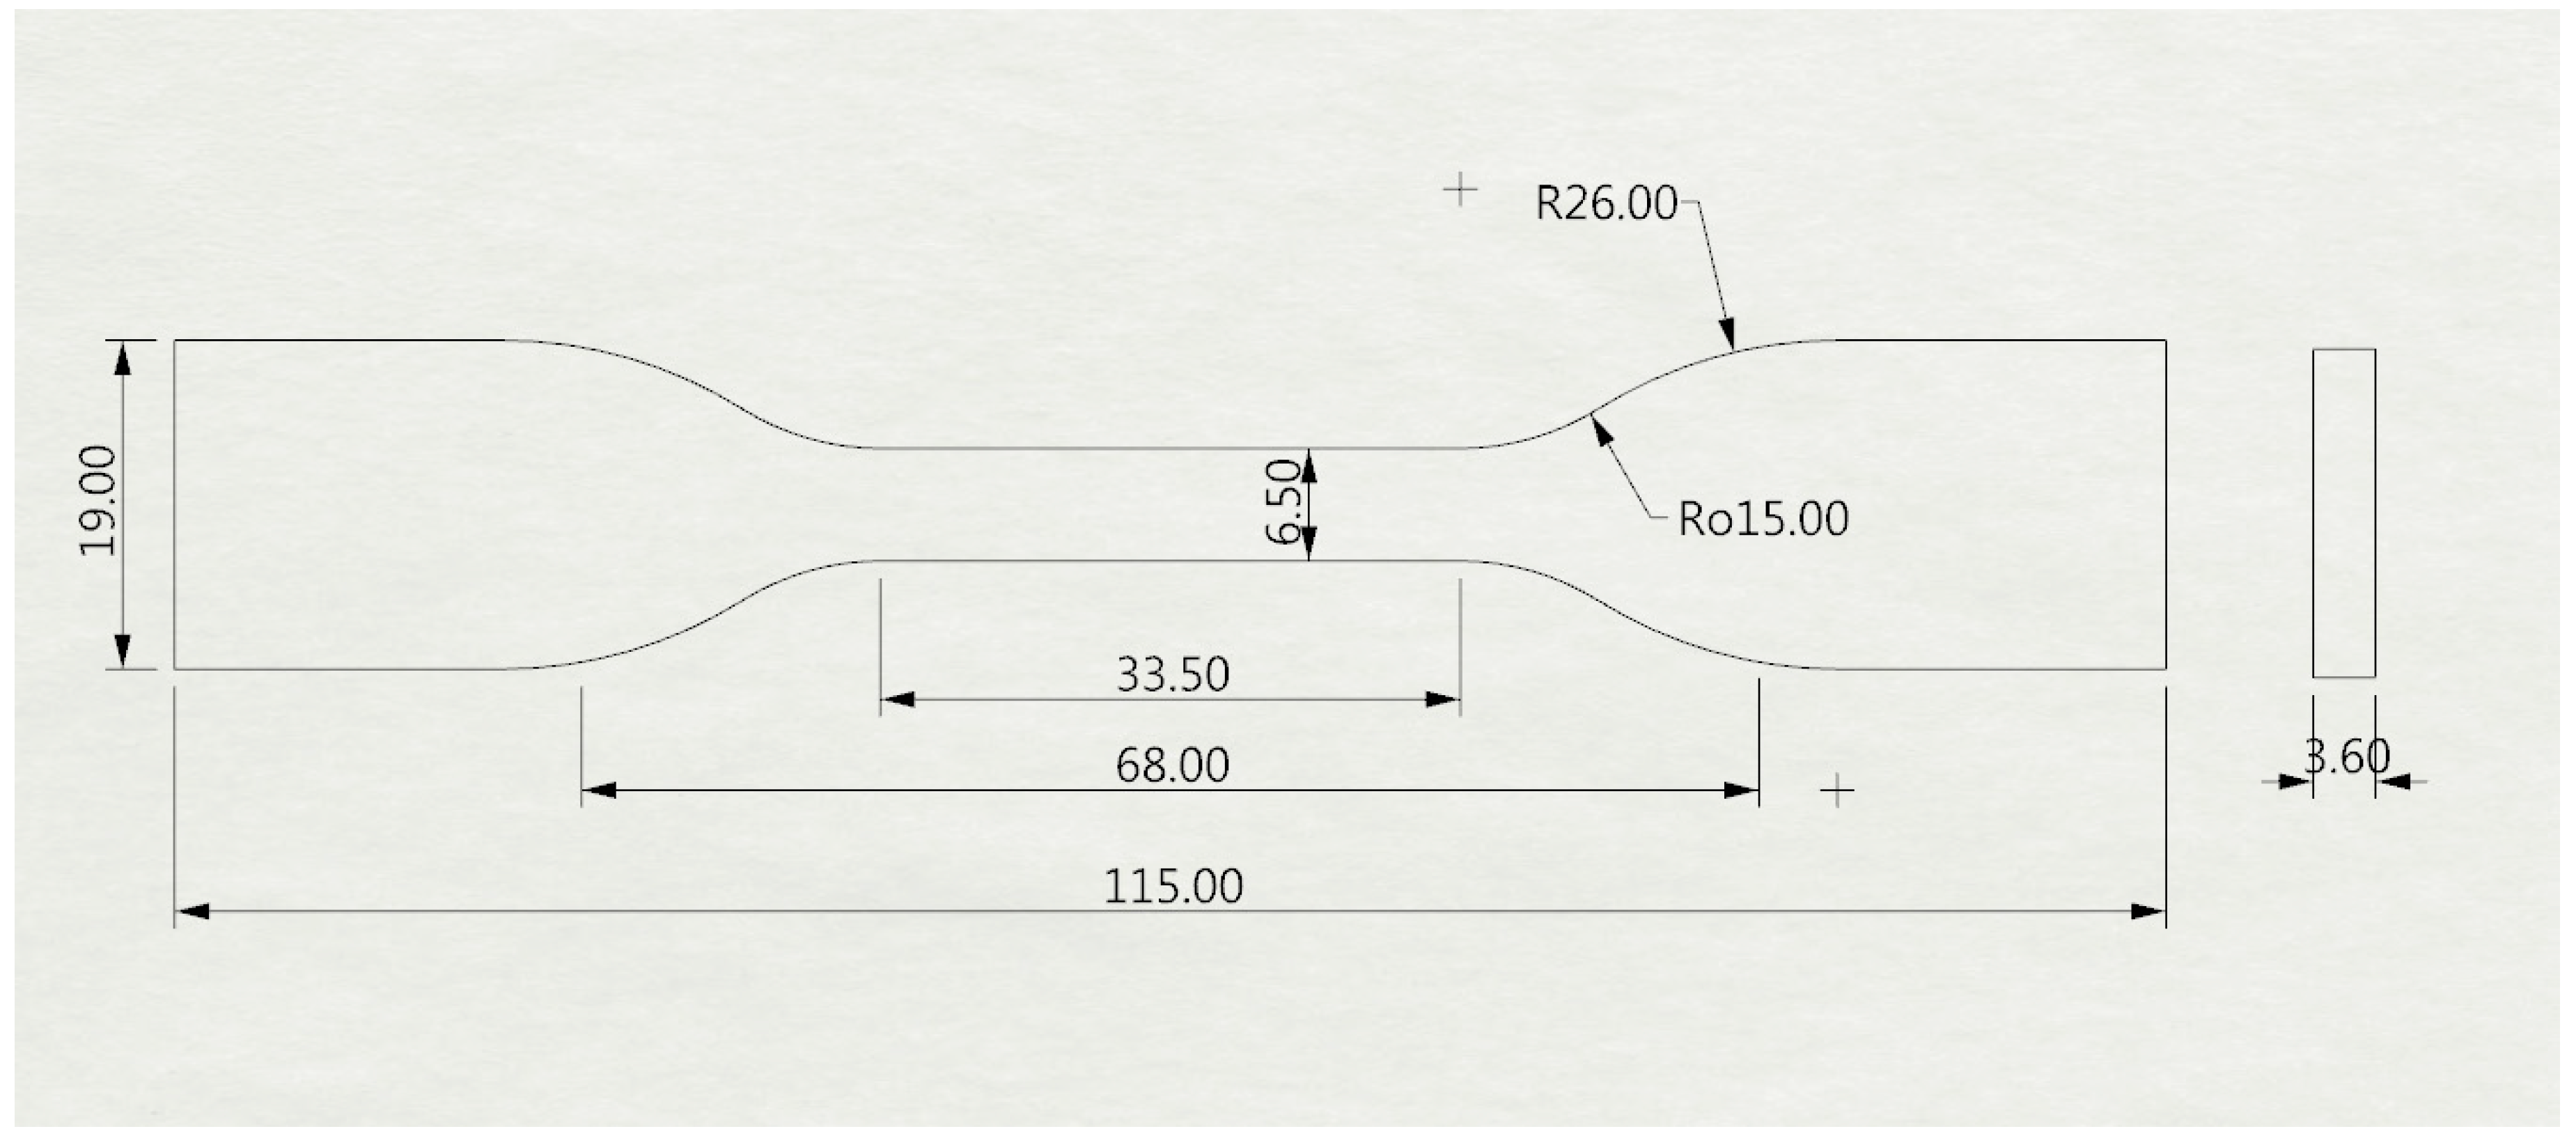
Test samples were fabricated by FDM. As mentioned above, two thermoplastics of ABS and PLA were used. The ABS samples were printed using Mojo manufactured by Stratasys. The PLA samples were fabricated using DP201 of Shindoh. The shape of the sample was based on ASTM D638 type IV, which was designed by 3D CAD software. Figure 1 shows the geometry of the sample.
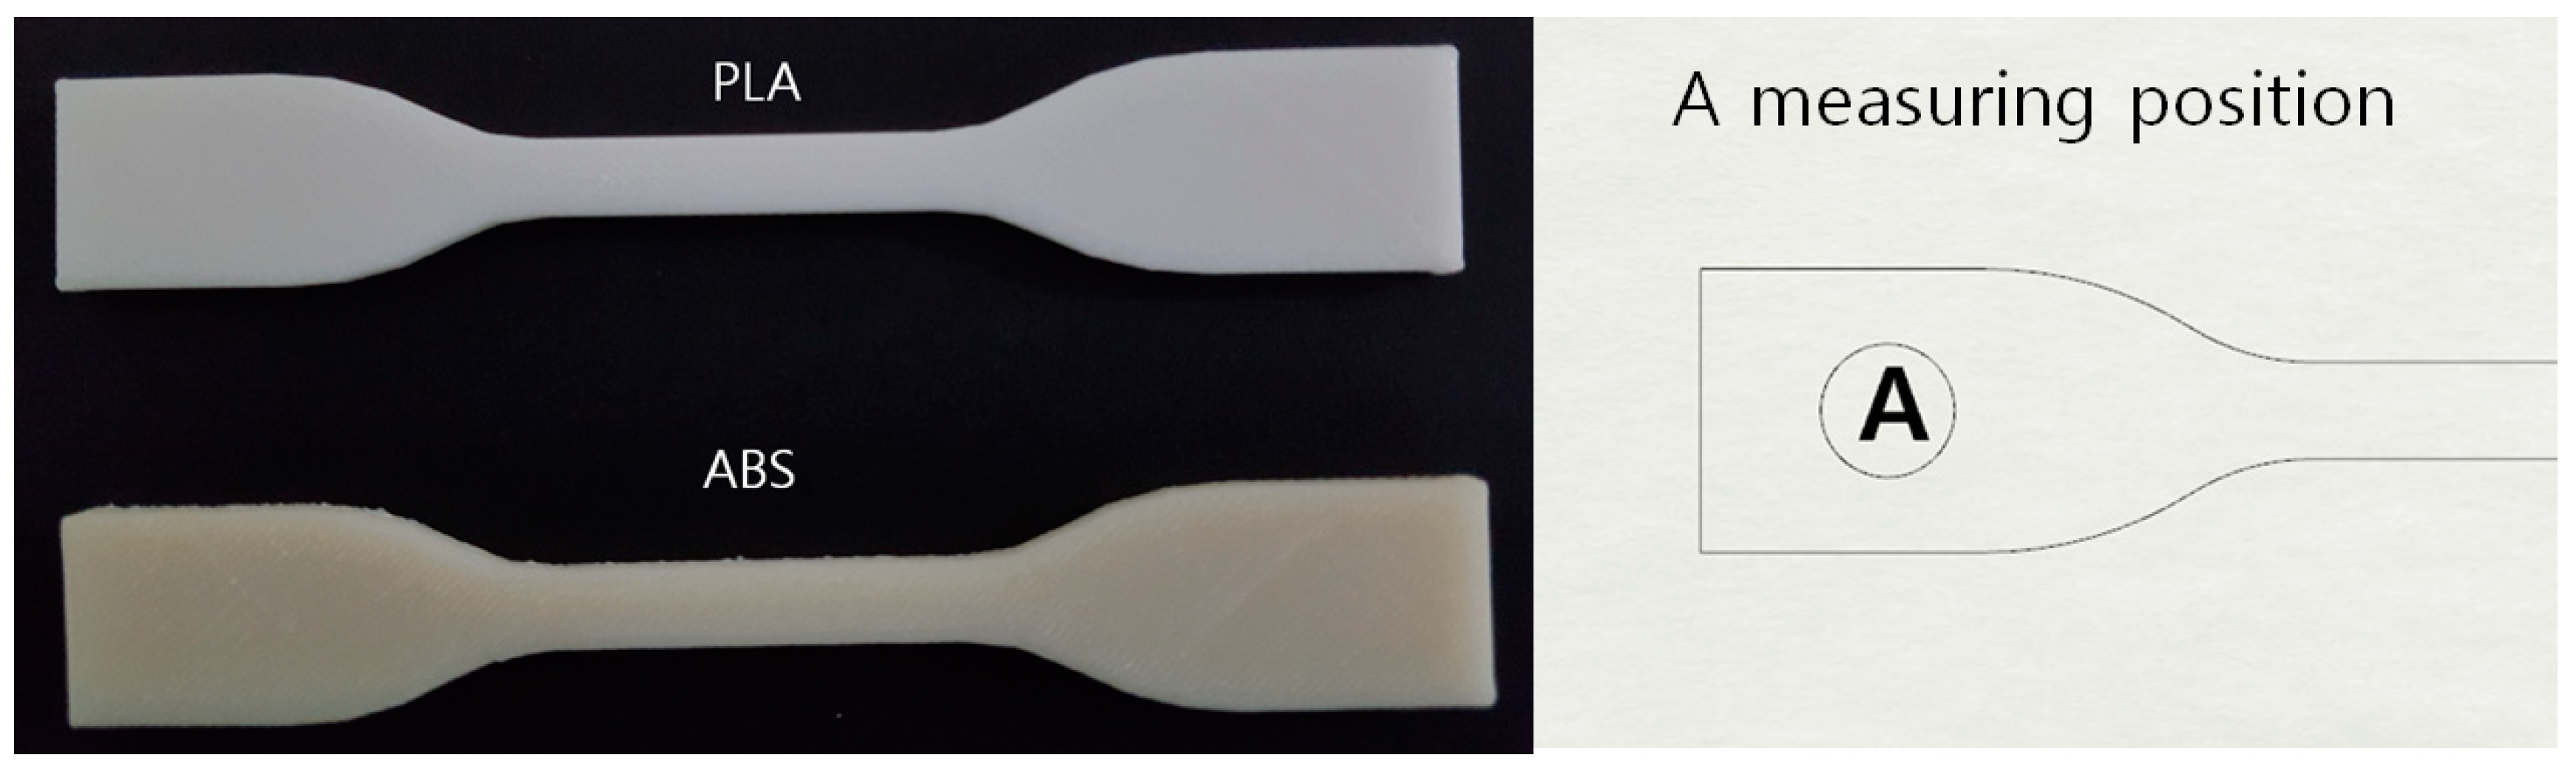
The CAD model was input data for the 3D printers. Infill density was set to be 100%. The printed ABS and PLA specimens are shown in Figure 2. A measuring position for the FTIR was defined to reduce unexpected noises occurred by surface roughness of different measuring positions.
2.2. High-Temperature Storage Test for Polymer Degradation
One time-consuming task is to observe the thermal degradation of thermoplastics at room temperature. To reduce the time, accelerated life testing has been suggested. One accelerated life test is the high-temperature storage test, which was used in this study. The degradation of polymers including thermoplastics is highly sensitive to ambient temperature [13]. SH-662 made of ESPEC was used as a storage chamber. The test can be performed to determine the effects of time and temperature for the degradation phenomenon. In this study, the time and temperature were set to 24 h and 160 °C. Therefore, four groups were prepared: ABS, degraded ABS, PLA, and degraded PLA specimens.
2.3. Fourier Transform Infrared Spectroscopy
In this study, a Nicolet iS10 manufactured by Thermo Fisher Scientific (168 Third Avenue Waltham, MA, USA 02451) was used to obtain the infrared spectrum of the 3D-printed ABS and PLA samples. On the predefined position, the FTIR spectrum could be obtained. The number of data points for each FTIR measurement was 6948. The number of repetitions per specimen was 50. Figure 3 shows 50 repetitions per location for an ABS sample. The x-axis and y-axis represent wavenumber and absorbance.
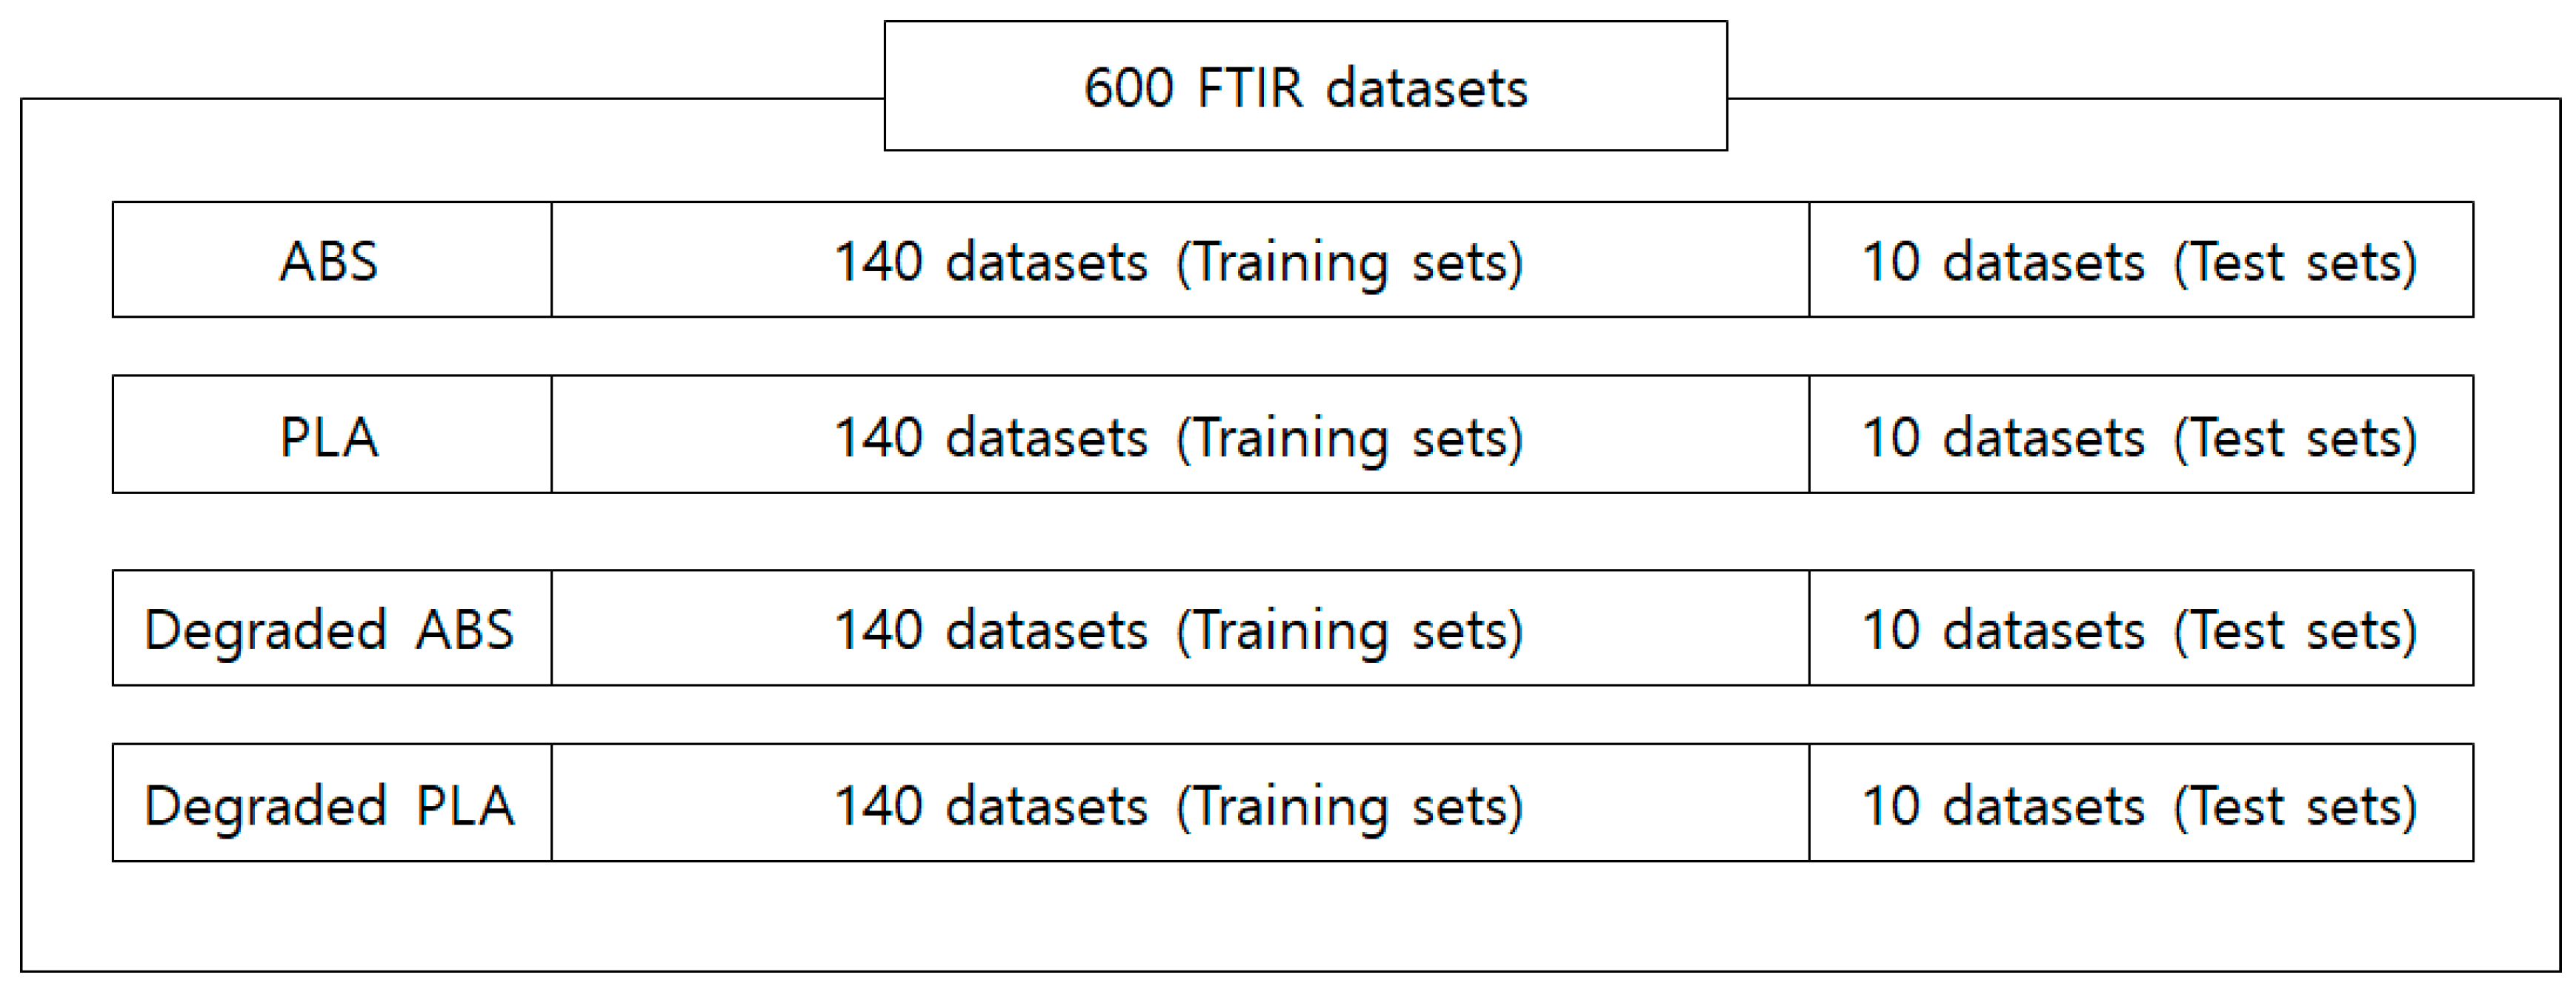
Three specimens were prepared for each split. The total number of datasets was 600 for ANNs, as shown in Figure 4. Among all datasets, 10 datasets per split were used as validation sets for the ANNs, and the other datasets were used as training sets.
2.4. Artificial Neural Networks (ANNs)
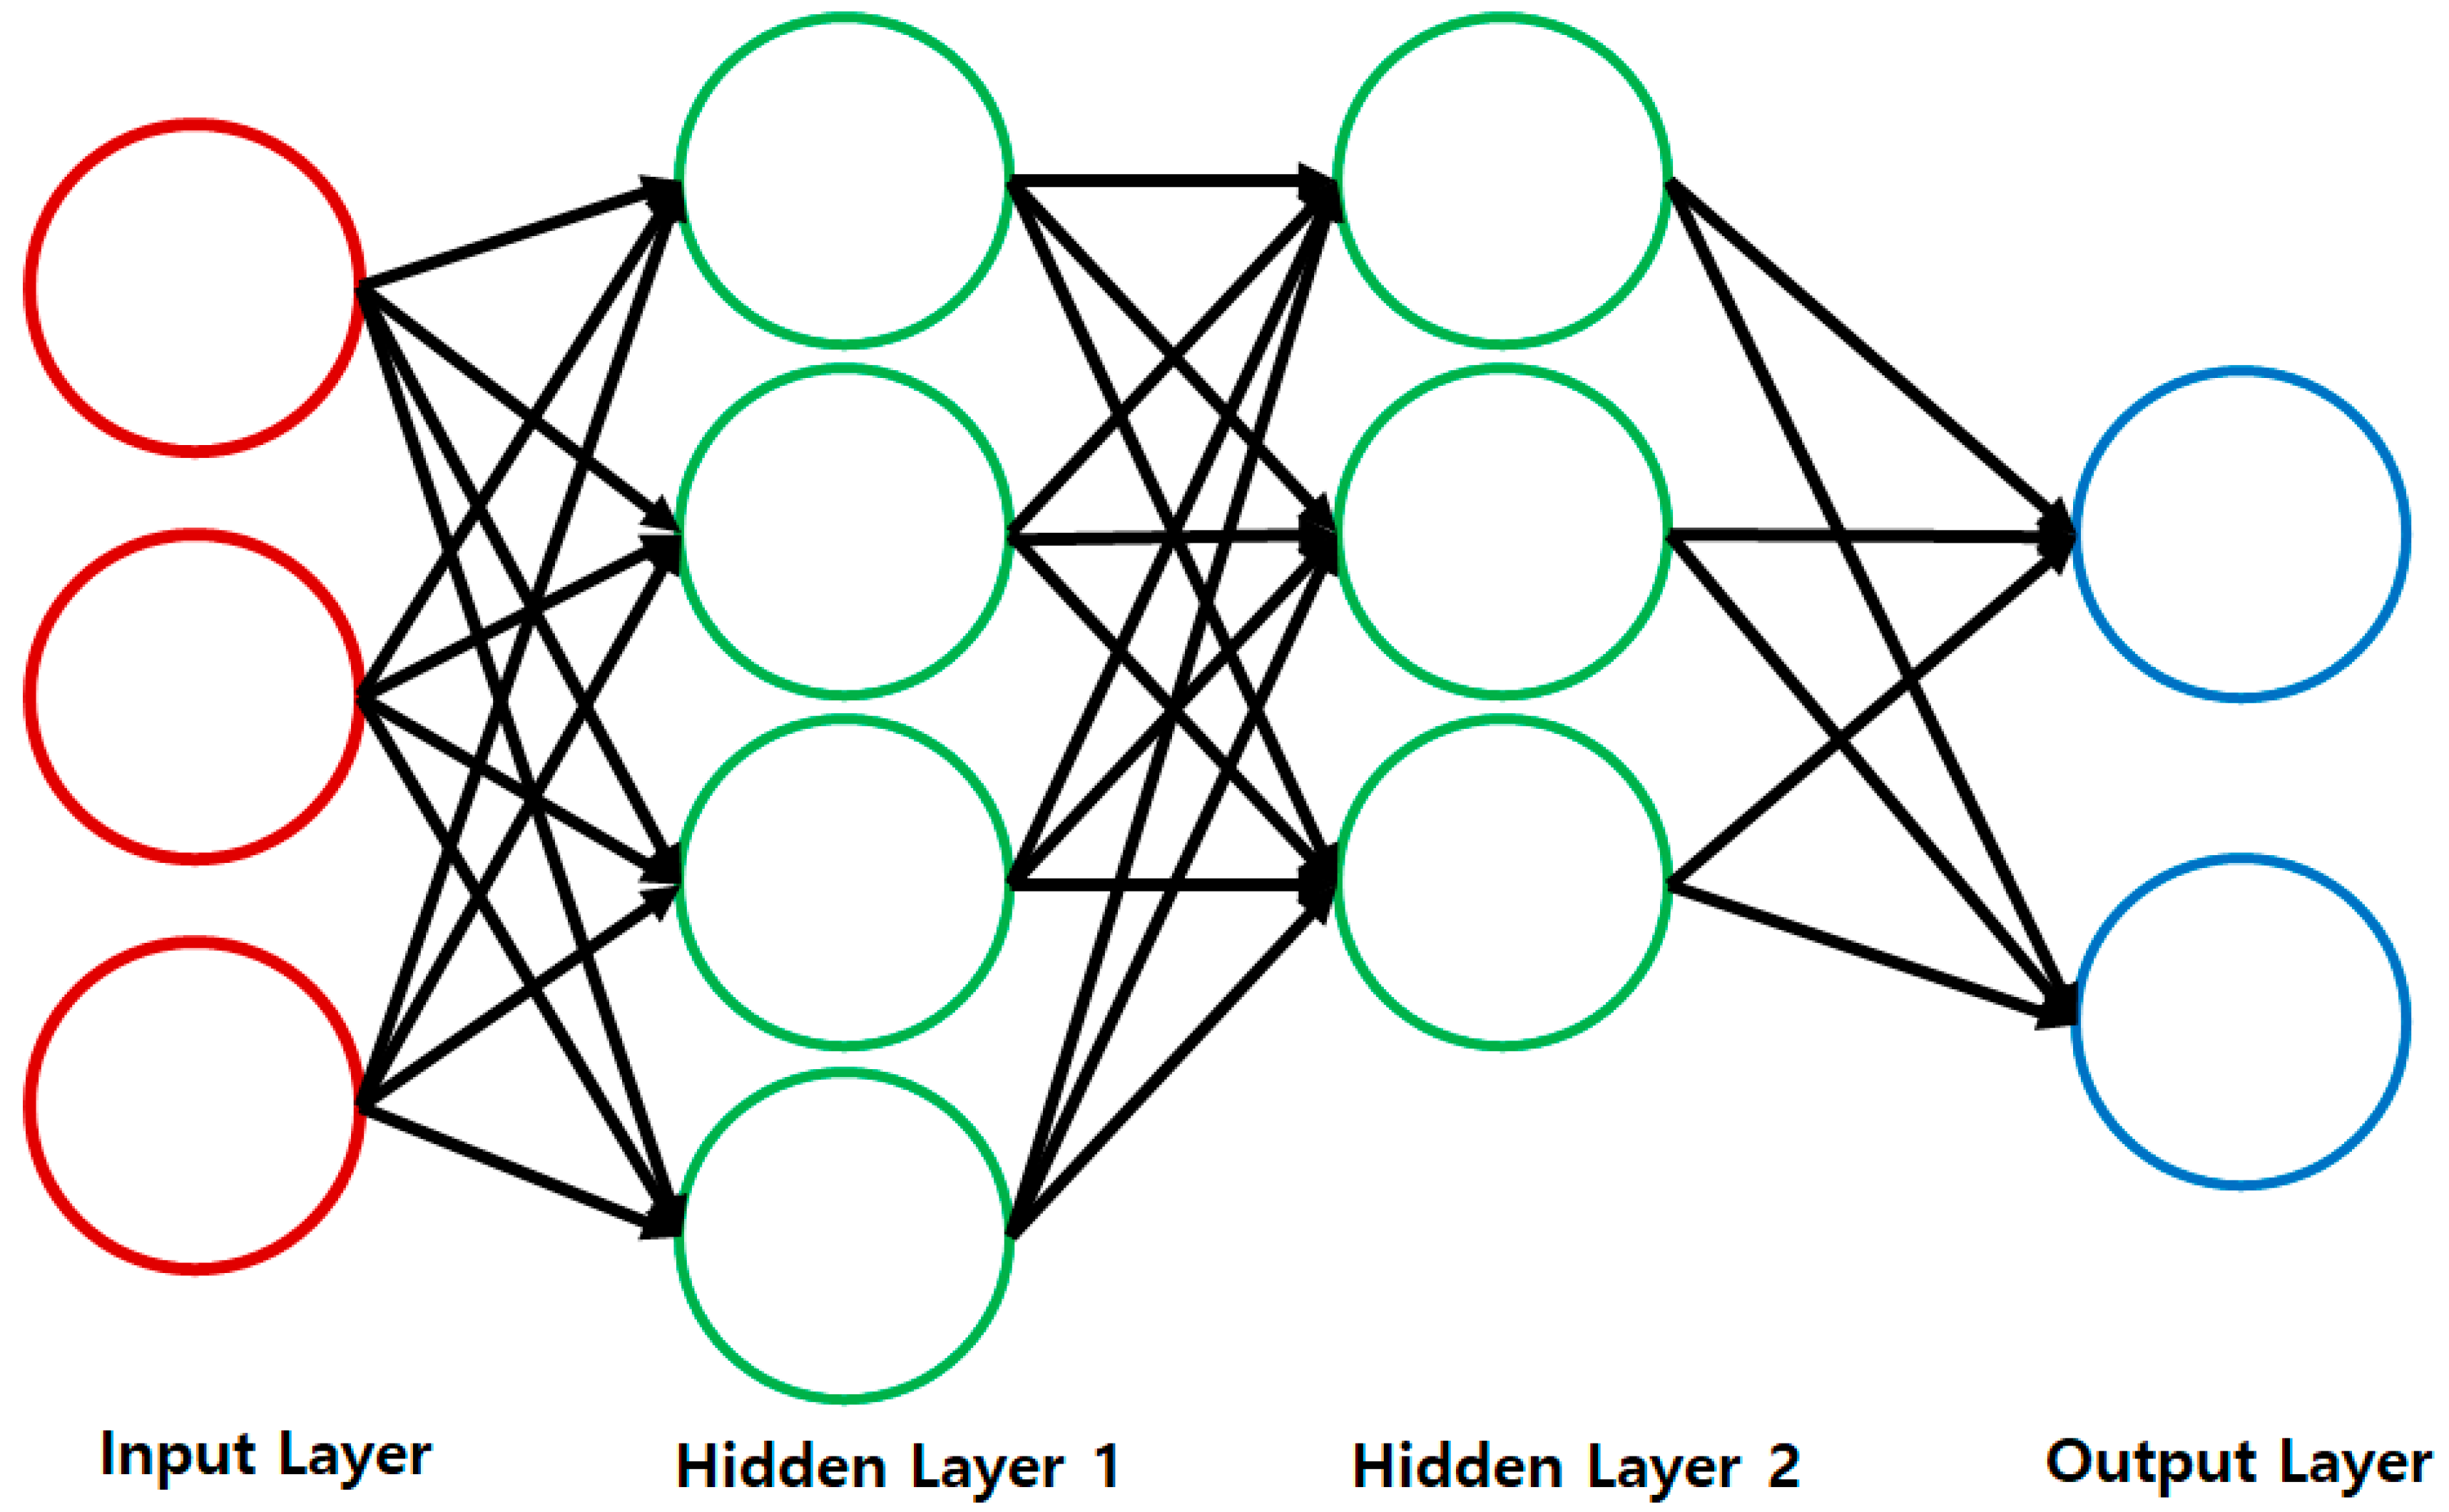
ANNs, also called multi-layer perceptions, are computing systems mimicked by biological neural networks, which is graphically shown in Figure 5.
An ANN is an interconnected group of nodes. The node is called an artificial neuron that receives the input signal, processes it, and transmits the output signal to its neighboring neurons. Signal processing, which is also called as propagation, transformation, a transfer function, or an activation function, is mathematically implemented. Figure 6 shows a sigmoid function (Sigmoid), a hyperbolic function (TanH), and a rectifier linear unit function (ReLU) as the activation function. In this study, the ReLU [14] was used.
ANNs have three representing layers: the input layer, the hidden layer, and the output layer. The number of hidden layers can be changed. When the number of hidden layers is more than two, the ANNs are defined as a deep neural network. In this study, the numbers of neurons and hidden layers were control parameters during the deep learning process, and this allowed us to observe the tendency toward accuracy for the classification. In addition, the ANN models were generated by the following rules.
- The size of the input layer and that of the output layer are 6948 and 4.
- The size of the hidden layers are between the size of the input layer and that of the output layer.
- The number of hidden neurons is one half of the number of neurons in the previous hidden layer.
3. Results and Discussion
3.1. Input Datasets for ANNs
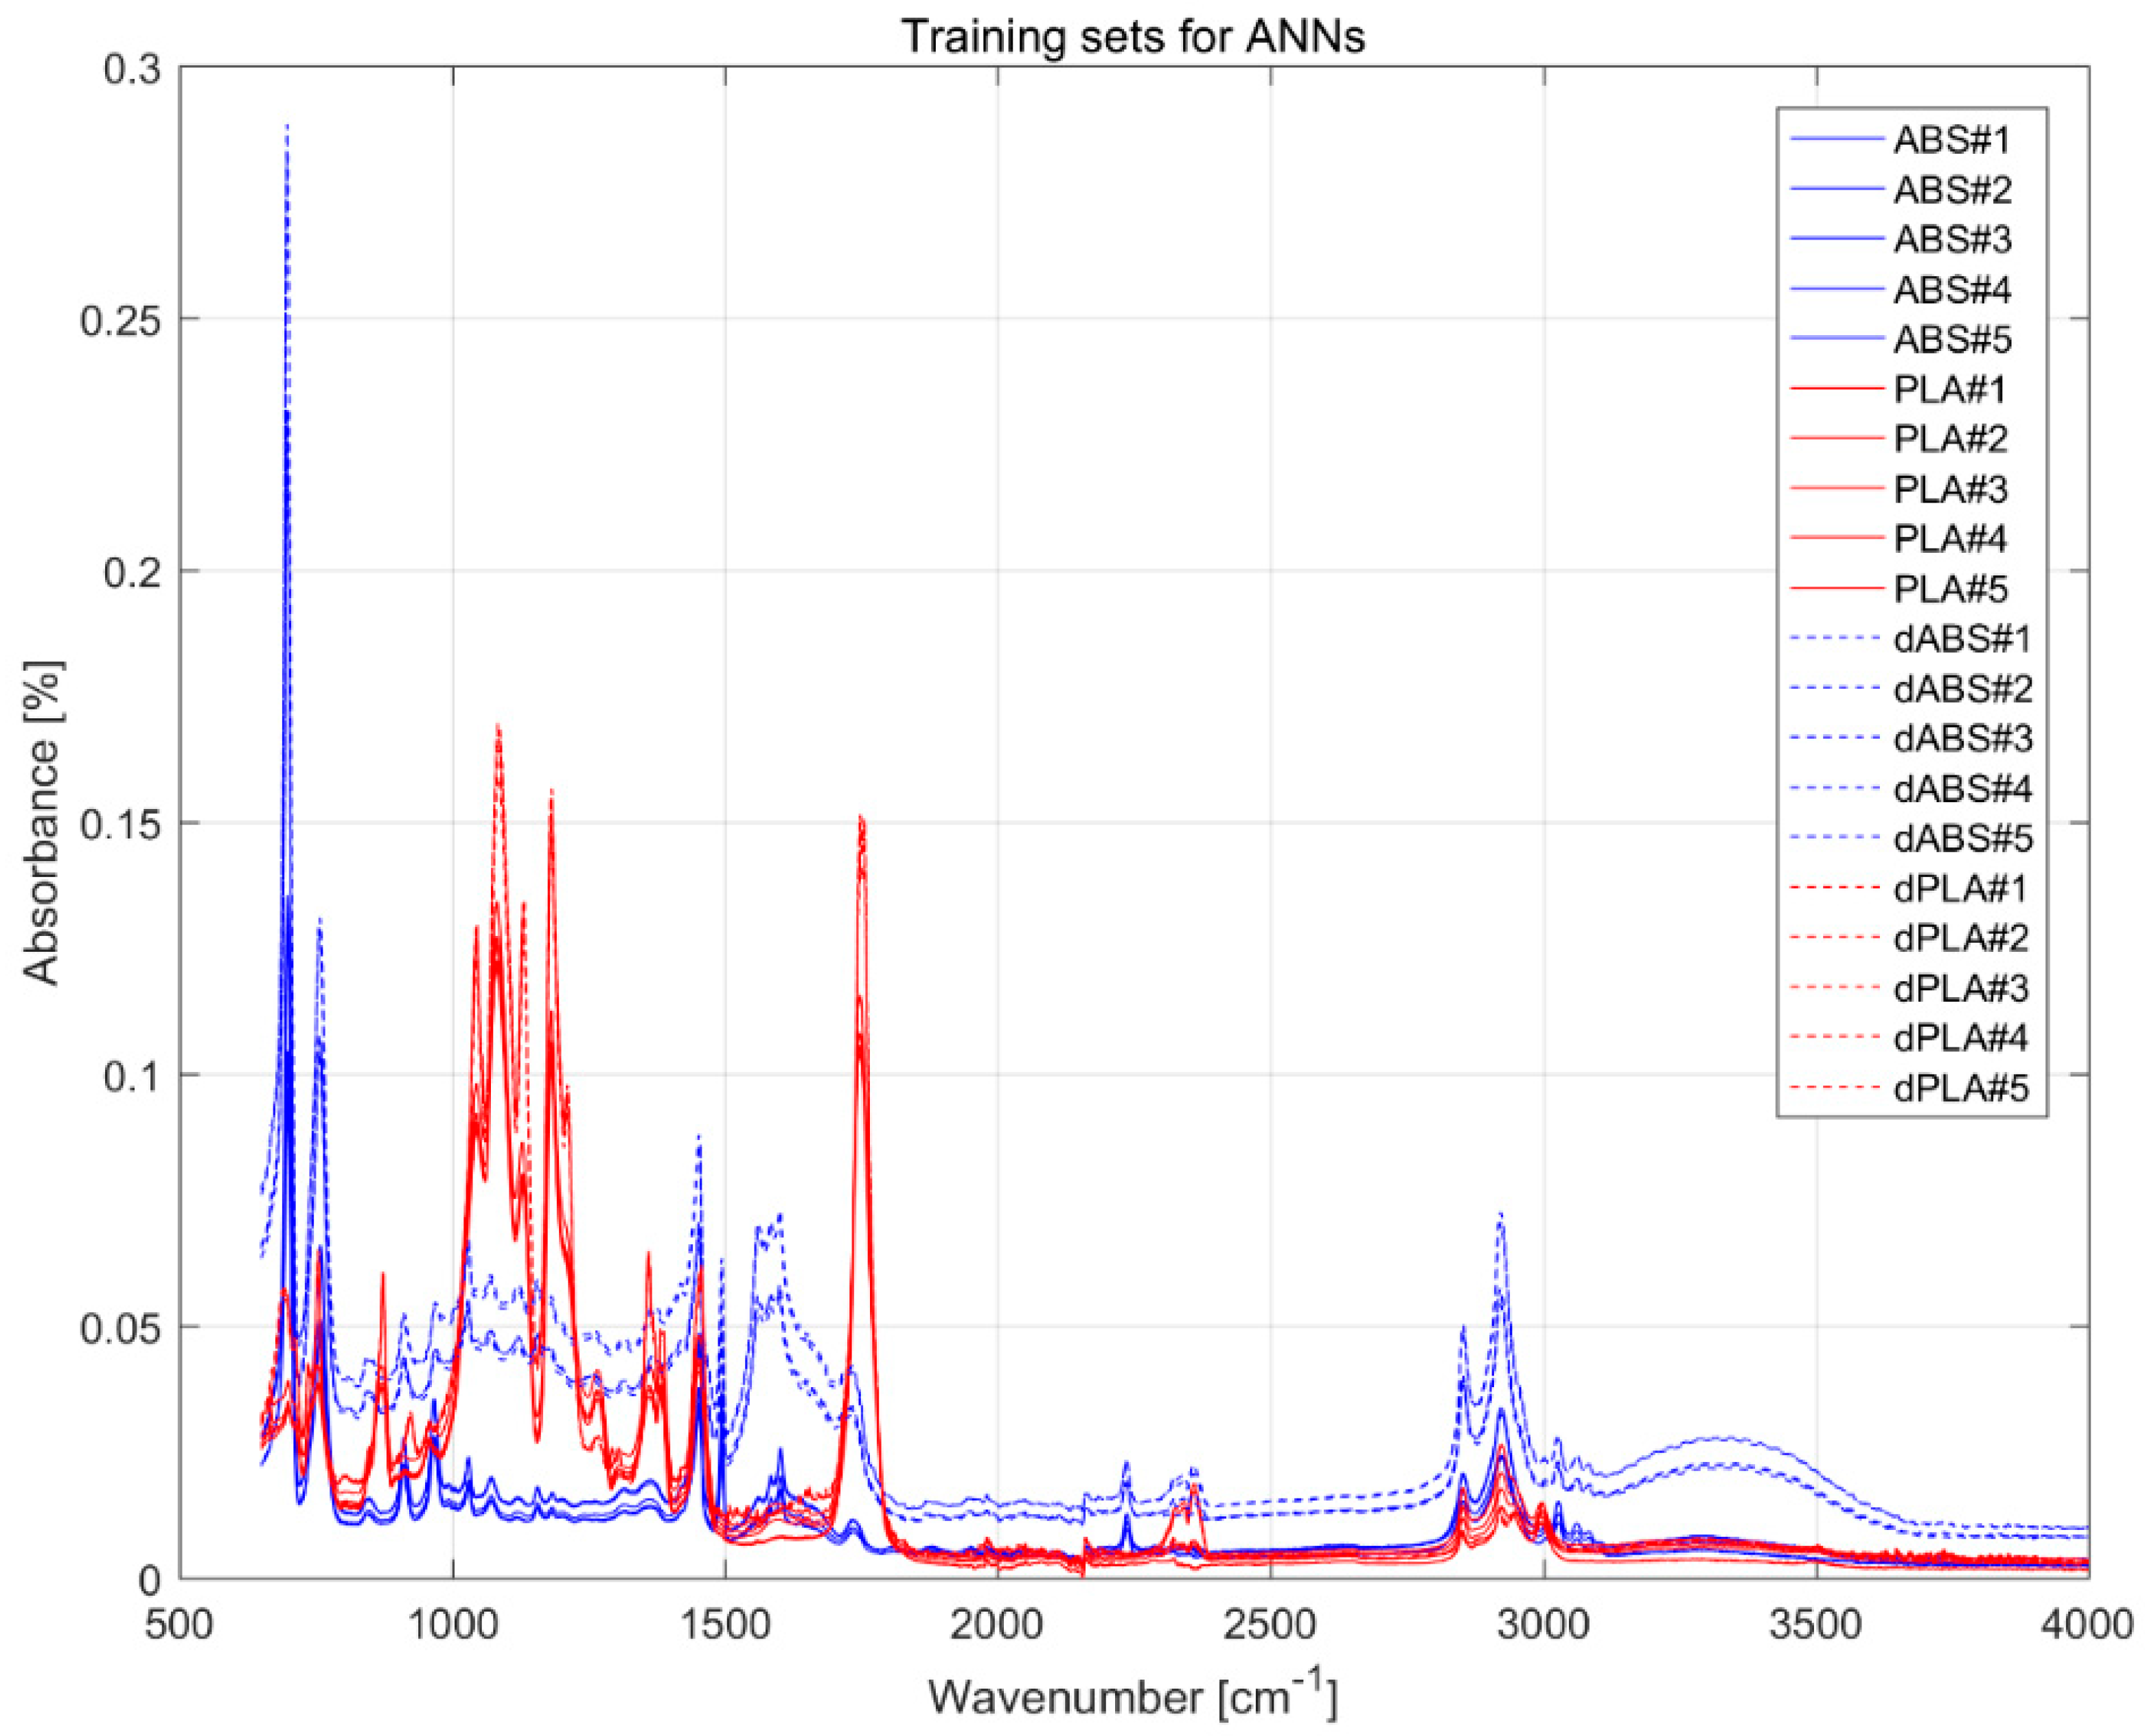
After performing the high-temperature storage test, degraded specimens were obtained as shown in Figure 7. The color of the specimens was changed by the accelerated life test. The FTIR measurement was performed on the prescribed position. Figure 8 shows five FTIR measurements per split. In this figure, dABS and dPLA denote the degraded ABS specimen and the degrade PLA specimen. Other researchers have reported characteristic bands for thermal effects. In the case of ABS, the thermal degradation makes the absorption peaks for alkenes and aromatic compounds increase [9]. The characteristic bands of alkenes and aromatic compounds are 3074 cm−1, 1630 cm−1, 910 cm−1, 3033 cm−1, 1496 cm−1, and 698 cm−1. Carrasco et al. [15] reported that the characteristic bands for PLA are related to crystalline structure, which are 1207 cm−1, and 920 cm−1. However, the IR spectra for PLA and dPLA are hard to be distinguished from each other using classical interpretation methods. When the IR spectra are measured, noise factors involved in the spectra are inevitable, which are typically caused by measurers, the environment, and so on. Noise factors can lead to misinterpretation of spectra. The methodology using ANNs might help to correctly interpret the IR spectra involving various noise factors.
3.2. Validation of ANN Models
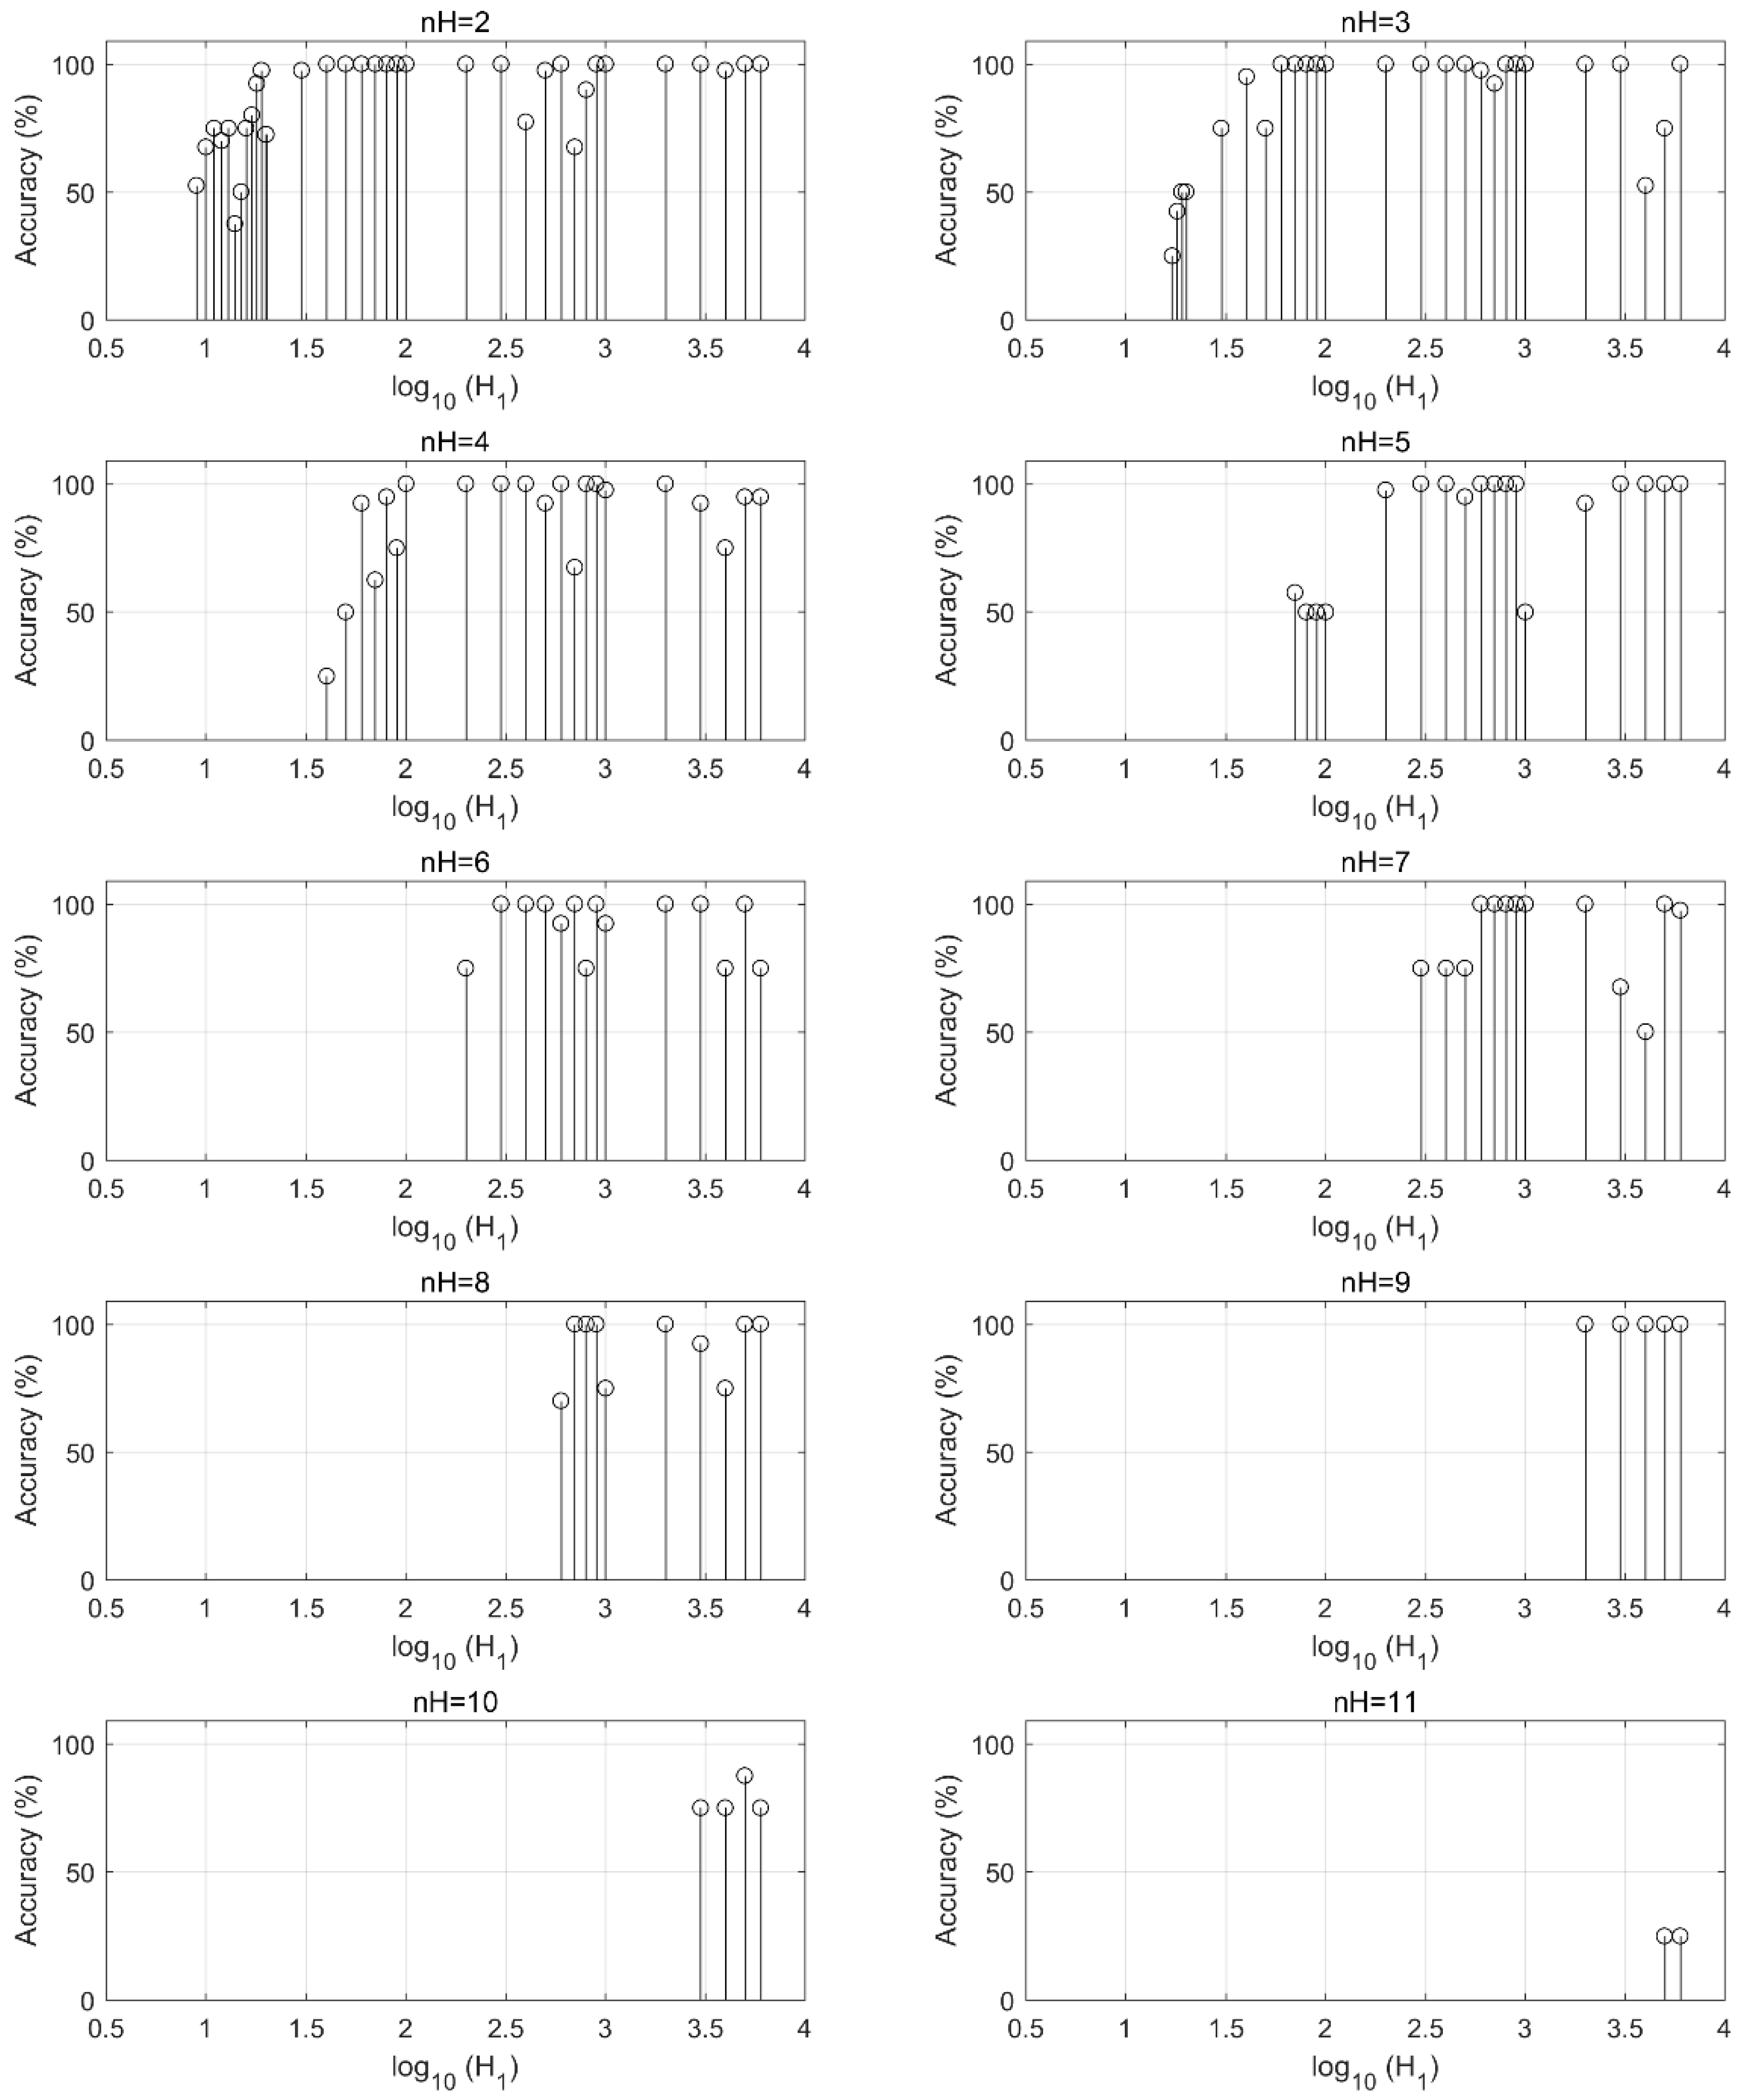
Several ANN models were trained using the 560 training sets and validated for 40 test sets. First, ANN models with two hidden layers were validated, as shown in the first graph of Figure 9. In the graph, nH means the number of the hidden layers. The x-axis represents the size of the first hidden layer, which is denoted as H1. The y-axis describes the average points for the test sets, which is related to the accuracy of the ANN model. When the size of the first hidden layer is 6000, the accuracy of the ANN model is 100%. However, the accuracy of the ANN model becomes 97.5% when the size of the hidden layer is 4000. Similarly, the number of the hidden layers increased from 2 to 11, so all generated ANN models were validated. In the case of the ANN models with 11 hidden layers, the size of the 11th hidden layer became 5 or 6, even though the number of the first layer’s hidden neurons was 5000 or 6000. When the number of hidden layers was 9, the accuracies of all generated ANN models were 100%.
4. Conclusions and Future Work
Under the given data, this study demonstrates that the thermal degradation of the 3D printing thermoplastics of ABS and PLA can be classified using FTIR and ANNs. As the numbers of neurons and hidden layers of ANN models varied, the accuracies of the ANN models were changed. When the ANN models had nine hidden layers, the best results were expected under the given data and rules. To expand and enhance this approach, the other 3D printing thermoplastics of PA, HIPS, TPE, and so on could be applied, test conditions of thermal degradation could be altered in terms of time and temperature, and the numerical parameters of the ANN models could be varied to optimize this methodology. In this study, the high-temperature storage test was performed with only one test condition. The time and the temperature were set to 24 h and 160 °C. To evaluate this methodology more precisely, accelerated life testing under the given conditions should be performed. Two control parameters for ANNs were of focus here, which were the numbers of neurons and hidden layers. As the ANNs are based on optimization, several parameters of this problem, such as learning rate, optimization algorithm, and so on, could act as control factors. Moreover, several activation functions need to be evaluated to optimize this methodology. These issues will be considered in further studies.
Funding
This research received no external funding.
Acknowledgements
This work was supported by the National Research Foundation of Korea (NRF) grant funded by the Korea government (MSIT) (No. NRF-2017R1C1B5074219).
Conflicts of Interest
There are no financial and commercial conflicts of interest in this study.
References
- Gao, W.; Zhang, Y.; Ramanujan, D.; Ramani, K.; Chen, Y.; Williams, C.B.; Wang, C.C.L.; Shin, Y.C.; Zhang, S.; Zavattieri, P.D. The status, challenges, and future of additive manufacturing in engineering. Comput. Des. 2015, 69, 65–89. [Google Scholar] [CrossRef]
- Chen, L.; He, Y.; Yang, Y.; Niu, S.; Ren, H. The research status and development trend of additive manufacturing technology. Int. J. Adv. Manuf. Technol. 2017, 89, 3651–3660. [Google Scholar] [CrossRef]
- Pan, J.; Wang, Y.; Feng, S.S. Formulation, characterization, and in vitro evaluation of quantum dots loaded in poly(Lactide)-Vitamin E TPGS nanoparticles for cellular and molecular imaging. Biotechnol. Bioeng. 2008, 101, 622–633. [Google Scholar] [CrossRef] [PubMed]
- Song, W.; Zheng, Z.; Lu, H.; Wang, X. Incorporation of multi-walled carbon nanotubes into biodegradable telechelic prepolymers. Macromol. Chem. Phys. 2008, 209, 315–321. [Google Scholar] [CrossRef]
- Wu, C.S.; Liao, H.T. Modification of biodegradable polylactide by silica and wood flour through a sol-gel process. J. Appl. Polym. Sci. 2008, 109, 2128–2138. [Google Scholar] [CrossRef]
- Chaunier, L.; Leroy, E.; Della Valle, G.; Dalgalarrondo, M.; Bakan, B.; Marion, D.; Madec, B.; Lourdin, D. 3D printing of maize protein by fused deposition modeling. AIP Conf. Proc. 2017, 1914, 190003. [Google Scholar] [CrossRef] [Green Version]
- Semba, T.; Kitagawa, K.; Ishiaku, U.S.; Hamada, H. The effect of crosslinking on the mechanical properties of polylactic acid/polycaprolactone blends. J. Appl. Polym. Sci. 2006, 101, 1816–1825. [Google Scholar] [CrossRef]
- Holland, B.J.; Hay, J.N. Thermal degradation of nylon polymers. Polym. Int. 2000, 49, 943–948. [Google Scholar] [CrossRef]
- Liu, G.; Liao, Y.; Ma, X. Thermal behavior of vehicle plastic blends contained acrylonitrile-butadiene-styrene (ABS) in pyrolysis using TG-FTIR. Waste Manag. 2017, 61, 315–326. [Google Scholar] [CrossRef] [PubMed]
- Ellis, D.I.; Broadhurst, D.; Goodacre, R. Rapid and quantitative detection of the microbial spoilage of beef by Fourier transform infrared spectroscopy and machine learning. Anal. Chim. Acta 2004, 514, 193–201. [Google Scholar] [CrossRef] [Green Version]
- Argyri, A.A.; Panagou, E.Z.; Tarantilis, P.A.; Polysiou, M.; Nychas, G.J.E. Rapid qualitative and quantitative detection of beef fillets spoilage based on Fourier transform infrared spectroscopy data and artificial neural networks. Sens. Actuators B. Chem. 2010, 145, 146–154. [Google Scholar] [CrossRef] [Green Version]
- Sattlecker, M.; Baker, R.; Stone, N.; Bessant, C. Support vector machine ensembles for breast cancer type prediction from mid-FTIR micro-calcification spectra. Chemom. Intell. Lab. Syst. 2011, 107, 363–370. [Google Scholar] [CrossRef]
- Hancox, N.L. Thermal effects on polymer matrix composites: Part 2. Thermal degradation. Mat. Design 1998, 19, 93–97. Available online: https://www.scopus.com/record/display.uri?eid=2-s2.0-0032105161&origin=resultslist&sort=cp-f&src=s&st1=The+degradation+of+polymers+thermoplastics+ambient+temperature+condition+&st2=&sid=d2adf8641efbf71f603a9005d37b2c8f&sot=b&sdt=b&sl=88&s=TITLE-ABS-KEY%28 (accessed on 20 March 2018). [CrossRef]
- Nair, V.; Hinton, G.E. Rectified Linear Units Improve Restricted Boltzmann Machines. In Proceedings of the 27th International Conference on Machine Learning (ICML-10), Haifa, Israel, 21–24 June 2010; pp. 807–814. [Google Scholar]
- Carrasco, F.; Pagès, P.; Gámez-Pérez, J.; Santana, O.O.; Maspoch, M.L. Processing of poly(lactic acid): Characterization of chemical structure, thermal stability and mechanical properties. Polym. Degrad. Stable. 2010, 95, 116–125. [Google Scholar] [CrossRef]
Figure 1.
ASTM D638 Type IV.

Figure 2.
Polylactic acid (PLA) and acrylonitrile butadiene styrene (ABS) specimens fabricated by 3D printers and the measuring position for the Fourier transform infrared (FTIR) method.
Figure 2.
Polylactic acid (PLA) and acrylonitrile butadiene styrene (ABS) specimens fabricated by 3D printers and the measuring position for the Fourier transform infrared (FTIR) method.

Figure 3.
The 50 FTIR datasets per a 3D-printed ABS specimen.

Figure 4.
Description of FTIR datasets.

Figure 5.
A model of artificial neural networks (ANNs).

Figure 6.
Activation functions.

Figure 7.
Activation functions.

Figure 8.
Twenty training sets for ANNs.

Figure 9.
Accuracies of ANN models in the change of the number of hidden layers.

© 2018 by the author. Licensee MDPI, Basel, Switzerland. This article is an open access article distributed under the terms and conditions of the Creative Commons Attribution (CC BY) license (http://creativecommons.org/licenses/by/4.0/).
Share and Cite
MDPI and ACS Style
Zhang, S.-U. Degradation Classification of 3D Printing Thermoplastics Using Fourier Transform Infrared Spectroscopy and Artificial Neural Networks. Appl. Sci. 2018, 8, 1224. https://doi.org/10.3390/app8081224
AMA Style
Zhang S-U. Degradation Classification of 3D Printing Thermoplastics Using Fourier Transform Infrared Spectroscopy and Artificial Neural Networks. Applied Sciences. 2018; 8(8):1224. https://doi.org/10.3390/app8081224
Chicago/Turabian StyleZhang, Sung-Uk. 2018. "Degradation Classification of 3D Printing Thermoplastics Using Fourier Transform Infrared Spectroscopy and Artificial Neural Networks" Applied Sciences 8, no. 8: 1224. https://doi.org/10.3390/app8081224
Note that from the first issue of 2016, this journal uses article numbers instead of page numbers. See further details here.