Quantitative Phase Imaging for Label-Free Analysis of Cancer Cells—Focus on Digital Holographic Microscopy


1
Department of Biomedical Science, Health and Society, Malmö University, 205 06 Malmö, Sweden
2
Institute Italiano di Tecnologia, 16163 Genua, Italy
*
Author to whom correspondence should be addressed.
Appl. Sci. 2018, 8(7), 1027; https://doi.org/10.3390/app8071027
Submission received: 31 May 2018
/
Revised: 15 June 2018
/
Accepted: 20 June 2018
/
Published: 23 June 2018
(This article belongs to the Special Issue Applications of Digital Holographic Microscopy)
Abstract
:To understand complex biological processes, scientists must gain insight into the function of individual living cells. In contrast to the imaging of fixed cells, where a single snapshot of the cell’s life is retrieved, live-cell imaging allows investigation of the dynamic processes underlying the function and morphology of cells. Label-free imaging of living cells is advantageous since it is used without fluorescent probes and maintains an appropriate environment for cellular behavior, otherwise leading to phototoxicity and photo bleaching. Quantitative phase imaging (QPI) is an ideal method for studying live cell dynamics by providing data from noninvasive monitoring over arbitrary time scales. The effect of drugs on migration, proliferation, and apoptosis of cancer cells are emerging fields suitable for QPI analysis. In this review, we provide a current insight into QPI applied to cancer research.
1. Introduction
A number of techniques are known to qualitatively convert phase changes to observable amplitude variations. Developed in the 1930s, the Phase Contrast (PC) microscope [1], uses a spatial filter and a phase plate to translate phase into intensity modulation. Since then, PC microscopy and its derivatives, Differential Interference Contrast (DIC) microscopy and Hoffman Modulation Contrast (HMC) microscopy, have become widely adopted as techniques for cellular observation. DIC uses two polarized light beams, which take slightly different paths through the microscopic sample. As their optical path lengths differ and as the beams are recombined, they interfere and thereby create a shadow effect at refractive index gradients [2]. HMC uses an off-axis slit plate and a spatial modulator to alternately attenuate or enhance scattered light, thus creating a bright and dark shadowing effect at refractive index gradients, whereas image areas of constant refractive index appear grey [3]. However, the images are non-quantitative, neither optimized for visualizing cells nor for performing measurements.
Quantitative phase imaging (QPI) methods use interference techniques to convert the phase information into pixel intensity, and in that way directly record the quantitative phase delay. Using QPI, studies associated with both thickness and refractive index fluctuations can be performed [4]. Previous work has been reviewed by Kemper et al., who described new ways of monitoring the cellular morphology changes in response to drugs [5], and by Kim et al. who presented a review of digital holography (DH), with emphasis on microscopy techniques and applications [6].
There are a number of different technical implementations of QPI; and, by convention, a variety of names have been used to describe what is here collectively referred to as QPI. Terms differ even in some cases for the same commercial product (Table 1). In this review, we use the term QPI to comprise all, and we let other notations denote specific variations of hardware configuration.
Optical methods are well suited for studying growth of both adherent single cells and cell clusters [15]. The study of single cells over longer periods of time requires non-disturbing measurement techniques, such as QPI [51]. QPI provides a quantitative measurement of intracellular structures without the need for artificial dyes or markers. By using only low intensity illumination, it is possible to perform imaging continuously and repeatedly at high capture frequency over the course of days or even weeks. Consequently, biological processes and live cell dynamics, which may occur infrequently, can still be captured at high sampling rate. If wide-field imaging methods are used, it is also possible to capture data of a large number of cells simultaneously. When combined with the ability to segment cell areas and perform temporal profiling of the image information of each cell, it is possible to monitor a large number of living cells over time. Indeed, in vitro studies monitoring the effects of new drugs on proliferation and migration of cancer cells are performed on a cell population level.
2. Technology
A complete description of the details of all possible technical setups of QPI is beyond the scope of this review; see Popescu et al. [4], Lee et al. [67], and Majeed et al. [68] for an overview of the details of commonly used technical setups, and Holden et al. [69] for an overview of available commercial systems. Important to note is that the different setups come with slightly different benefits and limitations, making them inherently well suited to a variety of purposes: High speed acquisition for high temporal resolution of flow imaging [70], in situ imaging of growing adherent cells [21,37,56], live cell tomography [71,72], or incubator monitoring [30,73].
Two of the most commonly used hardware configurations are DH in a separate path off-axis Mach-Zender configuration [4] and Spatial Light Interference Microscopy (SLIM) [74]. In this review, we refer to them as DH microscopy and SLIM, respectively.
Principles of QPI
Apart from a few early studies of biological imaging mounted on reflective surfaces, all QPI set-ups for bio-imaging examine the sample using transmitted light (Table 1). Transmission QPI is based on the interference between the light entering and exiting the sample. A separation between refracted light of the sample (the object beam) and the reference light (the reference beam) can be achieved using either spatial or temporal modulation. There are two types of spatial modulation: In-line holography and off-axis methods. The first type is based on interference of a weakly scattered beam from the object and an un-scattered incident beam [74]. For this optical instrument, the use of heavy algorithms is necessary for image reconstruction, because interferometric information overlaps with unwanted information.
In off-axis holography, the optical axis of the reference beam is slightly tilted with respect to the object beam. Thus, unwanted information can be spatially separated [75]. DH is a common off-axis holographic technique for the QPI of cells [31]. Here, a laser beam is spatially separated by a dichroic mirror. The object beam is diffracted by the cells and interferes with the reference beam at a slight angle at the recording sensor, where a fringe pattern characteristic of the object is created. The intensity distribution depends on the phase difference Δϕ [4]. Temporal modulation, or phase shifting interferometry, involves changing the phase of the reference beam with respect to the object beam. An example of temporal modulation is SLIM [76].
The reconstruction of the phase and amplitude images from the recorded interferometric pattern varies with the hardware set-up. Typically, it consists of one or several reconstruction stages using Fourier Transforms and a focal selection stage, followed by one or more post-processing calculations where modular phase recordings are unwrapped and edge effects removed [4]. The risk of introducing image artefacts in the unwrapping stage is reduced if the sample phase shift is less than one wavelength, or it can be avoided completely by imaging at several wavelengths, thus also allowing for imaging thicker specimens [73,77,78]. All image reconstruction and manipulation stages can be performed after capture, as the complete three-dimensional information of the sample is stored in the interferometric recording. The result is an image (Figure 1b) where pixel intensity is directly proportional to the phase shift (Equation (1), with wavelength and refractive index in optical path direction n(z) as parameters. The image is well suited for automated image analysis for two reasons. Firstly, the image background can be used to offset the phase shift and allow comparison between images. Secondly, the images themselves display intensity gradients at cellular boundaries, making it possible to segment the image and extract information on each imaged cell separately (Figure 1c).
All image reconstruction and manipulation stages can be performed after capture, as the complete three-dimensional information of the sample is stored in the interferometric recording. Despite these appealing traits, several challenges persist. Thick cellular coverage may make it difficult to establish image background, and the choice not to use dyes will also reduce the ability to artificially enhance image contrast or specific image content, such as highlighting a specific molecule or intracellular structure. As a consequence, QPI images of very thin cells or cell structures may be undetectable due to noise. The phase delay measured is directly related to cellular dry mass and is the only physical property measured. Using image analysis, it is possible to extract further information using the recorded two-dimensional mass distribution within each cell. As the phase delay is a property not always translatable to known biological properties, it can be difficult to compare QPI directly to well-known legacy methods. Instead, QPI images provides a new way of looking at cells with its own distinctive characteristics.
The phase delay measured is directly related to cellular dry mass (Equation (1) and is the only physical property measured. However, using image analysis, it is possible to extract further information using the recorded two-dimensional mass distribution within each cell. A number of studies have compared the results of QPI analyses with other methods: QPI for tissue imaging and histological analysis have been investigated using tissue from breast [68] and prostate [76,79]. The majority of QPI for studies of cell cultures have focused on cell count and/or cellular morphology (Table 1). As dry mass is independent of the intracellular water content, it can be a good indicator for cell growth. The ability to measure cell count was validated for the first time in 2008 by Mölder et al. [21], using human breast and prostate cancer cell lines, as well as a mouse fibroblast cell line. Measurement of cell growth has been well documented for both adherent and non-adherent cells [8,9,15,25,26,27,28,47,49,56,59,61]. By segmentation of cellular outlines, morphology and motility can also be studied [7,50,51,57,80]. Furthermore, differences in cell types can be detected if they display distinctly different morphologies or migration patterns in response to cytotoxic drugs [30,81,82].
3. Cell Death Studies with QPI
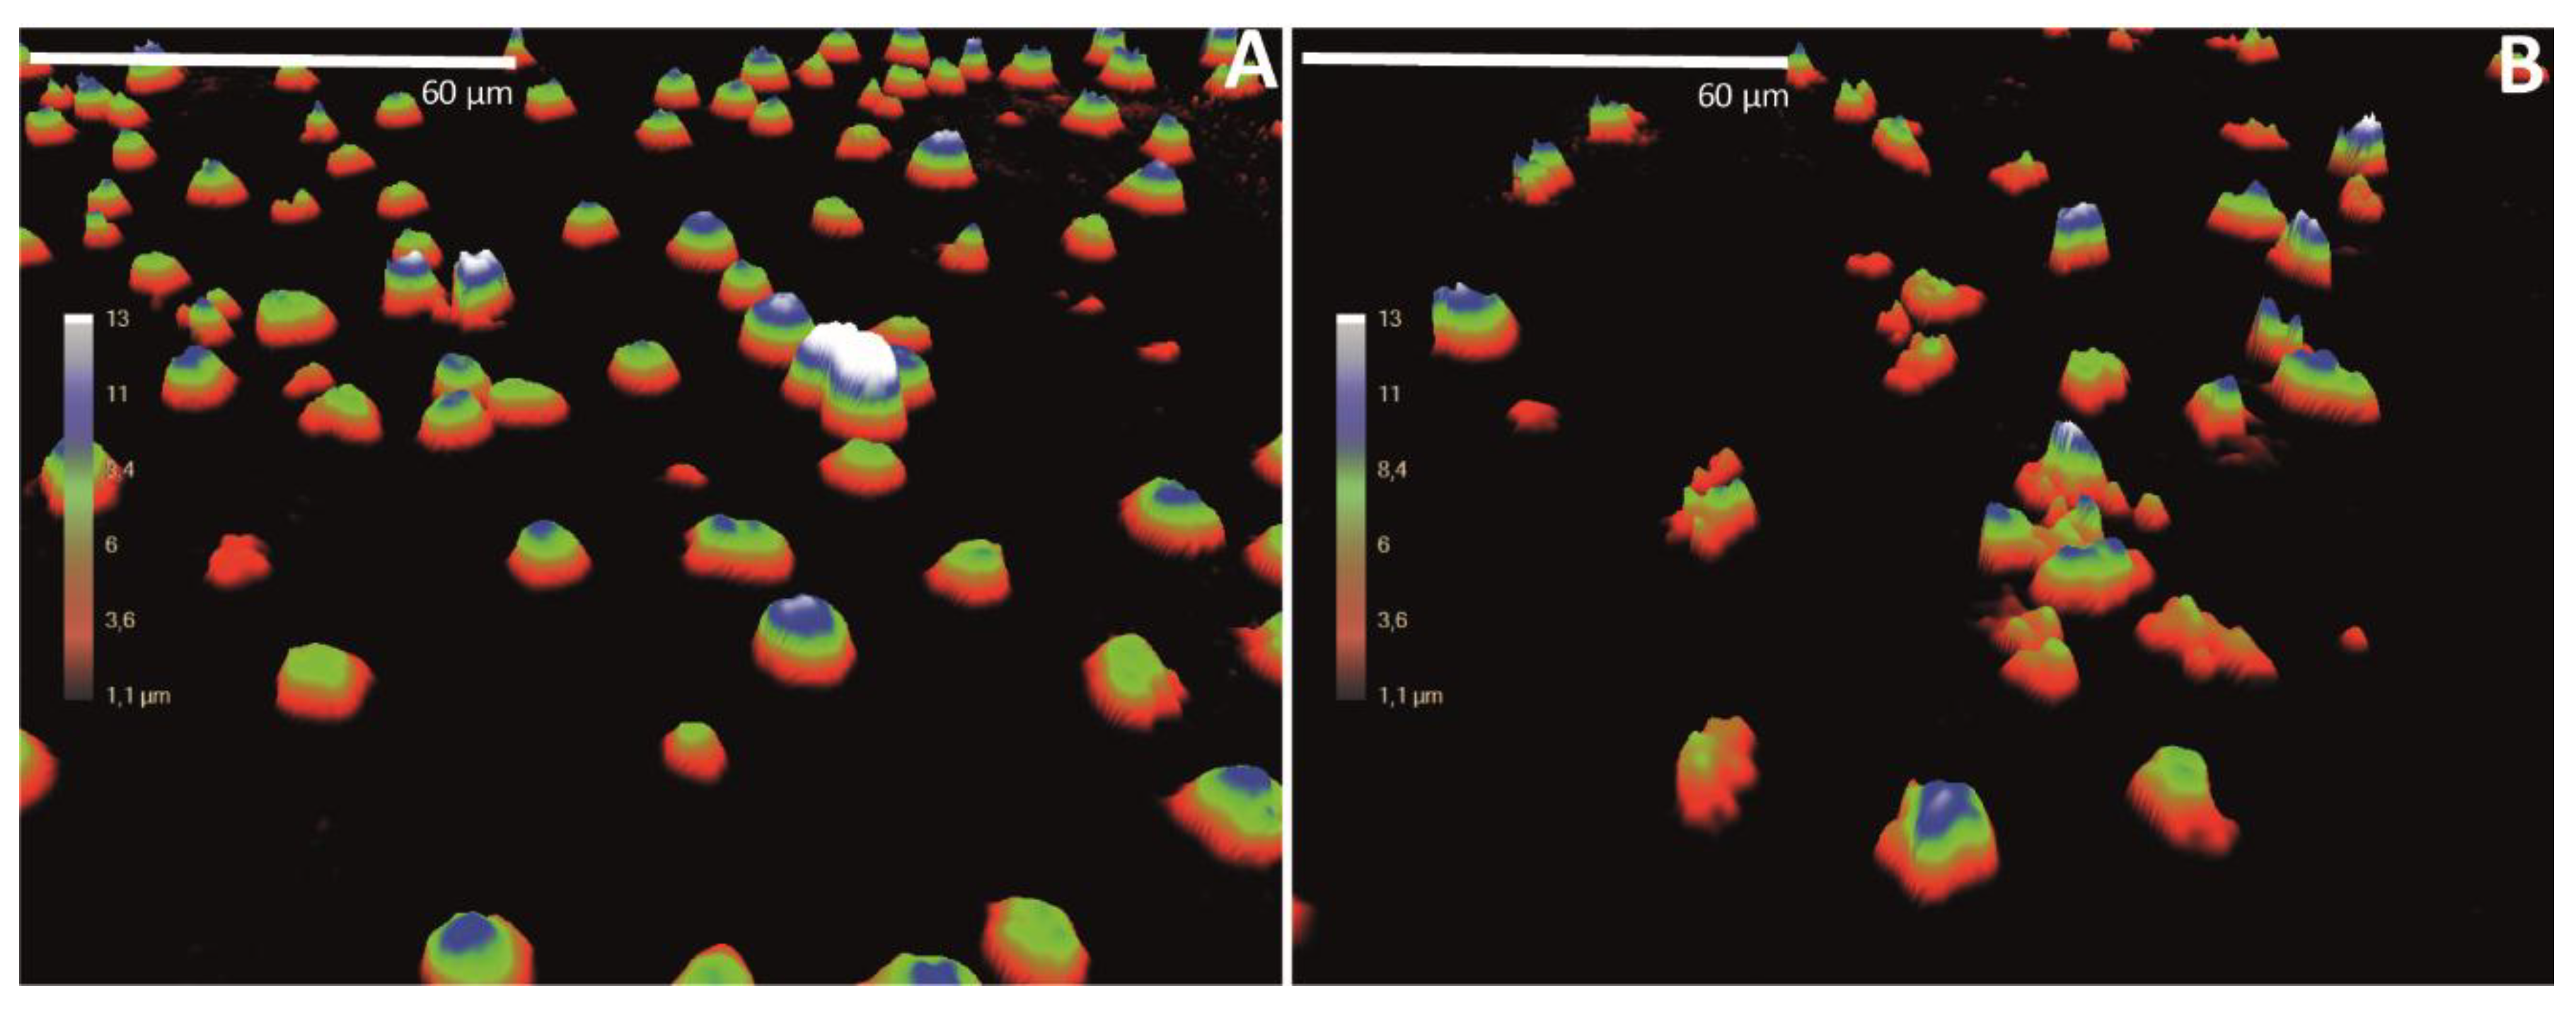
The ability of QPI to differentiate between viable and non-viable cells without the use of staining has been extensively studied [21,83]. The first DH microscopy images of tumor spheroids were published in 2003 [84], and the first images of single cells one year after that [85]. Indeed, DH microscopy has turned out to be a very useful technique for cell death studies [21,83]. Cells that go into programmed cell death, or apoptosis, show a decreased cell phase shift as the first indication of early apoptosis, but several morphological alterations take place, such as cell shrinkage, formation of small blebs, nuclear fragmentation, chromatin condensation, chromosomal DNA fragmentation, and breakdown into several apoptotic bodies [86]. Pavillon et al. showed that dead cells could be identified within minutes through their DH phase signal, whereas with conventional trypan blue staining the identification took several hours [87]. Also, DH microscopy was compared with electronic cell sizing and atomic force microscopy [88]. DH was shown to be advantageous in terms of the noninvasive labeling, the time resolution, and the possibility of measuring both single cells and cell populations. Moreover, in a study by El-Schich et al., DH measurements revealed significant differences in the average cell number, the confluence, cell volume, and cell area when comparing untreated and etoposide-treated cells [50]. We have cultured T leukemia Jurkat cells in ibidi chambers (ibidi GmbH, Martinsried, Germany) and treated the cells for 24 h with the cell death-inducing agent etoposide, or left untreated as a negative control. After the incubation, the cells were analyzed with DH microscopy. 3D holograms are shown for untreated cells (Figure 2A) and for the etoposide-treated cells (Figure 2B).
Interestingly, several DH parameters that were measured, including cell number, area, thickness, and volume, were decreased after Etoposide treatment of the Jurkat cells (Table 2).
Colomb et al. have shown details of the apoptotic process, where the apoptotic blebbing in prostate cancer cells was clearly visualized by DH microscopy [81]. Interestingly, results presented on the individual cellular level of prostate cancer cells and mouse fibroblast cells treated with cell death-inducing drugs showed that these cell types behaved very differently [82]. Using rapid profiling with high-speed live-cell interferometry, Huang and co-workers recently showed that the proto-oncogene B-Raf (BRAF)-inhibitor sensitive melanoma cell lines differed in measurements of optical cell biomass [62]. Interestingly, within 24 h, biomass kinetic signatures were obtained for three pairs of sensitive or resistant melanoma cell lines, which showed a discrimination.
Cell death and cell proliferation are stringently controlled by the cell cycle, and studies have shown the ability of QPI to identify the different phases of the cell life cycle, i.e., specific changes in cell phase correlating to either a G1 or a G2/M arrest [13,25,38,44,57,89]. Kamlund et al. constructed individual cell trees showing the way in which the drug salinomycin affects individual cells cultured in normoxia or hypoxia, by monitoring the times to first and last division [13]. In this way, sensitivity to different conditions could be analyzed. Moreover, several studies of cell cycle utilize the fact that cells in mitotic arrest, G2/M, increase in cellular thickness and cell volume [44,89].
4. Choice of Cell Culture and Imaging Vessel
QPI measures the path-length shifts associated with the dry mass of the specimen [4,5,6,67,90,91]. The elimination of the contrast agent removes one cause of sample variability as the sample is observed directly. However, there is no longer a possibility of artificially highlighting specific properties in situ, a situation which introduces new challenges in evaluating the relationship between imaging signal and cell pathology. As with all interferometric methods, QPI is highly sensitive to noise and contamination in the light path. Consequently, the choice of imaging chamber, cell type and physical growth conditions is of the utmost importance. QPI has optimal function on phase objects, thin objects with little light attenuation, and small differences between the refractive index of sample and background. The majority of studies have so far used a few common cell lines well suited to produce QPI signal (Table 1). The choice of cell culture chamber is more varied, with both commercial glass and plastic containers being used, as well as “homemade” chambers. Since the image is calculated from an interference pattern in a Fourier domain, any contamination which can cause the light to refract (other than the sample itself) will appear in the final image as an overall increase in noise levels, and not only as a singular point of contamination. In particular, a separate path configuration, e.g., the Mach-Zender, is especially vulnerable, as contamination can corrupt each path separately.
The main benefit of QPI is its non-invasive characteristics, thus making it possible to perform studies over long periods of time. Typically, some further restrictions are placed on the culture chambers used, as normal cell culture at these time scales requires regular change of the cell culture medium. Consequently, long term studies have used various kinds of perfusion chambers to be able to replace the medium without disturbing the imaging view [30,32,39,43,49,55,61]. Several studies have also used larger culture chambers with large enough volume to avoid changing the medium entirely, such as by using a T25 cell culture flask (Table 1). Glass and plastic have been used in the majority of cases, but studies have shown that thin films mounted on glass are acceptable from the perspective of optical quality [92].
5. Automated Analysis and QPI
A promising potential for cellular imaging is the ability to use QPI to combine the non-invasive full-field imaging at short imaging intervals with automated analysis of spatio-temporal cell signatures, which enables the gathering of data from a large number of individual cells for long periods of time, typically several cell cycles [93]. Given a stable segmentation of cell area and tracking of cell position, it is possible to monitor morphological cell parameters over time, while at the same time recording cell position and movement. When phase shift images are segmented, a large number of cellular features related to morphology, density, texture, and motility can be calculated for each individual cell. The highly stochastic nature of cell phenotypes results in high variability between systems to distinguish between different cell types and cell stages. Comparisons are often only possible using population averages or large sample sets. Consequently, a successful analysis of individual cells will require some degree of automation. Cellular and tissue dynamics were measured nearly ten years ago by studying speckle fluctuations caused by cellular and sub-cellular motions [94,95], and several studies have since investigated the characterization and separation of blood cells [96,97]. Abnormalities of erythrocytes are important markers for disease. For example, Moon et al. used QPI obtained by off-axis DH microscopy to automatically calculate many useful parameters of red blood cells, using algorithms to provide joint statistical distributions of the cell properties [98]. Simple and fast methods are needed urgently because morphology and functionality can differ quickly over time in a blood sample. Go et al. used digital in-line holographic microscopy combined with machine learning algorithms to classify different types of erythrocytes [51].
Recent advances in image analysis and machine learning classification algorithms applied to various types of medical imaging [99] have only just started to be applied to QPI. A typical approach for automated analysis consists of two major steps: The extraction of features from images, and the classification of cells into groups on the basis of the features. Studies have shown the ability of QPI to distinguish between cancer cell types in blood using relatively few basic features such as maximum and average intensity, and cell diameter [20,100]. However, the majority of studies use more features. The inline-DH microscopy method used by Singh et al. [19,20] to achieve large-scale fingerprinting capabilities was useful for characterizing circulating tumor cells (CTC) in bulk flow. The authors were able to characterize tumor cell lines with different metastatic potential, and to distinguish drug resistant tumor cells from their normal counterparts.
The first studies of classification of adherent cells were published in 2017 for applications of drug exposure [51] and cell cycle state [57], both relying on a few dozen simple features relating to size and shape (e.g., area, eccentricity, average, and maximum phase shift) and texture (e.g., energy, homogeneity, and entropy). Assigning a direct biological interpretation to QPI-derived features can be difficult as intracellular fluctuations in phase shift could be due to variations in cell thickness, as well as density or changes in internal organelle arrangement. Moreover, several features can be expected to show high correlation because they are all collected from the phase shift profile, thus providing redundant information. The clear benefit of studying adherent cells instead of cells in flow is the ability to simultaneously gather information on cellular morphology, migration, and motion over time. The time spent for each analysis will be limited by the expected speed of the analyzed process.
Hejna et al. [57] recently identified 26 digital features referred to as quantitative digital holographic cytometry (DHC). When trained on these features, machine-learning algorithms achieve blind single cell classification with up to 95% accuracy. Indeed, the choice of classification strategy is of vital importance to the outcome of the analysis, as each strategy balances a tolerance for false positives and negatives with computational complexity and speed. Classifiers can be binary, sorting cells into distinct classes, or proportional, assigning a probability to a cell to belong to a specific class.
In supervised machine learning, a model classification algorithm is trained using a training sample set consisting of training data labeled, classified, or annotated manually to provide a ground truth. When training is complete, the obtained model is validated on test data of unknown class. The more representative the training data is to the expected test data, the more accurate the classifier In many real-world scenarios, test data may differ significantly from the training set. In the case of building a model for clinical use, this means that each model must be possible to train on samples from one set of patients with known cancer types, while still retaining its classification accuracy on samples from other patients with unknown diagnosis. Achieving this robustness is crucial for any use of machine learning outside of the lab, and although several studies have shown the potential of various classification approaches to distinguish between cells of known types when trained on cells from the same individual [54] or on known cell lines [51], few studies so far have explicitly addressed this problem. Changes detected by image analysis were already visible on day 1 for 0.25 μM etoposide, whereas effects on viability, as detected with spectrophotometry assays, were detected only on day 3 for 5 μM etoposide concentration, leading to the conclusion that the morphological changes observed occur before and at lower concentrations than the reduction seen in cell metabolic activity or viability assays [51]. Moreover, Roitshtain et al. used a low-coherence off-axis interferometric phase microscopy setup, which allows a single-exposure acquisition mode, and thus is suitable for quantitative imaging of dynamic cells during flow. After acquisition, the optical path delay maps of the cells were extracted and then used to calculate 15 parameters derived from the cellular 3D morphology and texture [54]. In a very recent study, activated macrophages were analyzed and information of both cellular morphology and molecular content were collected with the help of the combination of Quantitative Phase Microscopy (QPM), Raman spectroscopy, and auto fluorescence imaging [101]. Macrophages are immune cells, which are mostly analyzed with immunological methods. However, here the activation state of macrophages could be detected, in comparison with the cytokine secretion and intracellular expression of molecules related to the immune response.
6. Discussion
QPI applications including cell counting, migration, and morphology assays have become increasingly popular, but several challenges still persist. The morphological label-free analysis ability of QPI is a fast, automatic, and cost-efficient evaluation tool for analyzing quantitative parameters, including cell area, thickness, volume, population confluence, and cell count. The need for QPI applications in clinical cancer diagnostics and treatments is emerging. There is a demand for tools to classify cells, and to determine cell morphology, differentiation, proliferation, morphological changes of cells transfected with DNA or siRNA, cell death, and effects on cell movement—all in a high-throughput manner. Since QPI is performed on live cells without any labeling, the cells can be investigated with other methods—or the cells can be cultured for longer periods after the analysis. However, extensive image analysis is required due to the richness of information in each image. Analyzing blood samples or tumor biopsies containing small subpopulations of drug-resistant cancer cells is also emerging with the increased need for individualized treatment. Interestingly, by using QPI in combination with machine-learning, the features provide biologically independent information across a variety of mammalian cell state transitions that can be used to standardize holograms for the purpose of kinetic single cell cytometry. The training speed and computer resources can be limitations in automated QPI using machine-learning. Also, it will be important in the near future to share data and to develop algorithms.
Funding
This project has received funding from the European Union’s Horizon 2020 research and innovation programme under the Marie Skłodowska-Curie grant agreement No. 721297, the Knowledge foundation in Sweden, Malmö University, and Biofilms—Research Center for Biointerfaces at Malmö University, Sweden.
Acknowledgments
Malmö University covered the costs to publish in open access.
Conflicts of Interest
The authors declare no conflict of interest.
References
- Zernike, F. Phase contrast, a new method for the microscopic observation of transparent objects. Physica 1942, 9, 686–698. [Google Scholar] [CrossRef]
- Nomarski, G. Microinterféromètre différentiel à ondes polarisées. J. Phys. Rad. 1955, 16, 9S–13S. [Google Scholar]
- Hoffman, R. The modulation contrast microscope: Principles and performance. J. Microsc. 1977, 110, 205–222. [Google Scholar] [CrossRef]
- Popescu, G. Quantitative Phase Imaging of Cells and Tissues; McGraw Hill Professional: New York, NY, USA, 2011; p. 385. [Google Scholar]
- Kemper, B.; Von Bally, G. Digital holographic microscopy for live cell applications and technical inspection. Appl. Opt. 2008, 47, A52–A61. [Google Scholar] [CrossRef] [PubMed]
- Kim, M.K. Principles and techniques of digital holographic microscopy. SPIE Rev. 2010, 1, 018005. [Google Scholar] [CrossRef]
- Guo, P.; Huang, J.; Moses, M.A. Characterization of dormant and active human cancer cells by quantitative phase imaging. Cytometry Part A 2017, 91, 424–432. [Google Scholar] [CrossRef] [PubMed]
- Mir, M.; Wang, Z.; Shen, Z.; Bednarz, M.; Bashir, R.; Golding, I.; Prasanth, S.G.; Popescu, G. Optical measurement of cycle-dependent cell growth. Proc. Natl. Acad. Sci. USA 2011, 108, 13124–13129. [Google Scholar] [CrossRef] [PubMed] [Green Version]
- Mo, W.; Zhang, Z.; Wang, D.; Liu, Y.; Bartlett, P.F.; He, R. Shielding of the geomagnetic field alters actin assembly and inhibits cell motility in human neuroblastoma cells. Sci. Rep. 2016, 6, 22624. [Google Scholar] [CrossRef] [PubMed]
- Antal, O.; Hackler, L.; Shen, J.; Mán, I.; Hideghéty, K.; Kitajka, K.; Puskás, L.G. Combination of unsaturated fatty acids and ionizing radiation on human glioma cells: Cellular, biochemical and gene expression analysis. Lipids Health Dis. 2014, 13, 142. [Google Scholar] [CrossRef] [PubMed]
- Hackler, L., Jr.; Ózsvári, B.; Gyuris, M.; Sipos, P.; Fábián, G.; Molnár, E.; Marton, A.; Faragó, N.; Mihály, J.; Nagy, L.I. The curcumin analog C-150, influencing NF-κB, UPR and Akt/Notch pathways has potent anticancer activity in vitro and in vivo. PLoS ONE 2016, 11, e0149832. [Google Scholar] [CrossRef] [PubMed]
- Cirenajwis, H.; Smiljanic, S.; Honeth, G.; Hegardt, C.; Marton, L.J.; Oredsson, S.M. Reduction of the putative CD44+CD24- breast cancer stem cell population by targeting the polyamine metabolic pathway with PG11047. Anticancer Drugs 2010, 21, 897–906. [Google Scholar] [CrossRef] [PubMed]
- Kamlund, S.; Strand, D.; Janicke, B.; Alm, K.; Oredsson, S. Influence of salinomycin treatment on division and movement of individual cancer cells cultured in normoxia or hypoxia evaluated with time-lapse digital holographic microscopy. Cell Cycle 2017, 16, 2128–2138. [Google Scholar] [CrossRef] [PubMed] [Green Version]
- Persson, J.; Mölder, A.; Pettersson, S.; Alm, K. Cell motility studies using digital holographic microscopy. In Microscopy: Science, Technology, Applications and Education; Méndez-Vilas, A., Díaz, J., Eds.; FORMATEX: Badajoz, Spain, 2010; Volume 3. [Google Scholar]
- Mir, M.; Bergamaschi, A.; Katzenellenbogen, B.S.; Popescu, G. Highly sensitive quantitative imaging for monitoring single cancer cell growth kinetics and drug response. PLoS ONE 2014, 9, e89000. [Google Scholar] [CrossRef] [PubMed]
- Gao, Y.; Wang, Z.; Hao, Q.; Li, W.; Xu, Y.; Zhang, J.; Zhang, W.; Wang, S.; Liu, S.; Li, M. Loss of ERα induces amoeboid-like migration of breast cancer cells by downregulating vinculin. Nat. Commun. 2017, 8, 14483. [Google Scholar] [CrossRef] [PubMed] [Green Version]
- Messica, Y.; Laser-Azogui, A.; Volberg, T.; Elisha, Y.; Lysakovskaia, K.; Eils, R.; Gladilin, E.; Geiger, B.; Beck, R. The role of vimentin in regulating cell invasive migration in dense cultures of breast carcinoma cells. Nano Lett. 2017, 17, 6941–6948. [Google Scholar] [CrossRef] [PubMed]
- Schwickert, A.; Weghake, E.; Brüggemann, K.; Engbers, A.; Brinkmann, B.F.; Kemper, B.; Seggewiß, J.; Stock, C.; Ebnet, K.; Kiesel, L. microRNA miR-142-3p inhibits breast cancer cell invasiveness by synchronous targeting of WASL, integrin alpha V, and additional cytoskeletal elements. PLoS ONE 2015, 10, e0143993. [Google Scholar] [CrossRef] [PubMed] [Green Version]
- Singh, D.K.; Ahrens, C.C.; Li, W.; Vanapalli, S.A. Label-free, high-throughput holographic screening and enumeration of tumor cells in blood. Lab Chip 2017, 17, 2920–2932. [Google Scholar] [CrossRef] [PubMed]
- Singh, D.K.; Ahrens, C.C.; Li, W.; Vanapalli, S.A. Label-free fingerprinting of tumor cells in bulk flow using inline digital holographic microscopy. Biomed. Opt. Express 2017, 8, 536–554. [Google Scholar] [CrossRef] [PubMed]
- Mölder, A.; Sebesta, M.; Gustafsson, M.; Gisselson, L.; Wingren, A.G.; Alm, K. Non-invasive, label-free cell counting and quantitative analysis of adherent cells using digital holography. J. Microsc. 2008, 232, 240–247. [Google Scholar] [CrossRef] [PubMed]
- Janicke, B.; Kårsnäs, A.; Egelberg, P.; Alm, K. Label-free high temporal resolution assessment of cell proliferation using digital holographic microscopy. Cytometry Part A 2017, 91, 460–469. [Google Scholar] [CrossRef] [PubMed]
- Ceballos, S.; Kandel, M.E.; Sridharan, S.; Majeed, H.; Monroy, F.; Popescu, G. Active intracellular transport in metastatic cells studied by spatial light interference microscopy. J. Biomed. Opt. 2015, 20, 111209. [Google Scholar] [CrossRef] [PubMed]
- Bhaduri, B.; Pham, H.; Mir, M.; Popescu, G. Diffraction phase microscopy with white light. Opt. Lett. 2012, 37, 1094–1096. [Google Scholar] [CrossRef] [PubMed]
- Girshovitz, P.; Shaked, N.T. Generalized cell morphological parameters based on interferometric phase microscopy and their application to cell life cycle characterization. Biomed. Opt. Express 2012, 3, 1757–1773. [Google Scholar] [CrossRef] [PubMed]
- Jin, D.; Sung, Y.; Lue, N.; Kim, Y.; So, P.T.; Yaqoob, Z. Large population cell characterization using quantitative phase cytometer. Cytometry Part A 2017, 91, 450–459. [Google Scholar] [CrossRef] [PubMed] [Green Version]
- Luther, E.; Mendes, L.P.; Pan, J.; Costa, D.F.; Torchilin, V.P. Applications of label-free, quantitative phase holographic imaging cytometry to the development of multi-specific nanoscale pharmaceutical formulations. Cytometry Part A 2017, 91, 412–423. [Google Scholar] [CrossRef] [PubMed] [Green Version]
- Popescu, G.; Park, Y.; Lue, N.; Best-Popescu, C.; Deflores, L.; Dasari, R.R.; Feld, M.S.; Badizadegan, K. Optical imaging of cell mass and growth dynamics. Am. J. Physiol.-Cell Physiol. 2008, 295, C538–C544. [Google Scholar] [CrossRef] [PubMed] [Green Version]
- Vijayarathna, S.; Chen, Y.; Kanwar, J.R.; Sasidharan, S. Standardized Polyalthia longifolia leaf extract (PLME) inhibits cell proliferation and promotes apoptosis: The anti-cancer study with various microscopy methods. Biomed. Pharmacother. 2017, 91, 366–377. [Google Scholar] [CrossRef] [PubMed]
- Peter, B.; Nador, J.; Juhasz, K.; Dobos, A.; Korosi, L.; Székács, I.; Patko, D.; Horvath, R. Incubator proof miniaturized Holomonitor to in situ monitor cancer cells exposed to green tea polyphenol and preosteoblast cells adhering on nanostructured titanate surfaces: Validity of the measured parameters and their corrections. J. Biomed. Opt. 2015, 20, 067002. [Google Scholar] [CrossRef] [PubMed]
- Benzerdjeb, N.; Garbar, C.; Camparo, P.; Sevestre, H. Digital holographic microscopy as screening tool for cervical cancer preliminary study. Cancer Cytopathol. 2016, 124, 573–580. [Google Scholar] [CrossRef] [PubMed] [Green Version]
- Özdemir, A.; Yildiz, M.; Senol, F.S.; Şimay, Y.D.; Ibişoglu, B.; Gokbulut, A.; Orhan, I.E.; Ark, M. Promising anticancer activity of Cyclotrichium niveum L. extracts through induction of both apoptosis and necrosis. Food Chem. Toxicol. 2017, 109, 898–909. [Google Scholar] [CrossRef] [PubMed]
- Sriraman, S.K.; Pan, J.; Sarisozen, C.; Luther, E.; Torchilin, V. Enhanced cytotoxicity of folic acid-targeted liposomes co-loaded with C6 ceramide and doxorubicin: In vitro evaluation on HeLa, A2780-ADR, and H69-AR cells. Mol. Pharm. 2016, 13, 428–437. [Google Scholar] [CrossRef] [PubMed]
- Puthia, M.; Storm, P.; Nadeem, A.; Hsiung, S.; Svanborg, C. Prevention and treatment of colon cancer by peroral administration of HAMLET (human alpha-lactalbumin made lethal to tumour cells). Gut 2014, 63, 131–142. [Google Scholar] [CrossRef] [PubMed]
- Ousingsawat, J.; Cabrita, I.; Wanitchakool, P.; Sirianant, L.; Krautwald, S.; Linkermann, A.; Schreiber, R.; Kunzelmann, K. Ca2+ signals, cell membrane disintegration, and activation of TMEM16F during necroptosis. Cell. Mol. Life Sci. 2017, 74, 173–181. [Google Scholar] [CrossRef] [PubMed]
- Chen, C.L.; Mahjoubfar, A.; Tai, L.; Blaby, I.K.; Huang, A.; Niazi, K.R.; Jalali, B. Deep learning in label-free cell classification. Sci. Rep. 2016, 6, 21471. [Google Scholar] [CrossRef] [PubMed]
- Gisselsson, D.; Jin, Y.; Lindgren, D.; Persson, J.; Gisselsson, L.; Hanks, S.; Sehic, D.; Mengelbier, L.H.; Ora, I.; Rahman, N.; Mertens, F.; Mitelman, F.; Mandahl, N. Generation of trisomies in cancer cells by multipolar mitosis and incomplete cytokinesis. Proc. Natl. Acad. Sci. USA 2010, 107, 20489–20493. [Google Scholar] [CrossRef] [PubMed] [Green Version]
- Salzano, G.; Costa, D.F.; Sarisozen, C.; Luther, E.; Mattheolabakis, G.; Dhargalkar, P.P.; Torchilin, V.P. Mixed Nanosized Polymeric Micelles as Promoter of Doxorubicin and miRNA-34a Co-Delivery Triggered by Dual Stimuli in Tumor Tissue. Small 2016, 12, 4837–4848. [Google Scholar] [CrossRef] [PubMed] [Green Version]
- Ho, J.; Rydstrom, A.; Manimekalai, M.S.S.; Svanborg, C.; Grüber, G. Low resolution solution structure of HAMLET and the importance of its alpha-domains in tumoricidal activity. PLoS ONE 2012, 7, e53051. [Google Scholar] [CrossRef]
- Ogawa, H.; Koyanagi-Aoi, M.; Otani, K.; Zen, Y.; Maniwa, Y.; Aoi, T. Interleukin-6 blockade attenuates lung cancer tissue construction integrated by cancer stem cells. Sci. Rep. 2017, 7, 12317. [Google Scholar] [CrossRef] [PubMed] [Green Version]
- Ma, L.; Rajshekhar, G.; Wang, R.; Bhaduri, B.; Sridharan, S.; Mir, M.; Chakraborty, A.; Iyer, R.; Prasanth, S.; Millet, L. Phase correlation imaging of unlabeled cell dynamics. Sci. Rep. 2016, 6, 32702. [Google Scholar] [CrossRef] [PubMed] [Green Version]
- Gyuris, M.; Hackler, L.; Nagy, L.I.; Alföldi, R.; Rédei, E.; Marton, A.; Vellai, T.; Faragó, N.; Ózsvári, B.; Hetényi, A. Mannich curcuminoids as potent anticancer agents. Arch. Pharm. 2017, 350. [Google Scholar] [CrossRef] [PubMed]
- Ho, J.C.; Storm, P.; Rydstrom, A.; Bowen, B.; Alsin, F.; Sullivan, L.; Ambite, I.; Mok, K.H.; Northen, T.; Svanborg, C. Lipids as tumoricidal components of human alpha-lactalbumin made lethal to tumor cells (HAMLET): Unique and shared effects on signaling and death. J. Biol. Chem. 2013, 288, 17460–17471. [Google Scholar] [CrossRef] [PubMed]
- Zhang, Y.; Sriraman, S.K.; Kenny, H.A.; Luther, E.; Torchilin, V.; Lengyel, E. Reversal of Chemoresistance in Ovarian Cancer by Co-Delivery of a P-Glycoprotein Inhibitor and Paclitaxel in a Liposomal Platform. Mol. Cancer Ther. 2016, 15, 2282–2293. [Google Scholar] [CrossRef] [PubMed] [Green Version]
- Kemper, B.; Carl, D.D.; Schnekenburger, J.; Bredebusch, I.; Schäfer, M.; Domschke, W.; von Bally, G. Investigation of living pancreas tumor cells by digital holographic microscopy. J. Biomed. Opt. 2006, 11, 034005. [Google Scholar] [CrossRef] [PubMed]
- Kastl, L.; Isbach, M.; Dirksen, D.; Schnekenburger, J.; Kemper, B. Quantitative phase imaging for cell culture quality control. Cytometry Part A 2017, 91, 470–481. [Google Scholar] [CrossRef] [PubMed]
- Li, Y.; Petrovic, L.; La, J.; Celli, J.P.; Yelleswarapu, C.S. Digital holographic microscopy for longitudinal volumetric imaging of growth and treatment response in three-dimensional tumor models. J. Biomed. Opt. 2014, 19, 116001. [Google Scholar] [CrossRef] [PubMed] [Green Version]
- El-Schich, Z.; Nilsson, E.; Gerdtsson, A.S.; Wingren, C.; Wingren, A.G. Interfacing antibody-based microarrays and digital holography enables label-free detection for loss of cell volume. Future Sci. OA 2015, 1–11. [Google Scholar] [CrossRef] [PubMed]
- Gál, B.; Veselý, M.; Čolláková, J.; Nekulová, M.; Jůzová, V.; Chmelík, R.; Veselý, P. Distinctive behaviour of live biopsy-derived carcinoma cells unveiled using coherence-controlled holographic microscopy. PLoS ONE 2017, 12, e0183399. [Google Scholar] [CrossRef] [PubMed]
- El-Schich, Z.; Mölder, A.; Tassidis, H.; Härkönen, P.; Falck Miniotis, M.; Gjörloff Wingren, A. Induction of morphological changes in death-induced cancer cells monitored by holographic microscopy. J. Struct. Biol. 2015, 189, 207–212. [Google Scholar] [CrossRef] [PubMed] [Green Version]
- Mölder, A.L.; Persson, J.; El-Schich, Z.; Czanner, S.; Gjörloff-Wingren, A. Supervised classification of etoposide-treated in vitro adherent cells based on noninvasive imaging morphology. J. Med. Imaging 2017, 4, 021106. [Google Scholar] [CrossRef] [PubMed] [Green Version]
- Semenas, J.; Hedblom, A.; Miftakhova, R.R.; Sarwar, M.; Larsson, R.; Shcherbina, L.; Johansson, M.E.; Harkonen, P.; Sterner, O.; Persson, J.L. The role of PI3K/AKT-related PIP5K1alpha and the discovery of its selective inhibitor for treatment of advanced prostate cancer. Proc. Natl. Acad. Sci. USA 2014, 111, E3689–E3698. [Google Scholar] [CrossRef] [PubMed]
- Lajkó, E.; Bányai, P.; Zámbó, Z.; Kursinszki, L.; Szőke, É.; Kőhidai, L. Targeted tumor therapy by Rubia tinctorum L.: Analytical characterization of hydroxyanthraquinones and investigation of their selective cytotoxic, adhesion and migration modulator effects on melanoma cell lines (A2058 and HT168-M1). Cancer Cell Int. 2015, 15, 119. [Google Scholar] [CrossRef] [PubMed] [Green Version]
- Roitshtain, D.; Wolbromsky, L.; Bal, E.; Greenspan, H.; Satterwhite, L.L.; Shaked, N.T. Quantitative phase microscopy spatial signatures of cancer cells. Cytometry Part A 2017, 91, 482–493. [Google Scholar] [CrossRef] [PubMed]
- Trulsson, M.; Yu, H.; Gisselsson, L.; Chao, Y.; Urbano, A.; Aits, S.; Mossberg, A.; Svanborg, C. HAMLET binding to α-actinin facilitates tumor cell detachment. PLoS ONE 2011, 6, e17179. [Google Scholar] [CrossRef] [PubMed]
- Sung, Y.; Tzur, A.; Oh, S.; Choi, W.; Li, V.; Dasari, R.R.; Yaqoob, Z.; Kirschner, M.W. Size homeostasis in adherent cells studied by synthetic phase microscopy. Proc. Natl. Acad. Sci. USA 2013, 110, 16687–16692. [Google Scholar] [CrossRef] [PubMed] [Green Version]
- Hejna, M.; Jorapur, A.; Song, J.S.; Judson, R.L. High accuracy label-free classification of single-cell kinetic states from holographic cytometry of human melanoma cells. Sci. Rep. 2017, 7, 11943. [Google Scholar] [CrossRef] [PubMed] [Green Version]
- Janeckova, H.; Vesely, P.; Chmelik, R. Proving tumour cells by acute nutritional/energy deprivation as a survival threat: A task for microscopy. Anticancer Res. 2009, 29, 2339–2345. [Google Scholar] [PubMed]
- Chang, H.; Lin, Z.; Wu, M.; Wang, L.; Chow, Y.; Jiang, S.S.; Ch’ang, H.; Chang, V.H. Characterization of a transgenic mouse model exhibiting spontaneous lung adenocarcinomas with a metastatic phenotype. PLoS ONE 2017, 12, e0175586. [Google Scholar] [CrossRef] [PubMed]
- Calin, V.L.; Mihailescu, M.; Scarlat, E.I.; Baluta, A.V.; Calin, D.; Kovacs, E.; Savopol, T.; Moisescu, M.G. Evaluation of the metastatic potential of malignant cells by image processing of digital holographic microscopy data. FEBS Open Bio 2017, 7, 1527–1538. [Google Scholar] [CrossRef] [PubMed] [Green Version]
- Calin, V.L.; Mihailescu, M.; Mihale, N.; Baluta, A.V.; Kovacs, E.; Savopol, T.; Moisescu, M.G. Changes in optical properties of electroporated cells as revealed by digital holographic microscopy. Biomed. Opt. Express 2017, 8, 2222–2234. [Google Scholar] [CrossRef] [PubMed]
- Huang, D.; Leslie, K.A.; Guest, D.; Yeshcheulova, O.; Roy, I.J.; Piva, M.; Moriceau, G.; Zangle, T.A.; Lo, R.S.; Teitell, M.A. High-Speed Live-Cell Interferometry: A New Method for Quantifying Tumor Drug Resistance and Heterogeneity. Anal. Chem. 2018, 90, 3299–3306. [Google Scholar] [CrossRef] [PubMed]
- Greve, B.; Sheikh-Mounessi, F.; Kemper, B.; Ernst, I.; Götte, M.; Eich, H. Survivin, a target to modulate the radiosensitivity of Ewing’s sarcoma. Strahlenther. Onkol. 2012, 188, 1038–1047. [Google Scholar] [CrossRef] [PubMed]
- Langehanenberg, P.; Ivanova, L.; Bernhardt, I.; Ketelhut, S.; Vollmer, A.; Dirksen, D.; Georgiev, G.K.; von Bally, G.; Kemper, B. Automated three-dimensional tracking of living cells by digital holographic microscopy. J. Biomed. Opt. 2009, 14, 014018. [Google Scholar] [CrossRef] [PubMed]
- Rezaei, M.; Cao, J.; Friedrich, K.; Kemper, B.; Brendel, O.; Grosser, M.; Adrian, M.; Baretton, G.; Breier, G.; Schnittler, H. The expression of VE-cadherin in breast cancer cells modulates cell dynamics as a function of tumor differentiation and promotes tumor–endothelial cell interactions. Histochem. Cell Biol. 2018, 149, 15–30. [Google Scholar] [CrossRef] [PubMed]
- Pastorek, L.; Venit, T.; Hozák, P. Holography microscopy as an artifact-free alternative to phase-contrast. Histochem. Cell Biol. 2018, 149, 179–186. [Google Scholar] [CrossRef] [PubMed]
- Lee, K.; Kim, K.; Jung, J.; Heo, J.; Cho, S.; Lee, S.; Chang, G.; Jo, Y.; Park, H.; Park, Y. Quantitative phase imaging techniques for the study of cell pathophysiology: From principles to applications. Sensors 2013, 13, 4170–4191. [Google Scholar] [CrossRef] [PubMed]
- Majeed, H.; Sridharan, S.; Mir, M.; Ma, L.; Min, E.; Jung, W.; Popescu, G. Quantitative phase imaging for medical diagnosis. J. Biophotonics 2017, 10, 177–205. [Google Scholar] [CrossRef] [PubMed]
- Holden, E.; Tárnok, A.; Popescu, G. Quantitative phase imaging for label-free cytometry. Cytometry Part A 2017, 91, 407–411. [Google Scholar] [CrossRef] [PubMed] [Green Version]
- Majeed, H.; Okoro, C.; Kajdacsy-Balla, A.; Toussaint, K.C.; Popescu, G. Quantifying collagen fiber orientation in breast cancer using quantitative phase imaging. J. Biomed. Opt. 2017, 22, 046004. [Google Scholar] [CrossRef] [PubMed]
- Choi, W.; Fang-Yen, C.; Badizadegan, K.; Oh, S.; Lue, N.; Dasari, R.R.; Feld, M.S. Tomographic phase microscopy. Nat. Methods 2007, 4, 717. [Google Scholar] [CrossRef] [PubMed]
- Kim, Y.; Shim, H.; Kim, K.; Park, H.; Jang, S.; Park, Y. Profiling individual human red blood cells using common-path diffraction optical tomography. Sci. Rep. 2014, 4, 6659. [Google Scholar] [CrossRef] [PubMed] [Green Version]
- Kemper, B.; Vollmer, A.; von Bally, G.; Rommel, C.E.; Schnekenburger, J. Simplified approach for quantitative digital holographic phase contrast imaging of living cells. J. Biomed. Opt. 2011, 16, 026014. [Google Scholar] [CrossRef] [PubMed]
- Xu, W.; Jericho, M.H.; Meinertzhagen, I.A.; Kreuzer, H.J. Digital in-line holography for biological applications. Proc. Natl. Acad. Sci. USA 2001, 98, 11301–11305. [Google Scholar] [CrossRef] [PubMed] [Green Version]
- Marquet, P.; Rappaz, B.; Magistretti, P.J.; Cuche, E.; Emery, Y.; Colomb, T.; Depeursinge, C. Digital holographic microscopy: A noninvasive contrast imaging technique allowing quantitative visualization of living cells with subwavelength axial accuracy. Opt. Lett. 2005, 30, 468–470. [Google Scholar] [CrossRef] [PubMed]
- Wang, Z.; Millet, L.; Mir, M.; Ding, H.; Unarunotai, S.; Rogers, J.; Gillette, M.U.; Popescu, G. Spatial light interference microscopy (SLIM). Opt. Express 2011, 19, 1016–1026. [Google Scholar] [CrossRef] [PubMed]
- Kim, T.; Zhou, R.; Goddard, L.L.; Popescu, G. Solving inverse scattering problems in biological samples by quantitative phase imaging. Laser Photonics Rev. 2016, 10, 13–39. [Google Scholar] [CrossRef]
- Zangle, T.A.; Teitell, M.A. Live-cell mass profiling: An emerging approach in quantitative biophysics. Nat. Methods 2014, 11, 1221–1228. [Google Scholar] [CrossRef] [PubMed]
- Sridharan, S.; Macias, V.; Tangella, K.; Melamed, J.; Dube, E.; Kong, M.X.; Kajdacsy-Balla, A.; Popescu, G. Prediction of prostate cancer recurrence using quantitative phase imaging: Validation on a general population. Sci. Rep. 2016, 6, 33818. [Google Scholar] [CrossRef] [PubMed] [Green Version]
- Nguyen, T.H.; Sridharan, S.; Macias, V.; Kajdacsy-Balla, A.; Melamed, J.; Do, M.N.; Popescu, G. Automatic Gleason grading of prostate cancer using quantitative phase imaging and machine learning. J. Biomed. Opt. 2017, 22, 036015. [Google Scholar] [CrossRef] [PubMed]
- Colomb, T.; Charrière, F.; Kühn, J.; Marquet, P.; Depeursinge, C. Advantages of digital holographic microscopy for real-time full field absolute phase imaging. In Proceedings of the Three-Dimensional and Multidimensional Microscopy: Image Acquisition and Processing XV, San Jose, CA, USA, 20 February 2008; Volume 6861, p. 686109. [Google Scholar] [CrossRef]
- Alm, K.; El-Schich, Z.; Miniotis, M.F.; Wingren, A.G.; Janicke, B.; Oredsson, S. Cells and holograms–holograms and digital holographic microscopy as a tool to study the morphology of living cells. In Holography-Basic Principles and Contemporary Applications; Mihaylova, E., Ed.; Intech: Vienna, Austria, 2013. [Google Scholar]
- Kemmler, M.; Fratz, M.; Giel, D.; Saum, N.; Brandenburg, A.; Hoffmann, C. Noninvasive time-dependent cytometry monitoring by digital holography. J. Biomed. Opt. 2007, 12, 064002. [Google Scholar] [CrossRef] [PubMed]
- Yu, P.; Mustata, M.; Turek, J.; French, P.; Melloch, M.; Nolte, D. Holographic optical coherence imaging of tumor spheroids. Appl. Phys. Lett. 2003, 83, 575–577. [Google Scholar] [CrossRef]
- Carl, D.; Kemper, B.; Wernicke, G.; von Bally, G. Parameter-optimized digital holographic microscope for high-resolution living-cell analysis. Appl. Opt. 2004, 43, 6536–6544. [Google Scholar] [CrossRef] [PubMed]
- Kroemer, G.; Galluzzi, L.; Vandenabeele, P.; Abrams, J.; Alnemri, E.; Baehrecke, E.; Blagosklonny, M.; El-Deiry, W.; Golstein, P.; Green, D. Classification of cell death: Recommendations of the Nomenclature Committee on Cell Death 2009. Cell Death Differ. 2009, 16, 3–11. [Google Scholar] [CrossRef] [PubMed]
- Pavillon, N.; Kühn, J.; Moratal, C.; Jourdain, P.; Depeursinge, C.; Magistretti, P.J.; Marquet, P. Early cell death detection with digital holographic microscopy. PLoS ONE 2012, 7, e30912. [Google Scholar] [CrossRef] [PubMed]
- Khmaladze, A.; Matz, R.L.; Epstein, T.; Jasensky, J.; Banaszak Holl, M.M.; Chen, Z. Cell volume changes during apoptosis monitored in real time using digital holographic microscopy. J. Struct. Biol. 2012, 178, 270–278. [Google Scholar] [CrossRef] [PubMed]
- Miniotis, M.F.; Mukwaya, A.; Wingren, A.G. Digital holographic microscopy for non-invasive monitoring of cell cycle arrest in L929 cells. PLoS ONE 2014, 9, e106546. [Google Scholar] [CrossRef]
- Marquet, P.; Depeursinge, C.; Magistretti, P.J. Review of quantitative phase-digital holographic microscopy: Promising novel imaging technique to resolve neuronal network activity and identify cellular biomarkers of psychiatric disorders. Neurophotonics 2014, 1, 020901. [Google Scholar] [CrossRef] [PubMed]
- Bettenworth, D.; Bokemeyer, A.; Poremba, C.; Ding, N.S.; Ketelhut, S.; Lenz, P.; Kemper, B. Quantitative phase microscopy for evaluation of intestinal inflammation and wound healing utilizing label-free biophysical markers. Histol. Histopathol. 2018, 33, 417–432. [Google Scholar] [CrossRef] [PubMed]
- Petecchia, L.; Usai, C.; Vassalli, M.; Gavazzo, P. Biophysical characterization of nanostructured TiO2 as a good substrate for hBM-MSC adhesion, growth and differentiation. Exp. Cell Res. 2017, 358, 111–119. [Google Scholar] [CrossRef] [PubMed]
- Kemper, B.; Bauwens, A.; Vollmer, A.; Ketelhut, S.; Langehanenberg, P.; Müthing, J.; Karch, H.; von Bally, G. Label-free quantitative cell division monitoring of endothelial cells by digital holographic microscopy. J. Biomed. Opt. 2010, 15, 036009. [Google Scholar] [CrossRef] [PubMed]
- Nolte, D.D.; An, R.; Turek, J.; Jeong, K. Tissue dynamics spectroscopy for phenotypic profiling of drug effects in three-dimensional culture. Biomed. Opt. Express 2012, 3, 2825–2841. [Google Scholar] [CrossRef] [PubMed]
- Nolte, D.D.; An, R.; Turek, J.; Jeong, K. Tissue dynamics spectroscopy for three-dimensional tissue-based drug screening. JALA: J. Assoc. Lab. Autom. 2011, 16, 431–442. [Google Scholar] [CrossRef] [PubMed]
- Yi, F.; Moon, I.; Javidi, B. Automated red blood cells extraction from holographic images using fully convolutional neural networks. Biomed. Opt. Express 2017, 8, 4466–4479. [Google Scholar] [CrossRef] [PubMed]
- Go, T.; Byeon, H.; Lee, S.J. Label-free sensor for automatic identification of erythrocytes using digital in-line holographic microscopy and machine learning. Biosens. Bioelectron. 2018, 103, 12–18. [Google Scholar] [CrossRef] [PubMed]
- Moon, I.; Javidi, B.; Yi, F.; Boss, D.; Marquet, P. Automated statistical quantification of three-dimensional morphology and mean corpuscular hemoglobin of multiple red blood cells. Opt. Express 2012, 20, 10295–10309. [Google Scholar] [CrossRef] [PubMed]
- Xue, Y.; Chen, S.; Qin, J.; Liu, Y.; Huang, B.; Chen, H. Application of Deep Learning in Automated Analysis of Molecular Images in Cancer: A Survey. Contrast Med. Mol. Imaging 2017, 2017. [Google Scholar] [CrossRef] [PubMed]
- Majeed, H.; Kandel, M.E.; Han, K.; Luo, Z.; Macias, V.; Tangella, K.V.; Balla, A.; Popescu, G. Breast cancer diagnosis using spatial light interference microscopy. J. Biomed. Opt. 2015, 20, 111210. [Google Scholar] [CrossRef] [PubMed]
- Pavillon, N.; Hobro, A.J.; Akira, S.; Smith, N.I. Noninvasive detection of macrophage activation with single-cell resolution through machine learning. Proc. Natl. Acad. Sci. USA 2018, 115, E2676–E2685. [Google Scholar] [CrossRef] [PubMed]
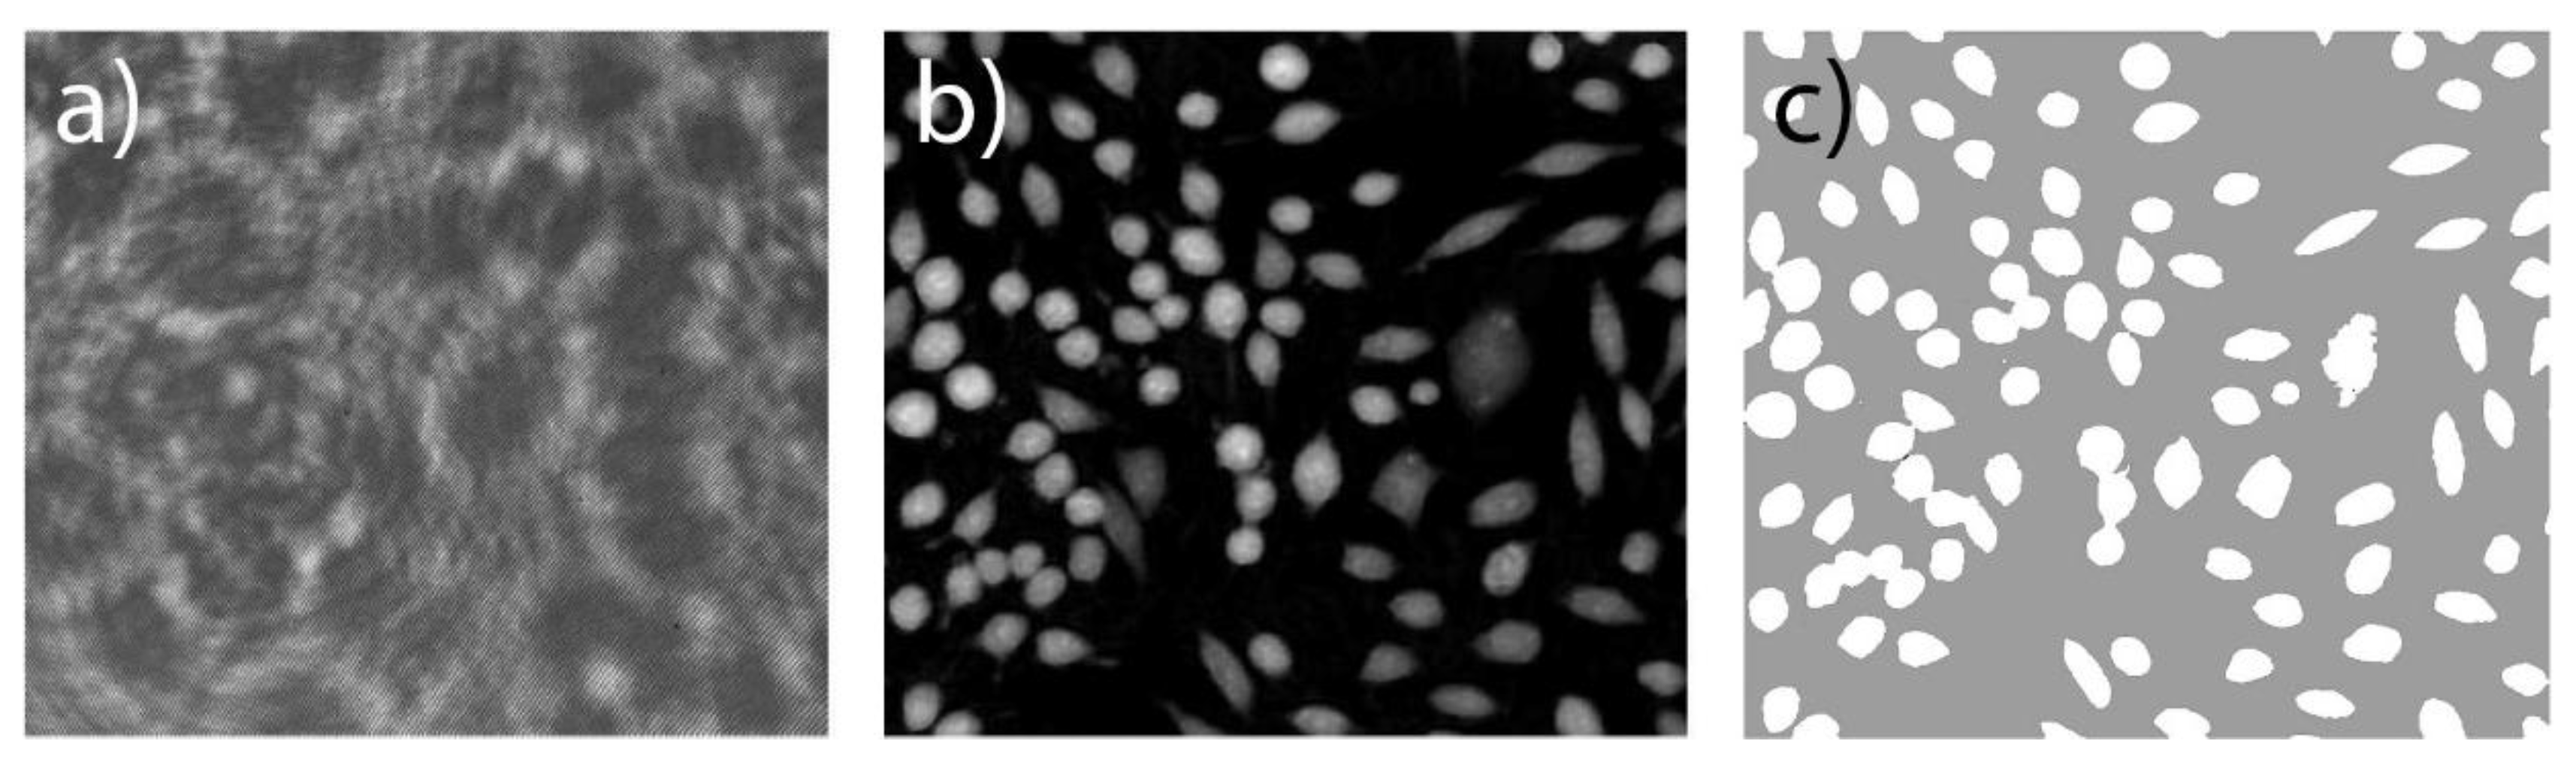
Figure 1.
Example of QPI image: (a) Interference pattern from digital holography (DH) recording showing cells in transmission mode as seen by the sensor. An interference pattern between object and reference wave has been disturbed by the refraction of cells in the object light path; (b) Reconstructed phase image using a Fresnel approximation, numeric refocusing, and unwrapping. Image intensity is proportional to optical path length through the cells; (c) Reconstructed phase image with segmented cell areas. Cell regions (white) have been separated from background (grey) using a simple thresholding. Scale: 200 × 175 µm2, human prostate DU145 cells in a T25 flask.

Figure 2.
Jurkat cells cultured in ibidi chambers for 24 h: (A) Untreated cells; (B) Cells treated with 250 µM etoposide.
Figure 2.
Jurkat cells cultured in ibidi chambers for 24 h: (A) Untreated cells; (B) Cells treated with 250 µM etoposide.


Table 1.
Summary of type of material and treatment used to analyze cancer specimens with quantitative phase imaging (QPI).
Table 1.
Summary of type of material and treatment used to analyze cancer specimens with quantitative phase imaging (QPI).
| Reference | Cell Lines | Organism | Tissue | Agent | Investigated | Vessel Type | Technology Naming | |||||
|---|---|---|---|---|---|---|---|---|---|---|---|---|
| Cellular Dry Mass/Proliferation | Cell Count | Single Cell Morphology | Cell Cycle | Cell Motility | Cell Lineage | |||||||
| [7] | KHOS | Human | Bone | - | X | X | X | 6-well plate | Quantitative Phase Imaging | |||
| [8] | U2OS | Human | Bone | - | X | Cultivation chamber | Spatial Light Interference Microscopy | |||||
| [9] | SH-SY5Y | Human | Bone Marrow | Hypomagnetic, Field | X | X | X | T25 flask | Holographic Imaging | |||
| [10] | U87 MG | Human | Brain | Fatty acids, Radiation | X | T25 Flask | Holographic Microscopy Imaging | |||||
| [11] | U87 MG, U-251 MG, GBM1, GBM2 | Human | Brain | C-150 | X | T25 Flask | Holographic Microscopy Imaging | |||||
| [12] | JIMT-1 | Human | Breast | DFMO, PG-11047 | X | T25 Flask | Digital Holography | |||||
| [13] | JIMT-1, MCF-7 | Human | Breast | Salinomycin | X | X | X | X | Petri dish, T25 flask | Digital Holographic Microscopy | ||
| [14] | L56Br-C1, MDA-MB-231 | Human | Breast | - | X | X | T25 Flask | Digital Holographic Microscopy | ||||
| [15] | MCF-7 | Human | Breast | Estrogen | X | Glass Chamber Slide | Spatial Light Interference Microscopy | |||||
| [15] | MCF-7 | Human | Breast | Estradiol, Antiestrogen | X | X | Chamber slide | Spatial Light Interference Microscopy | ||||
| [16] | MCF-7, ZR-75-1, MDA-MB-231, SK-BR-3 | Human | Breast | - | X | X | Gel matrix | Phase Holographic Imaging | ||||
| [17] | MDA-MB-231 | Human | Breast | Vimentin | X | unknown | - | |||||
| [18] | MDA-MB-231, MDA-MB-468, MCF-7 | Human | Breast | - | X | unknown | Digital Holographic Microscopy | |||||
| [19] | MDA-MB-231, MCF-7 | Human | Breast | - | X | Microfluidic channel | Digital Holographic Microscopy | |||||
| [20] | MDA-MB-231, MCF-7, SKOV-3, SKOV-3-TR | Human | Breast, Ovary | - | X | Flow | Digital Holographic Microscopy | |||||
| [21] | MCF-10A, PC-3, DU145 | Human | Breast, Prostate | - | X | T75 Flask | Digital Holography | |||||
| [22] | JIMT-1, SK-MEL-5 | Human | Breast, Skin | - | X | X | 6-well plate | Digital Holographic Microscopy | ||||
| [23] | HeLa | Human | Cervix | - | X | Petri dish | Spatial Light Interference Microscopy | |||||
| [24] | HeLa | Human | Cervix | - | X | unknown | White Light Diffraction Phase Microscopy | |||||
| [25] | HeLa | Human | Cervix | - | X | X | X | unknown | Wide-field Interferometric Phase Microscopy | |||
| [26] | HeLa | Human | Cervix | - | X | X | X | Slide | Quantitative Phase Imaging | |||
| [27] | HeLa | Human | Cervix | Doxorubicin | X | X | X | Glass Petri dish | Quantitative Phase Holographic Imaging | |||
| [28] | HeLa | Human | Cervix | Glucose | X | X | Chamber slide | Fourier Phase Microscopy | ||||
| [29] | HeLa | Human | Cervix | Polyalthia, Longifolia | X | T25 flask | Holographic Digital Microscopy | |||||
| [30] | HeLa | Human | Cervix | Epigalloca-Techingallate | X | X | Perfusion slide | Digital Holographic Microscopy | ||||
| [31] | Primary | Human | Cervix | - | X | Slide | Digital Holographic Microscopy | |||||
| [32] | HeLa, MCF-7 | Human | Cervix, Breast | Cyclotrichium, Niveum | X | Perfusion slide | Holographic Imaging | |||||
| [33] | HeLa, A2780-ADR, H69-AR | Human | Cervix, Ovary, Lung | C6 Ceramide, Doxorubicin | X | Glass dish | Phase Holographic Imaging Microscopy | |||||
| [34] | DLD | Human | Colon | HAMLET | X | Tissue culture flask | Holographic Imaging | |||||
| [35] | HT29 | Human | Colon | TNFa, smac Mimetic, Z-VAD | X | Slide | Quantitative Phase Microscopy | |||||
| [36] | SW-480 | Human | Colon | - | X | Flow | Quantitative Phase Imaging | |||||
| [37] | MVA12, MVA41C | Human | Connective | - | X | unknown | Holographic Time-lapse Imaging | |||||
| [38] | HT1080, MCF-7 | Human | Connective, Breast | Doxorubicin | X | X | Glass Petri dish | Time-lapse Holographic Imaging Cytometry | ||||
| [39] | A549 | Human | Lung | HAMLET | X | Perfusion slide | Holographic Imaging | |||||
| [40] | A549 | Human | Lung | IL-6 | X | Cell culture dish | Digital Holographic Microscopy | |||||
| [41] | A549 | Human | Lung | - | X | Glass dish | Phase Correlation Imaging | |||||
| [42] | A549, H1975 | Human | Lung | Curcuminoids | X | T25 flask | Holographic Microscopy Imaging | |||||
| [43] | A549, Jurkat | Human | Lung, Peripheral Blood | HAMLET | X | Perfusion slide | Holographic Imaging | |||||
| [44] | SKOV3-TR, HeyA8-MDR | Human | Ovary | Pacitaxel | X | T25 Flask | Holographic Imaging Cytometry | |||||
| [45] | PaTu8988S, PaTu8988T | Human | Pancreas | E-cadherin | X | Tissue Culture Plates | Digital Holographic Microscopy | |||||
| [46] | PaTu8988S, PaTu8988T | Human | Pancreas | - | X | Petri dish | Digital Holographic Microscopy | |||||
| [47] | PANC-1 | Human | Pancreas/Duct | Oxaliplatin | X | Glass dish | Digital Holographic Microscopy | |||||
| [48] | Jurkat, U2932 | Human | Peripheral, Blood | Etoposide | X | Slide | Digital Holographic Microscopy | |||||
| [49] | SACR2, FaDu | Human | Pharynx | - | X | X | Perfusion slide | Coherence Controlled Holographic Microscopy | ||||
| [50] | DU145 | Human | Prostate | Etoposide | X | X | T25 Flask | Holographic Microscopy | ||||
| [51] | DU145 | Human | Prostate | Etoposide | X | X | 6-well plate | Digital Holographic Microscopy | ||||
| [52] | PC-3 | Human | Prostate | ISA-2011B | X | unknown | Live Cell Imaging | |||||
| [53] | A2058, HT168-M1 | Human | Skin | Hydroxy-Anthraquinones | X | X | Petri dish | Holographic Microscopy | ||||
| [54] | Hs-895, WM-115, WM-266-4, SW-480, SW-620 | Human | Skin, Colon | - | X | Adhesive chamber | Quantitative Phase Microscopy | |||||
| [55] | A549, HRTEC | Human | Lung, Kidney | HAMLET | X | Perfusion slide | Phase Holographic Imaging | |||||
| [56] | RKO, L1210 | Human, Mouse | Colon, Skin | - | X | Slide | Synthetic phase microscopy | |||||
| [57] | A375, NuMuMg | Human, Mouse | Skin, Breast | Various | X | X | X | X | 6-well plate | Digital Holographic Imaging | ||
| [58] | G3S2, A337/311RP | Human, rat | Breast, Lung | Starvation | X | Slide | Digital Holographic Microscopy | |||||
| [59] | Primary | Mouse | Lung | - | X | X | 6-well plate | Phase Holographic Microscopy | ||||
| [60] | B16F1, B16F10 | Mouse | Skin | - | X | X | Microscope slide | Digital Holographic Microscopy | ||||
| [61] | B16F10 | Mouse | Skin | Electro-Chemotherapy | X | Perfusion slide | Digital Holographic Microscopy | |||||
| [62] | M229P, M229R5, M238P, M238R1, M249P, M249R4 | Human | Melanoma | Vemurafenib | X | X | 24-well glass-bottom plate | High-speed live cell, interferometry | ||||
| [63] | RM-82, CADO-ES-1, VH-64, STA-ET-1 | Human | Ewing sarcoma | Birc5 knockdown | X | X | X | Slide | Digital Holographic Microscopy | |||
| [64] | Red blood cells, HT1080 | Human | Fibrosarcoma | - | X | Digital Holographic Microscopy | ||||||
| [65] | MDA-MB-231, MCF-7 | Human | Breast | VE-cadherin | X | X | X | ibidi μDish Petri dish | Digital Holographic Microscopy | |||
| [66] | HeLa | Human | Cervix | - | X | Slide | Multimodal Holographic microscopy | |||||
Table 2.
Quantitative DH measurements of Jurkat cells treated with 250 µM etoposide for 24 h.
| Number of Cells | Confluence (%) | Av. Cell Area (μm2) | Av. Cell Optical Thickness Avg (μm2) | Av. Cell Optical Volume (μm3) | |
|---|---|---|---|---|---|
| Control | 226 ± 81 | 10.9 ± 3.8 | 143.4 ± 7.0 | 6.5 ± 0.4 | 1006.2 ± 121.1 |
| Etoposide | 114 ± 17 | 4.4 ± 0.5 | 115.0 ± 8.4 | 4.9 ± 0.2 | 584.0 ± 48.2 |
© 2018 by the authors. Licensee MDPI, Basel, Switzerland. This article is an open access article distributed under the terms and conditions of the Creative Commons Attribution (CC BY) license (http://creativecommons.org/licenses/by/4.0/).
Share and Cite
MDPI and ACS Style
El-Schich, Z.; Leida Mölder, A.; Gjörloff Wingren, A. Quantitative Phase Imaging for Label-Free Analysis of Cancer Cells—Focus on Digital Holographic Microscopy. Appl. Sci. 2018, 8, 1027. https://doi.org/10.3390/app8071027
AMA Style
El-Schich Z, Leida Mölder A, Gjörloff Wingren A. Quantitative Phase Imaging for Label-Free Analysis of Cancer Cells—Focus on Digital Holographic Microscopy. Applied Sciences. 2018; 8(7):1027. https://doi.org/10.3390/app8071027
Chicago/Turabian StyleEl-Schich, Zahra, Anna Leida Mölder, and Anette Gjörloff Wingren. 2018. "Quantitative Phase Imaging for Label-Free Analysis of Cancer Cells—Focus on Digital Holographic Microscopy" Applied Sciences 8, no. 7: 1027. https://doi.org/10.3390/app8071027
Note that from the first issue of 2016, this journal uses article numbers instead of page numbers. See further details here.