1. Introduction
The modeling of nanoantennas and nanocircuits depending on the material concept, i.e., a nanosized object as a working element of nano-device or a composite made of nano-inclusions as a macroscopic platform for antennas/circuit realization, could be provided in “top-down” and “bottom-up” approaches. The first one accesses the device realization by computation of microscopic electromagnetic response of nanoparticle (e.g., carbon nanotube) [
1,
2,
3], whereas the second one is expected to describe the collective effects of nanoparticles electromagnetics in the final composition caused by individual nanoparticles antennas’ properties through different homogenization and/or averaging techniques [
4,
5,
6,
7].
This communication is one of the second sort. It is motivated by an exceptional interest in nanocarbon based composites close or slightly above percolation concentration as the material support for design light and ultrathin effective electric components, optical and optoelectronic devices, constituent elements for electromagnetic compatibility realization [
6,
8]
Moreover, polymer nanocomposites close to or slightly above the electrical percolation threshold are of tremendous interest as a material-science basis for conformal structurally integrated microwave-to THz antennas [
1,
9].
The percolation threshold for multi-facial irregular media is a problem that was studied for a long time (see [
10,
11] and Refs. therein). In modern material science, the main focus is the percolation phenomena in composite with randomly distributed carbon nanoinclusions like graphite nanoplatelets, carbon nanotubes, carbon black, onion-like carbon, etc. [
12]. There are many approaches to simulate the nanocarbon composite system. For the case of nanotubes or fibers, the most obvious is to simulate it as a caped [
13,
14] or non-caped [
15,
16] cylinder. However, this approach is not universal because it does not allow to simulate all possible geometries of nanoinclusions.
All mentioned objects may be roughly modeled as ellipsoids of revolution with a different axial ratio. Many papers contribute to the modeling of the percolation threshold of overlapping ellipsoids [
17,
18,
19]. The method of overlapping inclusions is faster; it describes the transport properties in porous media well [
20], as well as the social phenomena [
21], etc. However, it is not accurate in the case of nanocarbon composites, because these particles are robust and cannot overlap. Very few papers contribute to the modeling of the percolation threshold for the suspension of the non-overlapping ellipsoids [
22,
23].
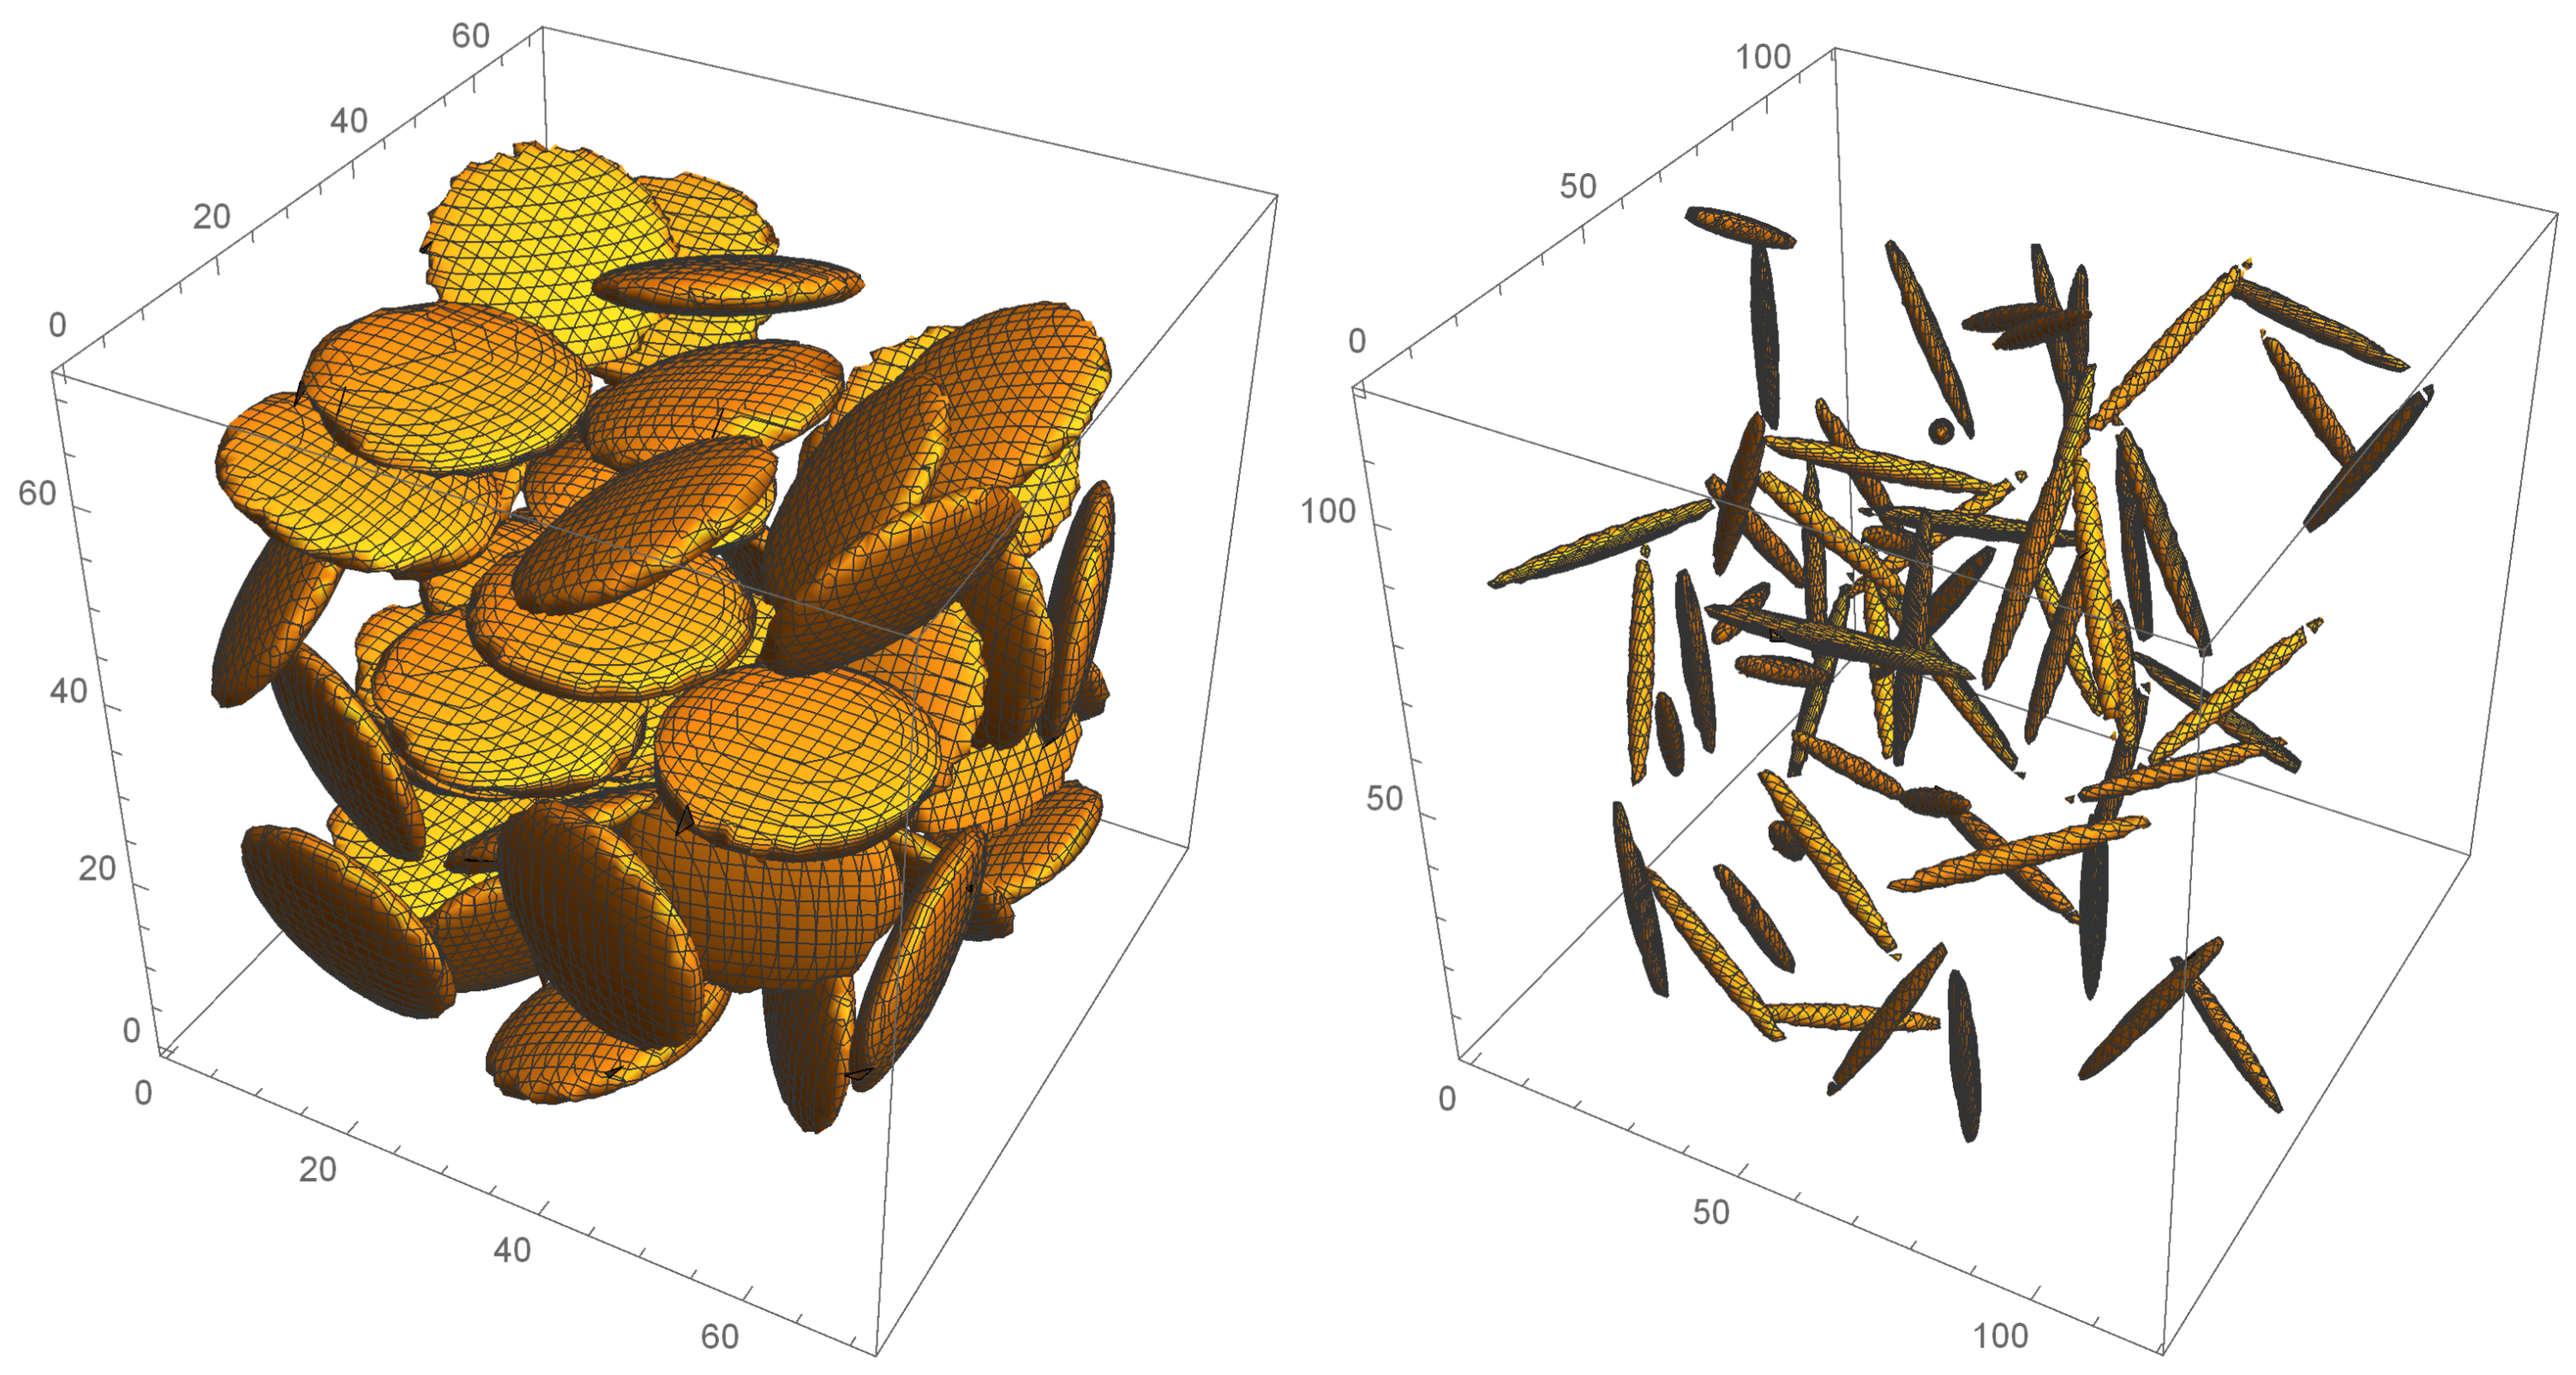
We report the Monte Carlo model for the calculation of the percolation of the ellipsoids distributed inside a cubic unit cell. The dependence of the percolation threshold on the ellipsoids’ distribution, unit cell size and the aspect ratio for the case of oblate ellipsoids will be discussed.
2. Modelling
The model generates the system of non-overlapping ellipsoids of revolution located inside the cubic unit cell. The dimensions , where d is the maximal diameter of the ellipsoid and .
2.1. Positioning the Ellipsoid in 3D Space
The ellipsoid with semiaxes
,
is a set of points
, that satisfy the condition:
where
is vector of ellipsoid center,
is positively defined matrix.
Any
can be converted to diagonal matrix
as follows:
Here
is diagonal matrix with elements
and
is Euler’s rotation matrix. The rotation matrix can be generally evaluated as a series of rotations:
Let be the semiaxes of the ellipsoid then, elements of A may be computed as . If (for the ellipsoid of revolution), the rotation turns to unitary. So, the total number of the coordinates is 5: . Using the described method, we can easily construct the ellipsoid of revolution with known orientation and position as a combination of the diagonal matrix and 5-component vector .
2.2. Distance between Ellipsoids
Minimal distance
between two ellipsoids
and
, is a solution of the minimisation problem:
where
S and
are the surfaces of ellipsoids. The equation
4 cannot be solved analyticaly, but there is a variety of numerical methods. All methods may be divided into geometrical [
24,
25] and algebraical [
26,
27].
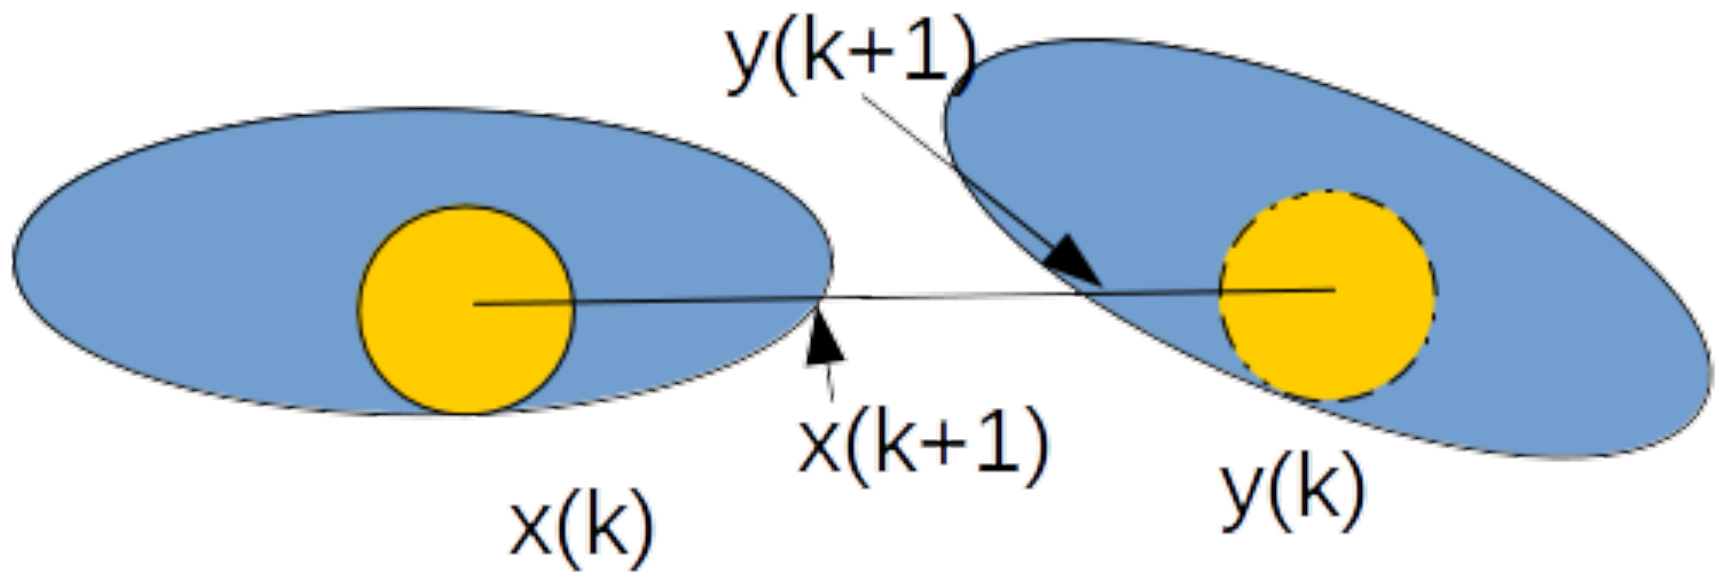
Here we will use the geometrical approach developed by Lin and Han [
25]. The idea of the method is to construct two balls completely inside each ellipsoid (see
Figure 1).
Then we check whether the line segment [, ] between the two centers is entirely contained in . If it is, then the two ellipsoids have a nonempty intersection and the distance ; otherwise, we continue and compute new point as the intersection of the line segment [, ] with the boundary S, and also as the intersection of [, ] with the boundary . As the accuracy criteria the angles between segments and can be used.
2.3. Composite Generation Procedure
The procedure of the composite creation is follows. On
i-th step, we generate random
K as:
Next, two conditions should be satisfied:
- i
i-th the ellipsoid should not intersect the walls of the unit cell.
- ii
i-th ellipsoid should not penetrate into any ellipsoid of the already existing system of i−1.
For the real nanocarbon composite (ii), condition is more strict. Taking into account the Van der Waals separation, the minimal separation between two ellipsoids here is considered as 0.34 nm. If both conditions are satisfied then we store
i-th ellipsoid, if not—we abandon it and make a new attempt for
i-th (see
Figure 2).
2.4. Percolation Computation
Once the system is computed, well-known Dijkstra’s [
28] algorithm may be applied for the calculation of the percolation path. The tunnelling distance of 2 nm was used as a connection criterion. Next, for Dijkstra protocol, we have to select an initial and final point (edge) of the graph. Obviously, these points are the ellipsoids located near
i-th border of the unit cell and the border opposite to
i-th correspondingly. Periodic boundary conditions are utilised. So the distance between the ellipsoid near the
i-th boarder, and the opposite one shifted along the chosen direction on the unit cell, should be less than the predefined separation of 2 nm. If this condition is satisfied, the ellipsoids are considered as the initial and final points of the graph.
Finally, the boolean vector of the percolation may be computed. We consider the system percolated if it is percolated in at least one direction.
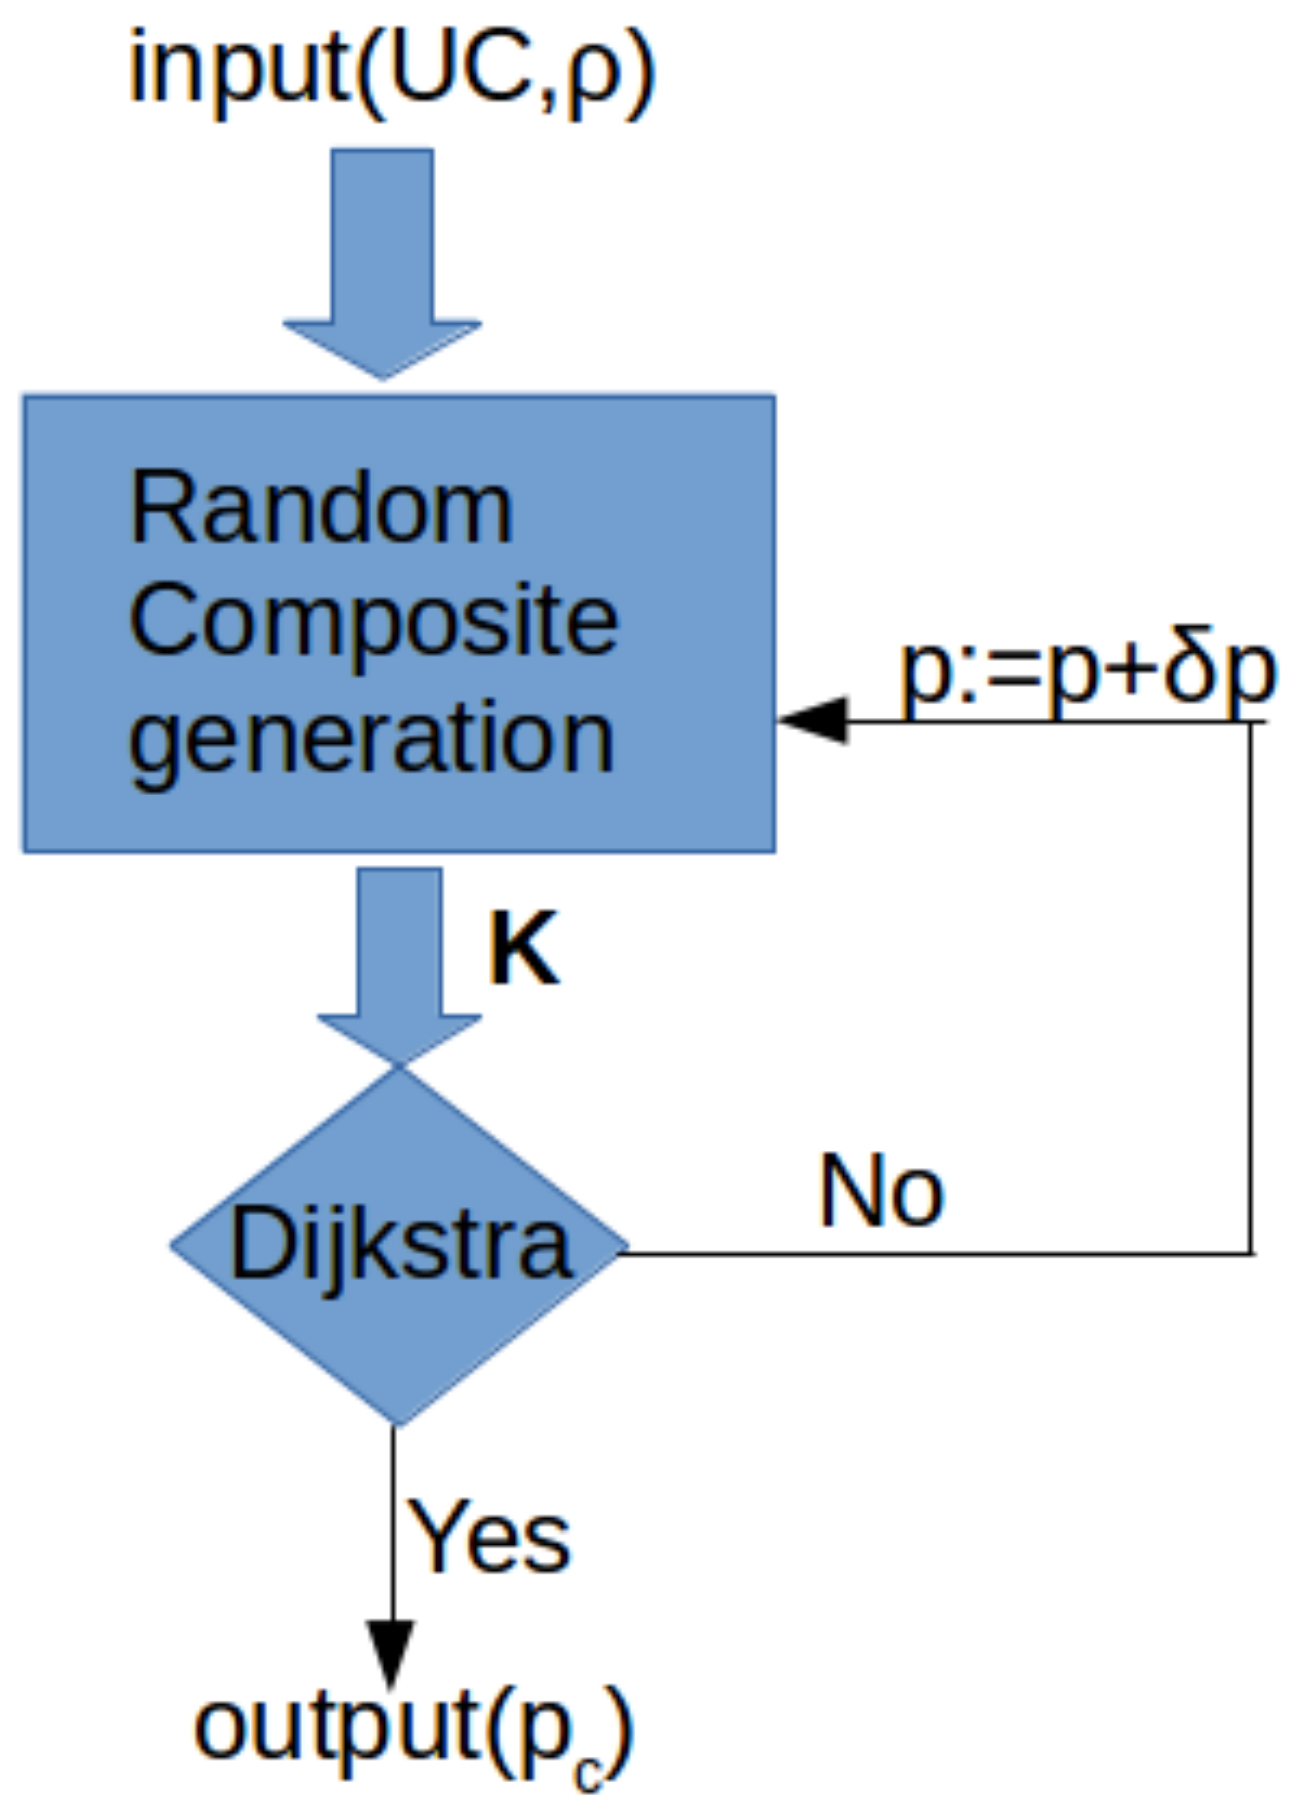
2.5. Total Algorithm
The total algorithm organized as Tabu search method [
29,
30,
31] and performs as follows:
Generation of the composite of ellipsoids, where p is the volume fraction. A result of this step is an array of ellipsoid coordinates . The number of strings is .
Checking if the system is percolated.
If it is, we then terminate, if not, we go back to (1) with
and construct new composite. The implementation of the algorithm is written with Fortran (see
Figure 3).
3. Result and Discussion
3.1. Two-Phase system
For the ellipsoid of revolution
, then the aspect ratio can be introduced as
,
. In this paper we consider
nm, so the total thickness corresponds to 14 graphite interlayer distances. The formation of the percolation paths depends on the concentration of filler, and also the distribution of the inclusions. The distribution effect as studied for the system filled with ellipsoids of
. We made 10,000 observations for
n = 3, 7000 for
n = 4 and 3000 for
n = 5. The percolation probability function is presented in
Figure 4.
The empiric probability functions are governed by the Weibull probability function,
[
32]. The parameters of equation are follows:
= 0.115,
k = 8.797 for
n = 3;
= 0.113,
k = 12.092 for
n = 4, and
= 0.113,
k = 14.90 for
n = 5. The Weibull function describes “time-to-failure” and it is typical for percolation processes [
33,
34,
35]. All the probability functions for different cell size are closely collapsed, but the diffusion is slightly decreased from
n = 3 to
n = 5, that corresponds to the rise of
k. This means that the percolation threshold is independent of the UC. The diffusion difference may be explained by the finite volume fraction of the single ellipsoid inside the unit cell. On the other hand, the calculation time increases drastically with UC rise, so the UC size of
n = 3 is optimal for the calculation of the composites with ellipsoids of higher aspect ratio.
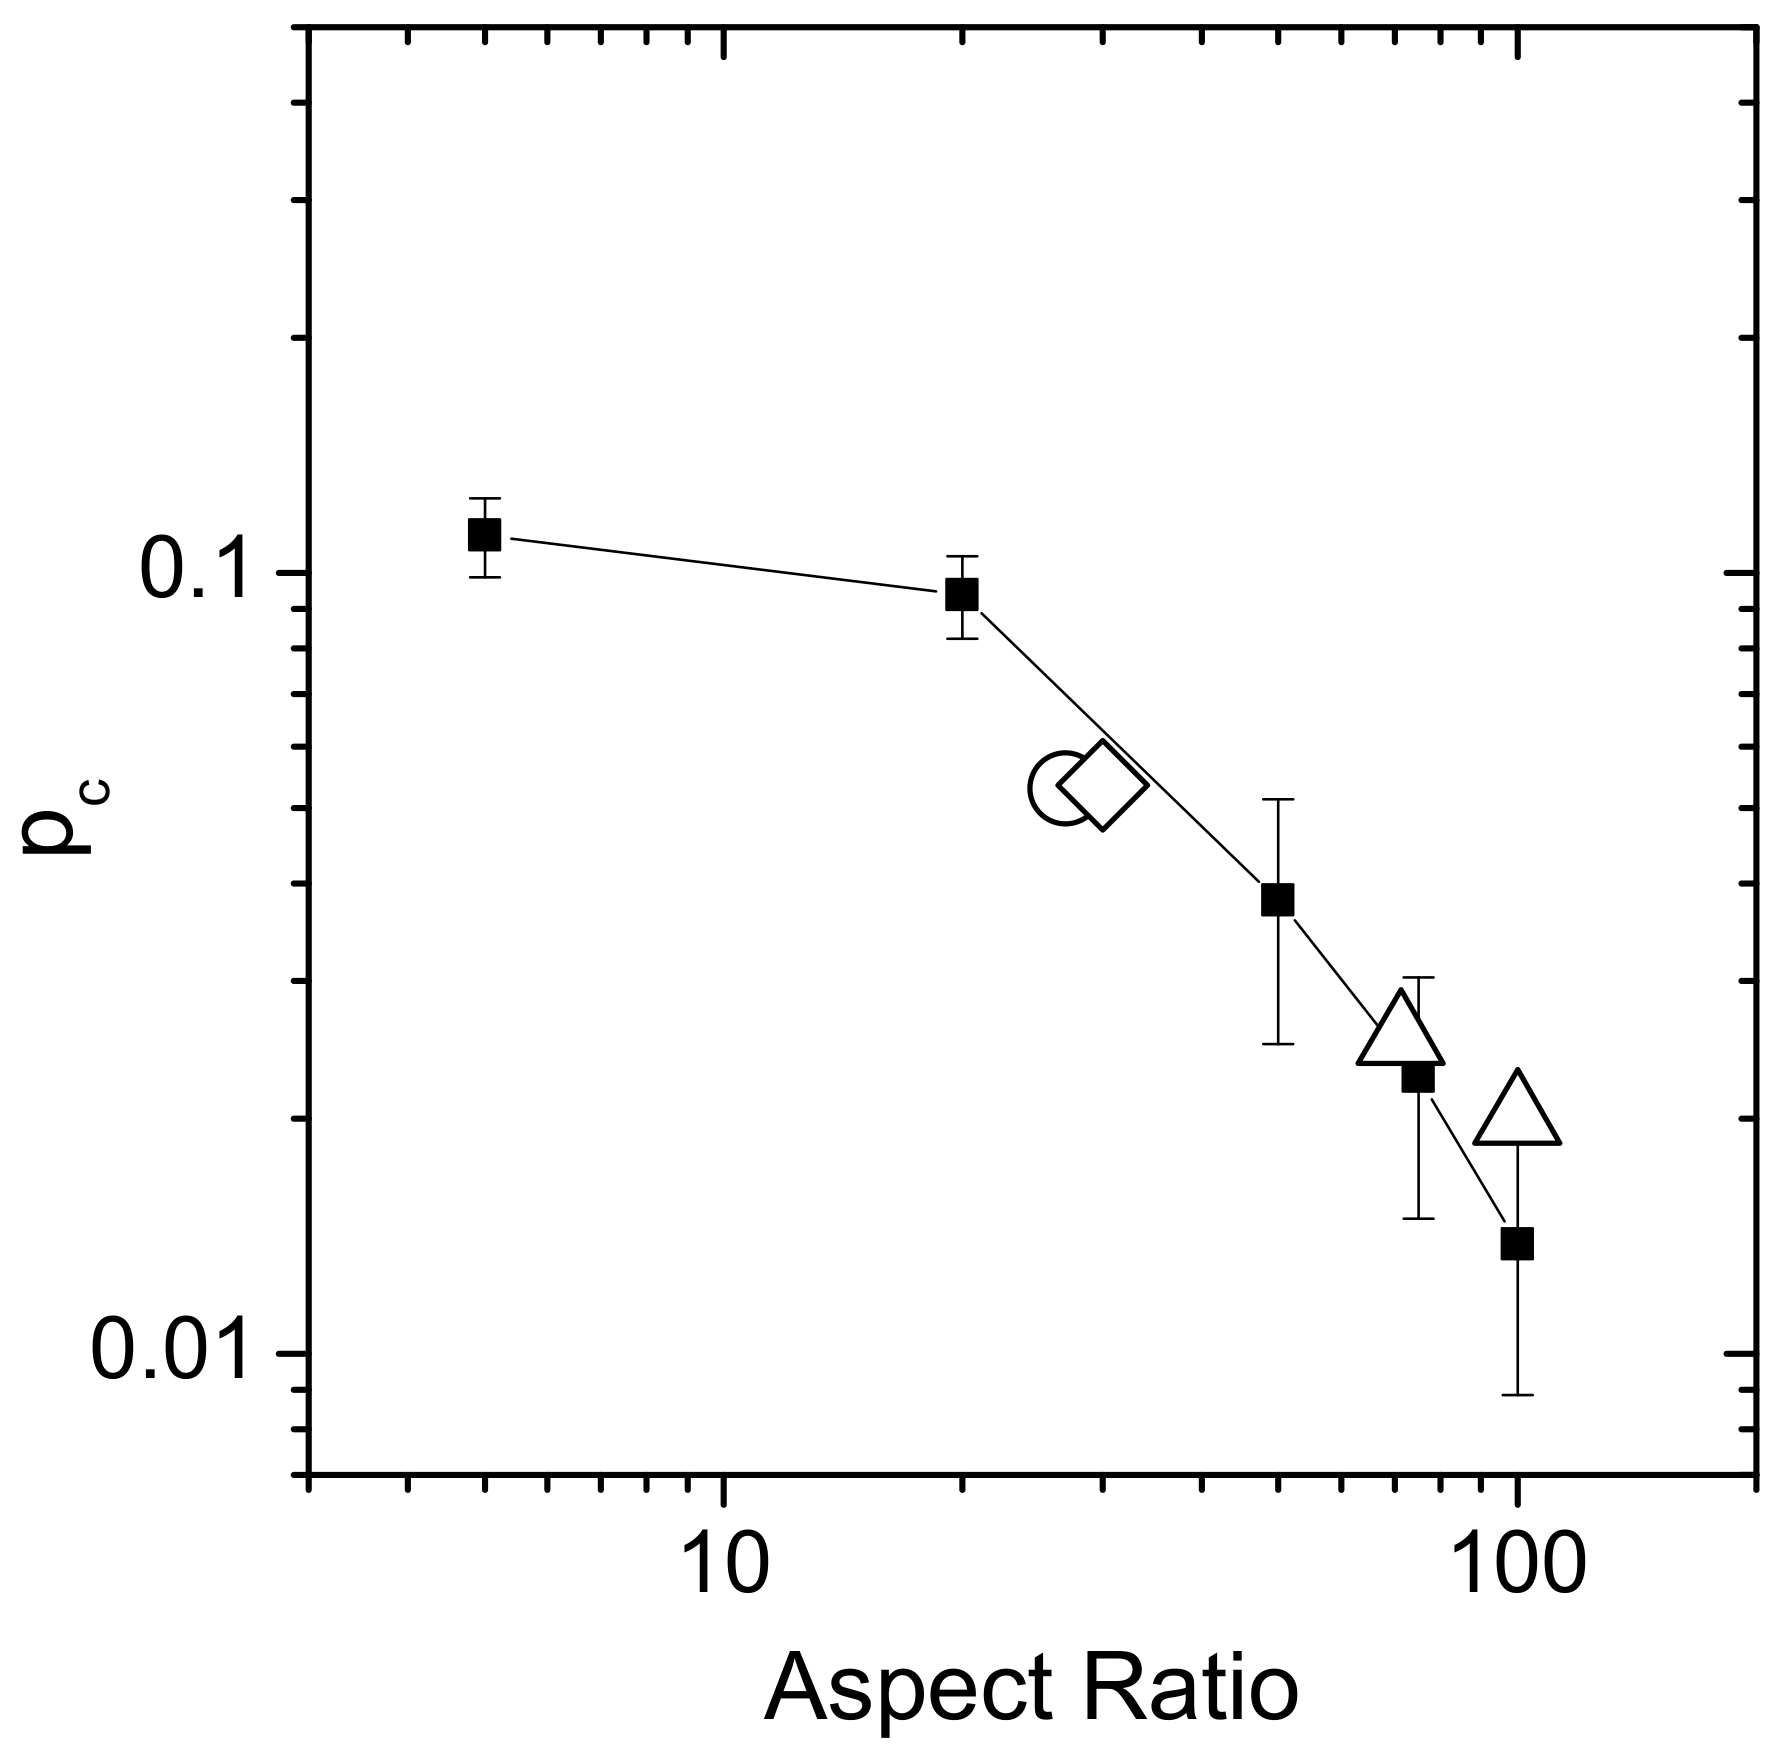
Figure 5 shows the dependence of the percolation threshold on the ellipsoids aspect ratio. As expected, the percolation threshold decreases with the aspect ratio rise. The resulting dependence is in good agreement with experimental data [
36,
37,
38] and theoretical modeling [
17,
39].
3.2. Three-phase system (Hybrids)
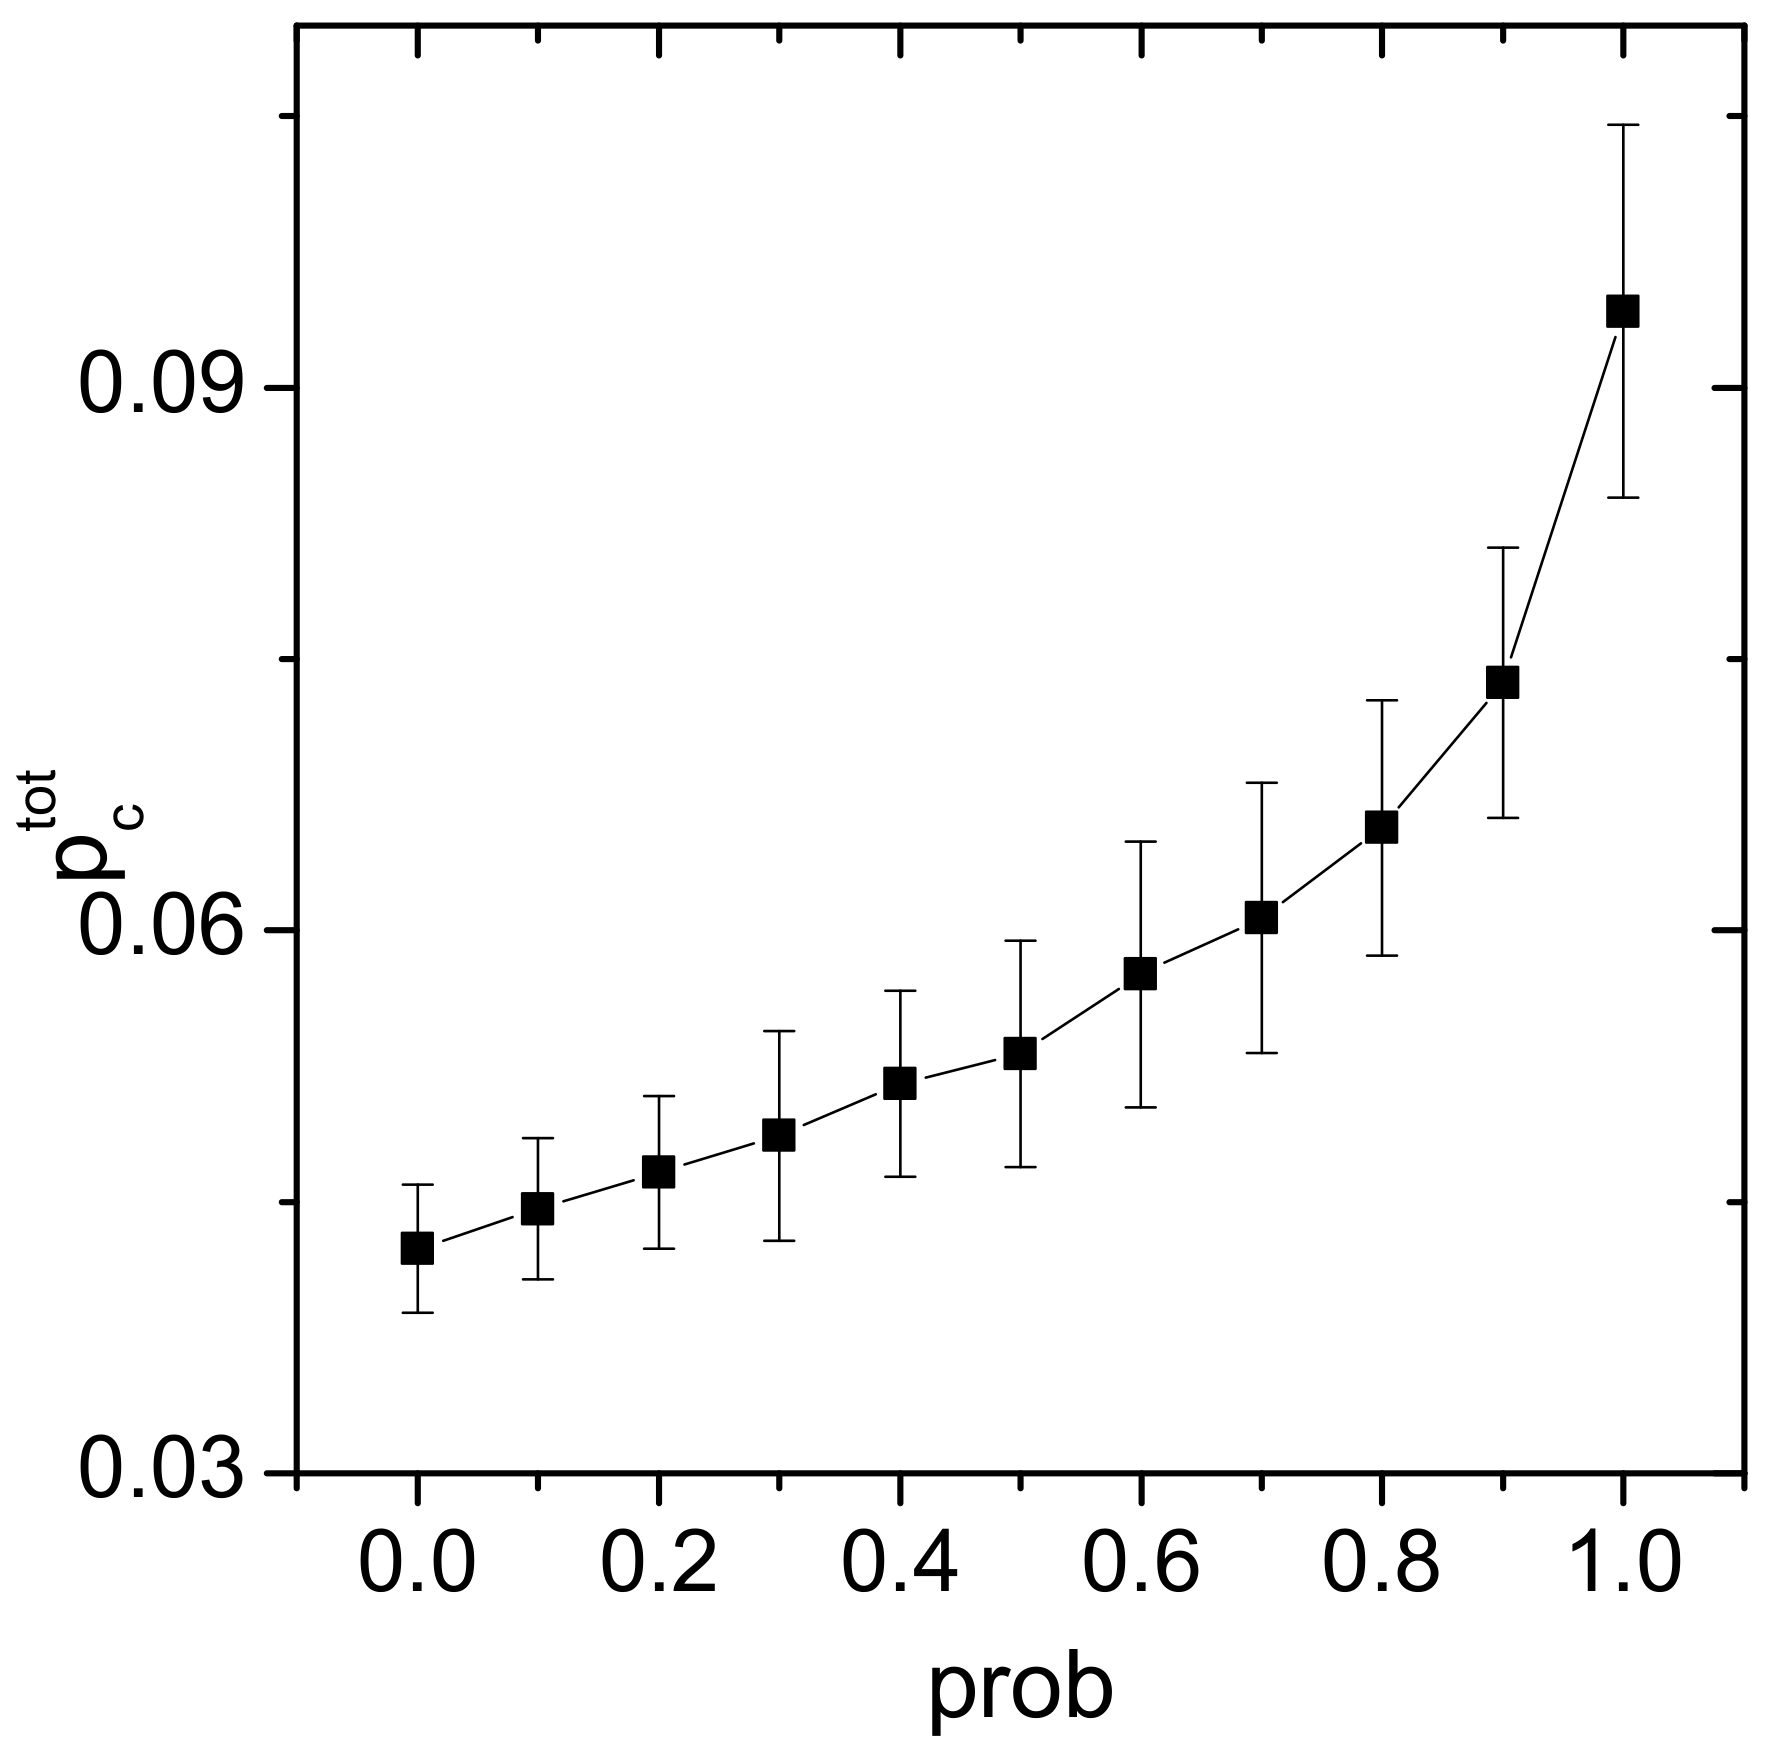
The calculation of the percolation of hybrid composite requires the modification of composite generation procedure
Section 2.3. The generation is organised “one in time”. We introduce the parameter
—the probability of the GNP appearance, then 1-
is the probability of the CNT appearance. So, upon the generation procedure, each
i-th particle has the probability to be “born” as GNP or CNT. After, the percolation was computed using the standard protocol. For the hybrid composite, we consider
as a total volume fraction of the inclusions required for the percolation. Obviously, for the hybrids total concentration may be presented as a sum of partial concentrations as
. The dependence of the
is presented on
Figure 6. For the case of prob = 1 and 0, the data was verified with the model for 1 type of inclusions. For the calculations two types of ellipsoids were used:
nm,
nm, and
nm,
nm.
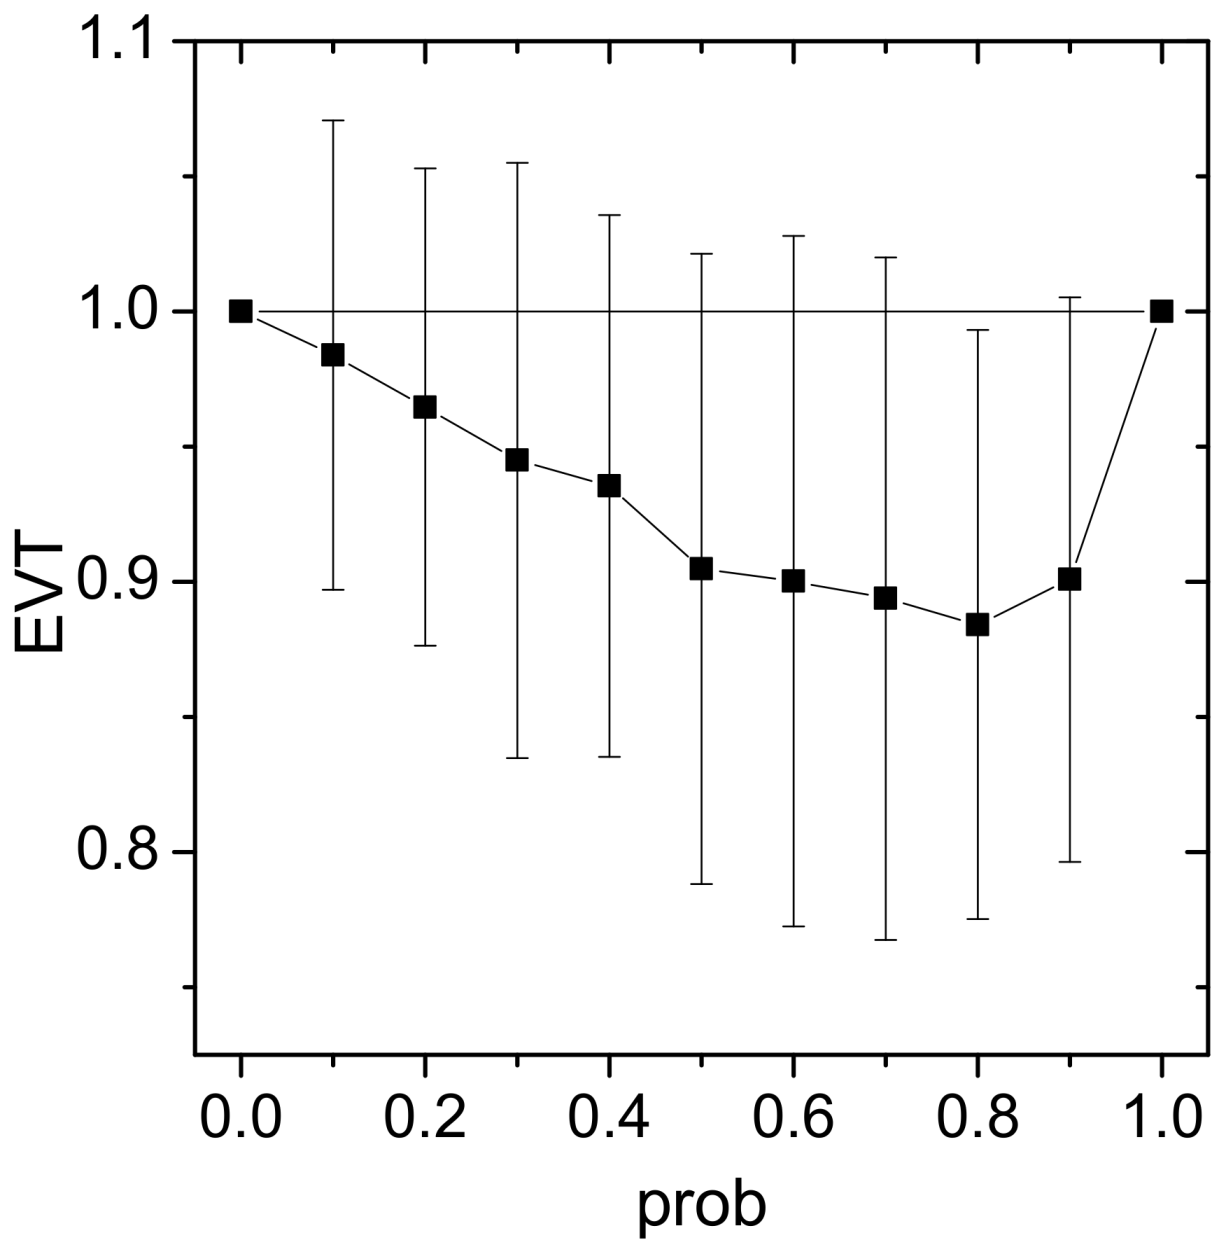
The excluded volume theory states that the percolation for the hybrid composites [
40] occurs if the following condition is satisfied:
where
and
are partial concentrations of the GNP and CNT in hybrid composite, and
and
are the critical concentrations for composites with GNP (
) and CNT (
= 0). However, a lot of experimental works evident the percolation even if the condition Equation (
6) is not satisfied [
41,
42,
43]. In our case, the exact number of GNP and CNT is known for each configuration, so we can easily calculate the EVT-parameter. The result is presented in
Figure 7. The mean value of EVT is below 1 for all studied configurations. The dependence demonstrates minimum at
= 0.7–0.8. We can preliminarily conclude that there is some optimum combination of CNT and GNP in hybrid composites.
4. Conclusions
This study is the next computational physics step in the series of our papers [
44,
45,
46] to approach electromagnetic components such as antennas, filters, polarizers, shields by using conductive/dielectric composite materials based on carbon additives. We present a Monte Carlo model for the calculation of the percolation threshold in the irregular system filled with ellipsoids of revolution. We demonstrate that the percolation concentration is independent of the unit cell size. The percolation concentration dependence on the aspect ratio of nanoinclusions is in the good agreement with that previously reported [
17,
22,
23,
39].
The reported model can be applied for nanocarbon containing composites as it supports the real experimental situation when percolated additives do not penetrate each other. The important advantage of the present model is that it can be easily applied for the modelling of multi-components composites, e.g., containing graphene nanoplatelets, carbon black and carbon nanotubes, by means of utilising the ellipsoids of different aspect ratio with the filling fraction corresponding to concentrations of each type of inclusion. This tested in simple case of one- and two-component composite (two and three-phase systems respectively) MC model could be used in a pre-experimental step for producing effective close-to percolation and percolated nanocomposites for various mechanical, thermal and electromagnetic applications to avoid time- and resources consuming “sort-out” experimental phase, that should lead to the design of optimal composition of many functional components providing e.g., the lowest overall percolative concentration at the lowest content of the most expensive functional additive, retaining at the same time high performance and functionality.
Author Contributions
A.P. and P.L. designed the computational experiments, A.P. developed the M.C. model, J.M. and G.S. tested the model vs. real experimental situation, A.P. and P.K. conceived the task as well as methodolgy and wrote the manuscript.
Funding
This research was funded by H2020 Marie Skłodowska-Curie Actions, grant number 734164 Graphene 3D, and Tomsk State University Competitiveness Improvement Program.
Acknowledgments
The authors acknowledge financial supports of Multifunctional Graphene-based Nanocomposites with Robust Electromagnetic and Thermal Properties for 3D-printing Application, project H2020 RISE 734164 Graphene 3D. PK is thankful for support by Tomsk State University Competitiveness Improvement Program. Authors are thankfull to Oleg Plyushch for valuable discussion.
Conflicts of Interest
The authors declare no conflict of interest.
References
- Shuba, M.; Paddubskaya, A.; Plyushch, A.; Kuzhir, P.; Slepyan, G.Y.; Maksimenko, S.; Ksenevich, V.; Buka, P.; Seliuta, D.; Kasalynas, I.; et al. Experimental evidence of localized plasmon resonance in composite materials containing single-wall carbon nanotubes. Phys. Rev. B 2012, 85, 165435. [Google Scholar] [CrossRef]
- Hanson, G.W. Fundamental transmitting properties of carbon nanotube antennas. IEEE Trans. Antennas Propag. 2005, 53, 3426–3435. [Google Scholar] [CrossRef]
- Burke, P.J.; Li, S.; Yu, Z. Quantitative theory of nanowire and nanotube antenna performance. IEEE Trans. Nanotechnol. 2006, 5, 314–334. [Google Scholar] [CrossRef]
- Spitalsky, Z.; Tasis, D.; Papagelis, K.; Galiotis, C. Carbon nanotube–polymer composites: Chemistry, processing, mechanical and electrical properties. Prog. Polym. Sci. 2010, 35, 357–401. [Google Scholar] [CrossRef]
- Kuzhir, P.; Paddubskaya, A.; Bychanok, D.; Nemilentsau, A.; Shuba, M.; Plusch, A.; Maksimenko, S.; Bellucci, S.; Coderoni, L.; Micciulla, F.; et al. Microwave probing of nanocarbon based epoxy resin composite films: Toward electromagnetic shielding. Thin Solid Films 2011, 519, 4114–4118. [Google Scholar] [CrossRef]
- Bauhofer, W.; Kovacs, J.Z. A review and analysis of electrical percolation in carbon nanotube polymer composites. Compos. Sci. Technol. 2009, 69, 1486–1498. [Google Scholar] [CrossRef]
- Qin, F.; Brosseau, C. A review and analysis of microwave absorption in polymer composites filled with carbonaceous particles. J. Appl. Phys. 2012, 111, 4. [Google Scholar] [CrossRef]
- Sandler, J.; Kirk, J.; Kinloch, I.; Shaffer, M.; Windle, A. Ultra-low electrical percolation threshold in carbon-nanotube-epoxy composites. Polymer 2003, 44, 5893–5899. [Google Scholar] [CrossRef]
- Slepyan, G.Y.; Shuba, M.; Maksimenko, S.; Lakhtakia, A. Theory of optical scattering by achiral carbon nanotubes and their potential as optical nanoantennas. Phys. Rev. B 2006, 73, 195416. [Google Scholar] [CrossRef]
- Grimmett, G. What is Percolation. In Percolation; Springer: Berlin, Germany, 1999; pp. 1–31. [Google Scholar]
- Stauffer, D.; Aharony, A. Introduction to Percolation Theory; CRC Press: Boca Raton, FL, USA, 1994. [Google Scholar]
- Celzard, A.; McRae, E.; Deleuze, C.; Dufort, M.; Furdin, G.; Marêché, J. Critical concentration in percolating systems containing a high-aspect-ratio filler. Phys. Rev. B 1996, 53, 6209. [Google Scholar] [CrossRef]
- Balberg, I.; Binenbaum, N.; Wagner, N. Percolation thresholds in the three-dimensional sticks system. Phys. Rev. Lett. 1984, 52, 1465. [Google Scholar] [CrossRef]
- Bug, A.; Safran, S.; Webman, I. Continuum percolation of rods. Phys. Rev. Lett. 1985, 54, 1412. [Google Scholar] [CrossRef] [PubMed]
- De Vivo, B.; Lamberti, P.; Spinelli, G.; Tucci, V. A morphological and structural approach to evaluate the electromagnetic performances of composites based on random networks of carbon nanotubes. J. Appl. Phys. 2014, 115, 154311. [Google Scholar] [CrossRef]
- De Vivo, B.; Lamberti, P.; Spinelli, G.; Tucci, V. Numerical investigation on the influence factors of the electrical properties of carbon nanotubes-filled composites. J. Appl. Phys. 2013, 113, 244301. [Google Scholar] [CrossRef]
- Garboczi, E.; Snyder, K.; Douglas, J.; Thorpe, M. Geometrical percolation threshold of overlapping ellipsoids. Phys. Rev. E 1995, 52, 819. [Google Scholar] [CrossRef]
- Yi, Y.B.; Sastry, A. Analytical approximation of the two-dimensional percolation threshold for fields of overlapping ellipses. Phys. Rev. E 2002, 66, 066130. [Google Scholar] [CrossRef] [PubMed]
- Yi, Y.B.; Wang, C.W.; Sastry, A. Two-dimensional vs. three-dimensional clustering and percolation in fields of overlapping ellipsoids. J. Electrochem. Soc. 2004, 151, A1292–A1300. [Google Scholar] [CrossRef]
- Feng, S.; Halperin, B.; Sen, P. Transport properties of continuum systems near the percolation threshold. Phys. Rev. B 1987, 35, 197. [Google Scholar] [CrossRef]
- Fujie, R.; Odagaki, T. Effects of superspreaders in spread of epidemic. Phys. A Stat. Mech. Appl. 2007, 374, 843–852. [Google Scholar] [CrossRef]
- Sagalianov, I.Y.; Lazarenko, O.A.; Vovchenko, L.L.; Matzui, L.Y. Monte-Carlo study of the percolation in a binary composites: Hardcore and softcore models comparison. In Proceedings of the 2017 IEEE 7th International Conference on Nanomaterials: Application & Properties (NAP), Odessa, Ukraine, 10–15 September 2017. [Google Scholar]
- Akagawa, S.; Odagaki, T. Geometrical percolation of hard-core ellipsoids of revolution in the continuum. Phys. Rev. E 2007, 76, 051402. [Google Scholar] [CrossRef] [PubMed]
- Kosolap, A. Quadratic Optimization Problems of Computer Geometry. Art. Int. 2009, 1, 70–75. [Google Scholar]
- Lin, A.; Han, S.P. On the distance between two ellipsoids. SIAM J. Optim. 2002, 13, 298–308. [Google Scholar] [CrossRef]
- Tamasyan, G.S.; Chumakov, A.A. Finding the distance between ellipsoids. J. Appl. Ind. Math. 2014, 8, 400–410. [Google Scholar] [CrossRef]
- Uteshev, A.Y.; Yashina, M. Computation of the distance from an ellipsoid to a linear surface and a quadric in Rn. In Doklady Mathematics; Springer: Berlin, Germany, 2008; Volume 77, pp. 269–272. [Google Scholar]
- Dijkstra, E.W. A note on two problems in connexion with graphs. Numer. Math. 1959, 1, 269–271. [Google Scholar] [CrossRef]
- Glover, F. Tabu search—Part I. ORSA J. Comput. 1989, 1, 190–206. [Google Scholar] [CrossRef]
- Glover, F. Tabu search—Part II. ORSA J. Comput. 1990, 2, 4–32. [Google Scholar] [CrossRef]
- Glover, F.; Laguna, M. Tabu Search. In Handbook of Combinatorial Optimization; Springer: Berlin, Germany, 2013; pp. 3261–3362. [Google Scholar]
- Weibull, W. A statistical distribution function of wide applicability. J. Appl. Mech. 1951, 18, 293–297. [Google Scholar]
- Stathis, J. Percolation models for gate oxide breakdown. J. Appl. Phys. 1999, 86, 5757–5766. [Google Scholar] [CrossRef]
- Kauerauf, T.; Degraeve, R.; Cartier, E.; Soens, C.; Groeseneken, G. Low Weibull slope of breakdown distributions in high-k layers. IEEE Electron Device Lett. 2002, 23, 215–217. [Google Scholar] [CrossRef]
- Long, S.; Lian, X.; Cagli, C.; Perniola, L.; Miranda, E.; Liu, M.; Suñé, J. A model for the set statistics of RRAM inspired in the percolation model of oxide breakdown. IEEE Electron Device Lett. 2013, 34, 999–1001. [Google Scholar] [CrossRef]
- Li, B.; Zhong, W.H. Review on polymer/graphite nanoplatelet nanocomposites. J. Mater. Sci. 2011, 46, 5595–5614. [Google Scholar] [CrossRef]
- Araby, S.; Meng, Q.; Zhang, L.; Kang, H.; Majewski, P.; Tang, Y.; Ma, J. Electrically and thermally conductive elastomer/graphene nanocomposites by solution mixing. Polymer 2014, 55, 201–210. [Google Scholar] [CrossRef]
- Shen, J.W.; Huang, W.Y.; Zuo, S.W.; Hou, J. Polyethylene/grafted polyethylene/graphite nanocomposites: Preparation, structure, and electrical properties. J. Appl. Polym. Sci. 2005, 97, 51–59. [Google Scholar] [CrossRef]
- Celzard, A.; Marêché, J.; Payot, F. Simple method for characterizing synthetic graphite powders. J. Phys. D Appl. Phys. 2000, 33, 1556. [Google Scholar] [CrossRef]
- Sun, Y.; Bao, H.D.; Guo, Z.X.; Yu, J. Modeling of the electrical percolation of mixed carbon fillers in polymer-based composites. Macromolecules 2008, 42, 459–463. [Google Scholar] [CrossRef]
- Kranauskaite, I.; Macutkevic, J.; Banys, J.; Talik, E.; Kuznetsov, V.; Nunn, N.; Shenderova, O. Synergy effects in the electrical conductivity behavior of onion-like carbon and multiwalled carbon nanotubes composites. Phys. Status Solidi B 2015, 252, 1799–1803. [Google Scholar] [CrossRef]
- Drubetski, M.; Siegmann, A.; Narkis, M. Electrical properties of hybrid carbon black/carbon fiber polypropylene composites. J. Mater. Sci. 2007, 42, 1–8. [Google Scholar] [CrossRef]
- Yue, L.; Pircheraghi, G.; Monemian, S.A.; Manas-Zloczower, I. Epoxy composites with carbon nanotubes and graphene nanoplatelets–Dispersion and synergy effects. Carbon 2014, 78, 268–278. [Google Scholar] [CrossRef]
- Bychanok, D.; Angelova, P.; Paddubskaya, A.; Meisak, D.; Shashkova, L.; Demidenko, M.; Plyushch, A.; Ivanov, E.; Krastev, R.; Kotsilkova, R.; et al. Terahertz absorption in graphite nanoplatelets/polylactic acid composites. J. Phys. D Appl. Phys. 2018, 51, 145307. [Google Scholar] [CrossRef]
- Shuba, M.; Yuko, D.; Kuzhir, P.; Maksimenko, S.; Kanygin, M.; Okotrub, A.; Tenne, R.; Lambin, P. How effectively do carbon nanotube inclusions contribute to the electromagnetic performance of a composite material? Estimation criteria from microwave and terahertz measurements. Carbon 2018, 129, 688–694. [Google Scholar] [CrossRef]
- Guadagno, L.; Naddeo, C.; Raimondo, M.; Barra, G.; Vertuccio, L.; Russo, S.; Lafdi, K.; Tucci, V.; Spinelli, G.; Lamberti, P. Influence of carbon nanoparticles/epoxy matrix interaction on mechanical, electrical and transport properties of structural advanced materials. Nanotechnology 2017, 28, 094001. [Google Scholar] [CrossRef] [PubMed]
© 2018 by the authors. Licensee MDPI, Basel, Switzerland. This article is an open access article distributed under the terms and conditions of the Creative Commons Attribution (CC BY) license (http://creativecommons.org/licenses/by/4.0/).

 ,
, 


