Finite Element Modeling of an Aircraft Tire Rolling on a Steel Drum: Experimental Investigations and Numerical Simulations


Aix-Marseille University CNRS, Centrale Marseille, LMA, F-13453 Marseille CEDEX 13, France
*
Author to whom correspondence should be addressed.
Appl. Sci. 2018, 8(4), 593; https://doi.org/10.3390/app8040593
Submission received: 23 January 2018
/
Revised: 1 March 2018
/
Accepted: 16 March 2018
/
Published: 10 April 2018
(This article belongs to the Special Issue Viscoelastic Solids: Mechanical Behaviour, Contact Mechanics, Fracture and Wear)
Abstract
:The aim of this study is to investigate the thermal evolution of an aircraft tire rolling at high velocities up to take off values. As this kind of experiment is difficult to realize on a real runway, experimental tests were realized on aircraft tires rolling on a steel drum. The rotating drum facility allows to apply variable velocities beyond the take off limits, at fixed skidding angles and loadings. The rolling conditions, vertical loading, velocity and cornering conditions were adopted to correspond to the real conditions of an aircraft tire running or skidding on a flat runway. In the experimental part, the influence of skidding angle, velocity and loading on the thermal evolution of the tire tread were investigated. The thermo-mechanical finite element analysis of a pneumatic radial tire structure was performed taking into account the hyper-viscoelastic rubber behavior, with heating mechanisms developed by the inelastic deformation and by friction. Three-dimensional finite element simulations of an aircraft tire rolling on a steel drum were carried out using Abaqus/Standard finite element solver. The comparison of the temperature distribution on the tire tread between numerical results and the experimental data shows the same overall tendencies. The good correlation between numerical and experimental data shows that numerical simulation could predict the thermal evolution of the tire in critical situations. The authors would like to mention that for confidentiality reason, certain numerical data could not be revealed.
1. Introduction
The development of aircraft with high performance characteristics has placed increased demands on landing gear and tire components. Aircraft tires have developed through the years to a point where the ratio of tire weight to aircraft weight has progressively decreased, due in part to improved tire cord materials, rubber compounds, and tire structural design. During landing and extreme cornering phases, aircraft tires are subjected to different mechanical and thermal cyclic loading scenarios. Thus, the tire undergoes significant vertical and lateral forces, internal and external thermal heating, generating severe wear. This last leads to loss of grip and efficiency which are critical for aircraft security. Thus, a need exists for the development of methods for predicting the strength limit, the thermal evolution of aircraft tires on some rational basis other than indoor testing.
The thermal evolution of aircraft tire is related to the friction and the energy loss (hysteresis) phenomena produced during landing and skidding situations. Heating is generated within the tire structure and affects its service life. The estimation of the heat build-up is essential for evaluating the durability of the tire. Aircraft tires generate significant temperatures during landing and taxi-driving. The temperatures are high enough to critically damage the strength of the load-carrying fabric components in the tire. Excessive temperatures can easily cause the failure of the tire even if the stress levels are not excessively high [1]. In addition to the interaction between temperature and stress, complex phenomena are at work in the repeated daily use of aircraft tires. These phenomena are basically related to the long-term strength degradation and grip loss of an aircraft tire due to cyclic variations in stress and temperature. Indeed, all information available for tire life expectancy are based mostly on experimental studies and suffer from speed and loading limitations.
In the literature, many researches are dedicated to the thermal prediction of passenger vehicle tires. Several numerical approaches were developed. Sarkar et al. [2] have carried out a thermo-mechanical analysis for an approximated two-dimensional tire structure. This approach leads to a pseudo steady-state temperature profile for a rolling tire. Ebbott et al. [3] have proposed a coupled thermo-mechanical method, in which the stiffness and the loss of properties are functions of the strain, temperature and loading frequency. Results for rolling resistance and steady state temperature distribution are compared with experiments for passenger vehicle and radial medium truck tires. Chae et al. [4] developed a nonlinear Finite Element model of a radial-ply truck tire rolling on a drum by using explicit FEA simulation software. The tire model was constructed to its extreme complexity with solid, layered membranes, and beam elements. In addition to the tire model, a rim model was included and rotated with the tire with its proper mass and rotational inertial effects. The predicted tire characteristics and responses, such as vertical stiffness, cornering force, and aligning moment, correlated to physical measurements. In this study, the in-plane sidewall translational stiffness and damping constants of the FEA tire model were determined by rotating the tire on a cleat-drum. The other in-plane parameters, such as tire rotational stiffness and damping constant, were determined by applying and releasing a tangential force on the tread band of the FEA tire model.
The thermal evolution of tires has a significant influence on tire behavior. Therefore it is crucial to assess the tire temperature during testing, in order to integrate the temperature effects in the numerical simulations. As it was mentioned, there is a direct relationship between tire temperature and the energy loss in the tire. Temperature of the rubber in the tire’s tread can be measured using different methods ranging from simple sensor (internal or external) to high speed infrared camera [5].
The numerical simulation by means of a finite element model represents today an essential tool for tire development. This technique complements and validates the experimental investigations. The thermo-mechanical properties of the tire tread rubber have a direct influence on its dynamic behavior. The thermal and dynamic behavior of rubber tires are generally determined by their viscoelastic properties which lead to energy dissipation, and consequent heating within the rubber material under dynamic loading. These hysteresis effects as well as rubber stiffness depend on the loading frequency, velocity and temperature. In the literature, few experimental studies are focused on the thermal evolution of aircraft tires; the experimental techniques required to identify the tire operating temperatures are still complicated and extremely sophisticated. The goal of this research work is to investigate the thermal evolution of an aircraft tire rolling on a drum. This work follows the previous researches on aircraft tires [5,6,7,8,9], in which finite element models were proposed for coupled thermo-mechanical analysis of the same type of aircraft tire in contact with a flat runway.
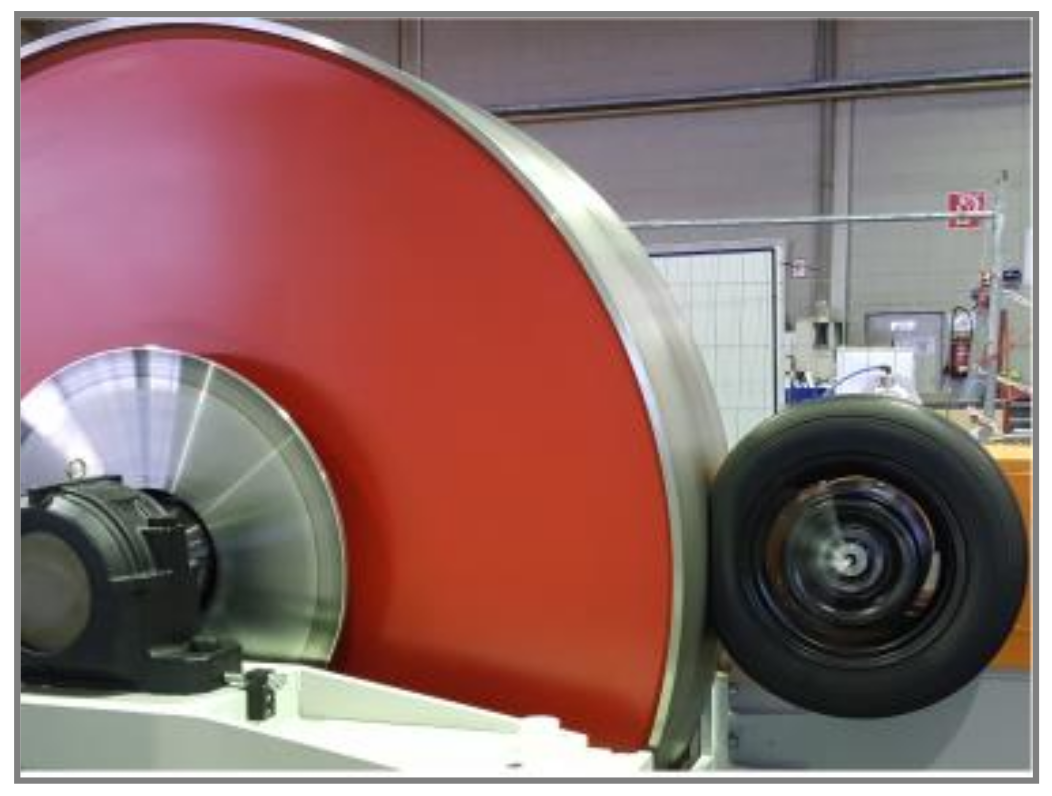
Drum Testing Machine
Testing a tire on a real runway still remains an expensive and difficult task, especially at high velocity. Therefore, drum-tire machines represent a suitable alternative. Tires could be tested in contact with the inner or the outer surface of the drum. The internal contact drum tests are frequently used to investigate the influence of the tread pattern design, tread groove, water depth, cornering and braking force capability of the tire on a wet runway. External contact drums with diameter of 1.8 m or 2.0 m are usually used to measure the rolling resistance of vehicle tires (Figure 1). The rolling resistance measured on these test rigs is higher than the rolling resistance measured on a flat surface. This deviation is caused by the drum’s curvature. Clark et al. [10] developed a model, which converts the rolling resistance of a tire measured on a curved surface into the corresponding rolling resistance on a plane runway. Indoor laboratory drum tests are generally run on large diameter drums, at an ambient temperature of 23 °C. Most industry high speed tire tests call for 80% of the maximum loading. In these tests, in order to avoid tire wear, velocity increases by 10 km/h every 10 min increment until the specified speed is achieved. Inflation pressure varies according to the tire type and velocity rating. The reduced pressure is an adjustment to obtain an equivalent tire deflation on the drum’s curved surface to the one expected on a flat runway surface.
In tire/drum tests proposed in [11], it was noted that the tire tread temperature increases linearly as a function of velocity and loading. This is due to the absence of cooling air and the effects of the runway interface. That is why all experimental tests are carried out at different vertical loadings and velocities.
Hall [13] has performed full-scale physical tests to characterize the behavior of the stationary tire under vertical loading, the rolling tire behavior under free-rolling and in cornering conditions. The rolling experiments were carried out on flat and drum surfaces. It was demonstrated that the normal pressures at the tire/drum interface are higher than those experienced on the flat surface. The maximum value exceeds the inflation pressure by a factor between 1.75 and 2.25. This indicates that the contact patch on the drum surface is smaller than that the one obtained on plane surface. The longitudinal and lateral shear stresses are similar under free-rolling and camber angle conditions. Under skidding angle conditions, the contact stresses on the drum surface differ considerably from those observed on the flat surface. The maximum pressure is much higher and the contact patch length at the lateral tire center increases with the skidding angle. Hall [13] noted that this phenomenon has not been previously identified and no explanation is currently at hand.
Korunovic et al. [14] have worked on a finite element analysis of a tire in steady rolling on a drum and the results were compared with experimental results. They developed a FEM model of rolling on the drum, which was used to quickly find out the optimal tire design parameters. Equipment and methods have been used for experimental determination of braking and cornering characteristics of the tire as well as for experimental determination of the friction coefficient of tire tread. For experimental testing of tire parameters, a drum of diameter of 1.20 m has been used and a maximum speed of 150 Km/h was applied. For the cornering test the skidding angles were varied from −10° to +10°. It was noted that the differences between experimental and numerical results were decreased after friction calibration and that the FEM model helps designers to quickly find out the optimal parameters for tire design.
2. Measurement Methods and Equipment: Laboratory Drum
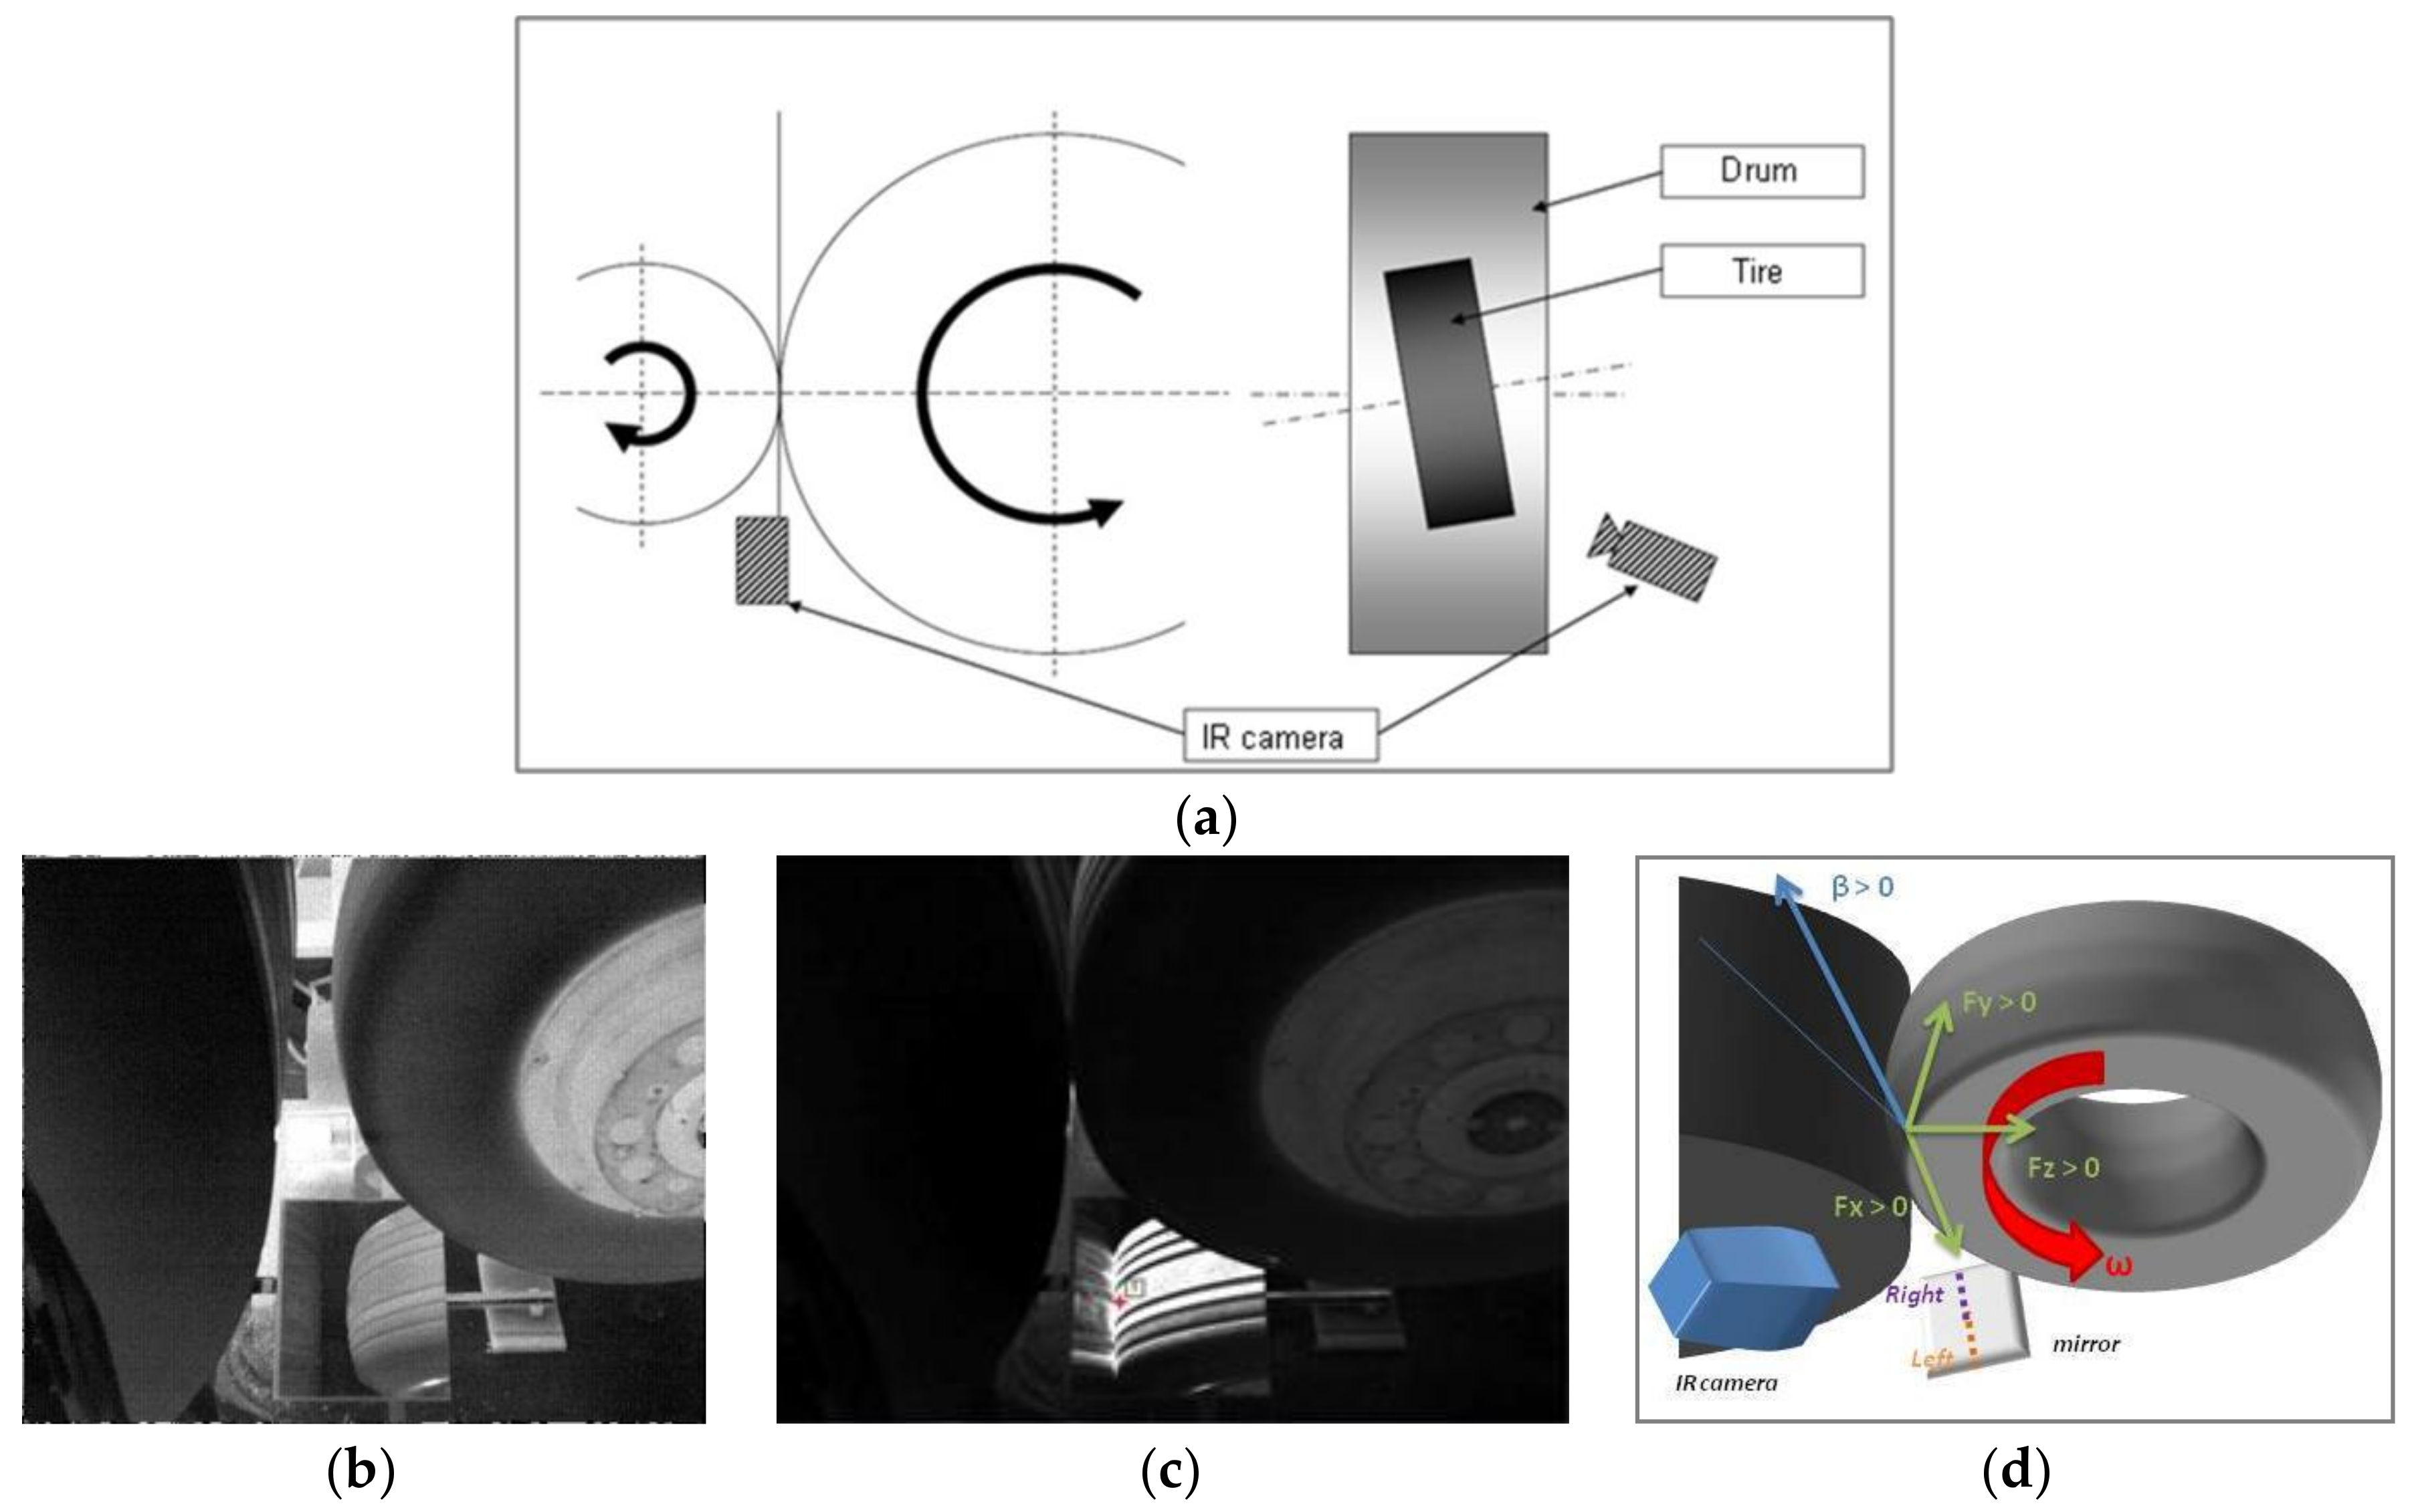
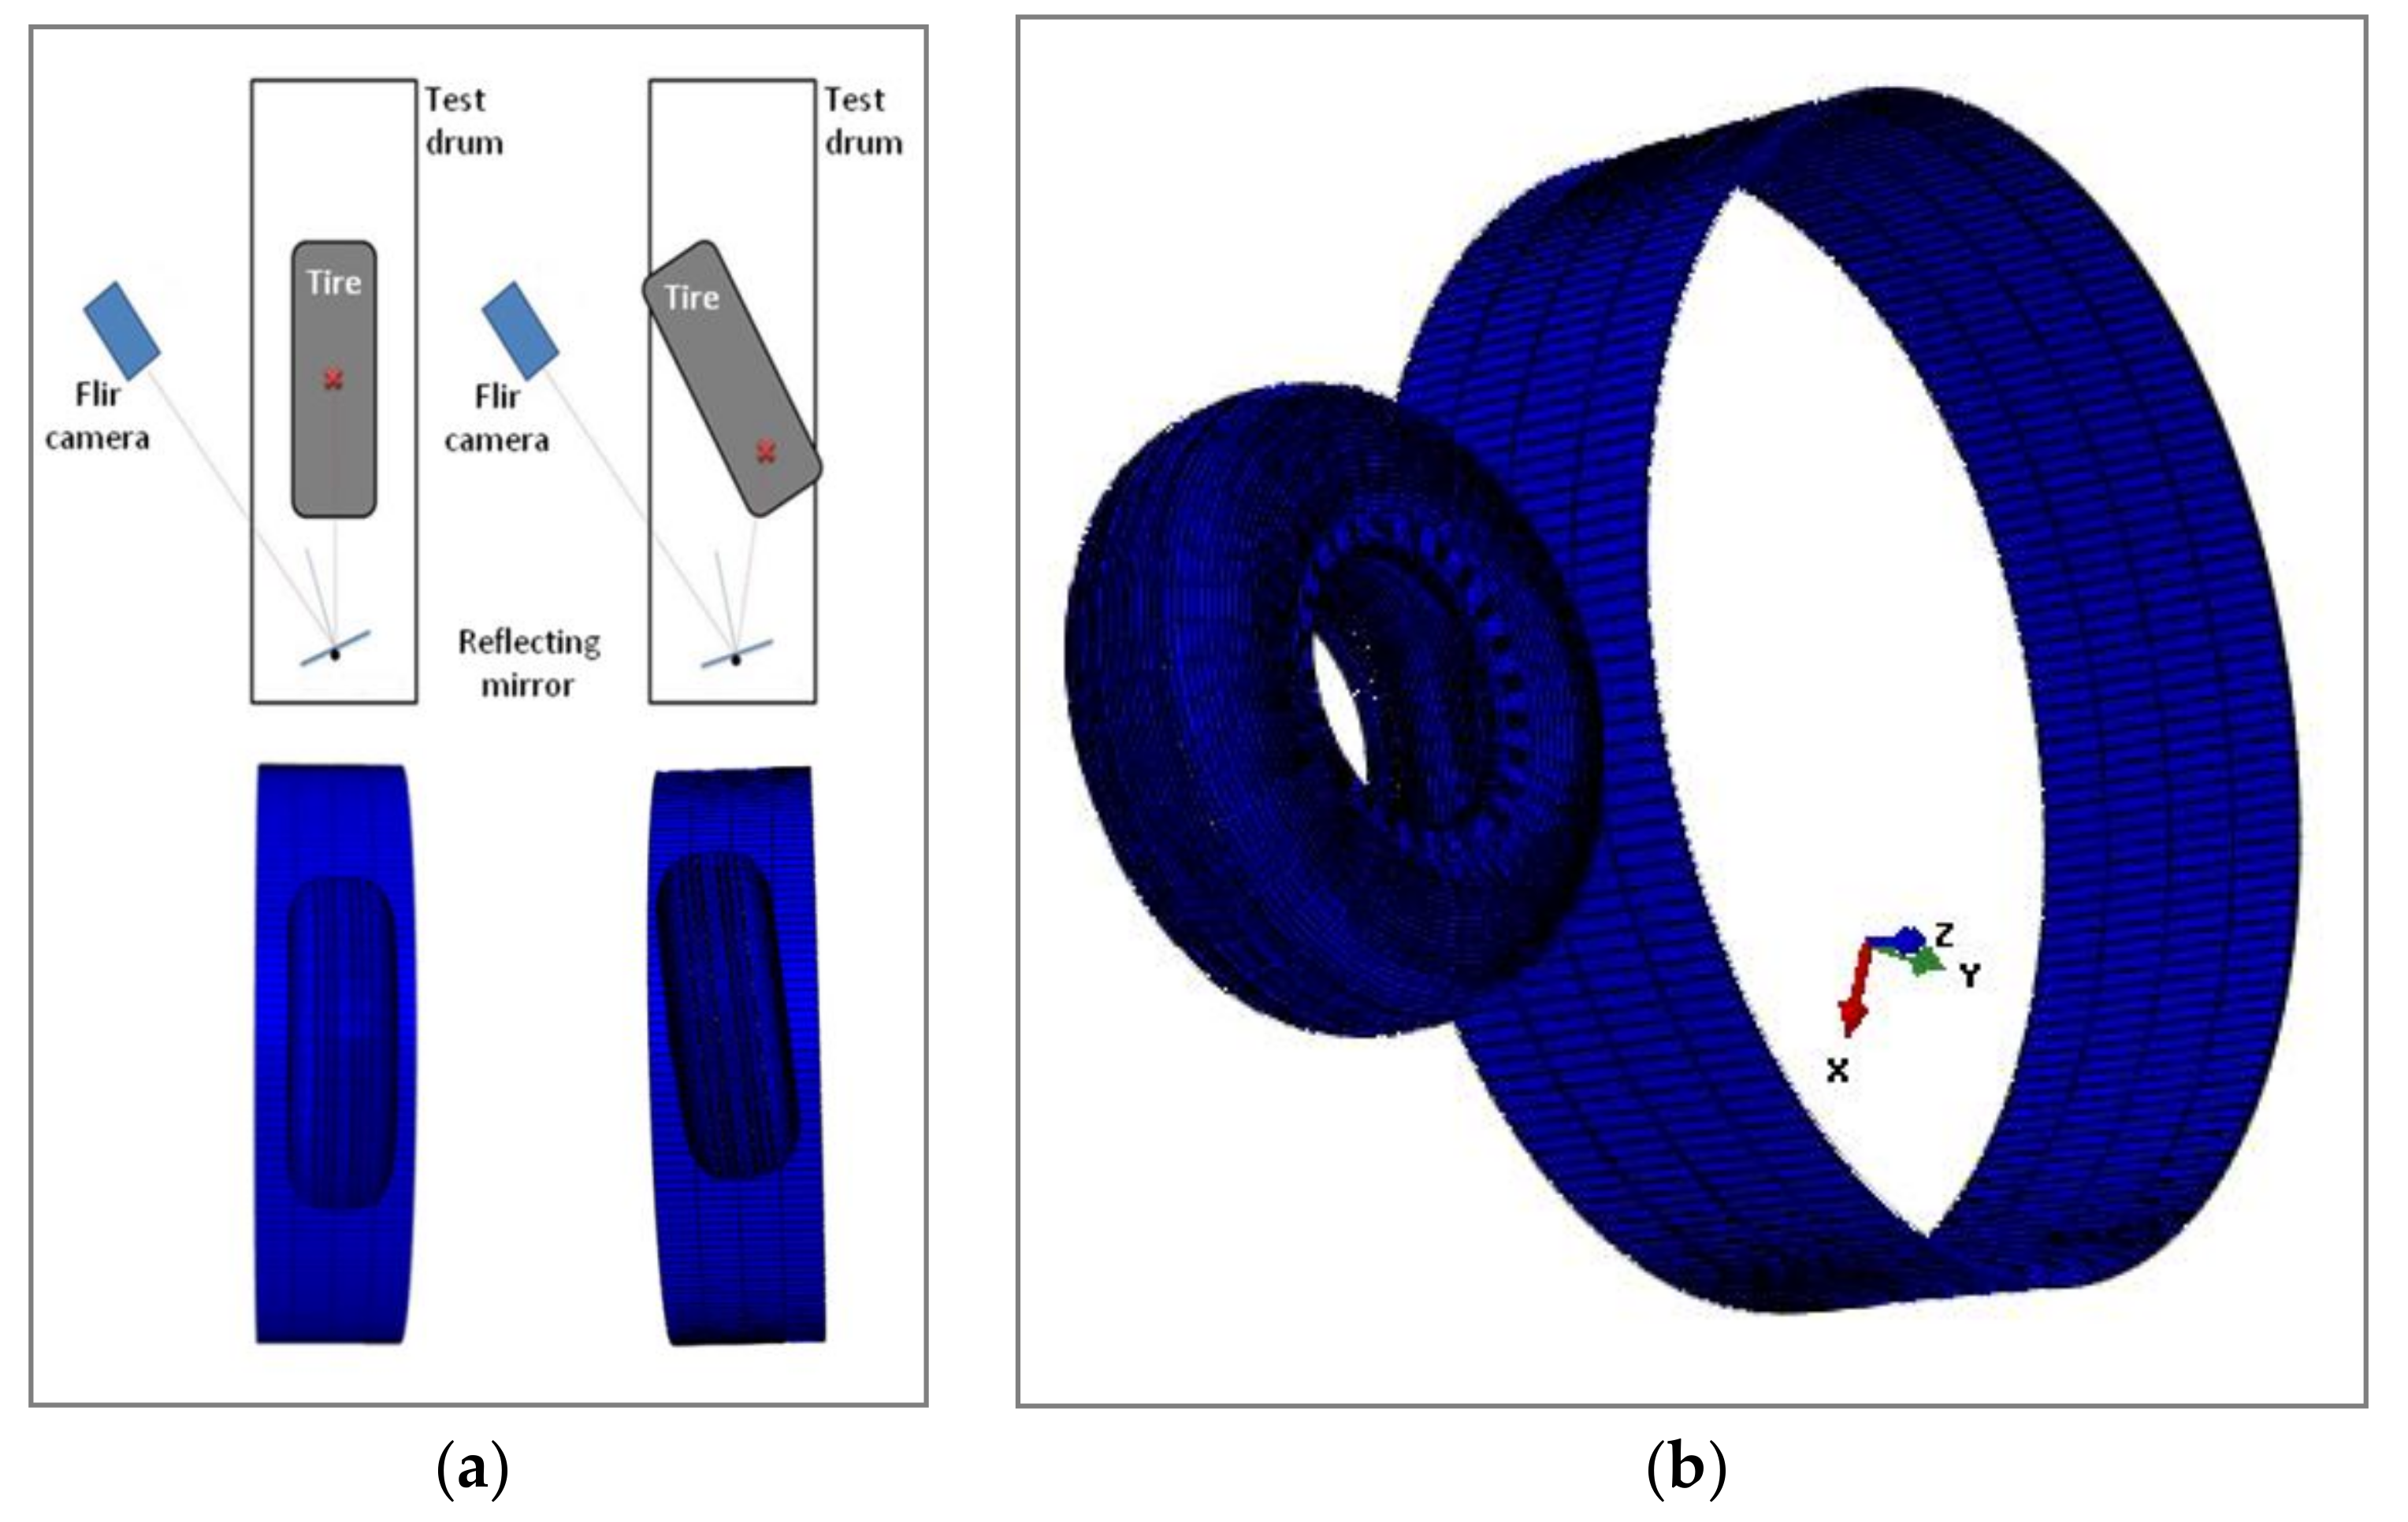
The thermal evolution of the tire tread has an important effect on the rolling resistance, wear, grip and overall tire performance. All the experimental tests were realized on a radial main landing gear aircraft tire. The main goal of these experiments is to study the thermal evolution of the aircraft tire at high velocity up to 190 km/h. The temperature evolution of the rubber tread and inside grooves was acquired by means of an infrared high speed camera installed on the test-rig (Figure 2a); the infrared camera was oriented to have an optimal view of the contact area through a golden reflecting mirror (Figure 2b or Figure 2d). Specific sensors have been used for force and moment measurements.
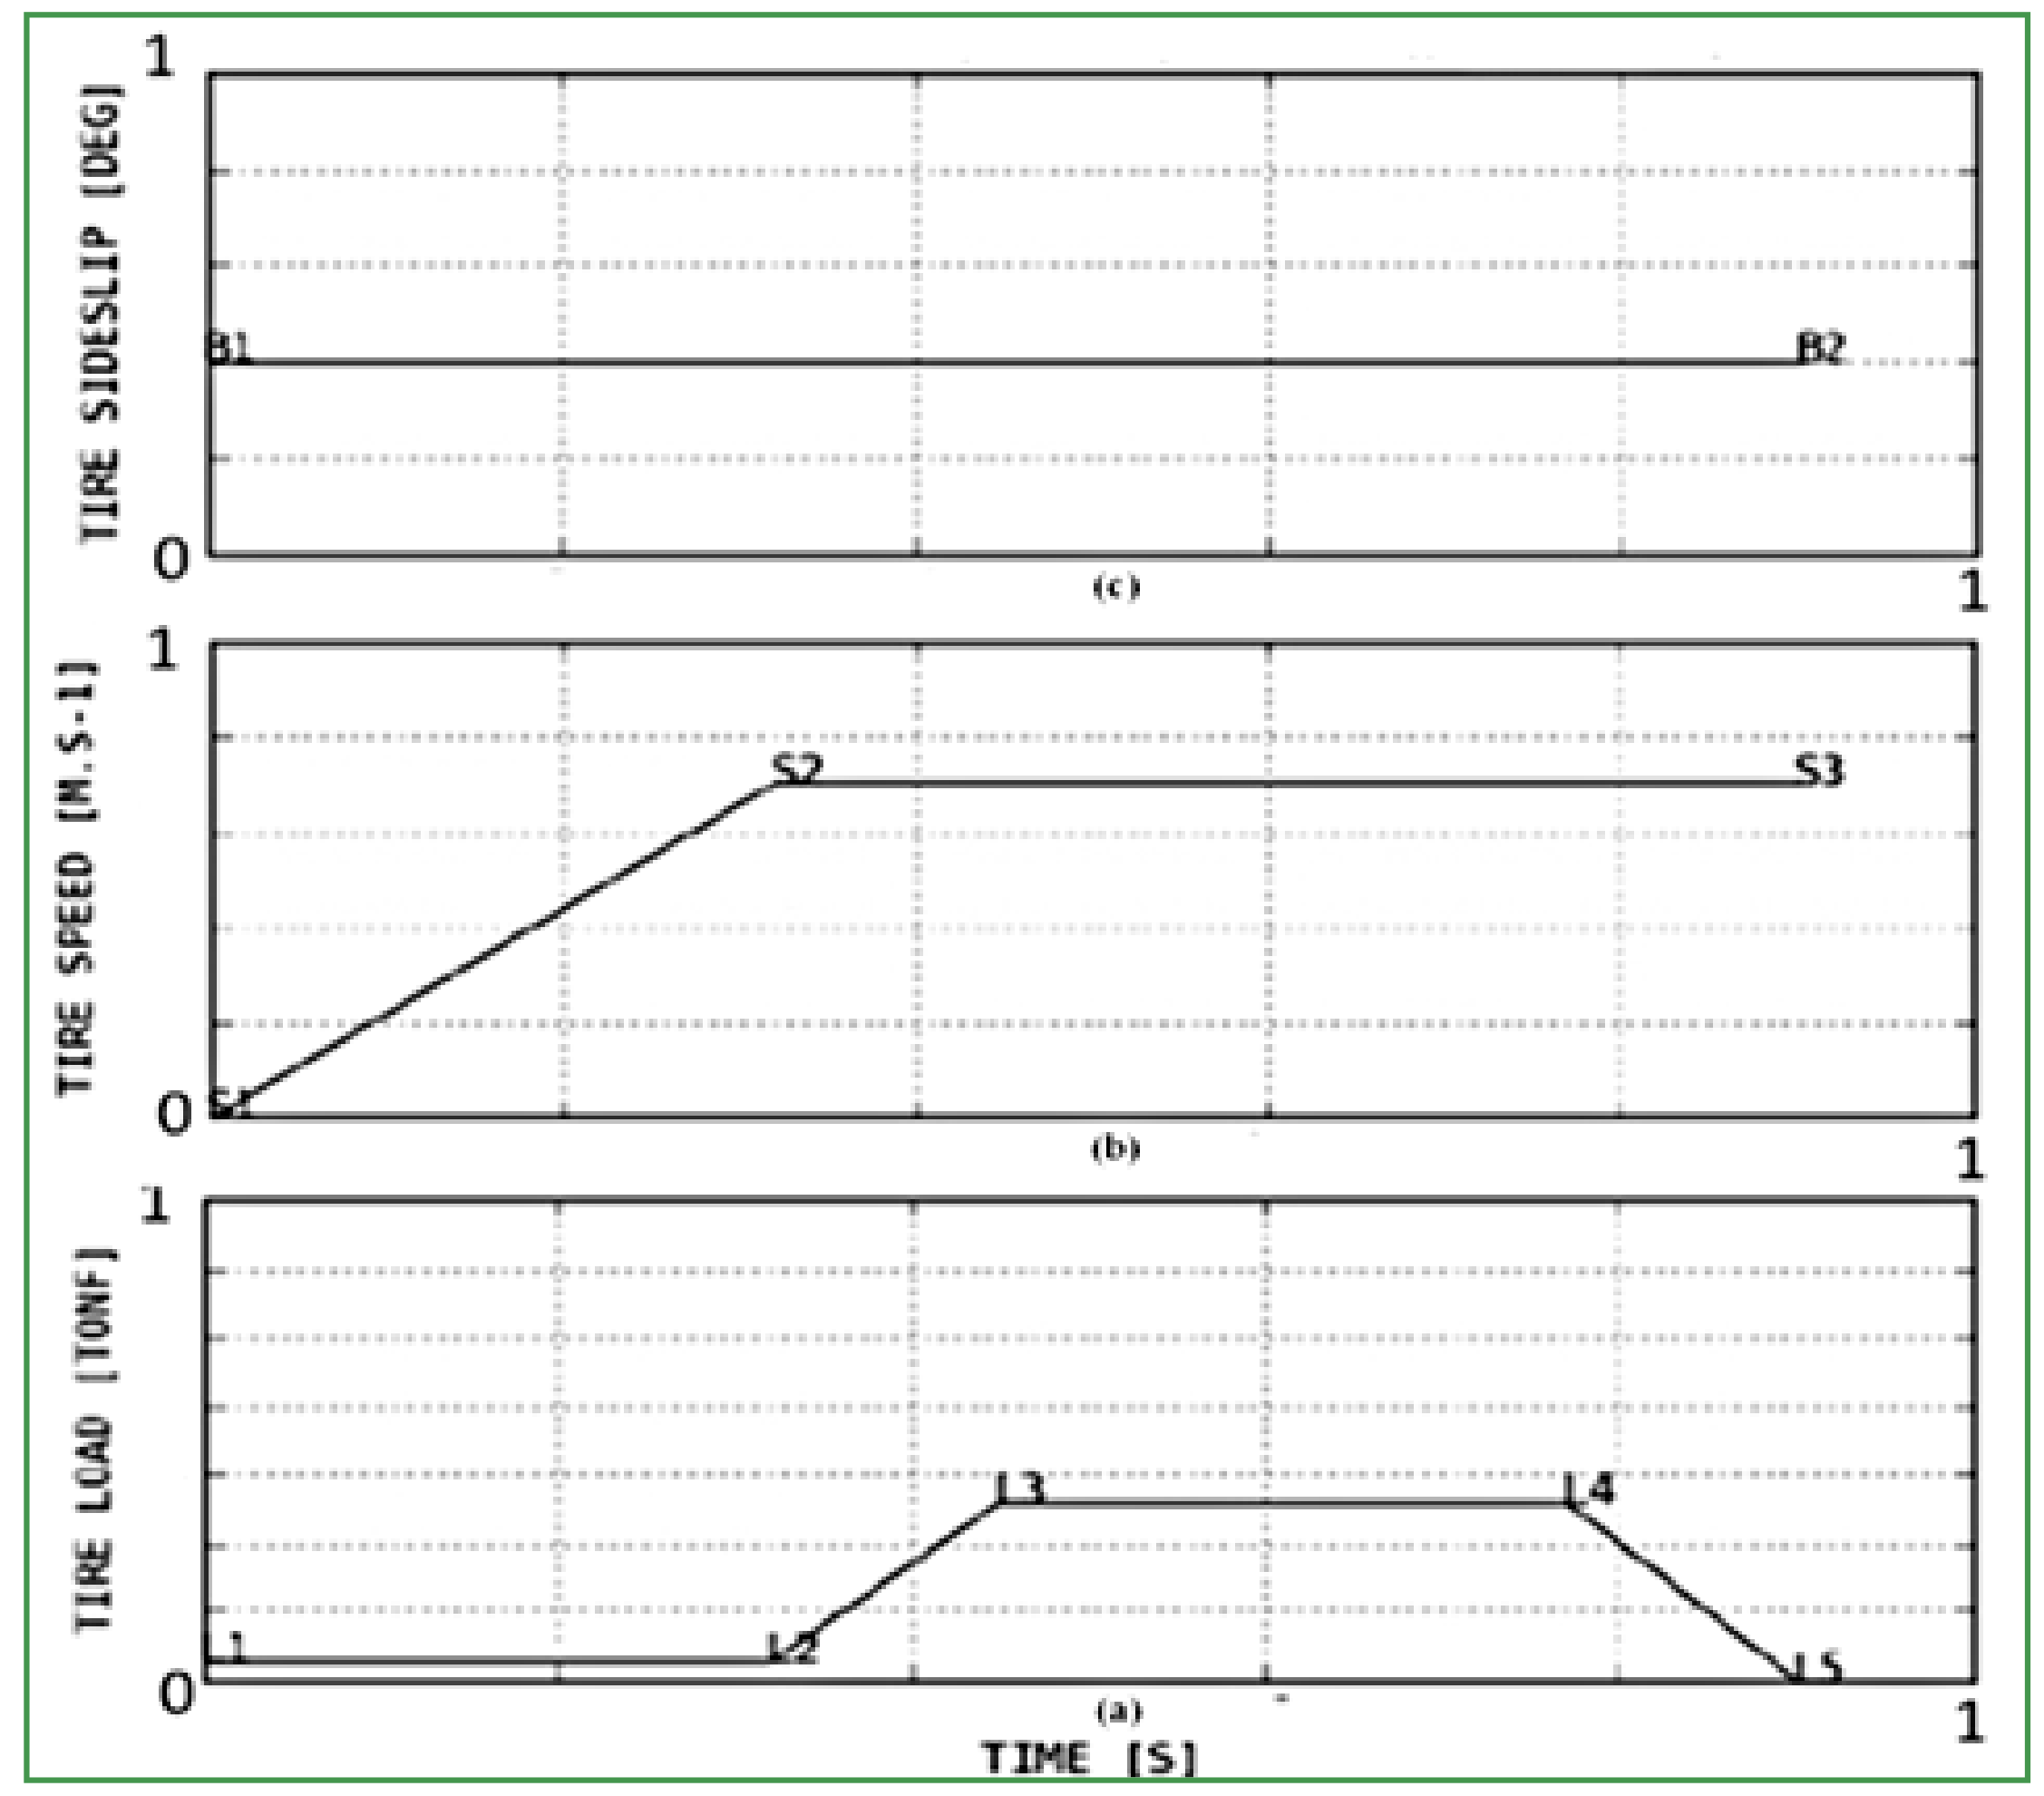
A steel drum of 3.0 m in diameter is used in this study; special precautions for the set-up procedure were required. The tire must be already rotated with the prescribed skidding angle before coming into contact with the drum surface. The initial contact between the tire and the drum surface must be established before the drum starts rotating by applying a slight normal loading. In order to prevent wear and a significant heating of the tire, a special acceleration step is necessary before loading the tire to the nominal load, Figure 3 represents the test protocol.
Set-up procedure steps:
- Acceleration step, from s1 = 0 km/h up to s2 km/h during t1 seconds at preliminary constant loading l1 = l2 kN and a given skidding angle β.
- Loading step, vertical loading increases up to l3 kN during t2 seconds, at constant velocity s3 = s2 km/h.
- Rolling step at constant velocity s3 = s2 km/h, at constant loading l3 kN during t3 seconds.
- Unloading step from l4 = l3 kN down to l5 = 0 kN within t4 seconds.
As it was noted, the skidding angle value is fixed during all the experimental steps. In order to protect the camera from impacting rubber debris, a reflection mirror was installed and the camera pointed toward it. Since different skidding angles had to be studied, the camera was readjusted for each test in order to have an optimal view of the contact zone (Figure 2d).
With regard to the temperature acquisition, a leaving-contact zone was defined just at the tire-drum interface, as it could be observed on the Figure 2c (red dot indicates the drum-tire contact zone). This zone concerns the temperature distribution just at the end of the tire-drum contact. Due to software limitations, the temperature was obtained using two times 30 data points along the aforementioned interface line. One data shot corresponds to one frame. The total number of frames depends on the acquisition frequency. By post processing techniques and further data handling, all measured values in pixels, points positions and acquisition frames were converted to degrees, mm and seconds. Figure 4b shows a typical temperature distribution at the end of the contact zone for several frames.
Figure 4a shows the tire/drum configuration. The origin of the coordinate system was chosen to be in the middle of the tire. Thus, the left side corresponds to positive Y values and the right side to negative Y values (Figure 4c). 30 points for each side of the tire tread were used to record the thermal evolution. Figure 4b shows the temperature distribution as a function of the point position within the tire tread profile. These point positions are given by the Y coordinates, varying from −L/2 to +L/2, where L is the tire width. All the data treatment was performed using MATLAB™. For angles greater than 8° and loadings over 170 kN, the tread overpasses the drum edge. For safety and wear reasons, the test campaign was limited to angles smaller than 10°.
2.1. The Influence of Skidding Angle, Velocity and Loading on the Thermal Evolution of the Tire Tread, Experimental Data
With regard to a minimum and uniform tread wear for all the tests, each parameter is studied starting from its lowest value toward its highest one. Thus, skidding angles are varied from 0° to 8° (β1, β2, β3 and β4 represent the same angle values in all the tests). The velocity varies from 110 Km/h up to 190 km/h. In the same way, nominal loadings start at 200 kN and end up at 330 kN. The inflation pressure is maintained at its nominal value (about 1700 kPa). All figures here after represent the mean temperature distribution along the interface line between the tread and the drum during the stabilized velocity and loading period.
2.1.1. The Effect of Skidding Angle
- The variation of skidding angles in the case of loading l3 = 200 kN at velocity lower than 120 km/h.
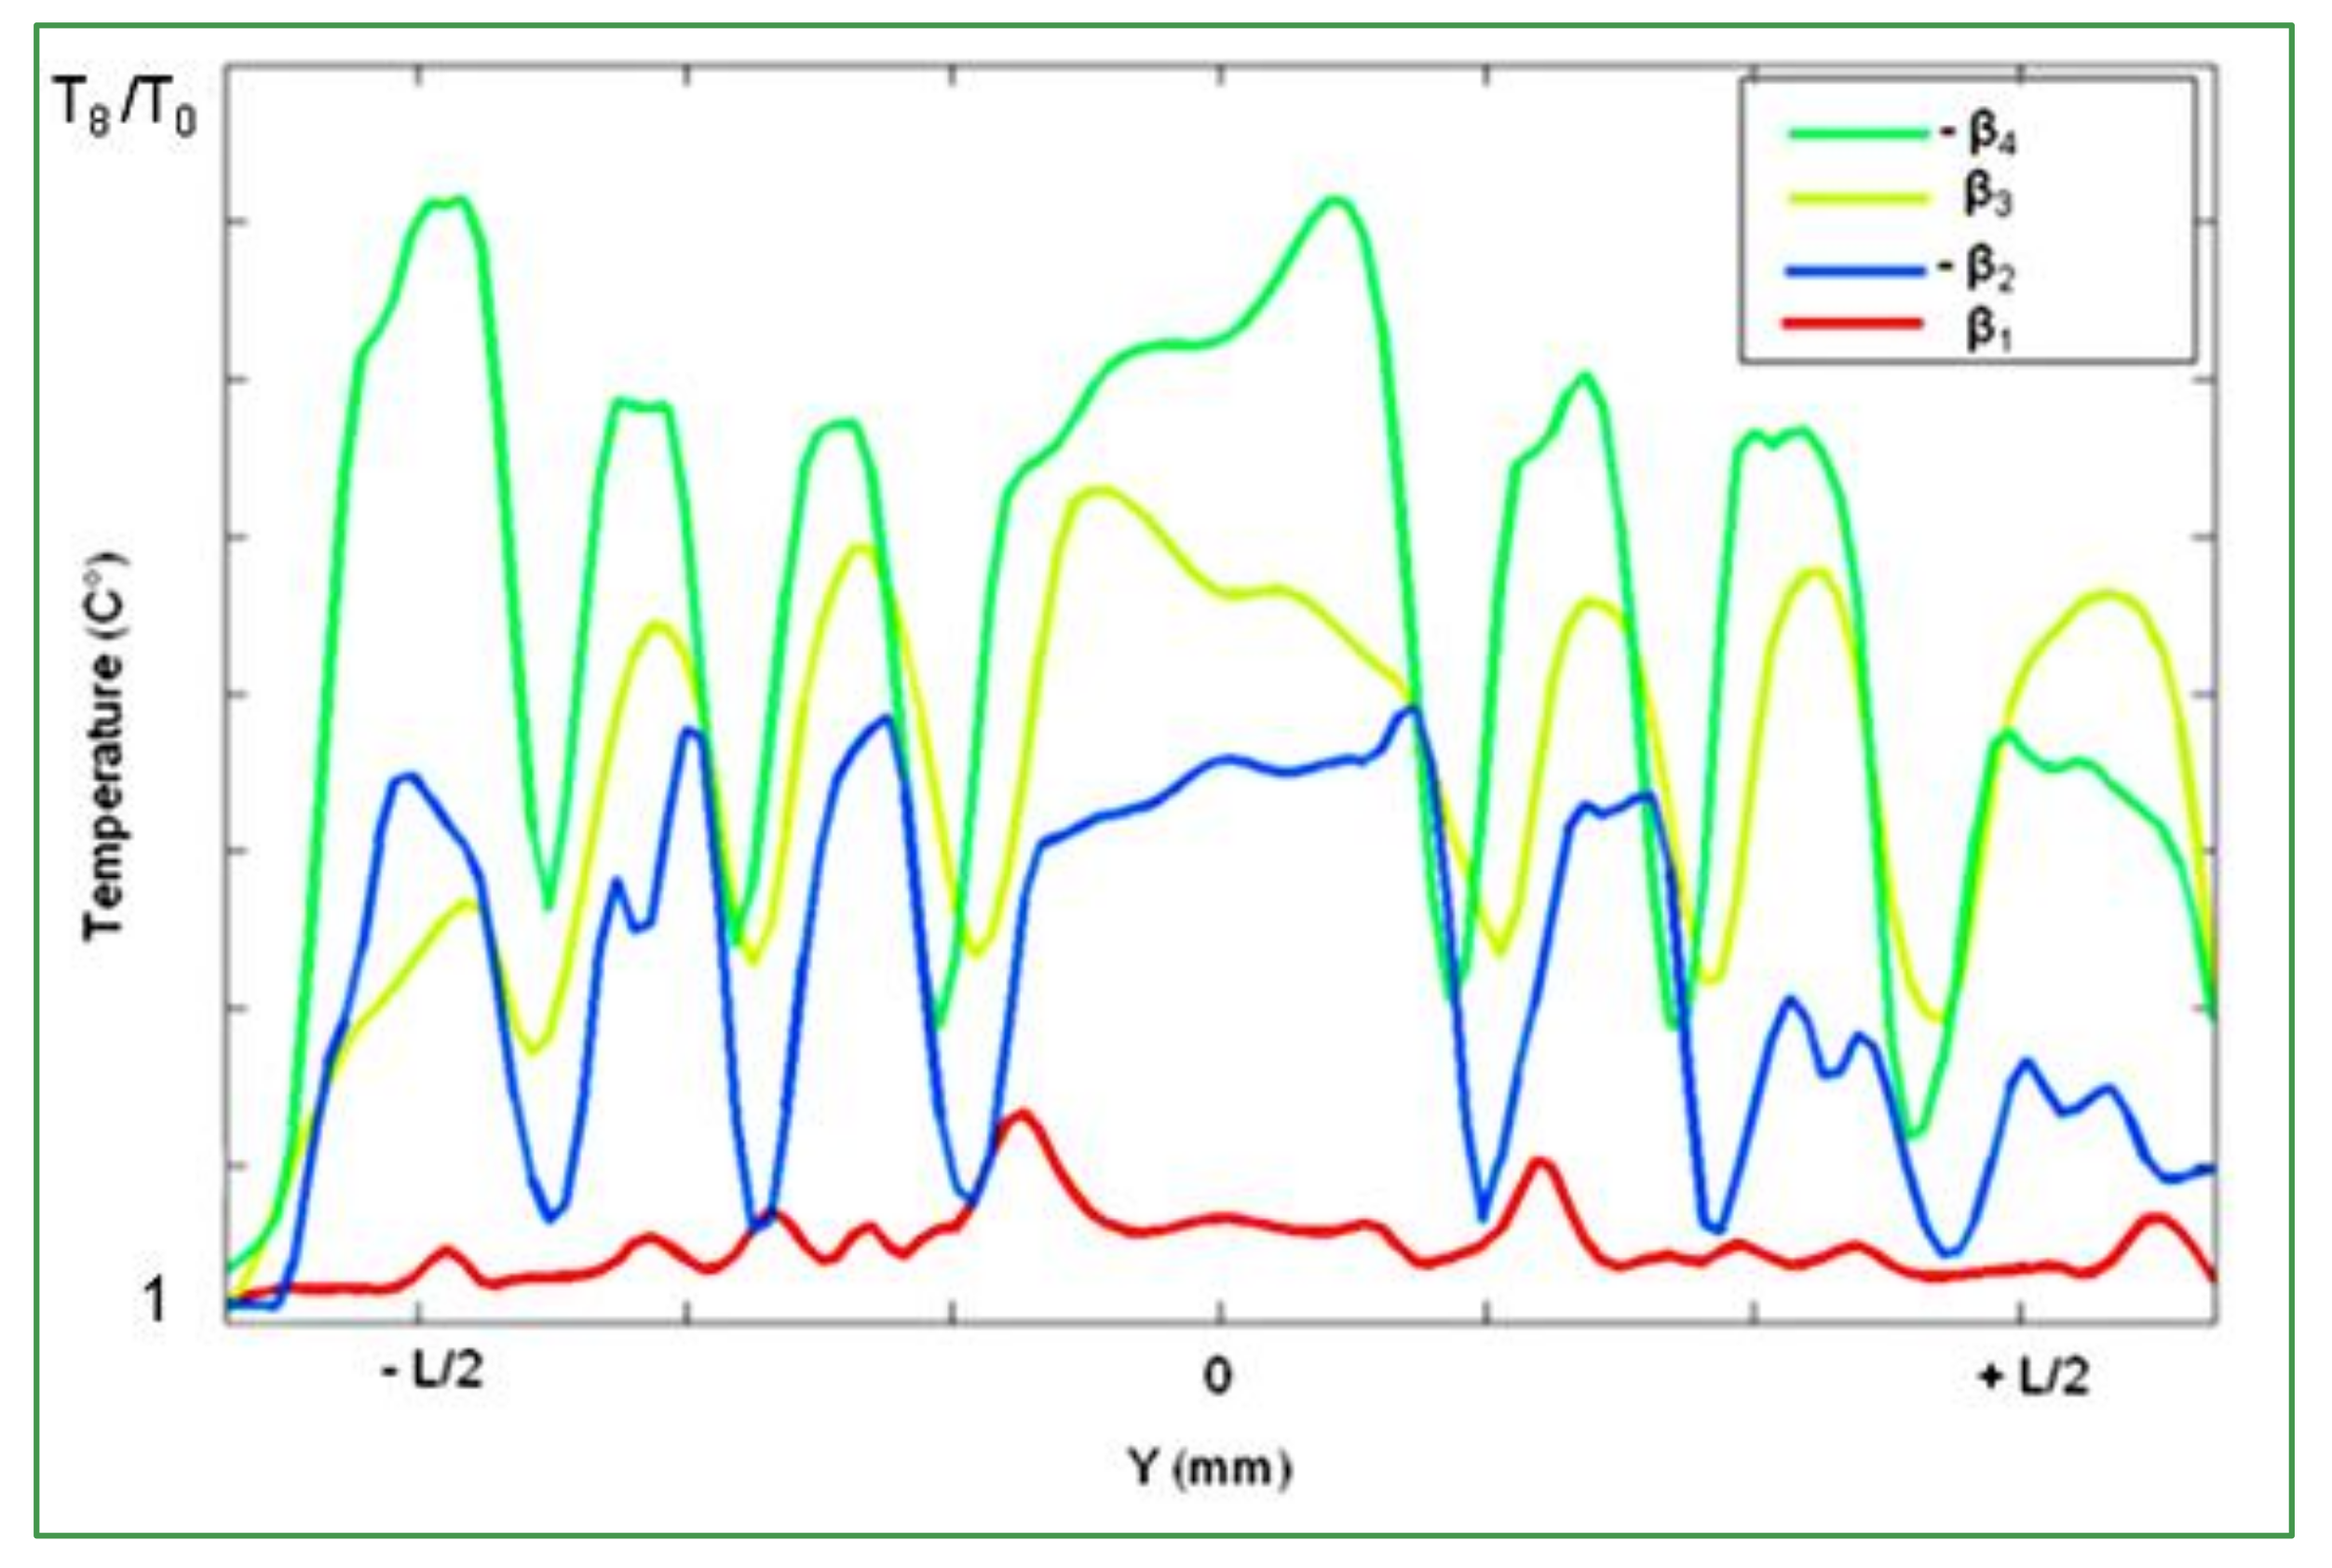
The thermal evolution of the tire tread was measured, for different skidding angles; a nominal loading of l3 = 200 kN and a velocity of s3 lower than 120 km/h were chosen.
As it can be seen in Figure 5, increasing the slip angle leads to a temperature rise of the tire tread. For very small angles from 0° to β1, the heat amount is about 10 °C. Increasing the skidding angle from β1 to −β2, leads to a significant heating, more than 50 °C. The amount of heat decreases for higher β3 and −β4 angles. All these temperature profiles present a rising or descending slope of heating depending directly on the sideslip angle orientation.
- The variation of skidding angles in the case of loading l3 = 260 kN at velocity lower than 120 km/h.
The same angle variation was used for a higher loading l3 = 260 kN. The thermal evolution presents a higher temperature compared to the first case were the loading value was only l3 = 200 kN (Figure 5). It can be noted that in the case of high loading (Figure 6), the effect of the skidding angle is still significant. The same considerable heating could be seen passing from β1 to β2. The next changes in β produce the same effects, with almost the same mean temperatures, but the temperature distributions change from ascending-descending slopes to plateau-like shapes.
- The variation skidding angles in the case of loading l3 = 200 kN at velocity up to 190 km/h.
Figure 7 represents the thermal evolution of the tire tread and the influence of skidding angle in the case of a tire loaded with l3 =200 kN and rolling at velocity s3 up to 190 km/h. As it can be seen, there is a considerable influence of the skidding angle on the thermal evolution. The high velocity leads to a somewhat homogeneous thermal distribution on the left and right sides of the tire tread. Mean temperature distributions present the same plateau shapes, but the maximum values increase by at least 20 °C.
2.1.2. The Effect of Velocity
Here after, Figure 8 represents the temperature evolution for four velocities, varied from 40 km/h up to 260 km/h, for a constant loading of 200 kN and a skidding angle of 8°. The temperature variation of the tire tread due to changes in the velocity seems to be more significant than those produced by the variation of the skidding angle. The maximum mean temperature levels are 20 °C higher than those previously quoted. For very high velocities (s3, s4), the temperature rise rate seems to saturate, tire tread profiles became flat and most temperatures in the contact zone are close to those of the center of the tread.
2.1.3. The Effect of Loading
The influence of the vertical loading was investigated in an analogous way as it can be seen in the Figure 9, the tire was loaded with five different values: l1, l2 = l.5 × l1, l3 = 2 × l2, l4 = 1.3 × l3, l5 = 1.3 × l4, for a fixed velocity s3 lower than 120 km/h and a constant skidding angle of 6°.
As it can be seen in Figure 9, the variation of the vertical loading has a direct influence on the thermal evolution of the tire tread, but the variation in temperature levels seems to be smaller than those induced by the skidding angle. For loadings lower than 100 kN (l1, l2), the vertical load seems to be not high enough to influence the whole contact patch; it could be related to the tire structure, which is designed to operate at high loading. For loadings beyond 260 kN (l4, l5), no major influence of the vertical loading is noticeable. The amount of heat induced by loadings l4 or l5 over the heat level of loading l3 is lower than 10 °C.
2.2. Which Test Should Be Used: Rolling on a Flat Runway or on a Steel Drum?
The previously presented measurements confirm that the thermal evolution of the tire tread is mostly influenced by the skidding angle followed by the velocity and loading. These results are in agreement with the results presented by Linke et al. [15]. They discussed the effect of the skidding angle, velocity and loading on the temperature of the tire tread rolling on a flat runway.
In a previous study [5], the same aircraft tire was tested on flat runway. The rolling conditions were identical for the skidding protocol; the velocity was limited to 70 km/h. The following figures illustrate the temperature distributions in the contact zone, along the interface line after rolling on a flat runway (Figure 10) and on a steel drum (Figure 11). The rolling conditions are similar (vertical loading about 200 kN, velocity lower than 60 km/h, and skidding angle up to 8°).
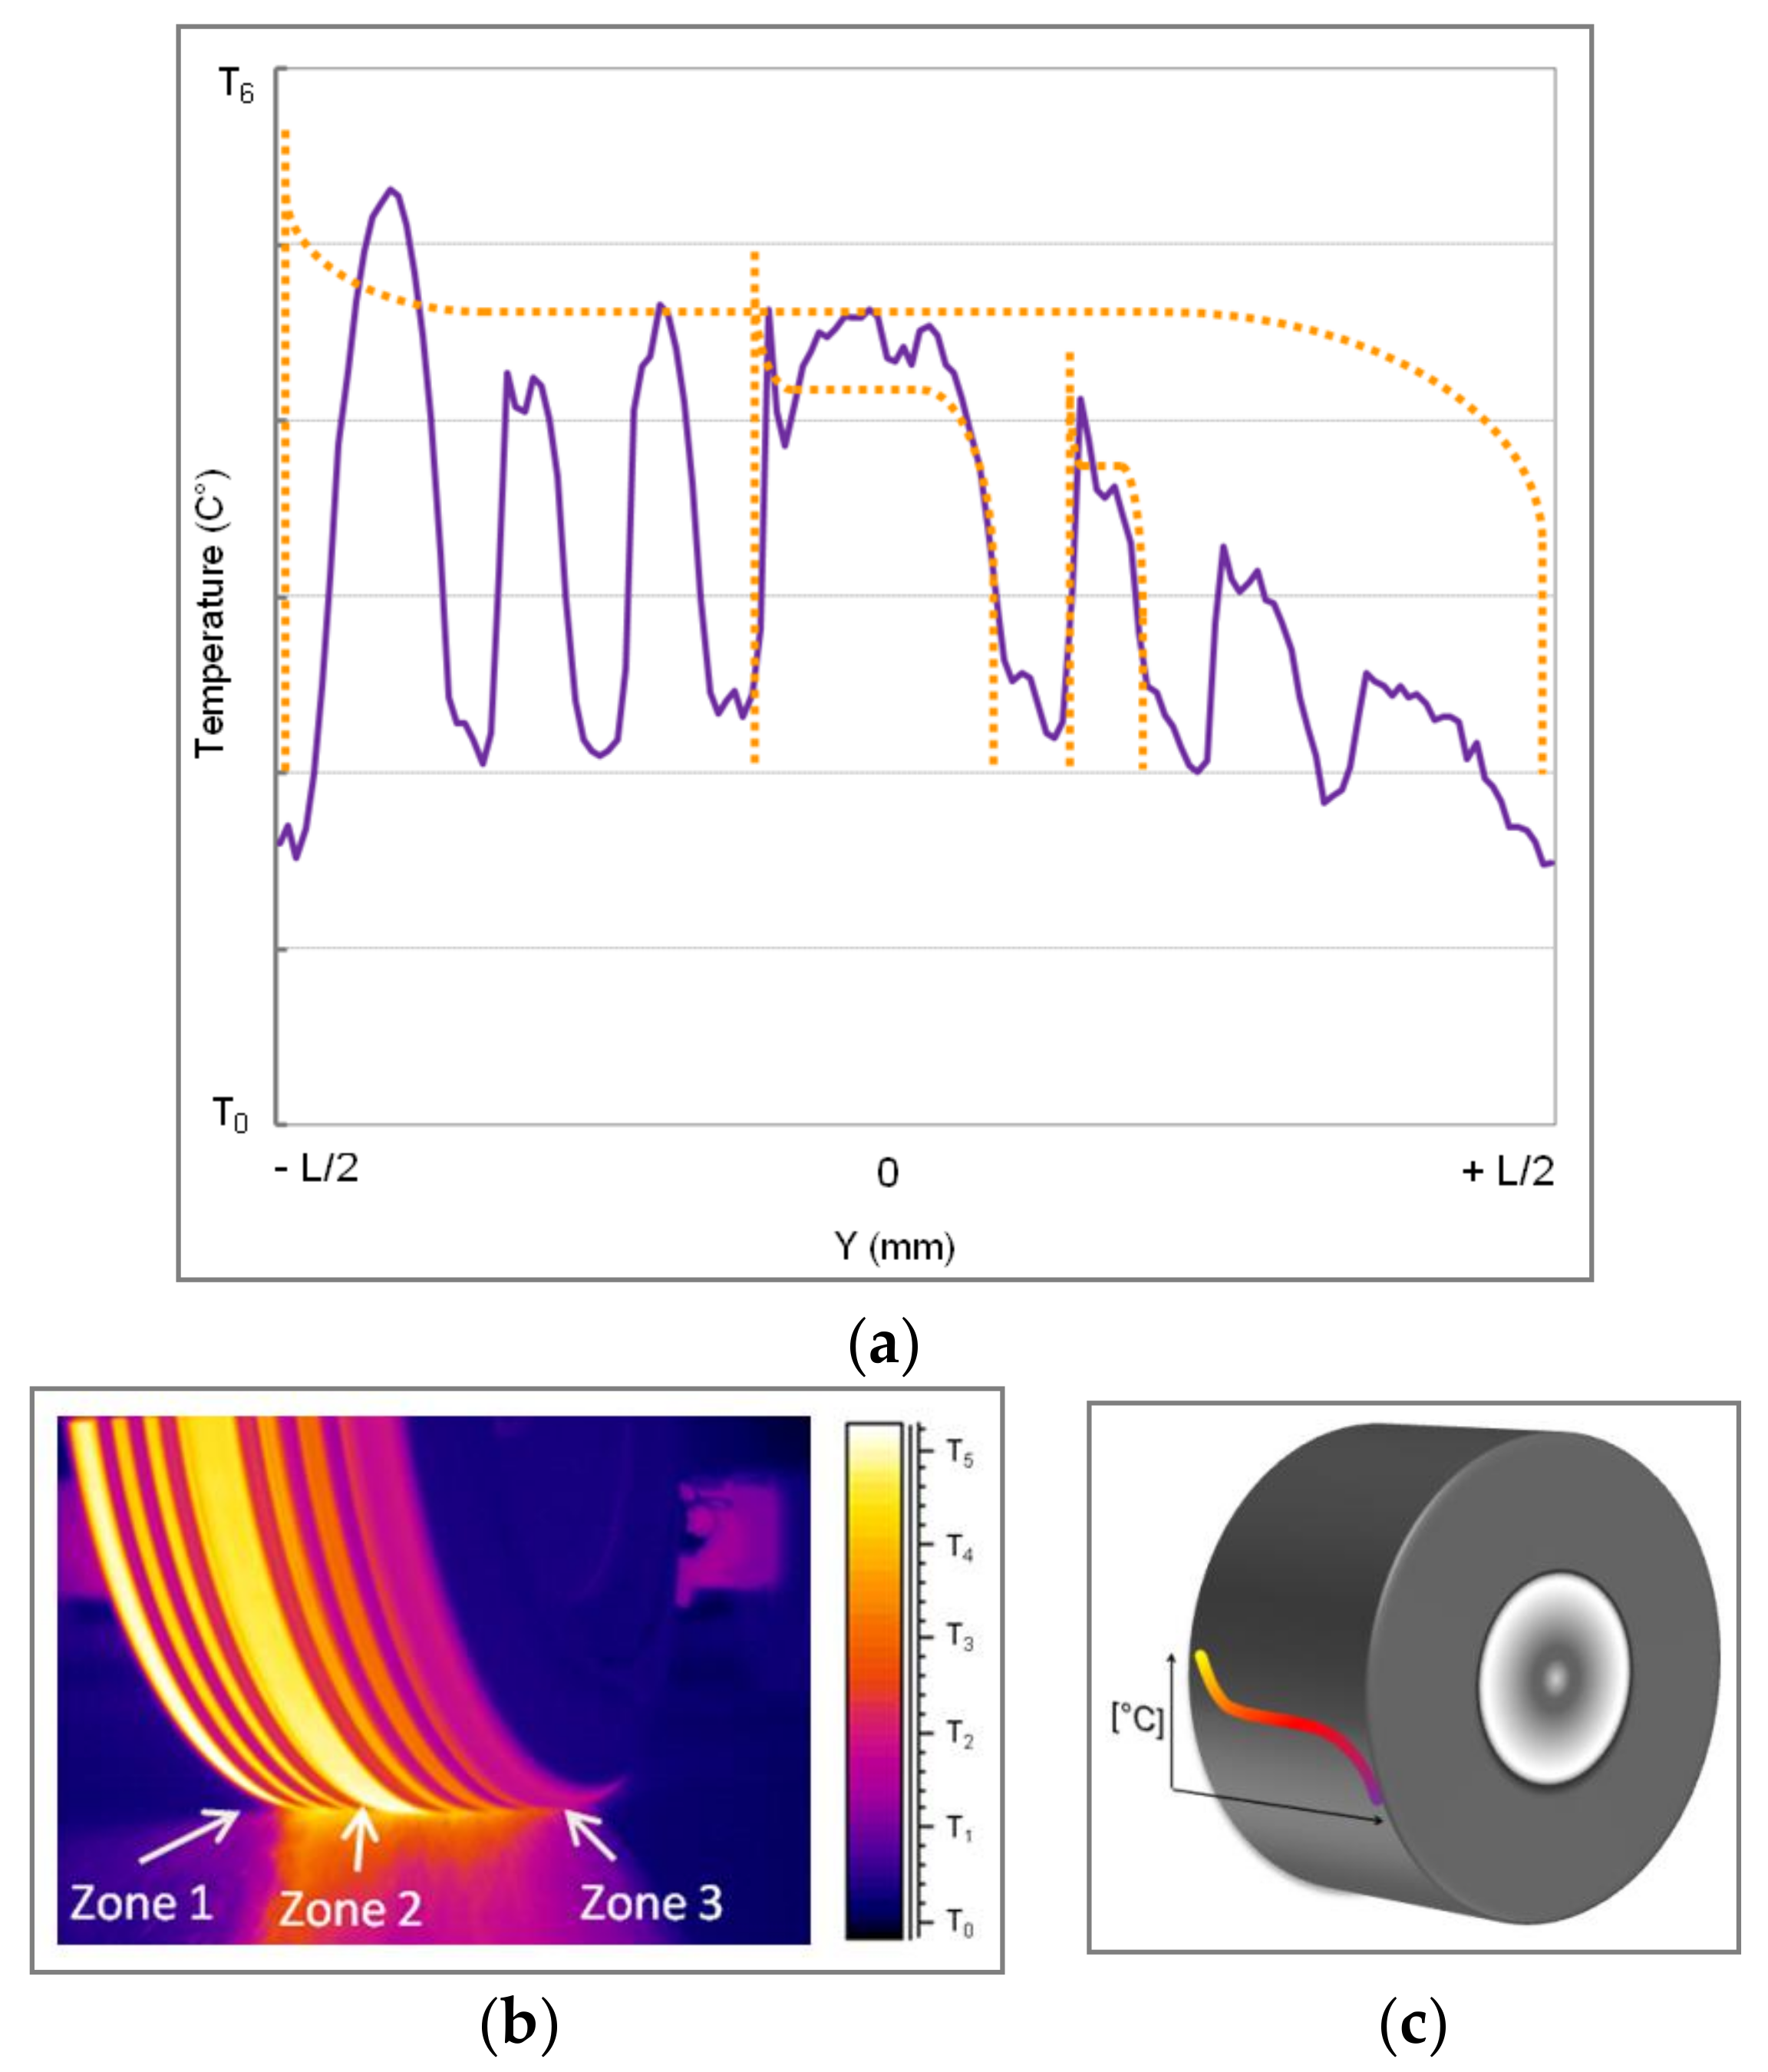
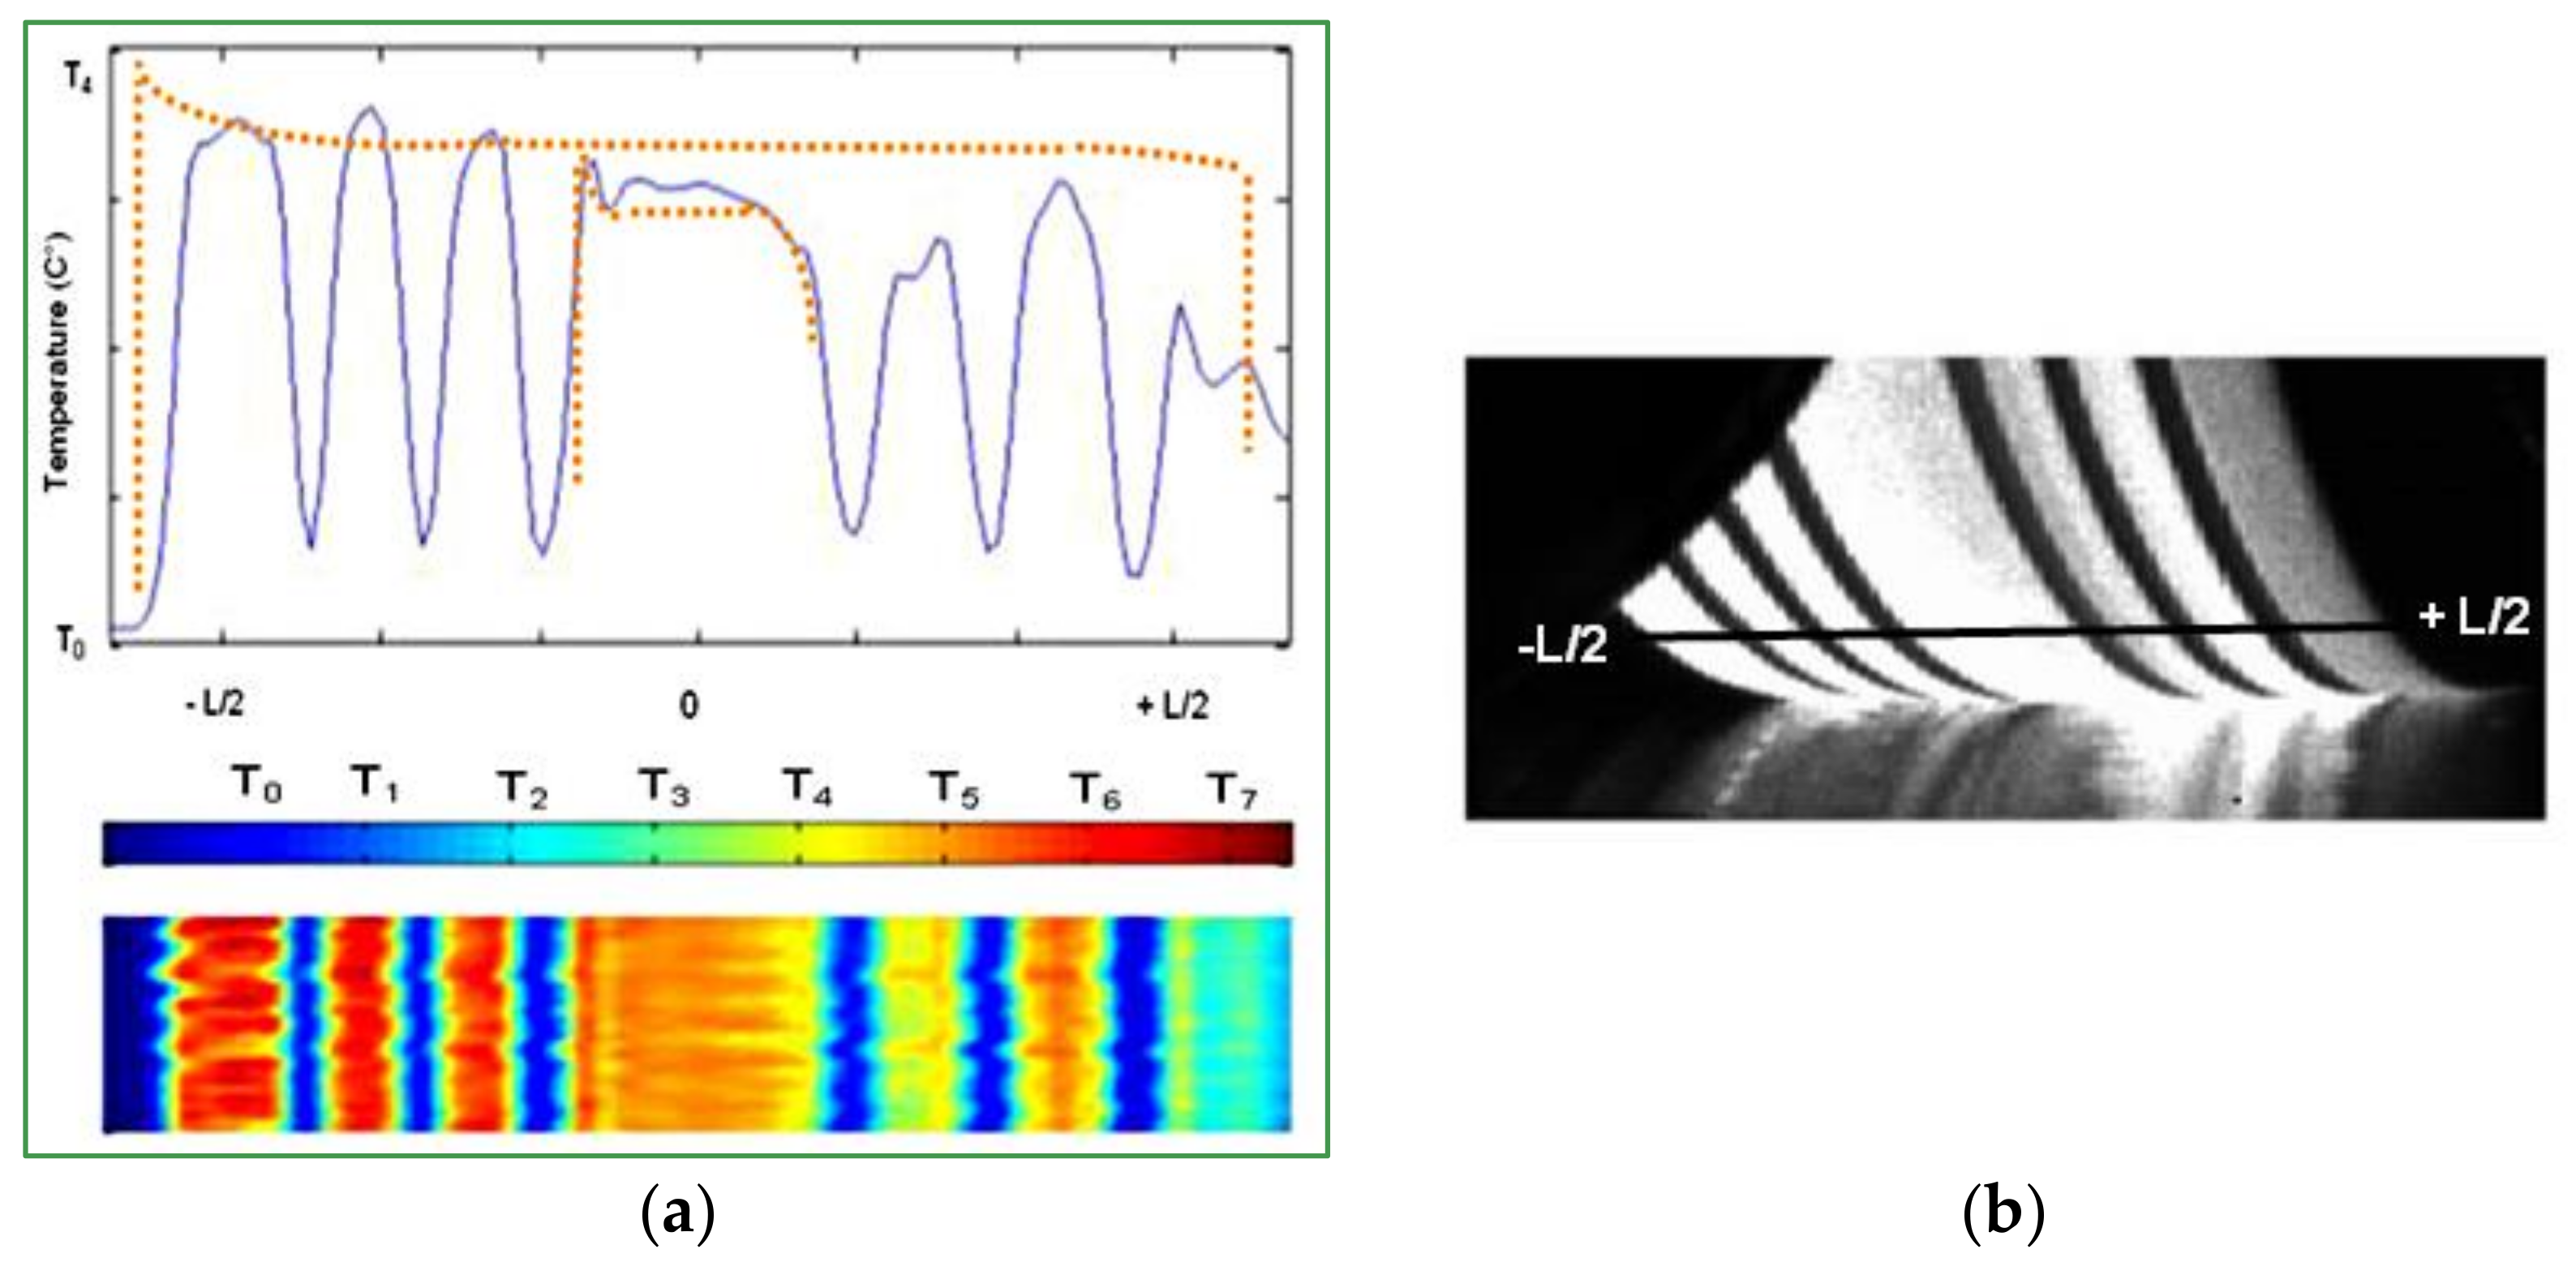
A typical S-profile of temperature evolution is shown in Figure 10c by the orange curve. Figure 11a represents the thermal evolution of the tire tread in the case of rolling on a steel drum with the same S-profile tendency. Figure 10a and Figure 11a present the temperature distribution starting from the hottest outside part (zone 1), followed by the temperature of the middle part (zone 2) and finished by the coolest inside part (zone 3). Rolling on a regular runway or on a steel drum, the inside groove temperatures seem to be slightly affected (Figure 10a or Figure 11a) by the frictional or inelastic heating of the rubber; the low conductivity of the rubber could explain this phenomenon. In conclusion, it seems that the main part of the tire tread heating results from friction phenomenon, which leads to similar thermal evolutions of the tire rolling on a standard runway or on a steel drum.
2.3. Remarks on the Experimental Results
- -
- The skidding angle influences directly the temperature evolution; higher temperatures are recorded for higher skidding angle values.
- -
- The vertical loading has less effect on the thermal evolution in the center of the tire tread, but a higher effect on the borders.
- -
- The heat rate as a function of velocity seems to have an asymptotic behavior.
- -
- The mean temperature presents sloping or flat profiles depending on charging parameters.
3. Numerical Simulations of an Aircraft Tire Rolling on a Steel Drum
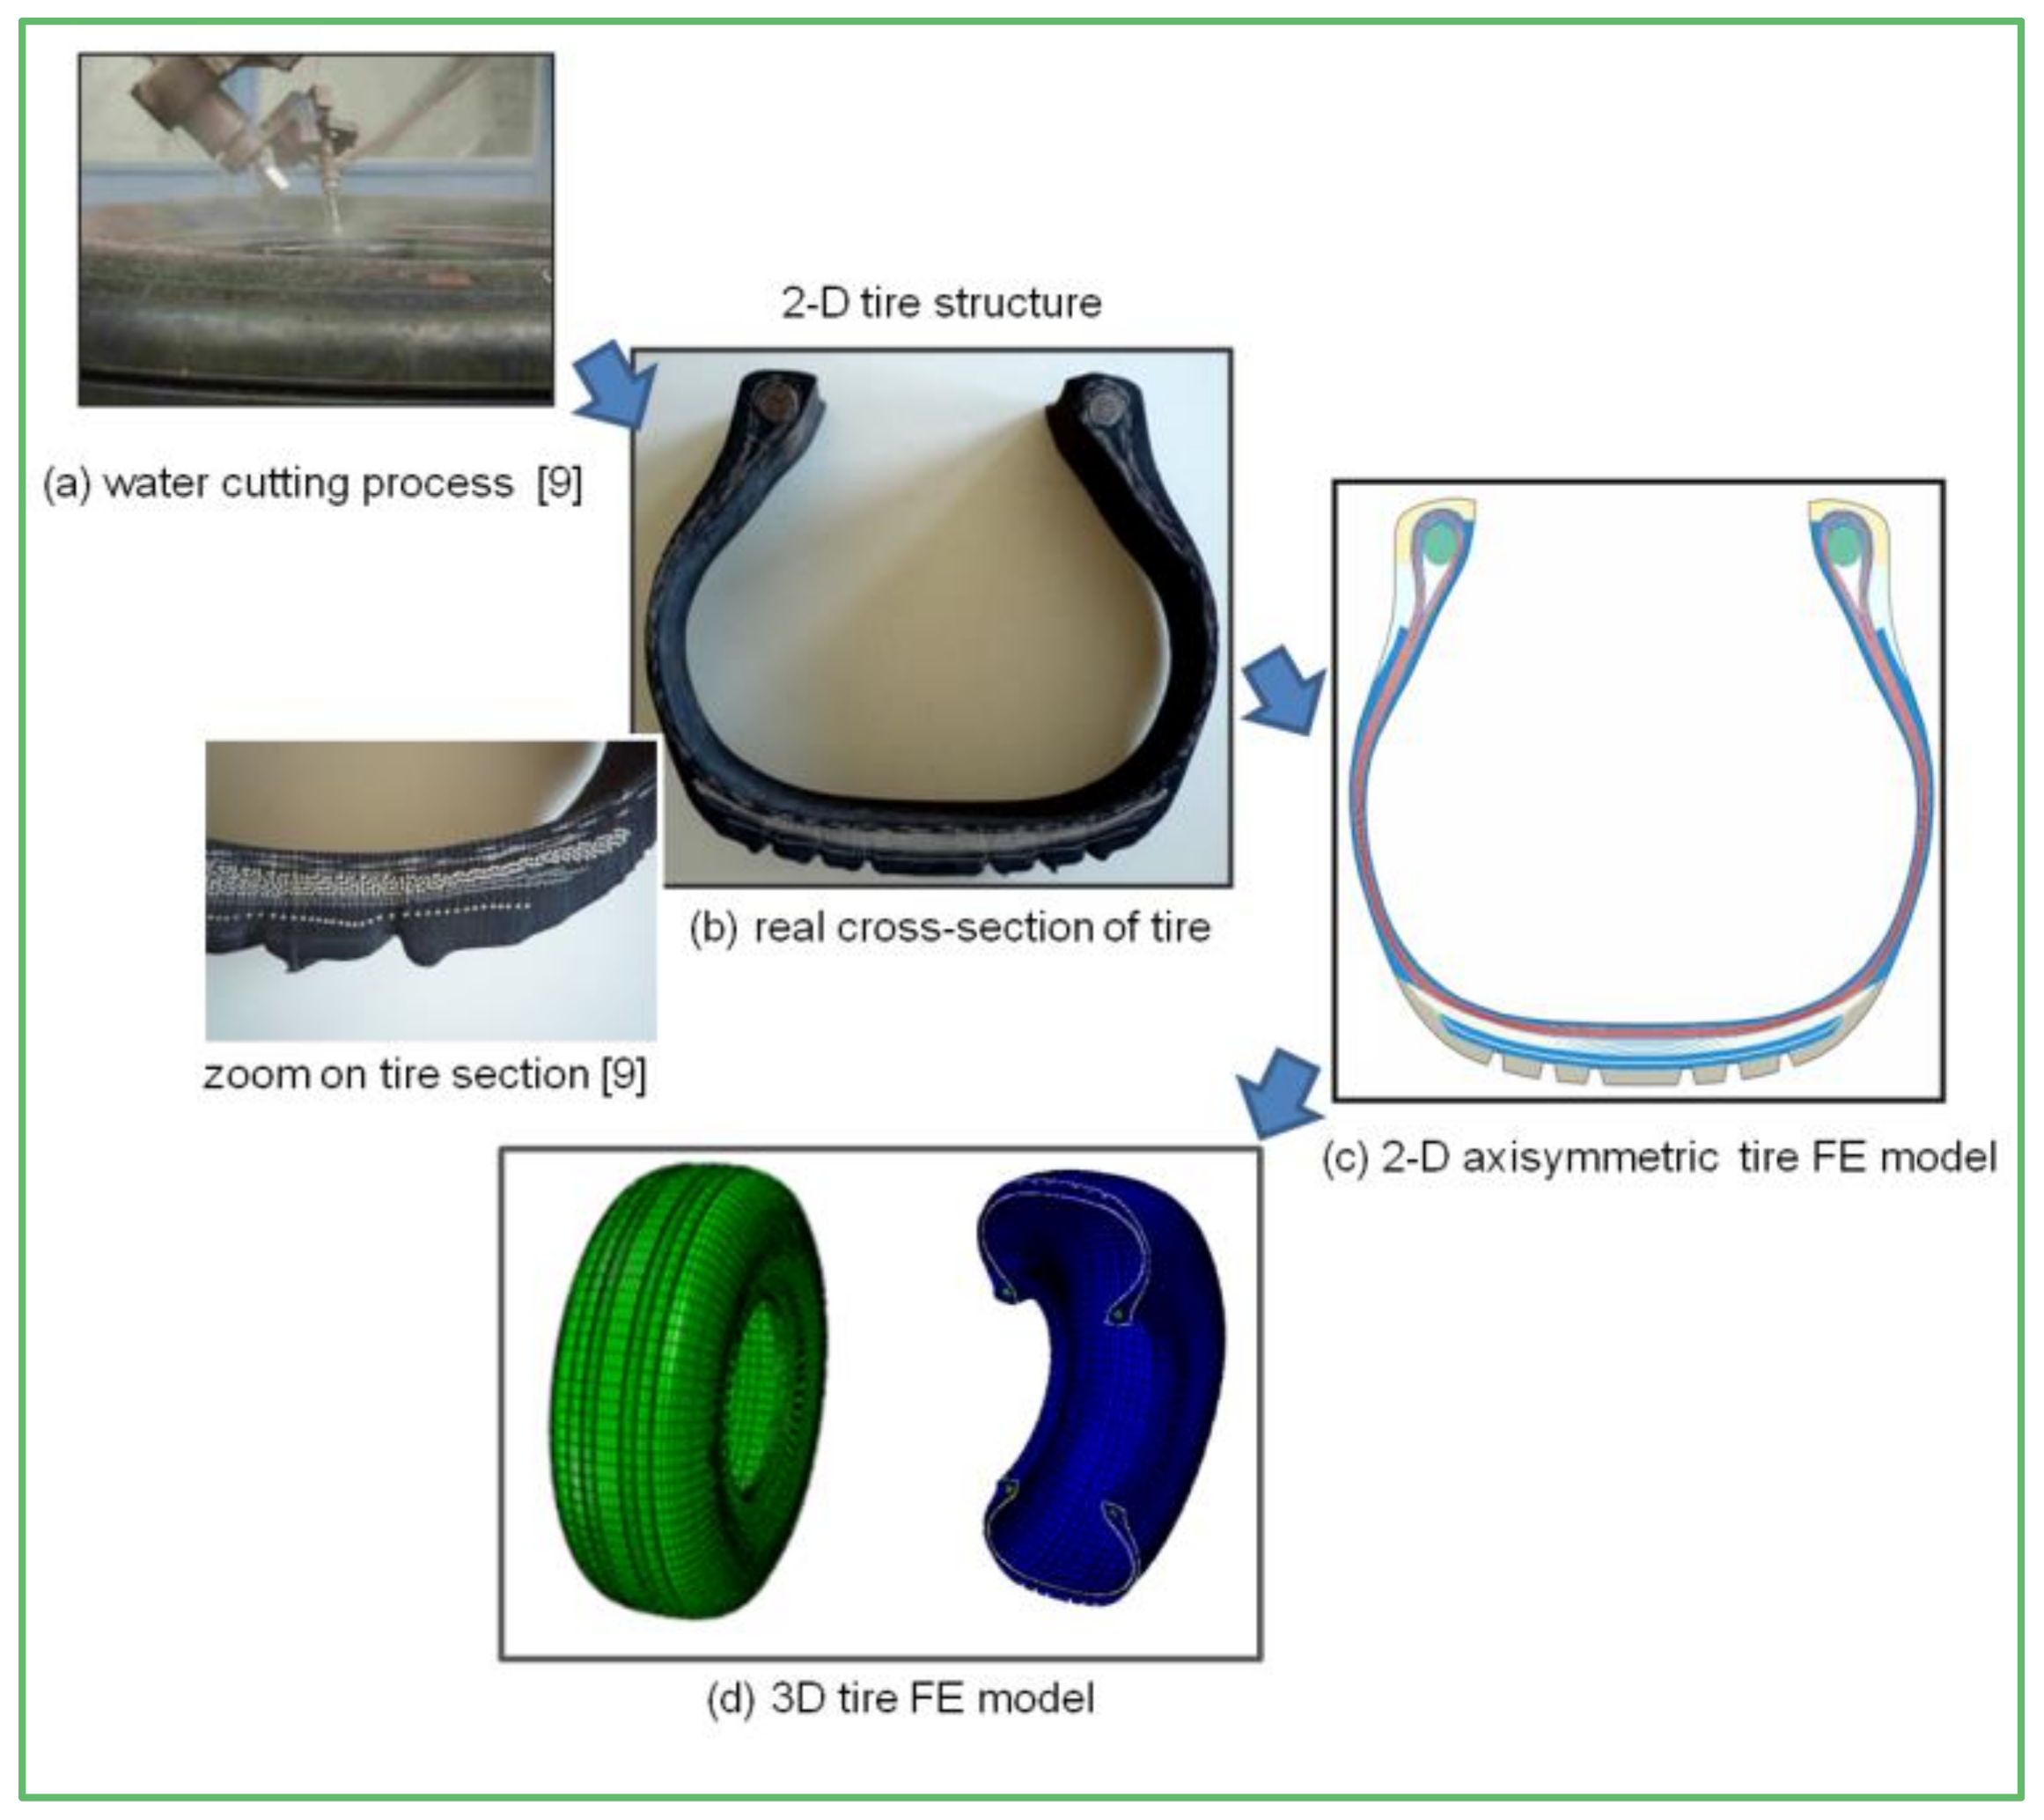
A 3-D numerical model of the tire previously developed for tire/runway studies [5,6,7,8] is employed. The aim of this part is to test and extend the capabilities of this 3-D model to predict the thermal evolution of the tire tread during rolling at high velocity. Figure 12 illustrates the tire 3-D FE model built-up. In this part, the tire cross-section was cut out from the tire using a water-jet, as shown in Figure 12a. This method gives an accurate cross section and a detailed image of all the inner layers of the tire structure (rubberized fabric layers, steel belts, nylon cords, etc.), Figure 12b. An image processing method was used to discretize the cross-sectional image and to obtain the 2-D FE section of the tire.
The finite element analysis was carried out in several stages. In the first stage, the tire was modeled using an axisymmetric 2-D model and inflated at 1700 kPa. A 3-D model (Figure 12d) was then developed for performing the rolling of the tire (dynamic simulation). The 3-D tire model is generated by using the symmetric model generation technique from the 2-D axisymmetric model. The 3-D model is composed of 51 circumferential segments, coupled temperature-displacement elements (C3D8RHT, eight-node tri-linear displacement and temperature, reduced integration with hourglass control, hybrid with constant pressure) were used in this simulation. The steel drum of 3 m in diameter was modeled as a 3-D deformable body.
The friction coefficient implemented in the numerical simulation is based on experimental tests [15]. A classical rolling (CR) method based on the Lagrangian formulation was used with a fixed friction coefficient. The numerical simulations were performed using ABAQUS/Standard solver. The hyper-elastic behavior of rubber is based on the Mooney–Rivlin model [16,17]. The viscoelastic parameters of rubber have been determined experimentally. The rubber viscoelastic behavior is modeled using the Prony series model, widely employed in tire modeling [18,19,20]. The rubber is considered as a homogenous, isotropic and incompressible material. Concerning the thermal parameters of the rubber material, the thermal conductivity was 0.20 W/m °C, the specific heat was 1900 J/(kg·°C) and the coefficients of expansion were 77e−6 × 1/°C for 20 °C and 150e−6 × 1/°C for 200 °C.
The major numerical difficulties are related to the highly non-linear model of the tire, large deformation, incompressibility of elastomers, and specific boundary conditions of the tire/drum contact.
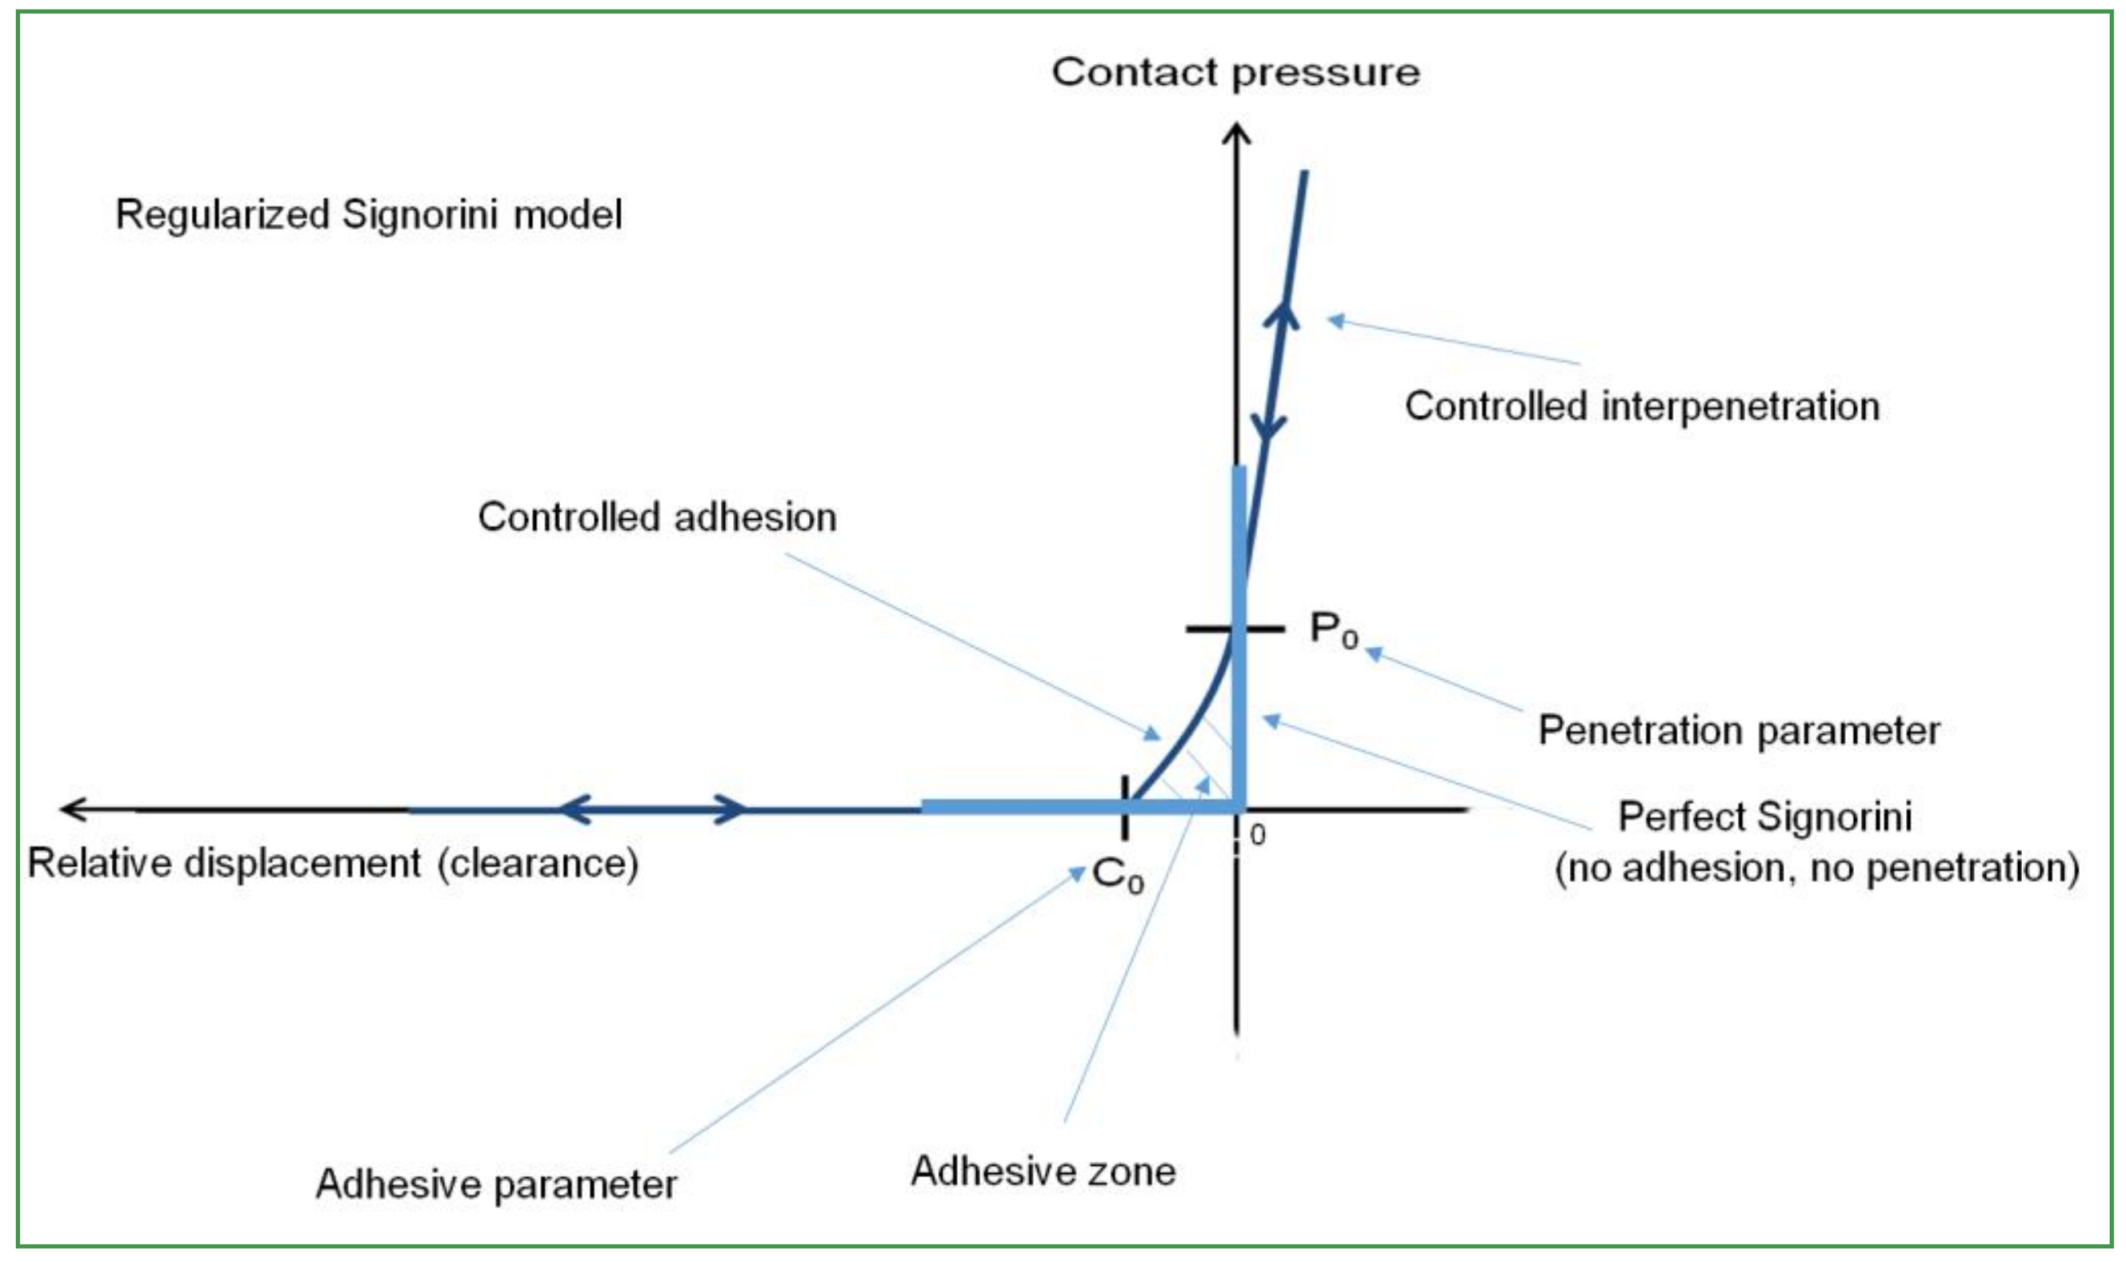
The contact between the tire and the drum is modeled as a softened contact relationship [21], in which the contact pressure is an exponential contact pressure-overclosure relationship. The surfaces begin to transmit contact pressure once the clearance between them, measured in the contact normal direction, reduces to a sufficiently small distance C0. The contact pressure transmitted between the two surfaces increases exponentially as the clearance continues to diminish. Figure 13 illustrates this behavior. The value of the clearance C0 and the contact pressure P0 were determined after a numerical sensitivity analysis, C0 = 0.002 m and P0 = 2000 kPa.
The numerical simulation of tire-drum test is performed in several steps according to the experimental protocol. The tire was preloaded at l1 kN. The numerical simulations are done taking into account the high geometrical deformations of the tire and its hyper-elastic materials. The next Figure 14 shows the tire position on the drum at slip angles at 0° and 6°. The skidding angle is imposed before the drum starts rotating.
3.1. Mesh Sensitivity and Computational Time (CPU)
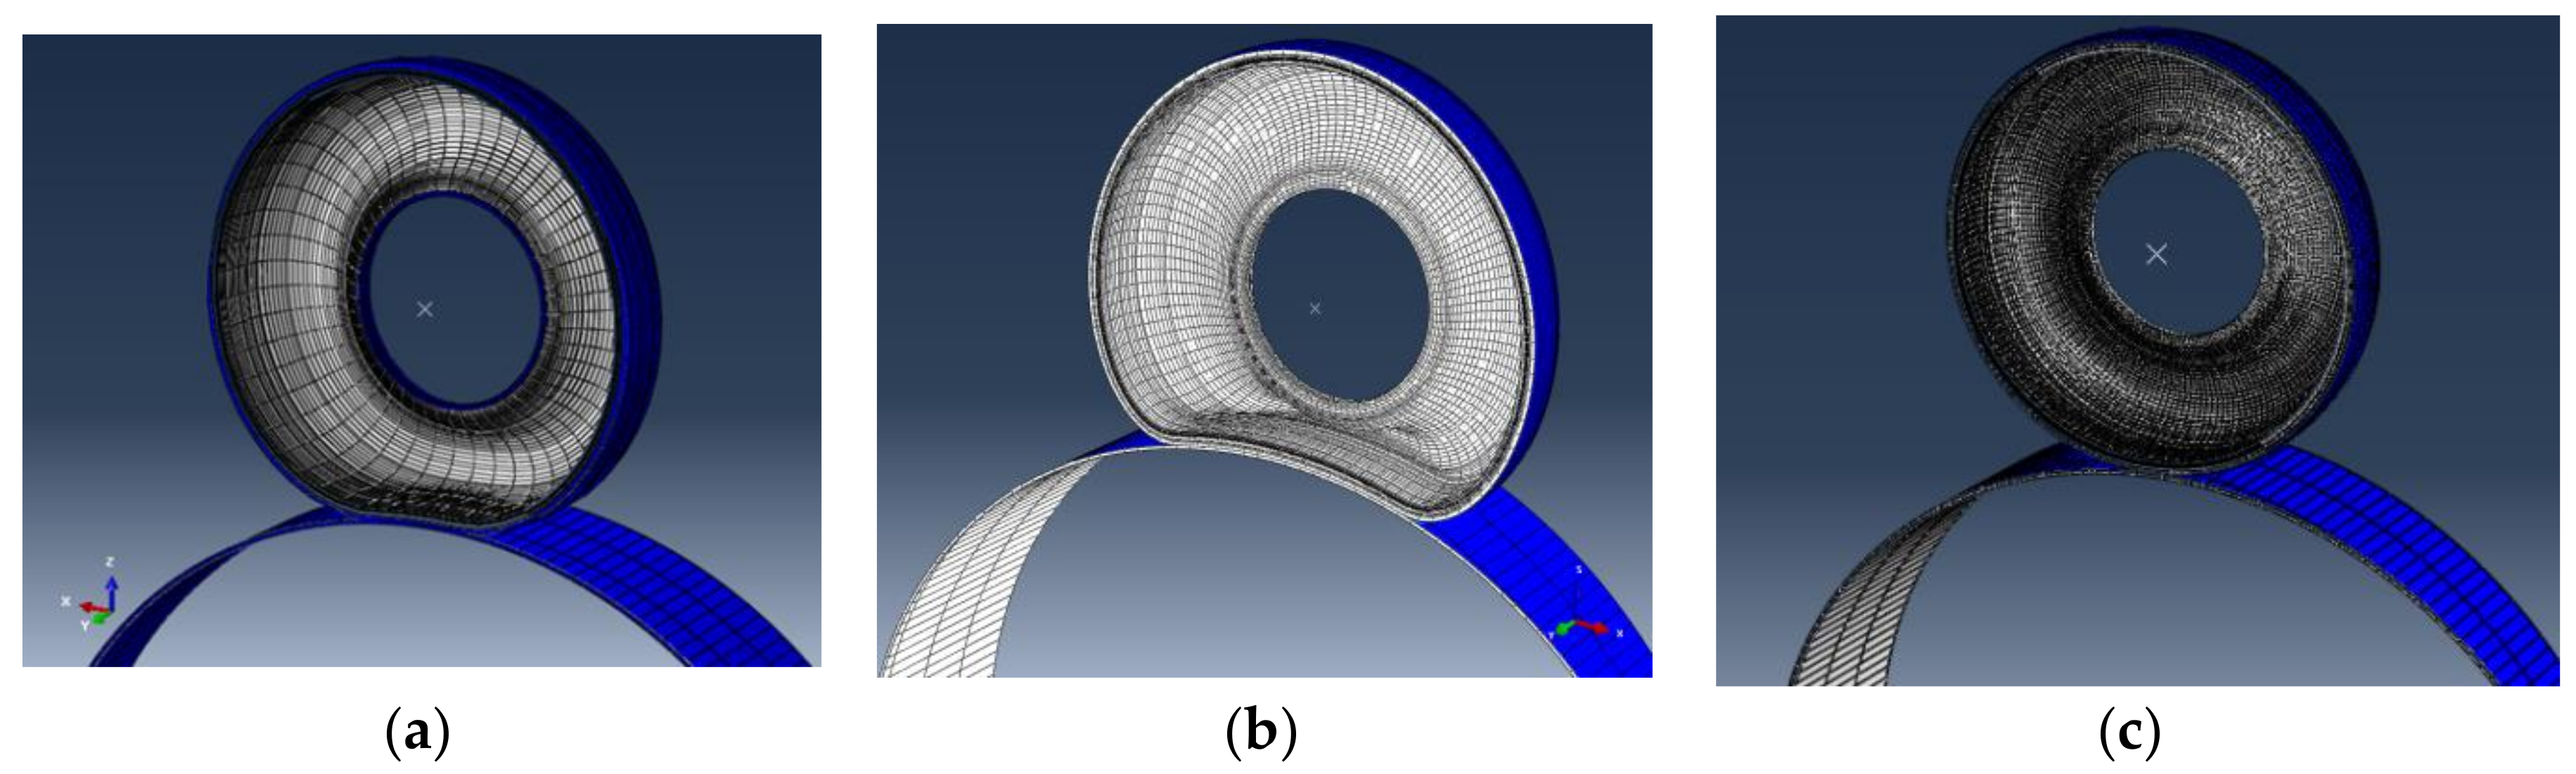
In order to optimize the simulation computational time, different mesh densities with 51, 101 and 181 circumferential elements for the tire and 200 elements for the drum were analyzed, (Figure 15a–c).
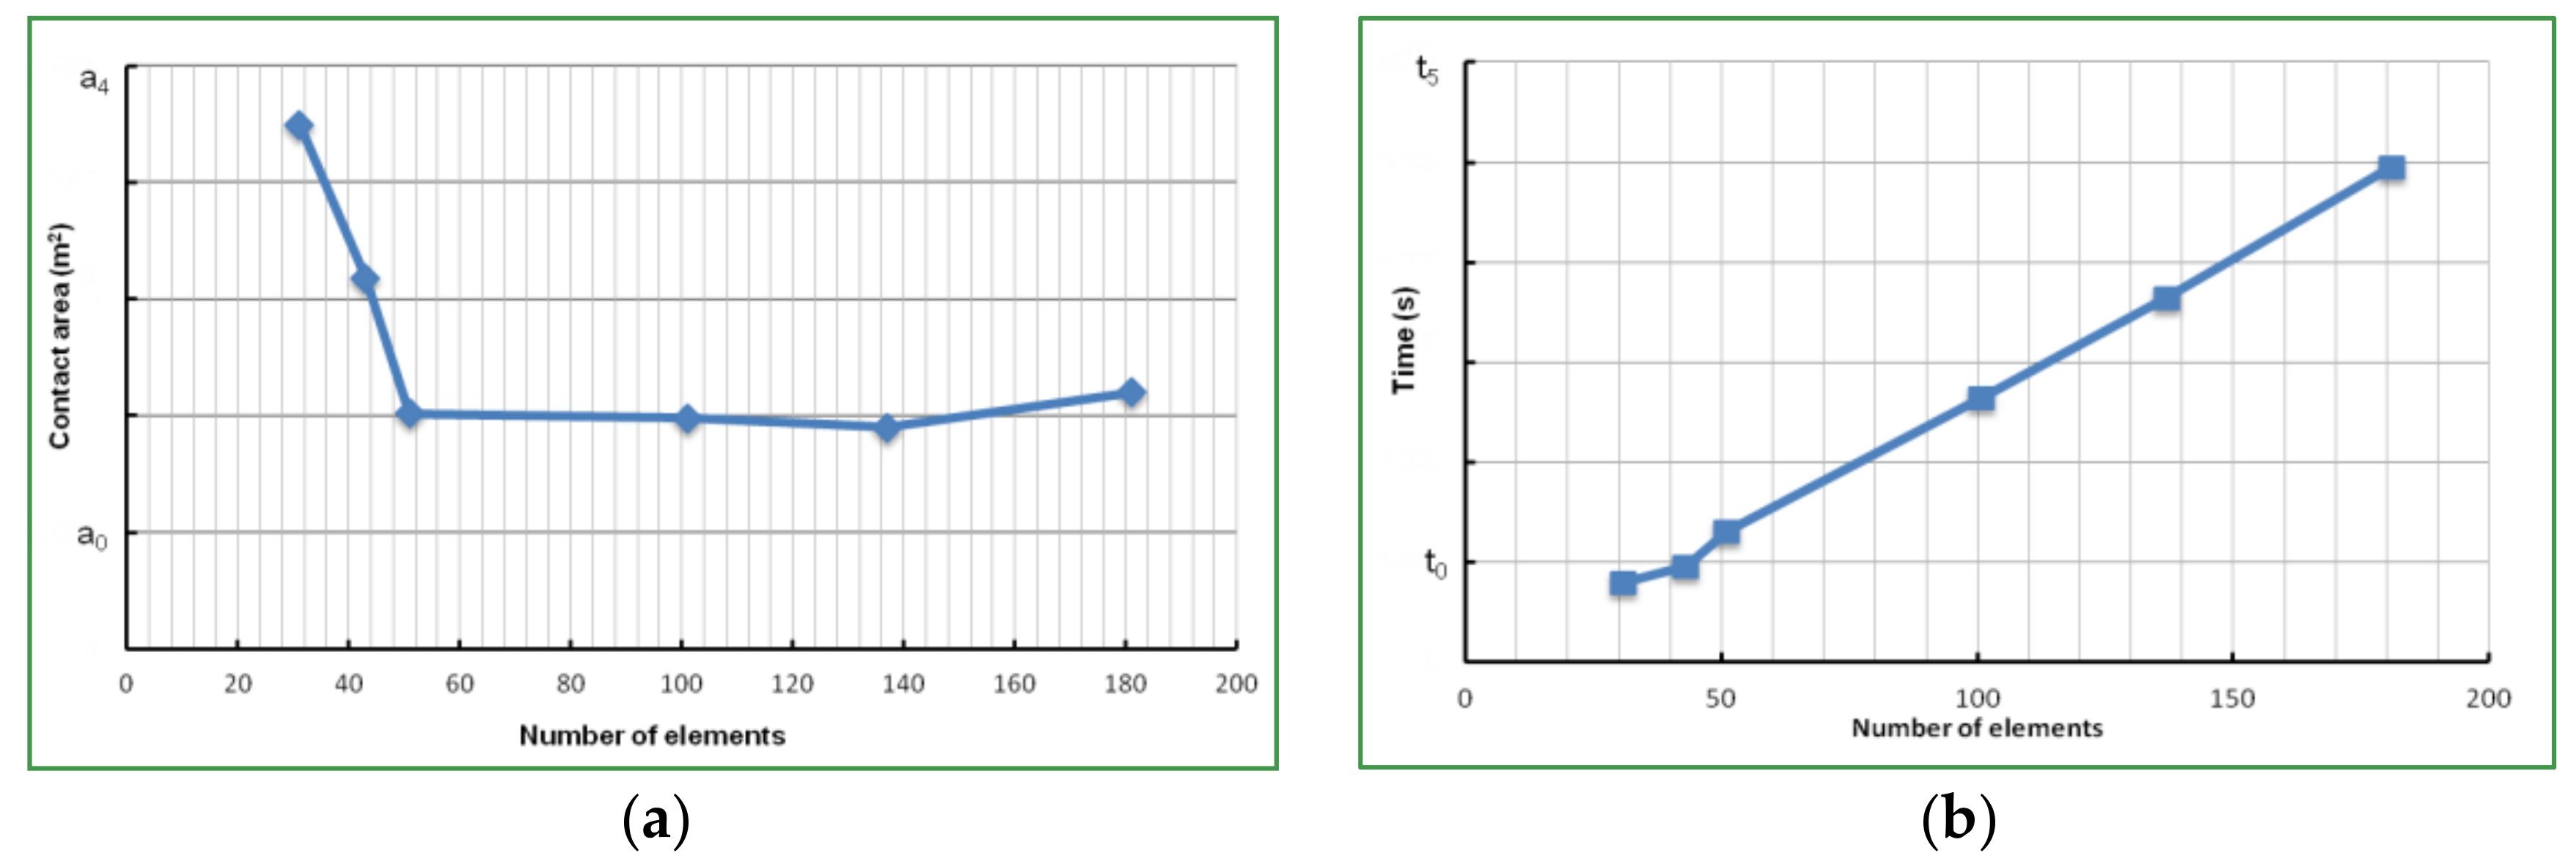
Obviously, the mesh density plays a very considerable role for the accuracy of the tangential forces in the contact zone. A finer mesh permits a very accurate estimation of the contact area, of the grip forces and the temperature distribution, all generated by frictional contact. A sensitivity study on the contact area depending on the element size is presented here after (Figure 16a). The maximum element size has been chosen bearing in mind the small amount of load applied during the acceleration period and the circular shapes of the tire and the drum. As it can be seen, the contact is realized on a small surface. A closer look shows that the mean estimated contact area converges to the measured one. The tire does not present any groove self-contact (contrary to that observed in [22] in another context) or lateral deformations, which is the case for higher loads.
Figure 16b represents the computational time as function of the number of elements, for the loading step. As it can be expected, choosing a higher number of elements will dramatically increase the computational time (CPU). The following numerical simulations are done with 51 continuum solid elements.
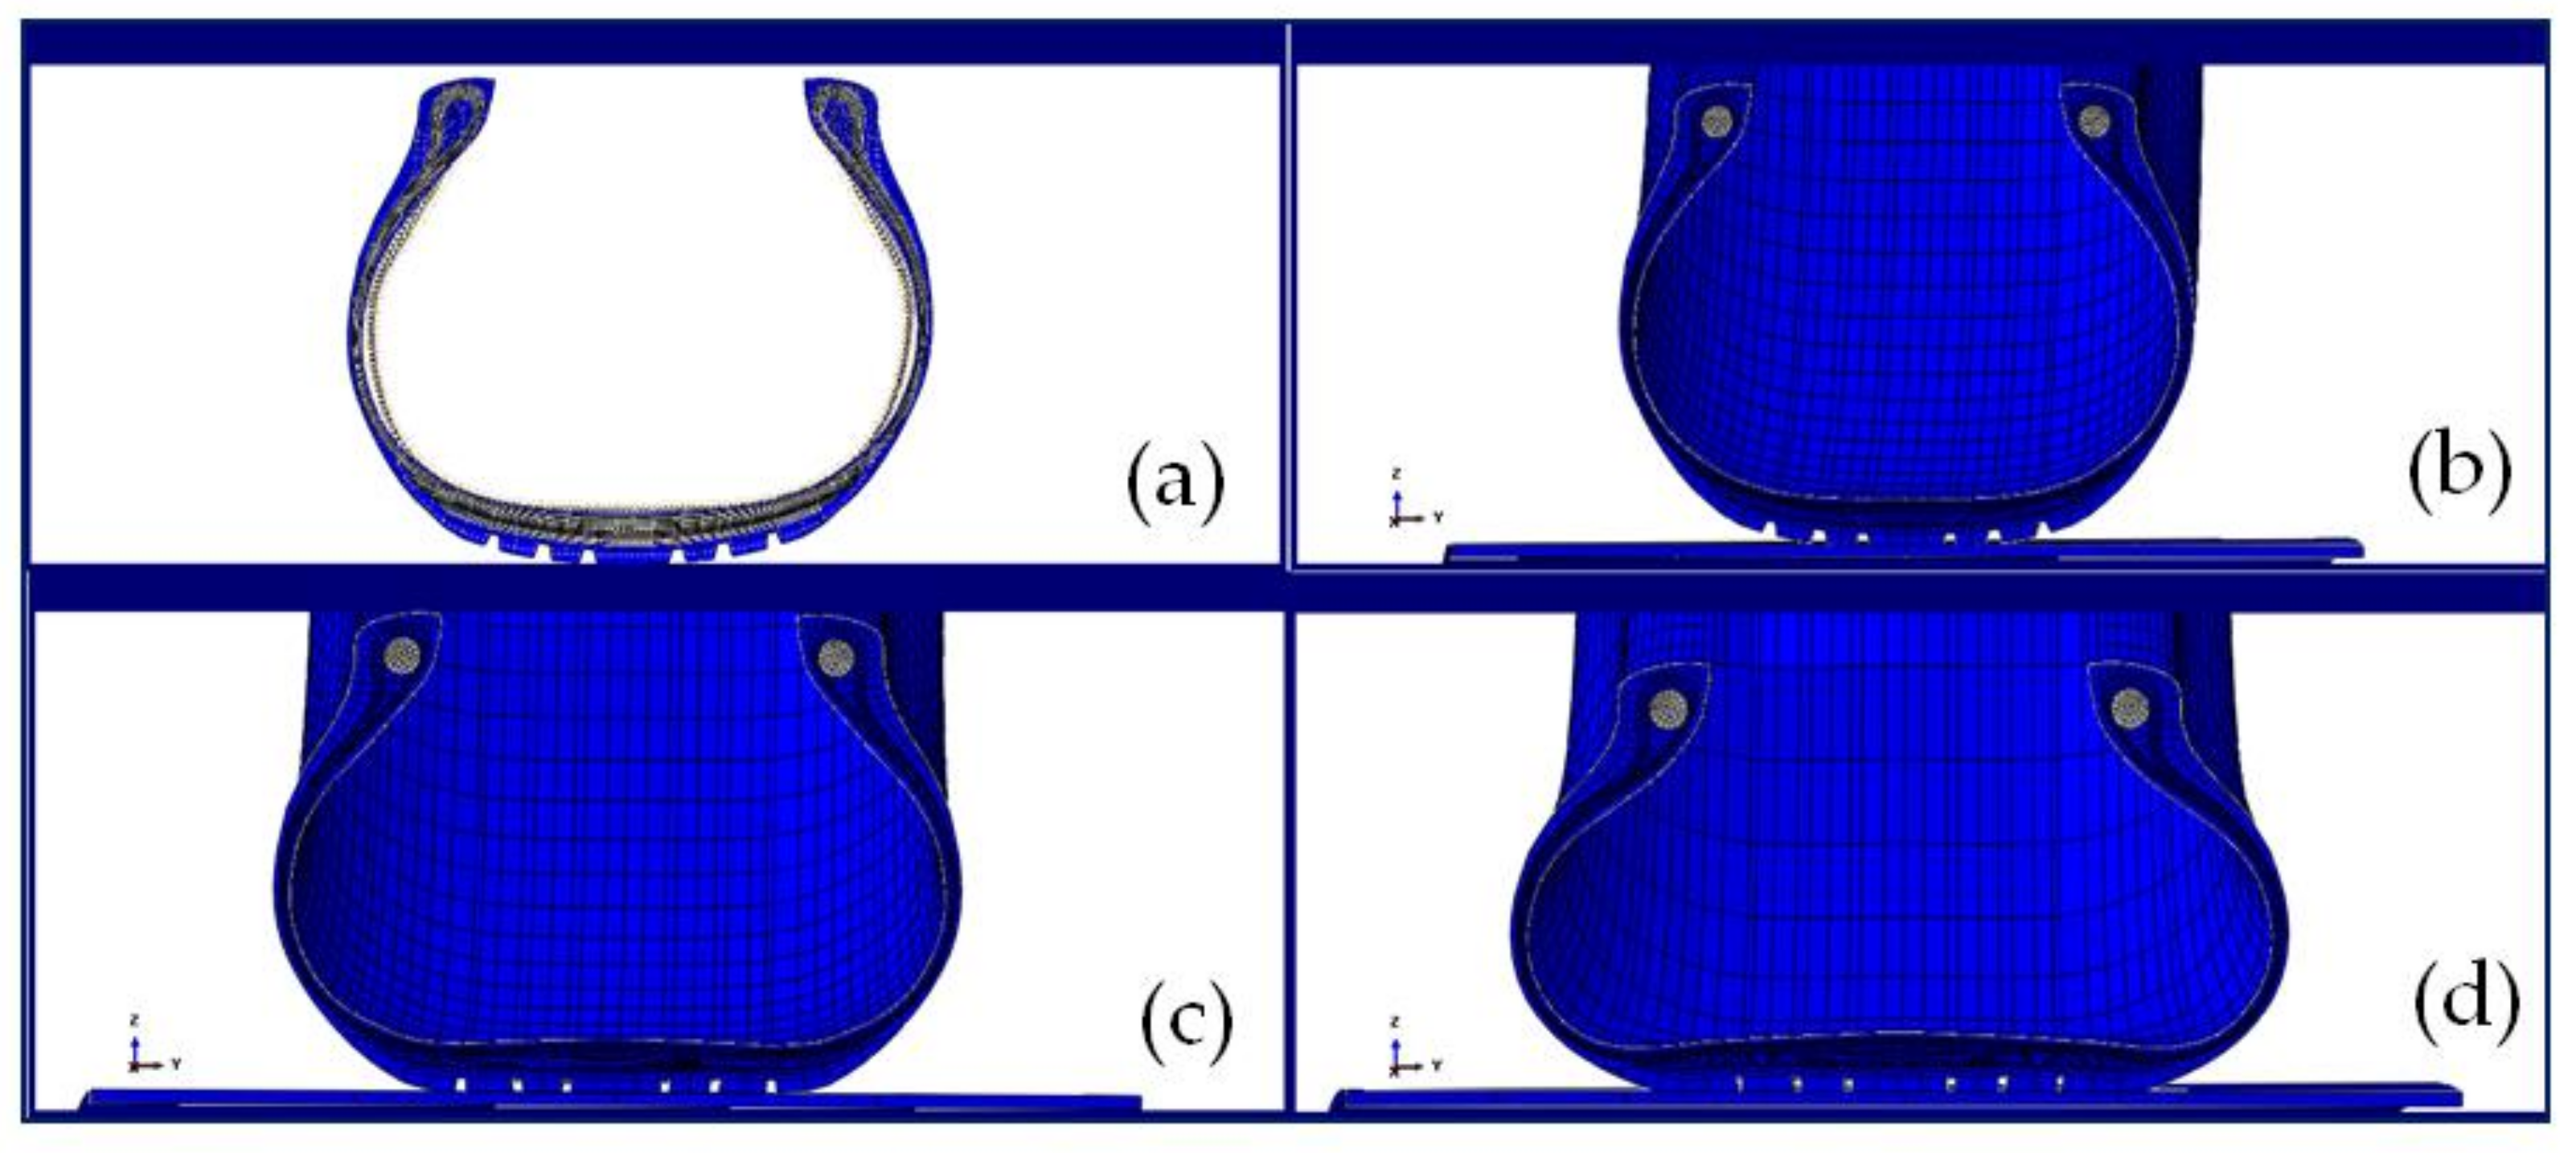
Figure 17 illustrates a numerical simulation of a tire modeled with 51 elements. Figure 17a shows the 2-D section of the tire before and after inflation at the nominal pressure. Figure 17b represents 3-D sections of the tire with a preloading of l1 kN, Figure 17c shows the tire loaded with l2 = 10 × l1 kN and Figure 17d illustrates the tire section loaded with l3 = 25 × l1 kN. The model realized with 51 circumferential elements seems to be convenient for loading less than 300 kN. It is clear that in the case of a loading greater than 300 kN, the option of 101 or 181 elements seems to be necessary, knowing that the computational time is still a considerable factor to take into account.
3.2. Numerical Simulation of an Aircraft Tire Rolling on a Steel Drum, Loading with 200 kN, Velocity up to 114 km/h, Skidding Angle = 6°
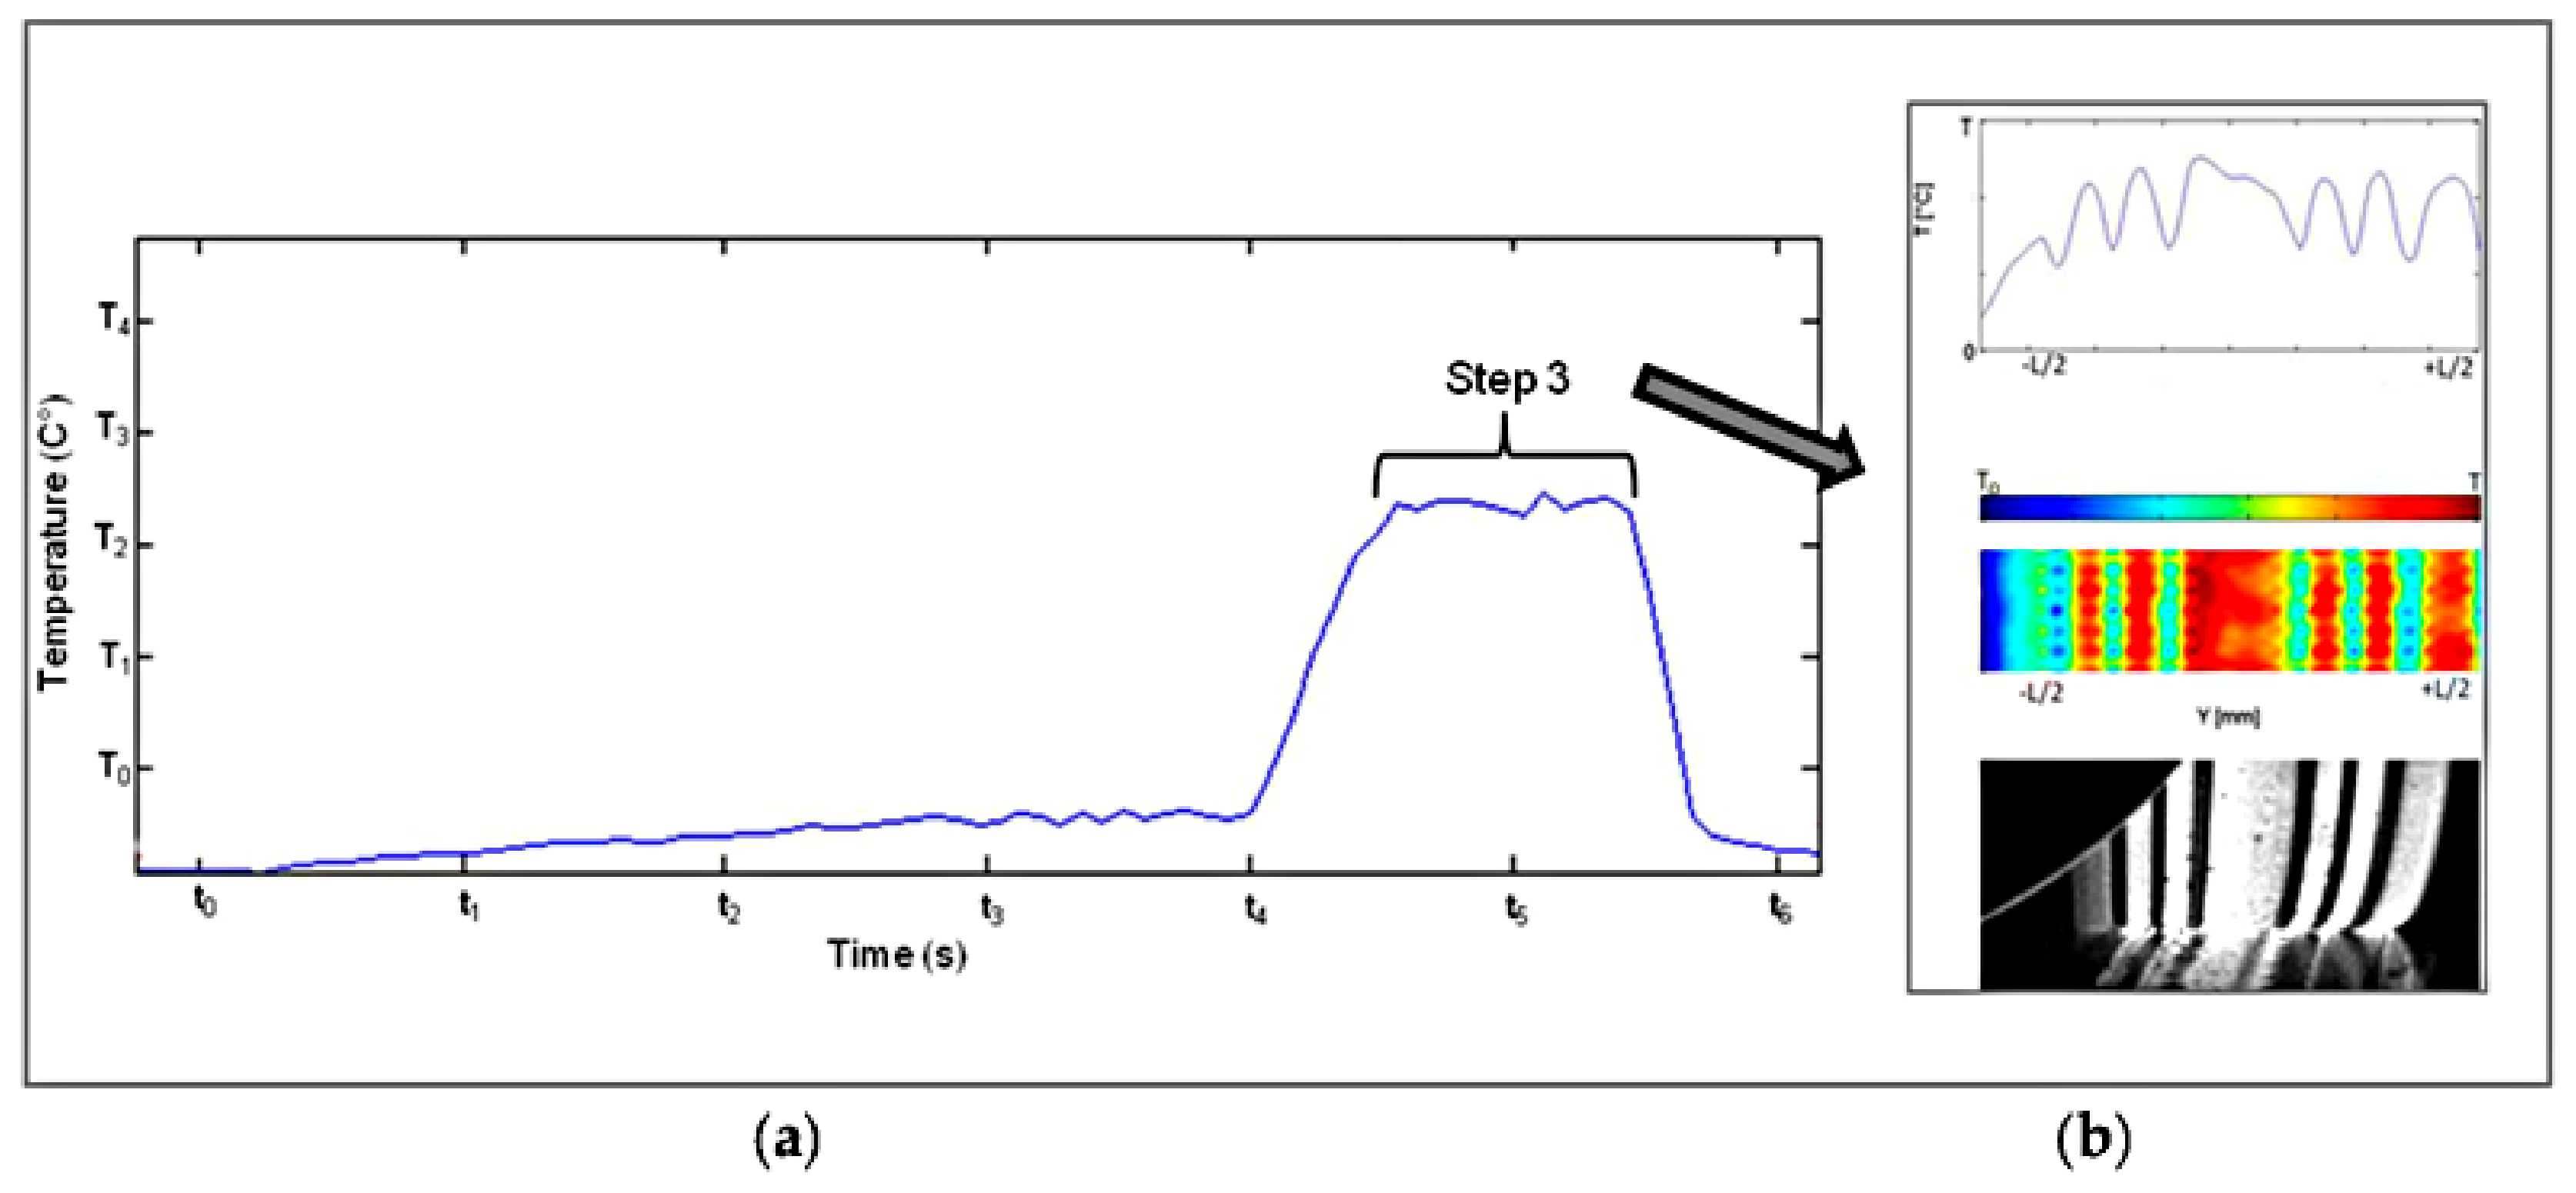
Figure 18a shows the global temperature evolution of tire tread at the end of testing. Figure 18b represents the experimental data for several frames of the thermal evolution of the tire tread for the third step, recorded for a period of 1.5 s of rolling. The present numerical model does not take into account neither the wear phenomenon nor the thermal exchange between the tire and the drum.
Figure 19 illustrates the thermal evolution of the tire tread loading with 200 kN, rolling with a velocity up to 114 km/h with skidding angle of 6°. The experimental and numerical data are compared in the next figure.
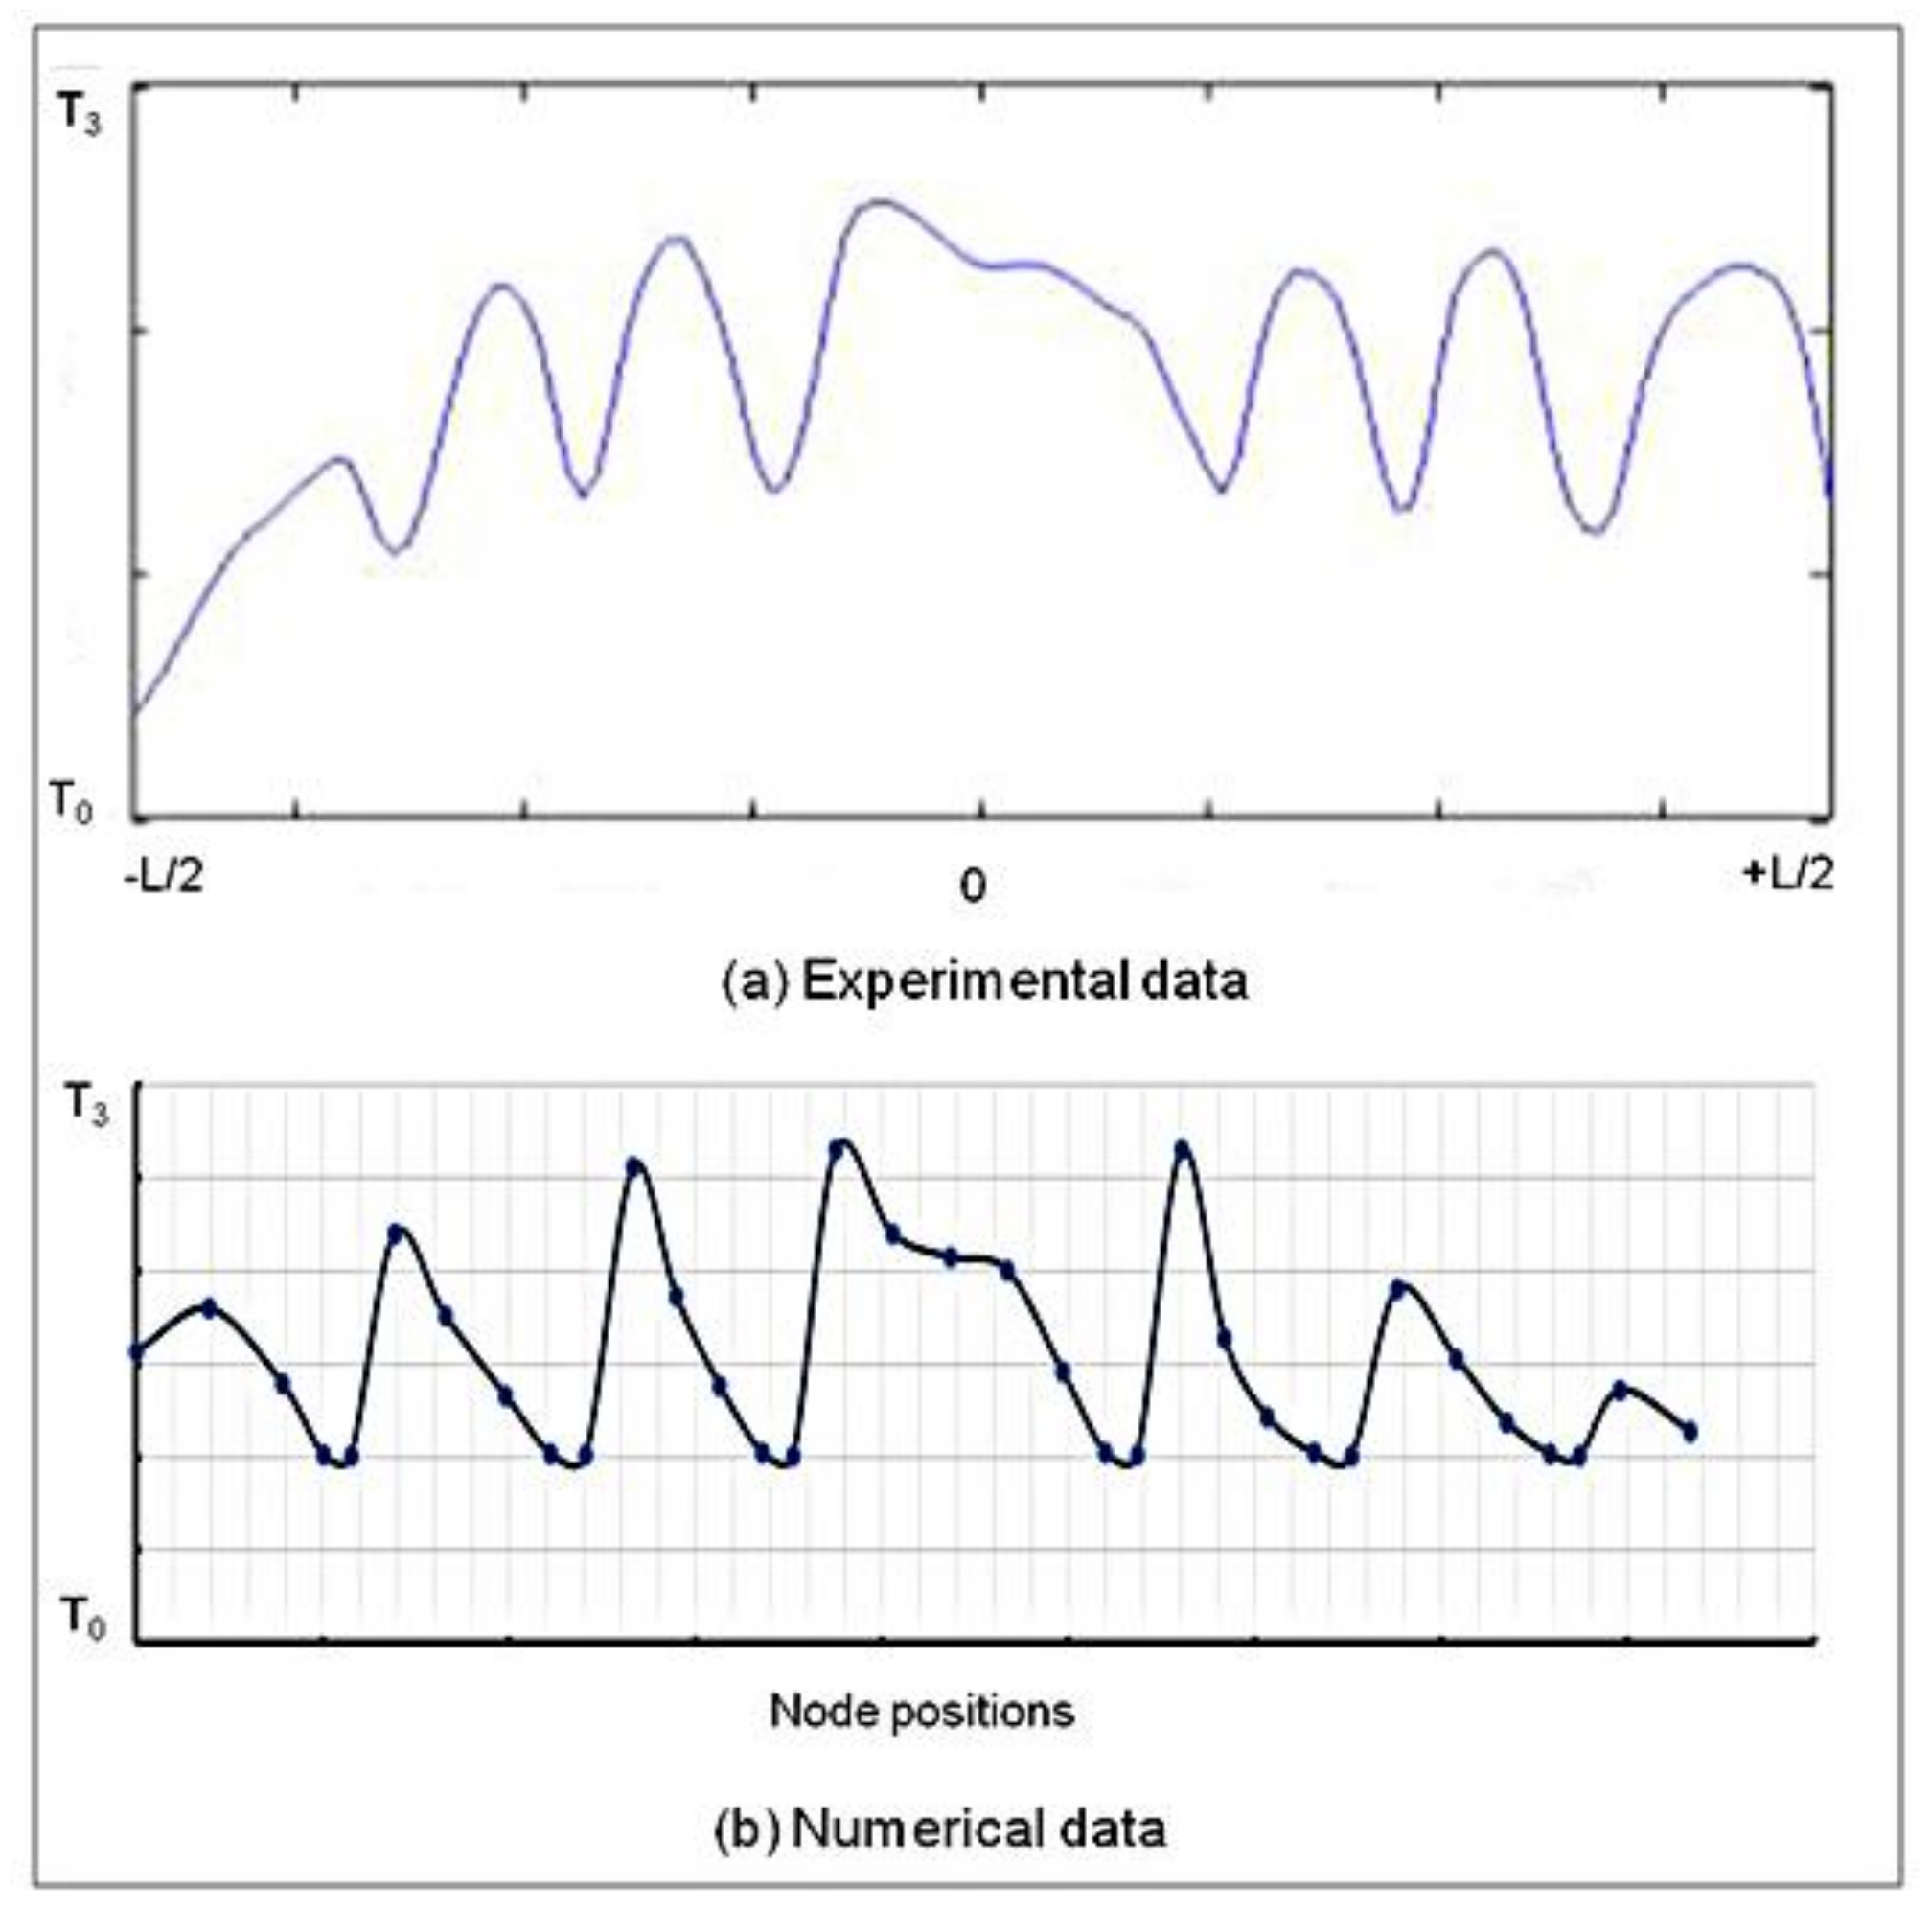
Figure 20 illustrates the temperature distribution along the cross section of the tire tread. Figure 20a represents the experimental data along the interface of the tire tread where the measurement was performed; the numerical results presented in (Figure 20b) show the thermal evolution along the entire contact interface. The good correlation between numerical and experimental data shows that numerical simulation could predict the thermal evolution of the tire rolling at velocities up to 114 km/h.
3.3. Numerical Simulation of an Aircraft Tire Rolling on a Steel Drum, Loading with 200 kN, Velocity up to 190 km/h, Skidding Angle = 6°
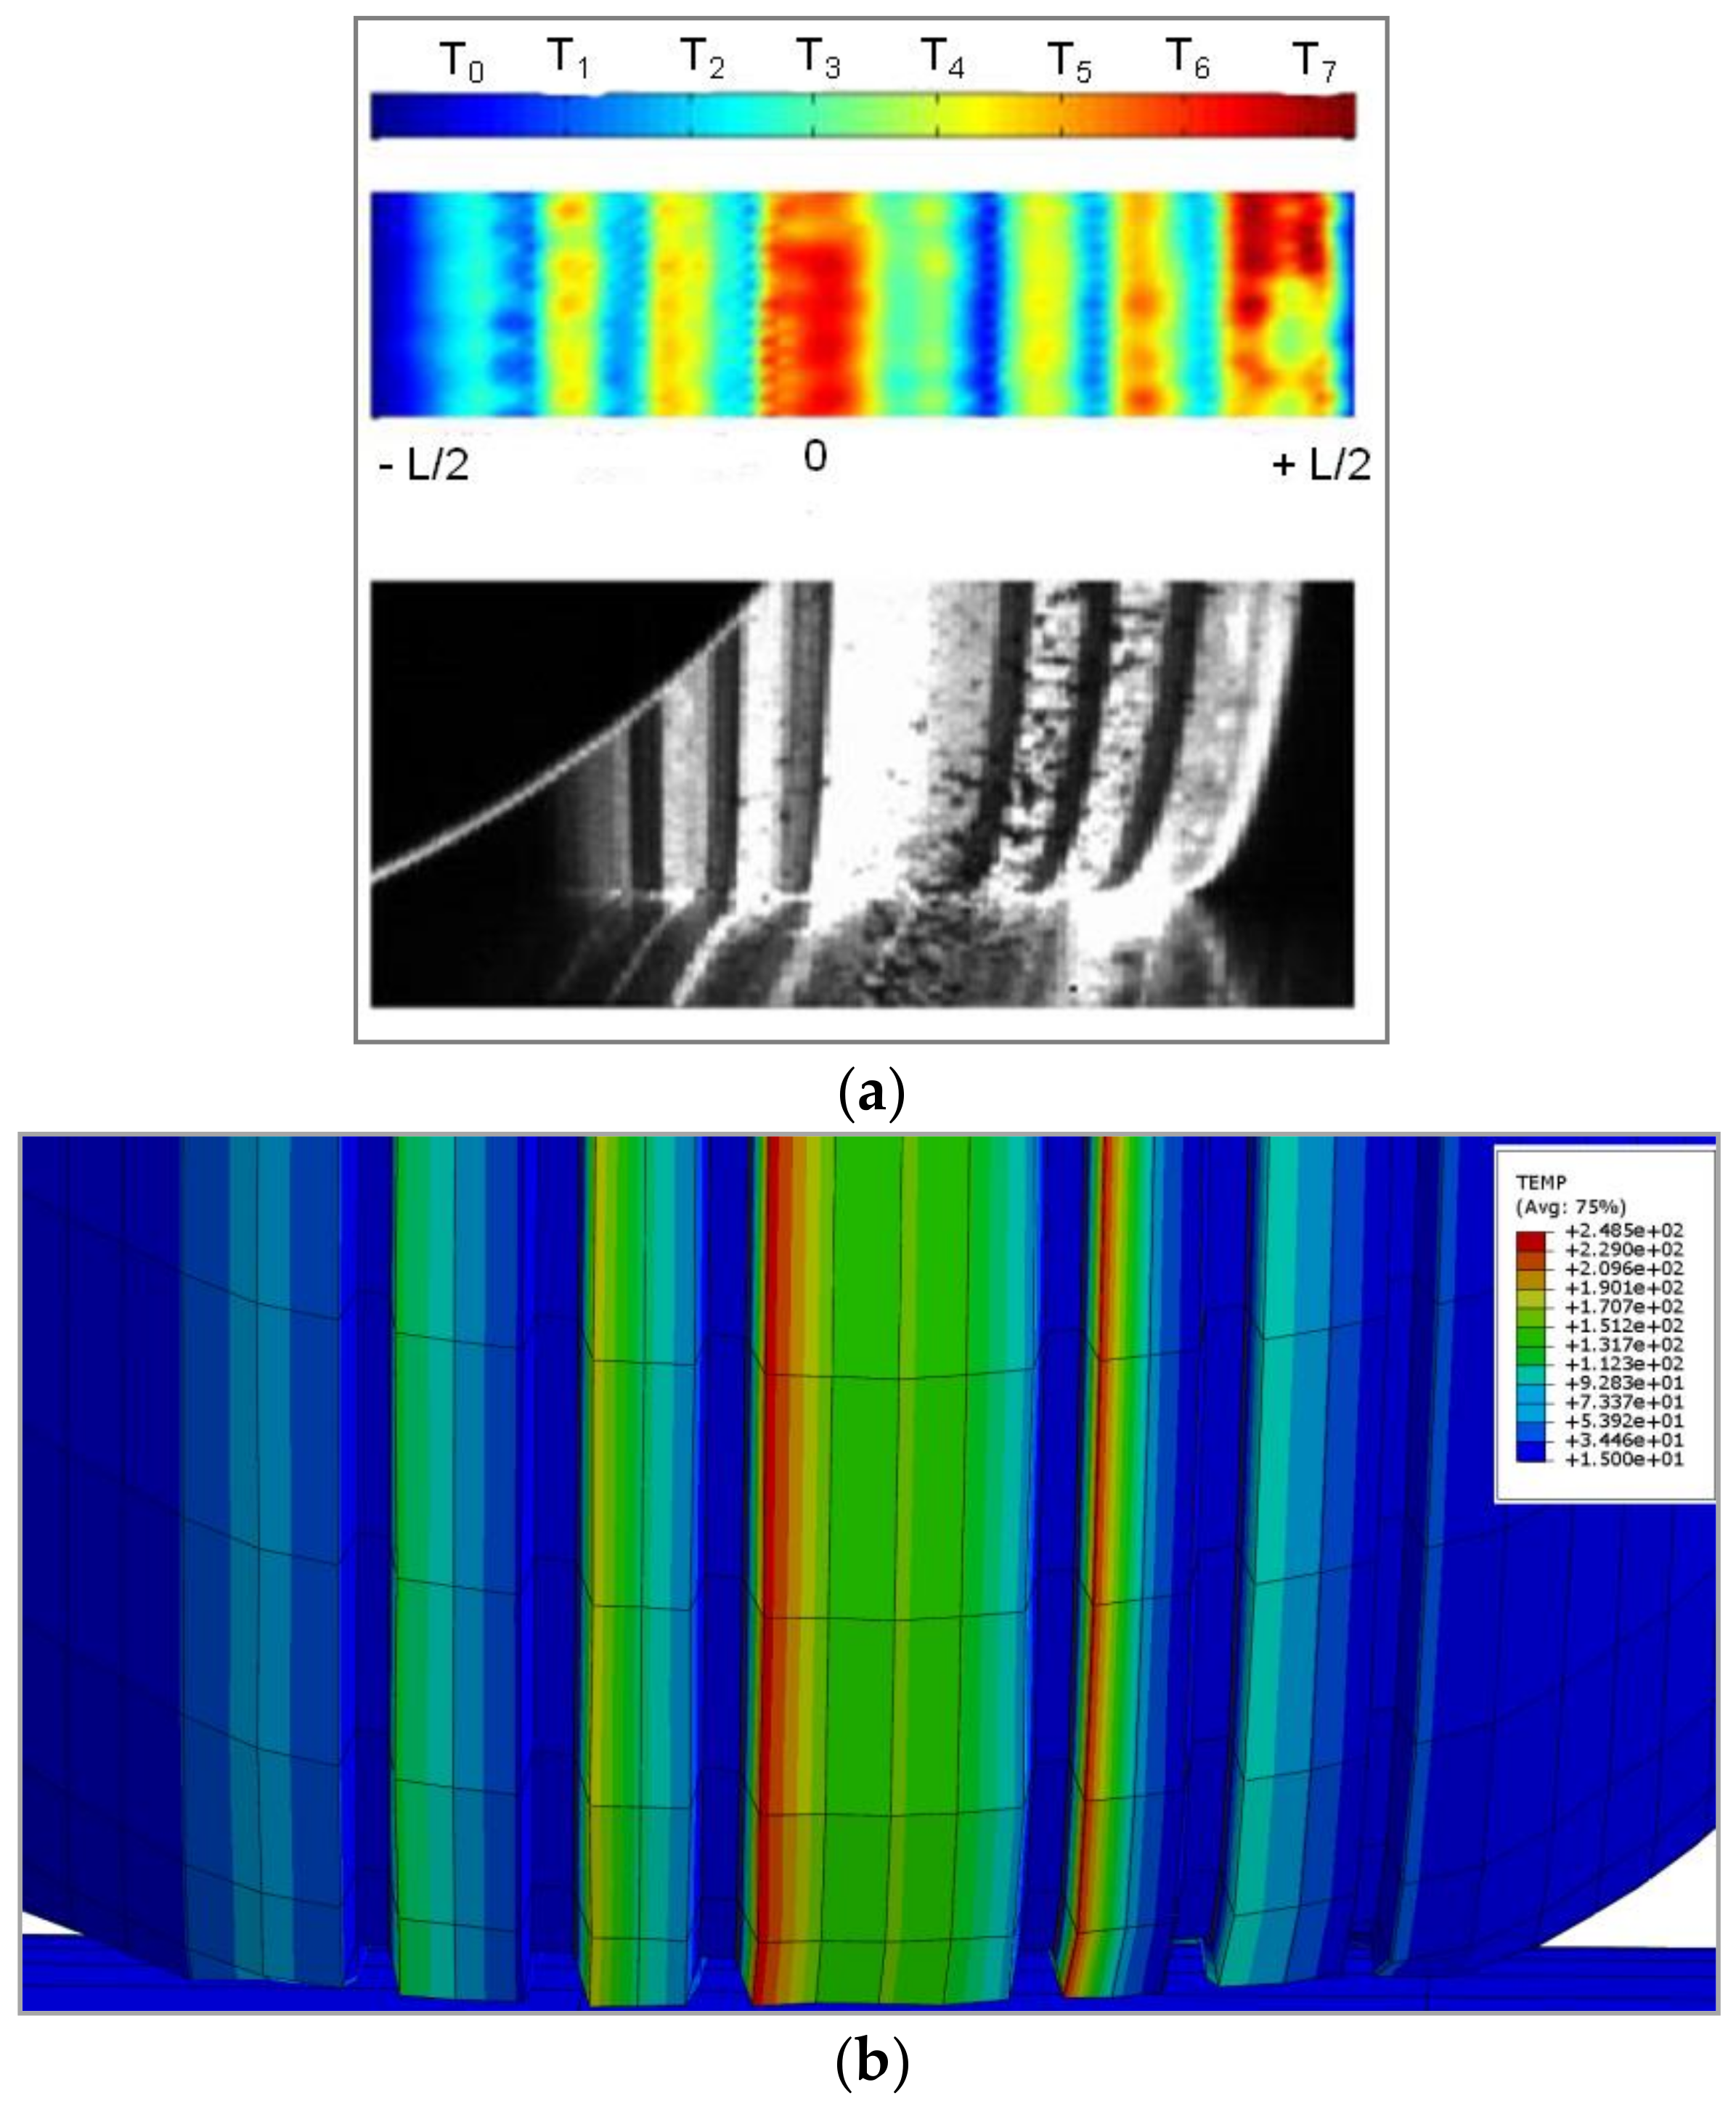
As it can be noted on Figure 20a, for a tire loading of 200 kN, rolling at velocity up to 190 km/h with skidding angle of 6°, a high thermal evolution occurred in the center of tire tread and also on the extreme right part of it. Fine particles of the tire tread rubber are deposed on the drum surface, meaning that wear appeared short time after starting rolling despite the preventive measures described in the set-up procedure steps.
The numerical model predicted a higher temperature on the same zone (Figure 21b); this could be explained by the absence of wear and of thermal conductivity to drum surface.
4. Conclusions
In the first part of this paper, an accurate methodology has been suggested and carried out for the testing of an aircraft tire rolling on a steel drum. Different loadings (up to 330 kN), tangential velocities (up to 190 km/h) and cornering conditions were tested. The influences of skidding angle, velocity and loading on the thermal evolution of the tire tread were recorded and discussed.
The experimental observations confirm that, in the case of rolling at high velocities (up to 190 km/h) on a steel drum, the thermal evolution of the tire tread is mostly influenced by the skidding angle followed by the velocity and loading.
A second part was dedicated to the study of a finite element model able to predict efficiently the aircraft tire behavior at high speeds, where experimental tests on a flat runway are still expensive and hard to realize and need specific equipment. The angular velocity and loading were varied in order to understand the influence of these parameters on the thermal evolution of the tire tread. The good correlation between numerical and experimental data shows that numerical simulation could predict the thermal evolution of the tire rolling at velocities up to 114 km/h. These results are in agreement and complement a previous work [5] realized on an identical tire for which the experimental tests were investigated on flat runway.
For high velocities, some difficulties were faced related to wear; fine fragments of tire tread deposed on the drum surface and the reflecting mirror, affected the data recorded by the infrared camera.
Author Contributions
Iulian Rosu and Hélène Elias-Birembaux carried out the numerical and experimental simulations and analyzed the data. All authors were involved in the preparation of the manuscript.
Conflicts of Interest
The authors declare no conflict of interest.
References
- Clark, S.K.; Dogde, R.N. Heat Generation in Aircraft Tire under Free Rolling Conditions; NASA Technical Report 3629; Michigan University Department of Mechanical Engineering and Applied Mechanics: Ann Arbor, MI, USA, 1982. [Google Scholar]
- Sarkar, K.; Kwon, Y.D.; Prevorsek, D.C. A new approach for the thermomechanical analysis of tires by the finite element method. Tire Sci. Technol. 1987, 15, 261–275. [Google Scholar] [CrossRef]
- Ebbott, T.G.; Hohman, R.L.; Jeusette, J.A.P.; Kerchman, V. Tire temperature and rolling resistance prediction with finite element analysis. Tire Sci. Technol. 1999, 27, 2–21. [Google Scholar] [CrossRef]
- Chae, S.E.G.; El-Gindy, M.; Trivedi, M.; Johansson, I.; Oijer, F. Dynamic response predictions of a truck tire using detailed finite element and rigid ring models. In Proceedings of the ASME International Mechanical Engineering Congress and Exposition, Anaheim, CA, USA, 13–19 November 2004. [Google Scholar]
- Rosu, I.; Elias-Birembaux, H.L.; Lebon, F.; Lind, H.; Wangenheim, M. Experimental and numerical simulation of the dynamic frictional contact between an aircraft tire rubber and a rough surface. Lubr. Spec. Issue Numer. Simul. Static Dyn. Frict. 2016, 4, 29. [Google Scholar] [CrossRef]
- Rosu, I.; Elias-Birembaux, L.; Lebon, F. Thermo-viscoelastic modeling of the aircraft tire cornering. Adv. Mater. Res. 2015, 1099, 80–86. [Google Scholar] [CrossRef]
- Elias-Birembaux, L.; Rosu, I.; Lebon, F. Thermo-viscoelastic modeling of aircraft tire cornering. In Proceedings of the 30th International Conference of Polymer Processing Society, Cleveland, OH, USA, 6–12 June 2014. [Google Scholar]
- Elias-Birembaux, L.; Rosu, I.; Lebon, F. Thermo-mechanical modelling of the aircraft tyre cornering. Mach. Dyn. Res. 2013, 37, 29–36. [Google Scholar]
- Kongo Kondé, A.; Rosu, I.; Lebon, F.; Brardo, O.; Devésa, B. On the modeling of aircraft tire. Aerosp. Sci. Technol. 2013, 27, 67–75. [Google Scholar] [CrossRef]
- Clark, S.K.; Dodge, R.N. A Handbook for the Rolling Resistance of Pneumatic Tires; Industrial Development Division of the Institute of Science and Technology, University of Michigan: Ann Arbor, MI, USA, 1979. [Google Scholar]
- Wilburn, D.K. A Temperature Study of Pneumatic Tires during Highway Operation; Defense Technical Center: Belvoir, VA, USA, 1972. [Google Scholar]
- TS Testing Service GmbH. Available online: http://www.testingservice.de/index.php/automotive/dyno-safety (accessed on 4 December 2017).
- Hall, W. Finite Element Modeling and Simulation for a ‘Smart’ Tire. Ph.D. Thesis, University of Warwick, Warwick, UK, 2003. [Google Scholar]
- Korunovic, N.; Trajanovic, M.; Stojkovic, M.; Mišic, D.; Milovanovic, J. Finite element analysis of a tire steady rolling on the drum and comparison with experiment. J. Mech. Eng. 2011, 57, 888–897. [Google Scholar] [CrossRef]
- Linke, T.; Wangenheim, M.; Lind, H.; Ripka, S. Experimental friction and temperature investigation on aircraft tires. Tire Sci. Technol. 2014, 42, 116–144. [Google Scholar]
- Mooney, M. A theory of large elastic deformation. J. Appl. Phys. 1940, 11, 582–592. [Google Scholar] [CrossRef]
- Rivlin, R.S. Large elastic deformations of isotropic materials. IV. Further developments of the general theory. Philos. Trans. R. Soc. Lond. 1948, 241, 379–397. [Google Scholar] [CrossRef]
- Johnson, A.R.; Quigley, C.J.; Young, D.G.; Danik, J.A. Visco-hyper elastic modeling of rubber vulcanizates. Tire Sci. Technol. 1993, 21, 179–199. [Google Scholar] [CrossRef]
- Yu, M.; Wu, G.; Kong, L.; Tang, Y. Tire-pavement friction characteristics with elastic properties of asphalt pavements. Appl. Sci. 2017, 7, 1123. [Google Scholar] [CrossRef]
- Ghoreishy, M.H.R.; Alimardani, M.; Mehrabian, R.Z.; Gangali, S.T. Modeling the hyperviscoelastic behavior of a tire tread compound reinforced by silica and carbon black. J. Appl. Polym. Sci. 2013, 128, 1725–1731. [Google Scholar] [CrossRef]
- Abaqus Theory Manual (6.12). Available online: http://130.149.89.49:2080/v6.12/books/stm/default.htm (accessed on 4 December 2017).
- Kongo Kondé, A. Modélisation du Roulement d’un Pneumatique D’Avion. Ph.D. Thesis, Aix-Marseille University, Marseille, France, 2011. [Google Scholar]
Figure 1.
Typical drum testing machine/external surface test [12].
Figure 1.
Typical drum testing machine/external surface test [12].

Figure 2.
(a) Experimental set-up (b) tire position, view camera/before loading, (c) tire position, view camera/after loading, (d) mirror and infrared camera positions.
Figure 2.
(a) Experimental set-up (b) tire position, view camera/before loading, (c) tire position, view camera/after loading, (d) mirror and infrared camera positions.

Figure 3.
The test protocol. (a) loading steps, (b) velocity strategy, (c) skidding angle.

Figure 4.
Experimental set-up: (a) tire/drum configuration (b) temperature distribution in the contact zone, (c) the thermal evolution of contact zone.
Figure 4.
Experimental set-up: (a) tire/drum configuration (b) temperature distribution in the contact zone, (c) the thermal evolution of contact zone.

Figure 5.
The variation of skidding angles for loading l3 = 200 kN and velocity lower than 120 km/h.
Figure 5.
The variation of skidding angles for loading l3 = 200 kN and velocity lower than 120 km/h.

Figure 6.
The variation of skidding angles for constant loading l3 = 260 kN at velocity lower than 120 km/h.
Figure 6.
The variation of skidding angles for constant loading l3 = 260 kN at velocity lower than 120 km/h.

Figure 7.
The variation of skidding angles for a constant loading l3 = 200 kN at velocity up to 190 km/h.
Figure 7.
The variation of skidding angles for a constant loading l3 = 200 kN at velocity up to 190 km/h.

Figure 8.
Temperature variation of tire tread for a constant loading of 200 kN, at a given skidding angle of 8° and for four different velocities: s1, s2 = 3 × s1, s3 = 1.6 × s2, s4 = 1.4 × s3.
Figure 8.
Temperature variation of tire tread for a constant loading of 200 kN, at a given skidding angle of 8° and for four different velocities: s1, s2 = 3 × s1, s3 = 1.6 × s2, s4 = 1.4 × s3.

Figure 9.
Temperature variation of the tire tread for a given velocity s3 lower than 120 km/h, at a given skidding angle of 6° and for five different loadings: l1, l2 = l.5 × l1, l3 = 2 × l2, l4 = 1.3 × l3, l5 = 1.3 × l4.
Figure 9.
Temperature variation of the tire tread for a given velocity s3 lower than 120 km/h, at a given skidding angle of 6° and for five different loadings: l1, l2 = l.5 × l1, l3 = 2 × l2, l4 = 1.3 × l3, l5 = 1.3 × l4.

Figure 10.
Experimental measurements: (a) thermal evolution of an aircraft tire tread rolling on a standard runway, (b) image of contact zone, infrared camera acquisition, (c) typical S-profile of thermal evolution of tire tread rolling on a flat runway.
Figure 10.
Experimental measurements: (a) thermal evolution of an aircraft tire tread rolling on a standard runway, (b) image of contact zone, infrared camera acquisition, (c) typical S-profile of thermal evolution of tire tread rolling on a flat runway.

Figure 11.
Experimental test: (a) thermal evolution of the tire tread rolling on a drum, (b) image of the contact zone.
Figure 11.
Experimental test: (a) thermal evolution of the tire tread rolling on a drum, (b) image of the contact zone.

Figure 12.
Tire 3-D finite element model built-up from the 2-D tire cross section.

Figure 13.
Exponential “softened” pressure-overclosure relationship.

Figure 14.
(a) The tire position on the drum at skidding angles at 0° and 6°, (b) numerical simulation, tire/drum set-up.
Figure 14.
(a) The tire position on the drum at skidding angles at 0° and 6°, (b) numerical simulation, tire/drum set-up.

Figure 15.
Different mesh options: Tire modeled using: (a) 51 elements, (b) 101 elements, (c) 181 elements.
Figure 15.
Different mesh options: Tire modeled using: (a) 51 elements, (b) 101 elements, (c) 181 elements.

Figure 16.
(a) Variation of contact area as a function of the number of elements, (b) computational time (CPU) as a function of the number of elements.
Figure 16.
(a) Variation of contact area as a function of the number of elements, (b) computational time (CPU) as a function of the number of elements.

Figure 17.
Numerical simulation, tire modeled with 51 elements (a) 2-D, deflated and inflated tire, (b) 3-D inflated tire pre-loaded with l1 kN, (c) inflated tire loaded with l2 = 10 × l1 kN, (d) inflated tire loaded with l3 = 25 × l1 kN.
Figure 17.
Numerical simulation, tire modeled with 51 elements (a) 2-D, deflated and inflated tire, (b) 3-D inflated tire pre-loaded with l1 kN, (c) inflated tire loaded with l2 = 10 × l1 kN, (d) inflated tire loaded with l3 = 25 × l1 kN.

Figure 18.
Experimental data, tire rolling on a steel drum, loading with 200 kN, velocity up to 114 km/h, skidding angle = 6°, (a) global temperature evolution of tire tread during the four steps of testing (Figure 3), (b) temperature of the contact zone, infrared camera recorded during 1.5 s of the step 3.

Figure 19.
Numerical simulation, thermal evolution of the tire tread, numerical simulation, for a tire loading with 200 kN, rolling velocity up to 114 km/h, skidding angle of 6°.
Figure 19.
Numerical simulation, thermal evolution of the tire tread, numerical simulation, for a tire loading with 200 kN, rolling velocity up to 114 km/h, skidding angle of 6°.

Figure 20.
Temperature distribution on the cross-section of the tire tread loading with 200 kN rolling up to 114 km/h, with a skidding angle of 6, (a) experimental data, (b) numerical simulation.
Figure 20.
Temperature distribution on the cross-section of the tire tread loading with 200 kN rolling up to 114 km/h, with a skidding angle of 6, (a) experimental data, (b) numerical simulation.

Figure 21.
Thermal evolution of the tire tread, numerical simulation, for a tire loading with 200 kN, rolling velocity up to 190 km/h, skidding angle of 6°, (a) experimental data, (b) numerical simulation.
Figure 21.
Thermal evolution of the tire tread, numerical simulation, for a tire loading with 200 kN, rolling velocity up to 190 km/h, skidding angle of 6°, (a) experimental data, (b) numerical simulation.

© 2018 by the authors. Licensee MDPI, Basel, Switzerland. This article is an open access article distributed under the terms and conditions of the Creative Commons Attribution (CC BY) license (http://creativecommons.org/licenses/by/4.0/).
Share and Cite
MDPI and ACS Style
Rosu, I.; Elias-Birembaux, H.L.; Lebon, F. Finite Element Modeling of an Aircraft Tire Rolling on a Steel Drum: Experimental Investigations and Numerical Simulations. Appl. Sci. 2018, 8, 593. https://doi.org/10.3390/app8040593
AMA Style
Rosu I, Elias-Birembaux HL, Lebon F. Finite Element Modeling of an Aircraft Tire Rolling on a Steel Drum: Experimental Investigations and Numerical Simulations. Applied Sciences. 2018; 8(4):593. https://doi.org/10.3390/app8040593
Chicago/Turabian StyleRosu, Iulian, Hélène L. Elias-Birembaux, and Frédéric Lebon. 2018. "Finite Element Modeling of an Aircraft Tire Rolling on a Steel Drum: Experimental Investigations and Numerical Simulations" Applied Sciences 8, no. 4: 593. https://doi.org/10.3390/app8040593
Note that from the first issue of 2016, this journal uses article numbers instead of page numbers. See further details here.