
Effect of Alginate Proportion in Glycerol-Reinforced Alginate–Starch Biofilms on Hydrogen Bonds by Raman Spectroscopy

Institut Polytechnique UniLaSalle, Université d’Artois, ULR 7519, 19 Rue Pierre Waguet, BP 30313, 60026 Beauvais, France
*
Author to whom correspondence should be addressed.
Appl. Sci. 2023, 13(15), 8846; https://doi.org/10.3390/app13158846
Submission received: 20 July 2023
/
Revised: 28 July 2023
/
Accepted: 30 July 2023
/
Published: 31 July 2023
(This article belongs to the Special Issue Application of Spectral Techniques in Agricultural Products and Food Analysis)
Abstract
:Among the most studied natural polymers, alginate, a natural polysaccharide extracted from algae is well known due to its applications related to remarkable properties such as biocompatibility, biodegradability and low toxicity. In order to optimize the physicochemical properties of alginate and starch-based biofilms reinforced by glycerol, we propose of different biofilms by Raman spectroscopy according to the mass proportion of alginate in water: 1%, 2%, 3%, 4% and 5%. The first vibrational study of alginate-based biofilms demonstrated a link between the mass proportion of alginate in water with the contribution of hydrogen bonds through vibrational modes at 1570, 1500 and 1414 cm−1 and with the vibrational contributions of gauche and trans conformational C-C stretching at 1098 and 1068 cm−1, respectively. This link seems to persist in the case of biofilms based on alginate reinforced by glycerol with a lower intensity. For the cases of alginate and starch-based biofilms and glycerol-reinforced alginate–starch biofilms, the impact of the mass proportion of alginate in water on the hydrogen bonds is evaluated by determining an area ratio between the mode 1414 cm−1 assigned to the hydrogen bonds and 1340 cm−1 assigned to d(O-H) in plane. The vibrational results show interaction between the proportion of alginate and the hydrogen bonds.
1. Introduction
In 20 years, the planet has produced more plastic than in the previous 50 years. Thus, the use of non-biodegradable polymers in everyday life is one of the sources of environmental problems. To overcome these problems, researchers have sought sustainable alternatives [1,2]. To replace non-renewable petrochemical materials, starch and its modifications are good candidates [3,4]. As renewable source adhesives, chitosan [5,6], cellulose, lignin [7] and alginate [8], polylactic acid (PLA), polyhydroxybutyrate (PHB) and polycaprolactone (PCL) [9] have proved to be very effective.
Since these films are fragile in nature, they are not recommended for large-scale use in packaging manufacturing [10]. To overcome this problem, plasticizers are interpenetrating connections of polymers are developed to modify the interactions and/or the structure of the polymer chain in order to optimize the mechanical and physicochemical properties of biofilms and to have interesting functions for applications in the field of food packaging [11,12]. Sorbitol, glycerol and polyethylene glycol (PEG) are now commonly used to improve the plasticity of biopolymers [6]. Their actions are at the level of the flexibility of biopolymers by decreasing the glass transition temperature (Tg) [13]. Having low molecular weights (between 300 and 600 kDa) and linear or cyclic carbon chains, these plasticizers can intercalate between polymers by reducing the formation of hydrogen bonds between the polymer chains [6]. Regarding the use of films based on biopolymers, Glycerol (GL) is a very good candidate of natural plasticizer which improves their mechanical properties [14].
Starch is a complex sugar with the molecular formula (C6H10O5)n. Being produced by photosynthesis, it comes in the form of grains ranging in size from 1 to 200 μm. Starch grains also have different aspect of shapes like spherical or oval. Starch serves as a carbohydrate reserve in plants like glycogen in animals [15]. This carbohydrate reserve is a mixture of two polysaccharides, amylose and amylopectin. The proportions of these two polysaccharides vary according to the types of starch. In the native form, it comes in the form of grains which consist, on average, of 15 to 30% amylose and 70 to 100% amylopectin [16]. In order to obtain a starch-based food film, it is necessary to transform the native starch into thermoplastic starch. Indeed, in the native state, the melting temperature of starch is higher than its degradation temperature (about 300 °C), due to the presence of numerous intermolecular hydrogen interactions. These properties make native starch very malleable and unsuitable for processing [15,16]. The plasticization of starch consists of incorporating a plasticizer and applying hydro-thermal and/or thermomechanical treatments in order to destructure the crystalline structure of the starch, and thus lower its melting and glass transition temperatures. The added plasticizer will insert itself between the starch chains and break the inter-starch chain hydrogen bonds. This will make it possible to create new hydrogen bonds between the starch and the plasticizer and thus increase the mobility of the chains. The effects of plasticization are reflected during the characterization of the films by a reduction in the breaking stress and an increase in the elongation at break, which is linked to a reduction in the Young’s modulus [15,16].
Alginate is an edible heteropolysaccharide abundantly available in brown algae [17]. The two major molecules that compose it are D-mannuronic acid (M) and L-glucuronic acid (G) [17]. Alginate, and more particularly sodium alginate, have many properties that seem to make them interesting materials for forming films. These algae could improve food safety and extend the shelf life of packaged foods. Indeed, these films are non-toxic, biodegradable, transparent and uniform and have antimicrobial properties. Alginate-based films and coatings also have lower permeability to fats, oils and oxygen. This low permeability may retard lipid oxidation of various vegetables and fruits and may help reduce weight loss and growth in microflora [18,19]. However, alginate films have drawbacks: they constitute weak barriers against moisture because they are hydrophilic films [20]. Thus, to overcome this, various mixtures of biopolymers can be made in order to form more efficient films.
Raman spectroscopy is a non-destructive vibrational spectroscopy technique which gives sensitive information about molecular structure in solid and liquid biopolymers [21,22,23,24,25,26]. The most sensitive Raman active features include the ν(C-H) stretching region (3000–2800 cm−1), the carboxylate stretching vibration in spectral region (1650–1400 cm−1), the δ(CH2) deformation region (1500–1400 cm−1), the O-H deformation in the spectral region (1450–1300 cm−1 and 800–500 cm−1) with the existence of possible hydrogen bonds, the ν(C-C) skeletal modes (1200–1000 cm−1) and ν(C-O) stretching region (1000–500 cm−1). These regions provide insight into intramolecular motion, the relative population of gauche (distorted) and trans conformers as well as the existence of hydrogen bonds.
In this work, the aim is to assess the impact of the mass proportion of alginate in the production of different biofilms: water–alginate, water–alginate–glycerol, water–alginate–starch and water–alginate–starch–glycerol. For these biofilms, we will use five possible percentages of alginate in the mixture: 1%, 2%, 3%, 4% and 5%. The physicochemical characterizations of these biofilms by Raman spectroscopy should reveal markers of differentiation, particularly with regard to the predominance or absence of hydrogen bonds in the biofilm.
2. Materials and Methods
2.1. Mixtures Preparation
Cornstarch (Maizena®, Unilever, France), glycerol (Louis François, France), alginic acid sodium salt from brown algae (Louis François, France).
Formulation of alginate films:
Sodium alginate was dissolved in distilled water while continuously stirred at 60 °C at different concentrations of 1%, 2%, 3%, 4% and 5% (w/v). All the solutions were prepared with and without glycerol. In the case of glycerol-containing mixture, 50% (w/w) of glycerol was added as a plasticizer. Once the solution was homogeneous, 10 mL of each solution was placed in a petri dish and then dehydrated in a preheated oven at 30 °C for 24 h. The dried films were then stored at room temperature for further analysis.
Formulation of starch films:
The film-forming solutions were prepared by dissolving 5% (w/v) of corn starch in distilled water under constant mechanical stirring. The mixture was heated and maintained at 75 °C for 10 min. Two solutions were prepared: one with glycerol and one without glycerol. For the solution containing glycerol, 50% (w/w) of glycerol was added to the mixture as a plasticizer. Then, 10 mL of each solution was transferred to a petri dish and dried at 30 °C for 24 h in an oven. The dried films were stored at room temperature for further analysis.
Preparation of composite films:
Alginate solutions were prepared by dissolving alginate at different concentrations (1%, 2%, 3%, 4% and 5%) in distilled water at 60 °C. Five percent of corn starch was added to the alginate solution. The mixture was heated and stirred constantly at 75 °C for 10 min. Both glycerol-containing and glycerol-free solutions were prepared. In the case of glycerol-containing mixture, 50% (w/w) of glycerol was added. Then, 10 mL of each solution was poured in a petri dish and then dehydrated in an oven at 30 °C for 24 h. The resulting dried films were then stored at room temperature for further analysis. The thickness of obtained films is of the order of 0.1 mm.
2.2. Raman Spectroscopy
Raman spectra of biofilms were obtained using a Raman imaging microscope (DRX2xi, Thermo Scientific Corp, Walsham, MA, USA) equipped with DXR 785 nm laser (Thermo Scientific Corp, Walsham, MA, USA). All spectra were an average of 30 scans with a 2 cm−1 resolution during an acquisition time of 5 s in the range of 3200–50 cm−1. The laser power was maintained at 15 mW. The magnification and NA of optical objective used in the Raman spectroscopy measurements were 50 and 25 μm, respectively. The Raman spectra have undergone special processing, in order to be able to compare the intensity ratios between the samples. Before normalizing the spectra on the peak at 1415 cm−1 for the vibrational study of alginate films relative the proportion of alginate in the water or on the peak at 1085 cm−1 for alginate–glycerol, alginate–starch and alginate–starch–glycerol films, we subtracted the baseline for each spectrum.
2.3. Statistical Analysis
Regarding the determination of the Raman spectra, we have chosen as a research protocol to make 5 different spectra for each sample in order to observe the reproducibility of the results. In Micro Raman, we proceeded to the determination of 5 spectra on 5 different positions of the incident laser for each sample. Whether with Raman spectra, we observed no difference between the spectra for the same sample confirming the reproducibility of our results.
In order to refine our study, we can perform models by Lorentzian functions of Raman spectra to determine the values of the wavenumbers as well as the areas of the associated peaks. The values in frequencies of the modes are obtained by the modelizations carried out by the software ORIGIN 5.0 professional. The modeling method is proposed by Bresson et al. [27]. We use as peak function the following Lorentz function:
where xc represents the value of the fit mode wavenumber, A the area of the peak and w the width at mid-height. We take an iteration number equal to 100. The error was estimated to be ±0.5 cm−1.
3. Results and Discussion
3.1. Alginate Films
Raman spectra at room temperature for the five alginate films relative the proportion by mass of alginate in the water from 1% to 5% are represented in Figure 1 in the spectral range 1700–700 cm−1. In this spectral region, we observe numerous vibrational modes corresponding to the carboxylate stretching, the O-H deformation with the existence of possible hydrogen bonds, the ν(C-C) skeletal and ν(C-O) stretching modes [24,25,28]. We report in Table 1 the values of the wavenumbers by pointing or by fitting for each vibrational mode. The frequency values indexed by * are fitted values (Curve fitting was performed as per Bresson et al. [29]).
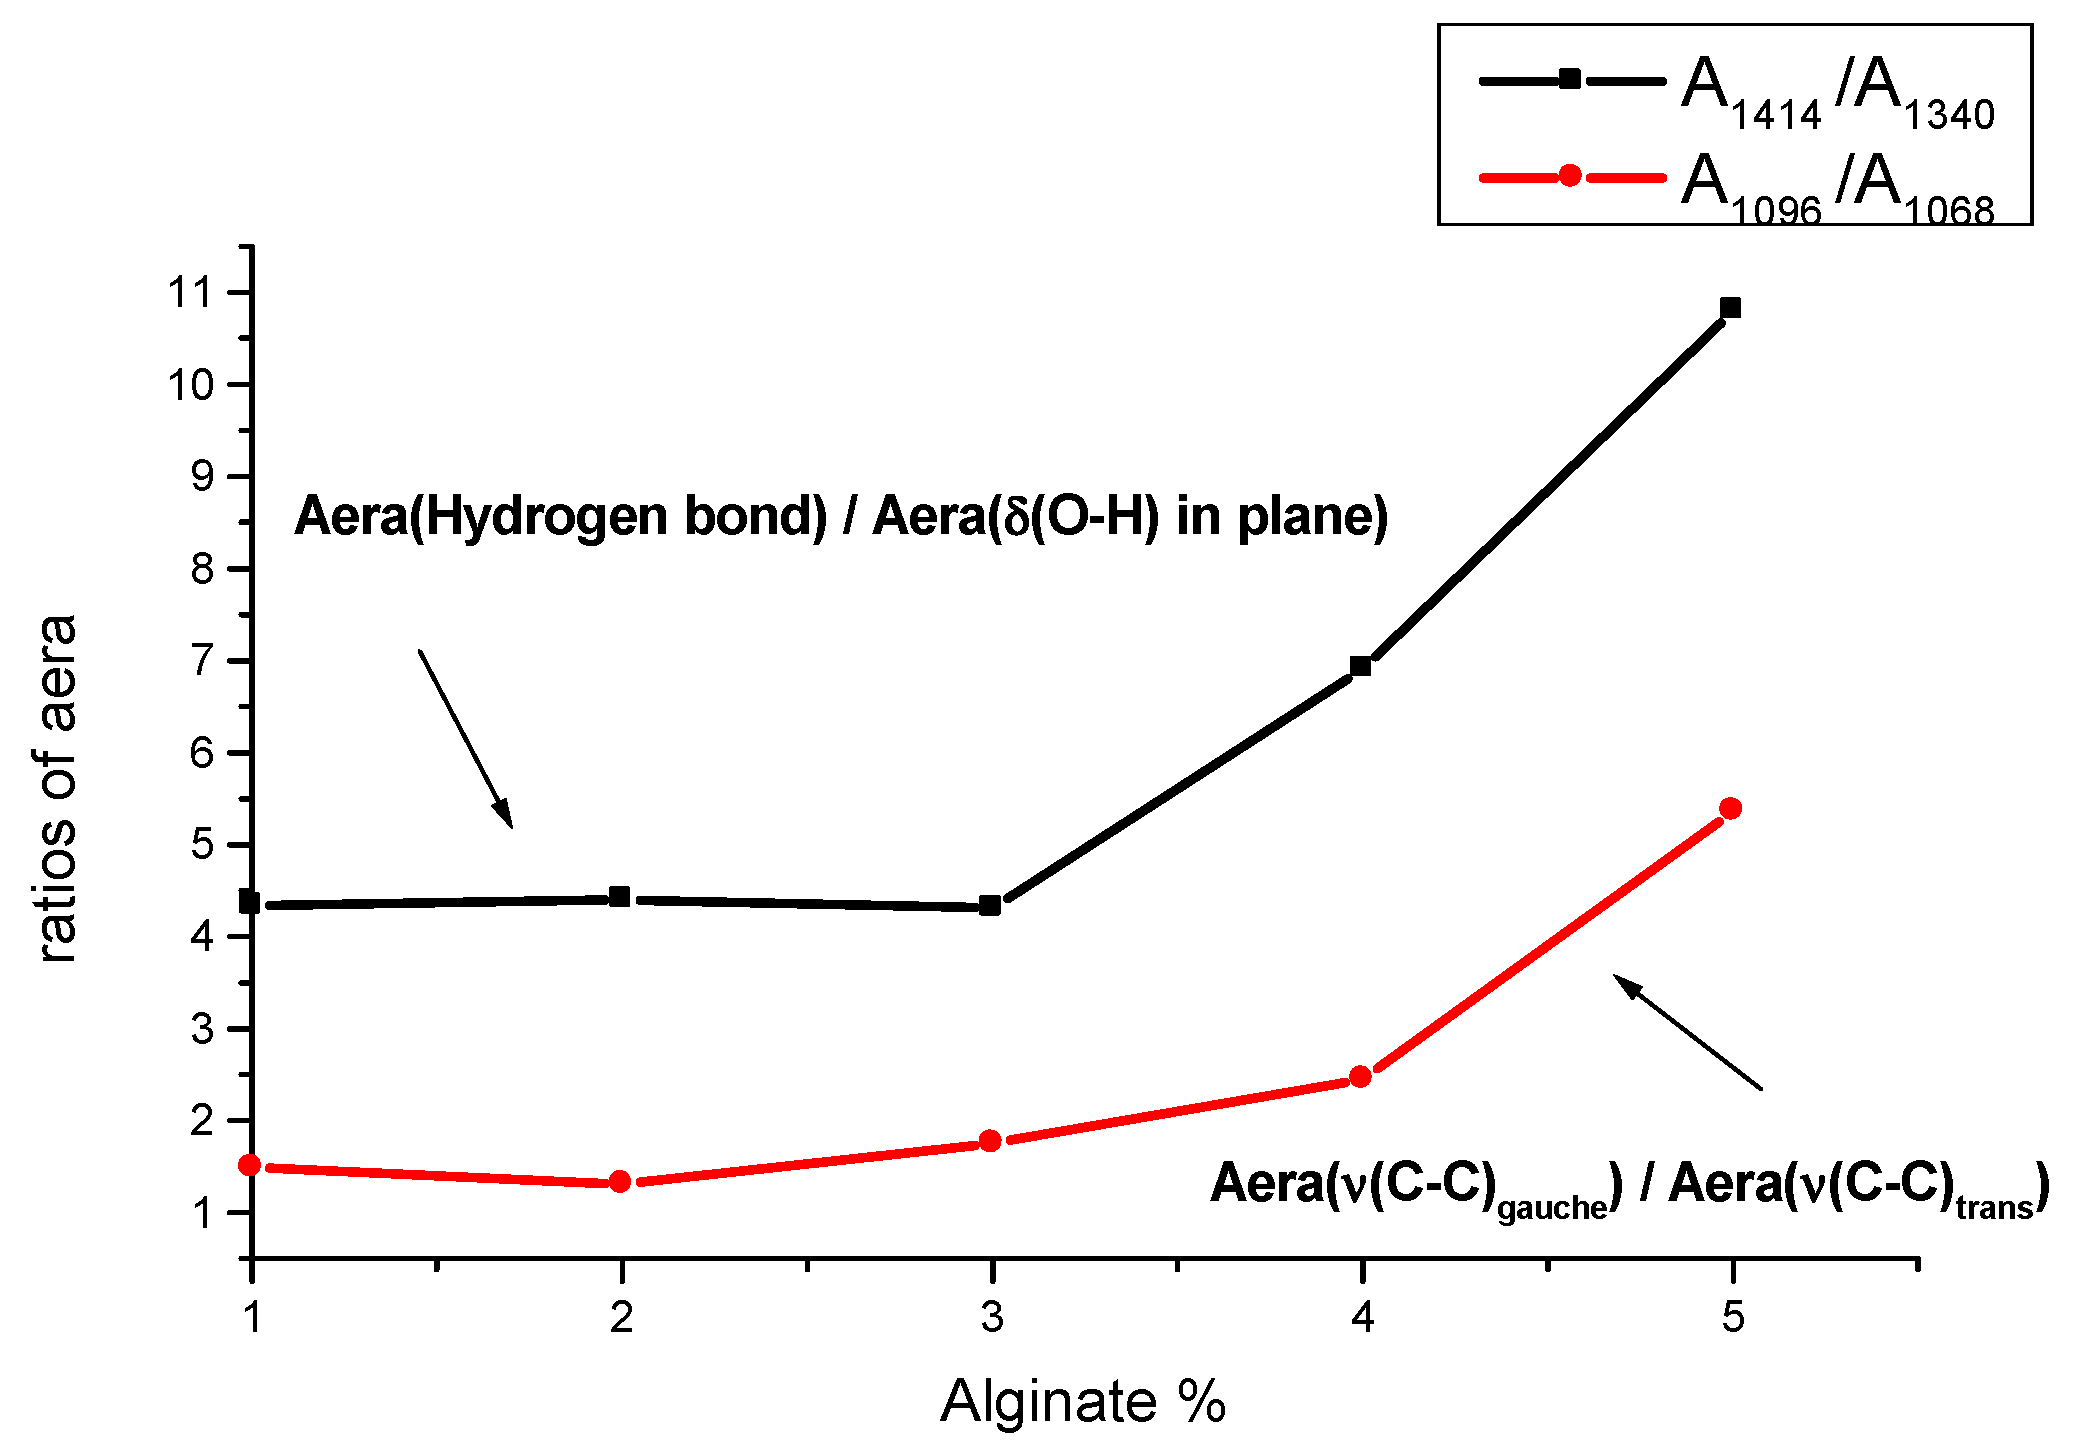
From Figure 1 and Table 1, it appears that in the spectral range 1650–1500 cm−1, the proportion of alginate in the water is a marker of differentiation: for 5% alginate, we observe three peaks (1630, 1570 and 1500 cm−1), whereas for the others samples we observe only one at 1612 cm−1. The modes at 1570 and 1500 cm−1 should be assigned for a hydrogen bond [28]. We note that the last peak at 1612 cm−1 assigned to asymmetric COO− stretching vibration shifts to 1630 cm−1 for alginate 5% films. The shift of this band to 1630 cm−1 can be attributed to hydrogen bond [22]. It seems that the hydrogen bonds are more important for the 5% alginate films which is consistent with an increase in the mass proportion of alginate in the water. To assess the impact of the mass proportion of alginate on the existence of hydrogen bonding, we studied the area ratio between the mode 1414 cm−1 assigned to the hydrogen bonds and 1340 cm−1 assigned to δ(O-H) in plane. The areas of these vibrational modes are obtained from an adjustment by Lorentzian functions with Origin 5.0 software in the spectral range 1450–1300 cm−1. In Figure 2, we present the evolution of the ratio according to the mass proportion of alginate in the water.
From Figure 2, it appears that remains more or less equal to 4 up to 3% of alginate in the water before it suddenly increases to 4% and 5% to reach a value close to 11. Thus, it would seem that the vibrational contribution of hydrogen bonds has been multiplied by almost 3 between 1% and 5% alginate films. This development should be compared with the appearance of additional peaks in the spectral region 1650–1500 cm−1 for 5% alginate films.
The region of Raman spectrum for alginate films covering the C-C stretching range revealed a large band centered at 1098 cm−1 characteristic of conformational disordered C-C stretching with gauche defects with a peak at 1068 cm−1 representing trans conformational C-C stretching. In liquid phase, all C-C stretching are in trans conformational. With the liquid–solid transition, the characteristic bands associated with the trans and gauche C-C stretching appeared. Thus, gauche/trans area ratio () provided a measure of alginate intermolecular mobility [31]. In Figure 2, we present the evolution of this ratio according to the mass proportion of alginate in the water. From this figure, we can note that remains more or less equal to 1.5 up to 3% of alginate in the water before a gradual increase to 4% and 5% to reach a value close to 5.4. Thus, it would seem that the stiffness of the biofilms increases with the mass proportion of alginate.
3.2. Alginate-Glycerol Films
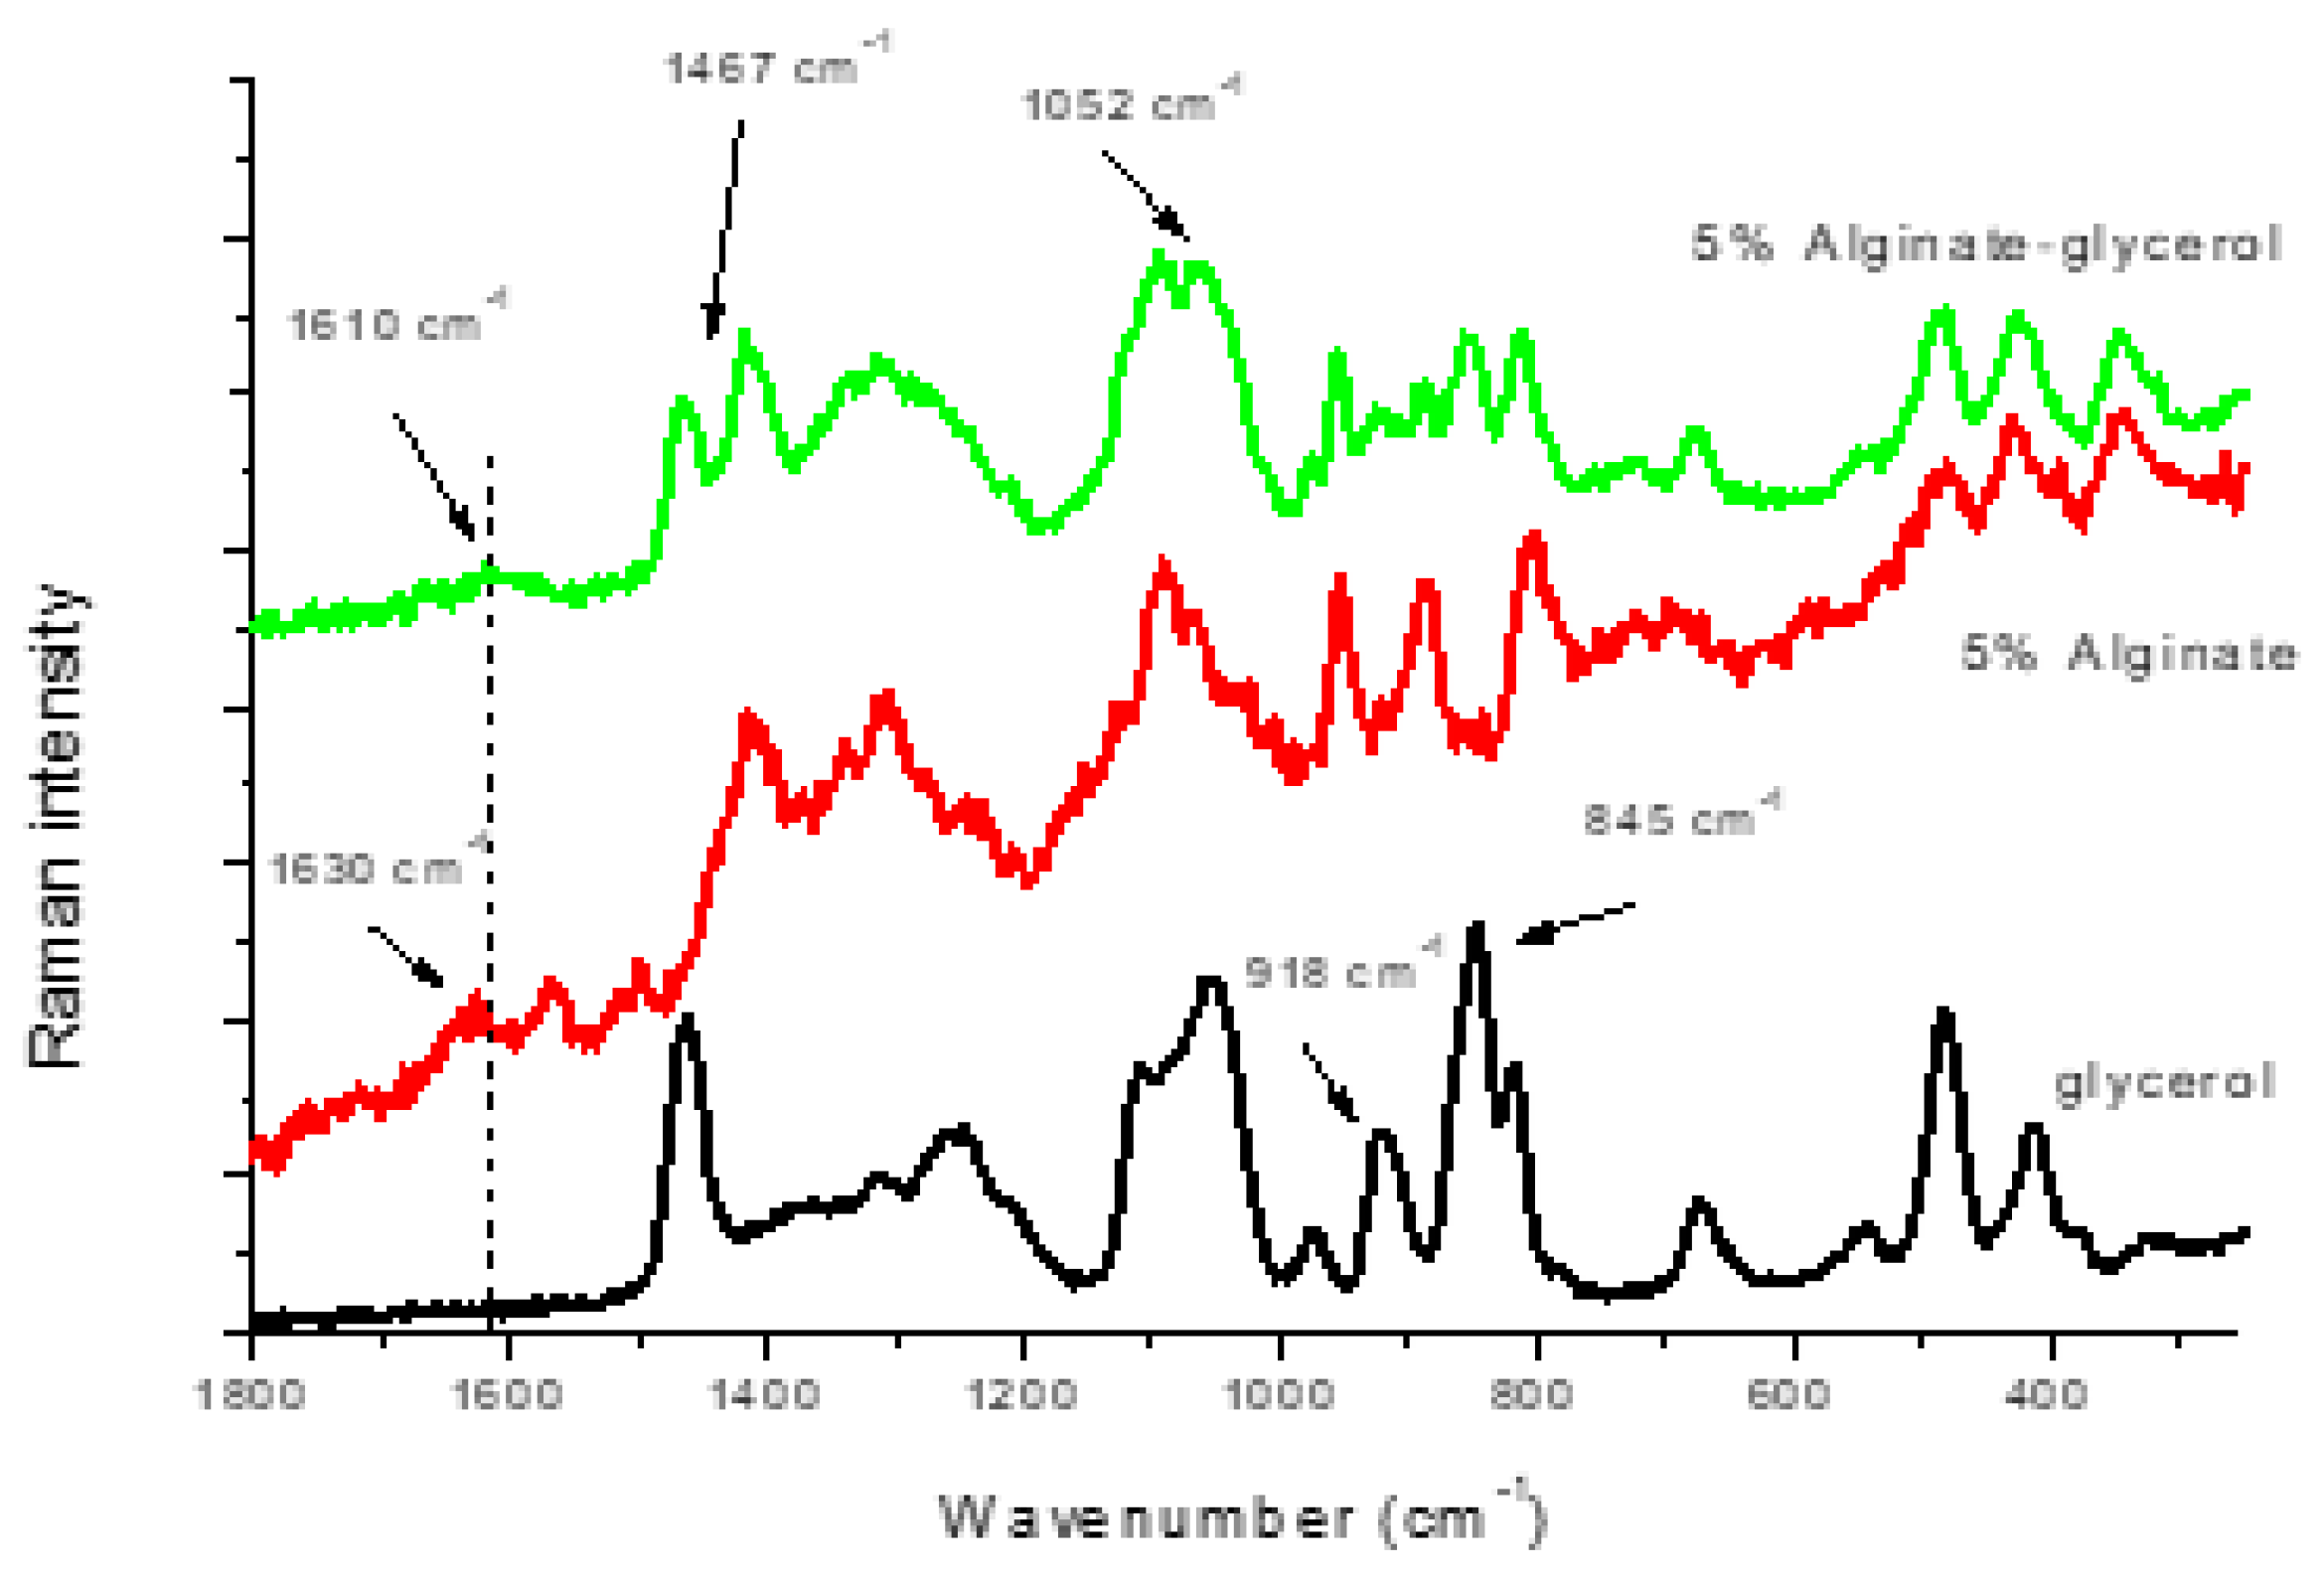
In Figure 3, we present Raman spectra at room temperature for the 5% alginate films, glycerol and 5% alginate–glycerol films in the spectral range 1700–700 cm−1. We report in Table 2 the values of each of the observed or adjusted peaks. Subtraction spectra are helpful to determine the contributions of each of the elements in the 5% alginate and glycerol mixture. The difference spectrum between 5% alginate–glycerol films and glycerol is shown in Figure 4 (spectral data from the sample scans were baseline-corrected and normalized against band at 1085 cm−1 using Origin 5.0). From Figure 3 and Figure 4, we can observe that the Raman spectrum of 5% alginate–glycerol films seems to be superposition of the Raman spectra of two elements taken separately. In Figure 4, the subtraction Raman spectrum highlights the vibrational modes exclusively linked to glycerol (peaks at 1463 and 845 cm−1 assigned to CH2 bending deformation and CH2-OH twisting mode, respectively) and to 5% alginate (peaks at 1414 and 956 cm−1 assigned to hydrogen bond and C-O-C stretching mode, respectively.
The study of the two area ratios and defined above seems relevant to describe these phenomena. In Figure 5, we present the evolution of these ratios according to the mass proportion of alginate in the water. From this figure, it is noted that between alginate and alginate–glycerol films the area ratio seems to have the same evolution according to mass proportion of alginate in the water but with lower values: a reduction with a factor of four for the small percentages (1%, 2% and 3%), then by a factor neighbor of two for 4% and 5%. These results are consistent with what we expected: a decrease in the vibrational contribution of hydrogen bonds. For area ratio , we remark that the ratio of alginate–glycerol films is very slightly lower for the 1%, 2% and 3% mass proportion of alginate in the water compared to alginate films. It is only for a rate above 3% that a significant drop is observed: for 5% alginate this area ratio goes from about 5.0 to 2.5, i.e., a division by 2. If the vibrational contribution of the gauche C-C stretching mode is divided by 2, it means that the intermolecular mobility within the alginate–glycerol–water mixture is multiplied by 2. However, it is the role of glycerol to increase this intermolecular mobility.
3.3. Alginate–Starch Films
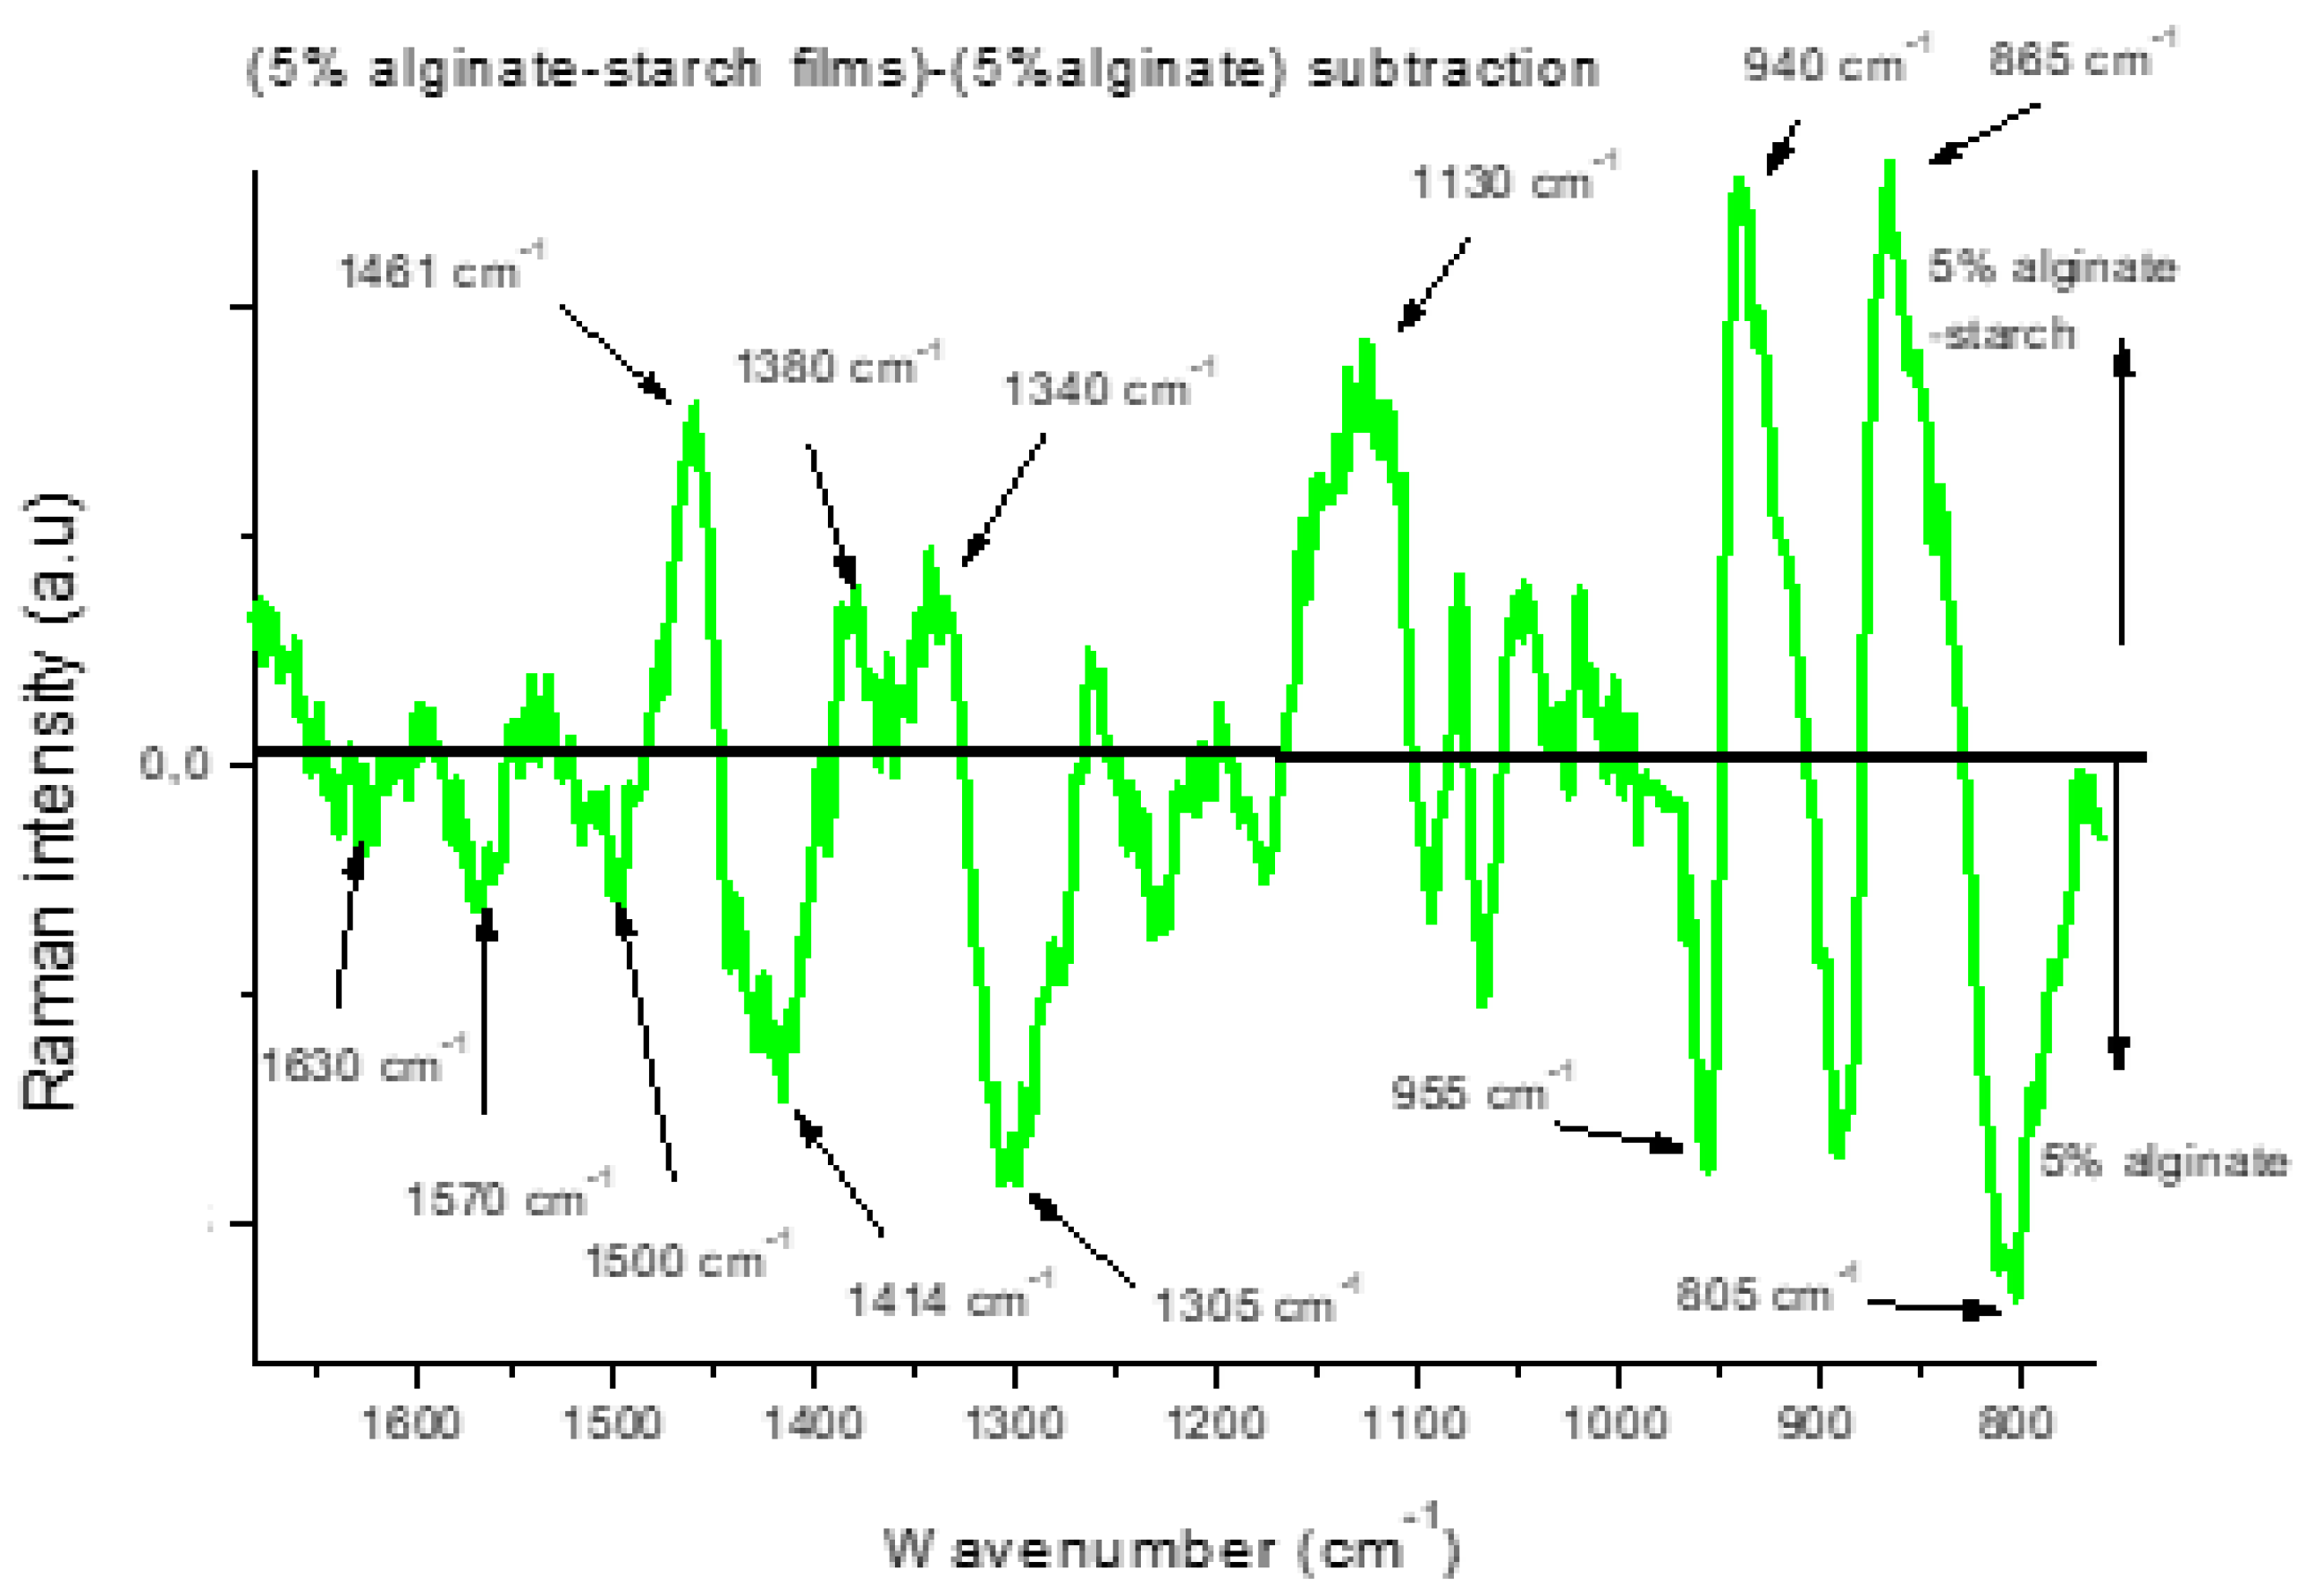
In Figure 6, we present Raman spectra at room temperature for the 5% alginate films, starch and 5% alginate–starch films in the spectral range 1700–700 cm−1. We report in Table 2 the values of each of the observed or adjusted peaks. The difference spectrum between 5% alginate–starch and 5% alginate films is shown in Figure 7.
In Figure 6, it is observed that the vibrational modes of starch seem to dominate the Raman spectra of 5% alginate–starch films. We find the specific modes of starch linked to CH2 vibrations: 1463 and 865 cm−1 assigned, respectively, by δ(CH2) and τ(CH2-OH) deformations. However, the Raman subtraction spectrum in Figure 7 better reveals the particularities of the two elements making up 5% alginate–starch showing that the Raman spectrum of the 5% alginate–starch films is indeed the superposition of those of 5% alginate and starch films taken separately. Thus, we observe in the Raman spectrum of 5% alginate–starch–water mixture the predominance of the vibrational modes linked to 5% alginate: 1630, 1570, 1500, 1414, 1305, 955 and 805 cm−1 assigned to νas(COO−), hydrogen bonds, d(O-H) in plane, ν(C-O-C) vibrations, respectively.
Among these seven vibrational modes only the modes at 1414 and 1305 cm−1 are common to 5% alginate and starch. If we observe in Figure 7 that the mode at 1414 cm−1 is more dominant on the 5% alginate side, it means that the vibrational contribution of hydrogen bonds is more important from 5% alginate compared to starch in the 5% alginate–starch films. A comparison of the value of the area ratio between 5% alginate and starch films prepared in water could confirm this phenomenon. From the Raman spectra of 5% alginate and starch films, we obtain for the following values: 10.8 for 5% alginate films against 0.6 for starch films. So, it seems clear that the hydrogen bonds with water are made primarily with alginate. But hydrogen bonds between 5% alginate and starch can be existed. A study of the area ratio for 5% alginate–starch films could give an indication on this point.
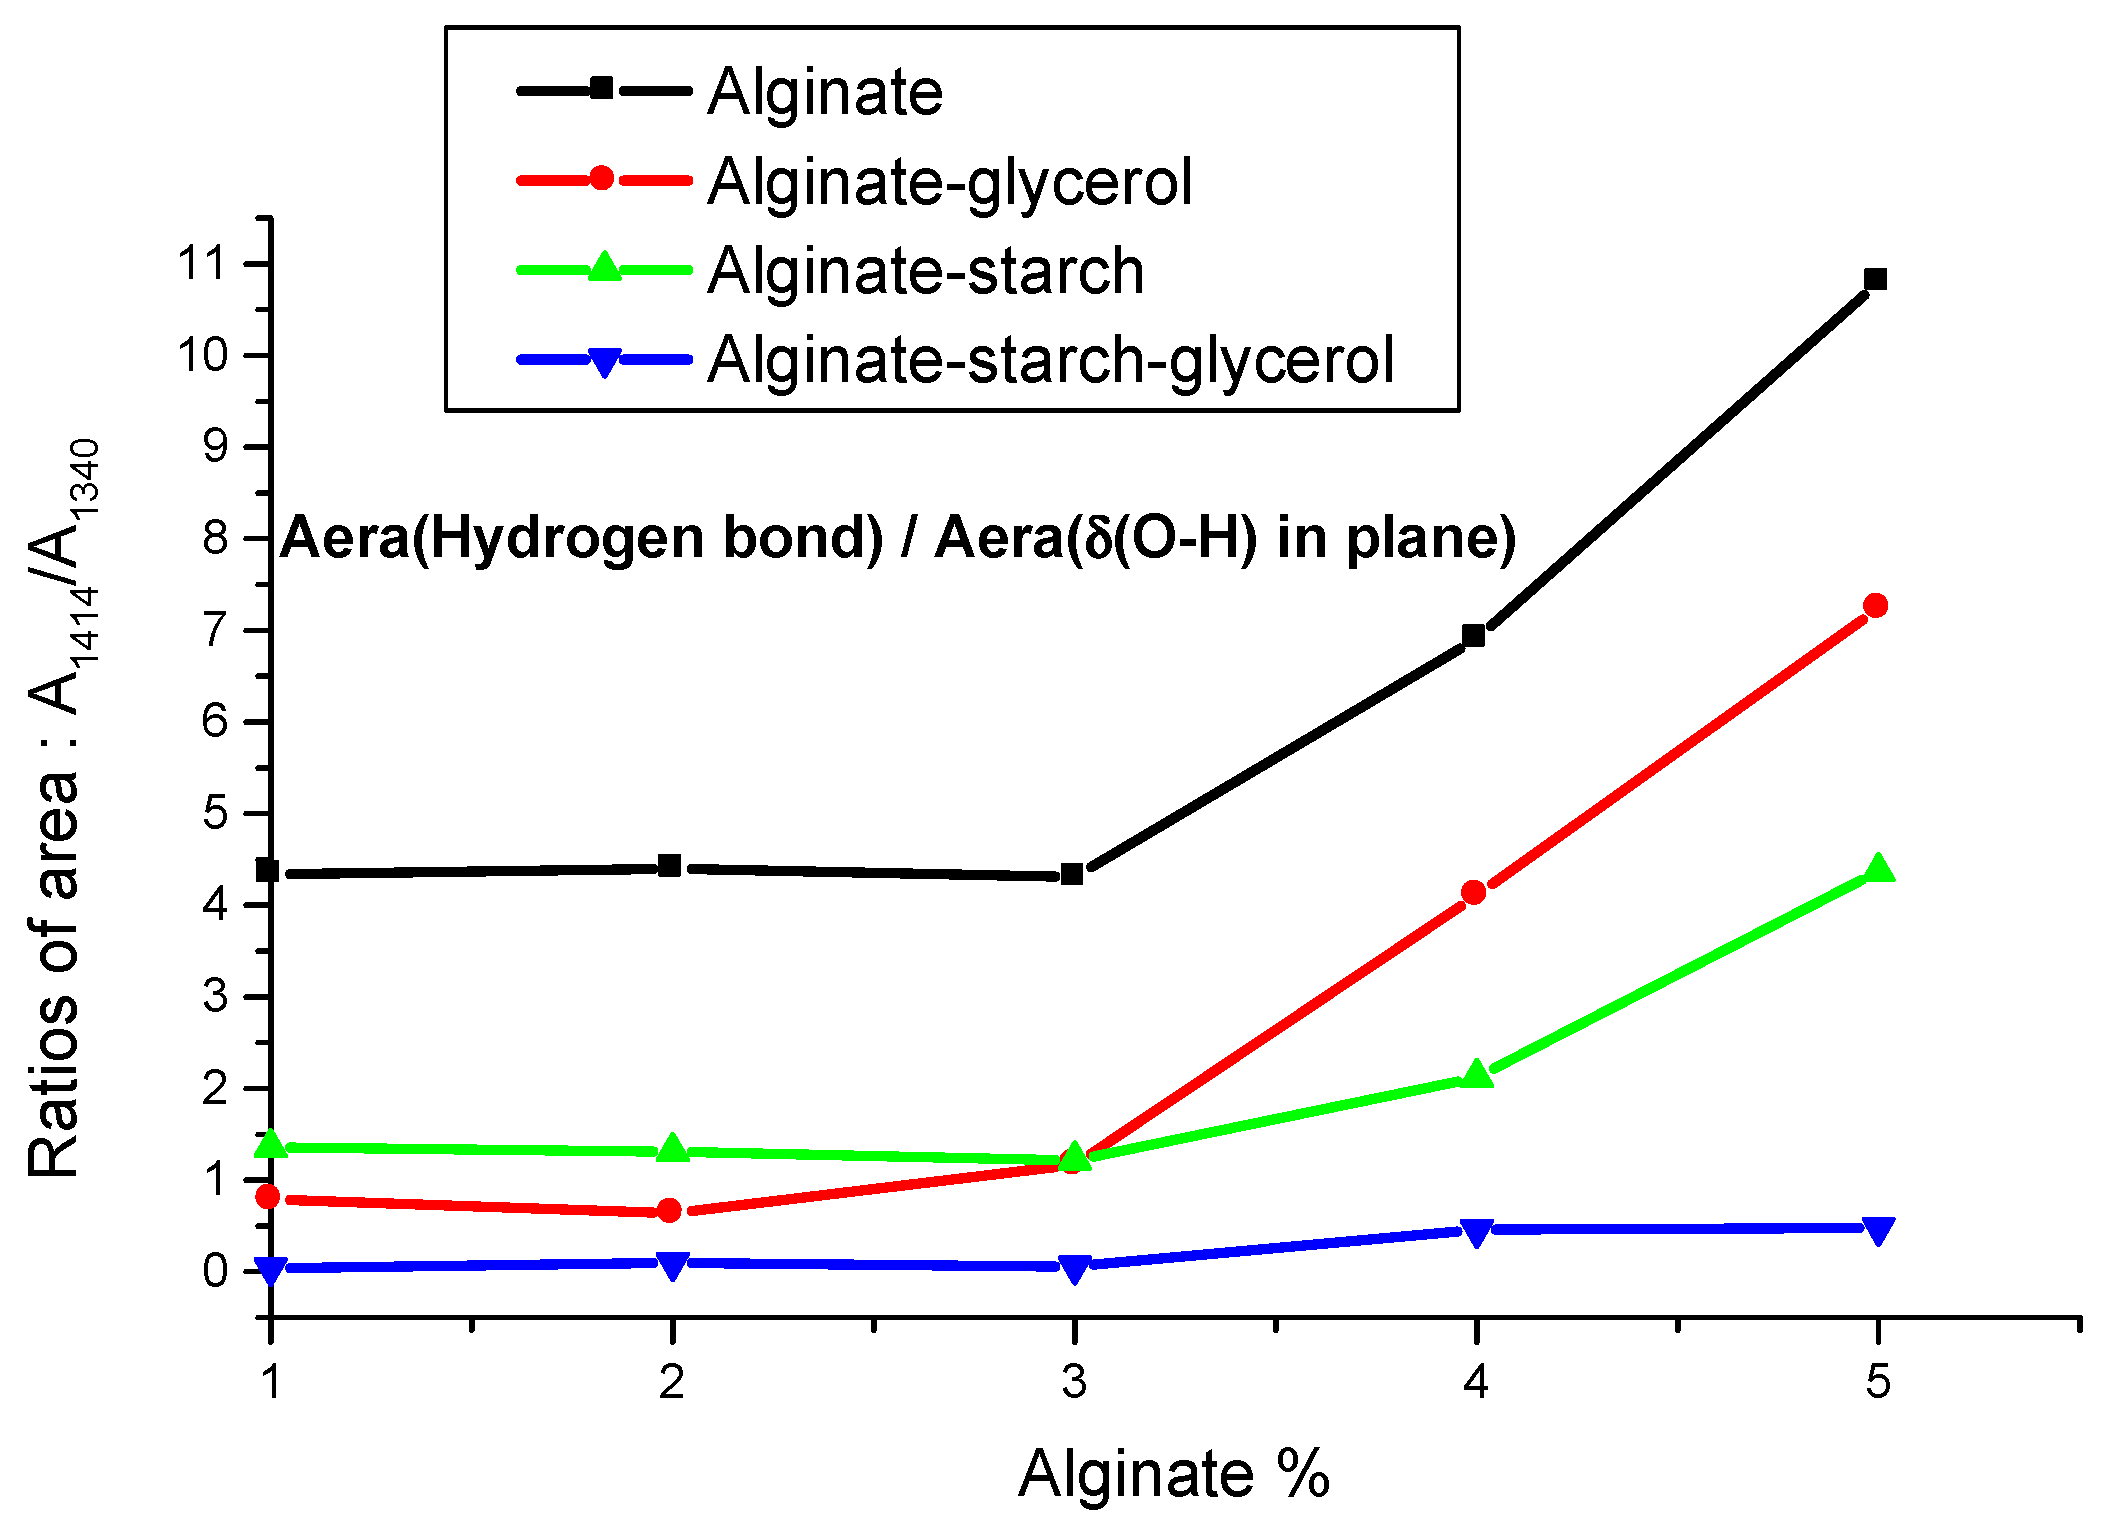
In Figure 8, we present the evolution of the area ratio according to the mass proportion of alginate in the water. From this figure, it is noted that between alginate and alginate–starch films the area ratio seems to have the same evolution according to the mass proportion of alginate in the water but with lower values: a reduction with a factor of 4 for the small percentages (1%, 2% and 3%), then by a factor between 2 and 3 for 4% and 5%. These results are consistent with what we expected: a decrease in the vibrational contribution of hydrogen bonds. Compared to 5% alginate–glycerol films, this ratio is even lower: we go from 7.0 to 4.4. The starch molecule being larger than that of glycerol, the intercalation of starch within the alginate matrix has the consequence of further reducing the number of hydrogen bonds of the alginate with water. Nevertheless, there may exist in this biopolymer structure different types of hydrogen bonds: between alginate with water, starch with water and starch with alginate. From our Raman study, it seems difficult to distinguish these different types of hydrogen bonds.
3.4. Alginate–Starch–Glycerol Films
In Figure 9, we present Raman spectra at room temperature for the 5% alginate films, starch, glycerol and 5% alginate–starch–glycerol films in the spectral range 1700–700 cm−1. We report in Table 2 the values of each of the observed or adjusted peaks. Once again, the Raman spectrum of the starch seems to dominate the spectrum of 5% alginate–starch–glycerol films. In Figure 8, we present the evolution of the area ratio for 5% alginate–starch–glycerol films according to the mass proportion of alginate in water. We remark that whatever the percentage this area ratio is very low of the order of 0.3. There seems to remain in this alginate–water–glycerol–starch mixture very few hydrogen bonds; the double intercalation of glycerol and starch in the alginate matrix considerably reduced the secondary forces in the mixture.
4. Conclusions
The purpose of this work was to try to understand the physicochemical properties of different biofilms based on two polymers: alginate and starch reinforced by glycerol according to the mass proportion of alginate in water. The vibrational study of alginate biofilms showed by the study of a hydrogen bonds area ratio and a gauche/trans area ratio that the impact of the mass proportion of alginate was significant from 3% with a very significant increase at 5%. In the case of glycerol-reinforced alginate biofilms, the area ratio decreases in a homogeneous way between the 5 percentages of mass proportion, whereas for the area ratio the fall in the rate is especially significant from 3%. The first result shows a significant decrease in the vibrational contribution of hydrogen bonds linked to the presence in the mixture of glycerol and the second result highlights the role of glycerol to increase this intermolecular mobility.
For the cases of alginate and starch-based biofilms and glycerol-reinforced alginate–starch biofilms, only the measurement of the hydrogen bonds area ratio could be exploited. For alginate and starch-based films, we observe an impact of the mass proportion of alginate on the vibrational contribution of hydrogen bonds always decreasing from 3%. For glycerol-reinforced alginate–starch biofilms, the impact is almost non-existent.
For all samples, the Raman spectroscopy studies show a superposition of the individual spectra of the constituents of the mixture without there being any transformation of the constituent elements: we observe intercalations.
Author Contributions
R.K.: conceptualization, investigation and writing; S.B.: methodology, conceptualization, T.A.: methodology. All authors have read and agreed to the published version of the manuscript.
Funding
This research received no external funding.
Data Availability Statement
Data are contained within the article.
Acknowledgments
We would like to thank Benoit LERZY and Annaelle BUCHOU, technicians of Transformations and Agroresources Lab., who participated to Raman measurements.
Conflicts of Interest
The authors declare no conflict of interest.
References
- Zhu, Y.; Romain, C.; Williams, C.K. Sustainable polymers from renewable resources. Nature 2016, 540, 354–362. [Google Scholar] [CrossRef] [PubMed]
- Agarwal, S. Biodegradable Polymers: Present Opportunities and Challenges in Providing a Microplastic-Free Environment. Macromol. Chem. Phys. 2020, 221, 2000017. [Google Scholar] [CrossRef] [Green Version]
- Gadhave, R.V.; Mahanwar, P.A.; Gadekar, P.T. Starch-Based Adhesives for Wood/Wood Composite Bonding: Review. Open J. Polym. Chem. 2017, 7, 19–32. [Google Scholar] [CrossRef] [Green Version]
- Wang, H.; Liang, J.; Zhang, J.; Zhou, X.; Du, G. Performance of urea-formaldehyde adhesive with oxidized cassava starch. BioResources 2017, 12, 7590–7600. [Google Scholar] [CrossRef]
- Patel, A.K.; Michaud, P.; Petit, E.; De Baynast, H.; Grédiac, M.; Mathias, J.D. Developpment of a chitosan-based adhesive. Application to wood binding. J. Appl. Polym. Sci. 2013, 127, 5014–5021. [Google Scholar] [CrossRef]
- Al-Marsy, W.A.; Haider, S.; Mahmood, A.; Khan, M.; Adil, S.F.; Siddiqui, M.R.H. Evaluation of the Thermal and Morphological Properties of ϒ-Irradiated Chitosan-Glycerol-Based Polymeric Films. Processes 2021, 9, 1783–1796. [Google Scholar]
- Gumoska, A.; Robles, E.; Kowaluk, G. Evaluation of functional Features of Lignocellulosic Particle Composites Containing Biopolymer Binders. Materials 2021, 14, 7718. [Google Scholar] [CrossRef]
- Kadri, R.; Elkhoury, K.; Ben Messaoud, G.; Kahn, C.; Tamayol, A.; Mano, J.F.; Arab-Tehrany, E.; Sanchez-Gonzalez, L. Physicochemical Interactions in Nanofunctionalized Alginate/GeIMA IPN Hydrogels. Nanomaterials 2021, 11, 2256. [Google Scholar] [CrossRef]
- Nagarajan, V.; Mohanty, A.K.; Mistra, M. Perspectives on Polylactic Acid (PLA) based Sustainable Materials for Durable Applications: Focus on Toughness and heat Resistance. ACS Sustain. Chem. Eng. 2016, 4, 2899–2916. [Google Scholar] [CrossRef]
- Chen, M.; Runge, T.; Wang, L.; Li, R.; Feng, J.; Shu, X.L.; Shi, Q.S. Hydrogen bonding impact on chitosan plasticization. Carbohydr. Polym. 2018, 200, 115–121. [Google Scholar] [CrossRef]
- Toxqui-Teran, A.; Leyva-Porras, C.; Ruiz-Cabrera, M.A.; Cruz-Alcantar, P.; Saavedra-Leos, M.Z. Thermal study of polyols for the technological application as plasticizers in food industry. Polymers 2018, 10, 467. [Google Scholar] [CrossRef] [PubMed] [Green Version]
- Li, S.; Shao, C.; Miao, Z.; Lu, P. Development of leftover rice/gelatin interpenetrating polymer network films for food packaging. Green Process. Synth. 2021, 10, 37–48. [Google Scholar] [CrossRef]
- El Miri, N.; Aziz, F.; Aboulkas, A.; El Bouchti, M.; Ben Youcef, H.; El Achady, M. Effect of plasticizers on physiochemical properties of cellulose nanocrystals filled alginate bionanocomposite films. Adv. Polym. Technol. 2018, 37, 3171–3185. [Google Scholar] [CrossRef]
- Lavorgna, M.; Piscitelli, F.; Mangiacapra, P.; Buonocore, G.G. Study of the combined effect of both clay and glycerol plasticizer on the properties of chitosan films. Carbohydr. Polym. 2010, 82, 291–298. [Google Scholar] [CrossRef]
- Pérez, S.; Baldwin, P.M.; Gallant, D.J. Structural Features of Starch Granules I. In Starch: Chemistry and Technology, 3rd ed.; BeMiller, J., Whistler, R., Eds.; Academic Press: Cambridge, MA, USA, 2009; pp. 149–192. [Google Scholar] [CrossRef]
- Carvaloh, A.J.F. Starch: Major sources, properties and applications as thermoplastic materials. In Monomers, Polymers and Composites from Renewable Resources, 3rd ed.; Belgacem, M.N., Gandini, A., Eds.; Elsevier Ltd.: Amsterdam, The Netherlands, 2008; pp. 321–342. [Google Scholar]
- Raus, R.A.; Wan Nawawi, W.M.F.; Nasaruddin, R.R. Alginate and alginate composites for biomedical applications. Asian J. Pharm. Sci. 2021, 16, 280–306. [Google Scholar] [CrossRef]
- Nair, M.S.; Tomar, M.; Punia, S.; Kukula-Koch, W.; Kumar, M. Enhancing the functionality of chitosan- and alginate-based active edible coatings/films for the preservation of fruits and vegetables: A review. Int. J. Biol. Macromol. 2020, 164, 304–320. [Google Scholar] [CrossRef]
- Senturk Parreidt, T.; Muller, K.; Sckmid, M. Alginate-Based Edible Films and Coatings for Food Packaging Applications. Foods 2018, 7, 170. [Google Scholar] [CrossRef] [Green Version]
- Olivas, G.I.; Barbosa-Canovas, G.V. Alginate–calcium films: Water vapor permeability and mechanical properties as affected by plasticizer and relative humidity. LWT—Food Sci. Technol. 2008, 41, 359–366. [Google Scholar] [CrossRef]
- Kelis Cardoso, V.G.; Poppi, R.J. Cleaner and Faster method to detect adulteration in cassava starch using Raman spectroscopy and one-class support vector machine. Food Control 2021, 125, 107917. [Google Scholar] [CrossRef]
- Li, Y.H.; Wang, Y.S.; Zhao, J.S.; Li, Z.Y.; Chen, H.H. A pH-sensitive curcumin loaded microemulsion-filled alginate and porous starch composite gels: Characterization, in vitro release kinetics and biological activity. Int. J. Biol. Macromol. 2021, 182, 1863–1873. [Google Scholar] [CrossRef]
- Vidal Urquiza, T.K.; Perales Pérez, O.; Galvez Saldana, M. Effect of the cross-linking with calcium ions on the structural and Thermo-mechanical properties of alginate films. Mater. Res. Soc. Symp. Proc. 2011, 1355, 1136. [Google Scholar] [CrossRef]
- Lopez-Cordoba, A.; Deladino, L.; Martino, M. Corn starch-calcium alginate matrices for simultaneous carrying of zinc and yerba mate antioxidants. LWT—Food Sci. Technol. 2014, 59, 641–648. [Google Scholar] [CrossRef]
- Parad, N.D.T.; Tomar, V. Raman spectroscopy of algae: A review. J. Nanomed. Nanotechnol. 2012, 3, 131. [Google Scholar] [CrossRef]
- Kaczmarska, K.; Grabowska, B.; Spychaj, T.; Zdanowicz, M.; Sitarz, M.; Bobrowski, A.; Cukrowicz, S. Effect of microwave treatment on structure of binders based on sodium carboxymethyl starch: FT-IR, FT-Raman and XRD investigations. Spectrochim. Acta Part A Mol. Biomol. Spectrosc. 2018, 199, 387–393. [Google Scholar] [CrossRef] [PubMed]
- Bresson, S.; El Marssi, M.; Khelifa, B. Raman spectroscopy investigation of various saturated monoacid triglycerides. Chem. Phys. Lipids 2005, 134, 119–129. [Google Scholar] [CrossRef] [PubMed]
- Socrates, G. Infrared and Raman Characteristic Group Frequencies Tables and Charts; John Wiley & Sons: Hoboken, NJ, USA, 2004. [Google Scholar]
- Bresson, S.; El Marssi, M.; Khelifa, B. Conformational influences of the polymorphic forms on the C=O and C-H stretching modes of five saturated monoacid triglycerides studied by Raman spectroscopy at various temperatures. Vib. Spectrosc. 2006, 40, 263–269. [Google Scholar] [CrossRef]
- El Hadri, M.; Achahbar, A.; El Khamkhami, J.; Khelifa, B.; Faivre, V.; Abbas, O.; Bresson, S. Lyotropic behavior of Gelucire 50/13 by XRD, Raman and IR spectroscopies according to hydration. Chem. Phys. Lipids 2016, 200, 11–23. [Google Scholar] [CrossRef]
- Bresson, S.; Rousseau, D.; Ghosh, S.; El Marssi, M.; Faivre, V. Raman spectroscopy of the polymorphic forms and liquid state of cocoa butter. Eur. J. Lipid Sci. Technol. 2011, 113, 992–1004. [Google Scholar] [CrossRef]
Figure 1.
The 1700–700 cm−1 Raman spectral range of the five alginate films: 1%, 2%, 3%, 4% and 5% alginate in proportion by mass in water.
Figure 1.
The 1700–700 cm−1 Raman spectral range of the five alginate films: 1%, 2%, 3%, 4% and 5% alginate in proportion by mass in water.

Figure 2.
Area ratios of four vibrational modes: and .

Figure 3.
The 1700–700 cm−1 Raman spectral range of the 5% alginate, glycerol and 5% alginate–glycerol films.
Figure 3.
The 1700–700 cm−1 Raman spectral range of the 5% alginate, glycerol and 5% alginate–glycerol films.

Figure 4.
Raman subtraction spectrum between 5% alginate–glycerol and glycerol films.

Figure 5.
Area ratios of four vibrational modes:. and for the alginate and alginate–glycerol films.

Figure 6.
The 1700–700 cm−1 Raman spectral range of the 5% alginate, starch and 5% alginate–starch films.
Figure 6.
The 1700–700 cm−1 Raman spectral range of the 5% alginate, starch and 5% alginate–starch films.

Figure 7.
Raman subtraction spectrum between 5% alginate–starch and 5% alginate films.

Figure 8.
Area ratio for % alginate, % alginate–glycerol, % alginate–starch and % alginate–starch–glycerol films according to the mass proportion of alginate in the mixture.
Figure 8.
Area ratio for % alginate, % alginate–glycerol, % alginate–starch and % alginate–starch–glycerol films according to the mass proportion of alginate in the mixture.

Figure 9.
The 1700–700 cm−1 Raman spectral range of the 5% alginate, starch, glycerol and 5% alginate–starch films.
Figure 9.
The 1700–700 cm−1 Raman spectral range of the 5% alginate, starch, glycerol and 5% alginate–starch films.


Table 1.
Assignments of Raman modes of alginate films at room temperature; δ = bending, ν = stretching; s = symmetric; as = asymmetric; T = trans; G = gauche; * = fitted value [22,25,28,30].
| Alginate 1% | Alginate 2% | Alginate 3% | Alginate 4% | Alginate 5% | Assignments |
|---|---|---|---|---|---|
| 345 | 345 | 345 | 345 | 343 | δ(C-O) out of plane |
| 430 | 431 | 431 | 430 | 428 | δ(C-O) in plane |
| 497 | 496 | 496 | 498 | 491 | δ(C-O) in plane |
| 733 | 730 | 730 | 731 | 710 | δ(O-H) out of plane |
| 806 | 806 | 806 | 806 | 805 | ν(C-O-C) |
| 889 | 889 | 889 | 889 | 885 | ν(C-O-C) |
| 920 * | 920 * | 921 * | 920 * | 922 | ν(C-O-C) |
| 955 | 954 | 954 | 953 | 954 | ν(C-O-C) |
| 982 | 983 | 983 | 982 | 980 | ν(C-O-C) |
| 1034 | 1034 | 1035 | 1034 | 1032 | ν(C-O-C)) |
| 1067 | 1068 | 1068 | 1069 | 1067 | νas(C-C)T |
| 1096 | 1097 | 1096 | 1096 | 1094 | ν(C-C)G |
| 1130 | 1129 | 1130 | 1128 | 1127 | νs(C-C)T, ν(C-O)T |
| 1162 * | 1165 * | 1164 * | 1162 * | 1160 * | νs(C-C)T, ν(C-O)G |
| 1270 * | 1291 * | 1271 * | 1291 * | 1275 * | νs(C-C)G |
| 1307 | 1317 | 1307 | 1315 | 1310 | δ(O-H) in plane |
| 1344 | 1341 | 1344 | 1340 | 1340 | δ(O-H) in plane |
| 1361 * | 1361 * | 1364 * | 1360 * | 1360 * | δ(O-H) in plane |
| 1414 | 1414 | 1413 | 1414 | 1412 | νs(COO−), H- bond |
| 1500 | hydrogen bond | ||||
| 1570 | hydrogen bond | ||||
| 1611 | 1612 | 1613 | 1612 | νas(COO−) | |
| 1630 | νas(COO−) | ||||
| 2935 | 2935 | 2935 | 2935 | 2934 | ν(CH-OH) |
Table 2.
Assignments of Raman modes of 5% alginate, glycerol, starch, 5% alginate–glycerol, 5% alginate–starch and 5% alginate–starch–glycerol films at room temperature; δ = bending, ν = stretching; τ = twisting, s = symmetric; as = asymmetric; T = trans; G = gauche; * = fitted value [].
Table 2.
Assignments of Raman modes of 5% alginate, glycerol, starch, 5% alginate–glycerol, 5% alginate–starch and 5% alginate–starch–glycerol films at room temperature; δ = bending, ν = stretching; τ = twisting, s = symmetric; as = asymmetric; T = trans; G = gauche; * = fitted value [].
| 5% Alginate | Glycerol | Starch | 5% Alginate–Glycerol | 5% Alginate–Starch | 5% Alginate–Glycerol–Starch | Assignments |
|---|---|---|---|---|---|---|
| 343 | 346 | 348 | 343 | δ(C-O) out of plane | ||
| 376 | δ(C-O) in plane | |||||
| 414 | 409 | 413 | 415 | δ(C-O) in plane | ||
| 428 | 425 | δ(C-O) in plane | ||||
| 441 | 440 | 440 | δ(C-O) in plane | |||
| 483 | 480 | 480 | 480 | δ(C-O) in plane | ||
| 491 | 494 | 488 | δ(C-O) in plane | |||
| 520 | 521 | 521 | ν(C-O-C) | |||
| 546 | 550 | ν(C-O-C), δ(O-H) | ||||
| 577 | 577 | 576 | δ(O-H) out of plane | |||
| 710 | 711 | 720 | 720 | 720 | δ(O-H) out of plane | |
| 765 | 762 | 763 | δ(O-H) out of plane | |||
| 805 | 795 | ν(C-O-C) | ||||
| 818 | 814 | 814 | ν(C-O-C) | |||
| 845 | 848 | 847 | 850 | 850 | τ(CH2-OH) | |
| 865 | 861 | 867 | 866 | τ(CH2-OH) | ||
| 885 | 890 | 890 | 889 | ν(C-O-C) | ||
| 904 | ν(C-O-C) | |||||
| 922 | 920 | 921 | 922 | 923 | 923 | ν(C-O-C) |
| 940 | 941 | 941 | ν(C-O-C) | |||
| 954 | 956 | 956 | ν(C-O-C) | |||
| 971 | ν(C-O-C) | |||||
| 980 | 980 | 976 | 976 | ν(C-O-C) | ||
| 1002 | ν(C-O-C) | |||||
| 1025 | 1020 | ν(C-O-C) | ||||
| 1032 | 1040 | 1041 | 1032 * | ν(C-O-C) | ||
| 1055 | 1052 | 1051 | 1052 | ν(C-O-C) | ||
| 1067 | 1062 | νas(C-C)T | ||||
| 1094 | 1088 | 1083 | 1096 | 1082 | 1084 | ν(C-C)G |
| 1112 | 1112 | 1108 | 1109 | ν(C-C)G | ||
| 1127 | 1132 | 1124 | 1130 | 1127 | νs(C-C)T, ν(C-O)T | |
| 1160 * | 1155 | 1154 | 1154 | νs(C-C)T, ν(C-O)G | ||
| 1202 * | 1203 | 1203 | 1203 | νs(C-C) | ||
| 1252 | 1258 | 1256 | 1259 | τ(CH2) | ||
| 1275 * | 1275 * | νs(C-C)G | ||||
| 1310 | 1315 | 1303 * | 1315 | 1311 | 1308 | δ(O-H) in plane |
| 1340 | 1344 | 1340 | 1340 | 1340 | 1340 | δ(O-H) in plane |
| 1360 * | 1361 * | 1362 * | δ(O-H) in plane | |||
| 1374 | 1380 | 1379 | 1381 | δ(O-H) in plane | ||
| 1412 | 1414 | 1404 * | 1412 | 1414 | 1418 | νs(COO−), H- bond |
| 1463 | 1461 | 1465 | 1460 | 1460 | δ(CH2) | |
| 1500 | hydrogen bond | |||||
| 1570 | hydrogen bond | |||||
| 1612 | νas(COH) | |||||
| 1630 | νas(COO−) | |||||
| 2882 | νs(CH2) | |||||
| 2905 | 2902 | 2905 | 2903 | νas(CH2) | ||
| 2934 | 2935 | ν(CH-OH), νas(CH2) | ||||
| 2945 | 2946 | 2946 | 2946 | νas(CH2) | ||
| 2961 | ν(CH-OH) |
Disclaimer/Publisher’s Note: The statements, opinions and data contained in all publications are solely those of the individual author(s) and contributor(s) and not of MDPI and/or the editor(s). MDPI and/or the editor(s) disclaim responsibility for any injury to people or property resulting from any ideas, methods, instructions or products referred to in the content. |
© 2023 by the authors. Licensee MDPI, Basel, Switzerland. This article is an open access article distributed under the terms and conditions of the Creative Commons Attribution (CC BY) license (https://creativecommons.org/licenses/by/4.0/).
Share and Cite
MDPI and ACS Style
Kadri, R.; Bresson, S.; Aussenac, T. Effect of Alginate Proportion in Glycerol-Reinforced Alginate–Starch Biofilms on Hydrogen Bonds by Raman Spectroscopy. Appl. Sci. 2023, 13, 8846. https://doi.org/10.3390/app13158846
AMA Style
Kadri R, Bresson S, Aussenac T. Effect of Alginate Proportion in Glycerol-Reinforced Alginate–Starch Biofilms on Hydrogen Bonds by Raman Spectroscopy. Applied Sciences. 2023; 13(15):8846. https://doi.org/10.3390/app13158846
Chicago/Turabian StyleKadri, Rana, Serge Bresson, and Thierry Aussenac. 2023. "Effect of Alginate Proportion in Glycerol-Reinforced Alginate–Starch Biofilms on Hydrogen Bonds by Raman Spectroscopy" Applied Sciences 13, no. 15: 8846. https://doi.org/10.3390/app13158846
Note that from the first issue of 2016, this journal uses article numbers instead of page numbers. See further details here.