Article

Evaluation of the Possible Ameliorative Effects of Anemarrhena asphodeloides Extract on Liver Cirrhosis by Combining Biochemical Analysis and Electrical Tissue Conductivity

1
Office of Strategic R&D Planning (MOTIE), Seoul 06152, Republic of Korea
2
Department of Radiology, Chosun University Hospital and Chosun University College of Medicine, Gwangju 61453, Republic of Korea
3
Medical Science Research Institute, Kyung Hee University Hospital, Seoul 02447, Republic of Korea
4
Department of Orthopedic Surgery, Cheomdanwoori Hospital, Gwangju 62274, Republic of Korea
5
Department of Hepato-Biliary-Pancreas Surgery, Chonnam National University Hwasun Hospital and Chonnam National University Medical School, Gwangju 61469, Republic of Korea
*
Authors to whom correspondence should be addressed.
These authors contributed equally to this work.
Appl. Sci. 2023, 13(13), 7950; https://doi.org/10.3390/app13137950
Submission received: 26 April 2023 / Revised: 29 June 2023 / Accepted: 5 July 2023 / Published: 7 July 2023

Abstract

:
Anemarrhena asphodeloides extract (AAE) has been used for the treatment of inflammatory diseases and its anti-inflammatory effects have been reported. In this feasibility study, the hepato-protective effect of AAE was evaluated in a rat liver cirrhosis model by a combination of biochemical analysis and electrical tissue conductivity. Liver cirrhosis was induced by dimethylnitrosamine (DMN) injection. A total of 32 Sprague–Dawley rats were divided into four groups such as normal liver, cirrhotic liver, cirrhotic liver with AAE treatment, and cirrhotic liver with lactulose treatment. Effects of AAE were compared with those of lactulose. Cirrhotic liver with both AAE and lactulose treatments showed increased body weight, decreased levels of aspartate aminotransferase and alanine aminotransferase, and increased albumin level compared with cirrhotic liver (p < 0.05). The expression levels of α-smooth muscle actin (α-SMA) and cyclooxygenase-2 (COX-2) in immunohistochemical analysis showed reduced fibrosis and inflammatory response in both AAE and lactulose treatments compared with cirrhotic liver (p < 0.05). The levels of AAE treatment were relatively lower than those of lactulose. The western blot analysis of α-SMA and COX-2 protein in both AAE and lactulose treatments was similar to that of normal liver. When comparing electrical conductivity to normal liver, difference in conductivity was 21.2%, 11.5%, and 7.7% in cirrhotic liver, lactulose treatment, and AAE treatment, respectively. These results suggest that the anti-inflammatory effect of AAE may delay or prevent the progress from liver fibrosis to cirrhosis. In summary, a more precise analysis of tissue conditions following the induction of liver cirrhosis was possible by combining electrical tissue conductivity with conventional biochemical analysis.

1. Introduction

Liver cirrhosis is caused by the accumulation of long-term damage that leads to tissue degeneration and malfunction. The damage to liver tissues from alcohol, toxins, and certain drugs can result in inflammation, which refer to hepatitis. As a result, hepatic fibrosis occurs and progresses to cirrhosis over a long period of time [1]. The major phenomenon of liver fibrosis is the hepatic stellate cell (HSC) activation, which is a major source of extracellular matrix in liver fibrosis [2,3]. Since HSCs express cytoplasmic alpha-smooth muscle actin (α-SMA) intensely in response to liver damage, α-SMA expression has been used to evaluate the amount of HSC activation and this correlates with the progress of liver fibrosis [4]. Although tissue changes in liver cirrhosis are known to be irreversible, several studies reported that liver fibrosis can be improved with appropriate treatments [5,6]. In patients with liver cirrhosis, hepatic failure and hepatocellular carcinoma in advanced liver cirrhosis are known as the main causes of death [7]. Ameliorating liver fibrosis with effective treatments can prevent the progression to liver cirrhosis as well as reduce the incidence of hepatocellular carcinoma [5,6,8].
Several herbal extracts have been used for the treatment of liver cirrhosis [9,10,11,12,13]. For example, Artemisia capillaris Thunb extracts decreased fibrogenic factor production, and specific Artemisia capillaris Thunb fragments inhibited the proliferation of fibroblast [9,14]. The Anemarrhenae rhizomes are also used to treat inflammatory diseases. A study reported that Anemarrhena asphodeloides extract (AAE) has an anti-inflammatory effect [15]. Specifically, mangiferin, the main constituent of AAE, inhibited the expression of pro-inflammatory cytokines and blocked the activation of nuclear factor κ-light-chain enhancer of activated B cells in lipopolysaccharide-stimulated peritoneal macrophages [15]. In addition, Timosaponin AIII, which is isolated from Anemarrhena asphodeloides Bunge is frequently used as an anti-pyretic, anti-inflammatory, anti-diabetic, and anti-depressive agent. The purified timosaponins and fractions of AAE containing timosaponins have various pharmacological effects which have a potential for improving inflammatory diseases as well as memory function of dementia patients [16].
Together with herbal extracts, many agents proven to have antifibrotic effects in vitro and in vivo animal models are being studied by clinical trials for the treatment of patients with liver fibrosis [2,6]. The oral administration of lactulose with antibiotics used in clinical practice is helpful to inhibit intestinal endotoxin production in alcohol-fed animals and improve hepatic inflammation in a non-alcoholic steatohepatitis rat model [17]. However, oral administration of lactulose has side effects such as diarrhea and abdominal cramps [18]. Therefore, it may be appropriate to apply herbal medicines with a hepato-protective effect and fewer side effects for cirrhosis. However, in order to be used in clinical practice, its effectiveness should be objectively verified. Recently, magnetic-resonance (MR)-based electrical conductivity imaging showed a potential as an imaging tool to measure the therapeutic effects of herbal medicine [8].
The purpose of this study was to evaluate the ameliorating effects of AAE in an in vivo rat model with liver cirrhosis induced by intraperitoneal injection of dimethylnitrosamine (DMN). Rats were divided into four experimental groups such as normal liver, cirrhotic liver, cirrhotic liver with AAE treatment, and cirrhotic liver with lactulose treatment. The expression levels of α-SMA in immunohistochemical analysis and levels of aminotransferase (AST), alanine aminotransferase (ALT), and albumin in blood were evaluated to the treatment effects in the four groups. In addition, the expression level of cyclooxygenase-2 (COX-2) was measured to evaluate the functionality of liver tissues among the groups. For comparison of tissue contrasts according to electrical tissue properties, MR-based imaging and in vitro measurement of electrical conductivity were performed after preparing a phantom composed of four liver blocks extracted from each group.

2. Materials and Methods

2.1. Preparation of Anemarrhena asphodeloides Extract

Anemarrhena asphodeloides was purchased from Puremind Medicinal Herbs (Youngchen, Republic of Korea). The Anemarrhena asphodeloides extract (AAE) was obtained in distilled water by boiling at 100 °C temperature for 3 h. The solution was subjected to evaporation and freeze drying with a yield of 20.0% by weight. The final AAE powder was stored at 4 °C.

2.2. Animal Preparation

A total of 32 Sprague–Dawley rats (8 weeks old, 260~280 g, Nara Biotechnology, Seoul, Republic of Korea) were used for this study. Rats were housed in plastic cages maintaining a constant temperature (22 ± 2 °C) and humidity (55 ± 10%) at light/dark condition of 12 h cycle. Food and water were supplied ad libitum for the animals. All rats were weighed at the beginning of the study and then weighed weekly throughout the study. Rats were divided into four groups: normal liver (marked as normal: saline injection and saline oral administration), cirrhotic liver (marked as DMN only: DMN injection and saline oral administration), cirrhotic liver with AAE treatment (marked as DMN + AAE: DMN injection and AAE oral administration), and cirrhotic liver with lactulose treatment (marked as DMN + Lac: DMN injection and lactulose oral administration) groups (Figure 1). To induce the liver cirrhosis, DMN (48670, Sigma-Aldrich, St. Louis, MO, USA) was injected intraperitoneally three times a week in a dose of 10 mg/kg for 4 weeks (dissolved in sterilized saline) [8,19]. Saline was intraperitoneally injected for the normal control group. The AAE was daily given a dose of 250 mg/kg through oral administration using gastric gavage for 4 weeks [15,20]. The same dose of lactulose (644913501, Joong-Wae Pharma Co., Seoul, Republic of Korea) also was given daily through oral administration for 4 weeks to compare with the effect of AAE [8,17]. Daily oral administration of saline was served as a mock treatment which corresponded with AAE and lactulose. The animal study protocol was approved by the Institutional Animal Care and Use Committee (IACUC, KHUASP-18-024) of Kyung Hee University.

2.3. Histology and Immunohistochemisty

On the last day of 4 weeks of drug administration, rats were fixed with 4% formaldehyde in 0.1 M sodium phosphate buffer (pH 7.4) by transcardial perfusion under anesthesia (intramuscular injection of zolazepam 0.2 mL/kg, (Zoletil 50; Virbac, Carros, France)). The liver tissue was quickly removed and post-fixed with the same fixative solution overnight at 4 °C. The coronal sections of liver tissue in a 20 μm thickness were made using a freezing microtome (Leica, 2800N, Nussloch, Germany). For observation of general tissue morphology, the sections were stained with hematoxylin and eosin (H and E). After the immunohistochemical staining of α-SMA (ab7817, Abcam, Cambridge, UK, 1:200 dilution) and COX-2 (sc1747, Santa Cruz Biotech, Santa Cruz, CA, USA, 1:200 dilution), signals were visualized by DAB (Sigma-Aldrich, St. Louis, MO, USA) reaction. The preparations for immunohistochemistry were performed according to the conventional procedure, and the details were followed by referring to the method of Kyung et al. [8]. Finally, the sectional images of liver tissues were qualitatively examined under a light microscope (BX51, Olympus, Tokyo, Japan) in a double-blind manner by two histopathologists.

2.4. Serum Biochemistry

Together with the preparation of histology and immunohistochemistry, whole blood was isolated from the aorta in the abdominal region under anesthesia. The serum was separated and stored at −70 °C after centrifuging the blood at 3000× g for 15 min. The levels of albumin, aspartate transaminase (AST), and alanine transaminase (ALT) were measured using an Auto Chemistry Analyzer (AU400, Olympus, Tokyo, Japan).

2.5. Western Blotting

Liver tissue was homogenized and sonicated on ice with lysis buffer (50 mM Tris-HCl pH 8.0, 150 mM NaCl, 1% Triton X-100, 0.5% sodium deoxycholate, 0.1% sodium dodecyl sulfate (SDS), 5 mM EDTA, 1% protease inhibitor cocktail, Sigma). After on-ice incubation for 1 h, the lysates were centrifugated at 14,000× g for 20 min. The supernatant was collected and assayed for protein concentration using the Bradford assay method. Lysate samples containing 35 μg of protein were fractionated by 10 or 13% SDS-PAGE gel electrophoresis and then transferred to PVDF membranes. The membranes were blocked with 5% skim milk in TBST (TBS with 0.1% Tween 20) for 1 h and incubated with each primary antibody overnight at 4 °C. The primary antibodies include goat polyclonal anti-COX-2 antibody (sc1747, Santa Cruz Biotech, Santa Cruz, CA, USA, 1:1000 dilution), mouse monoclonal α-SMA antibody (ab7817, Abcam, Cambridge, UK, 1:2000 dilution), and mouse monoclonal anti-β-actin antibody (sc-47778, Santa Cruz Biotech, Santa Cruz, CA, USA, 1:2000 dilution). The membranes were washed and further incubated with secondary antibodies including goat anti-mouse and donkey anti-goat IgG conjugated to horseradish peroxidase in 1:2500 dilution (sc-2005, sc-2020; Santa Cruz Biotech, Santa Cruz, CA, USA) for 1 h at room temperature. Then, the bands were visualized with an ECL Western Blotting Detection System (ATTO system).

2.6. Statistical Analysis

Using ImageJ software (Ver. 1.53t, NIH, Bethesda, MD, USA), the relative densities of immuno-labeled cells were measured by the mean value on a gray scaled image and normalized to that of the normal group. The mean values of four sections (obtained from four groups) were analyzed for statistical analysis. The results of western blot were converted to the percentage rate compared with that of the normal control. We applied the non-parametric test and post-hoc Krsukal–Walis multiple comparison test to compare the difference between two groups using SPSS 20.0 for windows (SPSS Inc., Chicago, IL, USA). The differences were considered statistically valid when p < 0.05.

2.7. Electrical Conductivity Measurements

Electrical conductivity image using MRI was performed for image-based analysis of hepato-protective effects of AAE treatment on liver cirrhosis. Acrylic phantom with a 60 mm diameter and an 80 mm height was used for the imaging experiment. The resected liver blocks containing the cirrhotic tissues were positioned inside a cylindrical acrylic phantom, which was filled with conductive material (agarose gel of 0.1 S/m) to support the liver block (Figure 1). The phantom was placed inside the bore of a 3T MRI scanner (Magnetom Trio A Tim; Siemens Medical Solutions, Erlangen, Germany). A multi-echo spin–echo MR pulse sequence was applied to acquire B1 phase maps to reconstruct high-frequency conductivity images of the phantom [21]. The imaging parameters were as follows: repetition time (TR)/echo time (TE) = 1000/10, 20, 30, 40 ms (four echoes), field of view (FOV) = 60 × 60 mm2, matrix size = 128 × 128, slice thickness = 3 mm, number of slices = 8, number of excitations (NEX) = 6, and total imaging time = 20 min. Electrical conductivity was reconstructed from optimized B1 phase images obtained from multi-echo spin–echo MR data after multiple pre-processing steps [21]. Details of conductivity image reconstruction followed the work of Katoch et al. [22,23].
To validate the electrical conductivities in the imaging results, the conductivity spectra of the four groups were directly measured using an impedance analyzer (SI1260A, METEK, Stonehouse, UK) (Figure 1). To this end, liver block extracted from four groups was placed in a 10 × 10 × 10 mm3 chamber equipped with the electrodes, and the conductivity spectra were measured using a four-electrode method. The frequency range of the conductivity spectra was from 10 Hz to 1 MHz.

3. Results

3.1. Body Weight Measurement and Serum Biochemical Assay

Body weight change is one of factors for assessing liver cirrhosis; we weighed all rats and compared the four experimental groups (Figure 2a). Except for DMN only, the body weight increased gradually over 4 weeks of the treatment and showed a similar pattern. Specifically, the DMN-only group showed a decreased body weight at 3 weeks, whereas DMN + AAE and DMN + Lac groups showed similar values to the normal liver group.
The serum levels of AST, ALT, and albumin were measured to evaluate liver function (Figure 2b–d and Table 1). In serum levels of AST and ALT, DMN + AAE and DMN + Lac groups were significantly lower than the DMN-only group (p < 0.05) but were higher than the normal liver group. When comparing the albumin levels among the four groups, the DMN-only group was lower than the normal liver group (p < 0.05). The albumin level of DMN + AAE and DMN + Lac groups were similar to the normal liver group.

3.2. Histological Analysis

Figure 3 shows the results of H and E stating and their histological morphologies between the liver tissues. The liver tissues from the DMN-only group showed histological abnormalities such as congestion, hepatic architectural destruction, massive hepatocyte necrosis, and remarkable infiltration of mononuclear cells (indicated by black triangles). However, the histological abnormalities were clearly reduced in DMN + AAE and DMN + Lac groups compared with the DMN-only group. Specifically, the degree of histological abnormalities in the DMN + AAE group were relatively lower than those of the DMN + Lac group.

3.3. Effects on α-SMA and COX-2 Expression

Figure 4 shows the results of immunohistochemical analysis for evaluating liver tissues in the four experimental groups. The level of α-SMA expression was to evaluate HSC activation (Figure 4a). Compared with the normal liver group, three DMN-treated groups showed increased expression level (stained in brown color). The DMN-only group showed the highest expression level. The DMN + AAE group showed less expression level than the DMN + Lac group. The count of α-SMA-positive cells of DMN + AAE and DMN + Lac groups were significantly higher than the normal liver group, but significantly lower than the DMN-only group (p < 0.05) (Figure 4b).
The severity of inflammation between the groups was compared by the level of COX-2 expression (Figure 4c). The DMN-only group showed the highest expression level. DMN + AAE and DMN + Lac groups showed less expression levels than the DMN-only group. The expression level of COX-2 was analyzed by counting the number of cells showing positive expression versus total cell count. The count of COX-2-positive cells in the DMN-only group was significantly higher than that of normal liver (p < 0.01) (Figure 4d). The cell count of DMN + AAE and DMN + Lac groups was significantly lower than the DMN-only group (p < 0.05). Especially, the cell count of the DMN + AAE group was lower than that of DMN + Lac, which may indicate a superior hepato-protective effect on hepatic fibrosis.

3.4. Improving Effects of AAE by Western Blot Analysis

To verify the ameliorating effect of AAE on inflammation and fibrosis, western blot analysis of α-SMA and COX-2 protein was performed in four groups (Figure 5). Based on the intensity of the normal liver group, levels of α-SMA (129.57 ± 12.78%) and COX-2 (176.34 ± 24%) in the DMN-only group were significantly higher than those of the normal group (p < 0.05). However, the expression of inflammation or fibrosis-related proteins were significantly lower in DMN + AAE (α-SMA; 81.24 ± 17.96%, COX-2; 97.14 ± 21.95%) and DMN + Lac (α-SMA; 93.95 ± 21.47%, COX-2; 89.7 ± 23.94%) groups than the DMN-only group (p < 0.05). The protein levels of the DMN + AAE group were similar to that of the normal liver group that may indicate the hepato-protective effect against DMN.

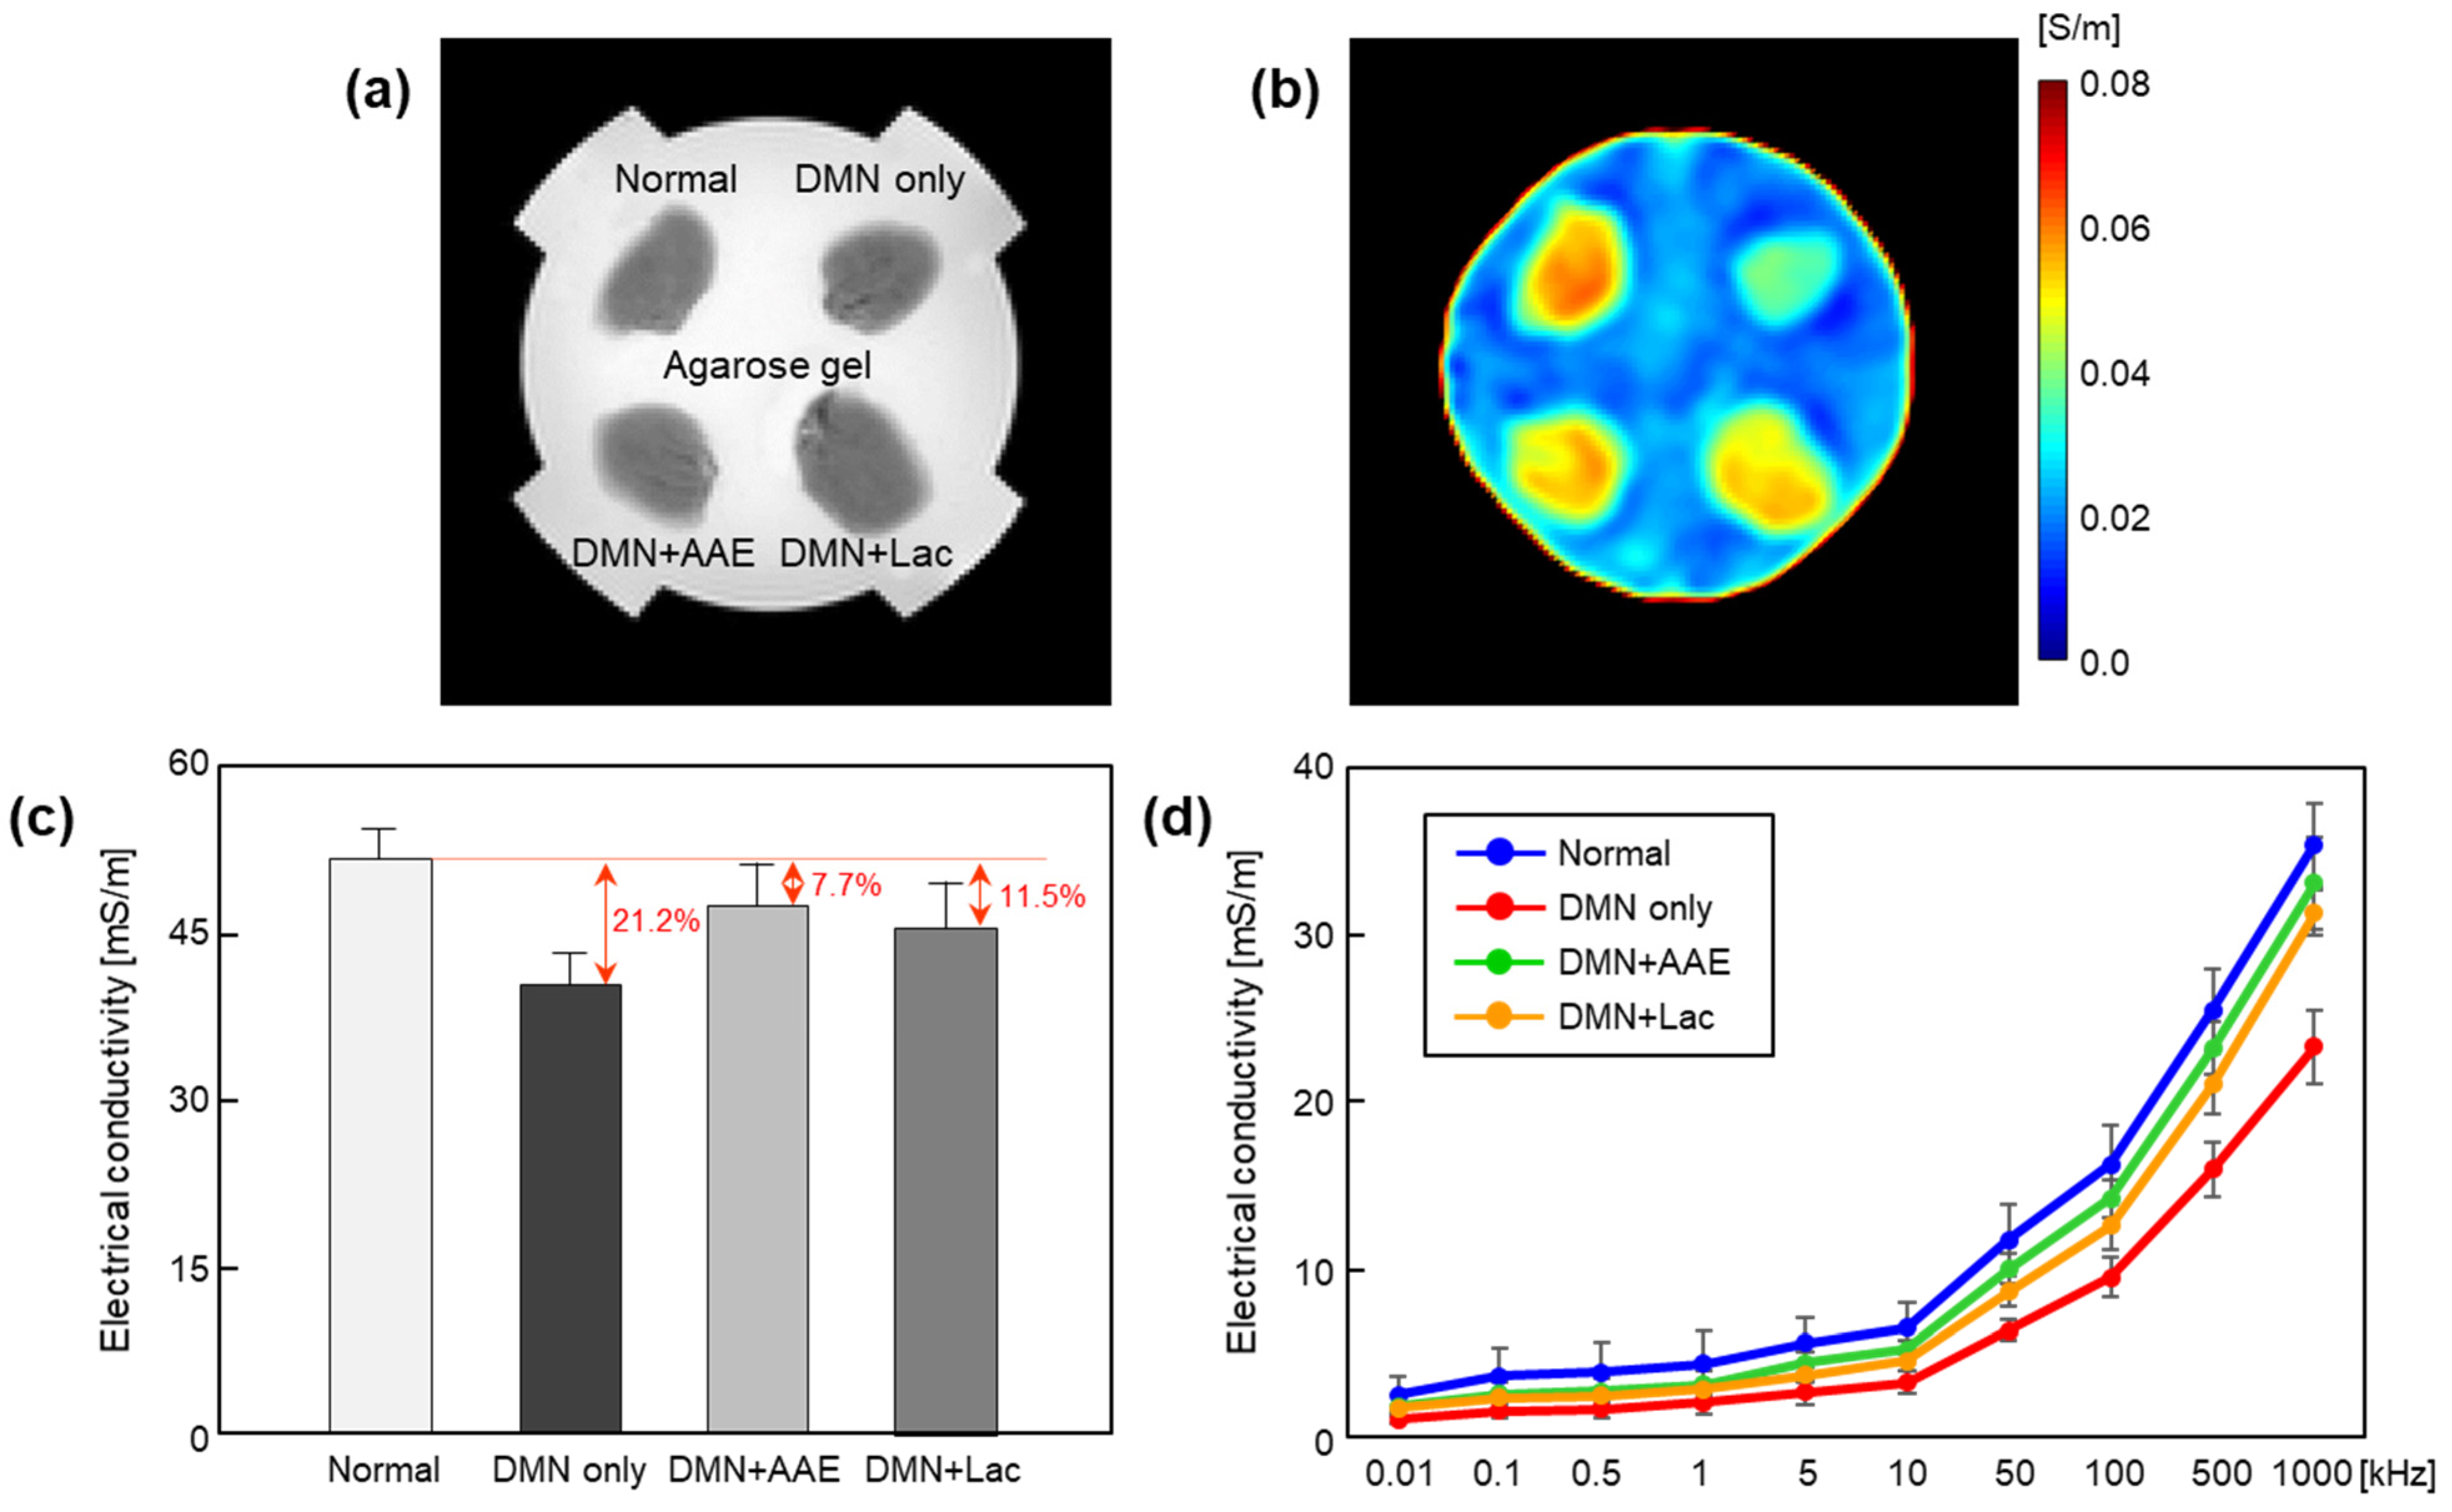
3.5. Improving Effects of AAE by Electrical Conductivity Imaging

MR-based electrical conductivity imaging of phantom, which consisted of four liver blocks, was performed for image-based analysis of hepato-protective effect. From morphological MR images (Figure 6a), significant difference in contrast was not observed between the groups. However, electrical conductivity images showed clear difference in contrast between the groups (Figure 6b). Specifically, the conductivity contrast was the highest in the normal group and the lowest in the DMN-only group. The contrasts in DMN + AAE and DMN + Lac groups were higher than that of the DMN-only group.
For image-based analysis, conductivity values were measured in whole liver tissue from four groups (Figure 6c). The conductivity was the highest in the normal group (52 ± 2 mS/m) and lower in the order of DMN + AAE (48 ± 4 mS/m), DMN + Lac (46 ± 4 mS/m), and DMN-only (41 ± 2 mS/m) groups. Based on the value of the normal group, the difference was 7.7% for DMN + AAE, 11.5% for DMN + Lac, and 21.2% for the DMN-only group. The tissue conductivity of the DMN + AAE group was closer to that of the normal group which may also indicate the hepato-protective effect against DMN as well as the results of western blot analysis.
From the conductivity spectra obtained from in vitro measurement using an impedance analyzer (Figure 6d), the measured conductivity was the highest in the normal group and lower in the order of DMN + AAE, DMN + Lac, and DMN-only groups. However, the absolute conductivity values were lower than that of imaging results due to the frequency dependence, but gradually increased with the measuring frequency.

4. Discussion

When DMN is injected intraperitoneally, the absorbed DMN from the visceral peritoneum drains into liver through the portal vein [24,25]. Finally, DMN induces diffuse micronodular cirrhosis with regenerative hepatocyte changes and bile duct proliferation [8,21,24]. Moreover, events such as increased mortality, destroyed hepatic parenchymal cell, and increased fibrosis in the DMN-induced rat model are similar to the progression in patients with cirrhosis [26]. In this study, the induced liver cirrhosis after intraperitoneal injection of DMN was indirectly confirmed by monitoring body weight and by serum biochemical assay, and the tissue condition was directly confirmed by histological analysis.
Tissue conditions of DMN + AAE and DMN + Lac groups were significantly different from that of the DMN-only group. Unlike lactulose, AAE may have a different mechanism of reducing liver fibrosis because AAE has anti-inflammatory effects [15]. Although there was no significant difference in tissue conditions between the DMN + AAE and DMN + Lac groups, the DMN + AAE group showed a superior hepato-protective effect on hepatic cirrhosis in the immunohistochemical analysis. After liver damage, HSCs transform into active contractile myofibroblasts and disturb the microcirculation [27,28]. Increased mobility and migration of HSCs contribute to the sinusoidal remodeling process and excessive function of HSCs results in pericytic dysfunction which is marked by phenotypic markers including α-SMA [29,30,31]. In both the DMN + AAE and DMN + Lac groups, the level of α-SMA expression and count of α-SMA-positive cells were significantly lower than those of the DMN-only group. However, the DMN + AAE group showed a lower level of α-SMA expression and decreased count of α-SMA-positive cells than those of the DMN + Lac group which indicates superior ability to inhibit HSCs activation.
Lactulose is often used to prevent hepatic encephalopathy by reducing the toxicity of ammonia in the blood rather than improving cirrhosis itself [32]. From the histological findings, the DMN + Lac group showed less hepatocyte injuries than the DMN-only group. This can be interpreted that lactulose may interfere with the proper induction of liver cirrhosis by DMN in the rat model. The mechanism for this result is not known; however, it can be speculated that lactulose reduced the level of the absorbed DMN in the mesenteric blood due to laxative effect including diarrhea via an increase in osmolality [27]. As a result, the degree of liver fibrosis in the DMN + Lac group was lower than that of the DMN-only group. Kyung et al. also reported that the degree of liver fibrosis was significantly reduced in DMN with lactulose treatment [8].
Chronic exposure of COX-2 and TNF-α promotes inflammation and fibrosis, and ultimately leads to liver cirrhosis [8,29,33]. Compared with the DMN-only group, the level of COX-2 expression was significantly reduced in DMN + AAE and DMN + Lac groups which indicates AAE and Lac treatments ameliorated liver cirrhosis by reducing hepatic inflammation and fibrogenesis. In particular, the DMN + AAE group showed a lower level of COX-2 expression than that of the DMN + Lac group, which may indicate a superior inhibitory effect. Kyung et al. reported that curcumin could ameliorate liver cirrhosis via its anti-inflammatory effect and suppression of HSC activity, thereby attenuating fibrosis [8]. The results of curcumin in liver cirrhosis rat models were similar to those of AAE in this study [8]. In particular, the level of COX-2 expression in DMN with curcumin treatment was higher than normal liver, but COX-2 expression in the level of the DMN + AAE group was similar to normal liver in this study. We can infer that AAE may have a similar or better ameliorating effect on liver cirrhosis than curcumin.
The contrast of electrical conductivity is primarily determined by the concentration and mobility of ions constituting the tissue [21]. Liver cirrhosis is closely related to changes in the extracellular compartments as well as hepatocytes, the electrical conductivity can provide sensitive information on tissue condition before and after treatments. In addition, conductivity is a material property with an absolute value, it is possible to quantify the difference in tissue condition between the experimental groups. In our results, the conductivity of the DMN-only group was lower than that of the normal liver group by more than 20%, but within 10% of the DMN + AAE group. Kyung et al. reported that, depending on the degree of fibrosis progression, the electrical conductivity was decreased due to the damaged tissues, anisotropy, and liver stiffness of fibrosis [8]. In contrast, Kim et al. reported that the conductivity was increased in the fibrous regions due to the changes in the extracellular compartments [25]. However, conductivity decreased at the stage of advanced liver cirrhosis, which was affected by the decreased amount of water, the restriction of ion mobility, and limited additional collagen deposition in the stage of advanced liver cirrhosis. When comparing the effects between the DMN + AAE and DMN + Lac groups, the conductivity of the DMN + AAE group was closer to that of normal liver than that of the DMN + Lac group. Following the contrast mechanism of electrical conductivity [21], the high conductivity in DMN + AAE than that of DMN + Lac group indicates that the tissue damages by DMN is relatively small. This means that the electrical property of the DMN + AAE group was closer to the tissue condition of normal liver.
Based on the results from electrical conductivity and immunohistochemical analysis, AAE treatments showed a potential for the hepato-protective effect against liver cirrhosis. Future studies through comparison with large samples and other herbal extracts are required to clearly identify the mechanism of the antifibrotic effect of AAE.

5. Conclusions

In summary, the ameliorating effect of AAE on liver cirrhosis was evaluated with a combination of a biochemical analysis and electrical tissue conductivity. The expression levels of α-SMA and COX-2 in immunohistochemical analysis showed reduced fibrosis and inflammatory response in AAE or lactulose treatment compared with cirrhotic liver. The cirrhotic liver showed decreased conductivity than that of normal liver, but the conductivity of cirrhotic liver with AAE treatment was similar to normal liver. The western blot analysis of α-SMA and COX-2 protein among the four groups was well correlated with the MR-based electrical conductivity images. When comparing the experimental groups, there was no significant difference in tissue conditions between the AAE and Lac treatment groups. However, cirrhotic liver with AAE treatment showed superior hepato-protective effect on hepatic cirrhosis in the immunohistochemical analysis as well as electrical conductivity. Future studies through comparison with large samples and other herbal extracts are required to clearly identify the ameliorating effect of AAE on liver cirrhosis. For clinical applications, it is necessary to provide the relationship between the biochemical parameters and electrical conductivity. Recent conductivity tensor imaging (CTI), which provides information on conductivity as well as on the cellular environments such as cell density, intra- and extracellular compartments, has been developed. We expect that CTI with high sensitivity regarding tissue changes can provide information on liver tissues in situ that could be utilized for in vivo human imaging.

Author Contributions

Conceptualization, Y.K. and J.W.K.; methodology, B.K.C., N.K. and E.J.Y.; software, N.K.; validation, J.W.K. and E.J.Y.; formal analysis, Y.K. and B.K.C.; investigation, J.S.K., Y.H.H., and S.G.S.; data curation, J.S.K. and S.G.S.; writing—original draft preparation, Y.K. and H.J.K.; writing—review and editing, J.W.K., Y.H.H. and H.J.K.; visualization, Y.H.H.; supervision, H.J.K. All authors have read and agreed to the published version of the manuscript.

Funding

This research was funded by the National Research Foundation of Korea (NRF) grants funded by the Korea government (No. 2021R1A2C2004299). This research was also supported by the research fund from Chosun University (2020).

Institutional Review Board Statement

The study was conducted according to the guidelines of the Institutional Animal Care and Use Committee (IACUC, KHUASP-18-024) of Kyung Hee University.

Informed Consent Statement

Not applicable.

Data Availability Statement

The data presented in this study are available upon request from the corresponding author. The data are not publicly available for confidentiality reasons.

Conflicts of Interest

The authors declare no conflict of interest.

References

  1. Schuppan, D.; Afdhal, N.H. Liver Cirrhosis. Lancet 2008, 371, 838–851. [Google Scholar] [CrossRef] [PubMed]
  2. Bataller, R.; Brenner, D.A. Liver Fibrosis. J. Clin. Investig. 2005, 115, 209–218. [Google Scholar] [CrossRef] [PubMed]
  3. Friedman, S.L. Molecular Regulation of Hepatic Fibrosis, an Integrated Cellular Response to Tissue Injury. J. Biol. Chem. 2000, 275, 2247–2250. [Google Scholar] [CrossRef] [PubMed] [Green Version]
  4. Carpino, G.; Morini, S.; Corradini, S.G.; Franchitto, A.; Merli, M.; Siciliano, M.; Gentili, F.; Muda, A.O.; Berloco, P.; Rossi, M. Alpha-SMA Expression in Hepatic Stellate Cells and Quantitative Analysis of Hepatic Fibrosis in Cirrhosis and in Recurrent Chronic Hepatitis After Liver Transplantation. Dig. Liver Dis. 2005, 37, 349–356. [Google Scholar] [CrossRef] [PubMed]
  5. Ellis, E.L.; Mann, D.A. Clinical Evidence for the Regression of Liver Fibrosis. J. Hepatol. 2012, 56, 1171–1180. [Google Scholar] [CrossRef] [Green Version]
  6. Ismail, M.H.; Pinzani, M. Reversal of Liver Fibrosis. Saudi J. Gastroenterol. 2009, 15, 72–79. [Google Scholar] [CrossRef]
  7. Fattovich, G.; Stroffolini, T.; Zagni, I.; Donato, F. Hepatocellular Carcinoma in Cirrhosis: Incidence and Risk Factors. Gastroenterology 2004, 127, S35–S50. [Google Scholar] [CrossRef]
  8. Kyung, E.J.; Kim, H.B.; Hwang, E.S.; Lee, S.; Choi, B.K.; Kim, J.W.; Kim, H.J.; Lim, S.M.; Kwon, O.I.; Woo, E.J. Evaluation of hepatoprotective effect of curcumin on liver cirrhosis using a combination of biochemical analysis and magnetic resonance-based electrical conductivity imaging. Mediat. Inflamm. 2018, 2018, 5491797. [Google Scholar] [CrossRef] [Green Version]
  9. Hong, Y.; Kim, M.Y.; Yoon, M. The Anti-Angiogenic Herbal Extracts Ob-X from Morus Alba, Melissa Officinalis, and Artemisia Capillaris Suppresses Adipogenesis in 3T3-L1 Adipocytes. Pharm. Biol. 2011, 49, 775–783. [Google Scholar] [CrossRef] [Green Version]
  10. Jang, E.; Kim, B.J.; Lee, K.T.; Inn, K.S.; Lee, J.H. A Survey of Therapeutic Effects of Artemisia Capillaris in Liver Diseases. Evid. Based Complement. Alternat. Med. 2015, 2015, 728137. [Google Scholar] [CrossRef] [Green Version]
  11. Kadir, F.A.; Kassim, N.M.; Abdulla, M.A.; Kamalidehghan, B.; Ahmadipour, F.; Yehye, W.A. PASS-Predicted Hepatoprotective Activity of Caesalpinia Sappan in Thioacetamide-Induced Liver Fibrosis in Rats. Sci. World J. 2014, 2014, 301879. [Google Scholar] [CrossRef] [Green Version]
  12. Park, H.; Hwang, Y.H.; Kim, D.G.; Jeon, J.; Ma, J.Y. Hepatoprotective Effect of Herb Formula KIOM2012H Against Nonalcoholic Fatty Liver Disease. Nutrients 2015, 7, 2440–2455. [Google Scholar] [CrossRef] [Green Version]
  13. Kim, J.J.; Choi, J.; Lee, M.K.; Kang, K.Y.; Paik, M.J.; Jo, S.K.; Jung, U.; Park, H.R.; Yee, S.T. Immunomodulatory and Antidiabetic Effects of a New Herbal Preparation (HemoHIM) on Streptozotocin-Induced Diabetic Mice. Evid. Based Complement. Alternat. Med. 2014, 2014, 461685. [Google Scholar] [CrossRef] [PubMed] [Green Version]
  14. Han, J.M.; Kim, H.G.; Choi, M.K.; Lee, J.S.; Lee, J.S.; Wang, J.H.; Park, H.J.; Son, S.W.; Hwang, S.Y.; Son, C.G. Artemisia Capillaris Extract Protects Against Bile Duct Ligation-Induced Liver Fibrosis in Rats. Exp. Toxicol. Pathol. 2013, 65, 837–844. [Google Scholar] [CrossRef]
  15. Jeong, J.J.; Jang, S.E.; Hyam, S.R.; Han, M.J.; Kim, D.H. The Rhizome Mixture of Anemarrhena asphodeloides and Coptidis Chinensis Ameliorates Acute and Chronic Colitis in Mice by Inhibiting the Binding of Lipopolysaccharide to TLR4 and IRAK1 Phosphorylation. Evid. Based Complement. Alternat. Med. 2014, 2014, 809083. [Google Scholar] [CrossRef] [PubMed] [Green Version]
  16. Kim, K.M.; Im, A.; Kim, S.H.; Hyun, J.W.; Chae, S. Timosaponin AIII Inhibits Melanoma Cell Migration by Suppressing COX-2 and In Vivo Tumor Metastasis. Cancer Sci. 2016, 107, 181–188. [Google Scholar] [CrossRef] [Green Version]
  17. Fan, J.; Xu, Z.; Wang, G. Effect of Lactulose on Establishment of a Rat Non-Alcoholic Steatohepatitis Model. World J. Gastroenterol. 2005, 11, 5053–5056. [Google Scholar] [CrossRef]
  18. Starr, S.P.; Raines, D. Cirrhosis: Diagnosis, Management, and Prevention. Am. Fam. Physician 2011, 84, 1353–1359. [Google Scholar]
  19. Tanaka, H.; Ueda, H.; Fukuchi, H.; Ichinose, M. Antifibrotic effect of edaravone in rat liver cirrhosis induced by dimethylnitrosamine. Clin. Exp. Med. 2009, 9, 229–233. [Google Scholar] [CrossRef]
  20. Piwowar, A.; Rembiałkowska, N.; Rorbach-Dolata, A.; Garbiec, A.; Ślusarczyk, S.; Dobosz, A.; Długosz, A.; Marchewka, Z.; Matkowski, A.; Saczko, J. Anemarrhenae asphodeloides rhizoma Extract Enriched in Mangiferin Protects PC12 Cells against a Neurotoxic Agent-3-Nitropropionic Acid. Int. J. Mol. Sci. 2020, 21, 2510. [Google Scholar] [CrossRef] [PubMed] [Green Version]
  21. Kim, J.W.; Park, J.A.; Katoch, N.; Yang, J.; Park, S.; Choi, B.K.; Song, S.G.; Kim, T.H.; Kim, H.J. Image-based evaluation of irradiation effects in brain tissues by measuring absolute electrical conductivity using MRI. Cancers 2021, 13, 5490. [Google Scholar] [CrossRef] [PubMed]
  22. Katoch, N.; Choi, B.K.; Sajib, S.Z.K.; Lee, E.A.; Kim, H.J.; Kwon, O.I.; Woo, E.J. Conductivity tensor imaging of in vivo human brain and experimental validation using giant vesicle suspension. IEEE Trans. Med. Imaging 2019, 38, 1569–1577. [Google Scholar] [CrossRef] [PubMed]
  23. Lesbats, C.; Katoch, N.; Minhas, A.S.; Taylor, A.; Kim, H.J.; Woo, E.J.; Poptani, H. High-frequency electrical properties tomography at 9.4T as a novel contrast mechanism for brain tumors. Magn. Reson. Med. 2021, 86, 382–392. [Google Scholar] [CrossRef] [PubMed]
  24. George, J.; Rao, K.R.; Stern, R.; Chandrakasan, G. Dimethylnitrosamine-induced liver injury in rats: The early deposition of collagen. Toxicology 2001, 156, 129–138. [Google Scholar] [CrossRef] [PubMed]
  25. Kim, J.W.; Kim, H.B.; Hur, Y.H.; Choi, B.K.; Katoch, N.; Park, J.A.; Kim, H.J.; Woo, E.J. MR-based electrical conductivity imaging of liver fibrosis in an experimental rat model. J. Magn. Reson. Imaging 2021, 53, 554–563. [Google Scholar] [CrossRef]
  26. Kang, K.W.; Kim, Y.G.; Cho, M.K.; Bae, S.K.; Kim, J.W.; Lee, M.G.; Kim, S.G. Oltipraz Regenerates Cirrhotic Liver through CCAAT/Enhancer Binding Protein-mediated Stellate Cell Inactivation. FASEB J. 2002, 16, 1988–1990. [Google Scholar] [CrossRef] [Green Version]
  27. Elkington, S.G. Lactulose. Gut 1970, 11, 1043–1048. [Google Scholar] [CrossRef] [PubMed] [Green Version]
  28. Garbuzenko, D.V.; Arefyev, N.O.; Belov, D.V. Mechanisms of Adaptation of the Hepatic Vasculature to the Deteriorating Conditions of Blood Circulation in Liver Cirrhosis. World J. Hepatol. 2016, 8, 665. [Google Scholar] [CrossRef]
  29. Hu, K.Q. Cyclooxygenase 2 (COX2)-Prostanoid Pathway and Liver Diseases. Prostaglandins Leukot. Essent. Fat. Acids 2003, 69, 329–337. [Google Scholar] [CrossRef]
  30. Lee, J.S.; Semela, D.; Iredale, J.; Shah, V.H. Sinusoidal Remodeling and Angiogenesis: A New Function for the Liver-specific Pericyte? Hepatology 2007, 45, 817–825. [Google Scholar] [CrossRef]
  31. Hellerbrand, C. Hepatic Stellate Cells—The Pericytes in the Liver. Pflügers Arch. -Eur. J. Physiol. 2013, 465, 775–778. [Google Scholar] [CrossRef] [PubMed]
  32. Chen, Z.; Ruan, J.; Li, D.; Wang, M.; Han, Z.; Qiu, W.; Wu, G. The role of intestinal bacteria and gut–brain axis in hepatic encephalopathy. Front. Cell. Infect. Microbiol. 2021, 10, 595759. [Google Scholar] [CrossRef] [PubMed]
  33. Yang, C.M.; Yang, C.C.; Hsiao, L.D.; Yu, C.Y.; Tseng, H.C.; Hsu, C.K.; Situmorang, J.H. Upregulation of COX-2 and PGE2 Induced by TNF-α Mediated Through TNFR1/MitoROS/PKCα/P38 MAPK, JNK1/2/FoxO1 Cascade in Human Cardiac Fibroblasts. J. Inflamm. Res. 2021, 14, 2807–2824. [Google Scholar] [CrossRef] [PubMed]
Figure 1. Schematic illustration of the experimental setup for biochemical analysis and electrical tissue conductivity to evaluate the ameliorating effects of AAE on liver cirrhosis.
Applsci 13 07950 g001
Figure 2. Comparison of body weight and serum biochemical parameters among four groups. (a) Measurement of body weight before and after 4 weeks of treatment period; (bd) AST, ALT, and albumin levels in blood. Significances are compared between normal vs. DMN only (*, p < 0.05; **, p < 0.01), and DMN only vs. DMN + AAE or DMN + Lac (#, p < 0.05; ##, p < 0.01).
Applsci 13 07950 g002
Figure 3. Histological analysis of liver tissues extracted from four experimental groups. Black triangles indicate marked infiltration of mononuclear cells.
Applsci 13 07950 g003
Figure 4. Immunohistochemical analysis of four experimental groups. (a) Immunostained α-SMA of liver tissues; (b) bar graph of positive cell count showing different levels of α-SMA expression; (c) levels of COX-2 expression in immunohistochemical staining of liver tissues; (d) bar graph positive cell count showing different levels of COX-2 expression. Significances are compared between normal liver and DMN-only groups (**, p < 0.01) or between DMN-only and DMN + AAE or DMN + Lac groups (#, p < 0.05; ##, p < 0.01).
Applsci 13 07950 g004
Figure 5. Western blot analysis of α-SMA and COX-2 protein in four experimental groups. Protein levels of α-SMA (a) and COX-2 (b) in liver tissues were examined using anti-α-SMA and anti-COX-2 specific antibody. Data was normalized against β-actin levels and expressed as a percentage compared with normal values. * p < 0.05 vs. normal liver group, # p < 0.05 vs. DMN-only group.
Applsci 13 07950 g005
Figure 6. MR-based conductivity imaging and in vitro conductivity measurement of four experimental groups. (a) Anatomical MR image of phantom with four liver blocks; (b) electrical conductivity image of phantom; (c) bar graph showing comparison of measured conductivities from the imaging experiment; (d) line plot showing comparison of measured conductivities from an impedance analyzer.
Applsci 13 07950 g006
Table 1. Summary of serum biochemical parameters among the four experimental groups.
ParametersNormalDMN OnlyDMN + AAEDMN + Lac
AST (IU/L)77.3 ± 12.1 *205.7 ± 25.4103.5 ± 21.2119.3 ± 17.9
ALT (IU/L)32.5 ± 4.974.7 ± 4.653.3 ± 5.351.8 ± 3.8
Albumin (g/dL)3.9 ± 0.22.9 ± 0.43.8 ± 0.33.7 ± 0.1
* Data are represented by mean ± SEM (n = 8 in each group).
Disclaimer/Publisher’s Note: The statements, opinions and data contained in all publications are solely those of the individual author(s) and contributor(s) and not of MDPI and/or the editor(s). MDPI and/or the editor(s) disclaim responsibility for any injury to people or property resulting from any ideas, methods, instructions or products referred to in the content.

