


Serotonin Signaling in the Enteric Nervous System and Connection to Autism Spectrum Disorder: A Translational Mathematical Model

Department of Biomedical Engineering, Northeastern University, Boston, MA 02115, USA
Appl. Sci. 2023, 13(5), 2970; https://doi.org/10.3390/app13052970
Submission received: 18 November 2022
/
Revised: 15 February 2023
/
Accepted: 20 February 2023
/
Published: 25 February 2023
(This article belongs to the Special Issue Dynamic Models of Biology and Medicine, Volume III)
Abstract
:While the causes of autism spectrum disorder (ASD) remain unclear, some studies have shown that serotonin-mediated effects on the enteric nervous system (ENS) correlate with an ASD-like behavioral phenotype in mice. Introduced here is a mathematical model of interactions between gut serotonin and its impact on the ENS. The model was used to identify three key factors that affect ENS size, namely, serotonin production, its clearance, and its ability to act as a growth factor for the ENS. The model was used to reproduce experimentally reported results from a mouse model by Margolis et al. (2016), which connected serotonin-mediated ENS hypoplasia to an ASD phenotype. The proposed mathematical model was used to scale the quantified relationship from mice to humans to show how the combination of these three factors can translate to a quantifiable metric that could potentially be correlated to the ASD spectrum. A detailed discussion of how ENS hypoplasia could mechanistically affect CNS activity concludes this paper.
1. Introduction
Autism spectrum disorder (ASD) is a complex heterogeneous neurodevelopmental condition characterized by varying degrees of challenges in social communication and interactions, often coupled with repetitive behaviors, as well as an impaired ability to learn and behave [1,2]. While causes for ASD remain unknown, several twin studies suggest a high degree of genetic heritability, with correlations among monozygotic twins being significantly higher than those for dizygotic twins on multiple ASD measures [3,4]. Furthermore, ASD is often associated with a high prevalence of gastrointestinal (GI) issues [5], and it has been suggested that serotonin (5-hydroxytryptamine, or 5-HT) may be a factor that affects both sides of this equation [6]. In fact, elevated serotonin levels in the blood were one of the first biomarkers correlated with autism, with a quarter to a third of individuals with ASD exhibiting hyperserotonemia [7,8]. Over 95% of serotonin is synthesized in the gut [9]; blood serotonin is found in platelets [10], which do not synthesize it but utilize a 5-HT transporter SERT to take it up as they circulate through the gut [11,12]. Hyperactivity of SERT, which is encoded by a variant of the Slc6a4 gene, has been associated with both ASD and, interestingly, obsessive-compulsive disorder (OCD).
A possible mechanistic link between serotonin specifically in the gut and ASD has been studied in an intriguing experiment by Margolis et al. [13]. In the gut, serotonin functions not only as a neurotransmitter but also as a growth factor [14,15] by promoting neurogenesis of the enteric (gut) nervous system (ENS). In [13], the authors evaluated the hypothesis that SERT hyperactivity in a mouse model can drive structural and functional GI deficits due to altered serotonin signaling in the gut. The authors compared the impact of SERT signaling on ENS size for mice with hyperactive SERT (Ala56 mice) who exhibit whole blood hyperserotonemia, as well as brain and behavioral abnormalities, with wild type mice and with SERT receptor knock out mice (SERTKO). The authors show that due to the increased activity of SERT in Ala56 mice, the size of the ENS can be up to 60% smaller at 6–8 weeks compared to WT mice, since increased clearance of serotonin from the gut due to SERT hyperactivity prevents serotonin from acting as a growth factor on the ENS (in the experiment, the authors used 10 mice per group, and the reported results were statistically significant). These animals tended to exhibit repetitive behaviors, delayed communication, and deficits in social interactions. Furthermore, the authors showed that the deficits could be reversed by administering a highly selective 5-HT4 agonist, prucalopride, during critical periods of neurodevelopment, which normalized enteric neuronal numbers in the SERT Ala56 mice and alleviated some of the social deficits.
The goal of this work is to explore more deeply the possible factors that connect gut concentration of serotonin, SERT expression, and ENS size. This is achieved through a mathematical model aimed at reproducing key features of the experiment conducted by [13]. The model is used to identify three key factors that can affect the relationship between serotonin and the ENS. A possible scaling of these results from mice to humans is proposed, followed by simulations that take into account changes in serotonin production that have been observed in neurotypical children compared to children with ASD. A discussion of possible connections between hypoplastic ENS and its impact on the brain, as well as possible implications of this hypothesis, concludes this work.
2. Methods
For the purposes of reproducing qualitatively the relationships described in the experiment by [13], consider a 2-dimensional model that describes the dynamics of serotonin in the gut Sg(t) and its impact on the development of the enteric nervous system N(t). Assume that there exists a normal gut serotonin synthesis rate S0, and that Sg is cleared from the gut at a SERT-receptor-independent rate sout; clearance rate can also be increased as a function of SERT receptor and is accounted for by parameter sert.
The enteric nervous system N(t) is assumed to increase proportionally to the Sg that remains in the gut proportionally to the amount of available serotonin per volume of N according to saturating function , where parameter kn represents the rate of conversion of gut serotonin into ENS volume, capturing the overall effect of gut serotonin as a growth factor, as indicated by the experiments of [13]. Assume also that the ENS can become pruned over time at some rate , since it cannot grow indefinitely.
The resulting system of equations becomes
Parameters used in the simulations are summarized in Table A1. Values were chosen to qualitatively capture the experimentally observed behavior and do not necessarily represent physiological values.
3. Results
3.1. Reproducing the Qualitative Relationship between Gut Serotonin, ENS Size, and Serotonin Clearance in Mice
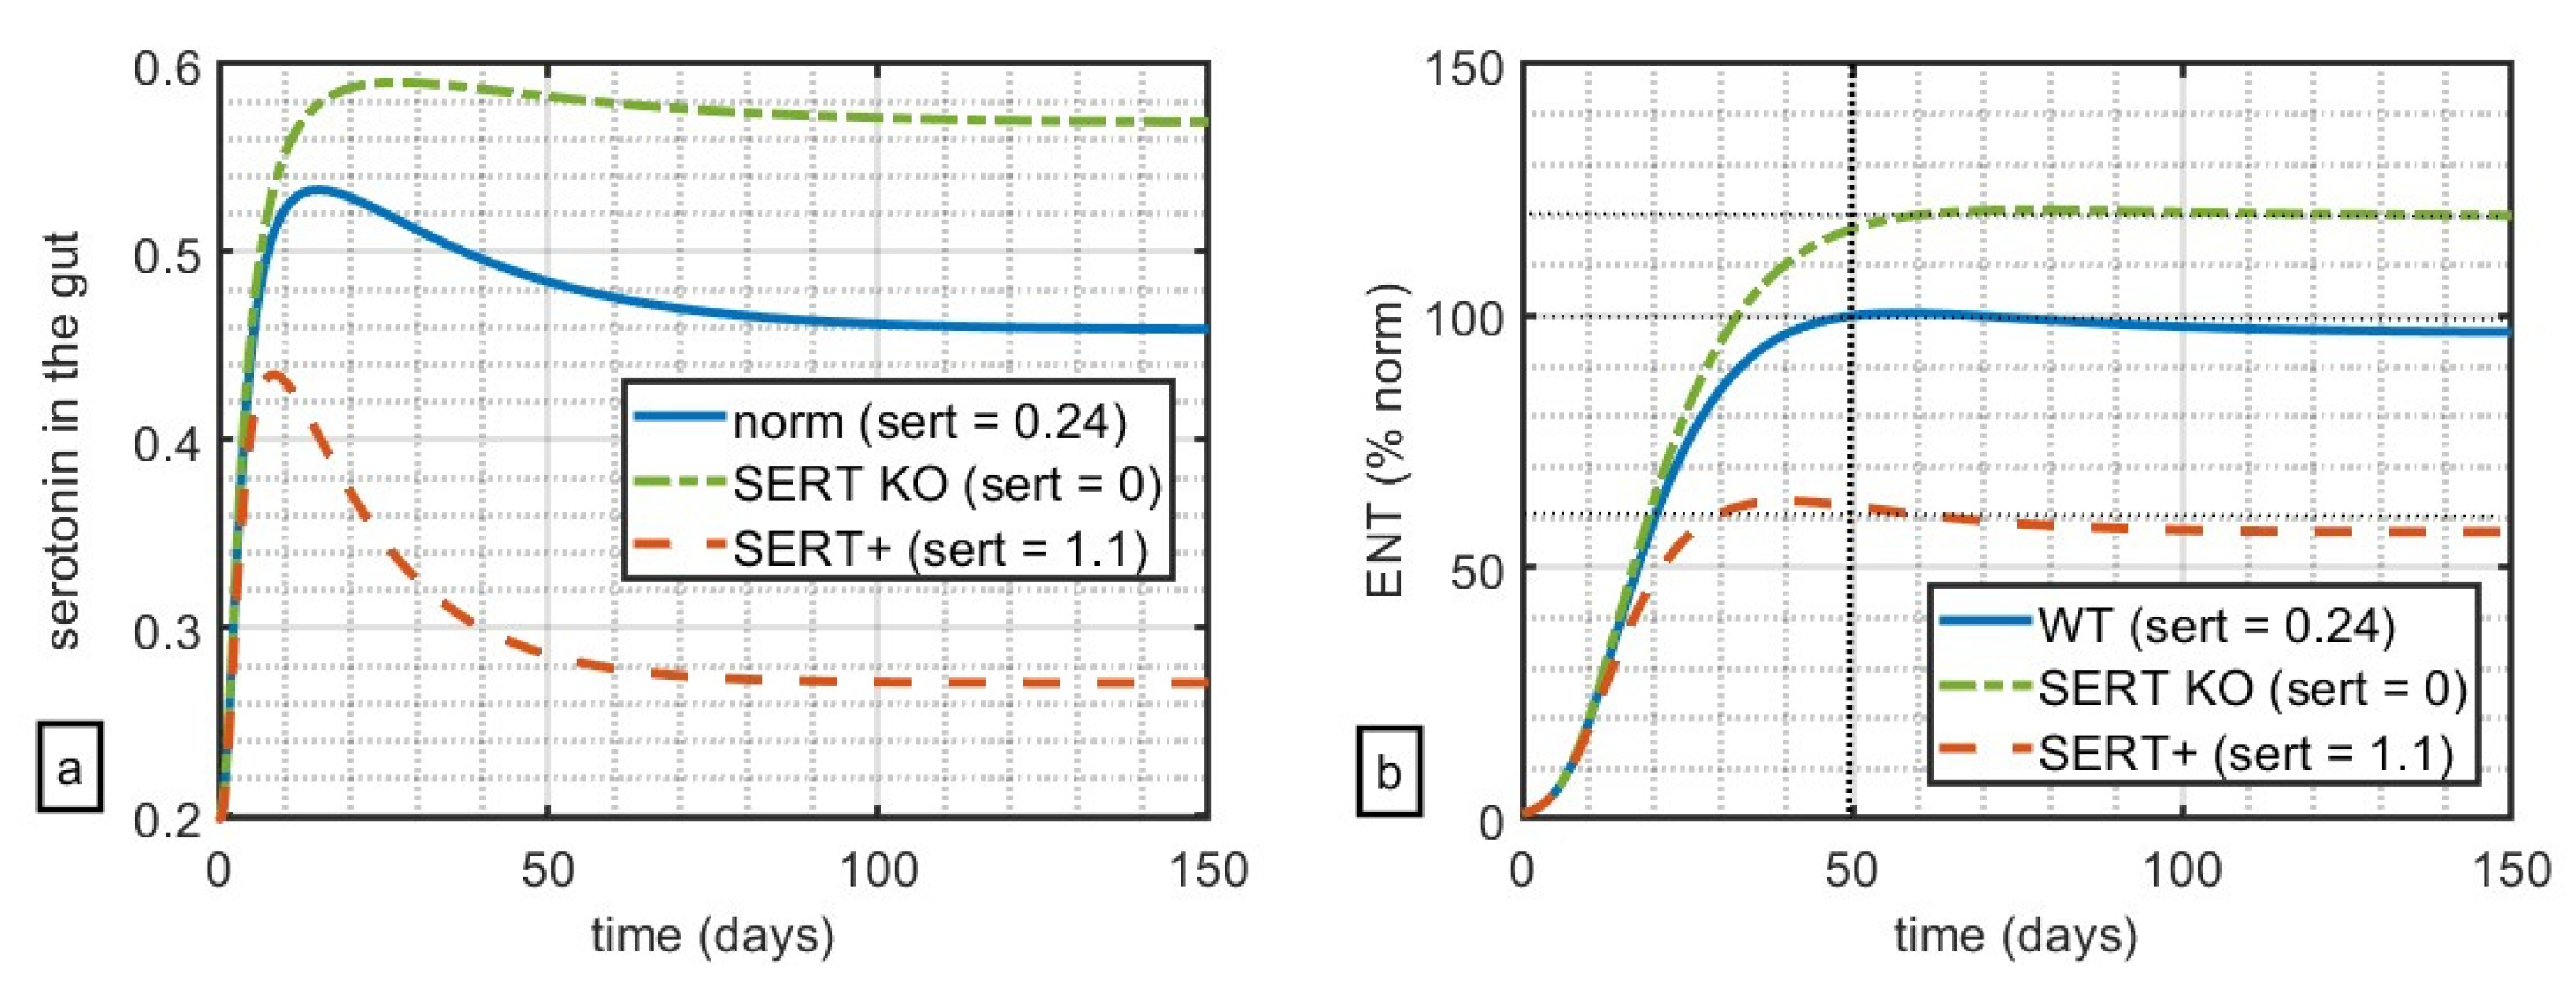
Firstly, we want to qualitatively reproduce the reported relationship between serotonin in the gut, SERT receptor expression, and relative size of the ENS at approximately t = 50 d (mice in [13] were examined at 6–8 weeks). Parameter values used in the simulations can be found in Table 1. Notably, since the goal of this work is to capture the qualitative rather than quantitative dynamics, these values were chosen to phenomenologically reproduce the qualitative results of the original experiment and do not necessarily represent exact physiological values. In Figure 1, the simulation was run for 150 days, depicting the 3 cases for SERT expression: KO (value of parameter sert = 0), WT (sert = 0.24), and Ala56, also notated as SERT+ (sert = 1.1). The values of parameter sert were chosen in such a way as to capture 100% ENS as the norm (WT), 120% ENS relative to norm for KO, and 60% ENS relative to the norm for SERT+ at t = 50 d as reported in Figure 1a,b and Figure 2A,E in [13].
These simulations suggest that, in this model, variation of the parameters of SERT-mediated clearance alone can qualitatively capture the key feature of serotonin-ENS-SERT relationships reported in [13]. Notably, in the original experiment, the authors measure the impact of serotonin and its clearance on both the myenteric plexus (which increases the tone of the gut and the velocity and intensity of contractions) and the submucosal plexus (which controls local secretion, absorption, and muscle movements). The authors reported similar results for both submucosal and myenteric plexuses; the choice was made to calibrate the model against the data reported in favour of the less noisy data set reported for the submucosal plexus.
3.2. Translating Model Dynamics from Mouse to Human
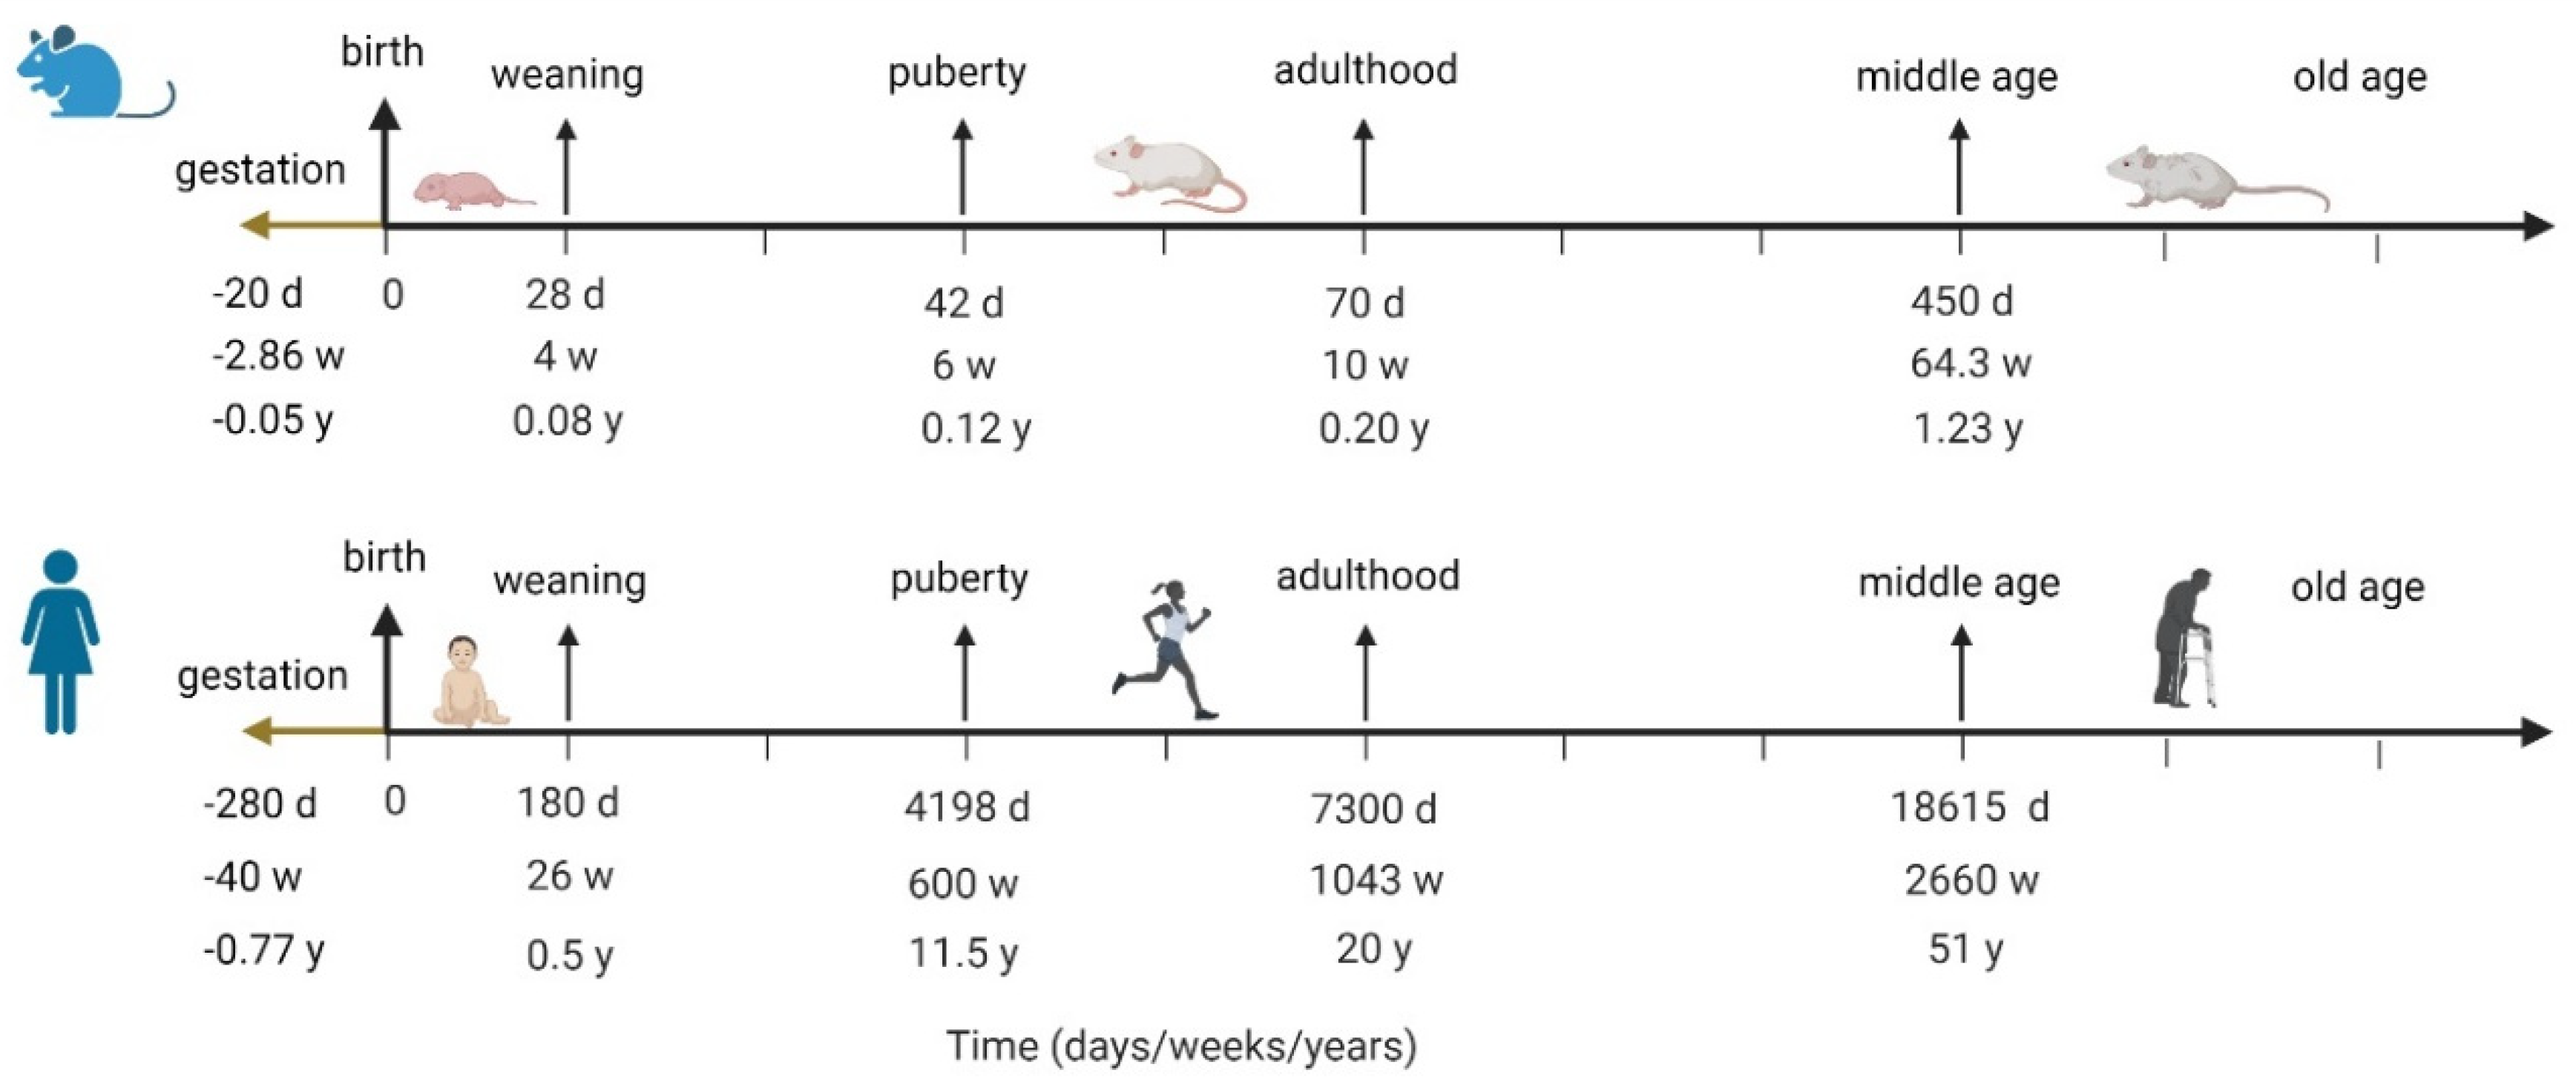
Of course, the question of inter-species translatability is always critical for extrapolating any insights from animal models into humans. Before this question can be addressed, it is important to understand how the mouse lifespan maps onto the human lifespan, since ASD is typically diagnosed in children before 5 years of age. Instead of assuming that each mouse day has a uniform conversion to a human day throughout the animal’s lifespan, it is more instructive to align the two lifespans by key developmental milestones, from gestation, to weaning, to puberty, to adulthood, and into old age, as has been done by Dutta et al. [16]. Figure 2 visualizes the analysis done in [16], aligning mouse and human lifespans by developmental milestones.
Margolis et al. [13] report data that was collected in mice at 6–8 weeks, which, according to the mapping in Figure 2, corresponds to humans of about 11–13 years of age. It is unknown if these animals exhibited ASD-like behaviors around week 5, which would be closer to the human age of around 5 years old, by which time we would already observe ASD-like behavior, although it is possible. If these relationships indeed translate, and if the relative size of the ENS is indeed correlated with an ASD-like phenotype, then the differences in the ENS would be observed by age 5. The model for projected human analysis is therefore re-parametrized to capture similar relationships between ENS size for non-ASD (parametrized to 100%) vs. ASD children by t = 5 years, with the understanding that it is possible for ASD symptoms to manifest much earlier.
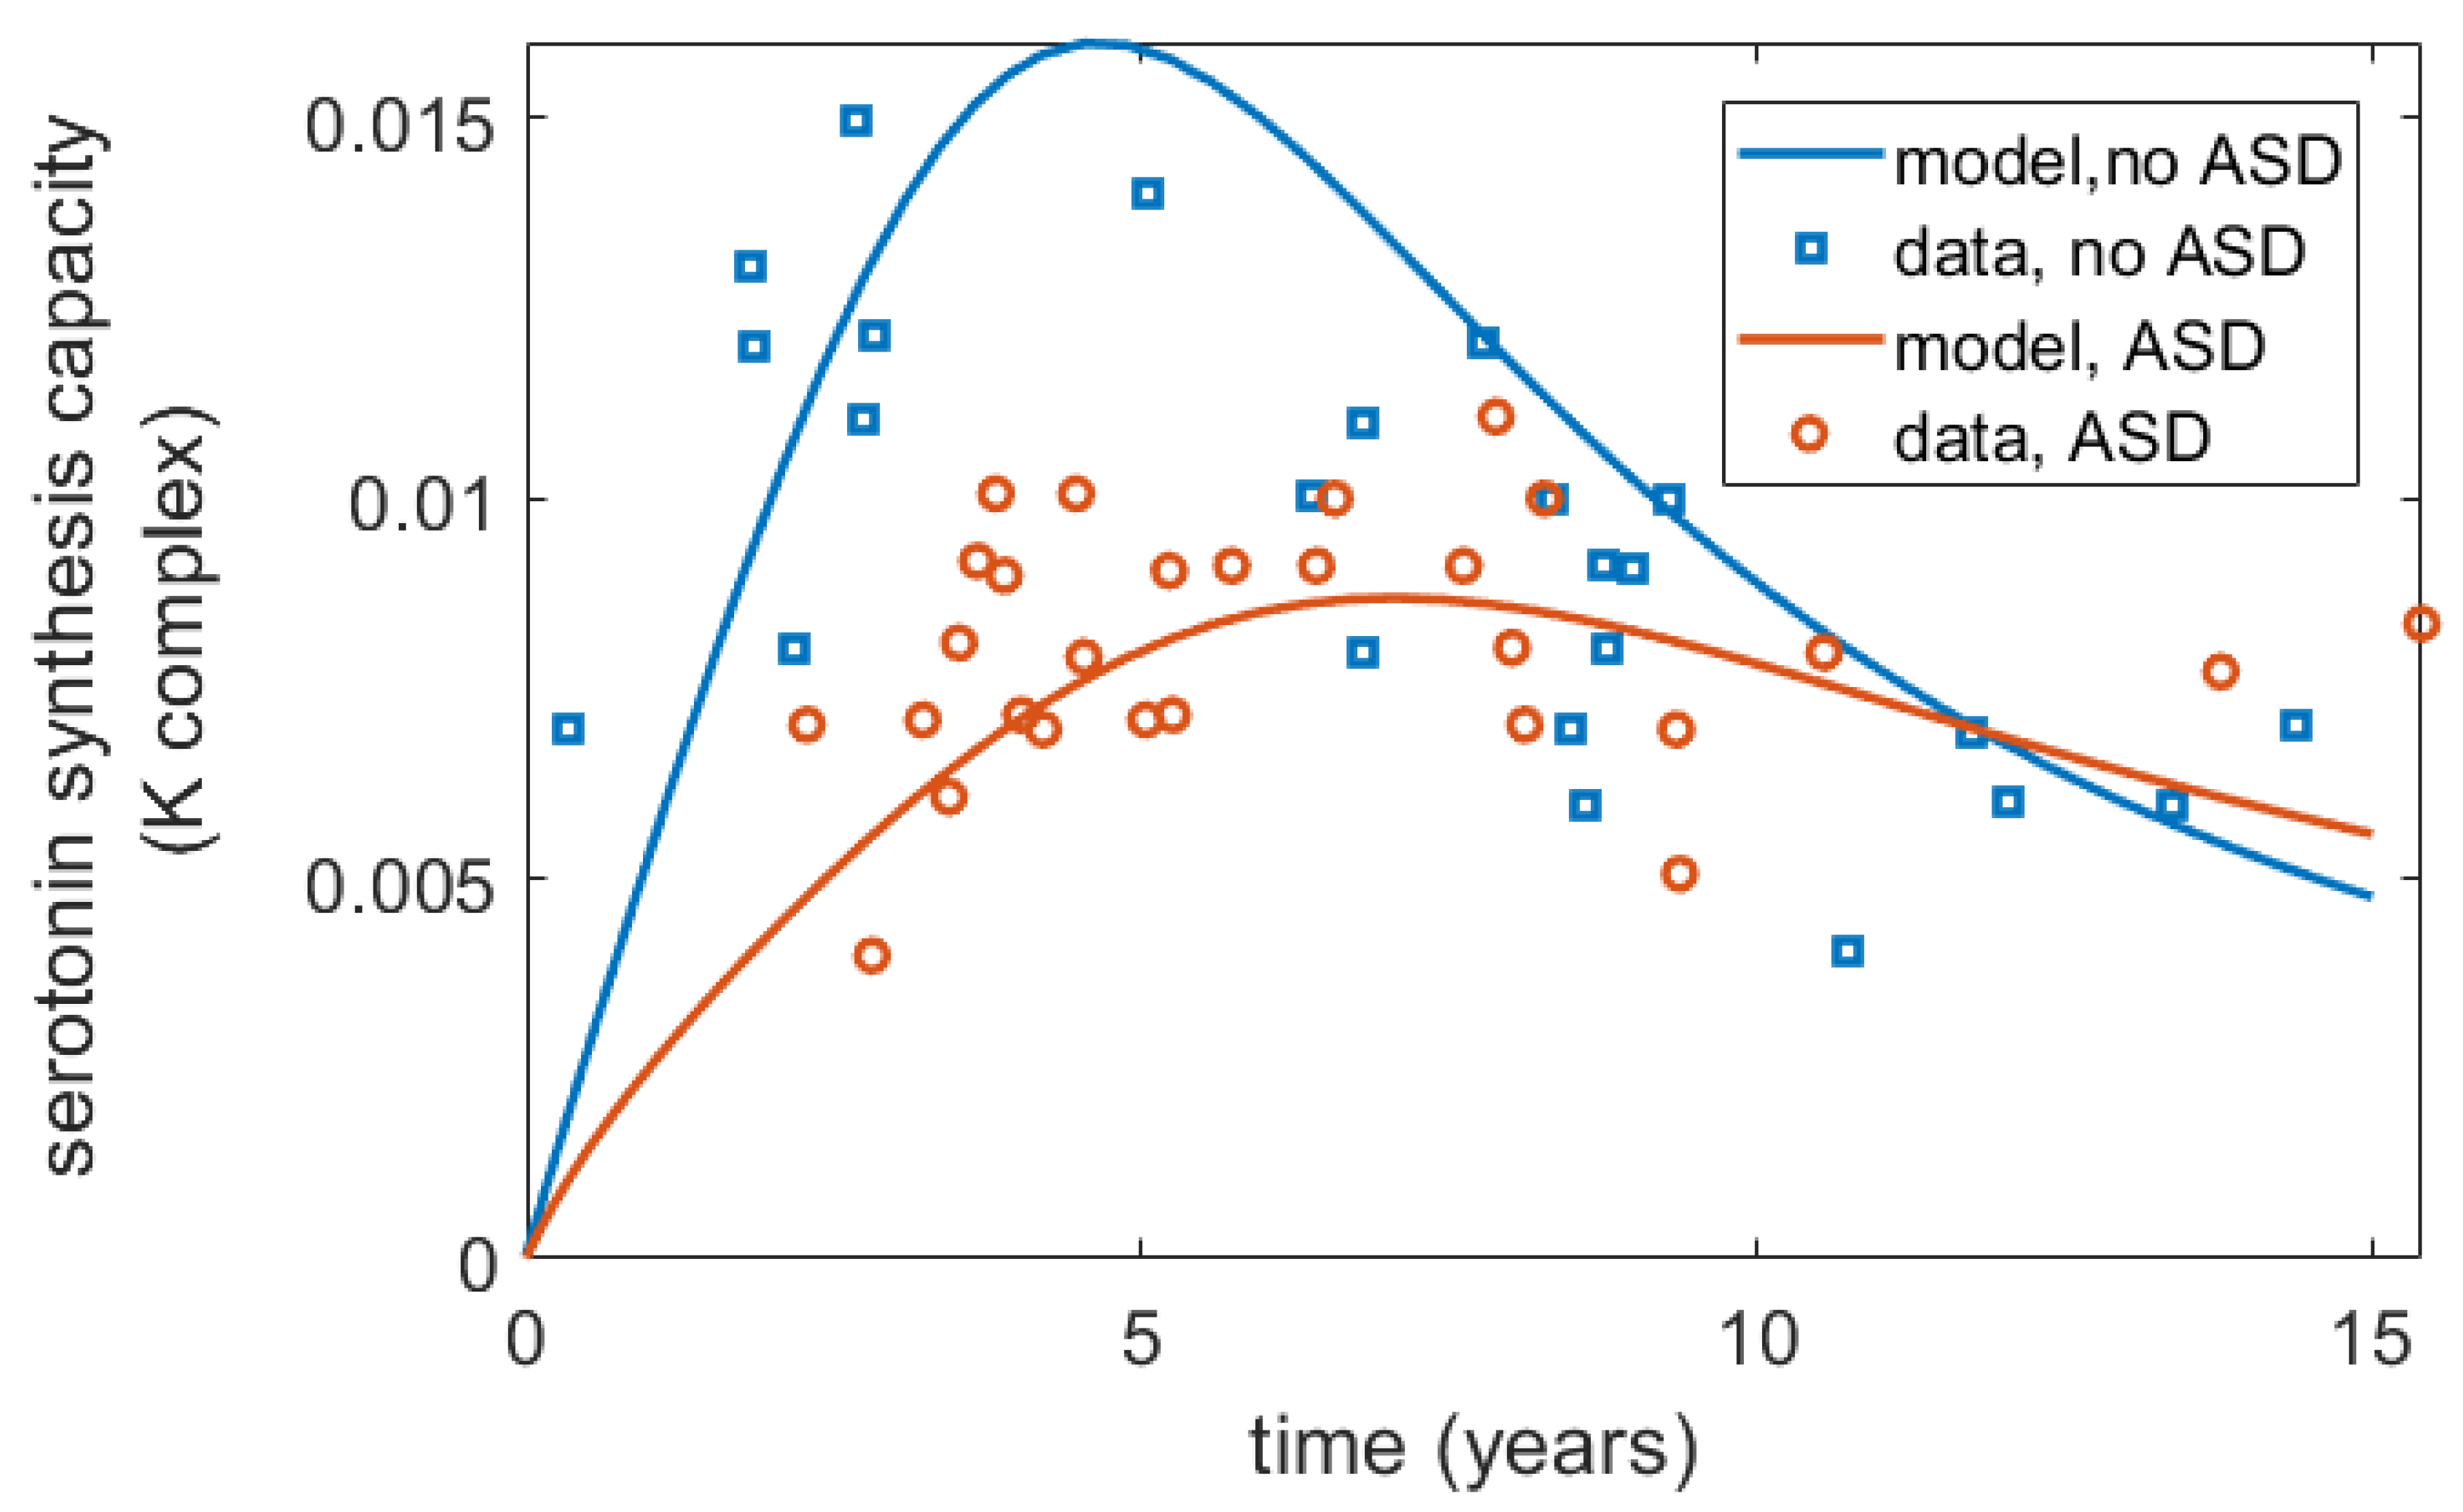
Furthermore, interestingly, Chugani et al. [17] reported differences in the serotonin synthesis capacity in ASD vs. non-ASD children, showing that for non-autistic children, serotonin synthesis capacity increased more sharply and to higher values in early life but declined towards adult values after 5 years of age, while in autistic children, it increased more gradually until 15 years of age but did not decline as much as it did for non-ASD children. Within the frameworks of the proposed model, these differences can be captured as a term for serotonin production, with the assumption that at least the pattern of relative differences in serotonin synthesis capacity reported in Chugani et al. [17] mirrors that of serotonin synthesis in the gut, a hypothesis that requires further experimental validation. A mathematical expression to describe change in serotonin synthesis for ASD and non-ASD children is described in Appendix B. The projected serotonin dynamics over time for ASD and non-ASD children using this function are shown in Figure 3.
4. Impact of Individual Mechanisms on the ENS
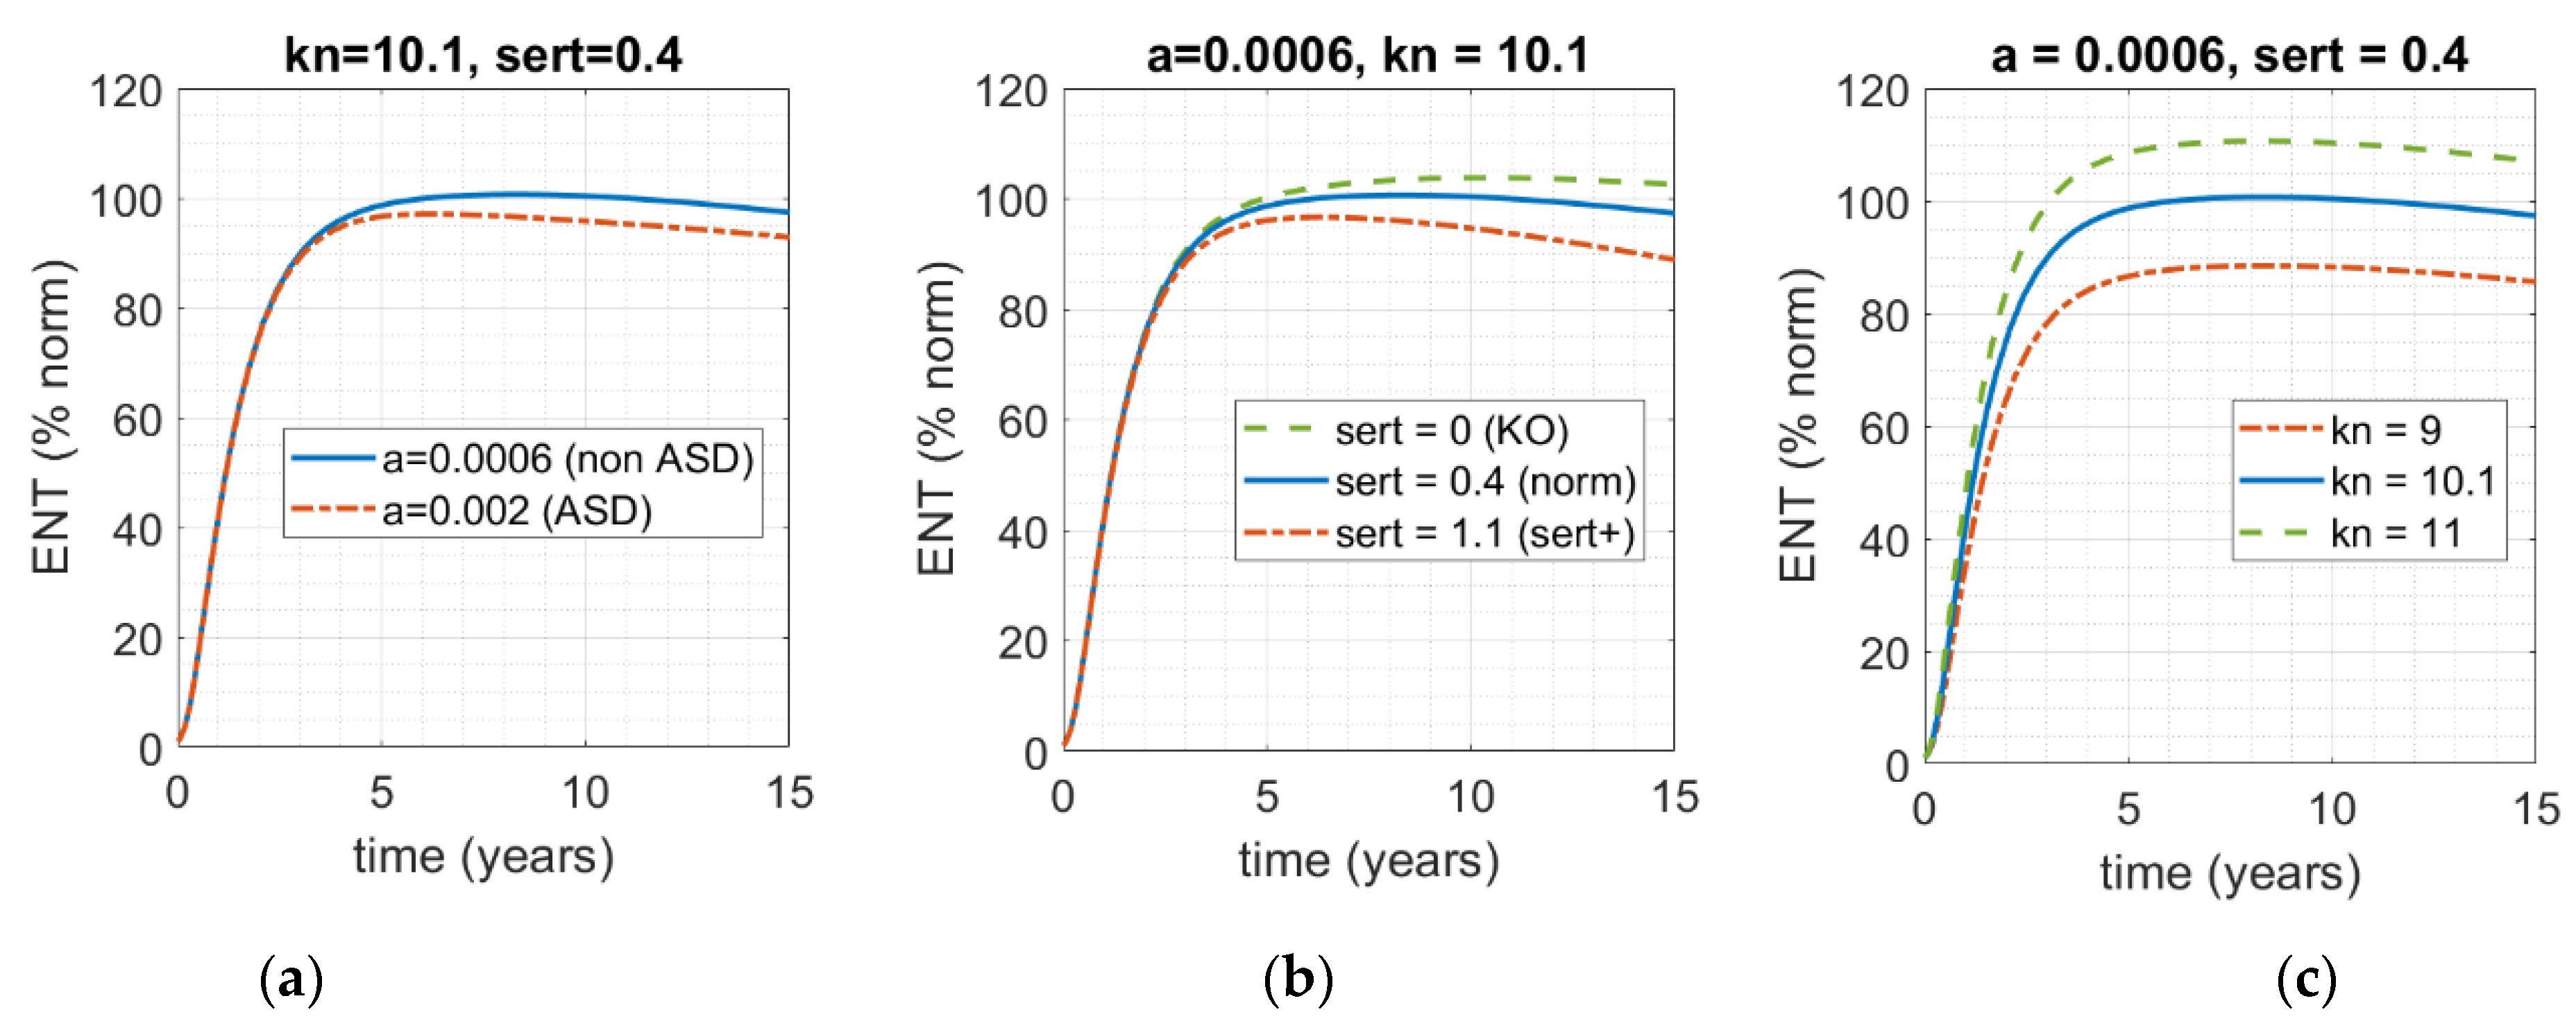
It can be seen from the model, and predicted intuitively, that in addition to serotonin production (here captured by parameter a in Equations (A1) and (A2) in the Appendix A) there are two other key components that could qualitatively affect ENS size: firstly, serotonin clearance through activity of SERT, drugs, or any other receptor that is involved in the clearance of serotonin from the gut, preventing it from acting as a growth factor (here captured as parameter sert); and secondly, the rate of ENS growth as a function of serotonin (here captured by parameter kn in Equation (A1) in the Appendix A). In Figure 4, all three factors are varied to assess their relative impact on ENS size relative to the norm (blue, solid) by time = 5 years, including the dynamic human serotonin production function from Figure 3.
As one can see in Figure 4, while all three of these factors can affect the size of the ENS by t = 5 years, and while each of them can certainly contribute to the deviation of ENS size from 100%, neither in this range can solely drive the ENS into the 60% range, which would have corresponded to ENS size for the ASD phenotype in the work of Margolis et al. [13]. Given the complexity of this condition and its heterogeneity, even for this subset of phenotypes, it is most likely that it is a combination of these factors that would result in the critical phenotype. That is, it is most likely that that there is intrinsic population variability with respect to each of these parameters, and it is a combination of the three rather than a single one that translates into ENS hypoplasia of sufficient severity to manifest in an ASD-like phenotype.
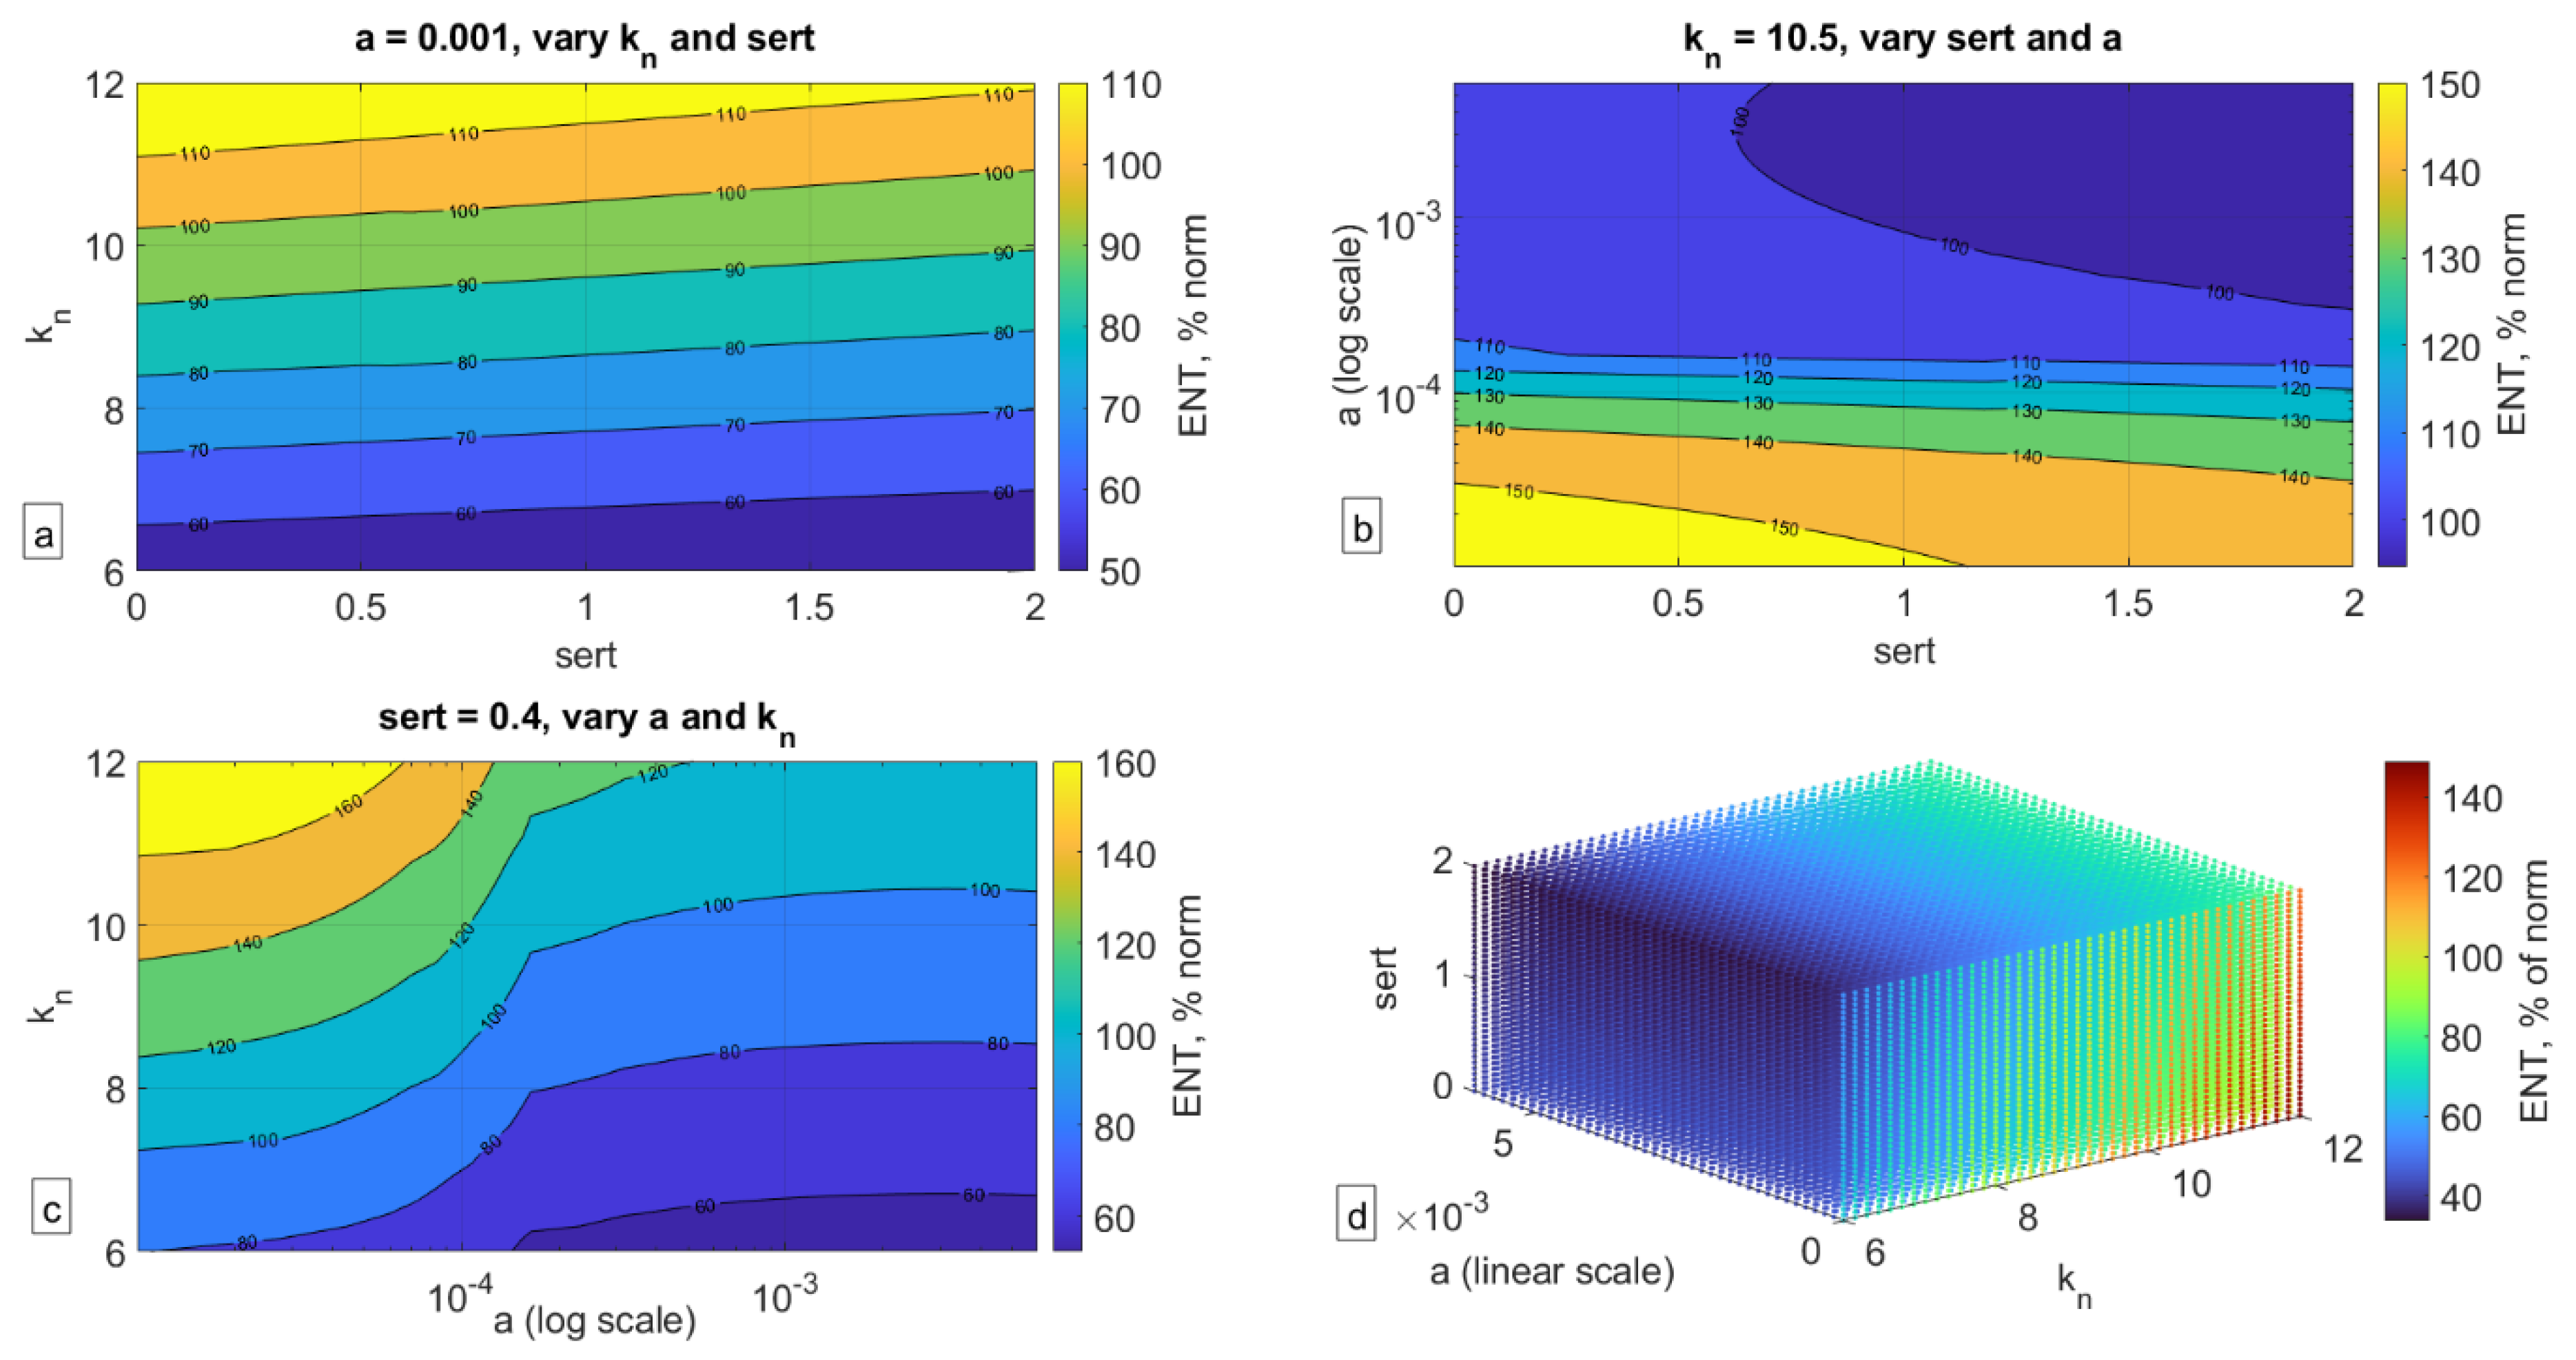
To assess the impact of the combination of these factors, we carried out a parameter sweep over these three properties—sert (rate of SERT-mediated serotonin uptake in the gut), kn (rate of serotonin-mediated ENS growth), and a (rate of serotonin production over time in the gut)—and recorded the corresponding size of the ENS relative to the norm at t = 5 years (Figure 5).
As can be seen in Figure 5, a confluence of factors can indeed significantly affect the size of the ENS (here collected at t = 5 years old), more so than each individual factor by itself. As can be seen in Figure 5a, even when serotonin production (parameter a) is fixed, a low rate of serotonin-mediated ENS growth (parameter kn) or high rate of SERT activity (sert) can result in significantly lower ENS size. In Figure 5b, one can see that when kn is fixed, it is the rate of serotonin production rather than SERT expression that determines ENS size. In Figure 5c, fixing sert shows that kn is more important when a is high to ensure normal ENS size but is less impactful for low values of a. Finally, in Figure 5d, one can see the impact of the confluence of all three of these factors, and their relationship with each other as they translate into ENS size. It is possible that if there is indeed a mechanistic link between ENS size and ASD phenotype, then the dynamics reported in Figure 5d may be a reflection of the ASD spectrum, with ENS size relative to the norm potentially reflecting the degree of severity of the condition. This hypothesis of course remains to be rigorously evaluated.
5. Discussion
This work describes a mathematical model that qualitatively captures results reported by Margolis et al. [13], where the authors showed that, at least in Ala56 mice, who overexpress SERT receptors and who exhibit behaviors that broadly align with core diagnostic features of ASD, hypoplastic ENS as a result of increased activity of SERT in the gut is predictive of ASD phenotype. The authors also show that pharmacological interventions that compensate for overexpression of SERT can restore ENS size even in Ala56 mice, and these animals have improvements in behavioral patterns, suggesting that ENS hypoplasia may have a causal link for at least a subset of ASD phenotypes.
Scaling the model from mouse to human suggested that alterations in SERT expression alone may be insufficient to result in ENS hypoplasia and instead there exist three key mechanisms that affect this process: rate of serotonin synthesis, rate of serotonin clearance from the gut (such as through SERT receptors), and rate of serotonin-mediated ENS growth. Assuming inter-individual variability with respect to these parameters, conducting a simulation that varies all three of these factors revealed that one can generate a “spectrum” of projected ENS size, which can perhaps be correlated to ASD severity, an intriguing hypothesis that requires empirical verification.
Interestingly, in the recent work by Chang et al. [18], the authors analyzed genetic factors that may account for ASD in multiplex families, i.e., families, where more than one child has ASD. The authors analyzed whole genome sequences of over four thousand people, including both autistic and non-autistic children, calculating a weighted sum of common variants linked to ASD, or the “polygenetic risk score”. The authors showed that children with ASD with rare inherited variants of genes that are linked to autism had higher scores than would have been expected if they inherited the variant from a non-autistic parent. The authors suggested that autism inheritance follows a “threshold model”, where a combination of rare and common variants increase the chances of an ASD diagnosis. Within the framework of this analysis, one can hypothesize that the three key classes of mechanisms identified by the model may reflect a subset of such combinations of rare and common genetic factors, and specifically variations in serotonin production, clearance, and impact on the ENS, and it is their confluence that could result in ASD phenotypes that are mechanistically linked to ENS hypoplasia. Interestingly, studies have shown an elevated incidence of ASD in children of mothers who took SSRIs during pregnancy, which seems to contradict results reported by [13], who report that in Ala56 mice, the administration of SSRIs during pregnancy compensated for excessive activity of SERT and thus mitigated the effects of overexpressed SERT on the ENS. It is possible that this effect is a confounder: if the mother has serotonin-mediated depressive symptoms, she may already pass along the genetic variant that may pre-dispose the fetus to ASD; it is also possible that, in addition, there may be an environment where fetal exposure to serotonin during development is decreased (such as has been observed for prenatal exposure to nutrient limitations, for example [19]), potentially contributing to ENS hypoplasia. If that is the case, then it is the association between parental depression, which may be genetic on both sides, necessitating SSRI administration even during pregnancy, and not the SSRIs themselves, that may be revealed by these observations. While some studies suggest that the odds of an ASD diagnosis are indeed higher among children whose mothers had a lifetime history of bipolar disorder or depression [20], this hypothesis remains to be evaluated more thoroughly to determine the impact of relevant confounders.
Potential Mechanistic Link between ENS Hypoplasia and the CNS
Of course, an important link that is still unclear is how hypoplastic ENS translates into effects on the CNS. The vagus nerve (VN) is the primary link between the ENS and CNS, consisting of afferent VN fibers going “up” from the intestinal wall to the brain and accounting for 90% of all VN fibers, and the remaining 10% of efferent VN fibers going “down” from the brain to the gut. Afferent VN fibers impact signals relating to inflammation, satiety, and energy metabolism, while efferent VN nerves affect secretion of gastric acid and digestive enzymes, as well as gastric capacity [21]. Some studies have suggested that vagus nerve stimulation (VNS) may be a promising adjuvant therapy for ASD and other neurodevelopmental disorders [22].
Additionally, mitochondrial dysfunction and impaired energy metabolism may be observed in ASD patients [23,24]. Given that the brain accounts for nearly a fifth of the body’s metabolic demands, and that neurons depend on oxidative phosphorylation, impairments in mitochondrial function would make a developing brain uniquely susceptible to neurodegenerative disorders [24]. Interestingly, it appears that children prenatally exposed to valproic acid (VPA), a medication used for epilepsy and mood swings, might have an increased likelihood of being diagnosed with autism [25,26,27], and that VPA may promote mitochondrial dysfunction at least in primary human hepatocytes in vitro [28]. Finally, Liu et al. [29] have shown that VPA administration during pregnancy in a rat model additionally affected gut microbiota, with prenatal exposure to VPA mimicking not only anatomical and behavioral aspects of an autistic brain but also its microbiota.
Gut microbiota has also been a focus of intense study in the ASD field. Desbonnet et al. [30] reported that germ-free mice tend to exhibit atypical social behaviors, including avoidance of social interactions and excessive grooming. Some bacterial pathogens, such as Clostridia, Bacteriodetes, and Desulfovibrio, produce propionic acid, which interferes with serotonin synthesis in the gut [31]; other bacteria species have been reported to differ in gut microbiota between autistic and non-autistic children as well [32]. Impaired metabolism of tryptophan, a precursor to serotonin, has also been reported to be associated with an autistic phenotype [33,34,35].
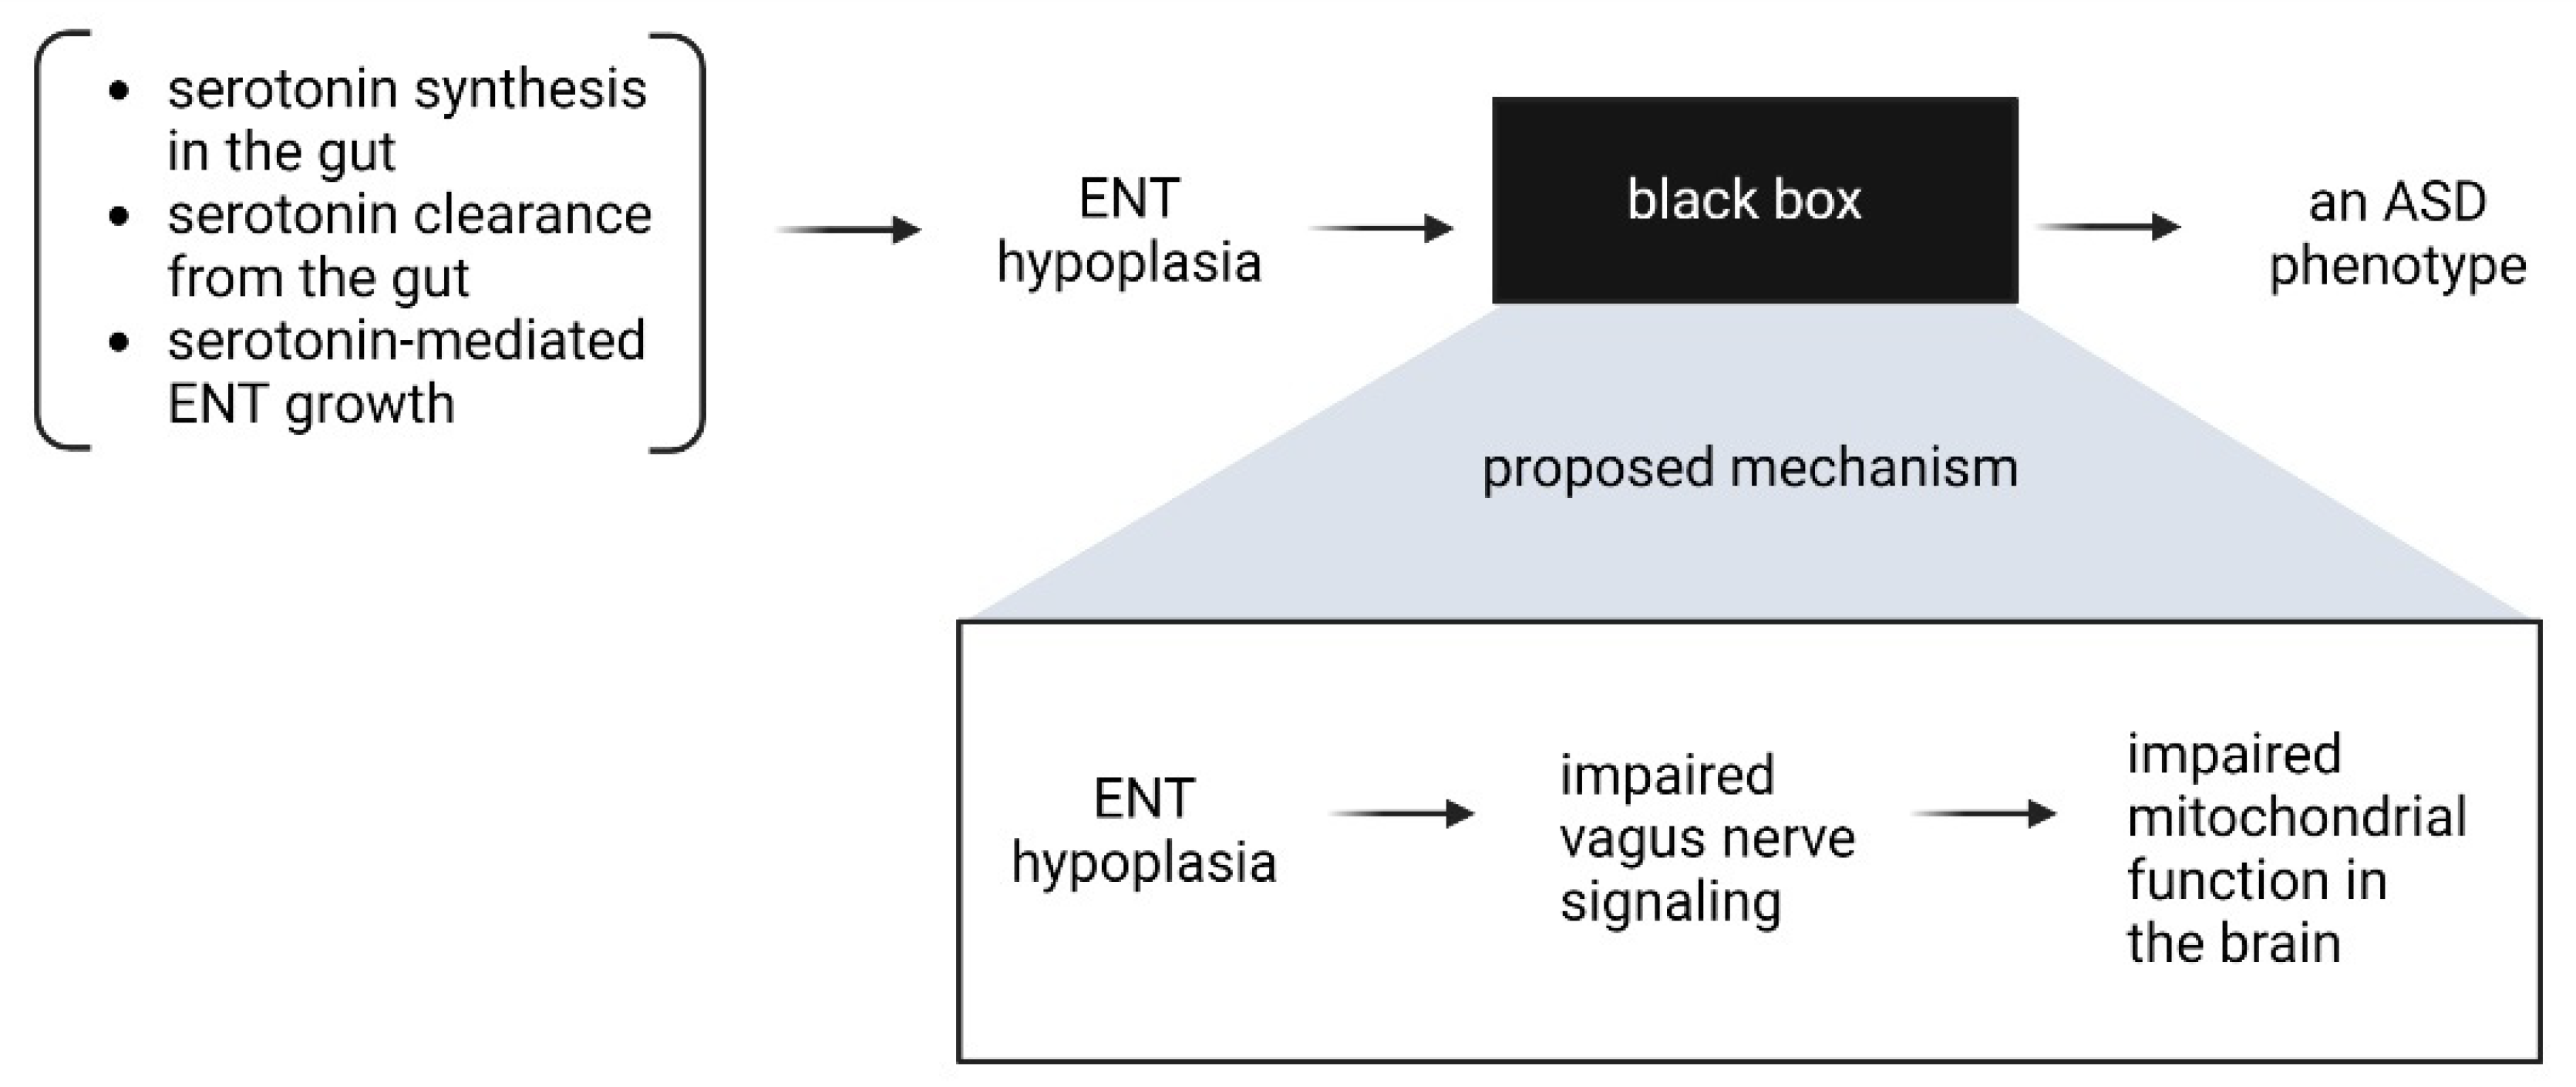
Together, these observations suggest that the link between the ENS and CNS perhaps lies in the ability of the vagus nerve to support energy and mitochondrial metabolism in the brain, and a hypoplastic ENS, which occurs because of a combination of factors affecting serotonin’s function as a growth factor in the ENS, may provide insufficient signaling and thereby affect neurological function. These considerations are summarized in Figure 6.
Interestingly, transcranial photobiomodulation has been investigated as a possible therapy for ASD [36,37], which is hypothesized to work through improving mitochondrial function in the brain [38,39]; studies evaluating this hypothesis are ongoing [40].
The analysis presented here of course has limitations, including numerous assumptions of mechanism translatability between mice and humans with respect to the impact of serotonin on the ENS. Nevertheless, it does highlight the multi-factorial nature of ASD even within the framework of a simple two-dimensional mathematical model and provides a possible interpretation of the ASD spectrum as a function of ENS size relative to the norm. Further investigation of this hypothesis might involve the development of a genetic panel that focuses on possible genes that contribute to the three mechanisms described here, and then conducting a prospective trial to evaluate the predictive capacity of such a panel. A complementary analysis should be conducted to further elucidate connection between ENS size and its potential impact on metabolism and mitochondrial function in the brain. While genetic pre-disposition to ASD may not be amenable to change, early interventions aimed at mitigating and compensating for potential metabolic deficits in combination to already established behavioral therapy may improve quality of life both for children with ASD and their families.
Funding
This research received no external funding.
Institutional Review Board Statement
Not applicable.
Informed Consent Statement
Not applicable.
Data Availability Statement
Not applicable.
Acknowledgments
The author reports no external sources of funding. I.K. is an employee of EMD Serono, US business of Merck KGaA. Views expressed in this work are the author’s personal views and do not necessarily represent the views of EMD Serono.
Conflicts of Interest
The author declares no conflict of interest.
Appendix A
To capture the dynamics of serotonin synthesis capacity over time as described by [17], we propose a fully phenomenological function to capture these data where the constant serotonin synthesis rate in Equation A1 is replaced by the following expression:
where is systemic serotonin that increases over time. The varying parameter a is sufficient to reproduce the dynamics reported in Figure 3, Figure 4 and Figure 5 of the main text.

Table A1.
Parameters needed to describe serotonin synthesis capacity data for ASD and non-ASD children in the data reported by [17].
Table A1.
Parameters needed to describe serotonin synthesis capacity data for ASD and non-ASD children in the data reported by [17].
| Parameter | Mouse Value | Human Value |
|---|---|---|
| a | 0.02 | 0.002 for ASD, 0.0006 for non-ASD |
| b | 0.01 | 0.01 |
| c | 20 | a/(3 × 10−6) |
| d | 1 | 1 |
Appendix B
One can add qualitative drug dynamics for the SSRI fluoxetine, which compensates for hyperactivity of the SERT receptor, and prucalopride P(t), which increases serotonin production. A phenomenological depiction of how these mechanisms can be implemented in the proposed model are given below:
Table A2.
Additional parameters to describe qualitative drug dynamics and their impact on the ENS as reported in [13]. The values reported in this table capture the quanlitative dynamics of these drugs and are not calibrated for quantitative analysis.
Table A2.
Additional parameters to describe qualitative drug dynamics and their impact on the ENS as reported in [13]. The values reported in this table capture the quanlitative dynamics of these drugs and are not calibrated for quantitative analysis.
| Parameter | Description | Sample Value |
|---|---|---|
| SSRI fluoxetine | ||
| ks01 | Drug absorption rate into the site of action | 0.1 |
| ks10 | Drug impact on serotonin clearance | 0.12 |
| Prucalopride | ||
| kp01 | Drug absorption rate into the site of action | 0.1 |
| kp10 | Drug impact on serotonin production | 0.05 |
References
- Posar, A.; Resca, F.; Visconti, P. Autism according to diagnostic and statistical manual of mental disorders 5th edition: The need for further improvements. J. Pediatr. Neurosci. 2015, 10, 146. [Google Scholar] [CrossRef] [PubMed] [Green Version]
- Vahia, V.N. Diagnostic and statistical manual of mental disorders. Am Psychiatr. Assoc. 2013, 21, 591–643. [Google Scholar]
- Colvert, E.; Tick, B.; McEwen, F.; Stewart, C.; Curran, S.R.; Woodhouse, E.; Gillan, N.; Hallett, V.; Lietz, S.; Garnett, T.; et al. Heritability of autism spectrum disorder in a UK population-based twin sample. JAMA Psychiatry 2015, 72, 415–423. [Google Scholar] [CrossRef] [PubMed] [Green Version]
- Tick, B.; Bolton, P.; Happé, F.; Rutter, M.; Rijsdijk, F. Heritability of autism spectrum disorders: A meta-analysis of twin studies. J. Child Psychol. Psychiatry 2016, 57, 585–595. [Google Scholar] [CrossRef] [PubMed] [Green Version]
- McElhanon, B.O.; McCracken, C.; Karpen, S.; Sharp, W.G. Gastrointestinal Symptoms in Autism Spectrum Disorder: A Meta-analysis. Pediatrics 2014, 133, 872–883. [Google Scholar] [CrossRef] [PubMed] [Green Version]
- Muller, C.; Anacker, A.; Veenstra-VanderWeele, J. The serotonin system in autism spectrum disorder: From biomarker to animal models. Neuroscience 2016, 321, 24–41. [Google Scholar] [CrossRef] [PubMed] [Green Version]
- Gabriele, S.; Sacco, R.; Persico, A.M. Blood serotonin levels in autism spectrum disorder: A systematic review and meta-analysis. Eur. Neuropsychopharmacol. 2014, 24, 919–929. [Google Scholar] [CrossRef] [PubMed]
- Hranilović, D.; Bujas-Petković, Z.; Vragovic, R.; Vuk, T.; Hock, K.; Jernej, B. Hyperserotonemia in Adults with Autistic Disorder. J. Autism Dev. Disord. 2006, 37, 1934–1940. [Google Scholar] [CrossRef]
- Banskota, S.; Ghia, J.-E.; Khan, W.I. Serotonin in the gut: Blessing or a curse. Biochimie 2019, 161, 56–64. [Google Scholar] [CrossRef]
- Brenner, B.; Harney, J.T.; Ahmed, B.A.; Jeffus, B.C.; Unal, R.; Mehta, J.L.; Kilic, F. Plasma serotonin levels and the platelet serotonin transporter. J. Neurochem. 2007, 102, 206–215. [Google Scholar] [CrossRef] [Green Version]
- Hughes, F.B.; Brodie, B.B. The mechanism of serotonin and catecholamine uptake by platelets. J. Pharmacol. Exp. Ther. 1959, 127, 96–102. [Google Scholar] [PubMed]
- Mercado, C.P.; Kilic, F. Molecular Mechanisms of SERT in Platelets: Regulation of Plasma Serotonin Levels. Mol. Interv. 2010, 10, 231–241. [Google Scholar] [CrossRef] [PubMed]
- Margolis, K.G.; Li, Z.; Stevanovic, K.; Saurman, V.; Israelyan, N.; Anderson, G.M.; Snyder, I.; Veenstra-VanderWeele, J.; Blakely, R.D.; Gershon, M.D. Serotonin transporter variant drives preventable gastrointestinal abnormalities in development and function. J. Clin. Investig. 2016, 126, 2221–2235. [Google Scholar] [CrossRef] [PubMed] [Green Version]
- Li, Z.; Chalazonitis, A.; Huang, Y.Y.; Mann, J.J.; Margolis, K.G.; Yang, Q.M.; Kim, D.O.; Côté, F.; Mallet, J.; Gershon, M.D. Essential roles of enteric neuronal serotonin in gastrointestinal motility and the development/survival of enteric dopaminergic neurons. J. Neurosci. 2011, 31, 8998–9009. [Google Scholar] [CrossRef] [PubMed]
- Liu, M.-T.; Kuan, Y.-H.; Wang, J.; Hen, R.; Gershon, M.D. 5-HT4 Receptor-Mediated Neuroprotection and Neurogenesis in the Enteric Nervous System of Adult Mice. J. Neurosci. 2009, 29, 9683–9699. [Google Scholar] [CrossRef] [Green Version]
- Dutta, S.; Sengupta, P. Men and mice: Relating their ages. Life Sci. 2016, 152, 244–248. [Google Scholar] [CrossRef]
- Chugani, D.C.; Muzik, O.; Behen, M.; Rothermel, R.; Janisse, J.J.; Lee, J.; Chugani, H.T. Developmental changes in brain serotonin synthesis capacity in autistic and nonautistic children. Ann. Neurol. Off. J. Am. Neurol. Assoc. Child Neurol. Soc. 1999, 45, 287–295. [Google Scholar] [CrossRef]
- Chang, T.S.; Cirnigliaro, M.; Arteaga, S.A.; Pérez-Cano, L.; Ruzzo, E.K.; Gordon, A.; Bicks, L.; Jung, J.Y.; Lowe, J.K.; Wall, D.P.; et al. The Contributions of Rare Inherited and Polygenic Risk to ASD in Multiplex Families. medRxiv 2022. [Google Scholar] [CrossRef]
- Ravelli, A.C.; van der Meulen, J.H.; Michels, R.P.; Osmond, C.; Barker, D.J.; Hales, C.N.; Bleker, O.P. Glucose tolerance in adults after prenatal exposure to famine. Lancet 1998, 351, 173–177. [Google Scholar] [CrossRef]
- VVasa, R.A.; Anderson, C.; Marvin, A.R.; Rosenberg, R.; Law, J.K.; Thorn, J.; Sarphare, G.; Law, P.A. Mood Disorders in Mothers of Children on the Autism Spectrum Are Associated with Higher Functioning Autism. Autism Res. Treat. 2012, 2012, 435646. [Google Scholar] [CrossRef]
- Breit, S.; Kupferberg, A.; Rogler, G.; Hasler, G. Vagus Nerve as Modulator of the Brain–Gut Axis in Psychiatric and Inflammatory Disorders. Front. Psychiatry 2018, 9, 44. [Google Scholar] [CrossRef] [PubMed] [Green Version]
- Engineer, C.T.; Hays, S.A.; Kilgard, M.P. Vagus nerve stimulation as a potential adjuvant to behavioral therapy for autism and other neurodevelopmental disorders. J. Neurodev. Disord. 2017, 9, 20. [Google Scholar] [CrossRef] [PubMed] [Green Version]
- Lombard, J. Autism: A mitochondrial disorder? Med. Hypotheses 1998, 50, 497–500. [Google Scholar] [CrossRef] [PubMed]
- Valenti, D.; de Bari, L.; De Filippis, B.; Henrion-Caude, A.; Vacca, R.A. Mitochondrial dysfunction as a central actor in intellectual disability-related diseases: An overview of Down syndrome, autism, Fragile X and Rett syndrome. Neurosci. Biobehav. Rev. 2014, 46, 202–217. [Google Scholar] [CrossRef] [PubMed]
- Williams, G.; King, J.; Cunningham, M.; Stephan, M.; Kerr, B.; Hersh, J.H. Fetal valproate syndrome and autism: Additional evidence of an association. Dev. Med. Child Neurol. 2001, 43, 202–206. [Google Scholar] [CrossRef]
- Bescoby-Chambers, N.; Forster, P.; Bates, G. Foetal valproate syndrome and autism: Additional evidence of an association. Dev. Med. Child Neurol. 2001, 43, 847. [Google Scholar] [CrossRef]
- Christensen, J.; Grønborg, T.K.; Sørensen, M.J.; Schendel, D.; Parner, E.; Pedersen, L.H.; Vestergaard, M. Prenatal Valproate Exposure and Risk of Autism Spectrum Disorders and Childhood Autism. JAMA 2013, 309, 1696–1703. [Google Scholar] [CrossRef] [Green Version]
- Caiment, F.; Wolters, J.; Smit, E.; Schrooders, Y.; Kleinjans, J.; van den Beucken, T. Valproic acid promotes mitochondrial dysfunction in primary human hepatocytes in vitro; impact of C/EBPα-controlled gene expression. Arch. Toxicol. 2020, 94, 3463–3473. [Google Scholar] [CrossRef]
- Liu, F.; Horton-Sparks, K.; Hull, V.; Li, R.W.; Martínez-Cerdeño, V. The valproic acid rat model of autism presents with gut bacterial dysbiosis similar to that in human autism. Mol. Autism 2018, 9, 61. [Google Scholar] [CrossRef] [Green Version]
- Desbonnet, L.; Clarke, G.; Shanahan, F.; Dinan, T.G.; Cryan, J.F. Microbiota is essential for social development in the mouse. Mol. Psychiatry 2014, 19, 146–148. [Google Scholar] [CrossRef] [Green Version]
- Macfabe, D.F. Short-chain fatty acid fermentation products of the gut microbiome: Implications in autism spectrum disorders. Microb. Ecol. Health Dis. 2012, 23, 19260. [Google Scholar] [CrossRef]
- Kang, D.-W.; Park, J.G.; Ilhan, Z.E.; Wallstrom, G.; LaBaer, J.; Adams, J.B.; Krajmalnik-Brown, R. Reduced Incidence of Prevotella and Other Fermenters in Intestinal Microflora of Autistic Children. PLoS ONE 2013, 8, e68322. [Google Scholar] [CrossRef] [Green Version]
- Golubeva, A.V.; Joyce, S.A.; Moloney, G.; Burokas, A.; Sherwin, E.; Arboleya, S.; Flynn, I.; Khochanskiy, D.; Moya-Pérez, A.; Peterson, V.; et al. Microbiota-related changes in bile acid & tryptophan metabolism are associated with gastrointestinal dysfunction in a mouse model of autism. EBioMedicine 2017, 24, 166–178. [Google Scholar]
- Stevenson, R.; Bochner, B.; Jones, K.; McCartney, H.; Skinner, C.; Pittman, A.; Chen, C.; Boccuto, L.; Charles, S. Decreased tryptophan metabolism in patients with autism spectrum disorders. Mol. Autism 2013, 4, 16. [Google Scholar]
- Gao, K.; Mu, C.-L.; Farzi, A.; Zhu, W.-Y. Tryptophan Metabolism: A Link Between the Gut Microbiota and Brain. Adv. Nutr. Int. Rev. J. 2020, 11, 709–723. [Google Scholar] [CrossRef] [PubMed]
- Machado, C.; Machado, Y.; Chinchilla, M.; Machado, Y. Follow-up assessment of autistic children 12 months after finishing low lever laser therapy. Internet J. Neurol. 2019, 21, 1–8. [Google Scholar]
- Leisman, G.; Machado, C.; Machado, Y.; Chinchilla-Acosta, M. Effects of Low-Level Laser Therapy in Autism Spectrum Disorder. Clin. Med. Res. 2018, 1116, 111.–130. [Google Scholar]
- Wong-Riley, M.T.; Liang, H.L.; Eells, J.T.; Chance, B.; Henry, M.M.; Buchmann, E.; Kane, M.; Whelan, H.T. Photobiomodulation directly benefits primary neurons functionally inactivated by toxins: Role of cytochrome c oxidase. J. Biol. Chem. 2005, 280, 4761–4771. [Google Scholar] [CrossRef] [PubMed] [Green Version]
- Mochizuki-Oda, N.; Kataoka, Y.; Cui, Y.; Yamada, H.; Heya, M.; Awazu, K. Effects of near-infra-red laser irradiation on adenosine triphosphate and adenosine diphosphate contents of rat brain tissue. Neurosci. Lett. 2002, 323, 207–210. [Google Scholar] [CrossRef] [PubMed]
- Ceranoglu, T.; Hoskova, B.; Cassano, P.; Biederman, J.; Joshi, G. T65. Efficacy of Transcranial Near-Infrared Light Treatment in ASD: Interim Analysis of an Open-Label Proof of Concept Study of a Novel Approach. Biol. Psychiatry 2019, 85, S153–S154. [Google Scholar] [CrossRef]
Figure 1.
Impact of relative levels of SERT expression on (a) simulated serotonin in the gut and (b) size of the ENS relative to WT. At t = 50 days, WT mice had 100% ENS, with SERT KO mice at 120% of ENS, and SERT+ mice at 60% ENS relative to WT.
Figure 1.
Impact of relative levels of SERT expression on (a) simulated serotonin in the gut and (b) size of the ENS relative to WT. At t = 50 days, WT mice had 100% ENS, with SERT KO mice at 120% of ENS, and SERT+ mice at 60% ENS relative to WT.

Figure 2.
Aligning human and mouse lifespans by developmental milestones; the figure visualizes analysis done by Dutta et al. in [16].
Figure 2.
Aligning human and mouse lifespans by developmental milestones; the figure visualizes analysis done by Dutta et al. in [16].

Figure 3.
Differences in serotonin synthesis capacity (K complex, mL/g/min) over time for ASD and non-ASD children as reported by Chugani et al. [17] and captured by the model. The published data from [17] were digitized using WebPlotDigitizer.

Figure 4.
Model-based assessment of the impact of varying the three main factors that functionally connect levels of serotonin in the gut and ENS size. Solid blue line represents the norm (kn = 10.1; sert = 0.4; a = 0.0006); dot-dashed red and dashed green lines represent the impact of deviation of the norm. (a) The rate of serotonin clearance (sert = 0.4) and rate ENS growth as a function of serotonin concentration (kn = 10.1) are fixed; rate of serotonin production over time a is varied. (b) Rate of serotonin production over time (parameter a) and serotonin-mediated ENS growth (kn) are fixed; rate of SERT-mediated serotonin clearance from the gut is varied. (c) Varying rate of serotonin-mediated ENS growth (kn), while keeping the other two factors fixed.

Figure 5.
Impact of variation of the three key parameters on ENS size relative to norm (ENS = 100%) at t = 5 years. (a) Holding parameter a (serotonin synthesis) constant, (b) holding parameter kn (serotonin-mediated ENS expansion) constant, (c) holding parameter sert (SERT-mediated serotonin uptake) constant, (d) three-dimensional plot of variation of all three parameters and their impact on ENS size.

Figure 6.
Potential mechanistic connection between ENS hypoplasia and ASD.

Table 1.
Parameter values used in simulations for both mouse and human dynamics.
| Parameter | Description | Value (Mouse) | Value (Human) |
|---|---|---|---|
| kn | Rate of conversion of serotonin into ENS | 0.5 | 10.1 |
| nout | Rate of normal ENS pruning (to have the system reach equilibrium) | 0.1 | 0.99 |
| S0 | Serotonin synthesis rate in the gut | 0.2 | 1 |
| kdeg | Gut serotonin degradation rate | 1.386 | 1.386 |
| ksyn | S0*kdeg | 0.2772 | 1.386 |
| sert | Rate of sert-mediated serotonin uptake | 0 if knockout (KO) 0.24 if normal 1.1 if SERT+ | 0.4 for norm |
| xi | Half-maximal concentration of serotonin needed for gut serotonin-mediated ENS growth | 0.19 | 0.9 |
| sout | Serotonin clearance from the gut not through sert | 0.0035 | 0.01 |
Disclaimer/Publisher’s Note: The statements, opinions and data contained in all publications are solely those of the individual author(s) and contributor(s) and not of MDPI and/or the editor(s). MDPI and/or the editor(s) disclaim responsibility for any injury to people or property resulting from any ideas, methods, instructions or products referred to in the content. |
© 2023 by the author. Licensee MDPI, Basel, Switzerland. This article is an open access article distributed under the terms and conditions of the Creative Commons Attribution (CC BY) license (https://creativecommons.org/licenses/by/4.0/).
Share and Cite
MDPI and ACS Style
Kareva, I. Serotonin Signaling in the Enteric Nervous System and Connection to Autism Spectrum Disorder: A Translational Mathematical Model. Appl. Sci. 2023, 13, 2970. https://doi.org/10.3390/app13052970
AMA Style
Kareva I. Serotonin Signaling in the Enteric Nervous System and Connection to Autism Spectrum Disorder: A Translational Mathematical Model. Applied Sciences. 2023; 13(5):2970. https://doi.org/10.3390/app13052970
Chicago/Turabian StyleKareva, Irina. 2023. "Serotonin Signaling in the Enteric Nervous System and Connection to Autism Spectrum Disorder: A Translational Mathematical Model" Applied Sciences 13, no. 5: 2970. https://doi.org/10.3390/app13052970
Note that from the first issue of 2016, this journal uses article numbers instead of page numbers. See further details here.