Article

Effects of Fermented Onion on Gut Health in Dextran Sodium Sulfate (DSS)-Induced Inflammatory Bowel Disease (IBD) Rats

1
Department of Food Engineering and Solar Salt Research Center, Mokpo National University, Muan 58554, Republic of Korea
2
Jangsoofood Co., Naju-si 58307, Republic of Korea
3
Jeonnam Bioindustry Foundation Food Research Center, Naju-si 58307, Republic of Korea
4
Institute of Agricultural Technology, School of Food Technology, Suranaree University of Technology, Nakhon Ratchasima 30000, Thailand
*
Author to whom correspondence should be addressed.
These authors contributed equally to this work.
Appl. Sci. 2023, 13(3), 1590; https://doi.org/10.3390/app13031590
Submission received: 23 December 2022 / Revised: 19 January 2023 / Accepted: 23 January 2023 / Published: 26 January 2023
(This article belongs to the Special Issue Potential Health Benefits of Fruits and Vegetables III)

Abstract

:

Featured Application

This paper is the first report to compare the effects of fresh and fermented onions on gut health using rats. These results could be useful for developing healthy foods using onions.

Abstract

Onion is a well-known health-beneficial vegetable. However, fresh onion is high in FODMAPs (fermentable oligosaccharides, disaccharides, monosaccharides, and polyols) which may be problematic for IBD. Fermentation of onion may help to lower FODMAP problems and increase the availability of bioactive compounds, especially quercetin. We investigated the effect of fermented onion on DSS-induced IBD in rats. Rats were divided into six groups and treated orally with saline as a control and negative control (DSS), probiotics, low and high doses of fermented onion, or fresh onion extract for 3 weeks. After two weeks, rats were given drinking water containing 0.2% DSS for 5 days, except for the control followed by two days of regular water. The colonic histomorphology, immunity, oxidative stress, short-chain fatty acids, and biochemical analysis showed improved IBD conditions in the fermented onion groups. In contrast, the consumption of fresh onion appeared to exacerbate the IBD condition. These results suggest that the consumption of a high dose of fermented onion can ameliorate IBD symptoms.

1. Introduction

Inflammatory bowel disease (IBD) is a chronic inflammation of the digestive tract. Its incidence is increasing worldwide at an unprecedented rate [1]. IBD can be caused by many factors. In particular, oxidative stress causes protein, lipid, and DNA damage, which leads to the pathogenesis of intestinal disorders [2]. The most important factor of IBD is intestinal homeostasis, which can occur through the equilibrium between the immune system and intestinal microbiota. Controlling the invasion of harmful microorganisms is one of the processes for maintaining this balance. Therefore, to prevent the adhesion and invasion of harmful microorganisms, the intestinal mucosa is furnished with protective mechanisms including the mucus layer, a building complex, and an effective mucosal barrier, which is formed by mucins produced by intestinal goblet cells [3]. Currently, therapeutic drugs for IBD such as steroids, immunomodulators, and antibodies are now available. However, most of them have limitations due to their side effects including increased risk of infection, pulmonary toxicity, congestive heart failure, congenital disabilities, myelosuppression, liver toxicity, pancreatitis, and malignancy [4]. Since eating habits play an important role in overall health, changes in diet and food consumption are used to improve, control, or even cure IBD. Numerous studies have shown that dietary components impact gut microbiota and may also have an effect on gut homeostasis directly [5].
Onion (Allium cepa), a monocotyledon, is one of the oldest fructan-containing vegetables. Onions are known to be high in polyphenols, the most abundant of which is quercetin [6]. According to research, quercetin has antihypertensive, antibacterial activities, and anti-inflammatory properties [7]. Furthermore, studies have shown that quercetin helps to suppress lipid peroxidation, inhibit the initial process of inflammation, and improve the immune system [8].
Onions are high in fructan, one of the FODMAPs (fermentable oligosaccharides, di-saccharides, monosaccharides, and polyols) that has been shown to have negative effects on IBD due to its poor absorption in the small intestine and is rapidly fermented by bacteria in the large intestine, leading to symptoms of irritable bowel syndrome (IBS) in IBD patients. On the other hand, the fermentation of onions enhances antioxidant activity, and the availability of bioactive compounds such as flavonoids and short-chain fatty acids (SCFAs) [9,10]. A recent study showed that a diet containing a high content of fermented food increased microbiome diversity and decreased inflammatory signals and activity [11]. Therefore, fermentation of onion may reduce onion’s FODMAP characteristics and improve IBD. Thus, this study aims to evaluate the effect of fermented onion on gut health in DSS-induced IBD rats.

2. Materials and Methods

2.1. Materials and Chemicals

A commercial probiotic that was approved by the Ministry of Food and Drug Safety of Korean government was purchased from Seoyun family Co., Ltd. (Seoul, Republic of Korea) and was used as a positive control in this study. Thiobarbituric acid (TBA), malondialdehyde (MDA), hydroxylamine hydrochloride, 5,5′-dithiobis (2-nitrobenzoic acid) (DTNB), 2-4-dinitrophenylhydrazine (DNPH), guanidine hydrochloride, acetic acid (AA), n-butyric acid (BA), propionic acid (PA), and anhydrous methanol were purchased from Sigma-Aldrich Chemical (St. Louis, MO, USA). Dextran sodium sulfate (DSS) was purchased from MP Biomedicals (Santa Anna, CA, USA). The antibody for interleukin 1 beta (IL-1β) was purchased from Abcam (Waltham, CA, USA). Antibodies for nuclear factor Kappa-B (NF-κB) p65, interleukin-6 (IL-6), tumor necrosis factor-alpha (TNF-α), β-actin, GAPDH and DAPI solution (1 mg/mL) were procured from Themo Fisher Scientific Inc. (Waltham, MA, USA). The antibody for horseradish peroxide (HRP)-conjugated goat anti-rabbit was obtained from Jackson ImmunoResearch Inc. (West Grove, PA, USA). Formic acid was obtained from Daejung chemicals (Siheung-si, Republic of Korea). Tri-chloroacetic acid (TCA) was purchased from Wako Pure Chemical, Inc. (Kyoto, Japan).

2.2. Selection of a Lactic Acid Bacteria for the Fermentation of Onion

Fresh onion (100 g) was mixed with 200 g of water. After boiling for 2 h at 90 °C, the mixture was inoculated with 109 cells of 16 different lactic acid bacteria (Lactococcus lactis subsp. Cremoris (KCCM-40699), Leuconostoc mesenteroides (KCCM-13374), Lactobacillus brevis (KCCM-40017), Lactobacillus cellobiosus (KCCM-40983), Lactobacillus plantarum subsp. Plantarum (KCCM-13093), Lactobacillus plantarum (KCCM-11322), Lactobacillus casei (KCCM-12452), Lactobacillus rhamnosus (KCCM-32405), Lactobacillus acidophilus (KCCM-32820), Lactobacillus delbrueckii subsp. Bulgaricus (KCCM-35465), Lactobacillus casei subsp. Casei (KCCM-35465), Lactococcus lactis subsp. Lactis (KCCM-40104), Lactobacillus acidophilus (KCCM-40265), Lactobacillus helveticus (KCCM-40989), Lactobacillus paracasei subsp. Paracasei (KCCM-41276), Streptococcus salivarius (KCCM-41580)), which were obtained from Korea Culture Center of Microorganisms (KCCM). The growth of lactic acid was monitored by counting the number of lactic acid bacteria in fermented onion using a 3M Petri film lactic acid bacteria count plate (3M Korea Co., Seoul, Republic of Korea). Sensory evaluation of fermented onion was also carried out.
Based on the growth of lactic acid bacteria and sensory evaluation (data not shown), Lactobacillus casei (KCCM-12452) was selected for the fermentation of onion. Furthermore, L. casei has been known as a probiotic that has been reported to balance the gut microbiota, relieve gastrointestinal dysfunction, prevent infection, modulate inflammatory and immunological responses, and alleviate IBS symptoms [12,13].

2.3. Preparation of Fermented Onion for Animal Experiment

Onion (80 kg) was ground and mixed with water (160 kg), and then heated for 2 h at 90 °C. Then, the mixture was inoculated with Lactobacillus casei, and incubated at 37 °C for 48 h without agitation. The culture broth was filtered and sterilized by boiling. The boiled filtrate was used for the animal experiment.

2.4. Animal Studies

Wistar rats were purchased from Orient Bio Inc. (Seongnam, Republic of Korea). The animals were housed under standard housing conditions of temperature (23 ± 2 °C), relative humidity (55 ± 10%), and light (12/12 h light/dark cycle). The animals had ad libitum access to a chow diet and water. Ethical approval for this study was obtained from the Institutional Animal Care and Use Committee (IACUC) of Mokpo National University (Muan, Republic of Korea). All animal experiments were performed according to the National Institutes of Health (NIH) guidelines for the care and use of laboratory animals and the guidelines of the IACUC.

2.5. Experimental Design

An inflammatory bowel disease (IBD) model was established through the oral administration of 2% DSS with a molecular weight of 36,000–50,000 purchased from MP Biomedicals (Santa Anna, CA, USA). Male Wistar rats (5 weeks old) were adapted for 1 week. After acclimatization, rats were divided into six groups (n = 8/group) and were treated orally with a different solution: control, saline; PC, positive control, 0.44 g of commercial probiotic/kg rat); LO, low dose of fermented onion (equivalent to 10 g of fresh onion/kg rat); HO, high dose of fermented onion (equivalent to 20 g fresh onion/kg rat); and FO, fresh onion solution (10 g/kg rat) for 3 weeks. Two weeks after starting the experiment, every group except the control was given 2% DSS in drinking water for 5 days, followed by two days of regular water. At the end of the experiment (week 3), animals were anesthetized with isoflurane and euthanized by draining blood by means of cardiac puncture. Colon tissue was surgically removed, then 3 cm of the distal colon containing feces was removed and stored in Carnoy’s fixative (60% ethanol, 30% chloroform, 10% glacial acetic acid) overnight, and the remaining tissue was flushed with 0.9% NaCl, followed by storage at −80 °C. A 0.5 cm segment was excised from the end of the proximal colon and soaked in a 10% neutral, buffered formalin solution (Sigma).

2.6. Colonic Histomorphology

2.6.1. Hematoxylin and Eosin Staining

The colon samples, after being fixed for 2 days in 10% neutral formalin, were paraffin-embedded and sectioned transversely. The cross-sections of colon tissues (5 µm in thickness) were prepared for rehydration and passed through a series of xylene–alcohol mixtures (100%, 95%, and 70%). The slides were dyed with hematoxylin for 6–8 min and then washed with tap water for 5 min, then placed in eosin solution for 1 min. The slides were dehydrated with a series of alcohol concentrations (70%, 95%, and 100%). Finally, slides were placed in xylene and mounted using Canada balsam.

2.6.2. Alcian Blue and Nuclear Fast Red Staining

The cross-sections of the colon after rehydration in the xylene–alcohol mixtures were stained with alcian blue (AB). Slides were dipped in acetic acid for 3 min and stained with AB dye for 30 min and then stained with Nuclear Fast Red for 5 min. After staining, all slides were dehydrated with a series of alcohol–xylene mixtures (70%, 95%, and 100% ethanol). Finally, the slides were placed in xylene and mounted using Canada balsam. For each stained section, at least 30 bright-field images were captured by a digital camera, under 20–40× magnification, using an Olympus BX43 microscope (Olympus, Tokyo, Japan). Histological damage and goblet cell number were evaluated. The Image J software was used to determine the goblet cell number.

2.6.3. Mucus Layer Thickness Using Periodic Acid-Schiff (PAS) Staining

One-centimeter-long segments of the colon, together with fecal content, were carefully collected and dipped in a water-free methanol-Carnoy’s fixative (60% dry methanol, 30% chloroform, and 10% glacial acetic acid) and fixed overnight. The tissues were then washed in methanol and embedded in paraffin, and sections 5 µm in thickness were cut using a microtome and placed on glass slides. Slides underwent deparaffinization with xylene and rehydration with 100% and 95% ethanol. Thereafter, the slides were stained using the periodic acid-Schiff procedure. Briefly, slides were oxidized for 5 min in 0.5% periodic acid solution. After rinsing, tissues were placed in Schiff reagent for 15 min, washed in warm water, and assessed by a light microscope. For each stained section, at least 10 bright-field images were captured by a digital camera, under 20–40× magnification, using an Olympus BHS microscope (Tokyo, Japan). The Image J 1.53g software was used to determine mucus layer thickness.

2.7. Oxidative Stress Parameters

2.7.1. Determination of Protein Carbonyl Content (PCOs)

Protein carbonyl content was measured using the modified method of Reznick and Packer [14]. An aliquot (1 mL) of 10 mM DNPH in 2 M HCl was added to the reaction mixture (2 mg tissue protein). The sample was incubated for 1 h in the dark at room temperature and vortexed at intervals of 15 min. Then, 1 mL of cold trichloroacetic acid (TCA) (10%, w/v) was added to each reaction mixture which was centrifuged at 3000× g for 10 min. The protein pellet was washed three times with 2 mL of ethanol/ethyl acetate (1:1, v/v) and dissolved in 1.5 mL of guanidine hydrochloride (6 M), incubated for 10 min at 37 °C. The absorbance was measured at 595 nm. The carbonyl content was calculated in nmol of carbonyl groups per mg of protein based on the molar extinction of DNPH (e = 2.1 × 10⁴ mL−1·cm−1).

2.7.2. Determination of Thiobarbituric Acid Reactive Substances (TBARS)

The lipid peroxidation content in colon tissue was determined by the TBARS method. Briefly, colon tissue (0.15 g) was homogenized with 1 mL of 0.01 M tris buffer (pH 7.4). Homogenate was centrifuged at 5000× g at 4 °C for 15 min. The supernatant (0.1 mL) was mixed with 0.3 mL of 10 mM KH2PO4 solution and 1 mL of 0.15 M Tris-HCl buffer solution and incubated at 37 °C for 20 min with continuous shaking (100 rpm). The reaction was stopped by adding 0.5 mL of 20% TCA and 0.5 mL of 0.67% of TBA, and the solution was boiled at 95 °C for 15 min. Then, the solution was centrifuged at 5000× g for 10 min and the absorbance of the supernatant was measured at 532 nm using a spectrophotometer (Hewlett Packard 8452A, Palo Alto, CA, USA). TBARS levels were calculated using a standard curve of malonaldehyde (MDA).

2.8. Immunoglobulin Enzyme-Linked Immunosorbent Assay (ELISA)

The frozen plasma samples were thawed on ice and the IgA and IgG assays were performed in triplicate according to the manufacturer’s instructions using a rat IgA and IgG ELISA kit (Genway, San Diego, CA, USA). The optical density was measured at 450 nm using a microplate reader (TECAN, Zürich, Switzerland). The concentrations of IgA and IgG in plasma samples were determined using standard curves produced from serial dilutions of the rat IgA and IgG, as provided in the kit.

2.9. Protein Quantitative Assay

Colon tissue (0.15 g) was homogenized in 0.8 mL RIPA buffer containing 0.01 M NaF, 2 mM phenylmethylsulfonyl fluoride, 10 mM sodium pyrophosphate, aprotinin (0.1 mg/mL), pepstatin (1 mg/mL) and leupeptin (1 mg/mL). After protein extraction at 4 °C for 2 h, the homogenate was centrifuged at 15,000× g at 4 °C. The supernatant was collected and the protein concentration was analyzed using the Bradford method. Briefly, 50 µL of the protein sample was mixed with 950 µL of the diluted concentrated reagent (1:4) in the disposable cuvette. All protein samples were gently mixed and incubated for 10 min. Absorbance was measured at 595 nm. The standard curve was created using a stock solution of γ-globulin in various concentrations (0, 200, 400, 600, 800, and 1000 µg/mL).

2.10. Western Blotting

An aliquot (40 µL) of protein was mixed with 40 µL of tricine buffer containing 2% 2-mercaptoethanol and denatured at 95 °C for 5 min. Proteins were separated by SDS-polyacrylamide gel electrophoresis and transferred to the PVDF (polyvinylidene difluoride) membrane, where it is blocked with 0.05% Tween-20 (TBST) buffer containing 3% bovine serum albumin (BSA). The membrane was incubated for 10 min and 5 min with TBST solution. Then, the membrane was incubated in primary antibodies and allowed to react overnight at room temperature with gentle agitation. After the primary antibody reaction, the membrane was incubated with TBST solution for 10 min and 5 min for washing. After washing, horseradish peroxidase (HRP)-conjugated goat anti-rabbit immunoglobulin G (Millipore, CA, USA) was added and reacted at room temperature for 1 h. After washing with TBST and TBS solutions, the membranes were reacted with enhanced chemiluminescence (ECL) solution containing luminol and visualized using the Davinch-Chemi™ system (Bio Co., Ltd., Daegu, Republic of Korea). Obtained images were analyzed using Image J software (NIH, Bethesda, MD, USA). All primary antibodies were used at the recommended dilution as given by the manufacturer.

2.11. Analysis of SCFAs in Colon Content Using GC

In rat cecum samples, the gut microbial metabolites, SCFAs, were determined and quantified by gas chromatography (GC) following a previously described protocol with little modification [4]. A Shimadzu GC-17A system (Bellefonte, PA, USA) along with a flame ionization detector (FID) and an automatic liquid sampler was used. A J&W DB-FFAP capillary column (Agilent Technologies Inc., USA; Part # J125-3232, 30 m × 0.53 mm × 1 μm film thickness) was used. One gram of the cecum sample that was previously frozen at −80 °C was thawed and suspended in at least 5 mL of methanol and homogenized for about 3 min, resulting in a 17% (w/w) cecum suspension. Then, the resulting slurry was adjusted to pH 2–3 by adding HCl and then kept for 10 min at room temperature with occasional shaking every 2 min. The mixture was centrifuged at 5000 rpm for 20 min. The supernatant was then filtered using a filter (0.2 μm pore). The internal standard 2-ethylbutyric acid solution containing 12% formic acid was spiked into the supernatant at a final concentration of 1 mM. The injection volume of the sample was 1.0 µL. The oven temperature was 100 °C for 0.5 min initially then raised to 180 °C at 8 °C/min, held for 1.0 min, then increased to 200 °C at 20 °C/min, and finally held at 200 °C for 5 min. The temperatures of the injection port and FID were 200 °C and 240 °C, respectively. The flow rates of hydrogen, air, and helium, known as makeup gas, were 30, 300, and 25 mL/min, respectively. The concentration of SCFAs was quantified as described previously [15].

2.12. Statistics

All data were expressed as mean ± standard deviation (SEM). A value of p < 0.05 was considered to indicate statistical significance using Tukey’s multiple-comparison test among more than three mean values for unpaired data.

3. Results

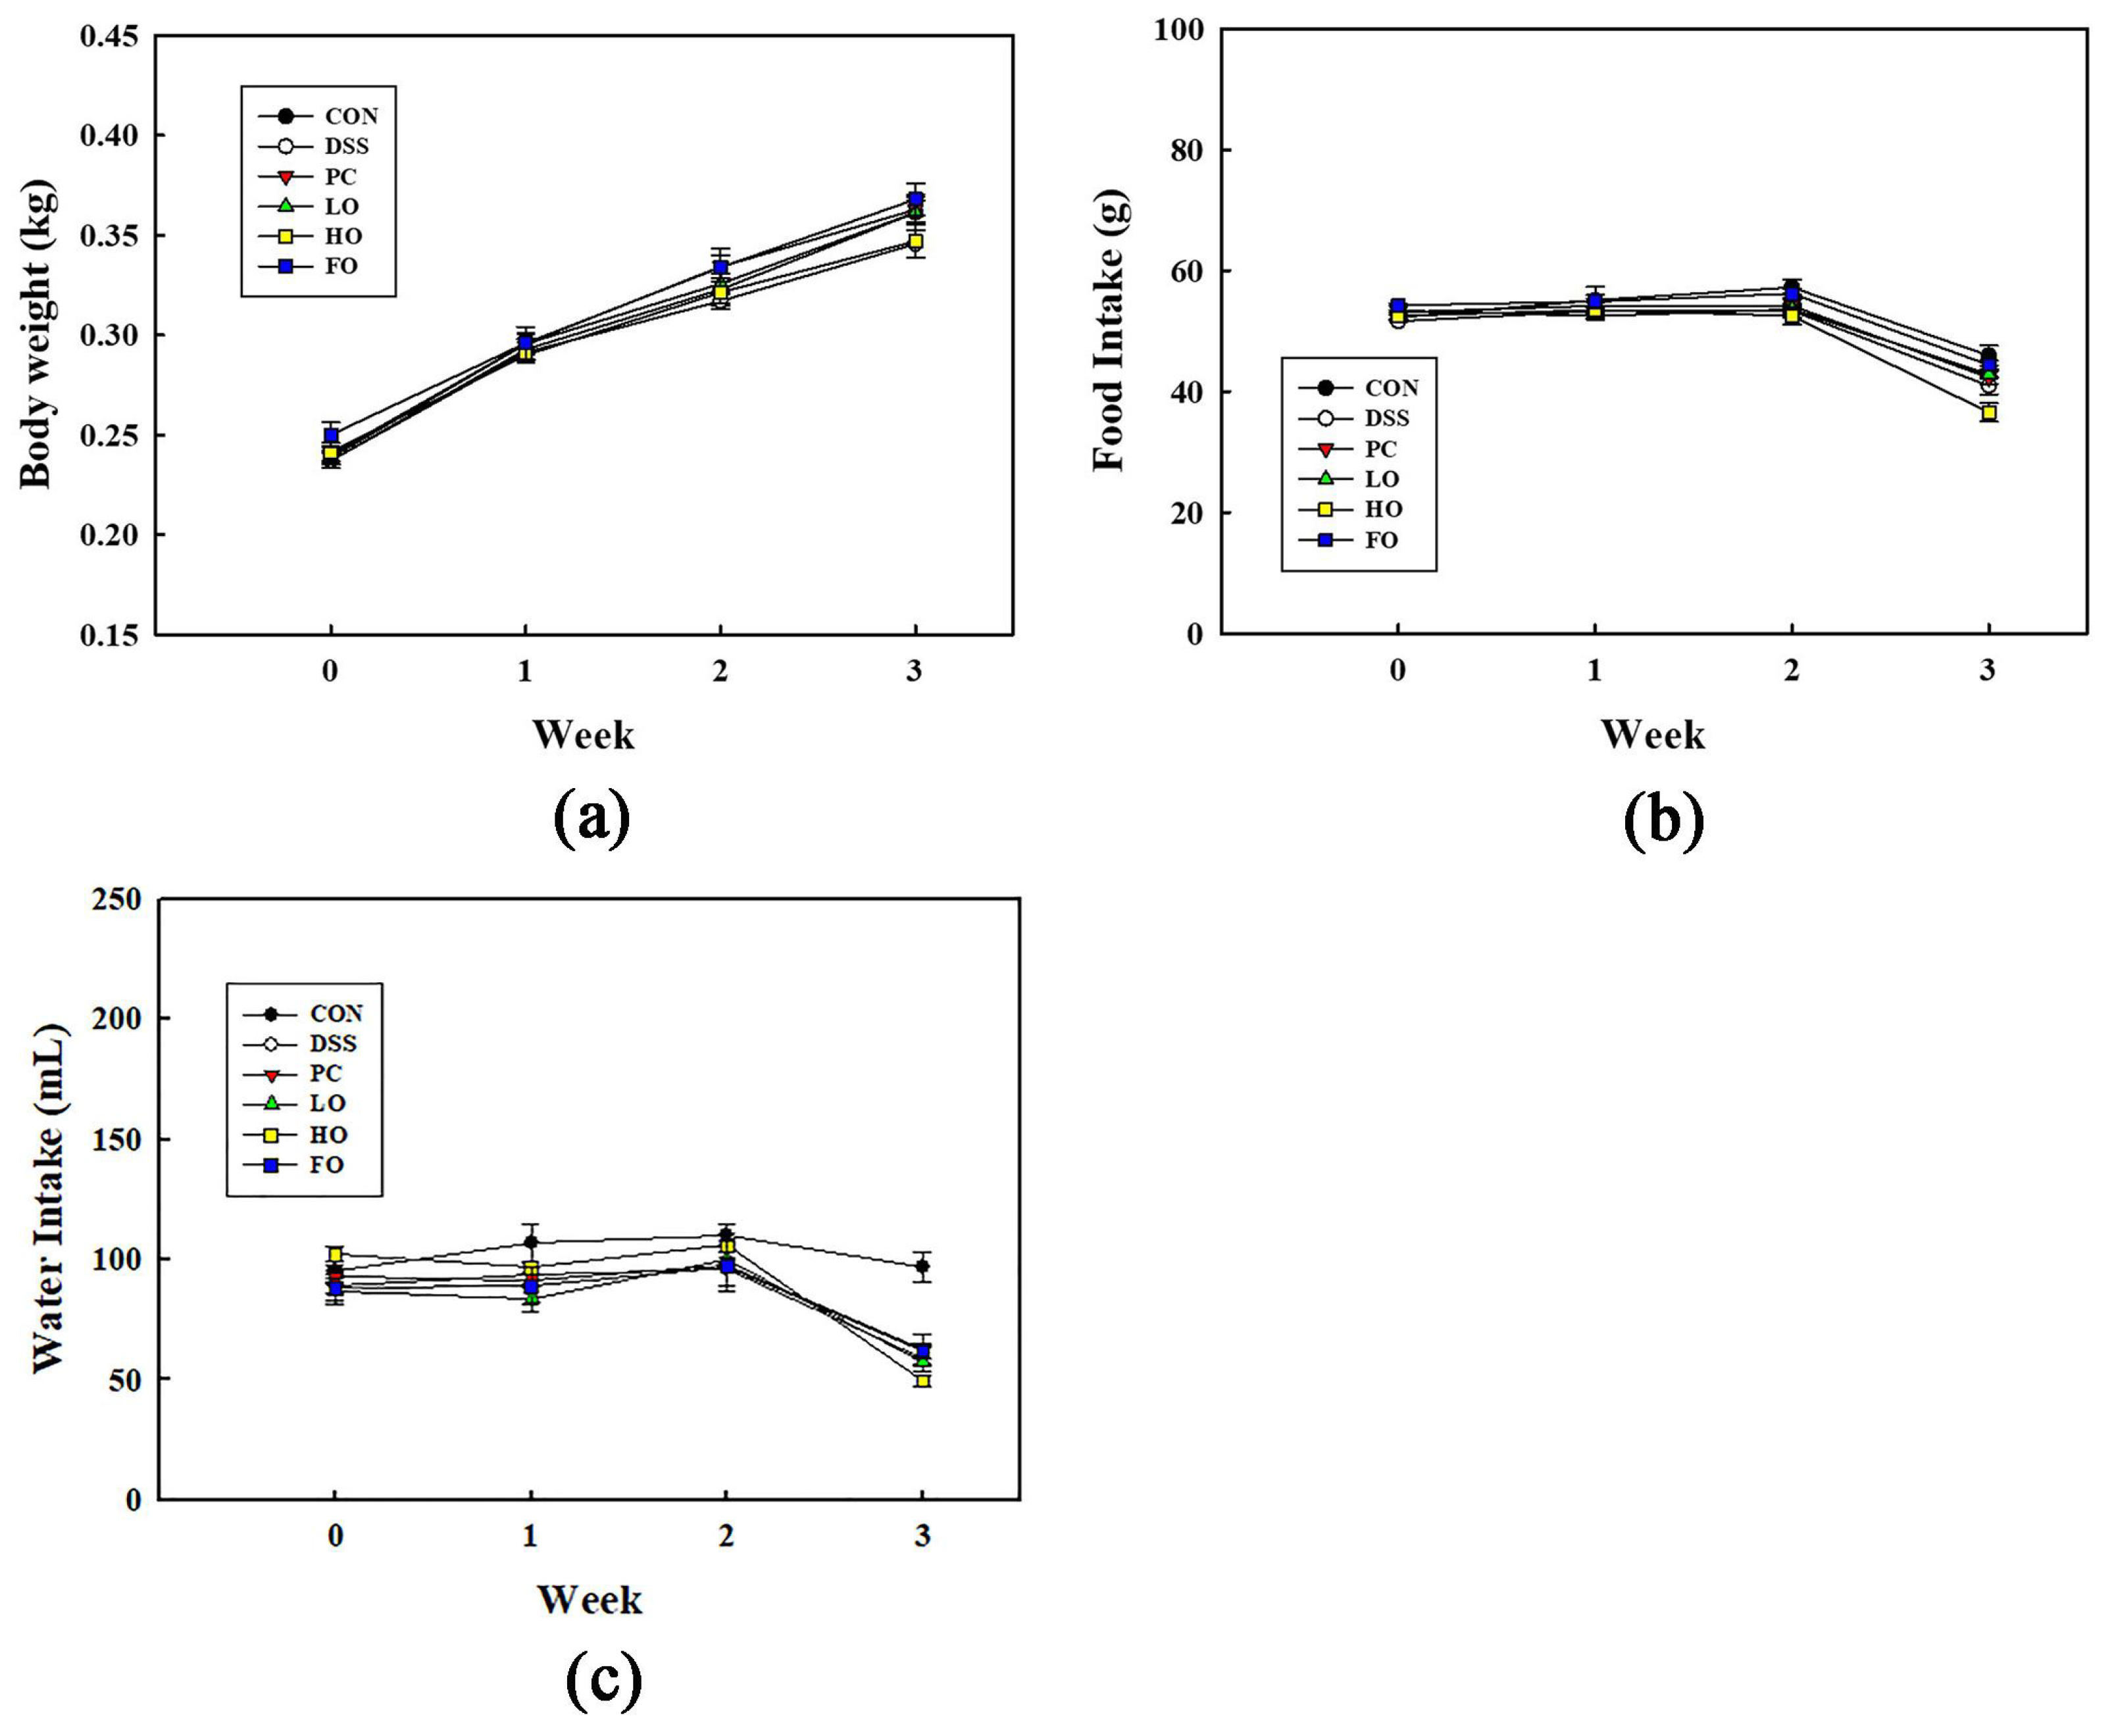
3.1. General Characteristics

The body weight, food, and water intake were measured throughout the experimental period (3 weeks). In Figure 1, all groups treated with DSS display reduced water intake, which is a normal side effect of the DSS-treated model [16]. The DSS groups appeared to have lower food intake as compared to the control group, though a significant difference was not observed. The HO group seemed to show lower food intake and body weight compared to the other groups. However, there are no significant differences among groups.

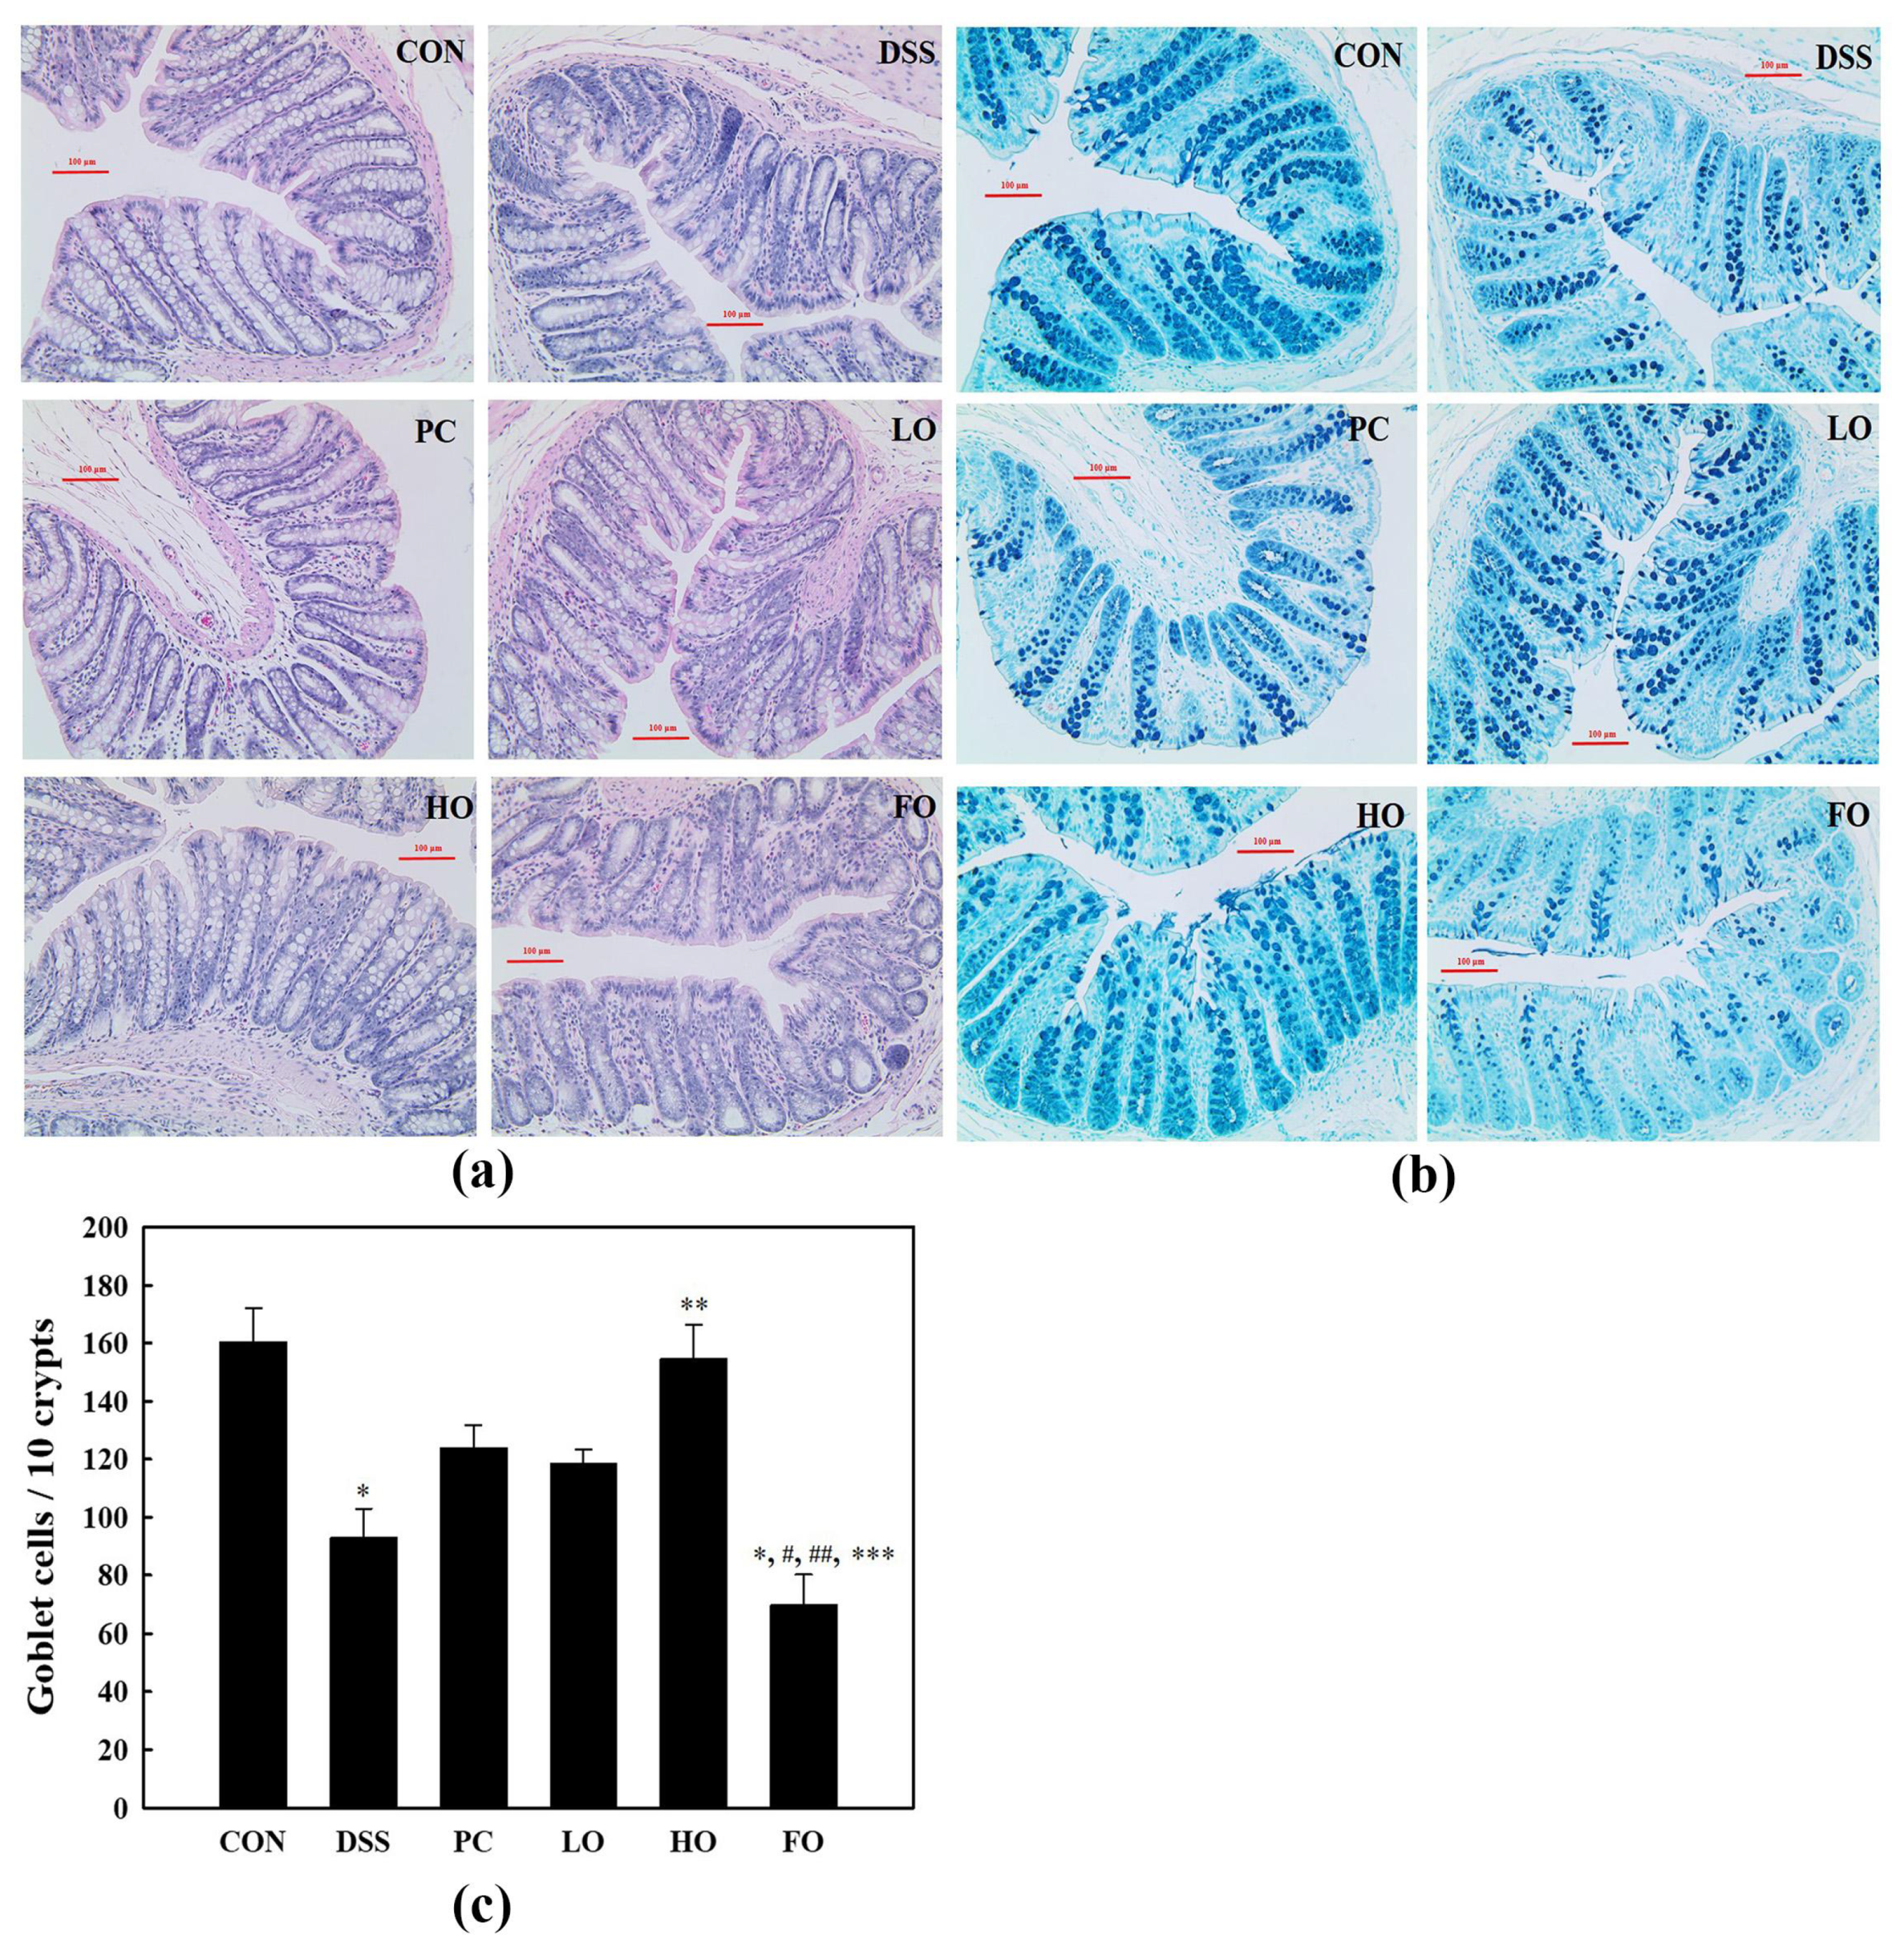
3.2. Colonic Histo-Morphology

Clinical signs of colitis, such as weight loss, diarrhea, and rectal bleeding, were not observed in DSS-induced rats when compared to control rats. H&E-stained sections showed changes in mucus-filled goblet cell numbers. The DSS, PC, LO and FO groups exhibited a depletion in goblet cell count, cellular infiltration in the colonic mucosa, and crypt distortion. DSS and FO groups showed remarkably higher histological damage as compared to the control group. Interestingly, the HO group showed significantly lower damage than the other DSS-treated groups, indicating the preventive effect of the fermented onion. The HO group was even better than PC group, which was treated with a probiotic that was approved for the improvement of gut health by the Ministry of Food and Drug Safety (Figure 2a). Alcian blue-stained colon sections of HO groups show higher goblet cell counts (p < 0.05) as compared to that of the DSS group (Figure 2b,c). The FO group, on the other hand, showed a considerable decrease in comparison to the other groups.

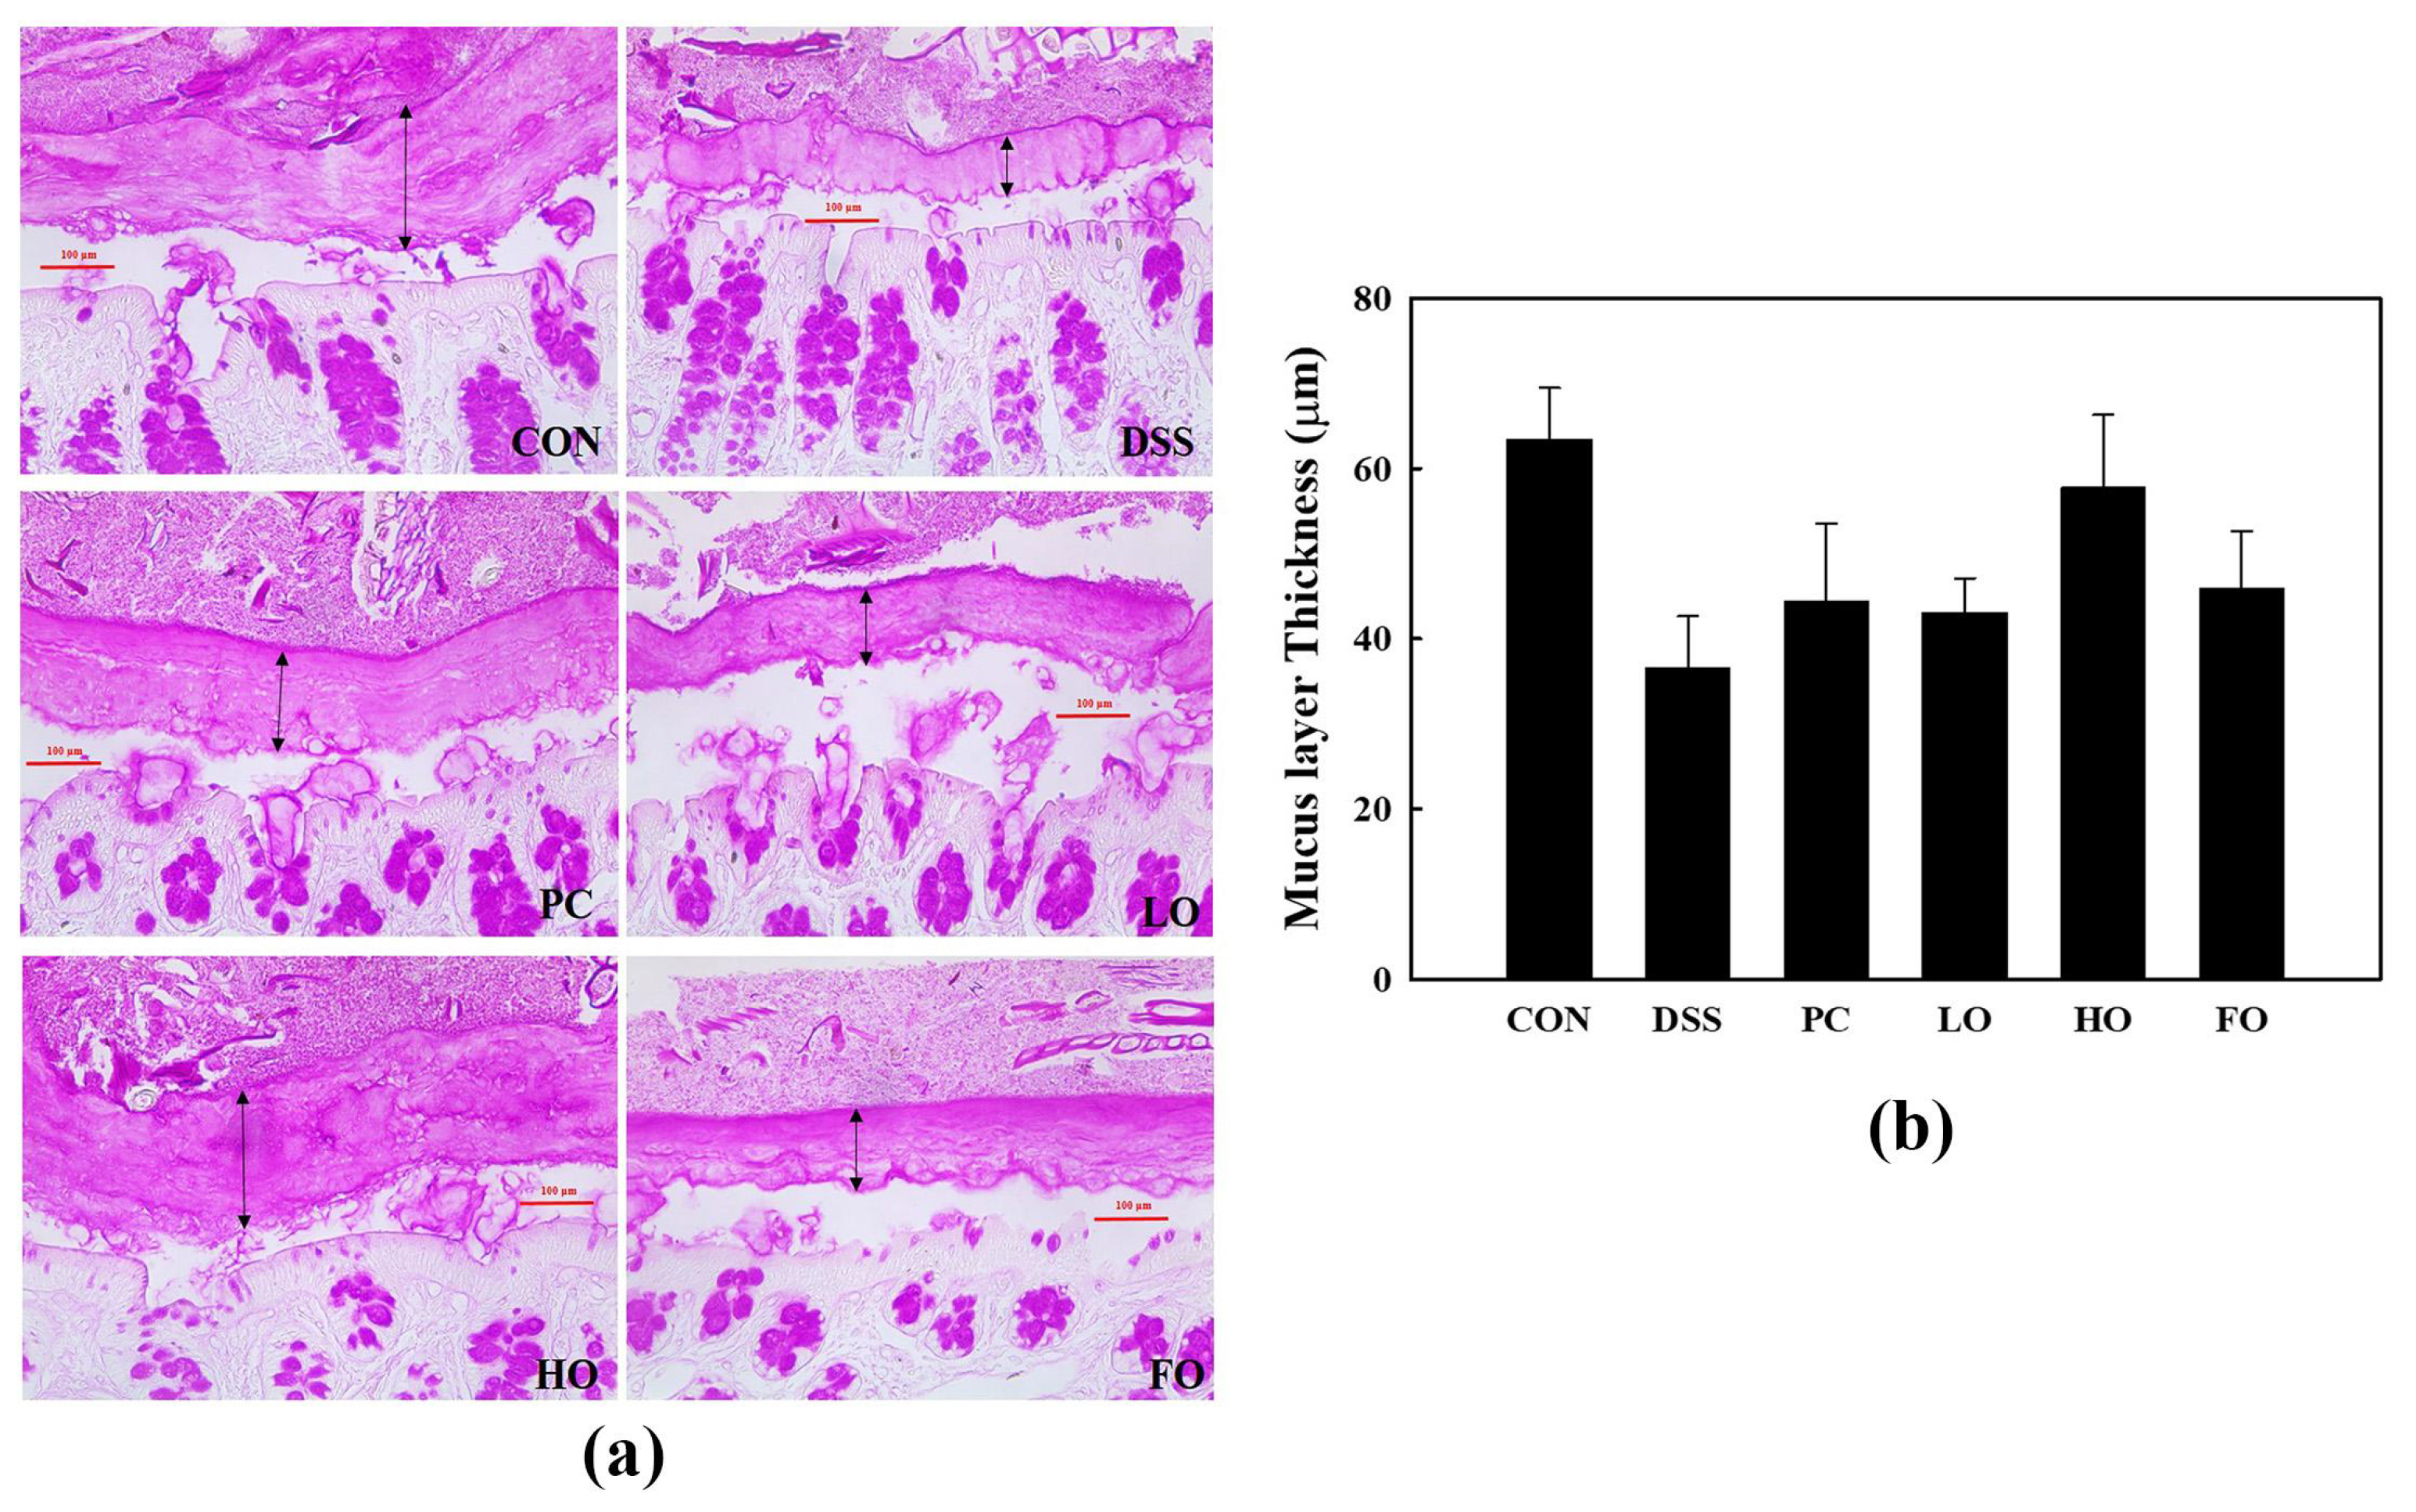
3.3. Inner Mucus Layer Thickness

The intestinal mucus layer plays a role in intestinal protection from mechanical, chemical, and biological damage, as well as in maintaining intestinal homeostasis by forming a coat that protects the intestinal cells from contact with external toxic substances, digestive enzymes, and bacteria [17]. The mucus layer also helps feces pass from the intestine and reduces the risk of bacterial invasion into the gut epithelium [18]. We collected segments of the colon together with fecal pellets and investigated inner mucus layer thickness. Using the PAS staining method, the thickness of adherent mucus was determined. Mucus layer thickness in the DSS group was decreased along with that of the PC-, LO-, and FO-fed groups as compared to that of the control group, whereas the HO group showed a higher mucus layer thickness compared to the other DSS-induced IBD groups, as shown in Figure 3a,b. However, no significant differences were observed among the groups. The mucus layer thickness is related to the number of goblet cells, because mucin-filled goblet cells secrete mucin continuously to replenish the mucus layer [18]. These data are consistent with the previous data on mucus-filled goblet cell count (Figure 2b,c), in which the high dose of fermented onion group presented with a higher number of mucus-filled goblet cells compared to the other DSS-induced groups.

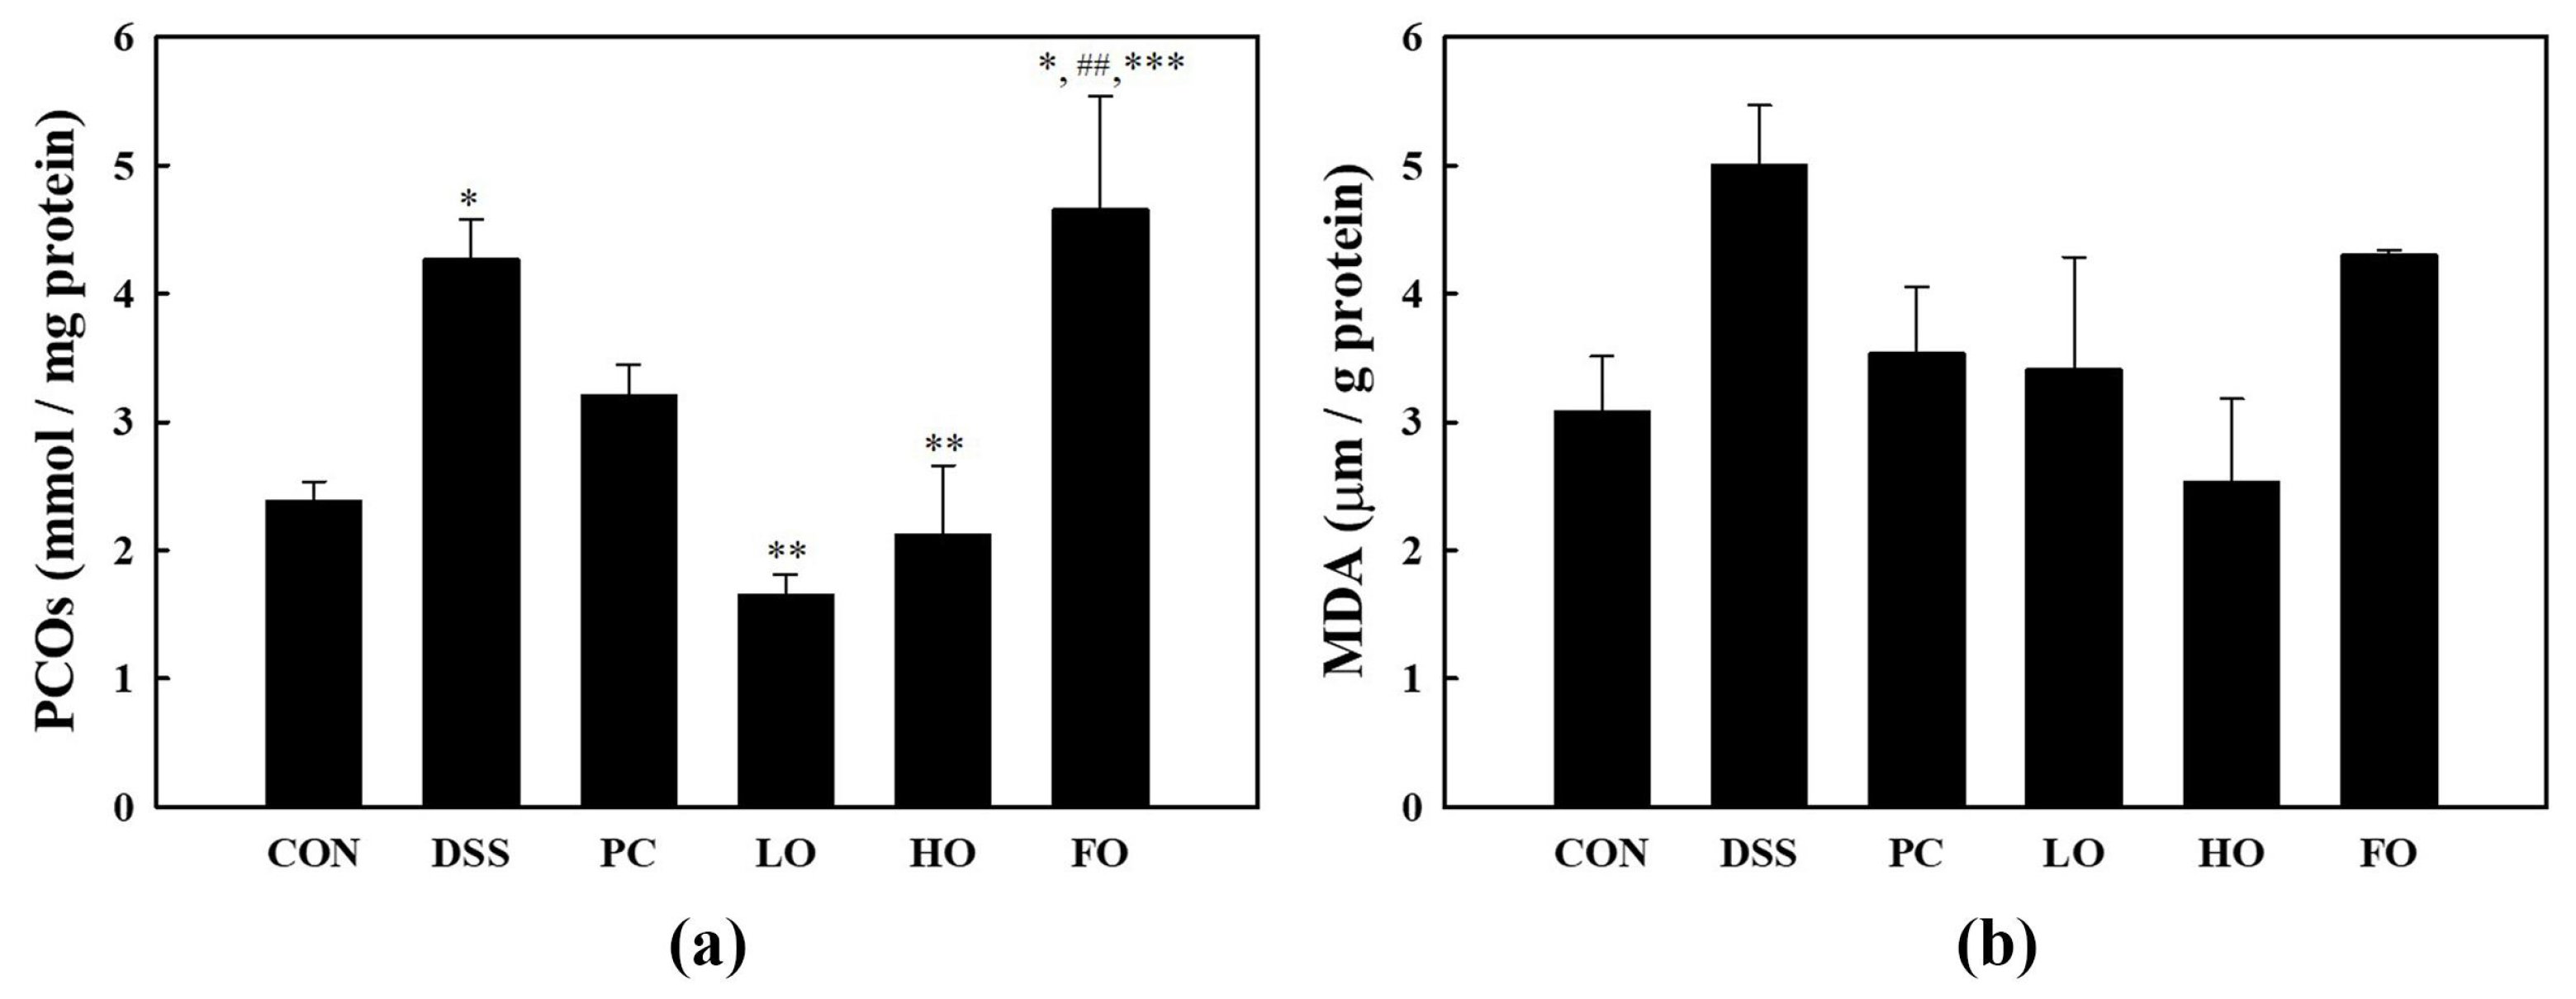
3.4. Oxidative Stress Profiling

3.4.1. Protein Carbonyl (PCO) Content

The protein carbonyls (PCOs) assay is frequently used as a biomarker of protein oxidation, measuring protein carbonyl groups, which occur when reactive oxygen species (ROS) attack the amino acid side chains, called protein carbonylation. This process produces a form of reactive ketones or aldehydes that can react with 2,4-dinitrophenylhydrazine (DNPH), and the accumulation of protein carbonyls has been observed in several human diseases [19]. In our result, the DSS-treated group exhibited a significant increase in PCO contents, while the PC, LO, and HO groups that were also treated with DSS displayed profoundly reduced PCO contents (Figure 4a) (p < 0.05). However, the PCO content of the FO group was similar to that of the DSS group.

3.4.2. Thiobarbituric Acid Reactive Substances (TBARS) Content

In tissue homogenate, oxidative stress was assessed by estimating the TBARS level. The TBARS assay is one method for detecting lipid oxidation [20] by analyzing malondialdehyde (MDA). The MDA reacts with thiobarbituric acid (TBA), forming a pink chromogen, which is measured at 532–535 nm [21]. In this study (Figure 4b), the DSS group exhibited an increase in TBARS contents, which was followed by the FO group, while the other groups showed similar MDA contents to the control group, while the HO-treated group showed the lowest MDA content as compared to the other groups. However, a significant difference among groups was not observed.
Figure 4. Oxidative stress profilings of colonic protein carbonyl content level (a), and colonic MDA level (b). CON, control, saline; DSS, dextran sulfate sodium; PC, positive control, probiotic; LO, low dose of fermented on-ion; HO, high dose of fermented onion; FO, fresh onion. Values are expressed as mean ± SEM (n = 8); different symbols in the bar graph are representative of statistical significance at (p < 0.05) measured by one-way ANOVA followed by Tukey’s test for multiple comparisons. * p < 0.05 vs. CON, ** p < 0.05 vs. DSS, ## p < 0.05 vs. LO, *** p < vs. HO.
Applsci 13 01590 g004

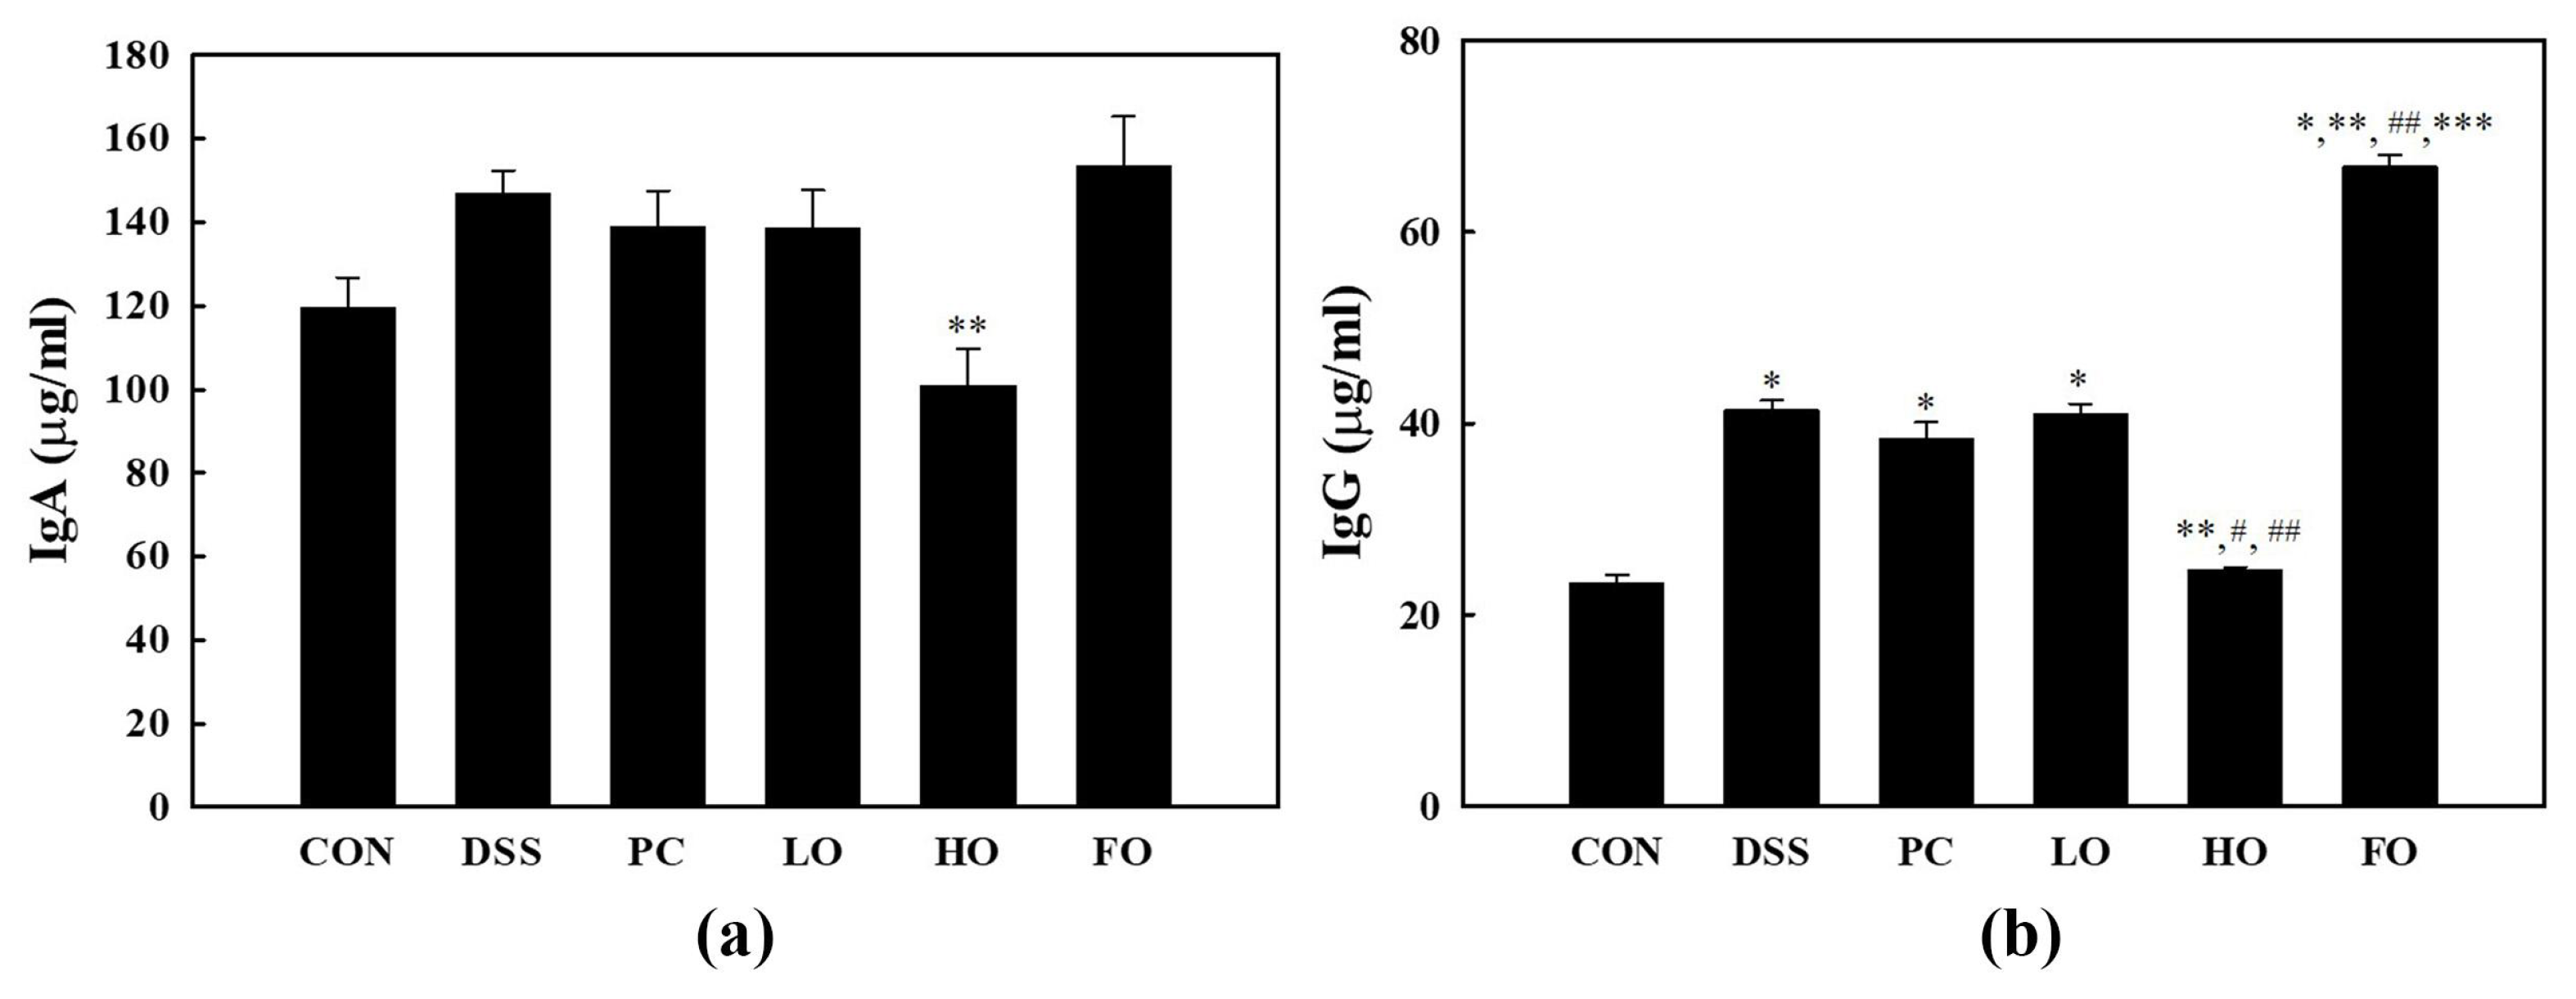
3.5. Effect on Host Immunity

The innate and adaptive immune system plays a crucial role in the development of IBD. B cells, T cells, and regulatory T/B cells are components of the adaptive immune system. Plasma cells, which are generated from B cells, can release immunoglobulin G, including IgG, IgA, IgD, IgM, and IgE [22]. In Figure 5, IgA and IgG levels in the HO group are shown to be significantly decreased (p < 0.05) when compared to those of other DSS-induced groups. These results suggest that a high-dose fermented onion treatment can reduce the distinct clinical characteristics of IBD. Surprisingly, the FO-treated group exhibited a considerable increase in IgG content when compared to other groups.

3.6. Assessment of Inflammation

DSS-induced colonic inflammation is associated with the release of several inflammatory markers [23]. To determine the degree of inflammation in the colon, inflammatory markers including NF-kB, TNF-α, IL-6, and IL-1β were analyzed through Western blotting. The result showed that the NF-kB protein expression level in the colon of the DSS was higher than that in the control, PC, and HO groups (Figure 6a). However, no significant difference was observed. Since NF-kB regulates the expression of numerous inflammatory mediators including interleukins and cytokines, TNF-α, IL-6, and IL-1β were analyzed. Both fermented and fresh onion-treated groups showed slightly decreasing trends in the levels of TNF-α and IL-1β cytokines compared to the DSS-induced group, but no significant differences were observed (Figure 6b,c). For IL-6, the DSS and FO groups exhibited significantly higher levels than the control group (Figure 6d).

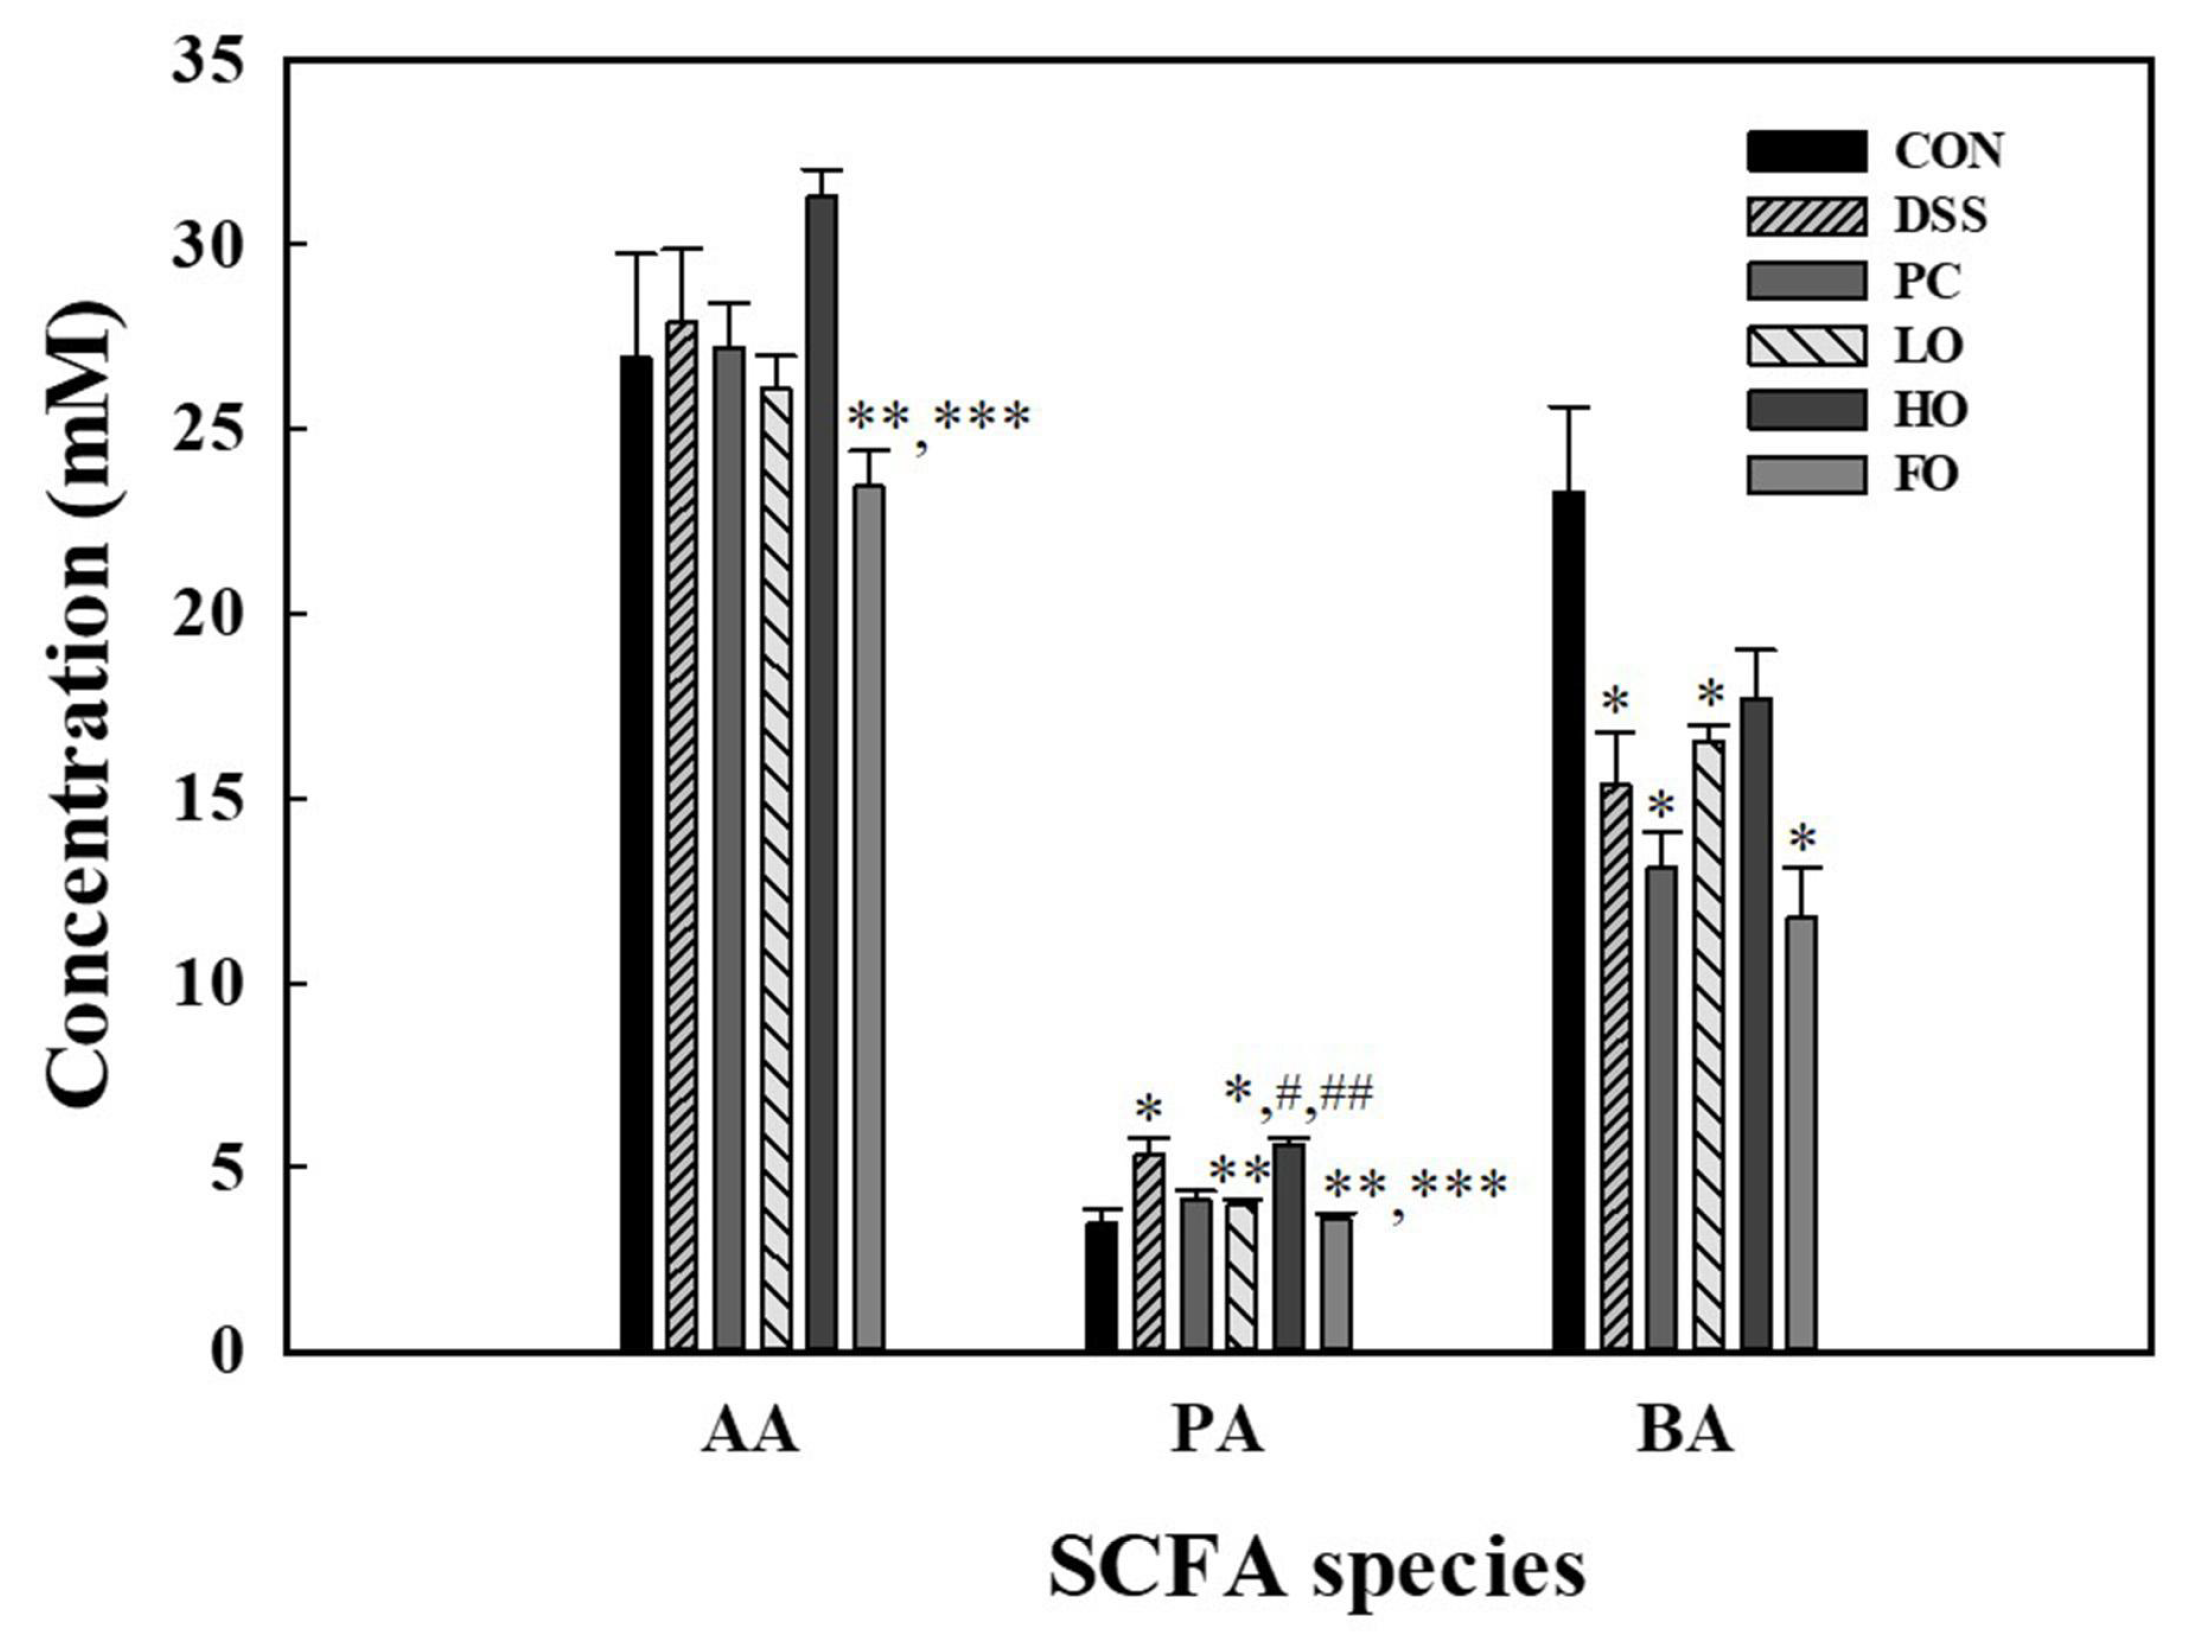
3.7. Short-Chain Fatty Acids (SCFAs) or Gut Metabolites

Short-chain fatty acids (SCFAs) are used as a source of energy by the host colonocyte. Therefore, SCFAs are important for gut health. The microbiota in the large intestine produces SCFAs through the anaerobic fermentation of indigestible polysaccharides such as dietary fiber and resistant starch [24]. Among them, acetate, propionate, and butyrate are the most abundant (≥95%) [25]. SCFAs are primarily produced from dietary fiber derived from plant foods which humans lack the enzymes to break down. The SCFAs including acetate, propionate, and butyrate were quantified by GC-FID in fecal samples. In Figure 7, the concentration of acetate in the FO group was significantly lower than that in the other DSS groups, while the HO group had the highest level of acetate, but the difference was not statistically significant. The HO group showed a significantly increased propionate content compared to the control, PC, and LO groups (p < 0.05); however, this level was similar to that of the DSS group. Butyrate content was reduced in all DSS-treated groups. Among them, the HO group appeared to show the highest level of butyrate, although the difference was not significant.

4. Discussion

Onion (Allium cepa) is well known for its activities against free radicals and oxidative damage associated with chronic diseases. The phytochemicals in onion include glucosinolates, flavonoids, isoflavones, phenolic acids, phytoestrogens, and carotenoids [26], which provide health benefits such as antioxidant and anti-inflammatory activities. However, onions are considered a high-FODMAP food (10–16% fructans) [27]. FODMAPs include di- and monosaccharides such as fructose and lactose, oligosaccharides originating from fructans and galactans, and polyols [28]. The fructans in onion are poorly absorbed in the human small intestine due to the lack of digestive enzymes. Like many other dietary fibers, they are not digested in the upper gastrointestinal tract and pass through to the large intestine, where they are fermented and utilized by the colonic microbiota, yielding gas [29]. FODMAPs show a negative effect on IBD patients by triggering the symptoms of IBD such as bloating, pain, discomfort, diarrhea, and flatulence. Several studies confirmed that the reduction in FODMAPs in the diet reduces symptoms of irritable bowel syndrome (IBS) [25,28,30,31,32].
Recent studies have reported that fermentation increases the bioavailability of bioactive compounds including phenolic compounds, flavonoids, and SCFAs, and the consumption of fermented foods increased microbiome diversity and decreased inflammation markers in humans [10,11,33]. Fermentation may improve FODMAP properties and gut health. Fermentation increases the production of cell wall-degrading enzymes such as cellulolytic, ligninolytic, and pectinolytic enzymes that may reduce FODMAP and may increase glycosidases, which are responsible for hydrolyzing the glycosidic bond of phenolic compounds, resulting in the production of an aglycone form (a molecule without a glycoside side chain), which improves absorbability in the intestine [34]. It has been reported that the fermentation of onion raised the content of quercetin (also known as an aglycone) [9], which is one of the most common bioactive compounds found in onions.
In order to determine whether fermented onion also improves DSS-induced IBD in human gut health, we orally administered 10–20 g of fresh onion/kg rat/day to each rat, which is equivalent to about one bulb (100–200 g) of fresh onion/60 kg of person/day.
The crypts in the intestine provide stem cells with a safe environment for the renewal of the intestinal epithelium, which occurs every 3 to 4 days [35]. The high dose of fermented onion group (HO, 20 g/kg rat) showed significantly lower crypt damage compared to DSS and FO groups, in which crypts showed loss of parallelism, and irregularity in size, spacing, and shape (Figure 2). Crypt damage can lead to a reduction in the number of goblet cells that are produced by the stem cells at the bottom of the crypt. In contrast to the HO group, which showed a significantly high number of goblet cells, there is a loss of goblet cells in the DSS and FO groups. The goblet cells help to maintain the integrity of the intestinal epithelium by secreting mucin, which contributes to the ongoing replenishing of the mucus layer [18]. Therefore, the integrity of goblet cells causes increased mucus production, which is followed by an increase in the thickness of the inner mucus layer, as demonstrated in the HO group (Figure 3). To the best of our knowledge, this is the first study that reports the effect of fermented onion on mucus production.
The short-chain fatty acids (SCFAs) contents including acetate, butyrate, and propionate were analyzed (Figure 7). Among the DSS-induced groups, butyrate only increased in the LO and HO groups. In contrast, acetate and propionate were increased in all DSS-induced groups, especially in the HO group. These results are consistent with a previous study, which showed that the DSS significantly increased acetate and propionate concentrations while significantly decreasing butyrate [36]. Further research is required to fully understand this mechanism.
The major immunoglobulins that constitute most humoral and mucosal immunity are immunoglobulin A (IgA) and immunoglobulin G (IgG). IgA is the main antibody generated within the intestines, while IgG is the most prevalent antibody in the peripheral blood [37]. Previous research has shown that patients with IBD had higher levels of serum IgG in the intestinal lumen [38,39]. Our results showed that IgG levels were significantly increased in the DSS-induced groups, especially in the FO group, and dramatically decreased in the HO group. A recent study suggests that IgG might play a pathogenic role in intestinal inflammation via Fc gamma receptor (FcγR) activation by IgG, which leads to the production of IL-1β, type 17 immunity, and the exacerbation of intestinal inflammation [40]. Similar results were shown in IgA, which increased in the DSS-induced groups, except in the HO group, in which IgA decreased. DSS causes impaired mucosal barriers, which result in a leaky gut, allowing substances to easily pass through the gut. These substances have the ability to stimulate IgA secretion. Furthermore, several studies have shown that IBD patients have higher IgA levels than healthy individuals [22,41].
Moreover, we found that the FO groups had significantly higher IL-6 and a slight increase in TNF-α and IL-1β protein expression. In fermented onion, on the other hand, improvement in these inflammation factors was shown. These findings are consistent with all data previously mentioned, suggesting that in DSS-induced IBD rats, fermented onions had better beneficial impacts on gut health than fresh onions, considering that fermentation may reduce FODMAP properties and induce anti-inflammation.
The differences in effects between fermented and fresh onions on gut health might be due to the degradation of FODMAP compounds by fermentation, which results in an increase in butyrate in the fermented onion groups, as butyrate has been shown to control oxidative stress in numerous studies [42]. The differences in the chemical compounds of fresh and fermented onions may be another factor that might play role in the different effects of these two types of onions. In a prior study, chemical analysis revealed that pickled onions had much higher levels of allyl methyl trisulfide, 3,5-diethyl-1,2,4-trithiolane, and 2-hexyl-5-methyl-3(2H)-furanone than fresh onions did [43]. These compounds have also been shown in several studies to have a positive effect on IBD in rats. This may lead to a future study in which we may extensively explore the relationship between the different components of fresh and fermented onion and gut health.

5. Conclusions

In this study, we examined the effects of fermented and fresh onions on gut health in DSS-induced IBD rats. The DSS-induced IBD rats exhibited mucosal inflammation with extensive depletion of goblet cells in the mucosa. We found that fermented onion is associated with repressed oxidative stress and inflammation in the DSS-induced IBD model. Furthermore, fermented onion treatment significantly reduced the mucosal damage by inducing a significant increase in the goblet cell number and the thickness of the mucus layer. Fresh onion, on the other hand, caused a considerable reduction in goblet cells.

Author Contributions

Conceptualization, K.-S.H., N.S., S.C., K.-H.P., Y.-J.P. and K.P.; methodology, N.S., S.C., H.-M.S., D.S. (Doyoung Song) and K.-H.P.; experimental analysis and investigation, N.S., S.C., M.S. and D.S. (Divya Sharma); writing—original draft preparation, N.S.; writing—review and editing, N.S., S.C. and K.-S.H.; supervision, K.-S.H. All authors have read and agreed to the published version of the manuscript.

Funding

This study was supported by a Regional Infrastructure Specialized Support Project from the Ministry of SMEs and Startups (MSS) of Korean government. P0013018.

Institutional Review Board Statement

The animal study protocol was approved by the Institutional Animal Care and Use Committee (IACUC) of Mokpo National University (Muan, Republic of Korea). MNU-IACUC-2020-016.

Informed Consent Statement

Not applicable.

Data Availability Statement

Not applicable.

Conflicts of Interest

Y.-J.P. is a stockholder of a company that specializes in onion processing. The other authors declare no conflicts of interest.

References

  1. Limdi, J.K. Dietary practices and inflammatory bowel disease. Indian J. Gastroenterol. 2018, 37, 284–292. [Google Scholar] [CrossRef] [PubMed] [Green Version]
  2. Bhattacharyya, A.; Chattopadhyay, R.; Mitra, S.; Crowe, S.E. Oxidative stress: An essential factor in the pathogenesis of gastrointestinal mucosal diseases. Physiol. Rev. 2014, 94, 329–354. [Google Scholar] [CrossRef] [PubMed] [Green Version]
  3. Antoni, L.; Nuding, S.; Wehkamp, J.; Stange, E.F. Intestinal barrier in inflammatory bowel disease. World J. Gastroenterol. 2014, 20, 1165–1179. [Google Scholar] [CrossRef] [PubMed]
  4. McLean, L.P.; Cross, R.K. Adverse events in IBD: To stop or continue immune suppressant and biologic treatment. Expert Rev. Gastroenterol. Hepatol. 2014, 8, 223–240. [Google Scholar] [CrossRef] [Green Version]
  5. Andersen, V.; Olsen, A.; Carbonnel, F.; Tjønneland, A.; Vogel, U. Diet and risk of inflammatory bowel disease. Dig. Liver Dis. 2012, 44, 185–194. [Google Scholar] [CrossRef]
  6. Hong, Z.; Piao, M. Effect of Quercetin Monoglycosides on Oxidative Stress and Gut Microbiota Diversity in Mice with Dextran Sodium Sulphate-Induced Colitis. Biomed Res. Int. 2018, 2018, 8343052. [Google Scholar] [CrossRef]
  7. Yang, D.; Wang, T.; Long, M.; Li, P. Quercetin: Its Main Pharmacological Activity and Potential Application in Clinical Medicine. Oxid. Med. Cell. Longev. 2020, 2020, 8825387. [Google Scholar] [CrossRef]
  8. Panche, A.N.; Diwan, A.D.; Chandra, S.R. Flavonoids: An overview. J. Nutr. Sci. 2016, 5, 9–10. [Google Scholar] [CrossRef] [Green Version]
  9. Yang, E.J.; Kim, S.I.; Park, S.Y.; Bang, H.Y.; Jeong, J.H.; So, J.H.; Rhee, I.K.; Song, K.S. Fermentation enhances the in vitro antioxidative effect of onion (Allium cepa) via an increase in quercetin content. Food Chem. Toxicol. 2012, 50, 2042–2048. [Google Scholar] [CrossRef]
  10. Annunziata, G.; Arnone, A.; Ciampaglia, R.; Tenore, G.C.; Novellino, E. Fermentation of foods and beverages as a tool for increasing availability of bioactive compounds. focus on short-chain fatty acids. Foods 2020, 9, 999. [Google Scholar] [CrossRef]
  11. Wastyk, H.C.; Fragiadakis, G.K.; Perelman, D.; Dahan, D.; Merrill, B.D.; Yu, F.B.; Topf, M.; Gonzalez, C.G.; Van Treuren, W.; Han, S.; et al. Gut-microbiota-targeted diets modulate human immune status. Cell 2021, 184, 4137–4153.e14. [Google Scholar] [CrossRef]
  12. Hill, D.; Sugrue, I.; Tobin, C.; Hill, C.; Stanton, C.; Ross, R.P. The Lactobacillus casei group: History and health related applications. Front. Microbiol. 2018, 9, 5–6. [Google Scholar] [CrossRef] [Green Version]
  13. Horvat, I.B.; Gobin, I.; Kresović, A.; Hauser, G. How can probiotic improve irritable bowel syndrome symptoms. World J. Gastrointest. Surg. 2021, 13, 923. [Google Scholar] [CrossRef] [PubMed]
  14. Reznick, A.Z.; Packer, L. Oxidative damage to proteins: Spectrophotometric method for carbonyl assay. Methods Enzymol. 1994, 233, 357–363. [Google Scholar] [CrossRef] [PubMed]
  15. Zhao, G.; Nyman, M.; Jönsson, J.Å. Rapid determination of short-chain fatty acids in colonic contents and faeces of humans and rats by acidified water-extraction and direct-injection gas chromatography. Biomed. Chromatogr. 2006, 20, 674–682. [Google Scholar] [CrossRef]
  16. Chassaing, B.; Aitken, J.D.; Malleshappa, M.; Vijay-Kumar, M. DSS Protocol. Curr. Protoc. Immunol. 2015, 27, 1–19. [Google Scholar] [CrossRef]
  17. Tarakci, N.G.; Erdem, N.Z.; Dumen, E. Probiotic Foods Are Effective on Weight Loss, Biochemical Parameters, and Intestinal Microbiota in Wistar Albino Rats with Obese Microbiota. Int. J. Clin. Pract. 2022, 2022, 4569100. [Google Scholar] [CrossRef] [PubMed]
  18. Omotoso, G.O.; Muonagolu, J.N.; Enaibe, B.U. Histological Evaluation of the Jejunum and Ileum of Rats after Administration of High Dose Garlic Aqueous Extract. Int. J. Health Sci. 2012, 6, 135–140. [Google Scholar] [CrossRef] [PubMed]
  19. Celi, P.; Gabai, G. Oxidant/antioxidant balance in animal nutrition and health: The role of protein oxidation. Front. Vet. Sci. 2015, 2, 48. [Google Scholar] [CrossRef] [PubMed] [Green Version]
  20. Abeyrathne, E.D.N.S.; Nam, K.; Ahn, D.U. Analytical methods for lipid oxidation and antioxidant capacity in food systems. Antioxidants 2021, 10, 1587. [Google Scholar] [CrossRef]
  21. Kumar, S.; Krishna Chaitanya, R.; Preedy, V.R. Assessment of Antioxidant Potential of Dietary Components; Elsevier Inc.: Amsterdam, The Netherlands, 2017; ISBN 9780128098547. [Google Scholar]
  22. Song, D.J.; Shen, J.; Chen, M.H.; Liu, Z.J.; Cao, Q.; Hu, P.J.; Gao, X.; Qian, J.M.; Wu, K.C.; Lai, L.J.; et al. Association of Serum Immunoglobulins Levels With Specific Disease Phenotypes of Crohn’s Disease: A Multicenter Analysis in China. Front. Med. 2021, 8, 621337. [Google Scholar] [CrossRef] [PubMed]
  23. Marrero, J.A.; Matkowskyj, K.A.; Yung, K.; Hecht, G.; Benya, R.V. Dextran sulfate sodium-induced murine colitis activates NF-κB and increases galanin-1 receptor expression. Am. J. Physiol. Gastrointest. Liver Physiol. 2000, 278, 797–804. [Google Scholar] [CrossRef] [PubMed]
  24. Silva, Y.P.; Bernardi, A.; Frozza, R.L. The Role of Short-Chain Fatty Acids From Gut Microbiota in Gut-Brain Communication. Front. Endocrinol. 2020, 11, 25. [Google Scholar] [CrossRef] [Green Version]
  25. Shepherd, S.J.; Lomer, M.C.E.; Gibson, P.R. Short-chain carbohydrates and functional gastrointestinal disorders. Am. J. Gastroenterol. 2013, 108, 707–717. [Google Scholar] [CrossRef] [PubMed]
  26. Septembre-Malaterre, A.; Remize, F.; Poucheret, P. Fruits and vegetables, as a source of nutritional compounds and phytochemicals: Changes in bioactive compounds during lactic fermentation. Food Res. Int. 2018, 104, 86–99. [Google Scholar] [CrossRef] [PubMed]
  27. Saeed, F.; Pasha, I.; Arshad, M.U.; Muhammad Anjum, F.; Hussain, S.; Rasheed, R.; Nasir, M.A.; Shafique, B. Physiological and Nutraceutical Perspectives of Fructan. Int. J. Food Prop. 2015, 18, 1895–1904. [Google Scholar] [CrossRef]
  28. Prince, A.C.; Myers, C.E.; Joyce, T.; Irving, P.; Lomer, M.; Whelan, K. Fermentable carbohydrate restriction (Low FODMAP Diet) in clinical practice improves functional gastrointestinal symptoms in patients with inflammatory bowel disease. Inflamm. Bowel Dis. 2016, 22, 1129–1136. [Google Scholar] [CrossRef] [Green Version]
  29. Kalantar-Zadeh, K.; Berean, K.J.; Burgell, R.E.; Muir, J.G.; Gibson, P.R. Intestinal gases: Influence on gut disorders and the role of dietary manipulations. Nat. Rev. Gastroenterol. Hepatol. 2019, 16, 733–747. [Google Scholar] [CrossRef]
  30. Barrett, J.S.; Gearry, R.B.; Muir, J.G.; Irving, P.M.; Rose, R.; Rosella, O.; Haines, M.L.; Shepherd, S.J.; Gibson, P.R. Dietary poorly absorbed, short-chain carbohydrates increase delivery of water and fermentable substrates to the proximal colon. Aliment. Pharmacol. Ther. 2010, 31, 874–882. [Google Scholar] [CrossRef]
  31. Ong, D.K.; Mitchell, S.B.; Barrett, J.S.; Shepherd, S.J.; Irving, P.M.; Biesiekierski, J.R.; Smith, S.; Gibson, P.R.; Muir, J.G. Manipulation of dietary short chain carbohydrates alters the pattern of gas production and genesis of symptoms in irritable bowel syndrome. J. Gastroenterol. Hepatol. 2010, 25, 1366–1373. [Google Scholar] [CrossRef]
  32. Murray, K.; Wilkinson-Smith, V.; Hoad, C.; Costigan, C.; Cox, E.; Lam, C.; Marciani, L.; Gowland, P.; Spiller, R.C. Differential effects of FODMAPs (Fermentable Oligo-, Di-, Mono-Saccharides and Polyols) on small and large intestinal contents in healthy subjects shown by MRI. Am. J. Gastroenterol. 2014, 109, 110–119. [Google Scholar] [CrossRef] [PubMed] [Green Version]
  33. Paramithiotis, S.; Das, G.; Shin, H.S.; Patra, J.K. Fate of Bioactive Compounds during Lactic Acid Fermentation of Fruits and Vegetables. Foods 2022, 11, 733. [Google Scholar] [CrossRef] [PubMed]
  34. Huynh, N.T.; Van Camp, J.; Smagghe, G.; Raes, K. Improved release and metabolism of flavonoids by steered fermentation processes: A review. Int. J. Mol. Sci. 2014, 15, 19369–19388. [Google Scholar] [CrossRef] [PubMed]
  35. Car, B.D.; Eng, V.M.; Everds, N.E.; Bounous, D.I. Clinical Pathology of the Rat. In The Laboratory Rat; Academic Press: Cambridge, MA, USA, 2006; pp. 127–146. [Google Scholar] [CrossRef]
  36. Borton, M.A.; Sabag-Daigle, A.; Wu, J.; Solden, L.M.; O’Banion, B.S.; Daly, R.A.; Wolfe, R.A.; Gonzalez, J.F.; Wysocki, V.H.; Ahmer, B.M.M.; et al. Chemical and pathogen-induced inflammation disrupt the murine intestinal microbiome. Microbiome 2017, 5, 47. [Google Scholar] [CrossRef] [Green Version]
  37. Lin, R.; Chen, H.; Shu, W.; Sun, M.; Fang, L.; Shi, Y.; Pang, Z.; Wu, W.; Liu, Z. Clinical significance of soluble immunoglobulins A and G and their coated bacteria in feces of patients with inflammatory bowel disease. J. Transl. Med. 2018, 16, 1–15. [Google Scholar] [CrossRef] [PubMed]
  38. Lee, H.S.; Lee, K.J. Immunoglobulin G4-related immune responses to common food antigens in patients with ulcerative colitis and Crohn’s disease. Turkish J. Gastroenterol. 2019, 30, 408–414. [Google Scholar] [CrossRef]
  39. Wang, Z.; Zhu, M.; Luo, C.; Zhen, Y.; Mu, J.; Zhang, W.; Ouyang, Q.; Zhang, H. High level of IgG4 as a biomarker for a new subset of inflammatory bowel disease. Sci. Rep. 2018, 8, 10018. [Google Scholar] [CrossRef] [Green Version]
  40. Castro-Dopico, T.; Dennison, T.W.; Ferdinand, J.R.; Mathews, R.J.; Fleming, A.; Clift, D.; Stewart, B.J.; Jing, C.; Strongili, K.; Labzin, L.I.; et al. Anti-commensal IgG Drives Intestinal Inflammation and Type 17 Immunity in Ulcerative Colitis. Immunity 2019, 50, 1099–1114.e10. [Google Scholar] [CrossRef] [Green Version]
  41. Kazemi-Shirazi, L.; Gasche, C.H.; Natter, S.; Gangl, A.; Smolen, J.; Spitzauer, S.; Valent, P.; Kraft, D.; Valenta, R. IgA autoreactivity: A feature common to inflammatory bowel and connective tissue diseases. Clin. Exp. Immunol. 2002, 128, 102–109. [Google Scholar] [CrossRef]
  42. Hamer, H.M.; Jonkers, D.M.A.E.; Bast, A.; Vanhoutvin, S.A.L.W.; Fischer, M.A.J.G.; Kodde, A.; Troost, F.J.; Venema, K.; Brummer, R.J.M. Butyrate modulates oxidative stress in the colonic mucosa of healthy humans. Clin. Nutr. 2009, 28, 88–93. [Google Scholar] [CrossRef]
  43. Farag, M.A.; Tawfike, A.F.; Donia, M.S.; Ehrlich, A.; Wessjohann, L.A. Influence of pickling process on Allium cepa and citrus limon metabolome as determined via mass spectrometry-based metabolomics. Molecules 2019, 24, 928. [Google Scholar] [CrossRef] [PubMed]
Figure 1. Changes in body weight (a), food intake (b), and water intake (c) of rats administered fermented and fresh onions orally for 3 weeks. CON, control, saline; DSS, dextran sulfate sodium; PC, positive control, probiotic; LO, low dose of fermented onion; HO, high dose of fermented onion; FO, fresh onion. Values are expressed as mean ± SEM (n = 8).
Applsci 13 01590 g001
Figure 2. Cross-section of the colonic tissue stained with hematoxylin and eosin (H&E) (a), alcian blue and nuclear fast red-stained colonic tissue to show goblet cells (dark blue color) (b), and intestinal goblet cells per crypt ratio (c). CON, control, saline; DSS, dextran sulfate sodium; PC, positive control, probiotic; LO, low dose of fermented onion; HO, high dose of fermented onion; FO, fresh onion. Values are expressed as mean ± SEM (n = 8); different symbols in the bar graph are representative of statistical significance at (p < 0.05) measured by one-way ANOVA followed by Tukey’s test for multiple comparisons. * p < 0.05 vs. CON, ** p < 0.05 vs. DSS, # p < 0.05 vs. PC, ## p < 0.05 vs. LO, *** p < vs. HO.
Applsci 13 01590 g002
Figure 3. Cross-section of the colonic tissue stained with periodic acid and Schiff (PAS) reagent showing inner and outer mucus layer, in which arrow indicates the thickness of the intestinal mucus layer. (a) and Inner mucus layer thickness, mm (b). CON, control, saline; DSS, dextran sulfate sodium; PC, positive control, probiotic; LO, low dose of fermented onion; HO, high dose of fermented onion; FO, fresh onion. Values are expressed as mean ± SEM (n = 8).
Applsci 13 01590 g003
Figure 5. Effects on the plasma immunoglobulins and histology of rats administered fermented and fresh onions orally after 3 weeks of treatment. IgA level in plasma (a) and IgG level (b). CON, control, saline; DSS, dextran sulfate sodium; PC, positive control, probiotic; LO, low dose of fermented onion; HO, high dose of fermented onion; FO, fresh onion. Values are expressed as mean ± SEM (n = 8); different symbols in the bar graph were representative of statistical significance at (p < 0.05) measured by one-way ANOVA followed by Tukey’s test for multiple comparisons. * p < 0.05 vs. CON, ** p < 0.05 vs. DSS, # p < 0.05 vs. PC, ## p < 0.05 vs. LO, *** p < vs. HO.
Applsci 13 01590 g005
Figure 6. The Western blot analysis of inflammation-related proteins, NF-κB p65 (a), TNF-α (b), IL-1β (c), and IL-6 (d). Control, Saline; DSS, dextran sulfate sodium; PC, positive control, probiotic; LO, low dose of fermented onion; HO, high dose of fermented onion; FO, fresh onion. Values are expressed as mean ± SEM (n = 8).
Applsci 13 01590 g006
Figure 7. GC analysis of short-chain fatty acid (SCFA) content in the digestive cecum of rats. AA, acetic acid; PA, propionic acid; BA, butyric acid. Control, saline; DSS, dextran sulfate sodium; PC, positive control, probiotic; LO, low dose of fermented onion; HO, high dose of fermented onion; FO, fresh onion. Values are expressed as mean ± SEM (n = 8); different symbols in the bar graph were representative of statistical significance at (p < 0.05) measured by one-way ANOVA followed by Tukey’s test for multiple comparisons. * p < 0.05 vs. CON, ** p < 0.05 vs. DSS, # p < 0.05 vs. PC, ## p < 0.05 vs. LO, *** p < vs. HO.
Applsci 13 01590 g007
Disclaimer/Publisher’s Note: The statements, opinions and data contained in all publications are solely those of the individual author(s) and contributor(s) and not of MDPI and/or the editor(s). MDPI and/or the editor(s) disclaim responsibility for any injury to people or property resulting from any ideas, methods, instructions or products referred to in the content.

