Article

Machine Learning Pipeline for the Automated Prediction of MicrovascularInvasion in HepatocellularCarcinomas

by
Riccardo Biondi
1,†,
Matteo Renzulli
2,†,
Rita Golfieri
2,
Nico Curti
3,4,*,
Gianluca Carlini
3,*,
Claudia Sala
1,
Enrico Giampieri
3,
Daniel Remondini
3,4,
Giulio Vara
2,
Arrigo Cattabriga
2,
Maria Adriana Cocozza
2,
Luigi Vincenzo Pastore
2,
Nicolò Brandi
2,
Antonino Palmeri
1,
Leonardo Scarpetti
5,
Gaia Tanzarella
5,
Matteo Cescon
1,
Matteo Ravaioli
1,
Gastone Castellani
1,‡ and
Francesca Coppola
2,5,6,‡
1
Department of Medical and Surgical Sciences, University of Bologna, 40138 Bologna, Italy
2
Department of Radiology, IRCCS Azienda Ospedaliero-Universitaria di Bologna, 40138 Bologna, Italy
3
Department of Physics and Astronomy, University of Bologna, 40127 Bologna, Italy
4
INFN Sezione Bologna, Bologna University, 40127 Bologna, Italy
5
Dipartimento Diagnostica per Immagini AUSL Romagna, UOC Radiologia Faenza, 48018 Faenza, Italy
6
SIRM Foundation, Italian Society of Medical and Interventional Radiology, 40138 Bologna, Italy
*
Authors to whom correspondence should be addressed.
These authors contributed equally to this study.
Appl. Sci. 2023, 13(3), 1371; https://doi.org/10.3390/app13031371
Submission received: 19 December 2022 / Revised: 11 January 2023 / Accepted: 18 January 2023 / Published: 20 January 2023
(This article belongs to the Special Issue Artificial Intelligence and Radiomic Analysis in Medicine)

Abstract

:
Background: Microvascular invasion (MVI) is a necessary step in the metastatic evolution of hepatocellular carcinoma liver tumors. Predicting the onset of MVI in the initial stages of the tumors could improve patient survival and the quality of life. In this study, the possibility of using radiomic features to predict the presence/absence of MVI was evaluated. Methods: Multiphase contrast-enhanced computed tomography (CECT) images were collected from 49 patients, and the radiomic features were extracted from the tumor region and the zone of transition. The most-relevant features were selected; the dataset was balanced, and the presence/absence of MVI was classified. The dataset was split into training and test sets in three ways using cross-validation: the first applied feature selection and dataset balancing outside cross-validation; the second applied dataset balancing outside and feature selection inside; the third applied the entire pipeline inside the cross-validation procedure. Results: The features from the tumor areas on CECT showed both the portal and the arterial phases to be the most predictive. The three pipelines showed receiver operating characteristic area under the curve (ROC AUC) scores of 0.89, 0.84, and 0.61, respectively. Conclusions: The results obtained confirmed the efficiency of multiphase CECT and the ZOT in detecting MVI. The results showed a significant difference in the performance of the three pipelines, highlighting that a non-rigorous pipeline design could lead to model performance and generalization capabilities that are too optimistic.

1. Introduction

Hepatocellular carcinoma (HCC) is the most-common primary hepatic malignant tumor and represents an important global health problem, currently being the third-leading cause of cancer-related deaths in the general population and the first among cirrhotic patients [1]. Furthermore, its incidence has continuously increased and since 1980, and the number of cases has more than tripled. There are several treatment options for HCC; nevertheless, those that are associated with the highest 5-year survival rate, such as ablation, surgical resection, and liver transplantation (LT), can only be applied in the very early and the early stages of the disease [2], accounting for fewer than 20% of cases at presentation [3]. Unfortunately, all these potentially curative treatments are burdened by a high rate of recurrence [4], which negatively impacts overall survival [5,6]. For example, the cumulative tumor recurrence rates of HCCs ≤ 3 cm at three years after ablation in patients in the low-, middle-, and high-risk groups were 68.2%, 100%, and 100%, respectively [7]. Five-year HCC recurrence complicates 35% of cases after LT and 70% of cases after hepatic resection [8,9,10,11]. Vascular invasion, both macroinvasion and microvascular invasion (MVI), has been universally recognized as a predictor of recurrence and poor overall survival after treatment for HCC [4,12]. For example, vascular invasion is currently considered to be more informative than the Milan Criteria in predicting the prognosis [5,6,13].
The pre-treatment clinical significance of the two forms of vascular infiltration is clearly different. Macrovascular infiltration can be correctly diagnosed by imaging in the pre-treatment phase, thus allowing correctly classifying those patients in the advanced stage and directing them to the best treatment (systemic therapy) [2]. Conversely, the presence of MVI can be confirmed only post-operatively by histopathological analysis [13,14,15]. Therefore, its utility in the pre-treatment selection of patients to undergo the different types of treatment is not possible since, even with state-of-the-art treatment, its diagnosis still remains post-procedural. Moreover, in patients having the same Barcelona clinical liver cancer stage, such as patients in the very early or the early stages, who are fit for surgery or ablation and have the same tumor burden, it is important to differentiate those with the MVI of HCC in order to choose the best treatment for each patient. For example, since MVI has been proven to be one of the most-relevant prognostic factors for HCC recurrence after surgical treatment [16,17], in recent years, much effort has been made to identify reliable imaging findings in order to reach an accurate pre-procedural diagnosis of MVI in HCC patients [16,18,19]. Unfortunately, to date, these criteria for a preoperative radiological diagnosis of MVI in HCC have not been widely recognized and have not been reported in the current guidelines for the management of HCC [2]. In fact, despite its clinical relevance, the detection of MVI represents one of the most-difficult tasks to achieve in conventional imaging analysis since it can be obtained only indirectly, in relation to capsule disruption, irregular tumor margins, peritumoral enhancement, etc. [13].
A possible explanation for failing to evolve towards the pre-treatment radiological diagnosis of MVI is that it is merely based on direct observation by radiologists who rely on contrast differences between adjacent tissues; however, these fade in the peritumor, where the MVI is supposed to most frequently occur [17]. In addition, basic knowledge, diagnostic experience, and work status are other factors that might potentially further limit the accuracy of diagnosing MVI.
However, radiological images contain more information than what is visible to the radiologist’s eye. Texture and, more in general, radiomic analysis of contrast-enhanced CT (CECT) scans have already been applied by several authors in many medical image pipelines [18,19,20,21,22,23], proving their efficiency as a valuable tool in aiding the clinical diagnosis [6] and in predicting patient prognosis [5,24].
Radiomics is a form of imaging analysis that uses a series of data mining and machine learning (ML) algorithms to extract high-throughput information for the quantification of the predictive and prognostic features associated with clinical outcomes [18,25]. Therefore, the prediction of MVI on CT scans using radiomic analysis is considered to be an important research topic, potentially being able to overcome the current radiologically based imaging diagnosis in favor of the pre-treatment diagnosis of MVI in HCC. In particular, various papers [18,26] have focused their attention on the peripheral area of HCC called the zone of transition (ZOT), in which the CECT attenuation is lower than the attenuation of the solid center of the tumor, but is still higher than the attenuation of the surrounding non-tumoral tissue. The use of the ZOT in HCC radiomic analysis is motivated by the potential presence of MVI in the penumbra zone [18,26].
The present study proposed radiomic feature extraction and ML pipelines to predict MVI in HCC tumor volumes of interest (VOIs). A set of radiomic features was extracted from the tumor VOI and the ZOT; three different pipelines were used to investigate the problem of data contamination. In the first pipeline, data pre-processing was carried out, namely data balancing and feature selection before the training–test split, i.e., on the entire dataset at the beginning of the analysis. In the second pipeline, the feature selection step was moved inside the cross-validation procedure and the dataset balancing outside, i.e., performing part of the pre-processing on the entire dataset and the other part on the training set only. In the last pipeline, the pre-processing step was moved inside the cross-validation procedure, i.e., after the data splitting into the training and test sets [27]. The three pipelines were applied to the radiomic features extracted from the CECT data, monitoring the difference in model performance. The same pipelines were also applied to a synthetic radiomic dataset in order to additionally validate the authors’ hypothesis. In this way, it was verified that the performance observed depended only on the design of the pipeline and not on specific dataset characteristics.
In the radiomic literature, it is possible to find several examples in which the analysis has been carried in a way that introduces the cross-contamination between the training and test datasets. The authors felt that this was a critical point in radiomic research, which should be addressed in order to produce more reliable and reproducible results. For this reason, in the present analysis, the importance of considering the data cross-contamination was stressed.

2. Materials and Methods

2.1. Patient Selection

This study involved 49 patients selected from the Department of Experimental, Diagnostic and Speciality Medicine (DIMES) of the IRCCS Policlinic Sant’Orsola Malpighi Hospital. This single-center retrospective study was approved by the Institutional Review Board (No. 197/2020/Oss/AOUBo), and the requirement for informed consent was waived. All procedures involving human participants were performed in accordance with the 1975 Declaration of Helsinki and its subsequent amendments.
The patients included met the following criteria:
(a)
HCC diagnosis;
(b)
CECT (at least in arterial and portal phases) before resection;
(c)
MVI presence/absence confirmed by histological evaluation.
The CECT images were acquired using the following parameters: two different Multi-Slice CTs (64 slices, GE VCT or PHILIPS Ingenuity), with keV range 100–120, and tube current modulation with a low-quality index to optimize patient dose (slice thickness range 1–2 mm); the images were reconstructed with high-resolution kernels. The same dataset was already introduced in the study of Tovoli et al. [28].
Of the patients selected, there were 38 males (77.6%), having an age distribution of 44/65/83 years (min/mean/max). The ages reported were those at the time of the CT scan and radiological analysis. Six radiologists manually identified and labeled the nodules using the ImageJ software [29] (accessed on 10 January 2021). An expert radiologist with more than ten years of experience validated the annotations.
The radiologists identified a total of 55 nodules: 11 with microvascular invasion (MVI+) and 44 without it (MVI−). The distribution of the nodule size was 0.8/2.0/3.0 mm (min/mean/max).
The dataset used in this study was a subset of the data already presented by Renzulli et al. [20].

2.2. Detection of the Zone of Transition

The identification of the ZOT allowed including the peritumoral area and overcoming the limits of human segmentation. Currently, there is no standard definition of the ZOT; many studies have used different approaches for its detection [18,20]. Three-dimensional morphological erosions and dilations with a circular kernel of size 3 × 3 × 3 were applied to the tumor volumes. The difference between the dilated and the eroded VOIs was defined as the ZOT.
Management and analyses of the CT scans were carried out using the SimpleITK [30] python package (data accessed 14 July 2022). All the analyses were carried out using a 64-bit workstation machine (64 GB RAM memory and 1 CPU i9-9900K Intel, with 8 cores, and a GeForce RTX 2070 SUPER NVIDIA GPU). From a computational point of view, the extraction of a single ZOT VOI required less than 1 min on the authors’ server-grade machine.

2.3. Feature Extraction

A set of radiomic features was extracted from the manually identified VOIs and the ZOT derived. The radiomic features extracted consisted of the 1st-order statistics, 3D shape-based scores, 3D gray-level co-occurrence matrix statistics, gray-level run length matrix statistics, gray-level size zone matrix, neighboring gray-tone difference matrix statistics, and gray-level dependence matrix statistics. The whole set of features was extracted from the original images and from the transformed images obtained by the application of wavelet (W) and Laplacian of Gaussian (LoG) transformations. The same set of 1130 features was extracted from the tumor VOIs and the tumor ZOT on both the arterial and the portal phases. A set of 4520 features was collected for each nodule.
We used the Pyradiomics [31] python package for the extraction of the radiomic features (data accessed 14 July 2022). From a computational point of view, the extraction of radiomic features required fewer than 10 min on the authors’ server-grade machine.

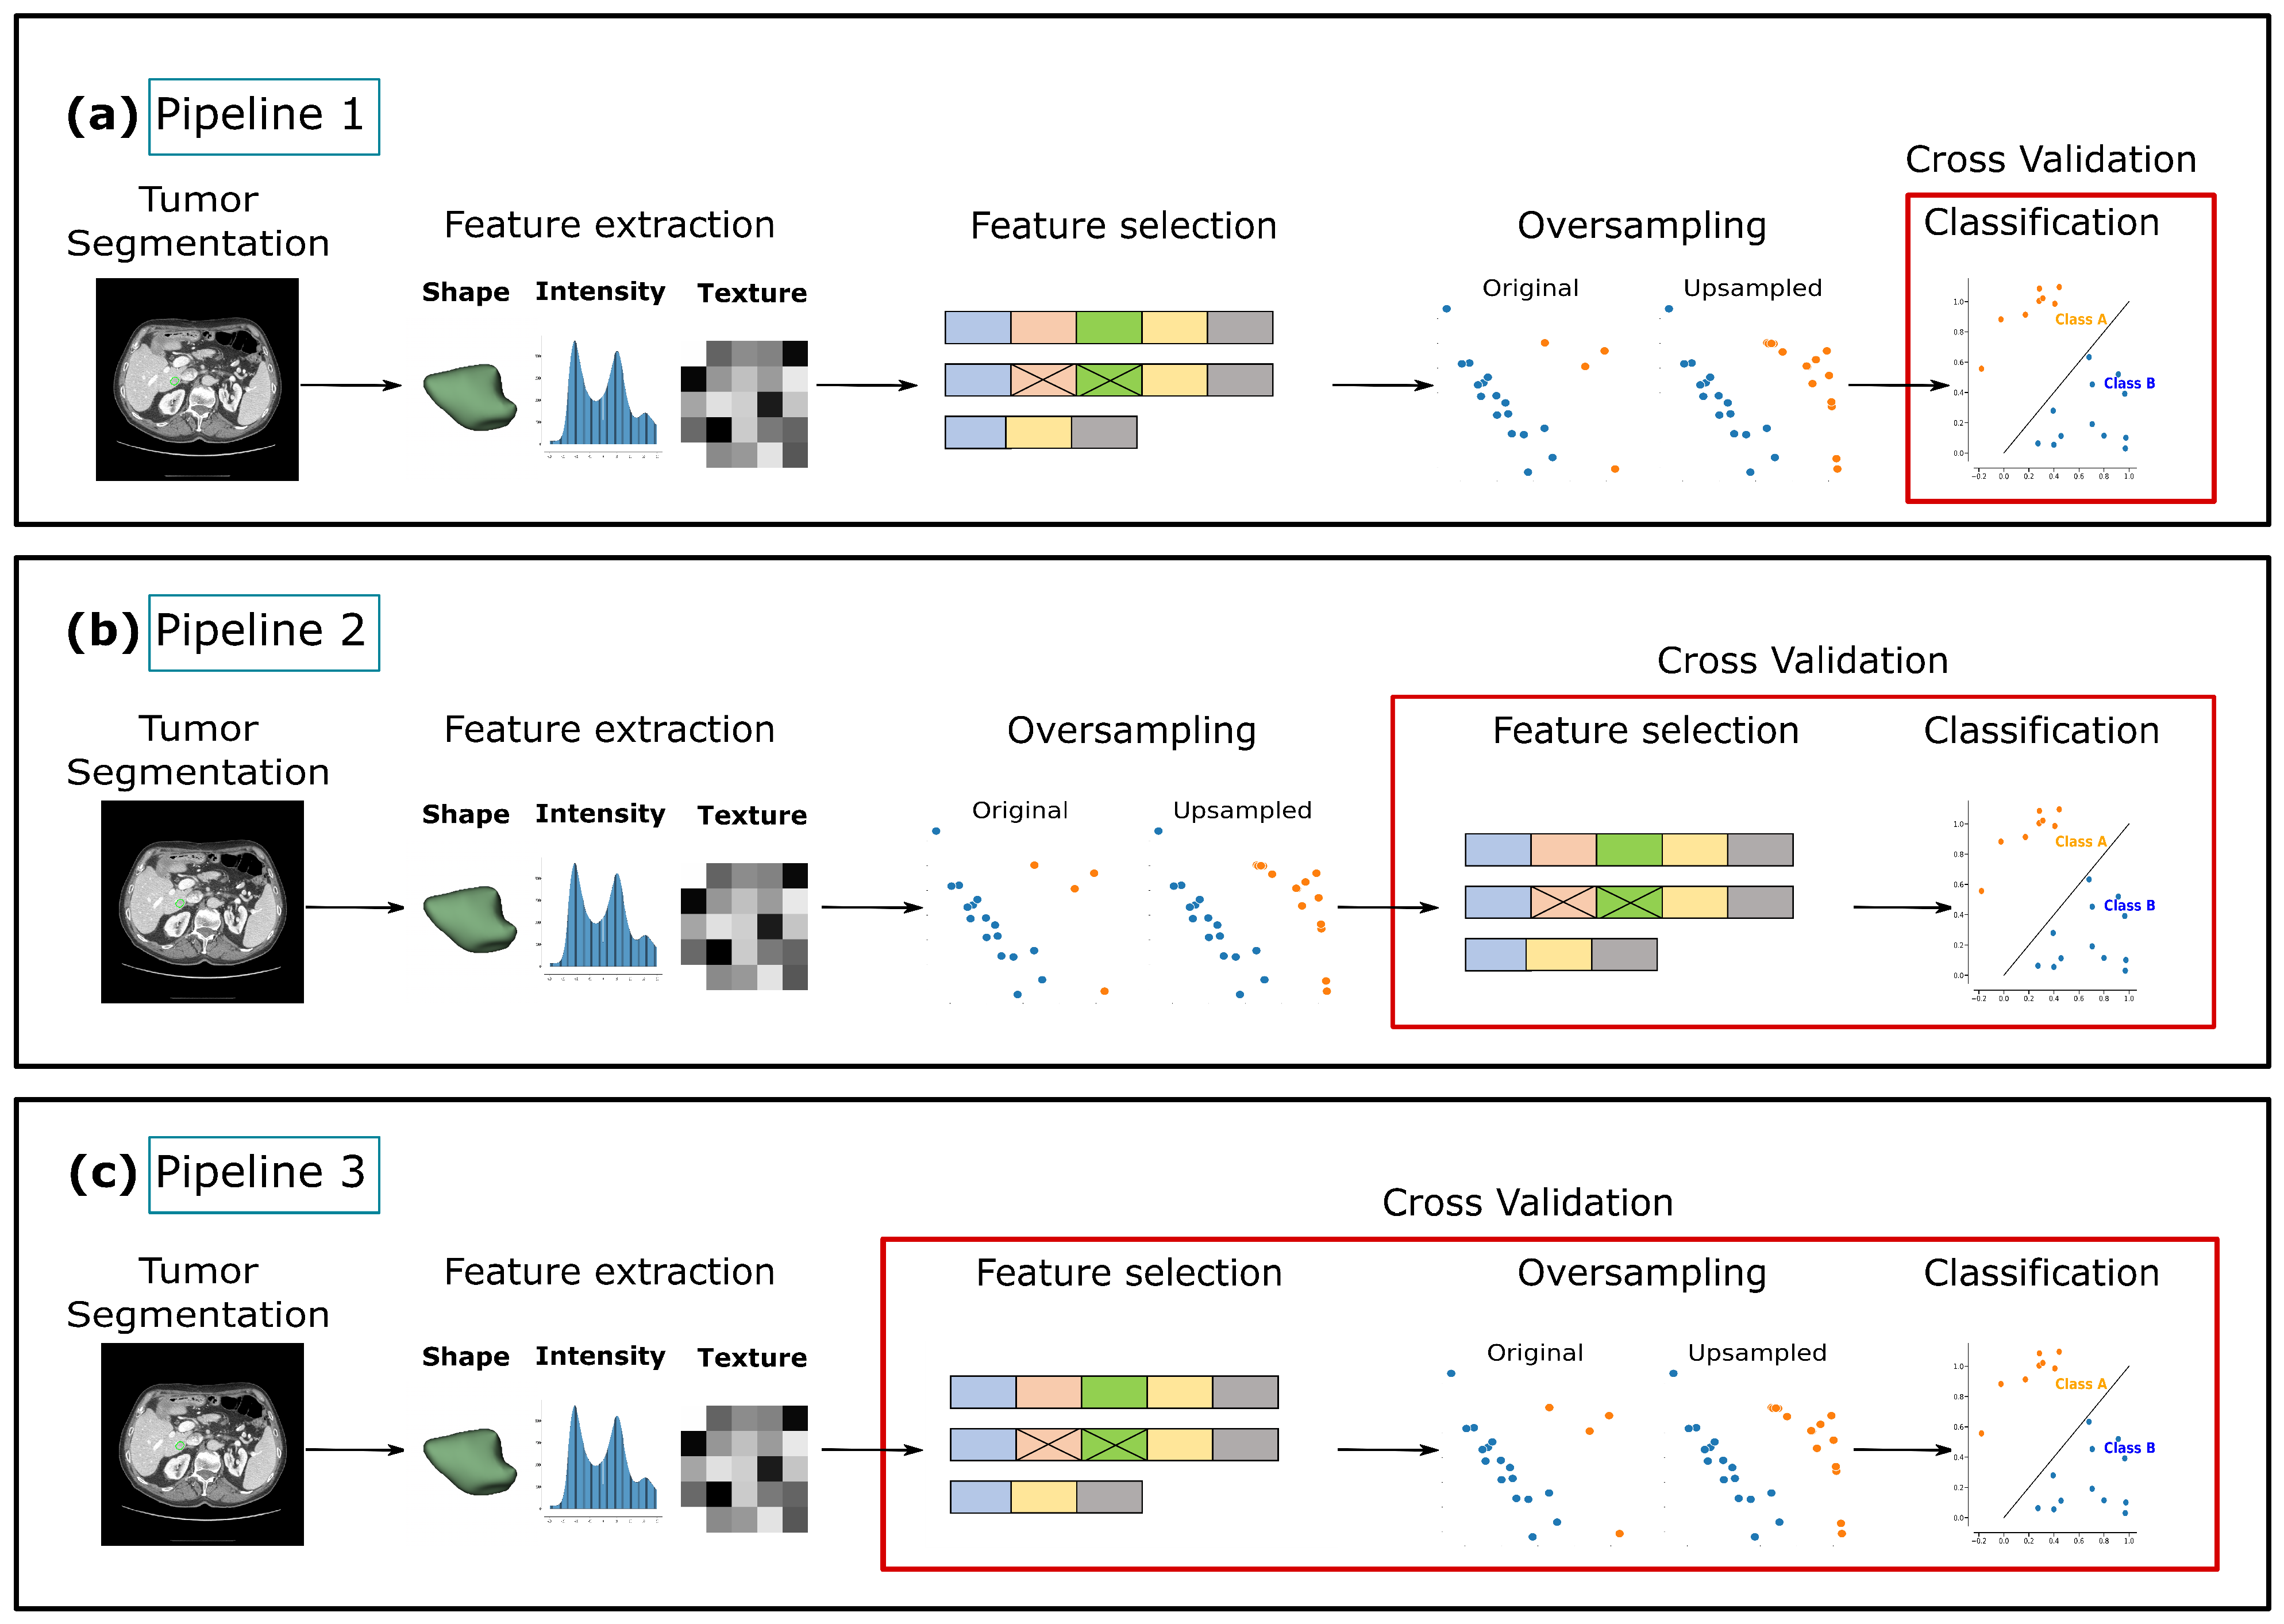
2.4. Pipeline Overview
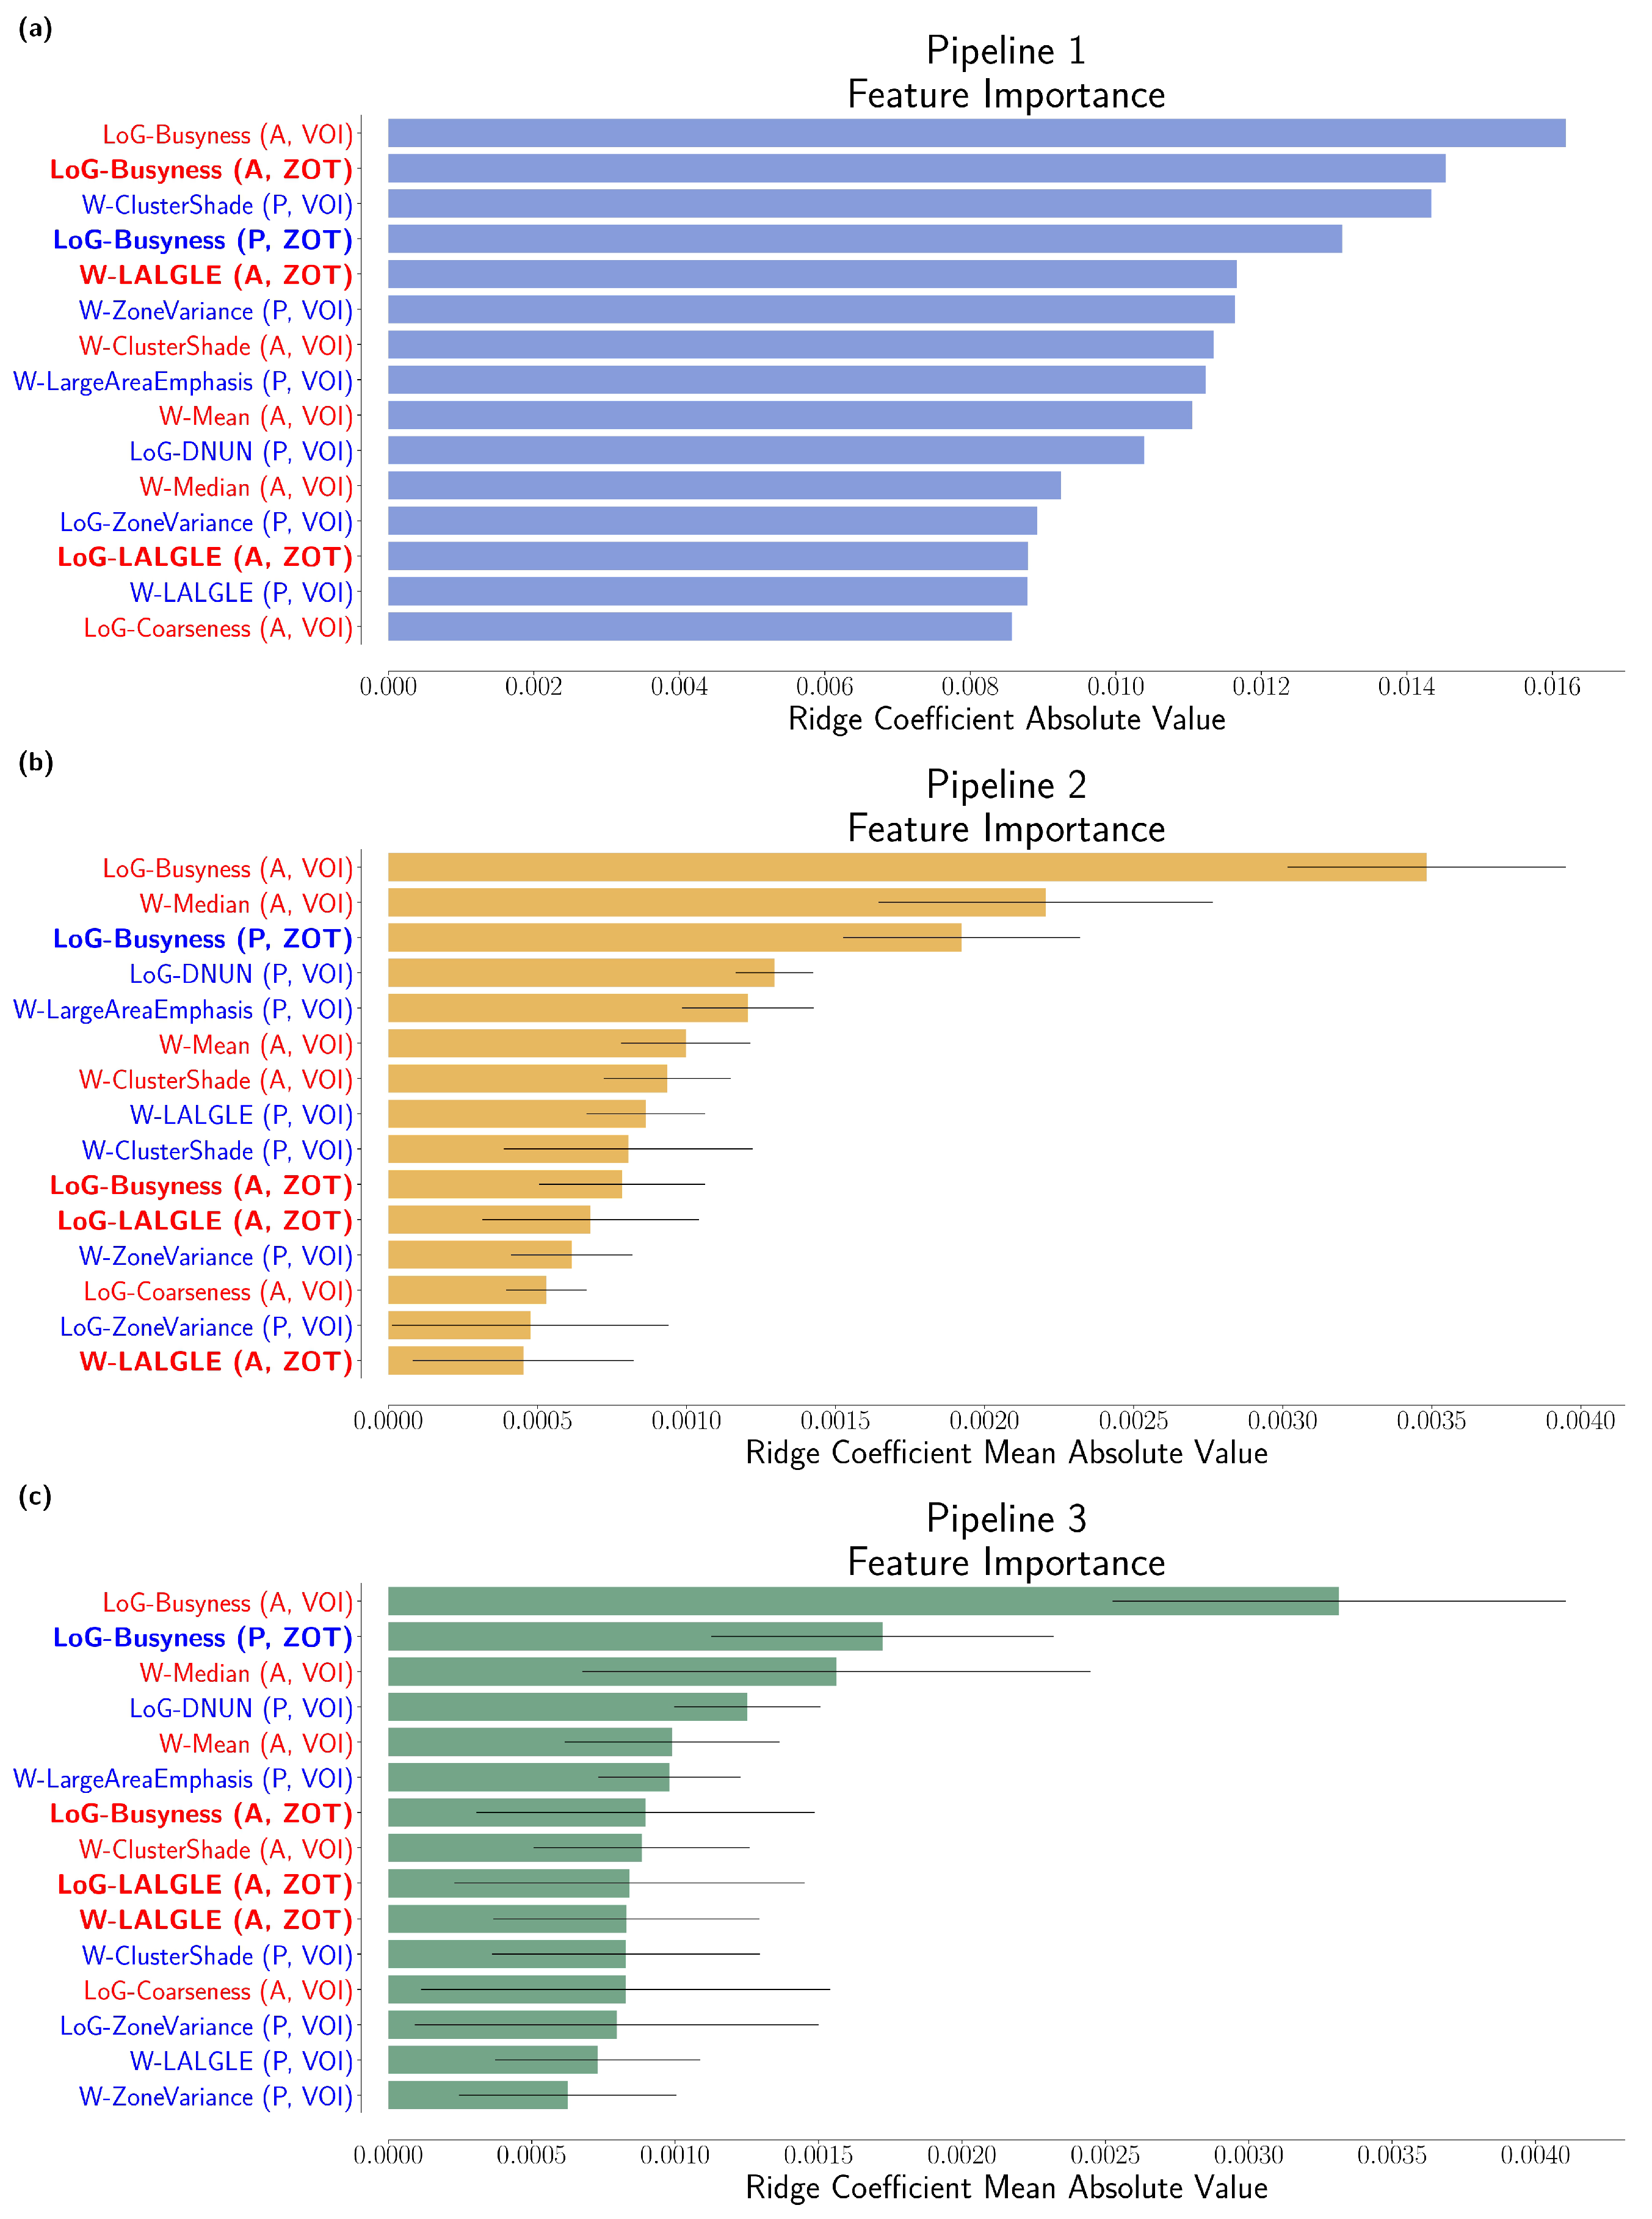
The MVI prediction can be considered to be a classification problem in which the two classes are represented by MVI+ and MVI−.
Each radiomic feature was scaled according to the median and the interquartile range of its distribution of values. Ridge regression was applied by selecting the 15 most-relevant features according to the absolute values of their coefficient; the minority class (MVI+) was then oversampled using the synthetic minority oversampling technique (SMOTE) [32], with the aim of balancing the dataset classes. Finally, a classification was established using support vector classification (SVC) with a linear kernel on the reduced and balanced dataset. The choice of the SVC classifier model was determined by analyses carried out during the preliminary phase of this study. For the sake of brevity, a comparison with other classifier models was excluded from this study with the aim of focusing the attention on the comparison of the pipelines developed. Due to the limited number of samples, the prediction and evaluation were carried out using the leave-one-out (LOO) cross-validation technique, and the prediction results were used to evaluate the model performance.
Three versions of this pipeline were introduced. In the first one (Pipeline 1), the pre-processing was applied outside the cross-validation, i.e., on the entire dataset. In the second one (Pipeline 2), the pre-processing step order was changed. The dataset balancing was applied to the entire dataset, namely outside the cross-validation, followed by the feature selection and classification applied after each splitting, i.e., only on the training data. In the third one (Pipeline 3), the pre-processing part was applied inside the cross-validation procedure, i.e., only on the training data. The schemes of the three proposed pipelines are reported in Figure 1.
The three pipelines were tested on a synthetic dataset created using a toy model generator provided by the scikit-learn package [33]. This was carried out to verify that the authors’ assumption regarding the effect of data cross-contamination in radiomic analyses also applied to more general contexts and was not an incidental effect induced by the limited number of samples in the present dataset. The synthetic data model generator creates normally distributed clusters of points on a hypercube of arbitrary dimension and assigns an equal number of clusters to each class (2 in the present case). It introduces interdependence between features and adds various types of noise to the data. The model allows setting the number of classes and informative, redundant, and repeated features.
Two-thousand features for 100 samples were randomly generated using the synthetic data model generator. A number of informative features were used, realistically small as compared to the noise, i.e., 20 features out of 2000. Eighty samples out of one-hundred from Class 0 and twenty from Class 1 were generated, introducing an unbalancing between the classes. In this way, a dataset was created having characteristics similar to a radiomic dataset, i.e., low number of informative features, strongly correlated features, redundant features, and a limited number of samples.
The performance of each pipeline was estimated according to the following metrics:
Sensitivity = TP TP + FN ; Specificity = TN TN + FP ; Precision = TP TP + FP ; Balanced   Accuracy = Sensitivity + Specificity 2 ; AUC = Area   Under   the   Receiver   Operative   Characteristic   ( ROC )   Curve .
where TP, TN, FP, and FN are the true positive, true negatives, false positives, and false negative scores, respectively, and the AUC score is evaluated as the area under the ROC curve, i.e., true positive rate vs. false positive rate.
We used the scikit-learn [33] and imbalanced-learn [34] python packages (accessed on 14 July 2022) for implementing all the ML analyses.

3. Results

MVI Prediction

The radiomic analysis on the features extracted from tumor and ZOT VOIs was carried out using the schemes of the three proposed pipelines. In Table 1, the classification results are shown.
For all the pipeline schemes, the features selected by the ridge and their importance in the ridge feature selection were monitored. In Figure 2a, the absolute values of the ridge coefficient for the 15 selected features are reported. In Figure 2b,c, the mean and standard deviation of the absolute value of the most-frequent 15 features selected by Pipelines 2 and 3 are reported. For each fold of the LOO cross-validation paradigm, the 15 most-informative features were computed. The mean and standard deviation of the absolute values of the ridge coefficient of the 15 most frequently selected features were computed.
Pipelines 1, 2, and 3 were applied to the synthetic dataset, and the results are reported in Table 2.

4. Discussion

The procedure proposed in Pipeline 3 obtained an ROC AUC score of 0.61. This result was in agreement with the hypothesis that radiomic features extracted from tumor VOIs and the ZOT allowed identifying the presence of MVI from CT images. However, the results obtained were not as good as other state-of-the-art results [18,19,21]. According to the authors, this limit could have been due to the limited number of samples involved in the study. This limit was a direct consequence of the single-center nature of the present study, which reduced the possible heterogeneity of the samples and affected the generalization capabilities of the pipelines in this study. Novel techniques capable of increasing the amount of data based on synthetic image generation have already been proposed in the literature [35]; however, their use could introduce unpredictable biases in the radiomic analysis and go beyond the aim of the present study. Furthermore, the dataset used in this study involved small tumor VOIs, making the radiomic analysis more difficult [20]. Moreover, many studies have considered not only radiomic features, but also clinical features [18,19,21]. The authors obtained notably better results using the scheme proposed in Pipelines 1 and 2, achieving an ROC AUC score of 0.89 and 0.84, respectively. These results are in agreement with the current state-of-the-art results [20,23] obtained with equivalent pipelines.
The results obtained highlighted the criticality of the pre-processing step inside a radiomic pipeline. The application of Pipeline 1 led to results 45% higher than Pipeline 3, by simply excluding the pre-processing steps from the cross-validation procedure. In fact, Pipeline 1 carried out the feature selection and oversampling using the entire set of available data, introducing a putative source of cross-contamination of the training and the test samples. The same behavior was observed when comparing Pipelines 2 and 3. Pipeline 2 obtained results 37% higher than Pipeline 3, by excluding the oversampling step from the cross-validation. The pipeline designs that carried out the oversampling before splitting could show the contamination of the test set with the training data. In both Pipeline 1 and Pipeline 2, the presence of almost redundant data in both the training and the test sets introduced the probability of overfitting, producing classification results that were too optimistic. He et al. and Zhang et al. [19,21] assessed model performance with configurations equivalent to those presented in this study, i.e., they evaluated the pipeline performances using both the training and the test datasets. Their results showed a higher ROC AUC score for the pipeline tested on the training set, i.e., with a design equivalent to the one presented in Pipelines 1 and 2. This behavior validated the authors’ hypothesis regarding cross-contamination and its effect on evaluating pipeline performance and generalization capabilities. In this study, the different pipeline designs were presented for the sake of completeness and a direct comparison of the present results with studies already published.
Pipelines 1, 2, and 3 were applied to a synthetic dataset, obtaining ROC AUC scores of 0.89, 0.89, and 0.78, respectively. Notably better results were observed using Pipeline 1 and Pipeline 2. This enforced the results obtained on the real radiomic dataset, confirming the potential cross-contamination problem in general radiomic studies. The same behavior observed on a synthetic dataset additionally validated the authors’ hypothesis, confirming that cross-contamination is a methodology problem.
Pipelines 1, 2, and 3 identified the same set of features as the most relevant. It was observed that the features extracted from the VOIs (11 out of 15) were prominent, with a balancing between the portal (6) and the arterial (5) phases, depicting the importance of multi-phase CECT acquisition, which allowed considering both the arterial and the portal veins for the evaluation of the MVI lesions. This result confirmed the hypothesis proposed regarding the stronger predictive value of multi-phase analysis. The pipelines selected 4 out of 15 features from the ZOT volumes; however, their coefficient relevance suggested that the tumor penumbra could play a valuable role in MVI classification. This result was in agreement with the biomedical evidence of possible MVI presence in ZOT volumes.

5. Conclusions

In this study, a radiomic pipeline was introduced for the automated identification of MVI presence/absence using CT images, i.e., avoiding invasive procedures. Features extracted from CECT scans related to the arterial and the portal phases were used.
The importance of using features from multiple CECT phases to identify the presence/absence of MVI was shown. The importance of including information from the peritumoral volumes was highlighted: ZOT features were shown to be relevant for MVI classification. Introducing radiomic analysis, also of the ZOT volumes, has the potential to improve the robustness of the features extracted, providing information regarding tumor proliferation.
The impact of data pre-processing on the final classification model was also highlighted. The application of feature selection and data oversampling on the entire dataset introduced cross-contamination, leading to over-estimation of the classifier’s performance and generalization capabilities. The results obtained by these types of pipelines could be affected by biases, in particular for studies involving a limited number of patients. In conclusion, more attention should be given to avoiding these possible sources of overfitting during the design of radiomic pipelines.

Author Contributions

Conceptualization, F.C., E.G., M.R. (Matteo Renzulli), M.C., M.R. (Matteo Ravaioli), G.C. (Gastone Castellani) and R.G.; data curation, F.C., G.V., L.S., G.T., A.C., M.A.C., L.V.P., A.P. and N.B.; formal analysis, R.B. and G.C. (Gianluca Carlini); methodology, R.B., G.C. (Gianluca Carlini), N.C., M.R. (Matteo Renzulli), C.S., F.C. and E.G.; project administration, G.C. (Gastone Castellani) and R.G.; software, R.B., G.C. (Gianluca Carlini), N.C., C.S. and E.G.; supervision, F.C., G.C. (Gastone Castellani) and R.G.; writing original draft, R.B., G.C. (Gianluca Carlini), N.C., M.R. (Matteo Renzulli), E.G., G.V., A.C., M.A.C., L.V.P., A.P. and N.B., writing—reviewing and editing, D.R., F.C., M.C., M.R. (Matteo Ravaioli), G.C. (Gastone Castellani) and R.G. All authors have read and agreed to the published version of the manuscript.

Funding

This research received no external funding.

Institutional Review Board Statement

This single-center retrospective study was approved by the Institutional Review Board (No. 197/2020/Oss/AOUBo), and the requirement for informed consent was waived. All procedures involving human participants were performed in accordance with the 1975 Declaration of Helsinki and its subsequent amendments.

Informed Consent Statement

This study was an observational, retrospective, single-center study and was approved by our local Institutional Review Board. Informed consent was waived by the Institutional Review Board owing to the retrospective nature of the study.

Data Availability Statement

The data are not available due to patient privacy.

Acknowledgments

The authors would like to acknowledge Laura Verzellesi, who helped in the preliminary analyses of the study, providing useful support for the development of the radiomic pipelines.

Conflicts of Interest

The authors declare no conflict of interest.

References

  1. World Health Organization. Liver Factsheet. In Globocan; WHO: Geneva, Switzerland, 2022. [Google Scholar]
  2. Galle, P.R.; Forner, A.; Llovet, J.M.; Mazzaferro, V.; Piscaglia, F.; Raoul, J.L.; Schirmacher, P.; Vilgrain, V. EASL Clinical Practice Guidelines: Management of hepatocellular carcinoma. J. Hepatol. 2018, 69, 182–236. [Google Scholar] [CrossRef] [Green Version]
  3. Moreno-Luna, L.E.; Yang, J.D.; Sanchez, W.; Paz-Fumagalli, R.; Harnois, D.M.; Mettler, T.A.; Gansen, D.N.; de Groen, P.C.; Lazaridis, K.N.; Narayanan Menon, K.V.; et al. Efficacy and Safety of Transarterial Radioembolization Versus Chemoembolization in Patients with Hepatocellular Carcinoma. Cardiovasc. Interv. Radiol. 2013, 36, 714–723. [Google Scholar] [CrossRef] [Green Version]
  4. Özgün, G.; Haberal Reyhan, N.; Özdemir, B.; Haberal, M. Liver transplant for hepatocellular carcinoma: Pathologic point of view. Exp. Clin. Transplant. 2017, 15, 50–54. [Google Scholar]
  5. Lim, K.C.; Chow, P.K.H.; Allen, J.C.; Chia, G.S.; Lim, M.; Cheow, P.C.; Chung, A.Y.; Ooi, L.L.; Tan, S.B. Microvascular Invasion Is a Better Predictor of Tumor Recurrence and Overall Survival Following Surgical Resection for Hepatocellular Carcinoma Compared to the Milan Criteria. Ann. Surg. 2011, 254, 108–113. [Google Scholar] [CrossRef]
  6. Shen, J.; Wen, J.; Li, C.; Wen, T.; Yan, L.; Li, B.; Yang, J.; Lu, C. The prognostic value of microvascular invasion in early-intermediate stage hepatocelluar carcinoma: A propensity score matching analysis. BMC Cancer 2018, 18, 278. [Google Scholar] [CrossRef]
  7. Llovet, J.M.; Beaugrand, M. Hepatocellular carcinoma: Present status and future prospects. J. Hepatol. 2003, 38, 136–149. [Google Scholar] [CrossRef]
  8. Zimmerman, M.A.; Ghobrial, R.M.; Tong, M.J.; Hiatt, J.R.; Cameron, A.M.; Hong, J.; Busuttil, R.W. Recurrence of Hepatocellular Carcinoma Following Liver Transplantation: A Review of Preoperative and Postoperative Prognostic Indicators. Arch. Surg. 2008, 143, 182–188. [Google Scholar] [CrossRef] [Green Version]
  9. Marshall, A.E.; Rushbrook, S.M.; Vowler, S.L.; Palmer, C.R.; Davies, R.J.; Gibbs, P.; Davies, S.E.; Coleman, N.; Alexander, G.J.M. Tumor recurrence following liver transplantation for hepatocellular carcinoma: Role of tumor proliferation status. Liver Transplant. 2010, 16, 279–288. [Google Scholar] [CrossRef]
  10. Fisher, R.A.; Kulik, L.M.; Freise, C.E.; Lok, A.S.F.; Shearon, T.H.; Brown, R.S., Jr.; Ghobrial, R.M.; Fair, J.H.; Olthoff, K.M.; Kam, I.; et al. Hepatocellular Carcinoma Recurrence and Death Following Living and Deceased Donor Liver Transplantation. Am. J. Transplant. 2007, 7, 1601–1608. [Google Scholar] [CrossRef] [Green Version]
  11. Unitt, E.; Marshall, A.; Gelson, W.; Rushbrook, S.M.; Davies, S.; Vowler, S.L.; Morris, L.S.; Coleman, N.; Alexander, G.J. Tumour lymphocytic infiltrate and recurrence of hepatocellular carcinoma following liver transplantation. J. Hepatol. 2006, 45, 246–253. [Google Scholar] [CrossRef]
  12. Erridge, S.; Pucher, P.H.; Markar, S.R.; Malietzis, G.; Athanasiou, T.; Darzi, A.; Sodergren, M.H.; Jiao, L.R. Meta-analysis of determinants of survival following treatment of recurrent hepatocellular carcinoma. Br. J. Surg. 2017, 104, 1433–1442. [Google Scholar] [CrossRef]
  13. Zhang, X.; Li, J.; Shen, F.; Lau, W.Y. Significance of presence of microvascular invasion in specimens obtained after surgical treatment of hepatocellular carcinoma. J. Gastroenterol. Hepatol. 2018, 33, 347–354. [Google Scholar] [CrossRef] [Green Version]
  14. Shindoh, J.; Kobayashi, Y.; Kawamura, Y.; Akuta, N.; Kobayashi, M.; Suzuki, Y.; Ikeda, K.; Hashimoto, M. Microvascular invasion and a size cutoff value of 2 cm predict long-term oncological outcome in multiple hepatocellular carcinoma: Reappraisal of the American Joint Committee on Cancer staging system and validation using the surveillance, epidemiology, and end-results database. Liver Cancer 2020, 9, 156–166. [Google Scholar]
  15. Rodríguez-Perálvarez, M.; Luong, T.V.; Andreana, L.; Meyer, T.; Dhillon, A.P.; Burroughs, A.K. A systematic review of microvascular invasion in hepatocellular carcinoma: Diagnostic and prognostic variability. Ann. Surg. Oncol. 2013, 20, 325–339. [Google Scholar] [CrossRef]
  16. Banerjee, S.; Wang, D.S.; Kim, H.J.; Sirlin, C.B.; Chan, M.G.; Korn, R.L.; Rutman, A.M.; Siripongsakun, S.; Lu, D.; Imanbayev, G.; et al. A computed tomography radiogenomic biomarker predicts microvascular invasion and clinical outcomes in hepatocellular carcinoma. Hepatology 2015, 62, 792–800. [Google Scholar] [CrossRef] [Green Version]
  17. Roayaie, S.; Blume, I.N.; Thung, S.N.; Guido, M.; Fiel, M.I.; Hiotis, S.; Labow, D.M.; Llovet, J.M.; Schwartz, M.E. A system of classifying microvascular invasion to predict outcome after resection in patients with hepatocellular carcinoma. Gastroenterology 2009, 137, 850–855. [Google Scholar] [CrossRef] [Green Version]
  18. Xu, X.; Zhang, H.L.; Liu, Q.P.; Sun, S.W.; Zhang, J.; Zhu, F.P.; Yang, G.; Yan, X.; Zhang, Y.D.; Liu, X.S. Radiomic analysis of contrast-enhanced CT predicts microvascular invasion and outcome in hepatocellular carcinoma. J. Hepatol. 2019, 70, 1133–1144. [Google Scholar] [CrossRef]
  19. Zhang, X.; Ruan, S.; Xiao, W.; Shao, J.; Tian, W.; Liu, W.; Zhang, Z.; Wan, D.; Huang, J.; Huang, Q.; et al. Contrast-enhanced CT radiomics for preoperative evaluation of microvascular invasion in hepatocellular carcinoma: A two-center study. Clin. Transl. Med. 2020, 10, e111. [Google Scholar] [CrossRef]
  20. Renzulli, M.; Mottola, M.; Coppola, F.; Cocozza, M.A.; Malavasi, S.; Cattabriga, A.; Vara, G.; Ravaioli, M.; Cescon, M.; Vasuri, F.; et al. Automatically extracted machine learning features from preoperative CT to early predict microvascular invasion in HCC: The role of the zone of transition (ZOT). Cancers 2022, 14, 1816. [Google Scholar] [CrossRef]
  21. He, M.; Zhang, P.; Ma, X.; He, B.; Fang, C.; Jia, F. Radiomic feature-based predictive model for microvascular invasion in patients with hepatocellular carcinoma. Front. Oncol. 2020, 10, 574228. [Google Scholar] [CrossRef]
  22. Meng, X.P.; Wang, Y.C.; Zhou, J.Y.; Yu, Q.; Lu, C.Q.; Xia, C.; Tang, T.Y.; Xu, J.; Sun, K.; Xiao, W.; et al. Comparison of MRI and CT for the prediction of microvascular invasion in solitary hepatocellular carcinoma based on a non-radiomics and radiomics method: Which imaging modality is better? J. Magn. Reson. Imaging 2021, 54, 526–536. [Google Scholar] [CrossRef] [PubMed]
  23. Ni, M.; Zhou, X.; Lv, Q.; Li, Z.; Gao, Y.; Tan, Y.; Liu, J.; Liu, F.; Yu, H.; Jiao, L.; et al. Radiomics models for diagnosing microvascular invasion in hepatocellular carcinoma: Which model is the best model? Cancer Imaging 2019, 19, 60. [Google Scholar] [CrossRef] [PubMed]
  24. Cuccurullo, V.; Di Stasio, G.D.; Mazzarella, G.; Cascini, G.L. Microvascular invasion in HCC: The molecular imaging perspective. Contrast Media Mol. Imaging 2018, 2018, 9487938. [Google Scholar] [CrossRef] [Green Version]
  25. Kumar, V.; Gu, Y.; Basu, S.; Berglund, A.; Eschrich, S.A.; Schabath, M.B.; Forster, K.; Aerts, H.J.W.L.; Dekker, A.; Fenstermacher, D.; et al. Radiomics: The process and the challenges. Magn. Reson. Imaging 2012, 30, 1234–1248. [Google Scholar] [CrossRef] [PubMed] [Green Version]
  26. Chong, H.H.; Yang, L.; Sheng, R.F.; Yu, Y.L.; Wu, D.J.; Rao, S.X.; Yang, C.; Zeng, M.S. Multi-scale and multi-parametric radiomics of gadoxetate disodium-enhanced MRI predicts microvascular invasion and outcome in patients with solitary hepatocellular carcinoma ≤ 5 cm. Eur. Radiol. 2021, 31, 4824–4838. [Google Scholar] [CrossRef]
  27. Farrow, E.; Moore, J.; Gašević, D. Analysing discussion forum data. In Proceedings of the 9th International Conference on Learning Analytics & Knowledge, Tempe, AZ, USA, 4–8 March 2019; ACM: New York, NY, USA, 2019. [Google Scholar]
  28. Tovoli, F.; Renzulli, M.; Negrini, G.; Brocchi, S.; Ferrarini, A.; Andreone, A.; Benevento, F.; Golfieri, R.; Morselli-Labate, A.M.; Mastroroberto, M.; et al. Inter-operator variability and source of errors in tumour response assessment for hepatocellular carcinoma treated with sorafenib. Eur. Radiol. 2018, 28, 3611–3620. [Google Scholar] [CrossRef]
  29. Schneider, C.A.; Rasband, W.S.; Eliceiri, K.W. NIH Image to ImageJ: 25 years of image analysis. Nat. Methods 2012, 9, 671–675. [Google Scholar] [CrossRef]
  30. Beare, R.; Lowekamp, B.; Yaniv, Z. Image Segmentation, Registration and Characterization in R with SimpleITK. J. Stat. Softw. 2018, 86, 30288153. [Google Scholar] [CrossRef] [Green Version]
  31. van Griethuysen, J.J.M.; Fedorov, A.; Parmar, C.; Hosny, A.; Aucoin, N.; Narayan, V.; Beets-Tan, R.G.H.; Fillion-Robin, J.C.; Pieper, S.; Aerts, H.J.W.L. Computational radiomics system to decode the radiographic phenotype. Cancer Res. 2017, 77, e104–e107. [Google Scholar] [CrossRef] [Green Version]
  32. Chawla, N.V.; Bowyer, K.W.; Hall, L.O.; Kegelmeyer, W.P. SMOTE: Synthetic Minority Over-sampling Technique. J. Artif. Intell. Res. 2002, 16, 321–357. [Google Scholar] [CrossRef]
  33. Pedregosa, F.; Varoquaux, G.; Gramfort, A.; Michel, V.; Thirion, B.; Grisel, O.; Blondel, M.; Prettenhofer, P.; Weiss, R.; Dubourg, V.; et al. Scikit-learn: Machine Learning in Python. J. Mach. Learn. Res. 2011, 12, 2825–2830. [Google Scholar]
  34. Lemaître, G.; Nogueira, F.; Aridas, C.K. Imbalanced-learn: A Python Toolbox to Tackle the Curse of Imbalanced Datasets in Machine Learning. J. Mach. Learn. Res. 2017, 18, 1–5. [Google Scholar]
  35. Shen, Z.; Ding, F.; Jolfaei, A.; Yadav, K.; Vashisht, S.; Yu, K. DeformableGAN: Generating Medical Images with Improved Integrity for Healthcare Cyber Physical Systems. In IEEE Transactions on Network Science and Engineering; IEEE: Toulouse, France, 2022; pp. 1–13. [Google Scholar] [CrossRef]
Figure 1. Scheme of the three pipelines proposed. Starting from the CECT, the manual VOI, and derived ZOT, the entire set of 4520 features was extracted. (a) Pipeline 1, feature selection and data oversampling were carried out on the entire radiomic dataset. It was then classified using the leave-one-out cross-validation, i.e., splitting the dataset into training and test sets, where the test set consisted of only one sample. (b) Pipeline 2, the second version of the pipeline in which oversampling was carried out on the entire dataset and feature selection and classification were carried out using leave-one-out cross-validation, i.e., feature selection classification was carried out only on the training dataset. (c) Pipeline 3, the third version of the pipeline, in which feature selection, oversampling, and classification were carried out using leave-one-out cross-validation, i.e., feature selection and data oversampling were carried out only on the training dataset.
Applsci 13 01371 g001
Figure 2. The importance of the 15 features selected according to the absolute value of the ridge coefficients. For each feature selected, it is reported whether it belonged to the original image (O), wavelet (W), or Laplacian of Gaussian (LoG). Moreover, whether they were computed from the CECT in the arterial (A) or the portal (P) phase is specified as the tumor (VOI) or zone of transition (ZOT) volumes. The features from the arterial phase, the portal phase, and the ZOT volume are highlighted in red, blue, and bold, respectively. (a) Absolute values of the ridge coefficients for the 15 selected features by Pipeline 1, i.e., computed considering the entire dataset. (b) The mean and standard deviation of the absolute values of the ridge coefficients for the 15 most-frequent features selected by Pipeline 2. (c) The mean and standard deviation of the absolute values of the ridge coefficient for the 15 most-frequent features selected by Pipeline 3.
Applsci 13 01371 g002
Table 1. Evaluation metrics obtained by applying Pipelines 1, 2, and 3 to the radiomic dataset. For each pipeline, the sensitivity, specificity, precision, balanced accuracy, and ROC AUC scores obtained on the test sets are reported.
MethodSensitivitySpecificityPrecisionBalanced AccuracyROC AUC
Pipeline 1 1.00 0.79 0.83 0.90 0.89
Pipeline 2 0.93 0.77 0.80 0.85 0.84
Pipeline 3 0.18 0.79 0.18 0.47 0.61
Table 2. Evaluation metrics obtained by the application of Pipelines 1, 2, and 3 on the synthetic radiomic dataset. The sensitivity, specificity, precision, balanced accuracy, and ROC AUC scores obtained on the test sets are reported for each pipeline.
MethodSensitivitySpecificityPrecisionBalanced AccuracyROC AUC
Pipeline 1 0.89 0.79 0.81 0.84 0.89
Pipeline 2 0.89 0.75 0.78 0.82 0.89
Pipeline 3 0.68 0.81 0.46 0.75 0.78
Disclaimer/Publisher’s Note: The statements, opinions and data contained in all publications are solely those of the individual author(s) and contributor(s) and not of MDPI and/or the editor(s). MDPI and/or the editor(s) disclaim responsibility for any injury to people or property resulting from any ideas, methods, instructions or products referred to in the content.

