


Al-Foam Compression Tests in Parallel and Serial Concepts

1
Doctoral School on Safety and Security Sciences, Óbuda University, H-1034 Budapest, Hungary
2
Air- and Road Vehicle Department, Faculty of Engineering, University of Debrecen, H-4028 Debrecen, Hungary
3
Department of Mechanical Engineering, Faculty of Engineering, University of Debrecen, H-4028 Debrecen, Hungary
4
Department of the Informatic Technology, Milton Friedman University, H-1039 Budapest, Hungary
5
Bánki Donát Faculty of Mechanical and Safety Engineering, Óbuda University, H-1038 Budapest, Hungary
*
Author to whom correspondence should be addressed.
Appl. Sci. 2023, 13(2), 883; https://doi.org/10.3390/app13020883
Submission received: 7 December 2022
/
Revised: 30 December 2022
/
Accepted: 4 January 2023
/
Published: 9 January 2023
(This article belongs to the Special Issue Composite Structures - Modelling, Testing and Manufacturing)
Abstract
:Taking into consideration the additional weight of a vehicle, today’s requirements can only be met using new materials and designs. The application of metal foam is one of the most promising methods of enhancing the impact energy absorption ability of the crumple zone. The energy-absorbing capacity of thin-walled structures filled with metal foams during compression can be notably improved, which results in lower loading on the passengers. The main goal of our research is to develop a new design that is suited to absorb more impact energy while taking into consideration weight optimization. The authors wanted to unveil the effect of the inhomogeneous filler material in these thin-walled structures. Therefore, the present study investigates the compression test of two metal foams of different densities, in different ways. In the first section, the foams were compressed independently from each other by a recording of a stress–strain diagram. After the single compression, the foams were loaded together, first in parallel, and subsequently in a serial scheme. The study aimed to reveal the effect of the parallel and serial compression scheme focusing on the sum of impact energy absorption.
1. Introduction
When a vehicle has movement, it has kinetic energy, which strongly depends on its weight and velocity. At the moment of impact, this energy is converted into impact energy in a few milliseconds. Therefore, the impact force and the deceleration of the vehicle and the passengers are remarkably influenced by the duration time of the collision [1,2,3,4,5]. That is why crumple zones have indicated roles during a crash. They are designed to extend the duration time of the collision while absorbing the most impact energy possible. This principle would ideally involve long and oversized crumple zones; however, weight optimization and efficient utilization inhibit this possibility. The car body structure is a so-called differing-strength frame, meaning the crumple zones are made of metals with high plasticity, but the cage is of high-strength steel. The latter is intended to prevent the deformation of the zone of passenger and driver, the former has a high deformation capacity, allowing it to absorb the impact energy [6,7,8,9,10,11]. Vehicle electrification causes a weight surplus, owing to the mass of the batteries and their safety system. Moreover, modern vehicles contain more driving assistants and entertainment systems, increasing the unloaded weight. The weight surplus not only influences energy inefficiency, but also has a negative effect on the features of an accident. Therefore, weight optimization is one of the most important factors in the vehicle industry. The recently applied high-strength steels are not able to complete the passive safety-related requirements and allow for a lower weight at the same time. Furthermore, not only have the applied materials been modified in the last decade, but the applied manufacturing process has, too. Taking into consideration these requirements, the researchers took on the difficult task of investigating and developing the crumple zone structure. A new frame and frame component must be developed which is compact, low-weight, and can absorb as much energy as possible while inhibiting the impact energy conduction in the direction of the cage. To improve the energy absorbing capacity of a thin-walled crumple frame structure without a considerable weight increase, the integration of aluminum foam—as a filler material—is a good, promising method for the vehicle industry. A large number of investigations deal with the positive effect of the foam on the compression features of thin-walled structures [12,13,14,15,16,17,18]. The shell bodies usually have a special notch or thinned cross-sections that allow for predetermined deformation during a collision, while the foam inside of it is loaded by compression. Figure 1 represents a foam-filled thin-walled tube as a simplified crashbox specimens.
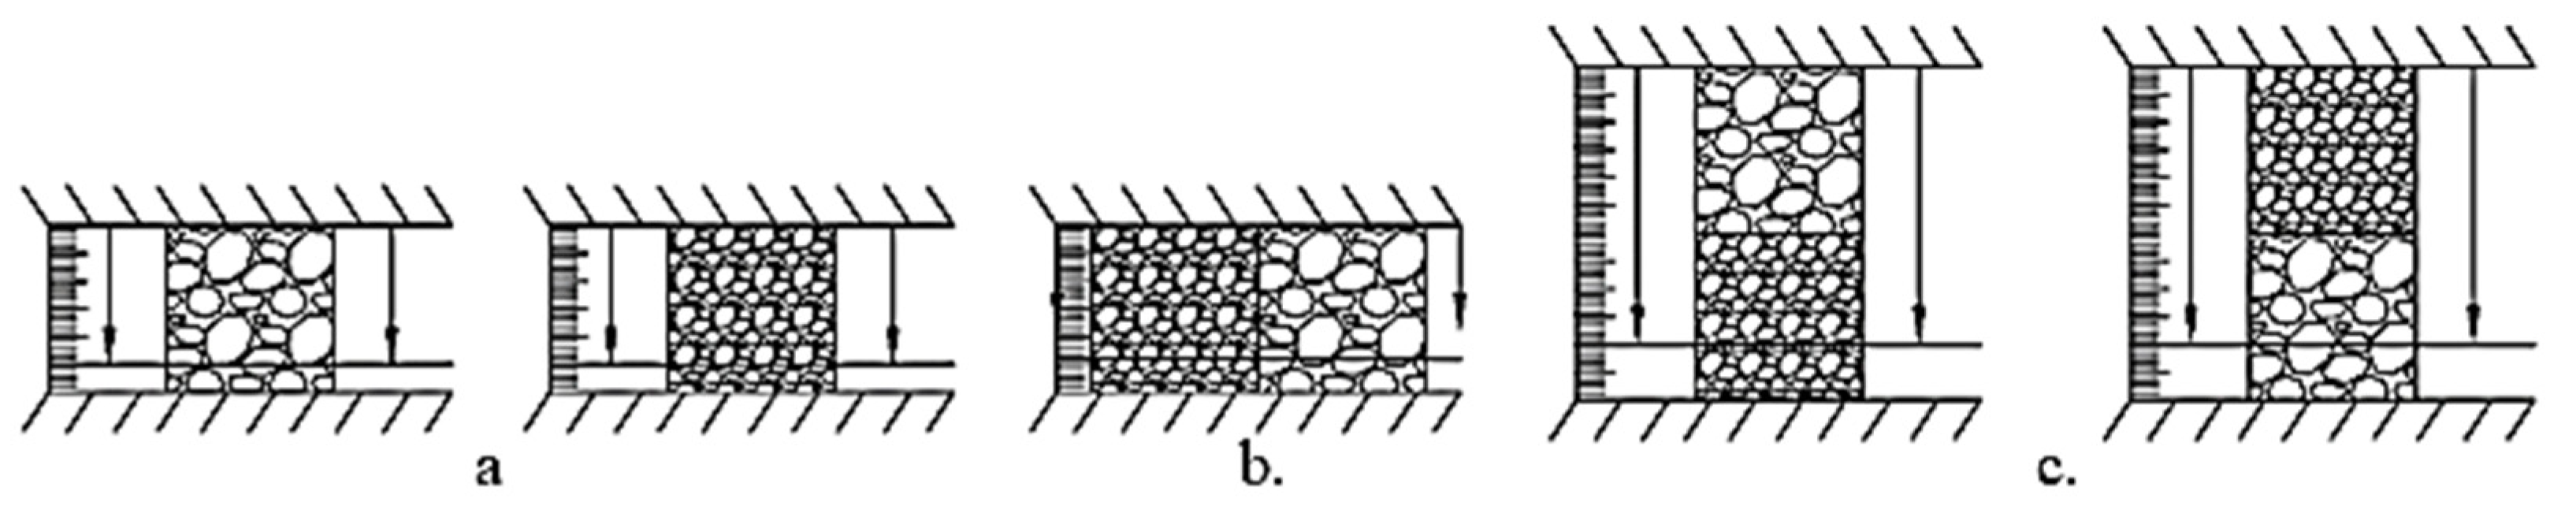
The foam-filled thin-walled frame components could be considered absorptive structures, meaning several proportions of the compression load are absorbed naturally by the deformation of the outer shell body, and the foam plays a role in improving this energy absorption. If we would like the foam to absorb the same amount of energy, it also requires a special construction, in which the foam is loaded in a radial constrain application. The number of studies about radial constrained foam compression is less than that of normal compression, but most of them report positive results. In the case of radial constrained compression, the lateral strain of the foam is inhibited by the wall of the frame and results in higher compression strength and a higher amount of absorbed energy [19,20,21]. The long-term goal of the research is to develop a highly efficient, yet compact crumple crash box based on the principle of the radially inhibited clogging of metal foams. The literature search did not provide any clear results on how to influence the sealing results when using foams of different densities at the same time and this is the subject of this paper. The aim of the present study was to investigate this filler material and reveal the effect of the inhomogeneity of the foam density relative to the amount of absorbed energy. Therefore, in the study, we investigated two different densities of the same base-material closed-cell aluminum foam with a low-speed compression test. First of all, the lower and the higher-density foams were compressed separately, and the recorded stress–strain diagram is represented in Figure 2a. In the next step, the foam was installed in a parallel scheme, meaning the foams are compressed next to each other under the cross-head of the test machine. This scheme is introduced in Figure 2b. In the next section, the foams were compressed in serial mode meaning they were placed on top of each other to unveil the effect of this set-up relative to the feature of the stress–strain curve as it can be seen in Figure 2c. To reveal the effect of the order of the foam types, the serial method was repeated, swapping the order sequence of the foams. In the first test, the lighter one was placed at the top, while in the second, the heavier one was placed on top. In Figure 2 the arrows represent the compression direction, and the scale next to the specimens shows the compression range.
2. Specimen Preparation and Experimental Method
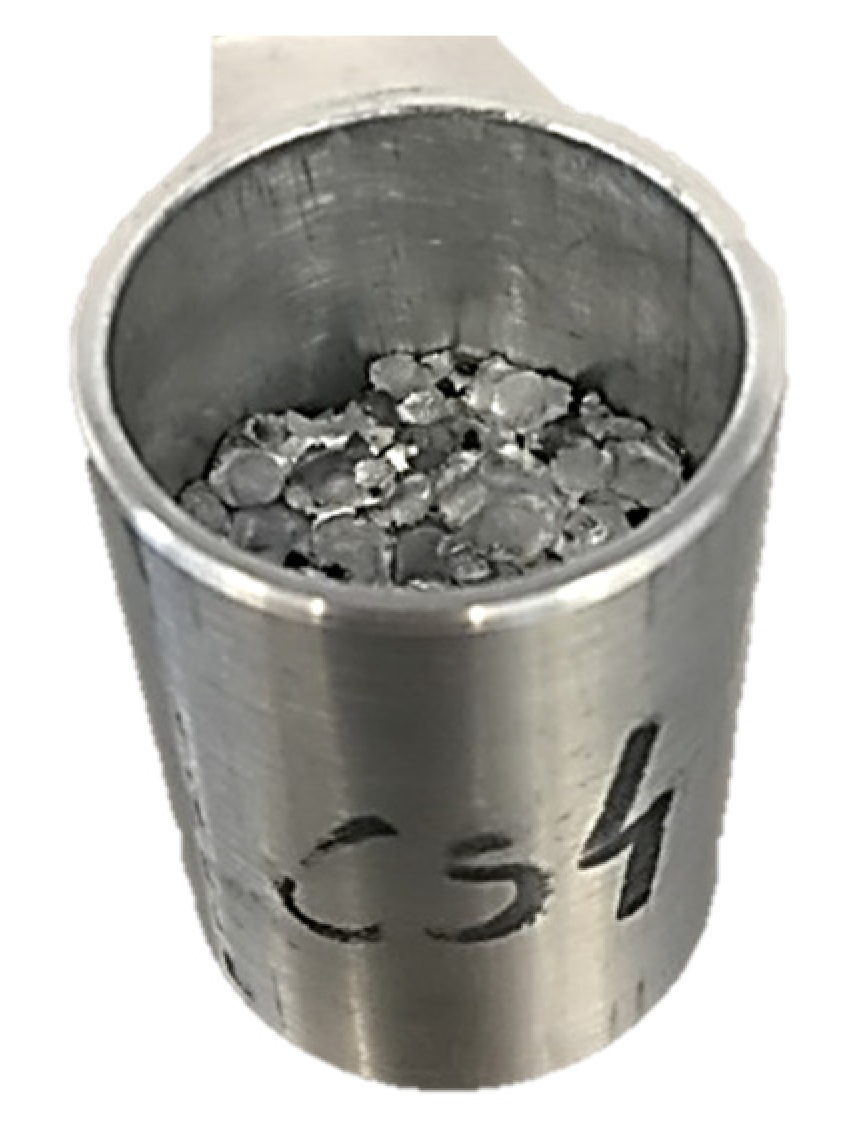
The compression was a low-speed test. Therefore, the ISO 13314:2011 standard requirements must be considered, since it specifies a test procedure for the compressive features of porous and cellular metals with a porosity of 50% or more [22]. According to the standard, the compressive tests must be carried out at an ambient temperature under quasi-static strain rate conditions. Keeping in mind the requirements of the standard, all of the specimens used in our test have D30 mm x H30 mm of cylindrical dimensions. For designation, the study applied the SP-LDX (Specimen-Low Density) and SP-HDX (Speci-men-High Density) abbreviations, where the X character indicates the number of the actual specimen serial number. Before compression, we documented the precise geometrical parameters and weight of the specimens in order to minimize the impact of the inner material structural variation. We utilized identical nominally sized specimens for all tests, but the density definition was crucial because of the uneven cellular distribution. Four of each variety of foam were used in the four specimens we performed. Table 1 contains the parameters of the specimens. Referring to these values, there was no significant physical dissimilarity between each density. The last column of the table is about the relative density (ρrel.), meaning the proportion of the physical density (ρ) of the foam and the density of the basic aluminum material (ρs) [23]. The two different density foams are well introduced in Table 1. The lower one has an average of 0.22 g/cm3, and the heavier one is about 0.36 g/cm3.
3. Tools for Test
The compression tests occurred on an Instron 8801 servo-hydraulic material testing device at the University of Debrecen laboratory. The test machine is capable of both dynamic and quasi-static compression, while its software records the displacement in mm and the effort in kN. An Instron 8800 MiniTower Control Unit was used to control the Istron 8801 material testing system. The software required to use the system is the WaveMatrix software package. The purpose of the measurement was to record the response properties of the metal foam to its compaction, i.e., to record the engineering stress–strain diagram and to evaluate it. The amount of data in the measurements is influenced by the sampling frequency. In this case, the frequency was chosen to be 500 1/s, which resulted in more than 10,000 data by the end of the test. This frequency set-up was based on a recent measuring foam compression test experience. Over this frequency limit, the data were mishandled inaccurately at the end of the densification range by the system. Given the use of the quasi-static method, the compression speed was chosen to be 1 mm/s, and the crumpling displacement of 25/55 mm resulted in more than 80% of strain in the foam specimens. Knowing the acting force and the displacement during the compression, the stress–strain curve could be structured. For visualization and the interpretation of the results, the 3.16.2 version of the Logger Pro software was used. The aim of the study is to compare and reveal the effect of the foams of different densities in one method; therefore, the test environment and temperature conditions were the same for all tests. No additional materials—for example, lubricator—were used since they could have influenced the final results.
4. The Ideal Absorber
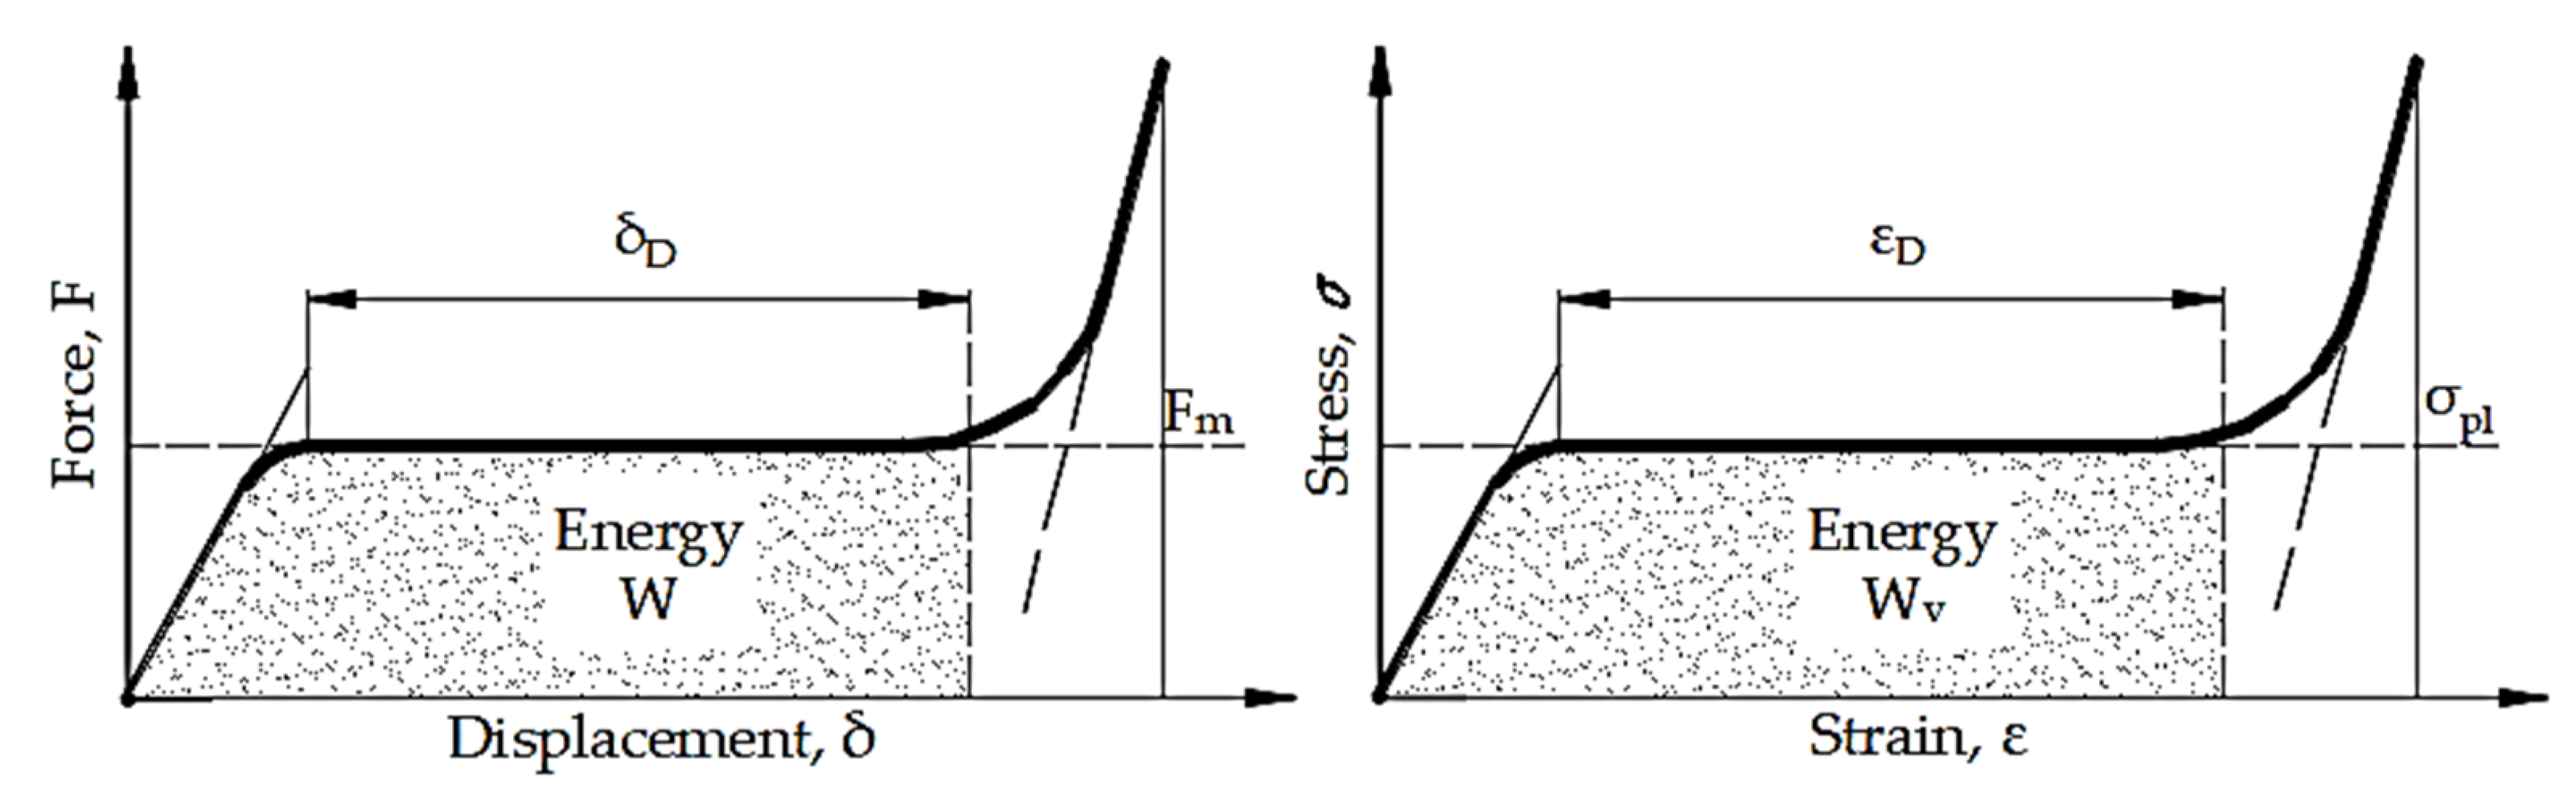
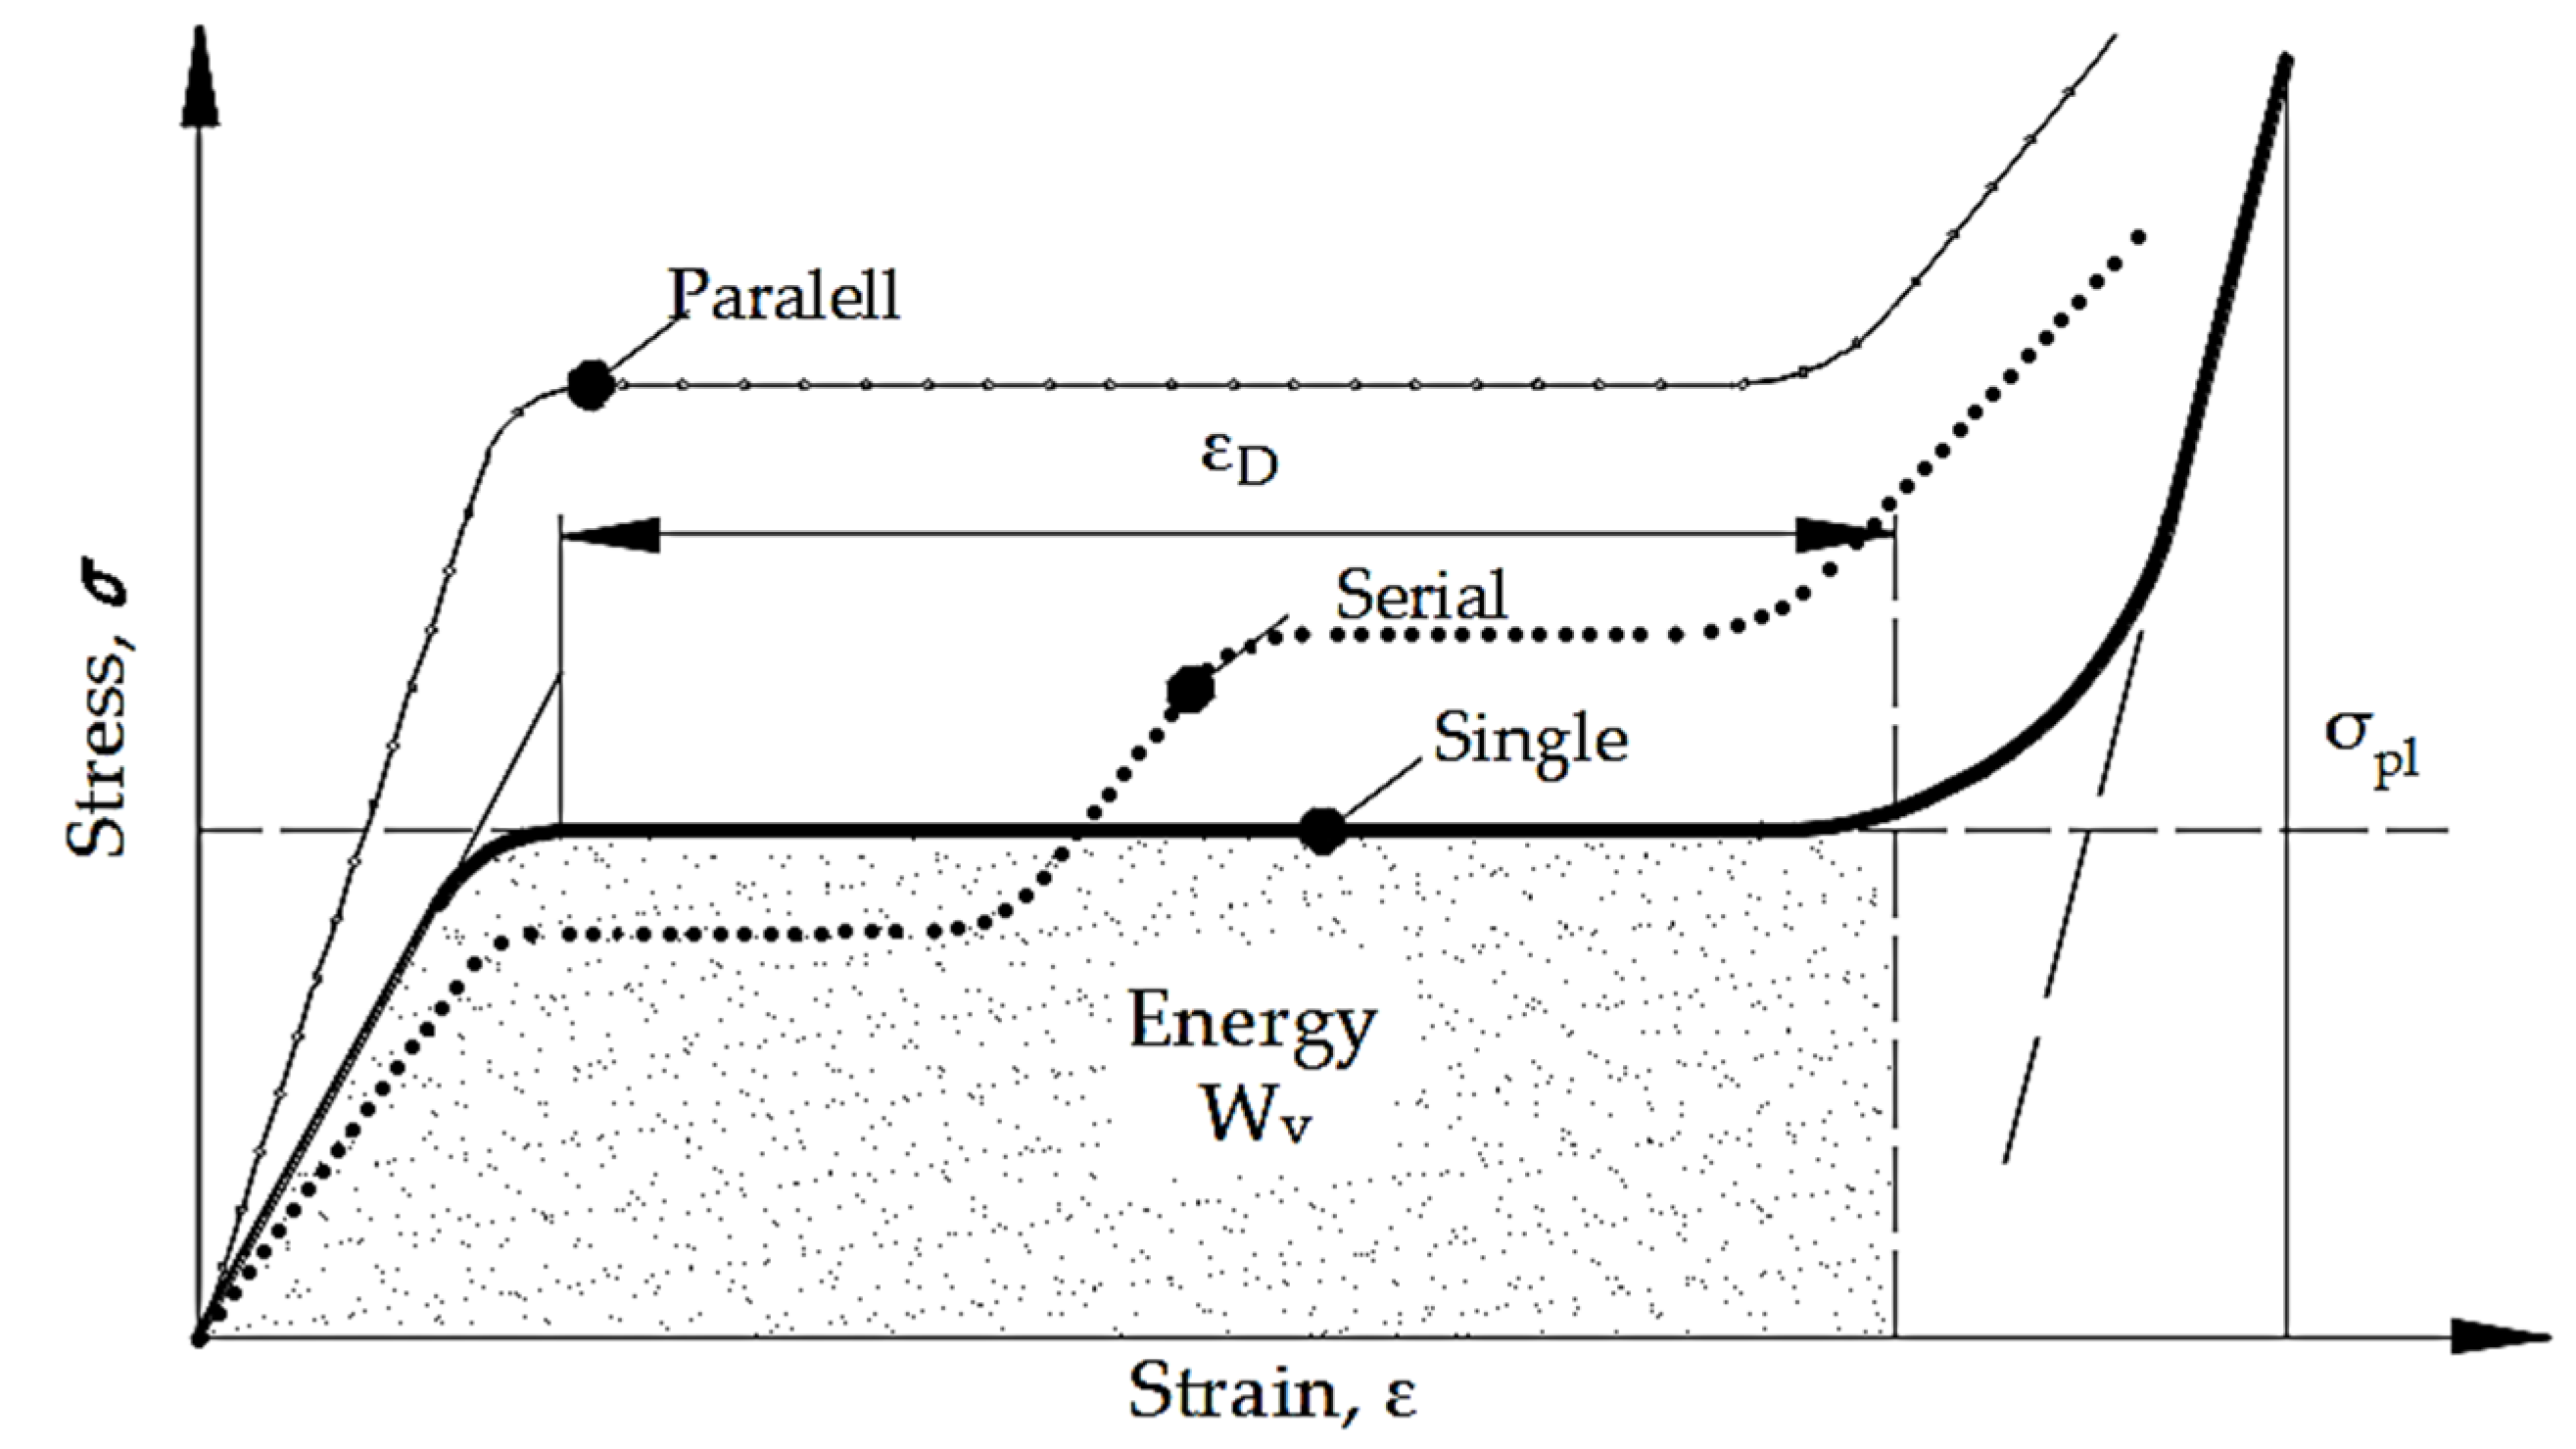
The stress–strain (or load–deflection) curve of an ideal energy absorber is long and flat, like those in Figure 3. Up to a limiting nominal strain, εD, the absorber collapses plastically at a constant nominal stress known as the plateau stress, σpl. The ideal energy absorber for impact protection is the one with the longest plateau, as it will absorb the most energy before reaching εD and the plateau stress will be just below that, allowing it to conduct the energy. The energy that the foam can absorb per unit initial volume up to the plateau’s end is represented by the area under the curve, or roughly σplεD [23].
A consistent interpretation is required to compare the effects of various constructions packed with aluminum foam. The definitions in the following text are provided in accordance with the aforementioned ISO standards. The compressive stress for porous and cellular materials may be calculated by dividing the compressive force by the initial cross-section. The strain is shown on the diagram’s horizontal (x-axis), which may be determined using the ratio of the actual displacement to the specimen’s original length. The definition of it is crucial since we compared the initial figures for the maximum compressive stress. In this instance, the maximum compressive stress may be related to the first local maximum. The interpretation of the plateau stress cannot be disregarded because this study concentrates on the amount of absorbed energy. The plateau is the mathematical mean of the compressive stresses between 20% and 40% of the strain. The densification strain point was calculated using the data of this area. The stress at about 1.3 times the plateau stress marks the beginning of the densification area and the end of the plateau [22]. Finally, two distinct methods are used to determine the absorbed energy. First, the energy is the area under the stress–strain curve up to 50% strain or up to the plateau end strain, as also indicated by the standard. Then, because a sizeable difference could be anticipated in the densification region, we computed the area under the curve up to 80% strain. Figure 3 shows a typical stress–strain diagram for compressing the foam. To determine the amount of absorbed energy during compression, the stress–strain curve must be integrated with the above-mentioned limits. The following formula was applied using the Pro Logger software to analyze the area of the curves:
5. Thin-Walled Structures
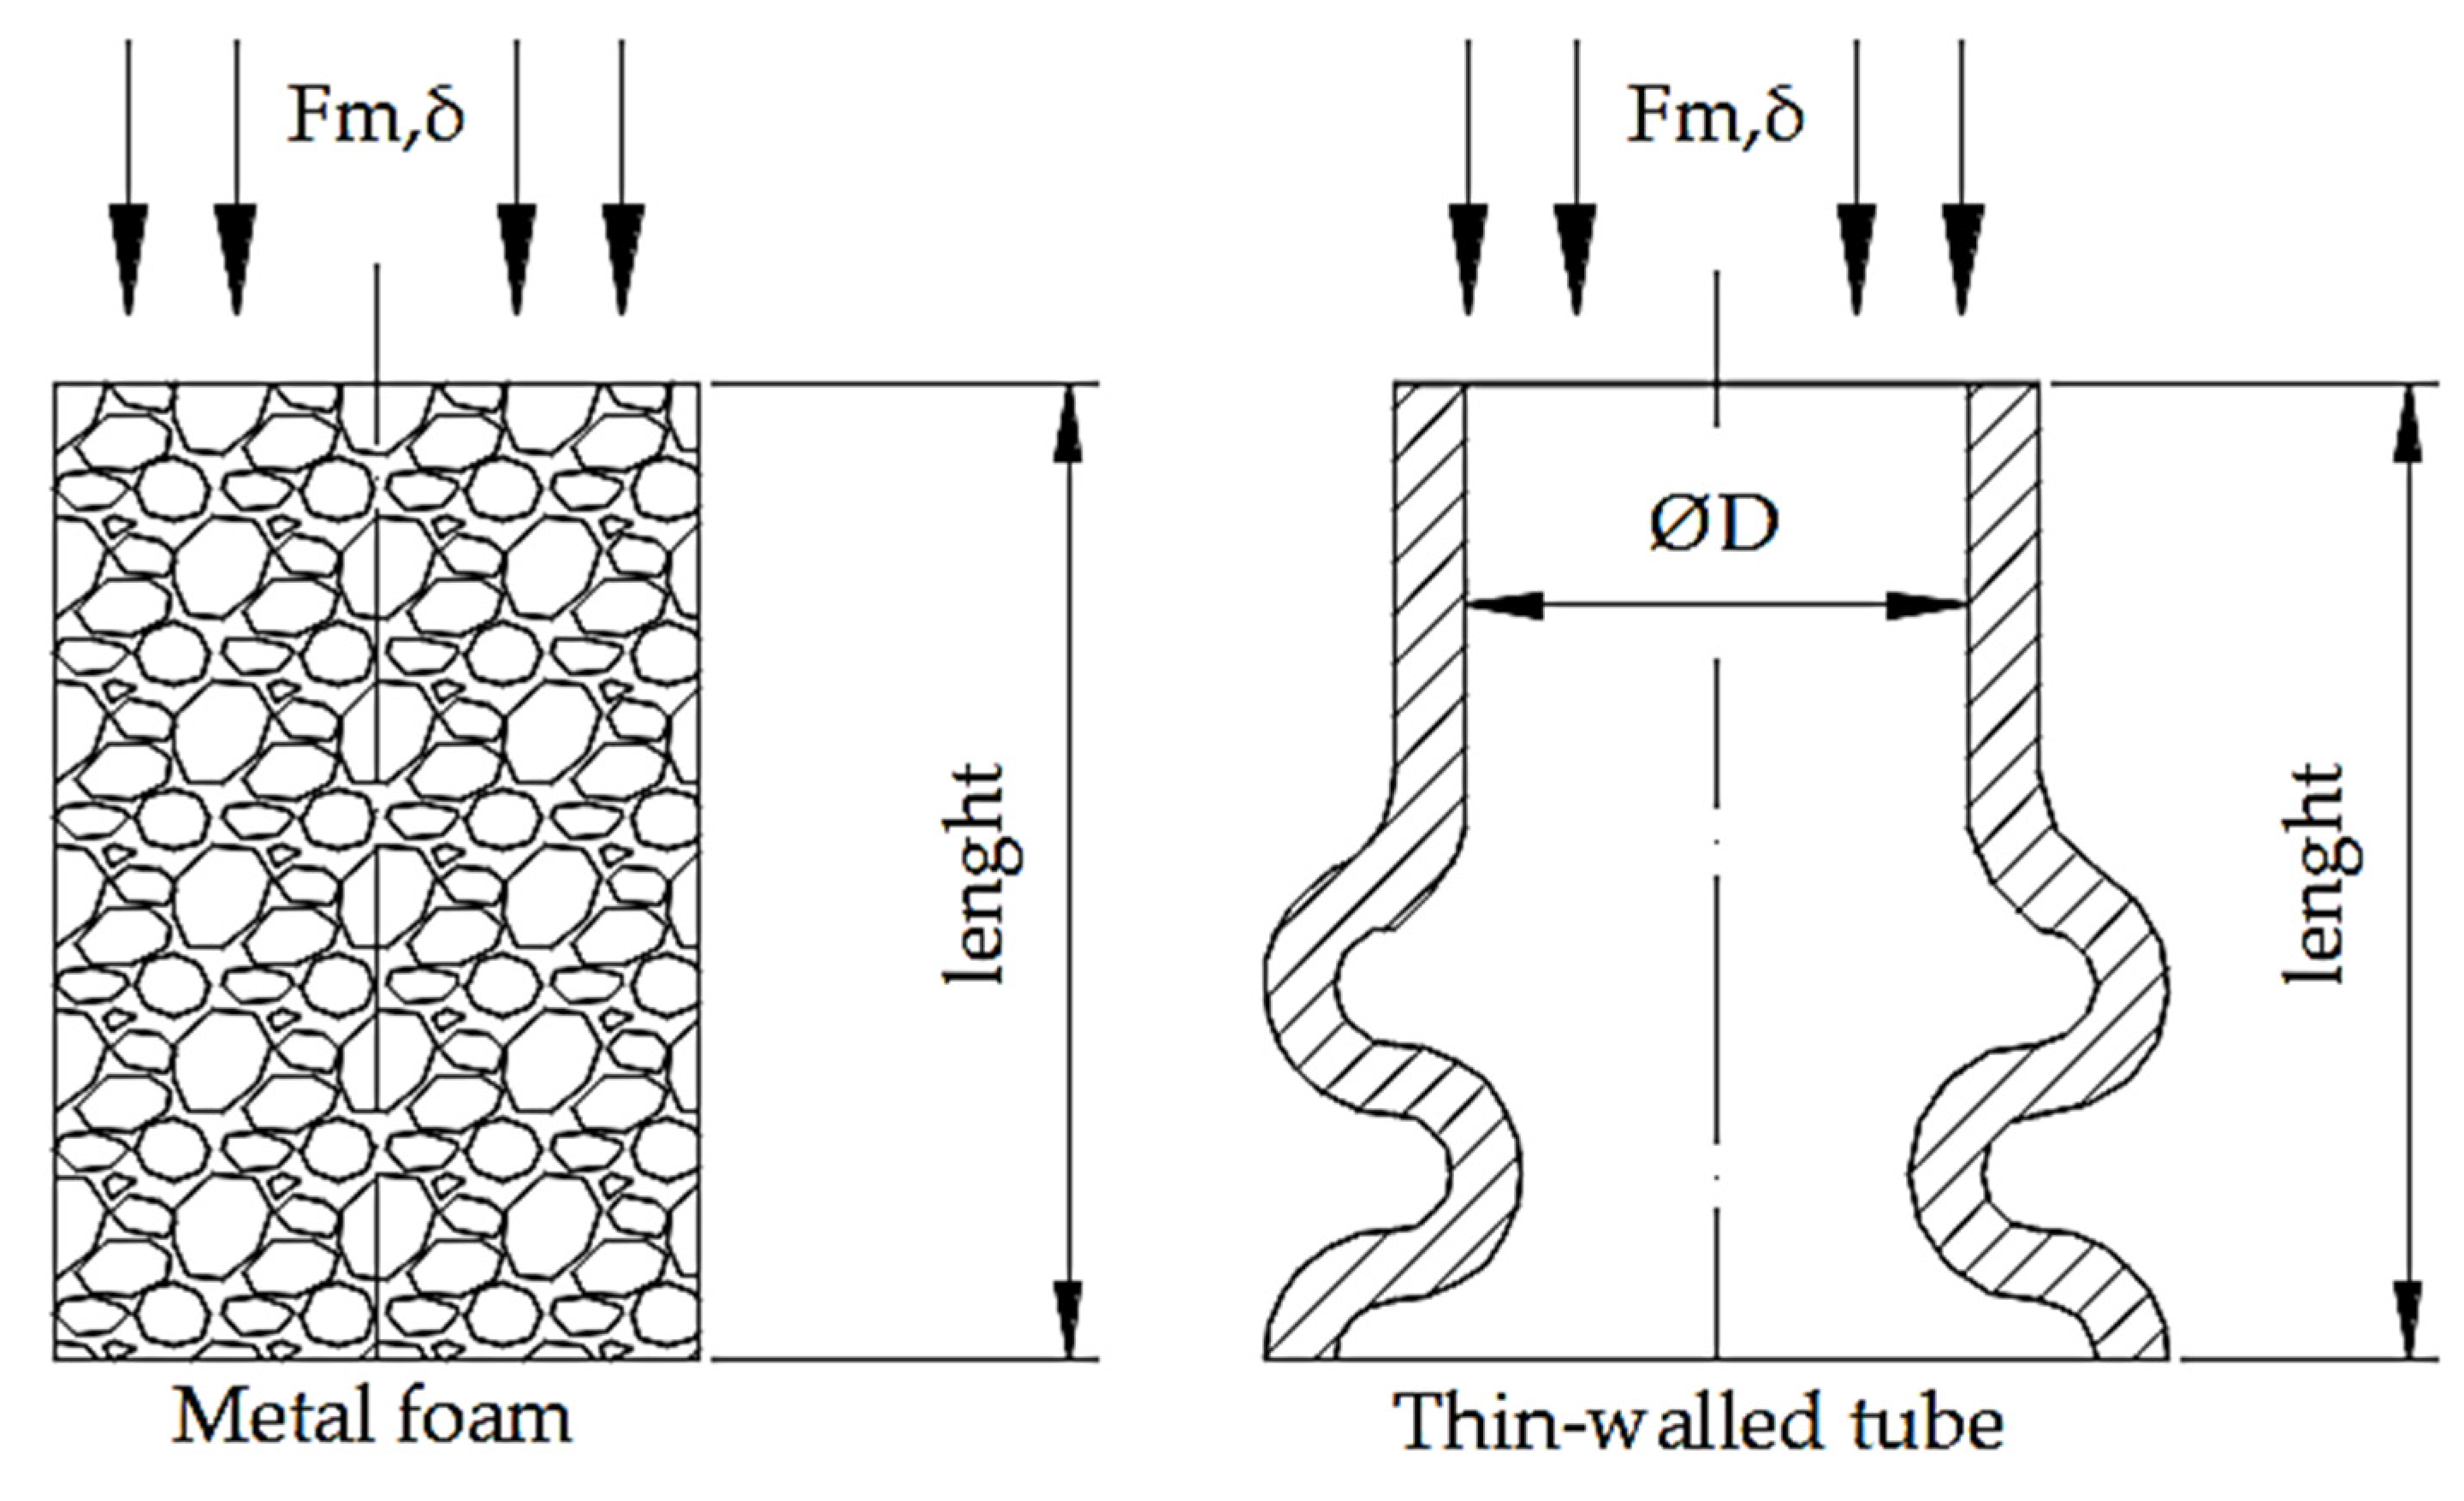
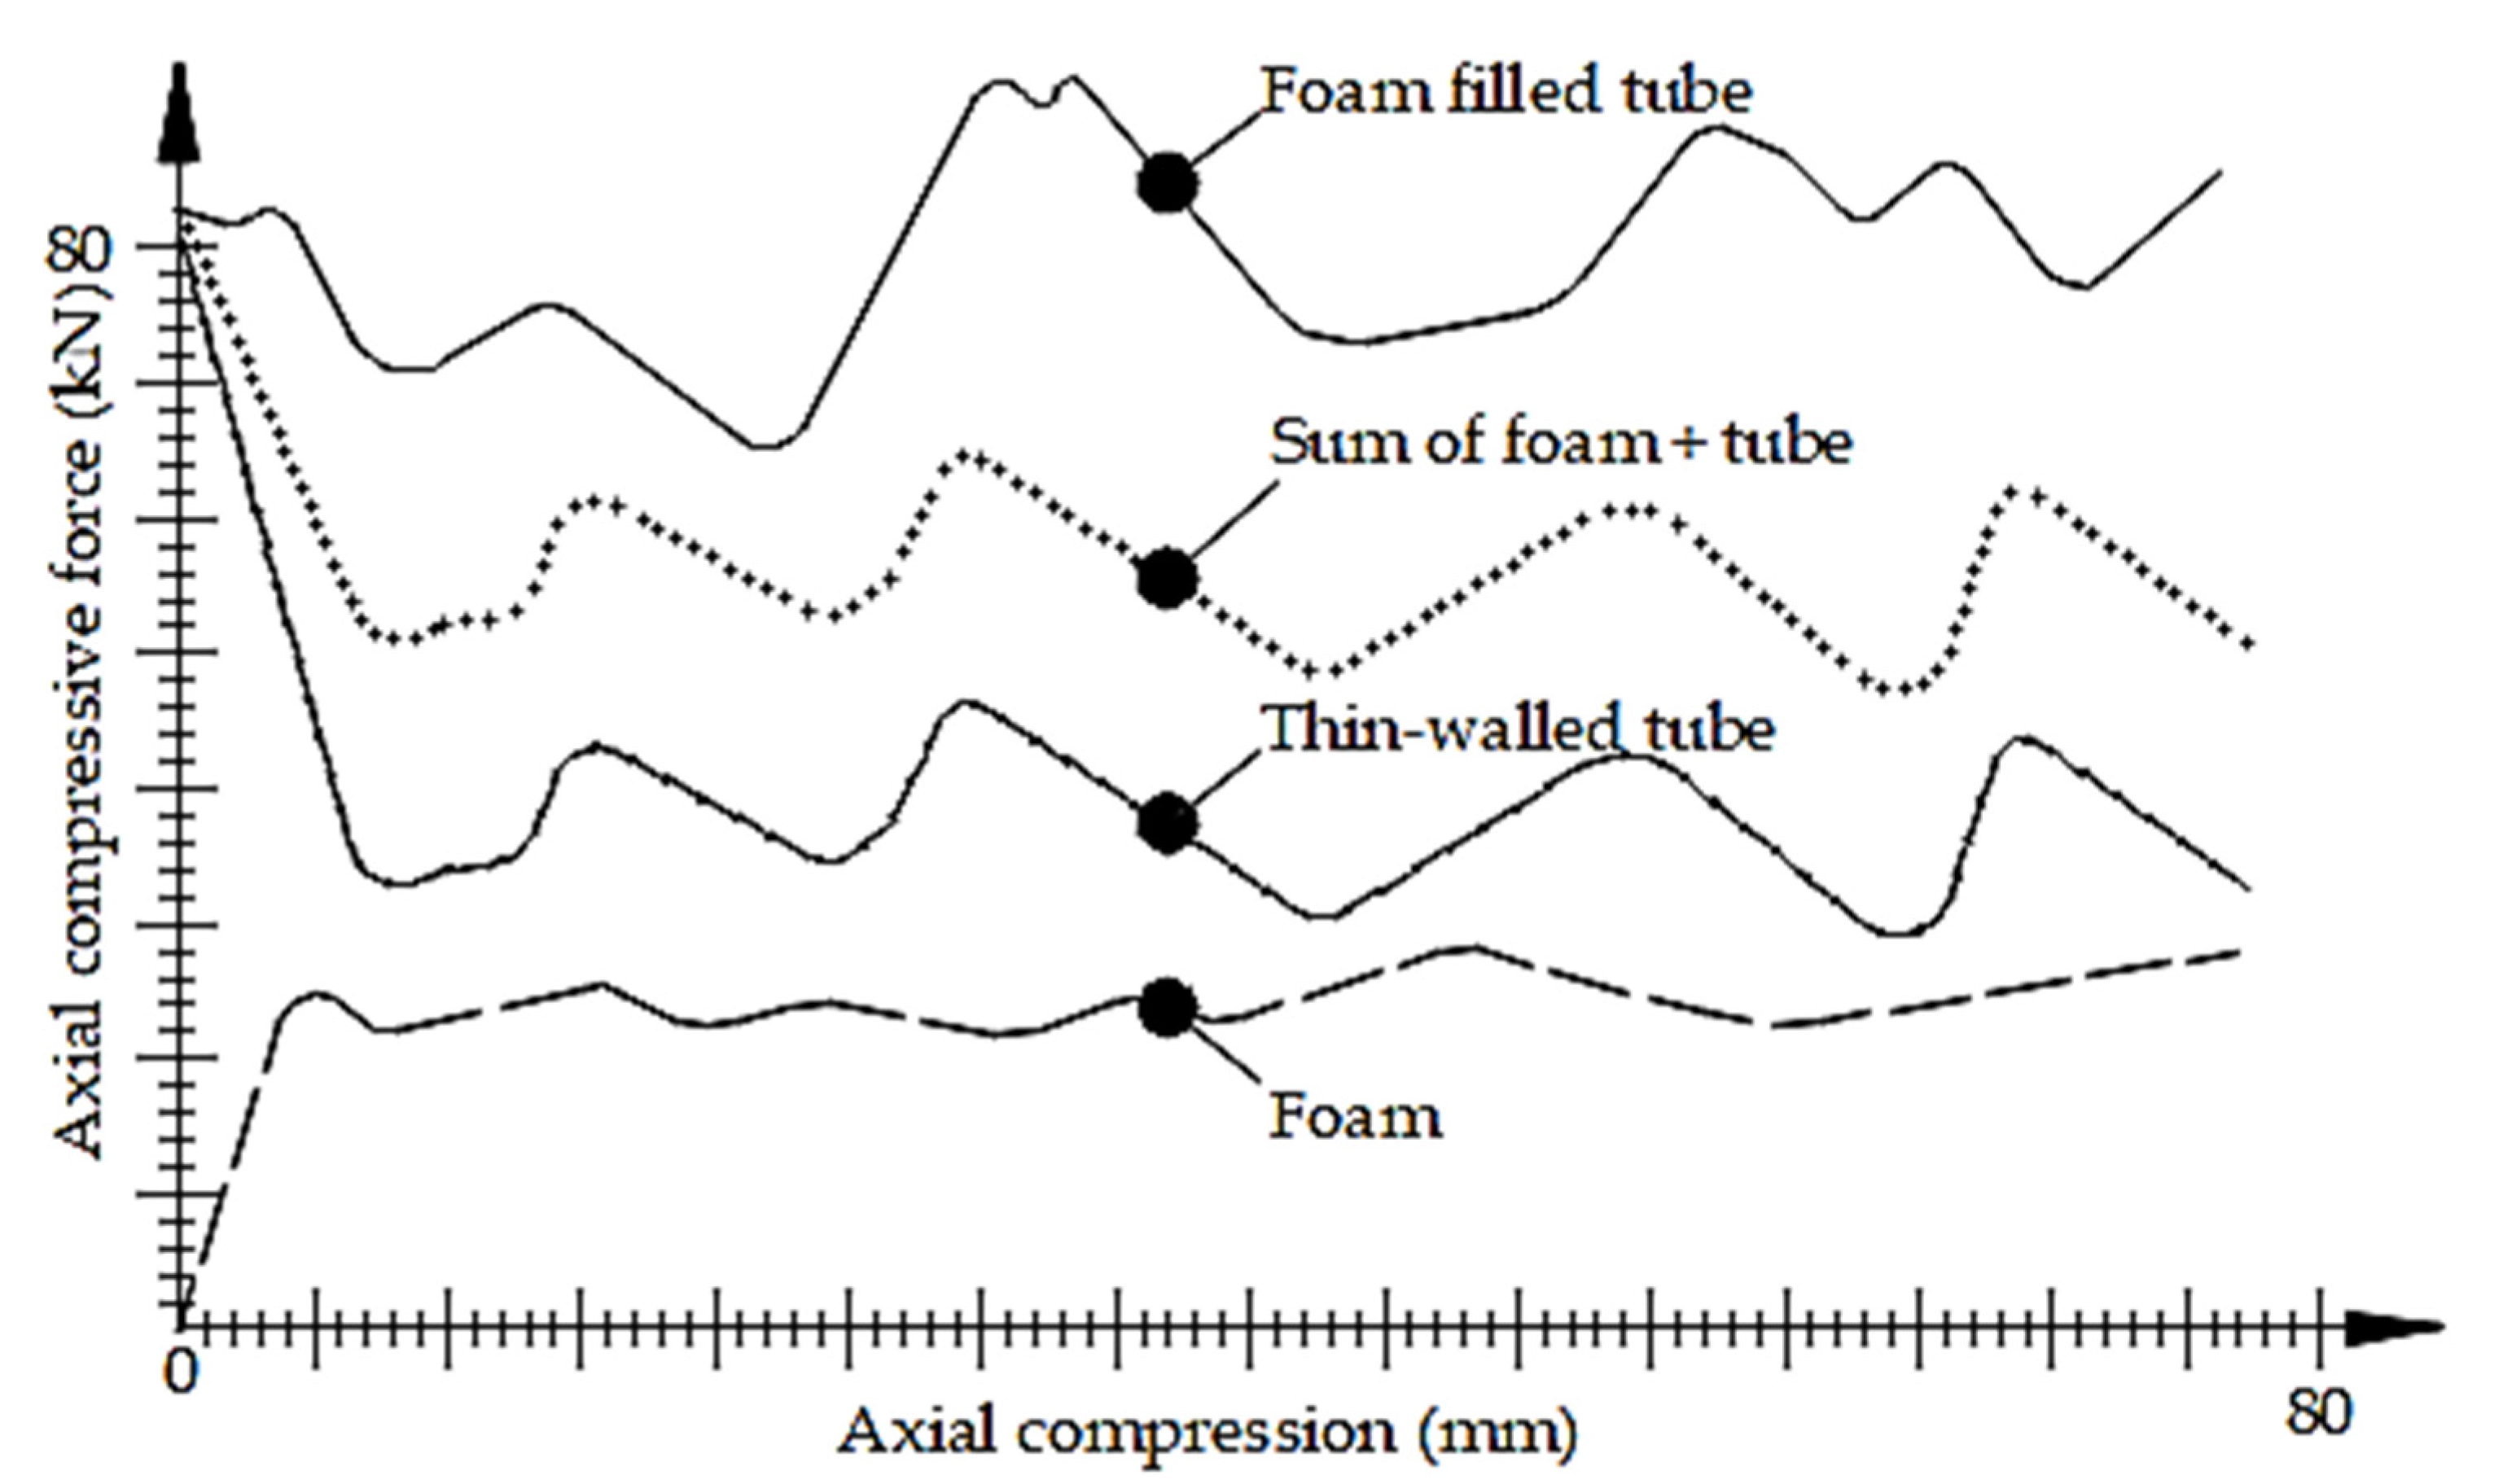
When crashed axially, thin-walled structures, such as the frontal or rear rails, function well as energy absorbers as can be seen in Figure 4. Being “efficient”, in this case, means that a large amount of energy is absorbed per unit of volume or weight. When the foam is compressed, the walls of its cells bend and buckle under nearly constant tension until the cells are collapsed fully. When the entire tube buckles, the fold faces come into touch [23].
6. Results
6.1. Single Compression Scenario
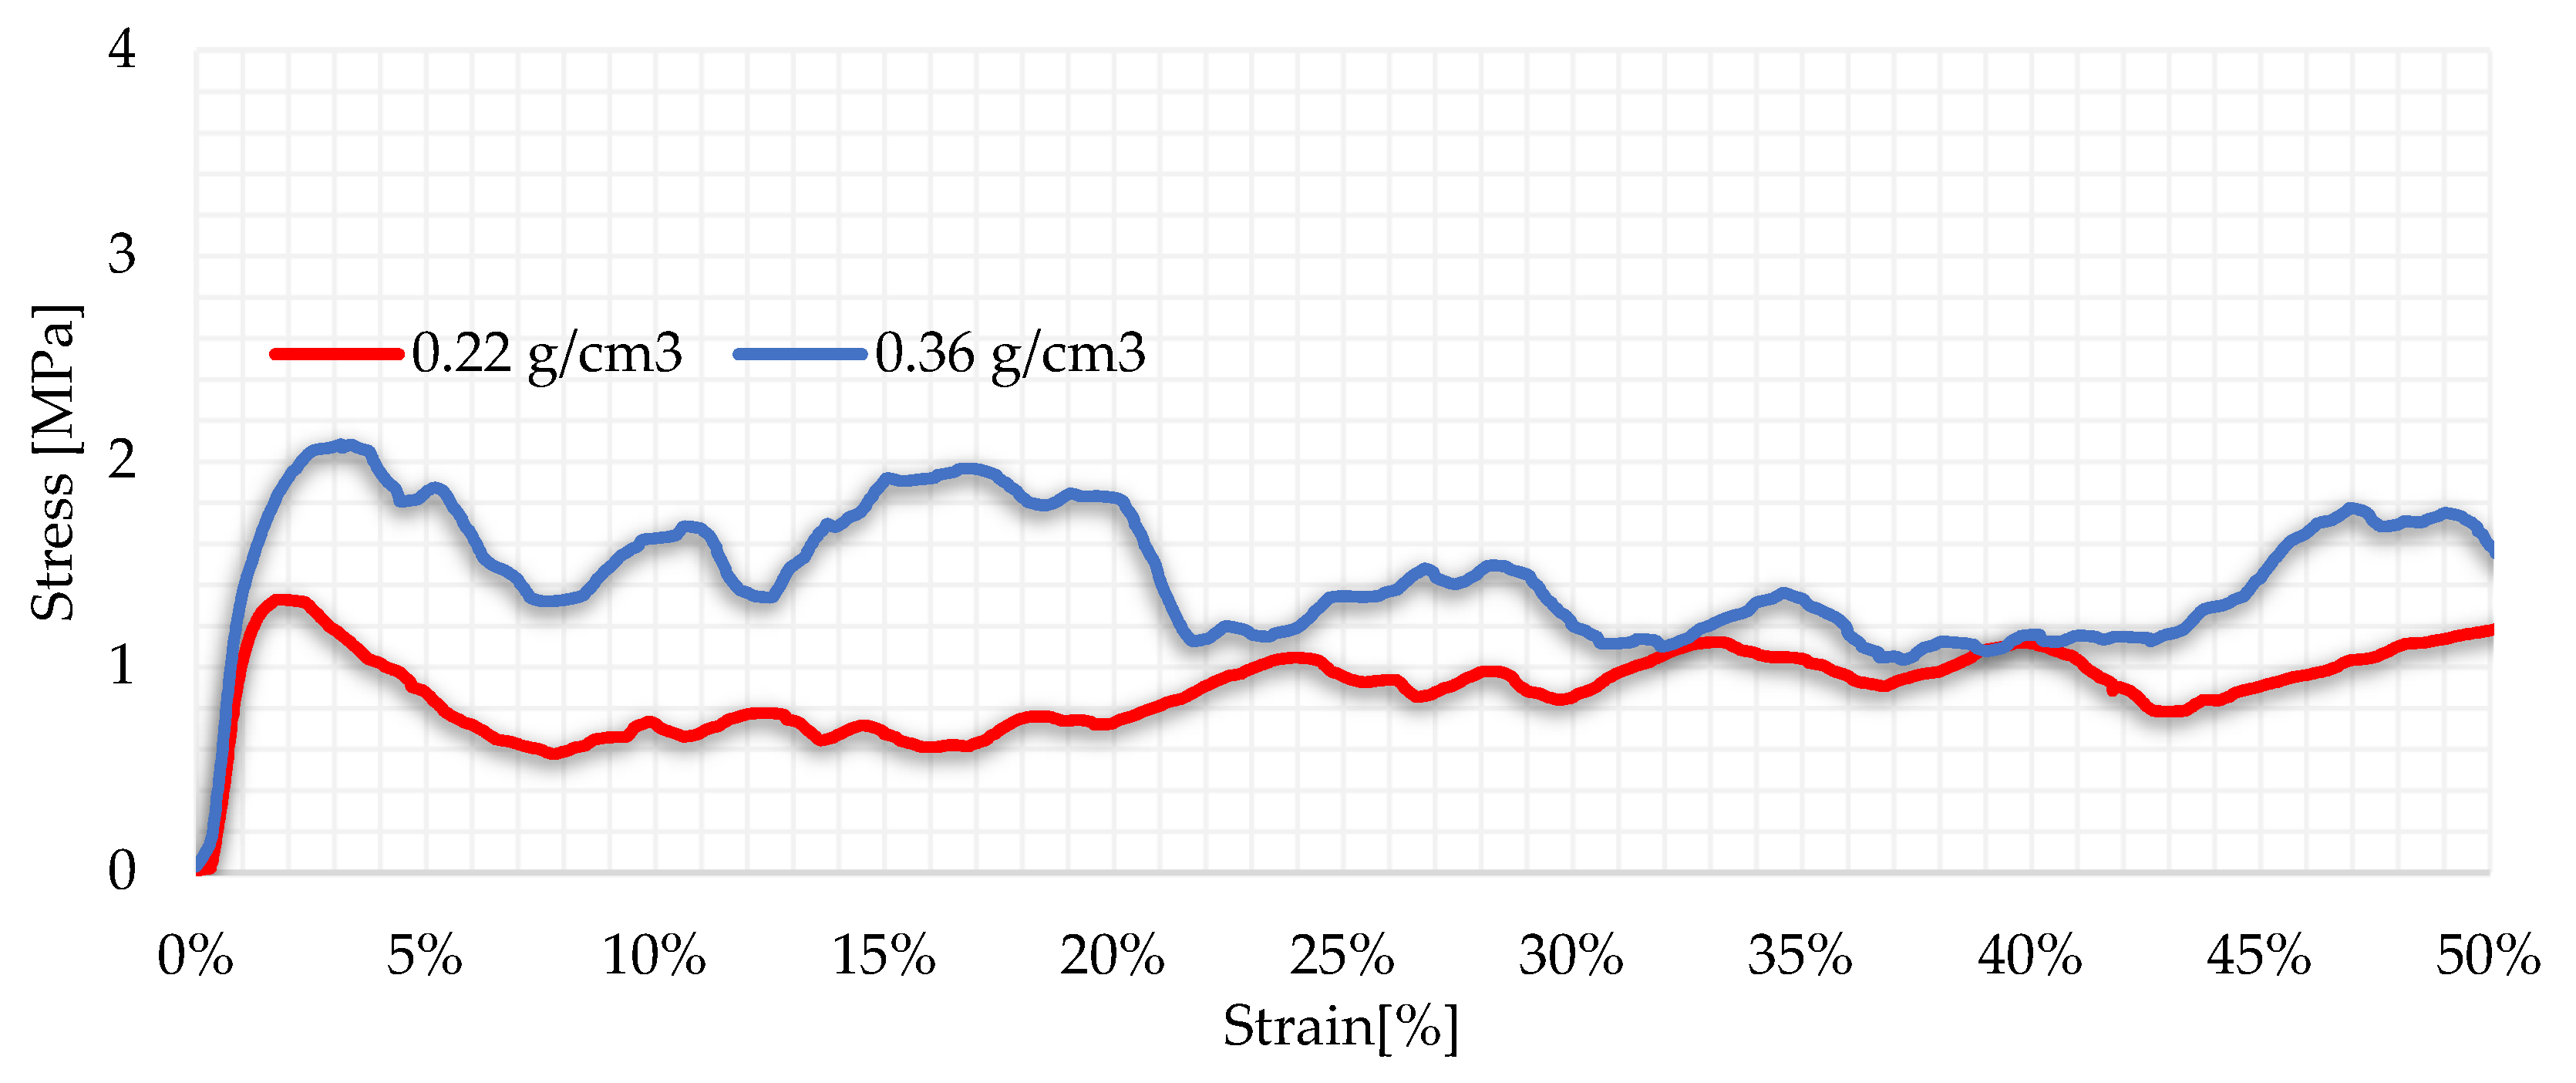
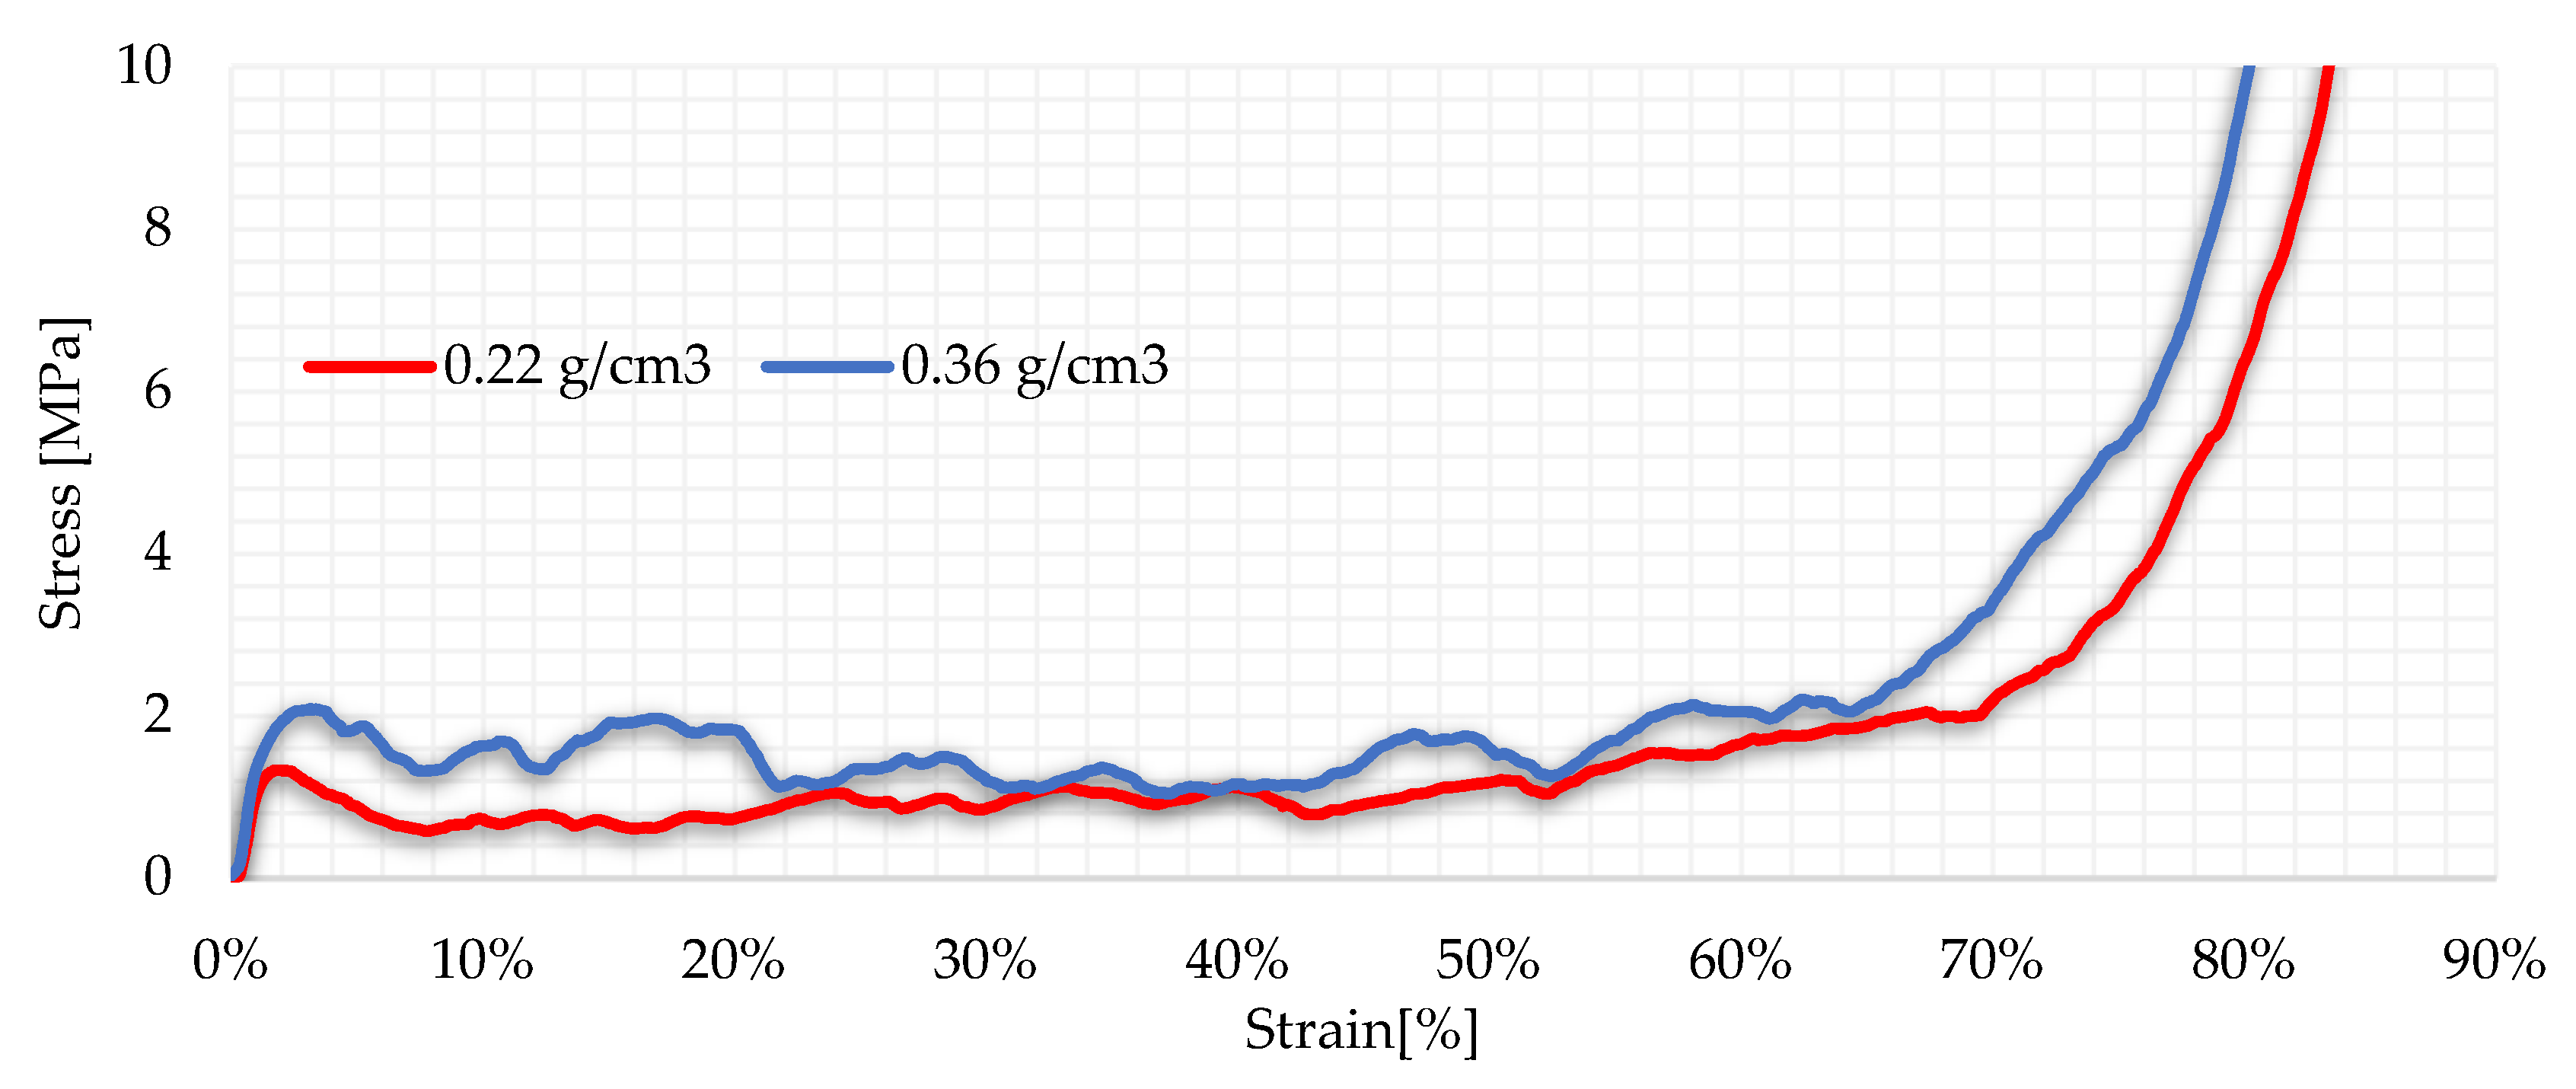
In the first section, the foams were compressed separately, first the lighter one, then the heavier one. Both tests resulted in a typical stress–strain diagram. The distinction is made between the linear elastic, flat plastic, and densification zones. The lighter foam (SP-LD1) reaches the elastic–plastic transient at 1.31 MPa and 2.39% of the strain, while the heavier one (SP-HD2) at 2.046 MPa and 3.15% of the strain. The effect of the density could be well introduced among the plateau stress, since the SP-HD1 has a higher flat stress range resulting in 1.445 MPa of plateau stress during the 20–40% strain, compared to the SP-LD1 which was just 1.062 MPa in the same measurement period. Naturally, the density and the cell size also influence the densification range. Smaller-sized cells result in sharp steepness in the densification range relative to the lighter ones. The densification zone could be best described by the steepness of the characteristic. Figure 6 and Figure 7 represent the stress–strain curves of the first test.
In order for the results to be compared, they are collected in Table 2. The table data are presented in the following order: first maximum stress (σmax), and then plateau stress(σpl) where both of them are given in MPa, and the end of plateau stress(εD) as a percentage. As mentioned in “The ideal absorber” chapter, the absorbed energy is determined for the plateau range (Eabs.plateau) and the whole compression (Eabs.total) in MJ/m3. These values are also available in the last two table columns. To verify the results of the compression test we employed a calculation method using the material properties of the samples and the Formulas (3) and (4) [23]:
The is the relative density, which is the ratio of the sample density and the base aluminum density. The formulas use the yield strength of the base material of the sample, while the is the densification strain. For the currently available metal foams, m lies between 1.5 and 2.0, and α1 is between 1.4 and 2 [23].
6.2. Parallel Compression Scenario
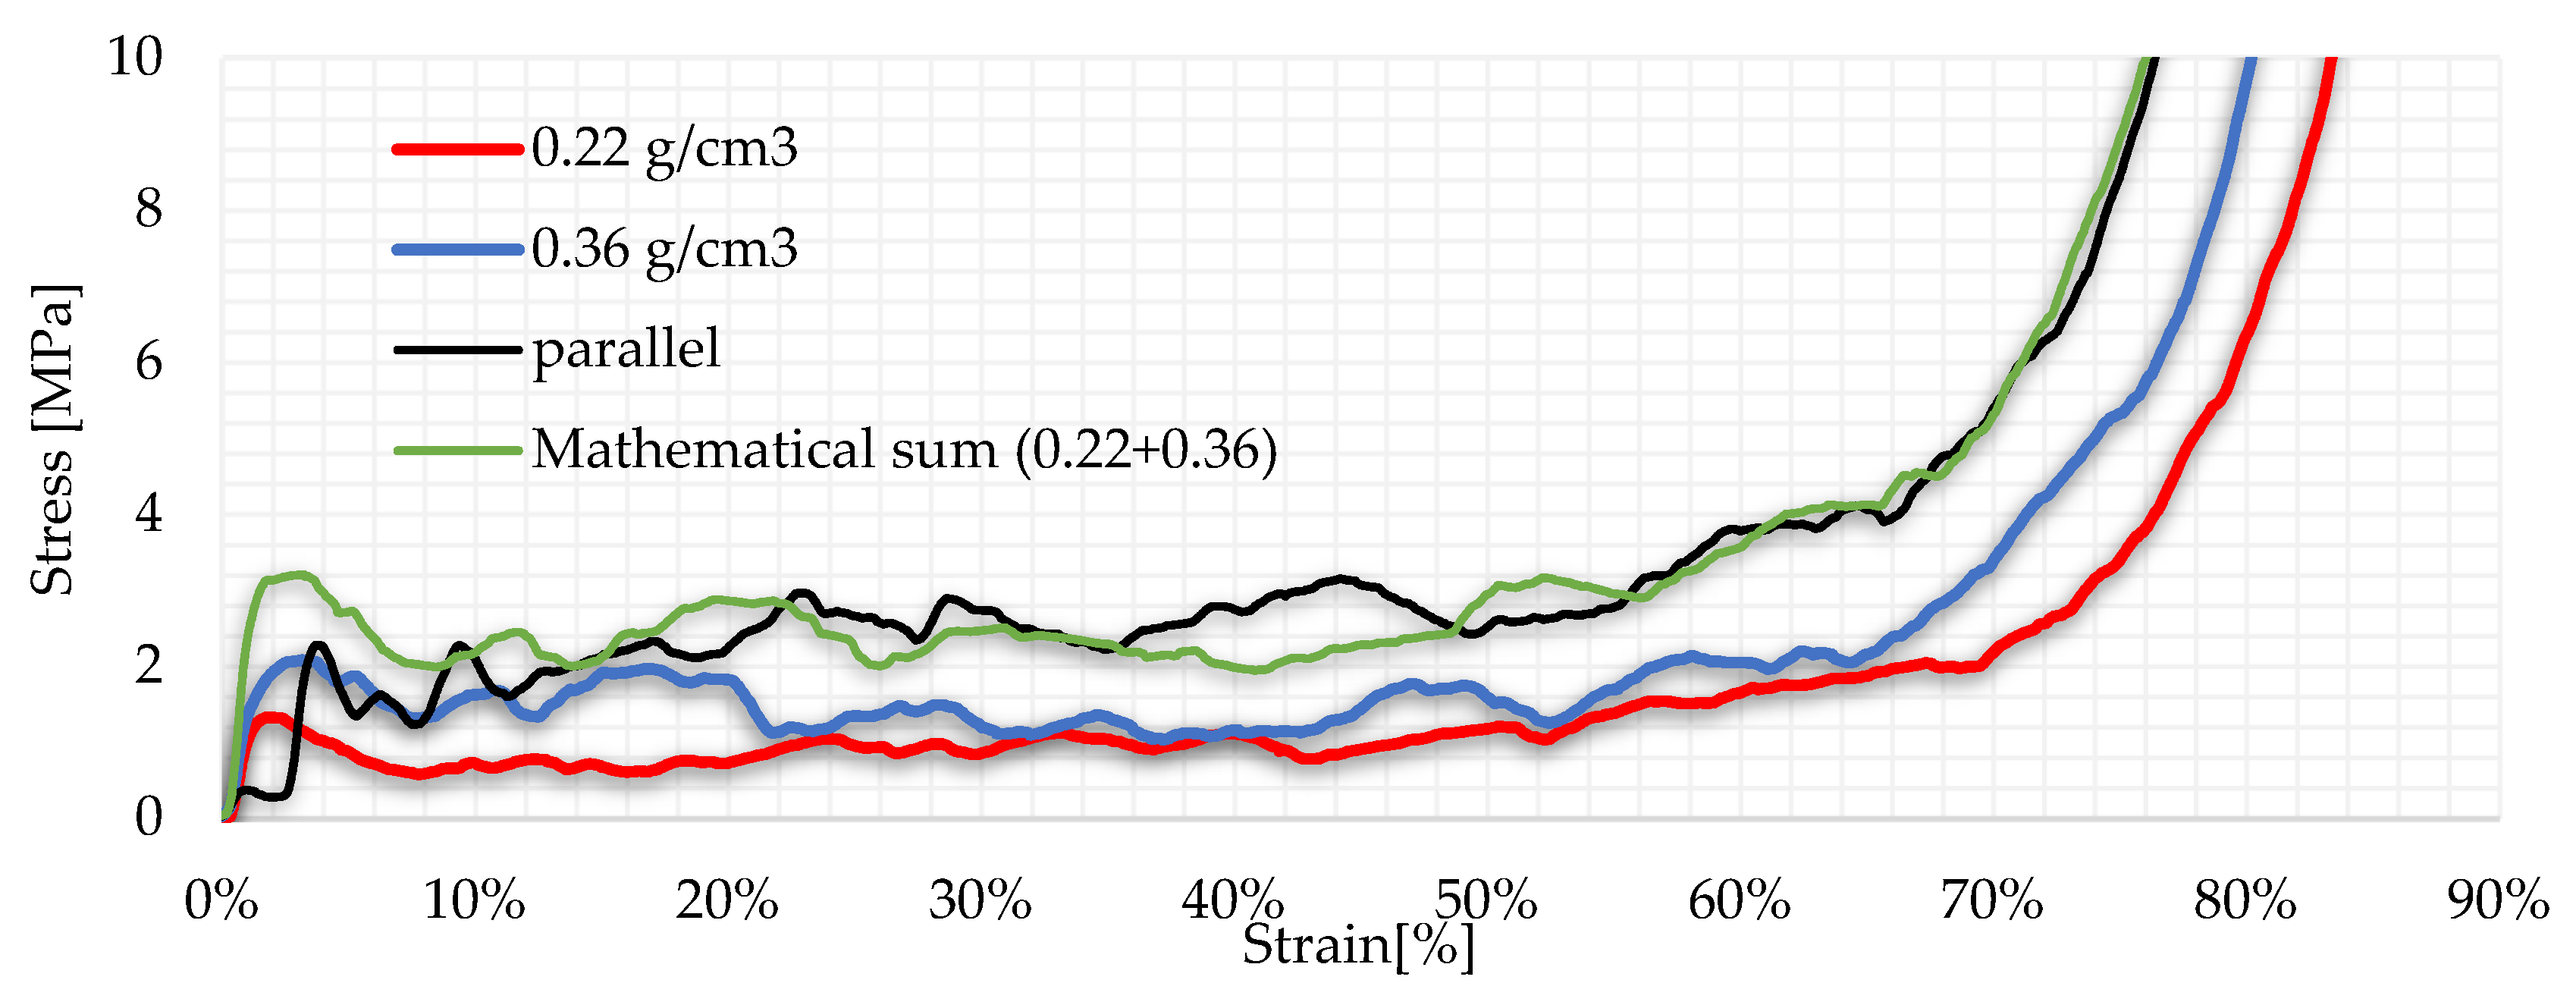
For this test, the foams SP-LD2 and SP-HD2 were used. However, contrary to our expectations, the stress–strain curve did not totally add up mathematically, but rather, remarkable changes occurred. In the first 20% of the strain, the real stress of the compression stayed under the mathematical summation; however, in the second half of the plateau and the densification zone, the curve closely approached the theory summation. As hypothesized, the denser foam was predominant, and the lighter foam was only present as a mechanical alloy and it had a positive effect on the test results. Due to the parallel arrangement, the obtained values can be interpreted as a common element, as the foams were compressed simultaneously. The first local maximum of the curve occurred at 3.99% deflection at 2.014 MPa. This was followed by a plateau section at a higher location than in the previous test, with an average value of 2.764 MPa. No significant deviation in the runout uniformity of the plateau section was observed, and the section was nicely uniform. During the first 20% of the strain, the lighter foam had no significant effect on the test, but after this, it improved the performance of the compression. The densification zone started at 63% strain. The higher stress values naturally meant a higher amount of energy absorbed during the test. The diagram obtained during the test is shown in Figure 8.
The values determined from the data collected during the test are summarized in Table 3. It can be clearly stated that too large a difference in density would have a negative effect on the results of the measurement, which is why it was important not to choose foams that differed in density too much. Similarly, a large proportion of the additional components are present in the alloyed metals. Choosing an extremely low percentage of alloying elements in the metal may have little or negligible effect on the mechanical properties of the base metal.
6.3. Serial Compression Scenario
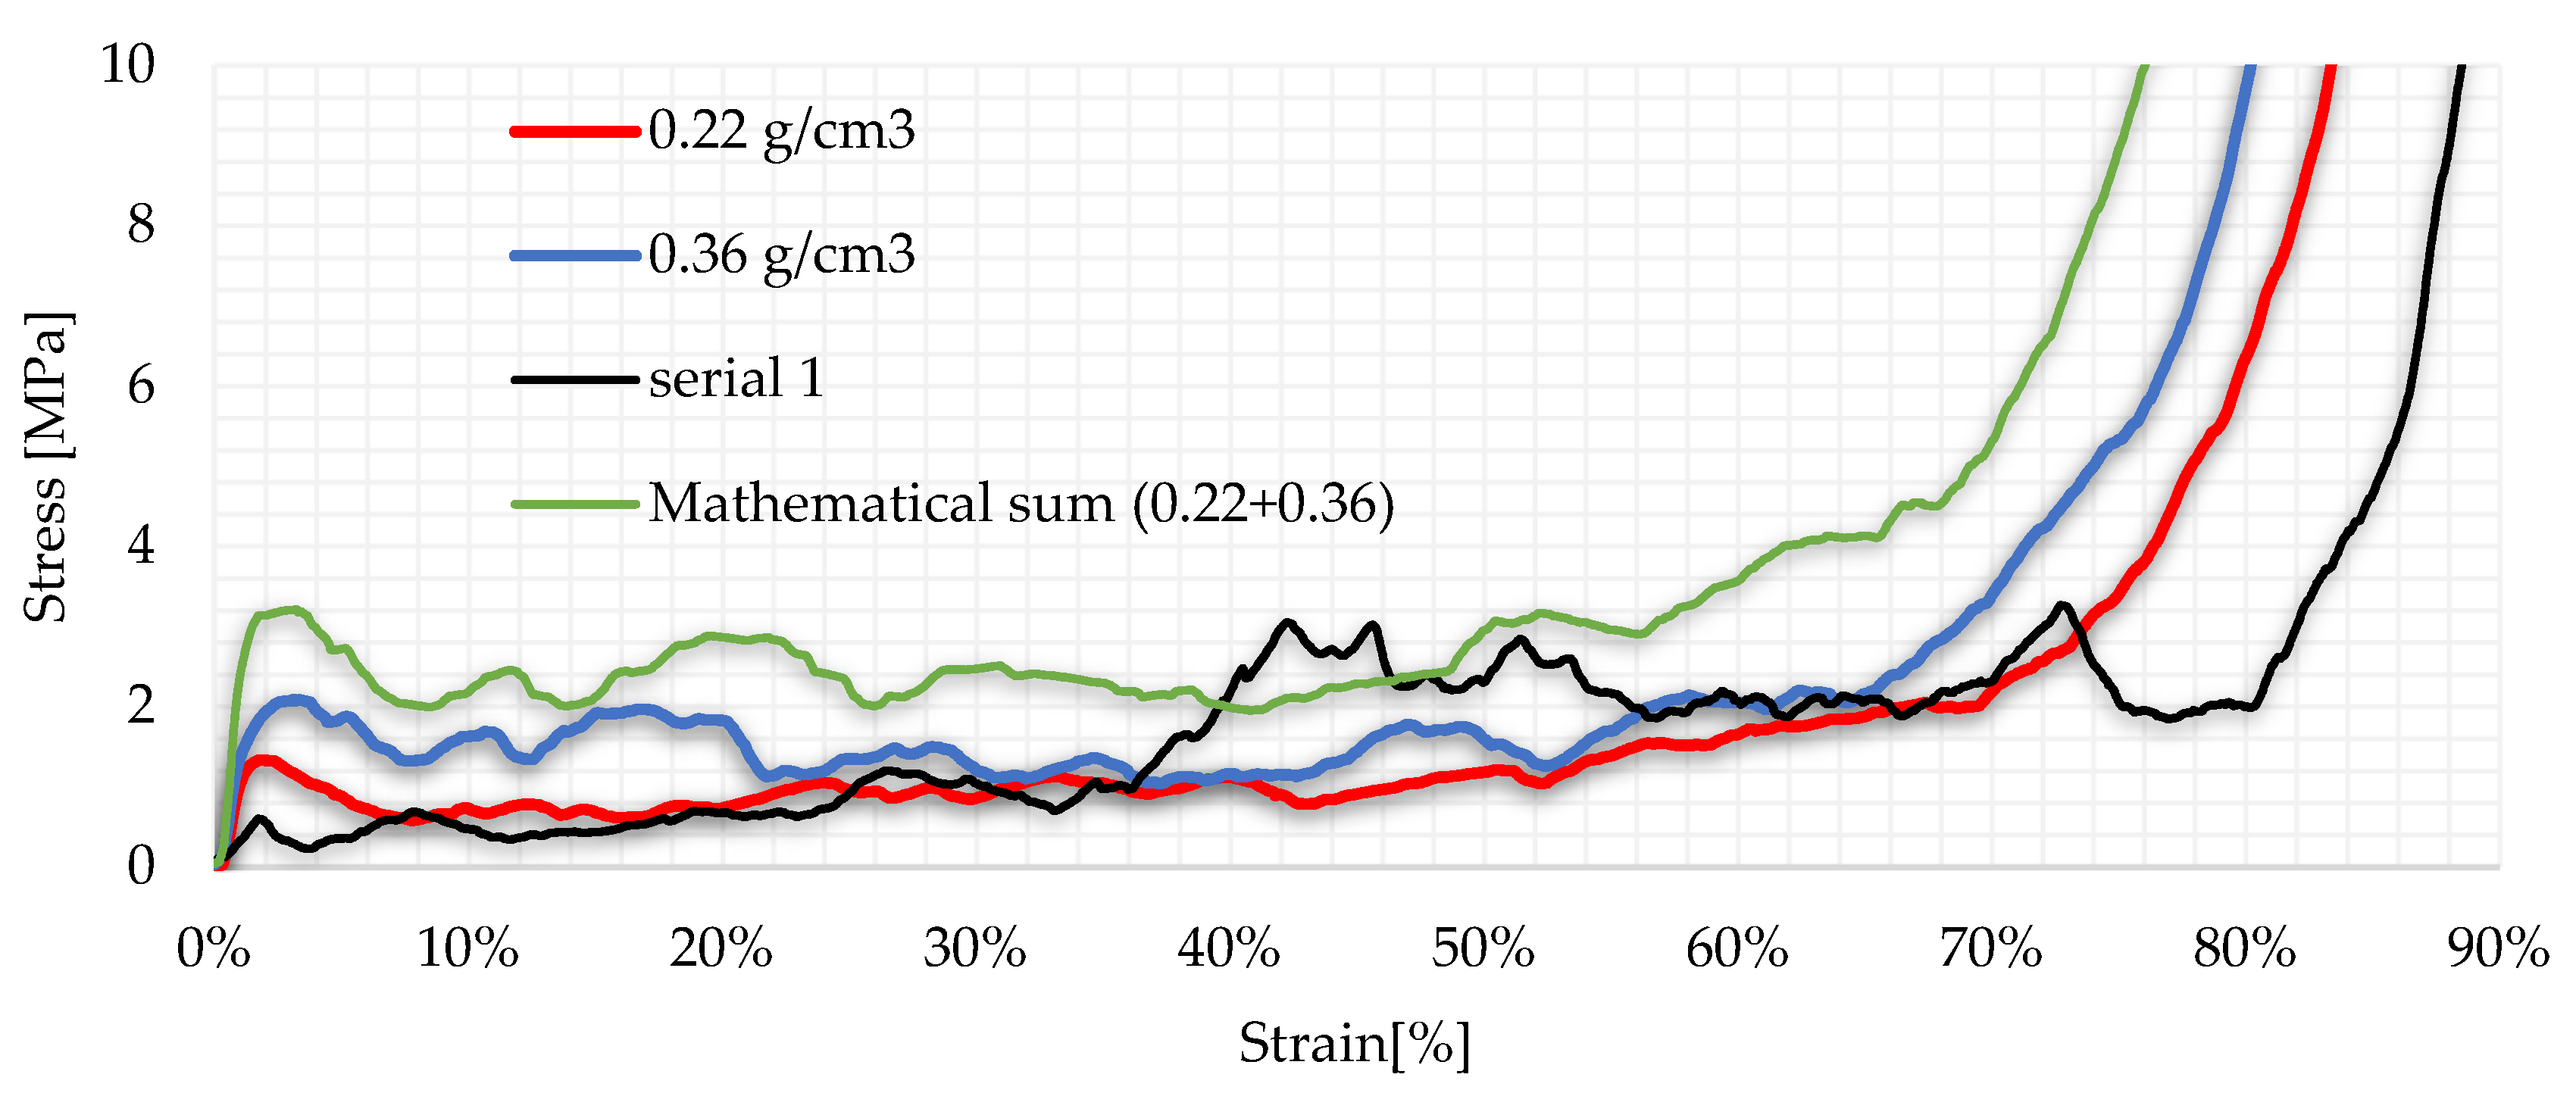
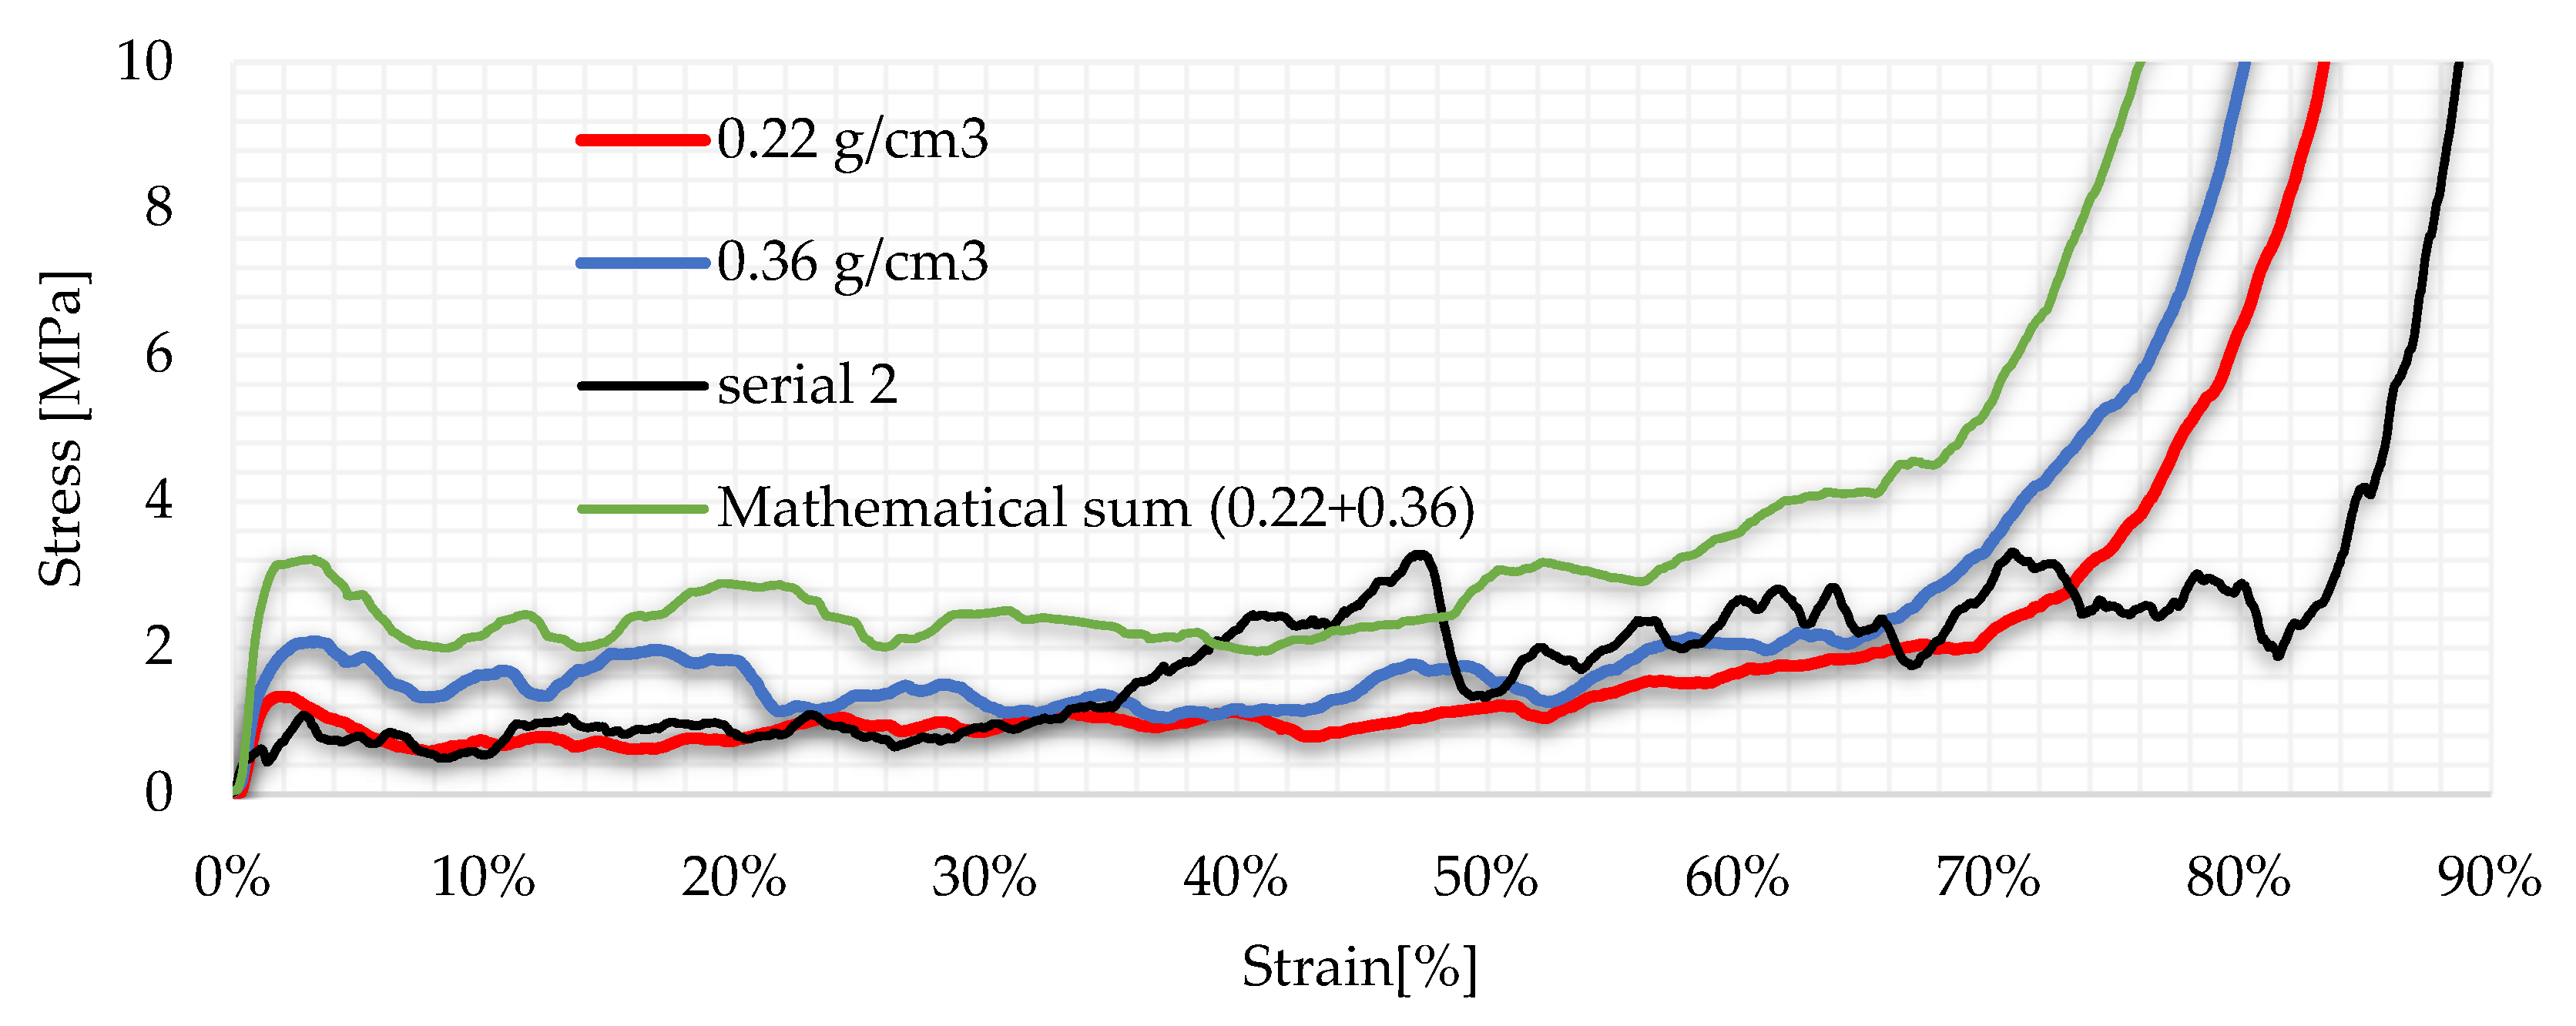
The in-line arrangement promised to be a much more exciting contest, as the single test proved that foams with different densities have different linear elastic properties. These, in turn, suggest that the degree of compression of the foams is different for the same compression displacement. Of course, the sum of the partial foam compression should be equal to the cross-head displacement. However, the simultaneous compression of foams with different properties resulted in new stress–strain characteristics. While in the parallel arrangement, the combining property of the lighter foam was weaker, here it significantly affected the curve characteristics. A very interesting and unexpected result was that the order of the foams also affects the curve and therefore different results can be obtained just by placing the foam closer to the cross-head. As we did in the parallel scenario, the two foams were interpreted as one in the diagram. The serial connection was tested using two methods, where the order of the foams was modified in accordance with Figure 1. Figure 9 and Figure 10 represent the results of the tests.
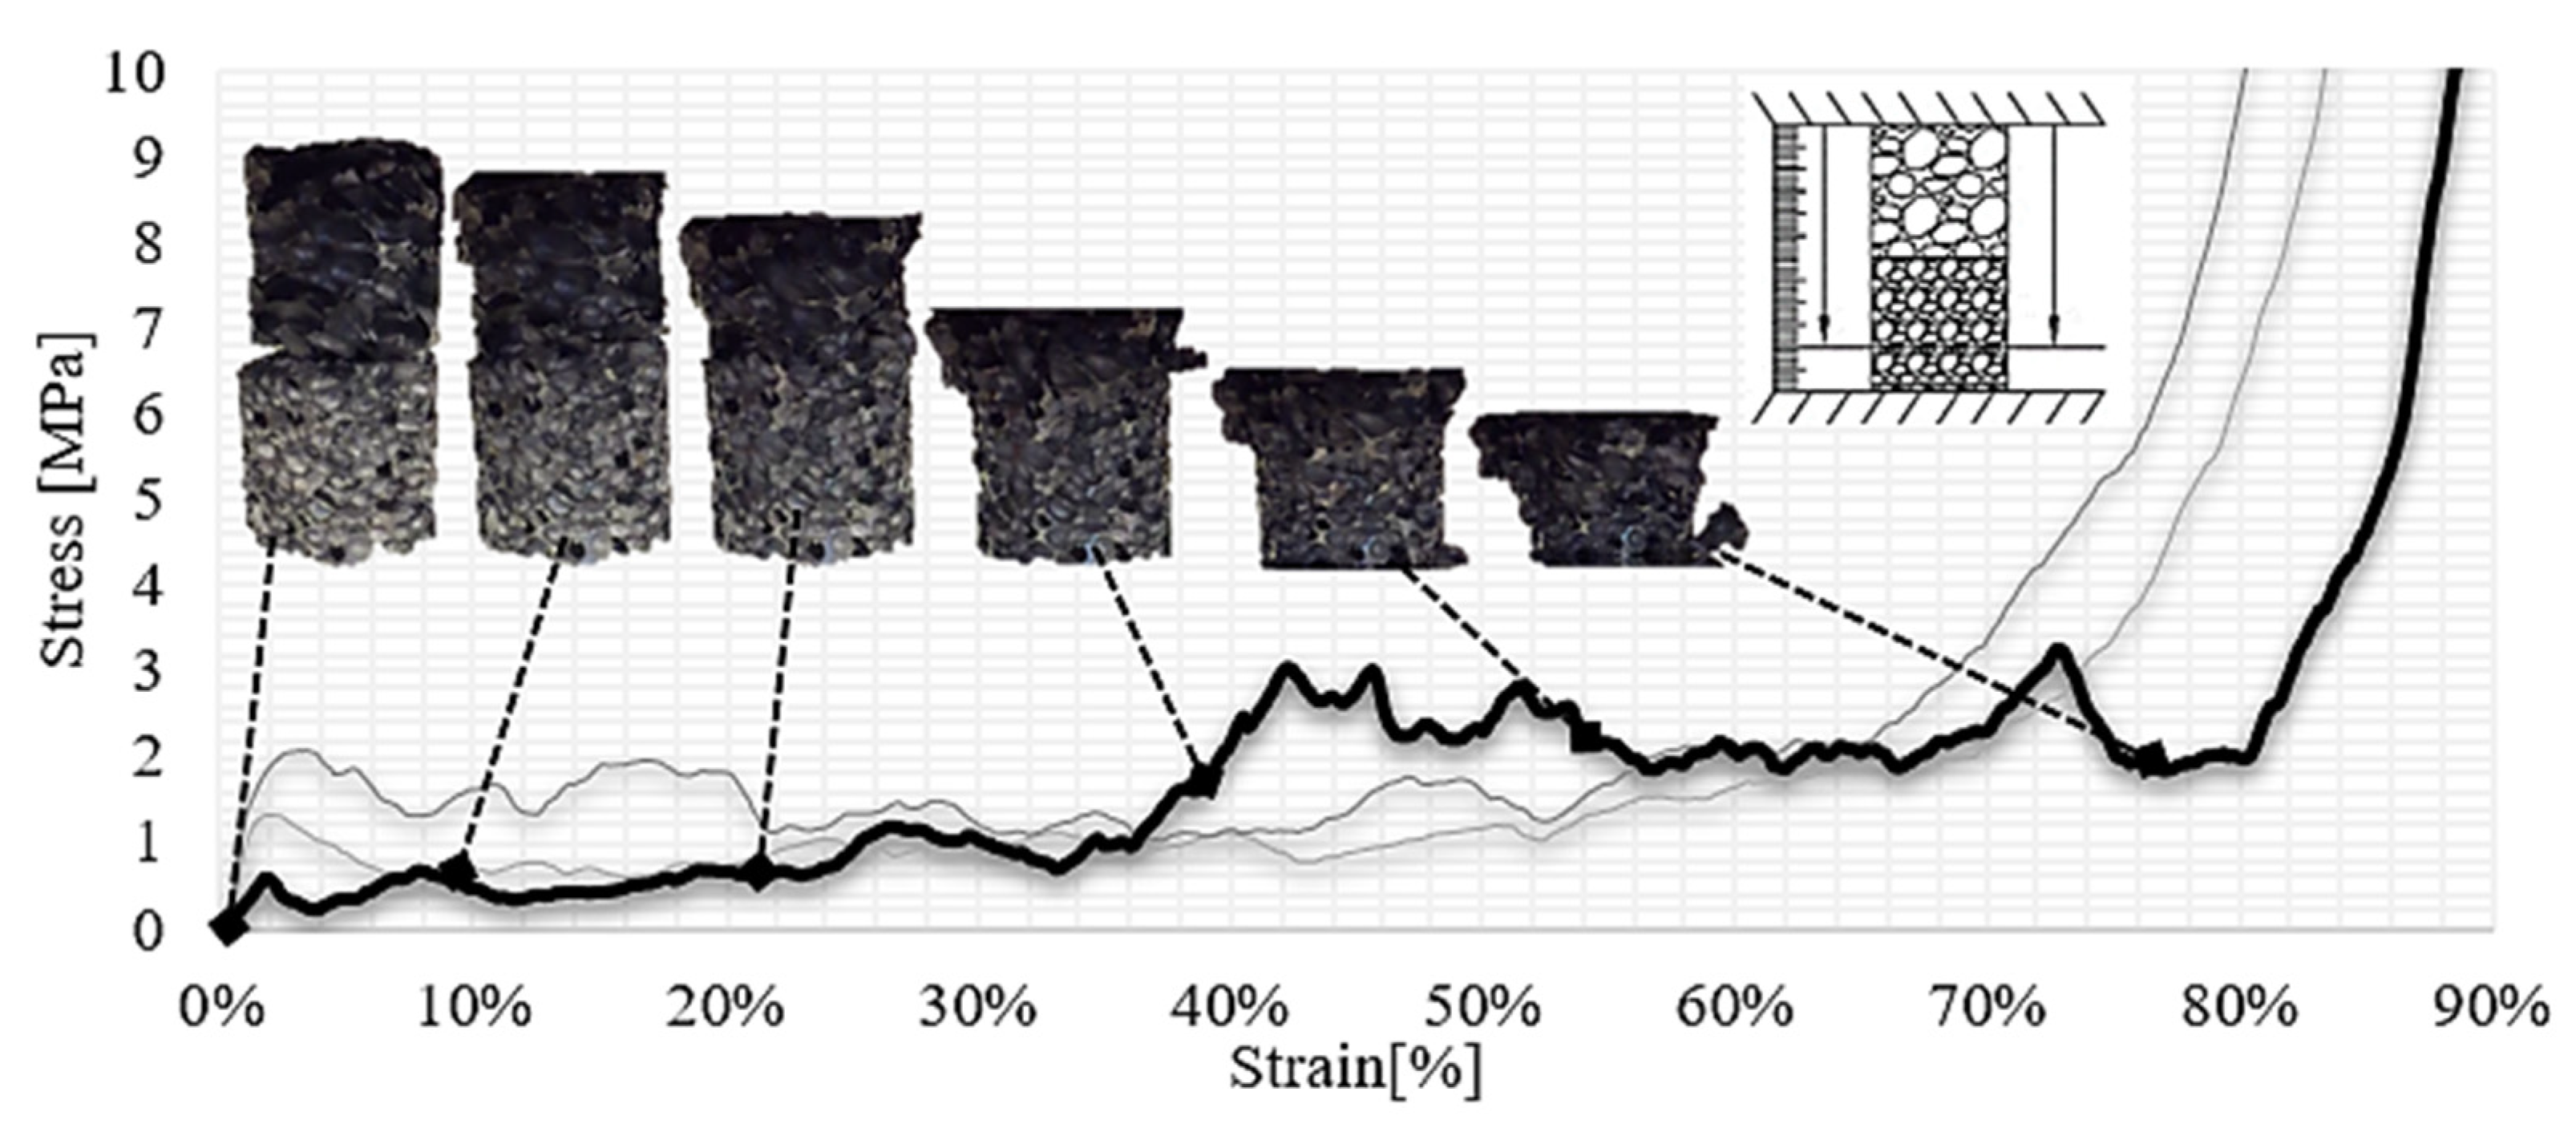
First, the SP-LD3 and the SP-HD3 labeled specimens were used where the lighter was placed closer to the crosshead, while in the second step, the order was changed. The linear-elastic section reaches its first local maximum at 1.949% strain where the stress was 0.564 MPa. It is interesting that both layouts (parallel and serial) used the same foam, but showed a different curve occurrence. At up to 30% deformation, only the low-density foam was compressed, then at 35%, it started to harden. This appears as a rising section in the plateau area. After that, the denser foam started to bulk and created the second plane of the plateau section. Another interesting phenomenon is the beginning of the thickening zone. At nearly 80% deformation, the actual hardening of the foam structure begins. This means that the ideal energy absorption range was extended. It is important to mention the regression before the hardening zone, which can be explained by the physical unification of the foam with two densities. Based on the diagram, we analyzed the plateau section in two parts. The average plateau value in the first section was 0.69 MPa and in the second section 2.43 MPa. Table 4 collects the values of the test. The snapshots clearly show the order of the deformation in Figure 11. By changing the order of the foams, similar results were obtained. Figure 10 clearly shows the two levels of plateau sections. A sharp transition between the two may be observed. Then, as in the previous design, a setback may be observed before the hardening zone.
7. Energy Efficiency
More pertinent information on the used and measured metal foams may be found when looking at the energy efficiency. With the use of this technique, we can learn how much of the foam’s capacity is being used for energy absorption. The goal of improving crashworthiness is to employ foams of the greatest absorption capability to lessen the loading effect of collisions. We can offer recommendations for development and optimization after taking these results into account. The long-term goal of our research is to create a crash box for vehicles that uses foam to absorb energy. We may formulate the creation and study of the crumple box using these efficacies. The crash absorption effectiveness of any structure may also be compared as a good yardstick. The following formula was used to calculate the impact energy absorption capacity of the foam [25,26,27]:
where the σ0 and the ε0 represent the actual stress and strain values of the stress–strain curve region where we want to define the foaming efficiency. Although the densification zone has the potential to absorb a significant amount of energy, it is advisable to use the foam until the end of the plateau phase. After this limit, the densified foam may be able to conduct energy instead of absorbing it. Therefore, the energy efficiency calculation was performed for the plateau stage and collected in Table 5.
8. Specific Energy Absorbing (SEA)
When weight is a crucial project parameter, Specific Energy Absorbing (SEA) enables the comparison of the energy absorption capacities of the two different materials and designs. It goes without saying that the energy absorption capacity of a crumple structure can be increased by changing the density of the foam used [28,29,30]. However, this is limited by mass optimization. Therefore, SEA is an excellent value for determining how much energy a unit mass of foam or foams can absorb.
where the m is the mass, the V is the volume of the specimens, and the EA is the amount of the absorbed energy, given in J. Basically, it is a value given by the ratio of the absorbed energy to the volume or mass. This can certainly be a guideline for the development of a mass optimization passive safety system. With SEA, the performance of the development can be expressed objectively, and it may also help to find the most effective design for passive safety systems [31,32,33,34]. Before the compression tests, the volume and mass of the foams were recorded and can now be used to determine the SEA in J/g. According to the content in Table 6, it was revealed that the different density foam had a positive effect on the SEA. Furthermore, applying the same foam, this value could even be further influenced by the positioning of the foams either in parallel or in series. In the case of crumple zone development overweight optimization, the space requirements are also important conditions. Hence, this study investigated the SEA value relative to the volume of the foams. This is also a great way to investigate the effect of foam placement, as both the parallel and in-line arrangements used the same volume unit, but the amount of energy absorbed, as shown in the previous table, was not the same, resulting in different overall efficiencies. Analyzing the data in Table 6 reveals that the effect of the different scenarios is well established. In the case of SEA, with regards to volume, there is no remarkable deviation between each concept, except in the serial method. With the serial design, the characteristic of the curve may be influenced, rather than the amount of energy.
9. Conclusions
In this investigation, the effects of varying the density of the foam arrangement were shown through the compression of closed-cell aluminum foam. The inquiry focused on the energy absorption performance since the test was the first step in a later crash-box optimization. Our hypothesis suggests that the actual arrangement of the foams may have a significant impact on the impact energy-absorbing capability of a crumple structure. The study was divided into three parts. In the first section, a single test was presented to reveal the mechanical parameters of the foams used in the test. Subsequently, the specimens were compressed in serial and parallel arrangements at a rate of 1 mm/s up to 80% deflection, while the force and displacement diagram was recorded to construct the stress–strain diagram. The minimum 80% compression was necessary to allow for the full compression of the foam and to be able to investigate each phase separately. The study provided important and useful results that will be applicable in our future research development. In the study, it was established that the energy absorption capacity of a metal foam structure is not directly proportional to its mass and/or volume, contrary to previous assumptions. The relative position of the foams of different densities with respect to the direction of the compression test could be important. Table 7 summarizes the results of the different compression scenarios.
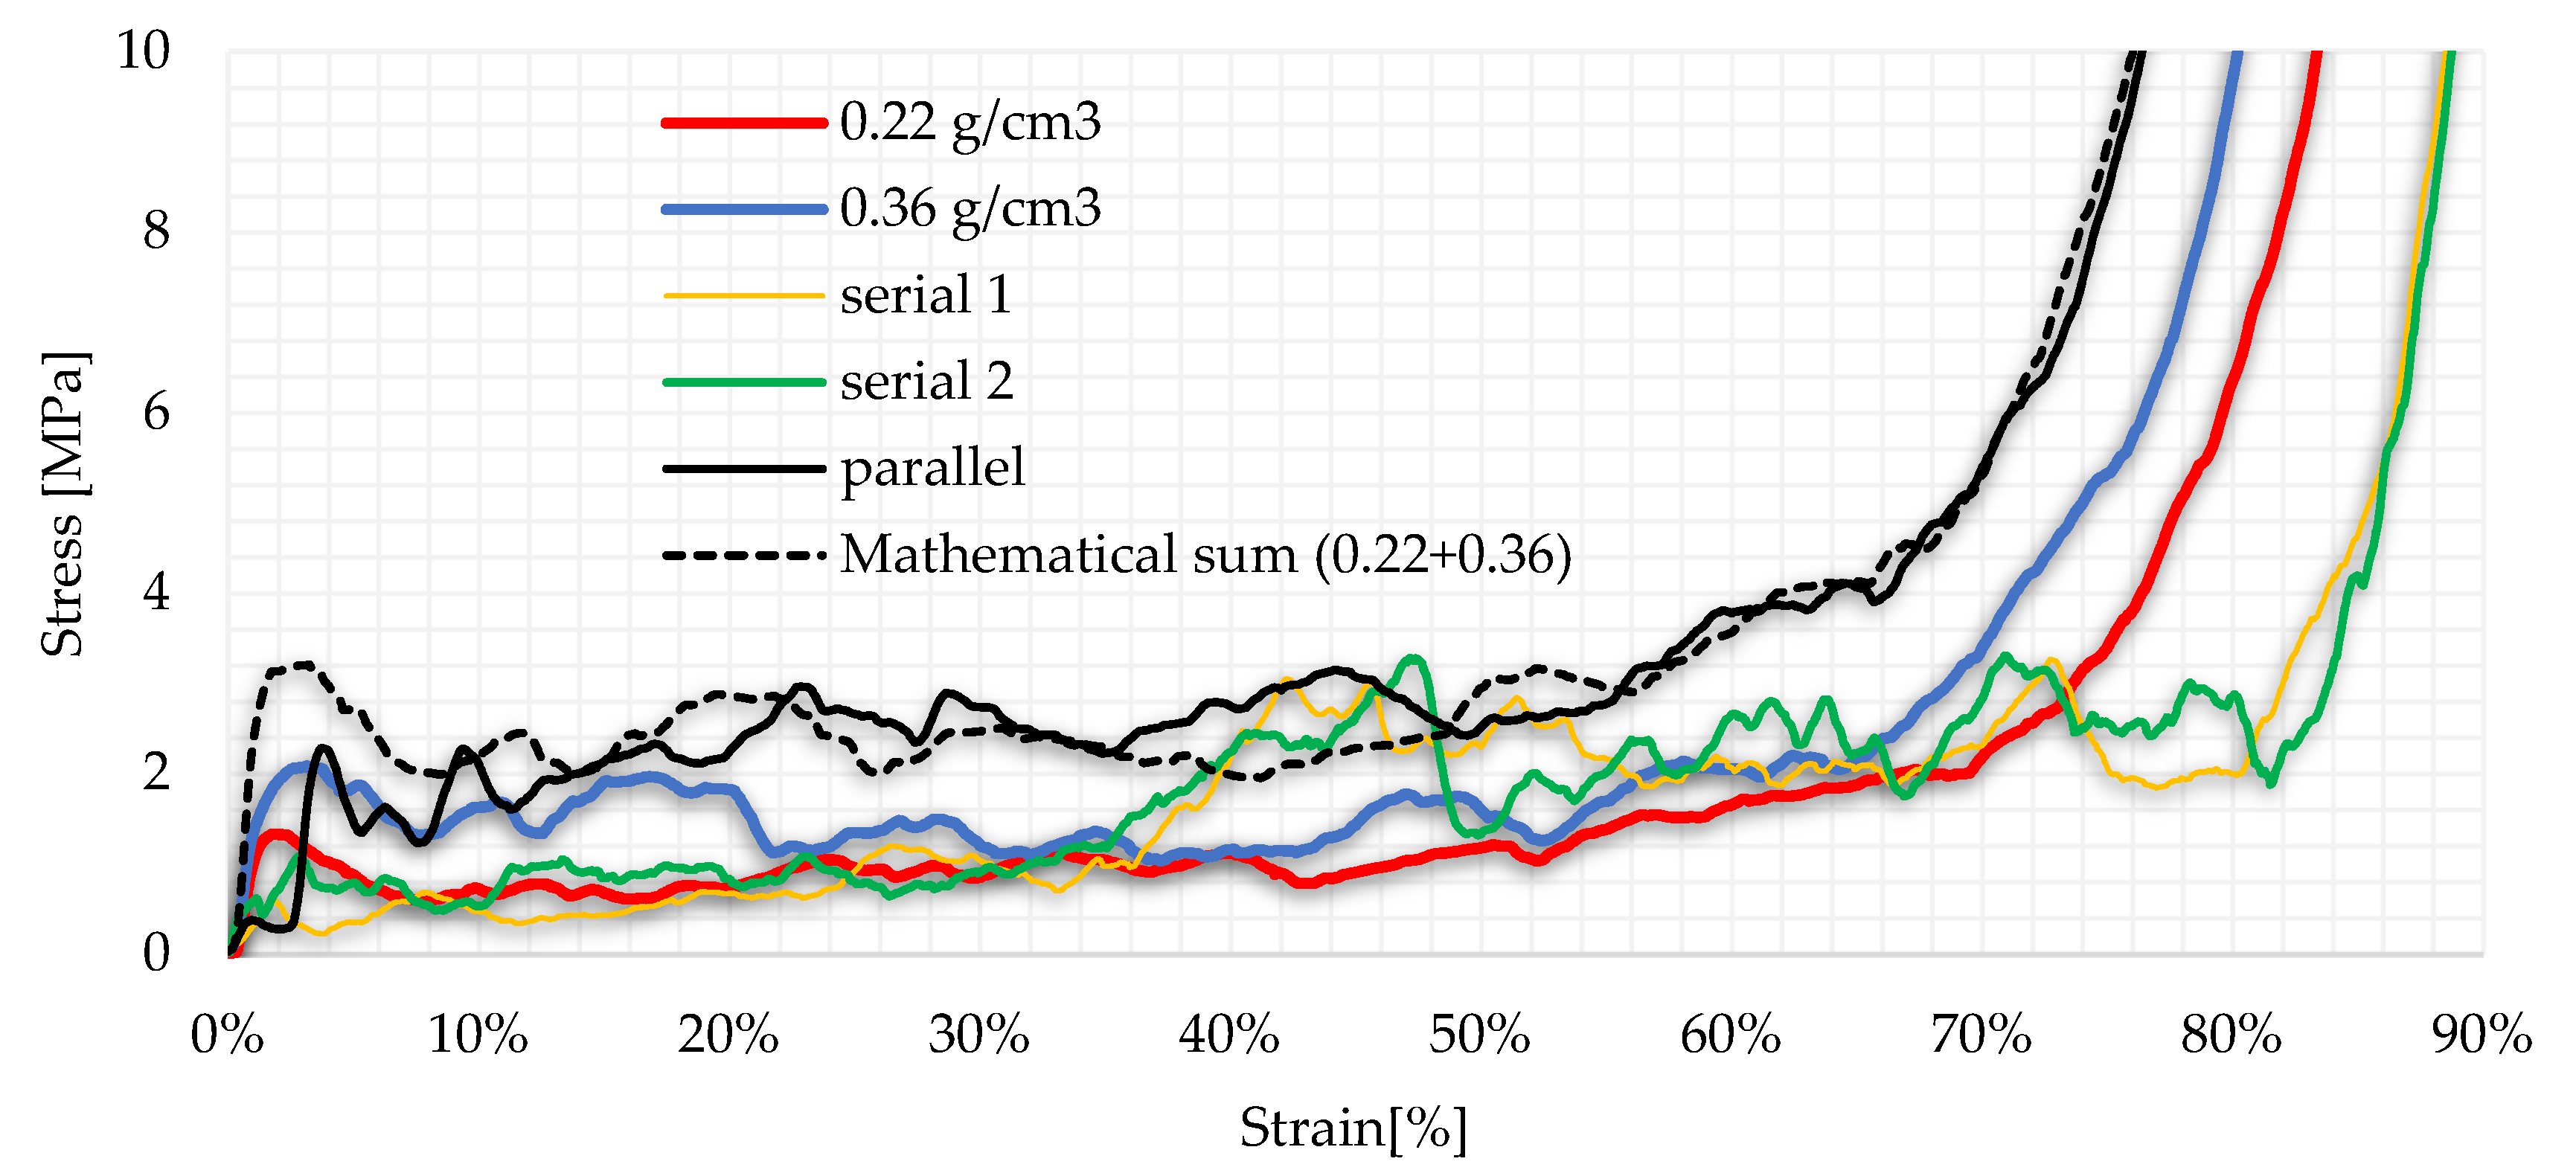
Measurements have shown that the same structure of foams will produce different mechanical properties in parallel and in series as seen in Figure 12. The thesis is that the higher-density material can be considered as the base metal in an alloy and the smaller-density foam as an alloying agent that affects the compressive properties of the structure. However, the effect of this physical alloy can be influenced if used in different arrangements.
The measurements show that the plateau section, which is important for energy absorption, can be influenced from a design point of view. In the case of a parallel arrangement, the plateau section was displaced in the positive direction along the Y-axis, but the two foam properties did not add up. This result is represented in Figure 13. In the case of the in-line arrangement, the platform section can be stretched. The onset of the previously observed thickening zone was shifted and instead of 60–70%, it reached 80% deformation. In crashworthiness, the densification zone of the foam must be avoided since the densified cells can conduct the energy. With this solution, this effect can be avoided or delayed. This means that the structure can be kept longer in the plateau stage thus increasing its energy absorption capacity. A further significant result is the layout of the plateau range. Figure 9 and Figure 10 illustrate well the two linear stages, based on which the new characteristic can be interpreted as a target to be achieved when designing a vehicle body, and this could be useful in the case of crashworthiness.
This is an important result because if we want to use the foam structure studied herein in a crash box, we can conclude that the structure can absorb more and more energy in case of an impact, with increasing deformation. At low impact energy, only the foam with lower density plays its role in the absorption, while at higher impact energy, both foams are compressed. The chapter about SEA (Specific Energy Absorption) also confirms the efficiency of the structure, since the amount of the energy absorbed—relative to the mass and the weight—could be significantly improved without significantly increasing the mass or the volume of the structure in the case of the parallel concept. This type of design study was important and the results obtained are of great relevance to this research, as no studies of this type were found in our literature search on which to base subsequent crumple zone design work.
Author Contributions
Conceptualization, J.K. and T.A.K.; methodology, J.K.; software, Z.N.; validation, J.K. and M.F.; formal analysis, L.T.; investigation, J.K.; resources, M.F.; data curation, Z.N.; writing—original draft preparation, J.K.; writing—review and editing, T.A.K.; visualization, J.K.; supervision, T.A.K.; project administration, L.T. All authors have read and agreed to the published version of the manuscript.
Funding
This research received no external funding.
Institutional Review Board Statement
Not applicable.
Informed Consent Statement
Not applicable.
Data Availability Statement
Not applicable.
Acknowledgments
The authors would like to thank the Hungarian State and the European Union for their support in project No. 2020-1.1.2-PIACI-KFI-2020-00081.
Conflicts of Interest
The authors declare no conflict of interest.
References
- Eichaker, L.; Trepeck, C.; Arnett, M.; Chen, H.F.; Wiechel, J.; Guenther, D. Increased Vehicle Intrusion as a Result of Vehicle Weight. In Proceedings of the ASME International Mechanical Engineering Congress and Exposition, Virtual, 1–5 November 2021. [Google Scholar] [CrossRef]
- Khata, E.M. Analysis of Impact Energy as a Basis of Collision Severity in Vehicle Accidents. Ph.D. Thesis, Jomo Kenyatta University of Agriculture and Technology, Juja, Kenya, 2021. [Google Scholar]
- Ziubiński, M.; Prochowski, L. Assessment of the vehicle body side stiffness influence on the process of hazard generating in front-to-side vehicles’ collision. IOP Conf. Ser. Mater. Sci. Eng. 2022, 1247, 012024. [Google Scholar] [CrossRef]
- Alexandru, G.I.; Marius, C.G.; Daniel, T.F.; Dragos, T.D. Dynamics of frontal crash in/without the presence of passive safety systems. Mater. Sci. Eng. 2022, 1220, 012044. [Google Scholar] [CrossRef]
- Yang, C.; Zhao, Z.; Guo, W.; Xu, P.; Zhou, S.; Yan, L.; Jin, X. Parametric beam-based crashworthiness optimisation for the crush zone of a subway vehicle. Thin-Walled Struct. 2023, 183, 110387. [Google Scholar] [CrossRef]
- Adarsha, H.; Venkadeshwaran, K.; Deepak, J.; Beemkumar, N. An Insight to Automobile Safety Systems. New Approaches Eng. Res. 2021, 11, 53–64. [Google Scholar]
- Gazder, U. Awareness of Vehicle Safety Features and Their Use and Impact on Accidents. In Proceedings of the Third International Sustainability and Resilience Conference: Climate Change, Online, 15–16 November 2021; pp. 394–398. [Google Scholar]
- Répás, J.; Berek, L. Security and Safety Systems on Modern Vehicles; VAE Springer: Berlin/Heidelberg, Germany, 2023; pp. 84–100. [Google Scholar]
- Abhikash, A.V.; Gupta, C.; Kumar, R.; Gupta, M.; Tonk, R. Study of an advanced vehicle impact absorbing body frame. Int. J. Mech. Eng. Technol. 2022, 13, 27–32. [Google Scholar]
- Dobrovolny, C.S.; Stoeltje, G.; Zalani, A. Crash Compatibility of Automated Vehicles with Passenger Vehicles; No. 05-098; Safety through Disruption (Safe-D); University Transportation Center: Washington, DC, USA, 2021. [Google Scholar]
- Jongpradist, P.; Senawat, S.; Muangto, B. Improvement of crashworthiness of bus structure under frontal impact. In Proceedings of the 2015 World Congress on Advances in Structural Engineering an Mechanics, Incheon, Korea, 25–29 August 2015. [Google Scholar]
- Zhang, Z.; Feng, H.; Xu, T.; Xin, W.; Ding, J.; Liu, N.; Liu, Y. Compression performances of integral-forming aluminum foam sandwich. Compos. Struct. 2022, 283, 115090. [Google Scholar] [CrossRef]
- Zhang, J.; Ye, Y.; Li, J.; Zhu, Y.; Yuan, H.; Qin, Q.; Zhao, M. Dynamic collapse of circular metal foam core sandwich tubes in splitting and curling mode. Thin-Walled Struct. 2021, 161, 107464. [Google Scholar] [CrossRef]
- Jiang, B.; Chen, X.; Yu, J.; Zhao, Y.; Xie, Z.; Tan, H. Energy-absorbing properties of thin-walled square tubes filled with hollow spheres. Thin-Walled Struct. 2022, 180, 109765. [Google Scholar] [CrossRef]
- Zhang, J.; Du, J.; Guo, H.; Yuan, H.; Qin, Q. Splitting and curling performance of metal foam-filled circular tubes. Acta Mech. 2022, 233, 535–559. [Google Scholar] [CrossRef]
- Wang, G.; Zhang, Y.; Zheng, Z.; Chen, H.; Yu, J. Crashworthiness design and impact tests of aluminium foam-filled crash boxes. Thin-Walled Struct. 2022, 180, 109937. [Google Scholar] [CrossRef]
- Magliaro, J.; Altenhof, W.; Alpas, A.T. A review of advanced materials, structures and deformation modes for adaptive energy dissipation and structural crashworthiness. Thin-Walled Struct. 2022, 180, 109808. [Google Scholar] [CrossRef]
- Hussein, R.D.; Naeem, H.T.; Atiyah, H.; Ruan, D. Lateral Crushing of Square Aluminium Tubes Filled with Different Cores. Mater. Res. 2022, 25, e20220057. [Google Scholar] [CrossRef]
- Szlancsik, A.; Orbulov, I. Compressive properties of metal matrix syntactic foams in uni-and triaxial compression. Mater. Sci. Eng. 2021, 827, 142081. [Google Scholar] [CrossRef]
- Mankovits, T.; Budai, I.; Balogh, G.; Gábora, A.; Kozma, I.; Varga, T.; Kocsis, I. Structural analysis and its statistical evaluation of a closed-cell metal foam. Int. Rev. Appl. Sci. Eng. 2014, 5, 135–143. [Google Scholar] [CrossRef]
- Duarte, I.; Vesenjak, M.; Krstulović-Opara, L. Compressive behaviour of unconstrained and constrained integral-skin closed-cell aluminium foam. Compos. Struct. 2016, 154, 231–238. [Google Scholar] [CrossRef]
- ISO 13314:2011; Mechanical Testing of Metals-Ductility Testing-Compression Test for Porous and Cellular Metals. International Organization for Standardization: Geneva, Switzerland, 2011.
- Ashby, M.F.; Evans, T.; Fleck, N.A.; Hutchinson, J.W.; Wadley, H.N.G.; Gibson, L.J. Metal Foams: A Design Guide; Elsevier: Amsterdam, The Netherlands, 2000. [Google Scholar]
- Zarei, H.R.; Kröger, M. Optimization of the foam-filled aluminium tubes for crash box application. Thin-Walled Struct. 2008, 46, 214–221. [Google Scholar] [CrossRef]
- Szlancsik, A. Szintaktikus Fémhabok Rugalmas. és Nyomóvizsgálatokkal Meghatározható Képlékeny Tulajdonságai és Modellezése. Ph.D. Thesis, Budapest University of Technology and Econoomics, Budapest, Hungary, 2021. [Google Scholar]
- Al-Sahlani, K.; Broxtermann, S.; Lell, D.; Fiedler, T. Effects of particle size on the microstructure and mechanical properties of expanded glass-metal syntactic foams. Mater. Sci. Eng. 2018, 728, 80–87. [Google Scholar] [CrossRef]
- Kemény, A.; Leveles, B.; Bubonyi, T.; Orbulov, I.N. Effect of particle size and volume ratio of ceramic hollow spheres on the mechanical properties of bimodal composite metal foams. Composites 2021, 140 Pt A, 106152. [Google Scholar] [CrossRef]
- Duarte, I.; Vesenjak, M.; Krstulović-Opara, L. Dynamic and quasi-static bending behaviour of thin-walled aluminium tubes filled with aluminium foam. Compos. Struct. 2014, 109, 48–56. [Google Scholar] [CrossRef]
- Wang, Q.; Fan, Z.; Gui, L. Theoretical analysis for axial crushing behaviour of aluminium foam-filled hat sections. Int. J. Mech. Sci. 2007, 49, 515–521. [Google Scholar] [CrossRef]
- Yamada, Y.; Banno, T.; Xie, Z.; Cui, E.W. Energy absorption and crushing behaviour of foam-filled aluminium tubes. Mater. Trans. 2005, 46, 2633–2636. [Google Scholar] [CrossRef] [Green Version]
- Hamidreza, S.; Mohammadbagher, B.A.; Masoud, A. Optimized foam filling configuration in bi-tubular crush boxes; a comprehensive experimental and numerical analysis. Eng. Res. Express 2020, 2, 015012. [Google Scholar]
- Djamaluddin, F.; Abdullah, S.; Arrifin, A.K.; Nopiah, Z.M. Crush analysis of the foam-filled bitubal circular tube under oblique impact. IOP Conf. Ser. Mater. Sci. Eng. 2017, 308, 012040. [Google Scholar] [CrossRef]
- Meriç, D.; Gedikli, H. Multi-objective optimization of energy absorbing behavior of foam-filled hybrid composite tube. Compos. Struct. 2022, 279, 114771. [Google Scholar] [CrossRef]
- Yang, H.; Lei, H.; Lu, G. Crashworthiness of circular fiber reinforced plastic tubes filled with composite skeletons/aluminum foam under drop-weight impact loading. Thin-Walled Struct. 2021, 160, 107380. [Google Scholar] [CrossRef]
Figure 1.
Closed cell foam-filled thin-walled tube (Own collaboration of authors).

Figure 2.
Scheme of the investigations ((a) single compressions (b) parallel compression, (c) serial conceptions) (own collaboration of authors).
Figure 2.
Scheme of the investigations ((a) single compressions (b) parallel compression, (c) serial conceptions) (own collaboration of authors).

Figure 3.
Typical stress–strain curve of metal foams (Own collaboration of authors based on [23]).
Figure 3.
Typical stress–strain curve of metal foams (Own collaboration of authors based on [23]).

Figure 4.
Scheme of foam and thin-walled structure compression (Own collaboration of authors based on [23].)
Figure 4.
Scheme of foam and thin-walled structure compression (Own collaboration of authors based on [23].)

Figure 5.
Foam effect for the axial compression (Own collaboration of authors based on [23]).
Figure 5.
Foam effect for the axial compression (Own collaboration of authors based on [23]).

Figure 6.
Stress–strain of single compressions up to 50% strain (own collaboration of authors).

Figure 7.
Stress–strain of single compressions up to 80% strain (own collaboration of authors).

Figure 8.
Stress–strain diagram of parallel scenario up to 80% strain (own collaboration of authors).
Figure 8.
Stress–strain diagram of parallel scenario up to 80% strain (own collaboration of authors).

Figure 9.
Stress–strain curve of serial 1. scenario up to 90% strain (own collaboration of authors).
Figure 9.
Stress–strain curve of serial 1. scenario up to 90% strain (own collaboration of authors).

Figure 10.
Stress–strain curve of serial 2. scenario up to 90% strain (own collaboration of authors).
Figure 10.
Stress–strain curve of serial 2. scenario up to 90% strain (own collaboration of authors).

Figure 11.
The process of compression (own collaboration of authors).

Figure 12.
Comparison diagram (own collaboration of authors).

Figure 13.
The effect of the parallel and serial concepts relative to the normal compression test (Own collaboration of authors).
Figure 13.
The effect of the parallel and serial concepts relative to the normal compression test (Own collaboration of authors).


Table 1.
Specimen parameters. (Own collaboration of authors).
| Designation | Diameter | Height | Volume | Mass | Density | Rel. Density |
|---|---|---|---|---|---|---|
| SP-LD1 | 29.76 | 28.73 | 19.97 | 4.74 | 0.23 | 0.085 |
| SP-LD2 | 29.55 | 28.95 | 19.84 | 4.54 | 0.22 | 0.081 |
| SP-LD3 | 29.13 | 29.35 | 19.55 | 4.69 | 0.23 | 0.085 |
| SP-LD4 | 29.88 | 29.81 | 20.89 | 4.81 | 0.23 | 0.085 |
| SP-HD1 | 29.91 | 29.81 | 20.93 | 7.58 | 0.36 | 0.13 |
| SP-HD2 | 29.95 | 28.73 | 20.23 | 7.02 | 0.34 | 0.12 |
| SP-HD3 | 29.34 | 29.85 | 20.17 | 7.44 | 0.36 | 0.13 |
| SP-HD4 | 29.79 | 29.34 | 20.43 | 7.49 | 0.36 | 0.13 |
Table 2.
Results of single compressions (own collaboration of authors).
| Label | σmax [MPa] | σpl [MPa] | σpl * [MPa] | εD [%] | Eabs.plateau [MJ/m3] | Eabs.total [MJ/m3] |
|---|---|---|---|---|---|---|
| SP-LD1 (0.22 g/cm3) | 1.315 | 1.062 | 1.044 * | 70 | 0.76 | 2.653 |
| SP-HD1 (0.36 g/cm3) | 2.046 | 1.445 | 1.386 * | 73 | 1.25 | 3.996 |
* Calculated plateau stress with the Formula (3).
Table 3.
Results of parallel compression (own collaboration of authors).
| Label | σmax [MPa] | σpl [MPa] | εD [%] | Eabs.plateau [MJ/m3] | Eabs.total [MJ/m3] |
|---|---|---|---|---|---|
| SP-LD2 + SP-HD2 | 2.014 | 2.764 | 63 | 1.55 | 6.163 |
Table 4.
Results of serial compression (own collaboration of authors).
| Label | σmax [MPa] | σpl [MPa] | εD [%] | Eabs.plateau [MJ/m3] | Eabs.total [MJ/m3] |
|---|---|---|---|---|---|
| SP-LD3 + SP-HD3 | 0.564 | 1.908 | 83% | 1.299 | 1.756 |
| SP-DH4 + SP-LD4 | 1.041 | 1.991 | 81% | 1.34 | 2.56 |
Table 5.
Energy efficiency (own collaboration of authors).
| Type of Method | Labels | η plateau [%] |
|---|---|---|
| Single test | SP-LD1 | 49.64 |
| SP-HD1 | 37.39 | |
| Paralell test | SP-LD2 + SP-HD2 | 64.61 |
| Serial test | SP-LD3 + SP-HD3 | 43.37 |
| SP-HD4 + SP-LD4 | 59.42 |
Table 6.
SEA of each scenario (own collaboration of authors).
| Type of Method | Labels | SEAmass [J/g] | SEAvolume [J/cm3] |
|---|---|---|---|
| Single test | SP-LD1 | 0.559 | 0.132 |
| SP-HD1 | 0.541 | 0.199 | |
| Parallel test | SP-LD2 + SP-HD2 | 0.524 | 0.308 |
| Serial test | SP-LD3 + SP-HD3 | 0.146 | 0.087 |
| SP-HD4 + SP-LD4 | 0.213 | 0.128 |
Table 7.
Result summarization (own collaboration of authors).
| Label | SP-LD1 (0.22 g/cm3) | SP-HD1 (0.36 g/cm3) | SP-LD2 + SP-HD2 | SP-LD3 + SP-HD3 | SP-DH4 + SP-LD4 |
|---|---|---|---|---|---|
| Arrangement | single | single | parallel | serial | serial |
| σmax [MPa] | 1.315 | 2.046 | 2.014 | 0.564 | 1.041 |
| σpl [MPa] | 1.062 | 1.445 | 2.764 | 1.908 | 1.991 |
| εD [%] | 70 | 73 | 63 | 83 | 81 |
| Eabs. [MJ/m3] | 0.76 | 1.25 | 1.55 | 1.299 | 1.34 |
| Eabs.total [MJ/m3] | 2.653 | 3.996 | 6.163 | 1.756 | 2.56 |
| SEAmass [J/g] | 0.559 | 0.541 | 0.524 | 0.146 | 0.213 |
| SEAvolume [J/cm3] | 0.132 | 0.199 | 0.308 | 0.087 | 0.128 |
| η plateau [%] | 49.64 | 37.39 | 64.61 | 43.37 | 59.42 |
Disclaimer/Publisher’s Note: The statements, opinions and data contained in all publications are solely those of the individual author(s) and contributor(s) and not of MDPI and/or the editor(s). MDPI and/or the editor(s) disclaim responsibility for any injury to people or property resulting from any ideas, methods, instructions or products referred to in the content. |
© 2023 by the authors. Licensee MDPI, Basel, Switzerland. This article is an open access article distributed under the terms and conditions of the Creative Commons Attribution (CC BY) license (https://creativecommons.org/licenses/by/4.0/).
Share and Cite
MDPI and ACS Style
Kertész, J.; File, M.; Nyikes, Z.; Kovács, T.A.; Tóth, L. Al-Foam Compression Tests in Parallel and Serial Concepts. Appl. Sci. 2023, 13, 883. https://doi.org/10.3390/app13020883
AMA Style
Kertész J, File M, Nyikes Z, Kovács TA, Tóth L. Al-Foam Compression Tests in Parallel and Serial Concepts. Applied Sciences. 2023; 13(2):883. https://doi.org/10.3390/app13020883
Chicago/Turabian StyleKertész, József, Máté File, Zoltán Nyikes, Tünde Anna Kovács, and László Tóth. 2023. "Al-Foam Compression Tests in Parallel and Serial Concepts" Applied Sciences 13, no. 2: 883. https://doi.org/10.3390/app13020883
Note that from the first issue of 2016, this journal uses article numbers instead of page numbers. See further details here.