
Effects of Contrast Enhancement Phase on the Reproducibility and Predictivity of CT-Based Renal Lesions Radiomic Features

1
Department of Medicine, Englewood Health Hospital, Englewood, NJ 07631, USA
2
Department of Radiology, Columbia University Irving Medical Center, New York, NY 10032, USA
*
Author to whom correspondence should be addressed.
Appl. Sci. 2022, 12(24), 12599; https://doi.org/10.3390/app122412599
Submission received: 7 November 2022
/
Revised: 6 December 2022
/
Accepted: 7 December 2022
/
Published: 8 December 2022
(This article belongs to the Special Issue Applications of Radiomics and Deep Learning in Medical Image Analysis)
Abstract
:The extraction of quantitative medical imaging features, or radiomics, has been an exponentially growing research field in recent decades. Nonetheless, more studies are investigating the limitations of the quantitative imaging features, especially the reproducibility of RFs across different scanning settings. In this experiment, we investigate the reproducibility of renal cell carcinoma (RCC) RFs between the non-contrast, arterial, and late phases contrast-enhanced computed tomography (CE-CT) scans; and the ability of ComBat technique to harmonize these RFs. In addition, we assessed the predictive performance of the RFs extracted from the different phases. A total of 69 CECT scans with the three different phases were analyzed. Original RFs were extracted from the segmented lesions on each phase using Pyradiomics toolbox. The agreement in RF values before and after harmonization was evaluated with the concordance correlation coefficient (CCC). Our results show that most RFs are not reproducible across different imaging phases. In addition, ComBat harmonization did not significantly increase the number of reproducible RFs in any of the three scenarios. Furthermore, RFs extracted from the arterial phase were, on average, the most predictive of overall survival in RCC patients. The findings can guide the analysis of retrospective RCC heterogeneous data acquired in different phases and add to the call for radiomics-specific harmonization techniques.
1. Introduction
With the advancement of imaging technologies and computing powers within recent decades, an opportunity for mining medical images for additional information using quantitative image analysis has arisen. Radiomics—“the high throughput extraction of quantitative features from medical images that are further correlated with biologic information”—was introduced as a result [1]. To date, research into the potential applications of quantitative medical image analysis using radiomic features (RFs).
The basis in radiomics analyses is that using quantitative imaging features or RFs could result in extracting additional information to that perceived by human experts. The extracted RFs can then be used for statistical analyses and machine learning modeling [2,3,4]. A significant number of studies reported on the predictive ability of RFs to decrypt information on computed tomography (CT) [5,6,7], magnetic resonance (MR) [8,9,10,11], and positron emission tomography (PET) scans [12,13,14]. Clinical implementation of radiomics tools has the benefits of being a minimally invasive, rapid, and highly reproducible tool that can characterize the entirety of the lesion in comparison to the current clinical standard of care, such as tissue biopsy. However, radiomics analyses must be methodologically sound to ensure the generalizability of the developed radiomic signatures.
Radiomics analyses generally aim to devise the RFs as clinical biomarkers, which requires that the RFs are both predictive and reproducible [15]. With the advancement of the field, the limitations of RFs have been increasingly researched. Several studies have studied the effects of variations in some imaging parameters on phantom and human data [16,17,18,19,20,21,22,23]. These studies reported that significant percentages of RFs are sensitive to the variations in imaging hardware and parameters used for scanning. Other studies reported on the effects of inter-observer variability on the reproducibility of RFs and reported variable results depending on the type of lesions investigated and the number and experience of observers participating in the study [24,25,26,27]. Most importantly, the lists of reproducible RFs differed based on the site and the scanning settings used for acquiring the data for the analysis. This indicates the need for more thorough analyses of the reproducibility of RFs before performing radiomics modeling.
The incidence of Renal cell carcinoma (RCC), which currently constitutes 2% of the global cancer burden, is expected to rise, especially in the developed world [28]. Around 90% of RCCs are found incidentally on abdominal scans obtained for other diagnostic reasons, and only 10% of the cases present with symptoms [29,30]. Clinically, A number of approaches are used for the diagnosis and treatment of RCC patients that are tailored based on the staging of the disease. Nonetheless, advanced non-invasive diagnostic and prognostic clinical tools remain unmet clinical needs.
Numerous studies investigated the possibility of developing clinical decision support tools using radiomic signatures in renal carcinomas, e.g., the differentiation between benign and malignant renal lesions [7,31,32], and the prediction of overall survival [33,34,35]. However, the limitations of radiomics, as mentioned earlier, hinder incorporating these models in clinical practice. Understanding the impacts of different imaging parameters on RFs is currently the most crucial objective in the field since the majority of imaging datasets are collected retrospectively and most frequently contain scans that were acquired differently.
ComBat harmonization is a data-driven harmonization method that was established as a tool to remove different batch effects on gene expression arrays [36]. Because of its successful application in genomics, ComBat has been explored in some studies to harmonize RFs extracted from scans acquired differently [12,37,38,39,40]. A number of previous studies investigated the ability of ComBat harmonization to remove the effects of different batches on the values of RFs on various phantom datasets on patient data [16,17,18,41]. Other studies investigated the change in the predictive ability of RFs following ComBat harmonization [37,38,39,41]. Nonetheless, the reported effects of ComBat harmonization on RFs varied across different studies, with no consensus on how to apply it in radiomics analysis.
This study investigates the reproducibility of RFs extracted from renal lesions segmented on three different contrast enhancement phases (non-contrast, arterial and late phases). In addition, we assess the agreement in renal lesions’ RF values across the non-contrast, arterial, and late phase scans following the application of ComBat harmonization. The aim is to examine and ultimately guide the ability to combine scans acquired in different imaging phases in radiomics analyses. Furthermore, we investigate the differences in the ability to predict overall survival using RFs extracted from the different imaging phases, which could help identify the preferential imaging phase for predicting outcomes of renal lesions.
2. Materials and Methods
2.1. Imaging Data
In this study, we analyzed the publicly available imaging dataset (Kidney and Kidney Tumors Segmentation Challenge 2019-KiTS) on the cancer imaging archive (TCIA.org) [42,43]. Imaging CT data for 210 patients were available. Of these 210 patients, 69 had the scans for three imaging phases available. These patients were used for the analyses in this manuscript. The patients were scanned in different medical centers using different imaging parameters and vendors (Table 1). The segmentations of target lesions were provided on TCIA.
2.2. Radiomic Features Extraction
Before feature extraction, we matched the regions of interest (ROIs) on the non-contrast, arterial, and late phase scans. RFs were extracted from these ROIs using Pyradiomics Toolbox (version 3.0.1, https://pyradiomics.readthedocs.io/en/latest/, last accessed on 16 October 2022). The majority of Pyradiomics RFs are defined based on theImaging Biomarkers Standardization Initiative (IBSI) guidelines [44]. A binwidth of 25 Hounsfield Units (HUs) was defined to bin the image intensities to lessen the degree of noise and the sizes of the texture matrices used for calculating the RFs, as well as the computation power needed. The original images were used for feature extraction. A description of RFs calculated using Pyradiomics can be found at (https://pyradiomics.readthedocs.io/en/latest/features.html, last accessed on 16 October 2022).
2.3. ComBat Harmonization
ComBat method is a statistical harmonization tool that employs empirical Bayesian models to approximate the variations in RF values attributed to the variations in batches ofgiven data. For a given RF, ComBat assumes that the equation can approximate its value:
α represents the average RF value for the ROI j on batch i; X depicts a design matrix of the biologic covariates; β is the vector of regression coefficients of the biologic covariate; γi is the additive impact of batch i on the given RF, δi is the multiplicative scanner impact, and εij represents a normally distributed with zero mean error term. Following the calculation of the ComBat coefficients, the harmonized RF value is obtained by the formula:
where and equal the impacts calculated in Formula (1) for α and β, respectively; and γi* and δi* qual the empirical Bayes estimates for the additive and multiplicative batch impacts γi and δi, respectively.
Yij = α + β Xij + γi + δiεij
2.4. Statistical Analyses
Statistical analyses were performed using R language [45] on RStudio (V 3.6.3) [46]. To assess the impacts of the variation in the contrast enhancement phase of the CECT scans on the values of renal lesions’ RFs, the concordance correlation coefficient (CCC) was used [47]. The CCC is a measurement of agreement in the value and rank of paired readings, with a CCC > 0.90 considered a good agreement. Pairwise CCC values were calculated across the three phases, resulting in 3 different scenarios. Reproducible RFs were defined as the RFs with CCC > 0.9 in a given scenario.
To assess the ability of ComBat to remove batch effects attributed to the variation in the CECT phase, shape and RFs with (near) zero variance were removed. The batch defined for ComBat harmonization formula was the phase of the CECT scans. ComBat has also been performed in a pairwise manner. RFs with CCC values higher than 0.90 were considered reproducible following ComBat harmonization. The statistical significance of the difference in the number of reproducible RFs before and after ComBat harmonization was assessed using McNemar’s test [48]. p-values below 0.05 were considered significant.
To assess the difference in the ability of RFs to predict overall survival in RCC patients based on the CECT phase used to extract the RFs, patients who were not followed up were removed. The remaining patients were split randomly into 80% training and 20% validation sets. RFs with high correlations, as defined per Spearman’s correlation (R > 0.85), were removed from the training RFs set [49]. Univariate feature selection was applied by modeling Cox regression models using each of the remaining uncorrelated RFs [50]. Cox regression is used to establish whether a set of variables, or in our case RFs, are predictive of a particular time event. RFs with a p-value < 0.05 were considered essential and were further input as the predictors in the final Cox regression model. If no RF was found to have a p-value < 0.05, the 3 RFs with the least p-values were selected to construct the final cox regression model. The final Cox regression model was then tested on the validation dataset. The concordance index (C-index) was used to assess the predictive performance of the final model on the validation dataset [51]. The C-index estimates how well a model differentiates between two survival distributions ranging from 0 to 1, with higher values indicating better predictivity. The process was repeated 1000 times to avoid obtaining a significant result by chance, and the performance per imaging phase was averaged over all the repeats. Kruskal–Wallis test was used to assess the difference in the distribution of the C-index values obtained on the 1000 repeats for each imaging phase [52].
3. Results
3.1. Patient Characteristics
The patients included (N = 69) had a median age of 61 years, 65 (94.2%) of the 69 patients had a malignant lesion, and 41 (59.4%) patients were male. The majority of investigated lesions were RCC, with different pathologic stages (Table 2).
3.2. Extracted RFs
From each of the available ROIs, 107 original RFs were extracted with the Pyradiomics toolbox. The number of RFs per the different groups were as follows: First order (n = 18), Gray Level Co-occurrence Matrix (GLCM; n = 24), Gray Level Run Length Matrix (GLRLM; n = 16), Gray Level Size Zone Matrix (GLSZM, n = 16), Gray Level Dependence Matrix (GLDM; n = 14), Neighbouring Gray Tone Difference Matrix (NGTDM, n = 5), and Shape (n = 14).
3.3. The Reproducibility of RFs across the CECT Phases
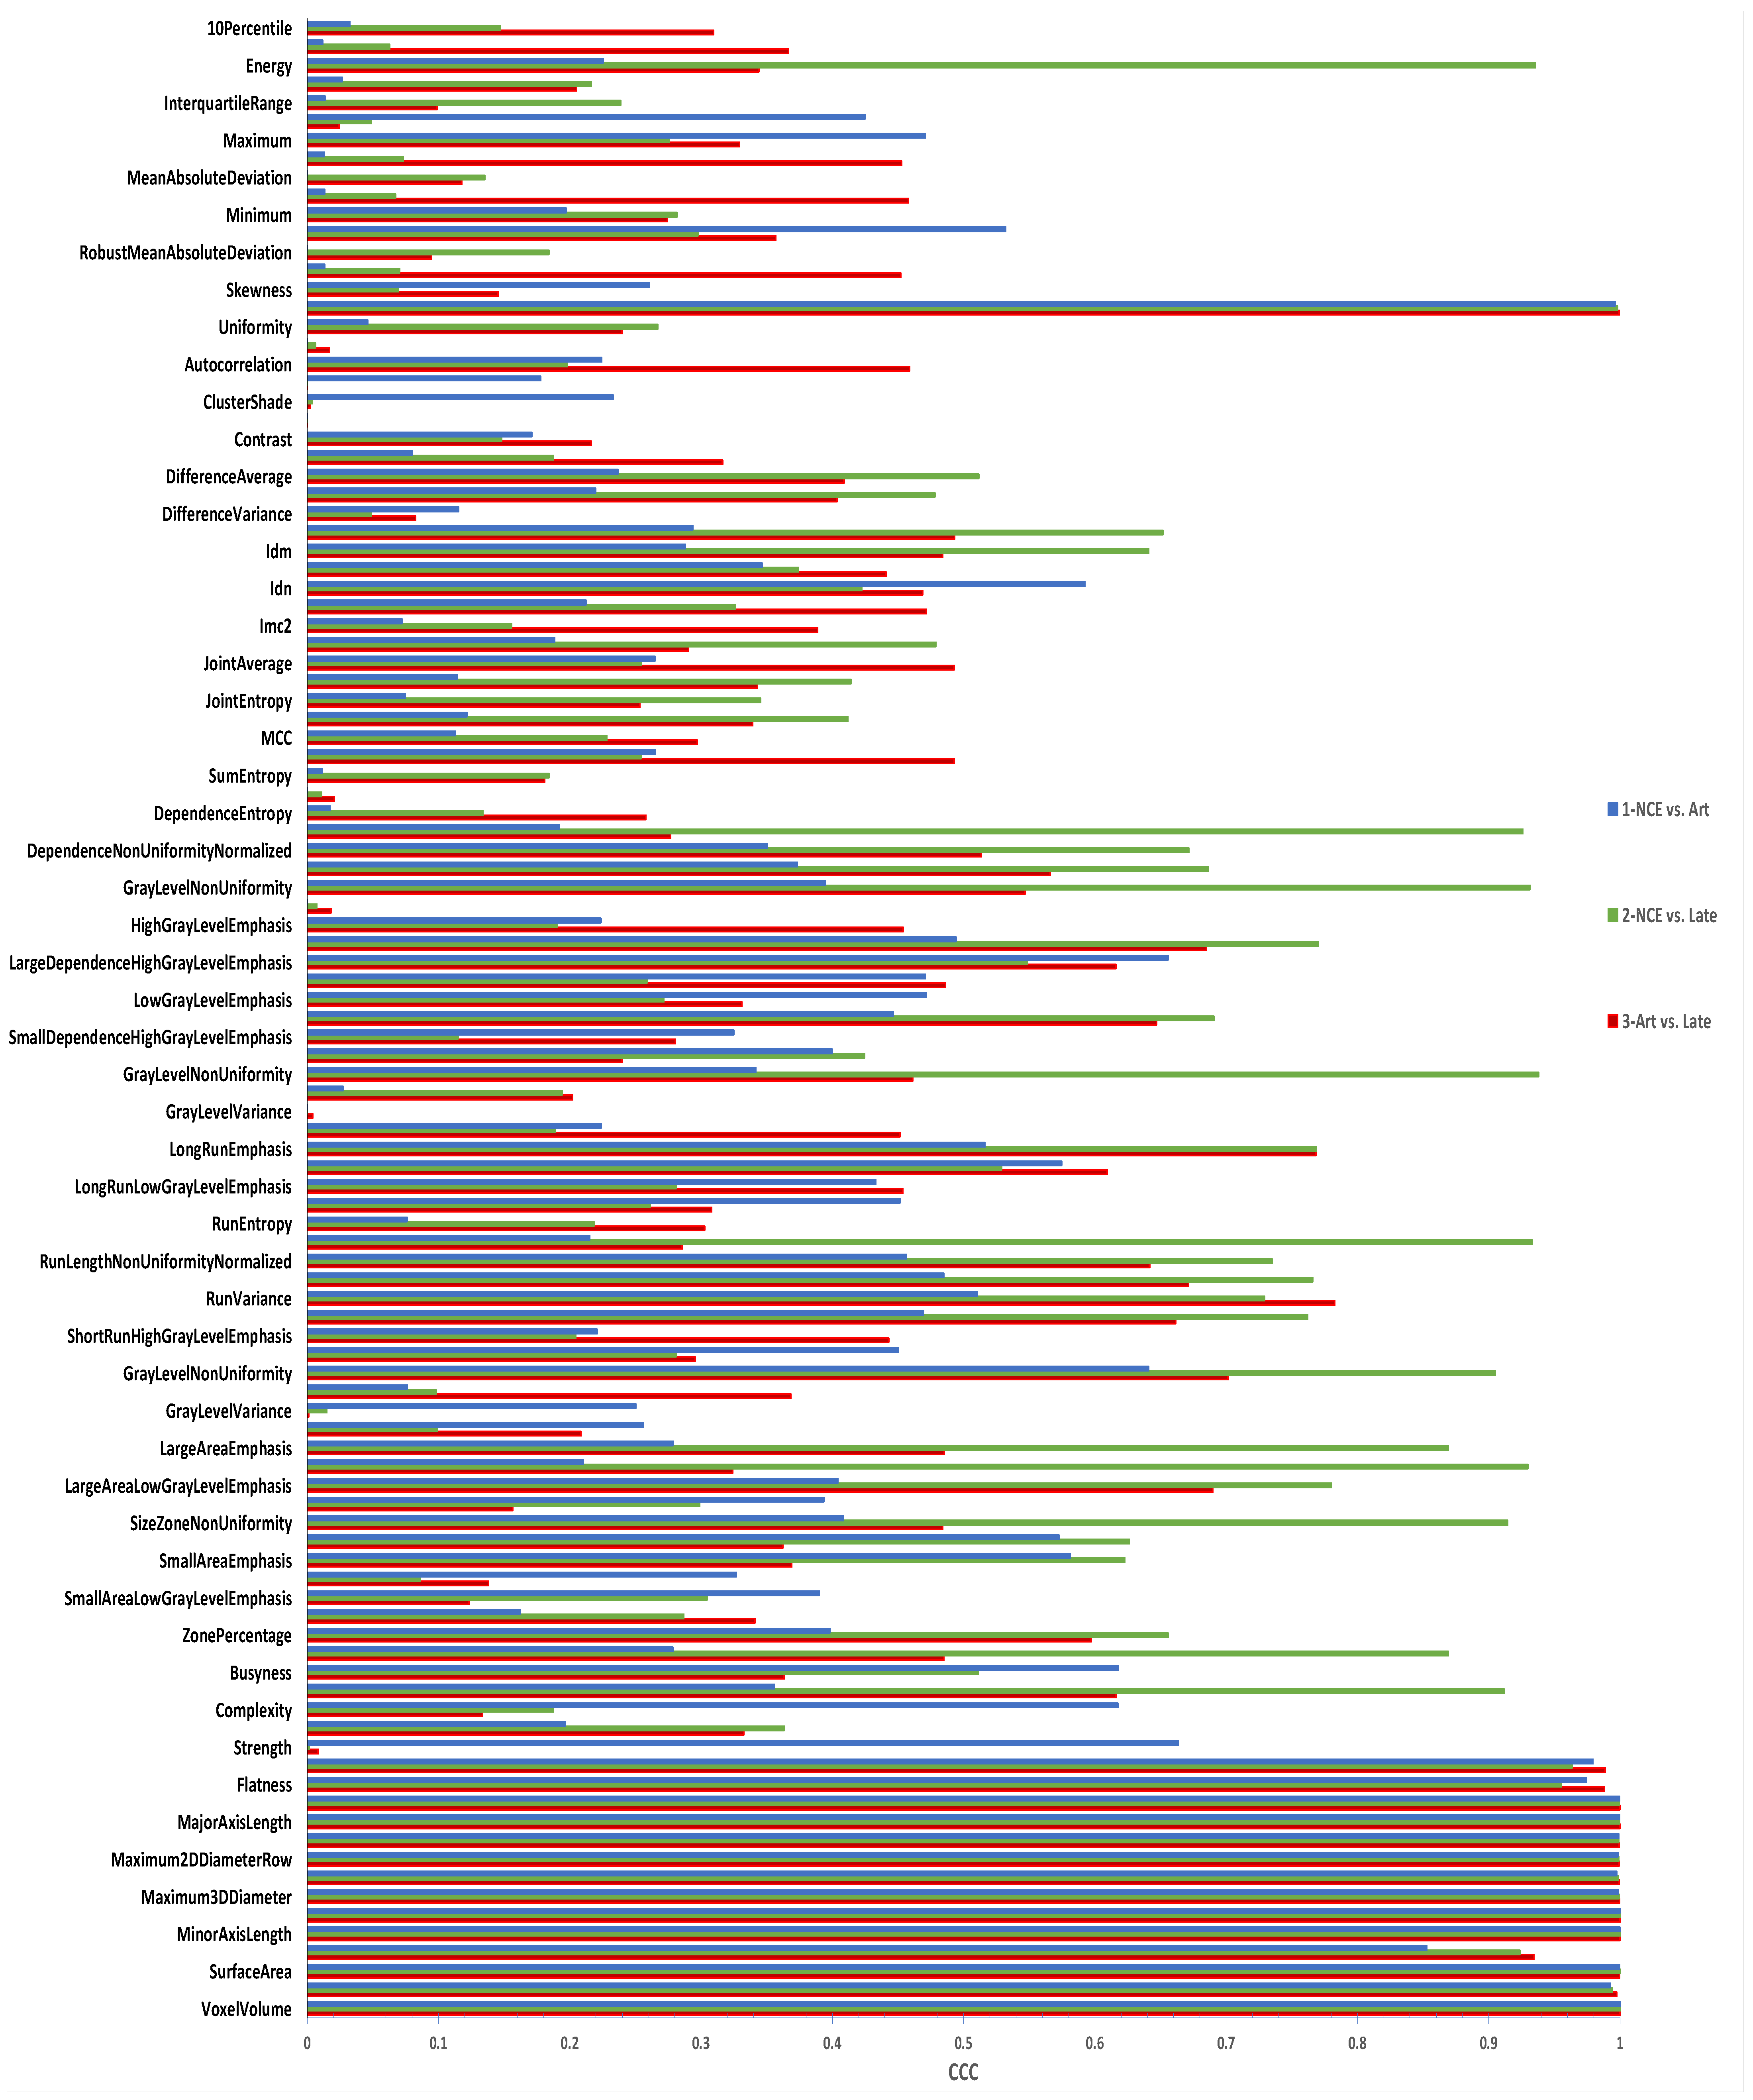
The reproducibility of RFs was assessed pairwise. Of the 107 extracted RFs, 15 (14.0%) were reproducible across the non-contrast enhanced and arterial phases. These RFs included all the shape RFs (n = 14) and a single first-order feature (total energy) (Figure 1). The CCC values for the remaining RFs ranged between −0.03 and 0.85, with a median of 0.26.
Across the non-contrast enhanced and late phase scans, 24 (22.4%) RFs were reproducible. In this scenario, all shape, two first order (total energy and energy), 2 GLDM (gray level non-uniformity and dependence non-uniformity), 2 GLRLM (gray level non-uniformity and run length non-uniformity), 3 GLSZM (gray level non-uniformity, size zone non-uniformity, and large area high gray level emphasis), and 1 NGTDM (Coarseness) features were found to be reproducible. The rest of the RFs had CCC values within the range of 0.0–0.87, with a median of 0.26.
Lastly, 15 (14.0%) RFs were found to be reproducible across the arterial and late phase scans. Again, all the shape and one first order (total energy) RFs had CCC values of more than 0.90. The remaining RFs had CCC values ranging between 0.0 and 0.78, with a median of 0.34.
3.4. ComBat Harmonization Using the CECT Phase
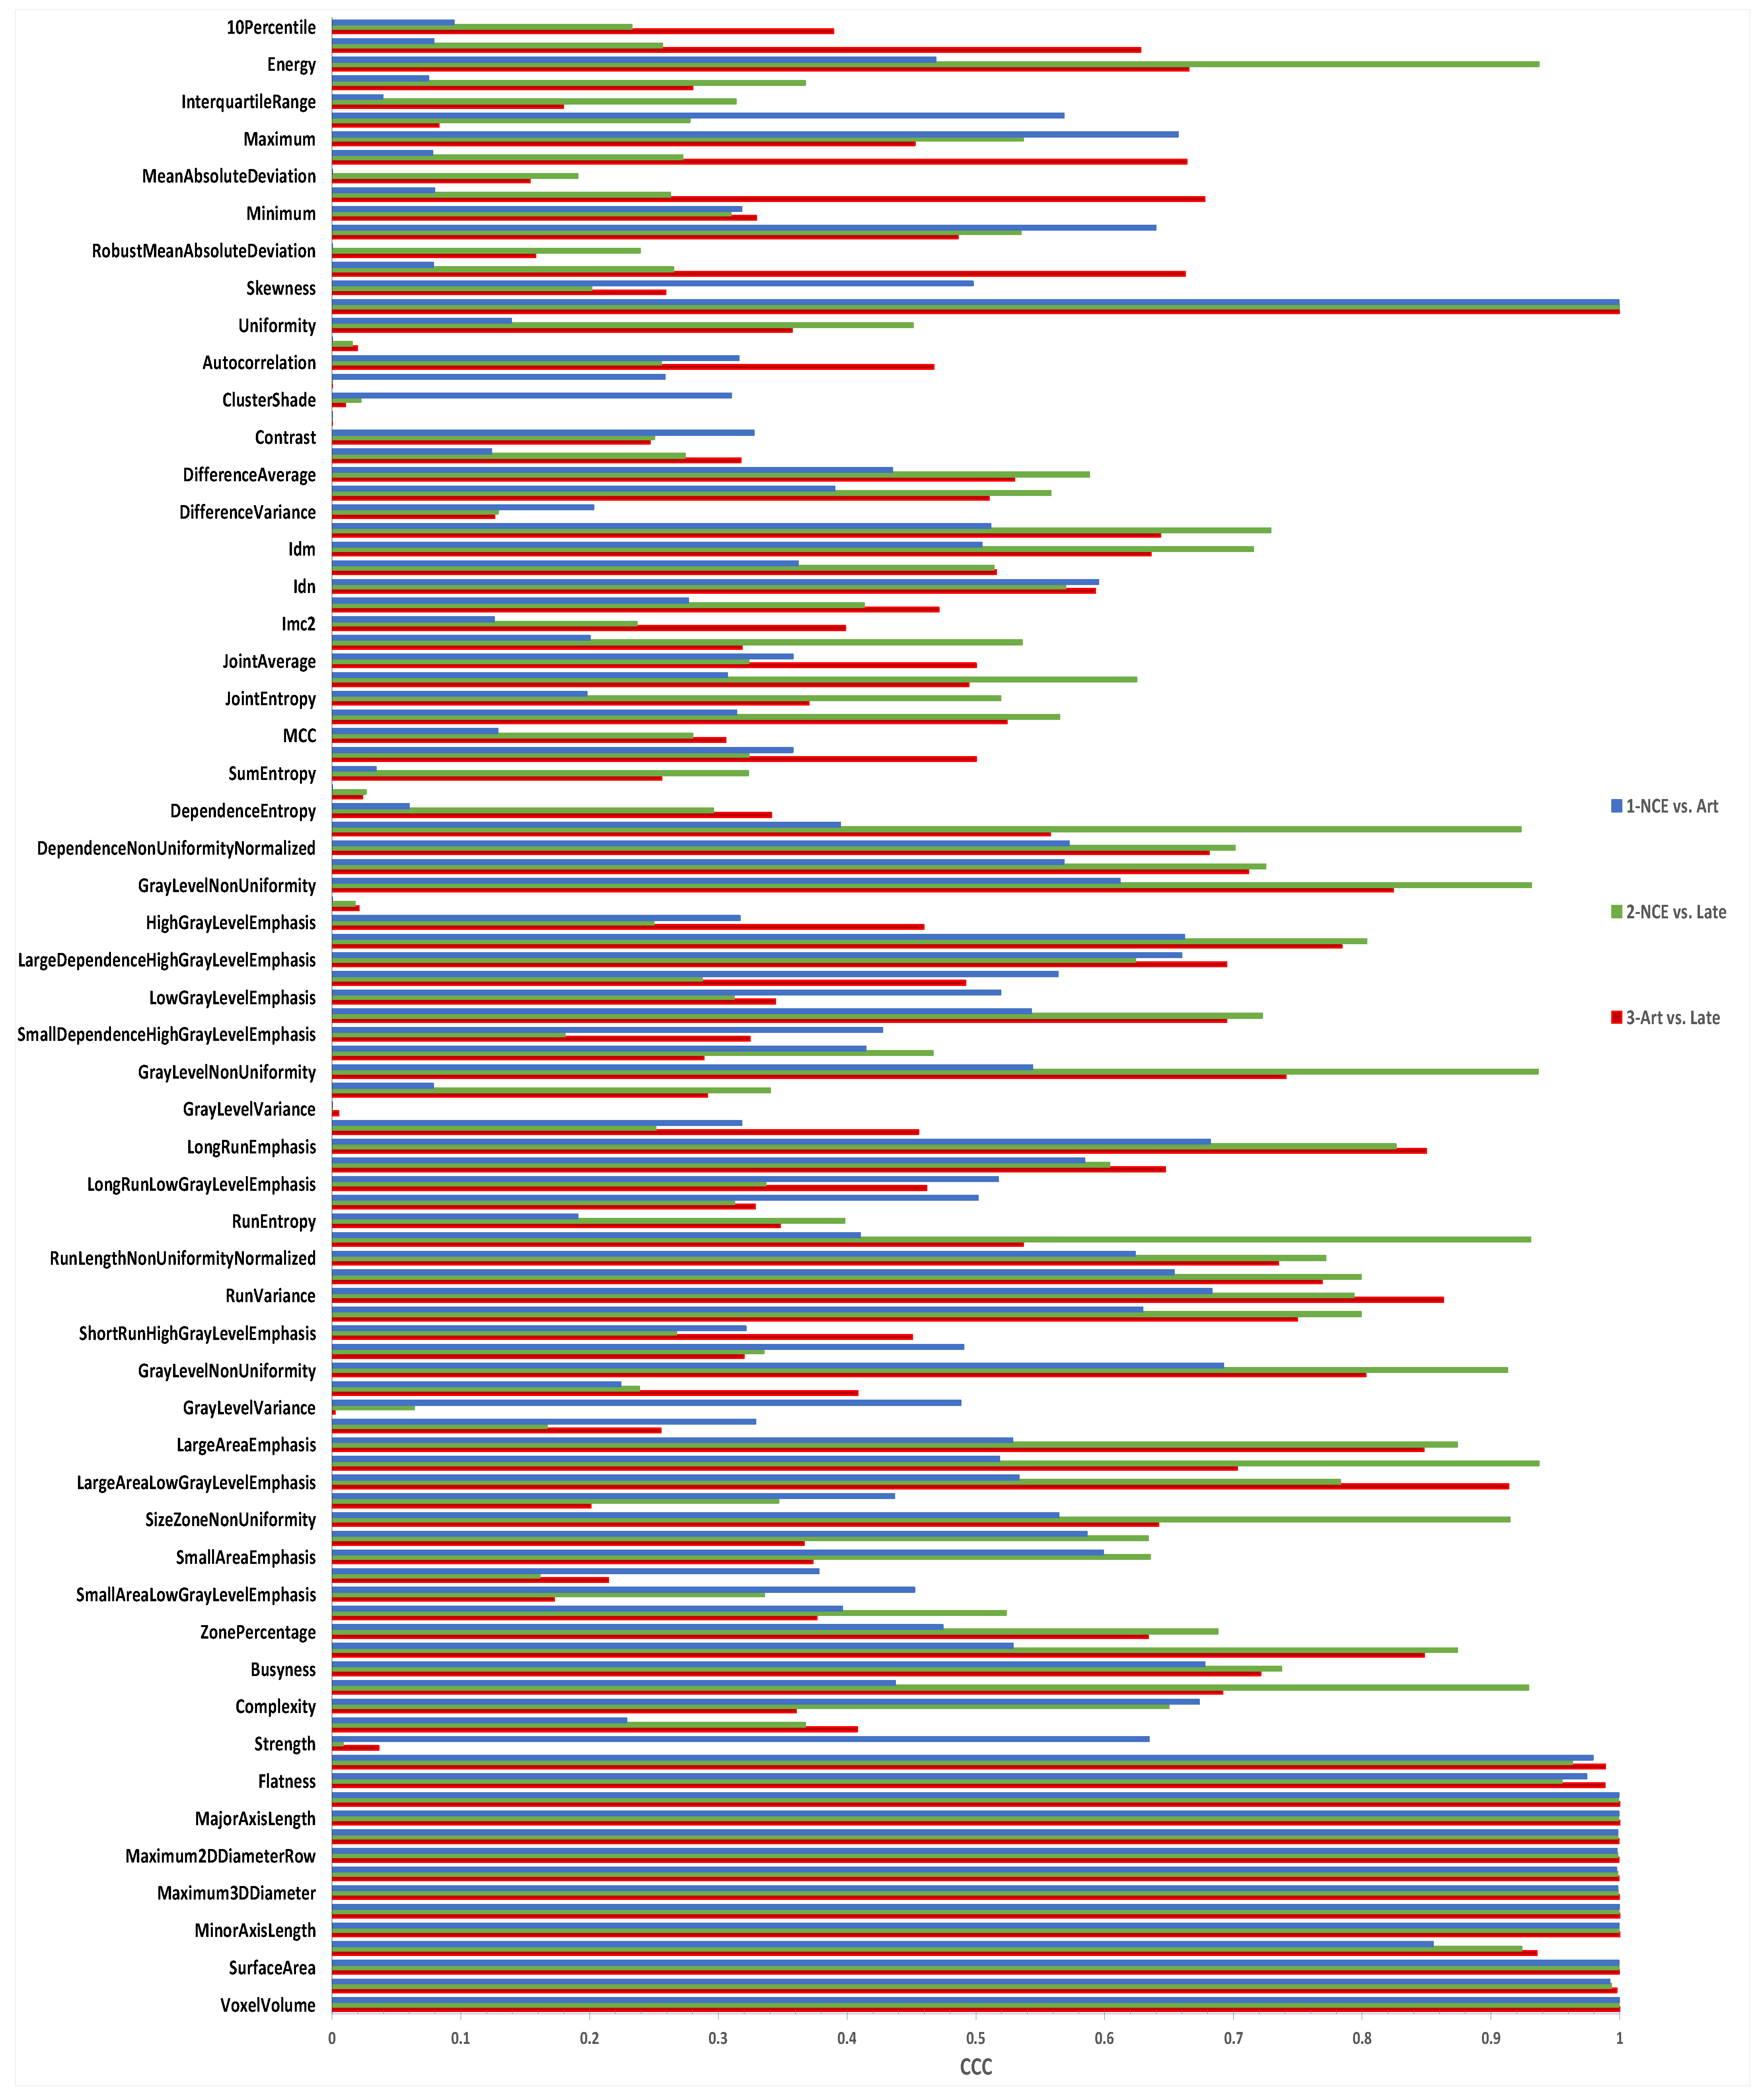
When the batches used for Combat harmonization were “non-contrast” and “arterial”, the number of reproducible RFs remained at 14 (13.1%), which was not significantly different (p-value = 1.0) (Figure 2).
When the batches for ComBat formula were “non-contrast” and “late” phases, the same number of RFs had CCC > 0.90 (24 (22.4%); p-value = 1.0). Similarly, the number of RFs with CCC > 0.90 across the “arterial” and “late” phases increased by a single RF, which was not statistically significant (from 15 (14%) to 16 (15%); p-value = 1.0).
3.5. The Predictivity of Different CECT Phases-Based RFs
For this experiment, 56 patients who were followed up were used in the analysis, as described in Section 3.1. RFs extracted from each imaging phase were used to predict overall survival in these patients a thousand times independently.
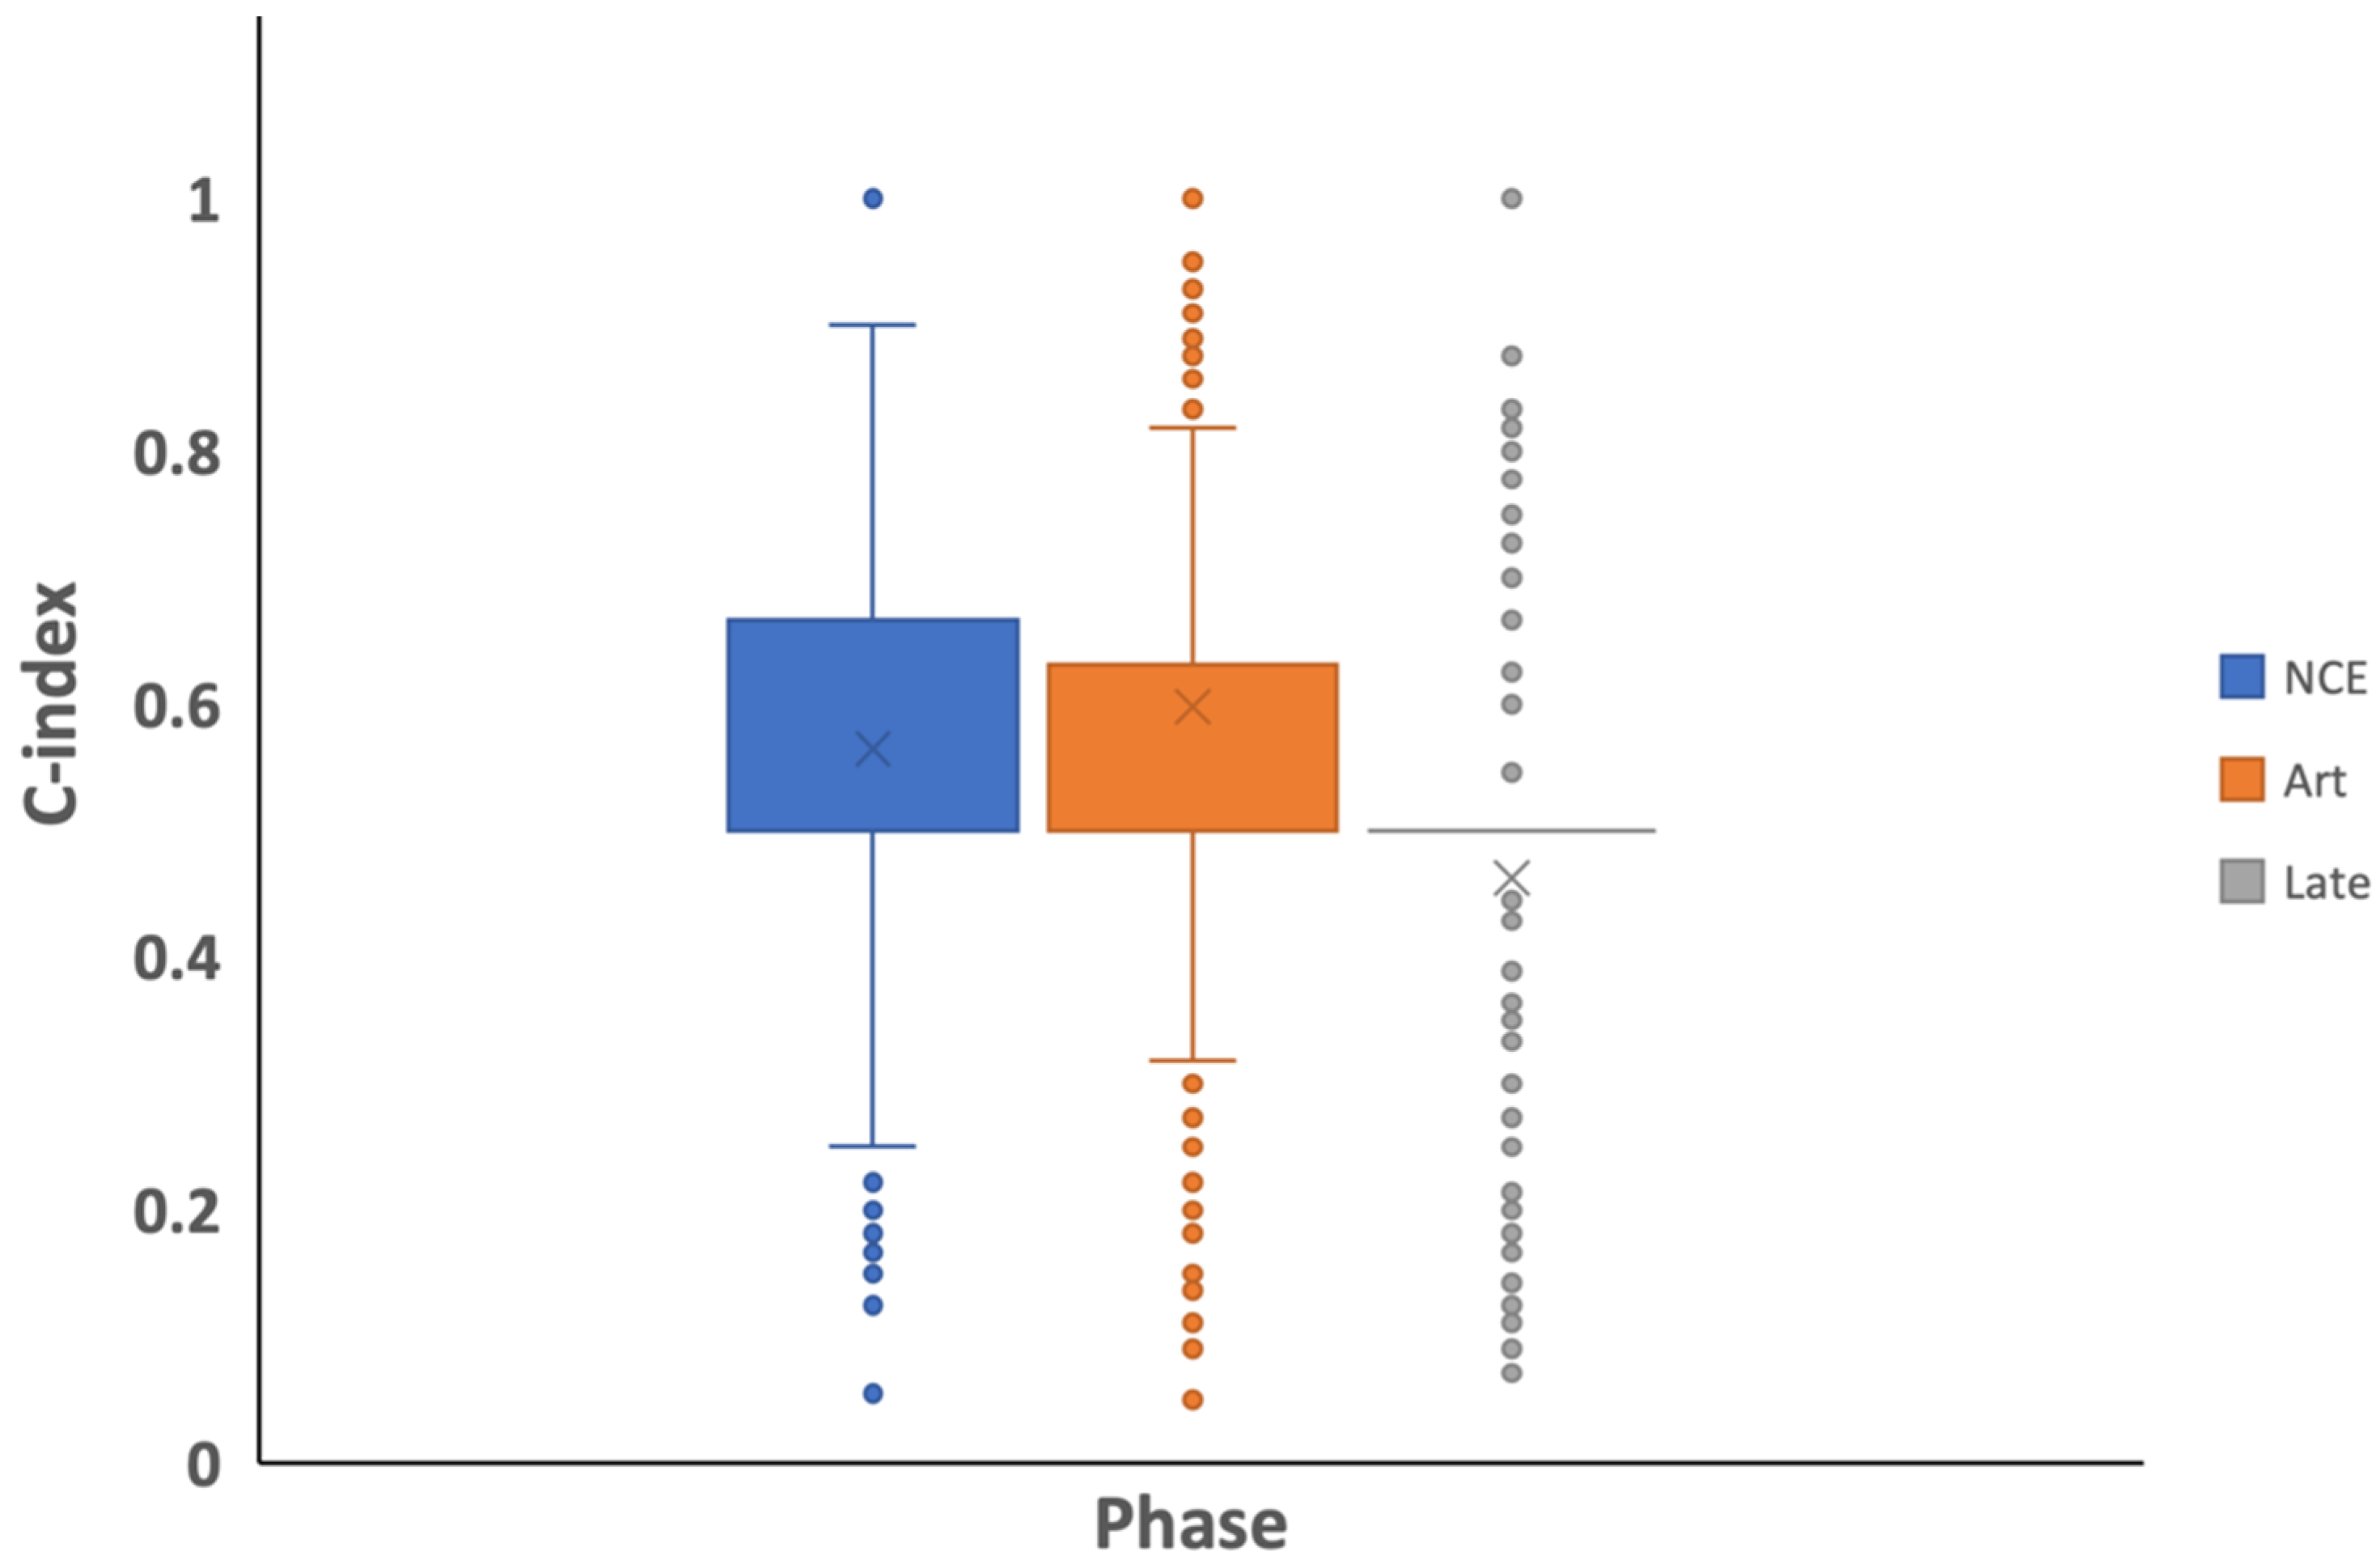
Over the 1000 repeats, a different number of successful repetitions were achieved for each imaging phase. The C-index values ranged between (0.08–1.00), (0.05–1.00), and (0.07–1.00) for the non-contrast, arterial and late scans RFs, respectively (Figure 3). On average, predictions based on RFs extracted from the arterial phase scans (average C-index of 0.59) and the non-contrast enhanced phase (average C-index of 0.56) were found to be significantly higher than those obtained using the late phase (average C-index of 0.47), with p-values < 2 × 10⁻¹⁶. There was no significant difference in the distribution of the C-index values obtained based on RFs extracted from the non-contrast enhanced and arterial phases (p-value = 0.36).
4. Discussion
The experiments performed in this study were designed to investigate the reproducibility of renal lesions’ RFs across the different CECT phases when the remaining scanning parameters were kept similar. The experiments were further intended to examine the ability of ComBat harmonization method to remove the variations in renal lesions’ RF values across the different phases of CECT scans. Differences in the CECT phase used to extract the RFs affected their reproducibility significantly. Aside from the first order total energy and shape features, all RFs were significantly impacted between the arterial phase RFs and the non and late phase RFs. Since the same mask was used to extract the RFs from the different imaging phases, the shape features were used as a control, indicating that a single feature is independent of the shape of the ROI.
Nevertheless, some texture features (8, 7.5%) were found to be reproducible between the non-contrast enhanced phase and late phase RFs. These findings indicate that scans from different phases must be analyzed separately. Our results are in line with previous studies that investigated the reproducibility of RFs across different phases [19,20]. In addition, ComBat harmonization technique has not statistically significantly increased the agreement in the values of RFs across the CECT phases. A single (1%) RF was found to be reproducible following ComBat harmonization across the arterial and late phase scans compared to before harmonization. The number of reproducible RFs has not changed in the remaining investigated scenarios. These results also align with previous studies that reported on the use of ComBat harmonization in radiomics [16,17,18,19,41].
Despite having all the other imaging parameters fixed across the different phases, the variation in the imaging phase significantly impacted almost all of the RFs. This is expected because of the nature of the renal lesions, their enhancement characteristics, and the differential regional enhancement of the kidneys across the different imaging phases. Yet, in the comparison between the non-contrast enhanced and late phases, some texture RFs remained reproducible, which could also be attributed to the similarity in lesion enhancement across those phases (or the lack thereof). In contrast, a previous study investigating the reproducibility of hepatocellular carcinoma-based RFs between the arterial and portal venous CECT phases reported a slightly higher percentage of reproducible RFs [19]. The variations in the rate of RFs between the study and our results could be attributed to several factors: (i) The difference in the anatomic nature of the lesions investigated; (ii) The previous study analyzed arterial and portal venous scans, which are taken at shorter time intervals following contrast injection compared to the phases analyzed in this study; (iii) The differences in imaging parameters across the patients were less compared to our data. Similar to the HCC study, our results signify the need for careful curation of the imaging datasets before performing radiomics analyses. Most publicly available datasets were collected retrospectively and included scans of different phases, as is the case with the data analyzed in this study. Careful curation of the imaging dataset is needed to ensure that RF values are meaningful and reproducible across the different imaging parameters to develop robust and generalizable radiomic signatures.
Some possibilities could justify the lack of statistically significant increments in the number of reproducible RFs across the CECT phases: (i) ComBat harmonization was designed for variables that were calculated in the same manner (gene arrays), in contrast to the RFs, which have different definitions and levels of complexity; (ii) ComBat harmonization assumes that the effect of the batch is the same on all of the RFs to be harmonized [36]. However, our results and previous studies showed that different RFs are variably influenced by the variation in the CECT phase used to extract the RFs, as could be seen from the range of CCC values obtained; (iii) The dataset includes scans collected with different hardware and settings, which could also confound the effects of imaging phase on the RFs and the calculations of ComBat estimates. The lack of significant improvement despite using ComBat harmonization was also previously reported [17,18,19]. Our results add to the current evidence on the limited reproducibility of RFs across different scanning settings and strengthen the call for harmonization tools designed explicitly for the RFs.
The other principal aim investigated in this study was to assess the impact of the imaging phase on the predictivity of RFs. For this aim, we investigated the ability to predict overall survival in RCC patients. Interestingly, there was no statistically significant difference between the non-contrast phase and arterial phase RF’s predictive performances, while both significantly outperformed the predictions based on the late phase RFs. Repeating the analysis one thousand times ensured that we achieved a distribution representing the actual predictive ability [41]. Performing the analysis a single time could show one of the extreme end performances and would not represent the actual predictive performance. It also allows the identification of robust RFs in a given dataset. Predictions based on different imaging phase RFs were not similar, which indicates the inability to substitute imaging phases within a single radiomics study. RFs extracted from the arterial phase seem to have the highest predictive ability of overall survival in RCC lesions.
While meticulous and comprehensive statistical methods were used in this study, several limitations remain. The number of available scans, especially for the survival analysis, was limited, which limits the generalizability of the findings. In addition, the patients were scanned in different medical centers using different imaging vendors and parameters, which could significantly affect the predictive performance of RFs. However, since the three phases for each patient were acquired using the same imaging parameters, the differences in the predictive performance across the different phases could be assumed robust. Future studies are recommended to include a more significant number of patients, with the addition of inter-scanner reproducibility analyses to assess the predictive ability of RFs in RCC patients accurately.
5. Conclusions
Most RFs were not found to be reproducible across the non-contrast, arterial and late venous imaging phases of CE-CT scans. Experiments that include retrospectively collected CE-CT datasets must ensure careful curation before performing radiomics analyses. RFs extracted from the arterial phase scans are the most predictive of overall survival in RCC patients. Radiomics-specific harmonization tools are required to advance the quantitative medical imaging analysis field.
Author Contributions
Conceptualization, H.A. and A.I.; methodology, H.A. and A.I.; software, H.A.; formal analysis, H.A.; data curation, H.A.; writing—original draft preparation, H.A.; writing—review and editing, A.I.; visualization, H.A.; supervision, A.I. All authors have read and agreed to the published version of the manuscript.
Funding
This research received no external funding.
Informed Consent Statement
Not applicable.
Data Availability Statement
The data are publicly available on TCIA.org: (https://wiki.cancerimagingarchive.net/pages/viewpage.action?pageId=61081171, accessed on 3 October 2022).
Conflicts of Interest
The authors declare no conflict of interest.
References
- Lambin, P.; Rios-Velazquez, E.; Leijenaar, R.; Carvalho, S.; van Stiphout, R.G.P.M.; Granton, P.; Zegers, C.M.L.; Gillies, R.; Boellard, R.; Dekker, A.; et al. Radiomics: Extracting More Information from Medical Images Using Advanced Feature Analysis. Eur. J. Cancer 2012, 48, 441–446. [Google Scholar] [CrossRef] [Green Version]
- Gillies, R.J.; Kinahan, P.E.; Hricak, H. Radiomics: Images Are More than Pictures, They Are Data. Radiology 2016, 278, 563–577. [Google Scholar] [CrossRef] [Green Version]
- Ma, X.; Deng, L.; Tian, R.; Guo, C. Novel Methods for Oncologic Imaging Analysis: Radiomics, Machine Learning, and Artificial Intelligence; Frontiers Media SA: Lausanne, Switzerland, 2021; ISBN 9782889713479. [Google Scholar]
- Al-Kadi, O.S.; Ye, X.; Russo, G.; Mitchell, J.R. Computational Radiomics for Cancer Characterization; Frontiers Media SA: Lausanne, Switzerland, 2022; ISBN 9782832503157. [Google Scholar]
- Mokrane, F.-Z.; Lu, L.; Vavasseur, A.; Otal, P.; Peron, J.-M.; Luk, L.; Yang, H.; Ammari, S.; Saenger, Y.; Rousseau, H.; et al. Radiomics Machine-Learning Signature for Diagnosis of Hepatocellular Carcinoma in Cirrhotic Patients with Indeterminate Liver Nodules. Eur. Radiol. 2020, 30, 558–570. [Google Scholar] [CrossRef]
- Feng, Z.; Zhang, L.; Qi, Z.; Shen, Q.; Hu, Z.; Chen, F. Identifying BAP1 Mutations in Clear-Cell Renal Cell Carcinoma by CT Radiomics: Preliminary Findings. Front. Oncol. 2020, 10, 279. [Google Scholar] [CrossRef]
- Amiri, S.; Akbarabadi, M.; Abdolali, F.; Nikoofar, A.; Esfahani, A.J.; Cheraghi, S. Radiomics Analysis on CT Images for Prediction of Radiation-Induced Kidney Damage by Machine Learning Models. Comput. Biol. Med. 2021, 133, 104409. [Google Scholar] [CrossRef]
- Granzier, R.W.Y.; Ibrahim, A.; Primakov, S.P.; Samiei, S.; van Nijnatten, T.J.A.; de Boer, M.; Heuts, E.M.; Hulsmans, F.-J.; Chatterjee, A.; Lambin, P.; et al. MRI-Based Radiomics Analysis for the Pretreatment Prediction of Pathologic Complete Tumor Response to Neoadjuvant Systemic Therapy in Breast Cancer Patients: A Multicenter Study. Cancers 2021, 13, 2447. [Google Scholar] [CrossRef]
- Li, Q.; Bai, H.; Chen, Y.; Sun, Q.; Liu, L.; Zhou, S.; Wang, G.; Liang, C.; Li, Z.-C. A Fully-Automatic Multiparametric Radiomics Model: Towards Reproducible and Prognostic Imaging Signature for Prediction of Overall Survival in Glioblastoma Multiforme. Sci. Rep. 2017, 7, 14331. [Google Scholar] [CrossRef] [Green Version]
- de Leon, A.D.; Kapur, P.; Pedrosa, I. Radiomics in Kidney Cancer: MR Imaging. Magn. Reson. Imaging Clin. N. Am. 2019, 27, 1–13. [Google Scholar] [CrossRef]
- Samiei, S.; Granzier, R.W.Y.; Ibrahim, A.; Primakov, S.; Lobbes, M.B.I.; Beets-Tan, R.G.H.; van Nijnatten, T.J.A.; Engelen, S.M.E.; Woodruff, H.C.; Smidt, M.L. Dedicated Axillary MRI-Based Radiomics Analysis for the Prediction of Axillary Lymph Node Metastasis in Breast Cancer. Cancers 2021, 13, 757. [Google Scholar] [CrossRef]
- Lucia, F.; Visvikis, D.; Vallières, M.; Desseroit, M.-C.; Miranda, O.; Robin, P.; Bonaffini, P.A.; Alfieri, J.; Masson, I.; Mervoyer, A.; et al. External Validation of a Combined PET and MRI Radiomics Model for Prediction of Recurrence in Cervical Cancer Patients Treated with Chemoradiotherapy. Eur. J. Nucl. Med. Mol. Imaging 2019, 46, 864–877. [Google Scholar] [CrossRef]
- Chicklore, S.; Goh, V.; Siddique, M.; Roy, A.; Marsden, P.K.; Cook, G.J.R. Quantifying Tumour Heterogeneity in 18F-FDG PET/CT Imaging by Texture Analysis. Eur. J. Nucl. Med. Mol. Imaging 2013, 40, 133–140. [Google Scholar] [CrossRef]
- Benfante, V.; Stefano, A.; Comelli, A.; Giaccone, P.; Cammarata, F.P.; Richiusa, S.; Scopelliti, F.; Pometti, M.; Ficarra, M.; Cosentino, S.; et al. A New Preclinical Decision Support System Based on PET Radiomics: A Preliminary Study on the Evaluation of an Innovative 64Cu-Labeled Chelator in Mouse Models. J. Imaging Sci. Technol. 2022, 8, 92. [Google Scholar] [CrossRef]
- Holland, R.L. What Makes a Good Biomarker? Adv. Precis. Med. 2016, 1, 66. [Google Scholar] [CrossRef]
- Ibrahim, A.; Refaee, T.; Leijenaar, R.T.H.; Primakov, S.; Hustinx, R.; Mottaghy, F.M.; Woodruff, H.C.; Maidment, A.D.A.; Lambin, P. The Application of a Workflow Integrating the Variable Reproducibility and Harmonizability of Radiomic Features on a Phantom Dataset. PLoS ONE 2021, 16, e0251147. [Google Scholar] [CrossRef]
- Ibrahim, A.; Refaee, T.; Primakov, S.; Barufaldi, B.; Acciavatti, R.J.; Granzier, R.W.Y.; Hustinx, R.; Mottaghy, F.M.; Woodruff, H.C.; Wildberger, J.E.; et al. The Effects of in-Plane Spatial Resolution on CT-Based Radiomic Features’ Stability with and without ComBat Harmonization. Cancers 2021, 13, 1848. [Google Scholar] [CrossRef]
- Refaee, T.; Salahuddin, Z.; Widaatalla, Y.; Primakov, S.; Woodruff, H.C.; Hustinx, R.; Mottaghy, F.M.; Ibrahim, A.; Lambin, P. CT Reconstruction Kernels and the Effect of Pre- and Post-Processing on the Reproducibility of Handcrafted Radiomic Features. J. Pers. Med. 2022, 12, 553. [Google Scholar] [CrossRef]
- Ibrahim, A.; Widaatalla, Y.; Refaee, T.; Primakov, S.; Miclea, R.L.; Öcal, O.; Fabritius, M.P.; Ingrisch, M.; Ricke, J.; Hustinx, R.; et al. Reproducibility of CT-Based Hepatocellular Carcinoma Radiomic Features across Different Contrast Imaging Phases: A Proof of Concept on SORAMIC Trial Data. Cancers 2021, 13, 4638. [Google Scholar] [CrossRef]
- Midya, A.; Chakraborty, J.; Gönen, M.; Do, R.K.G.; Simpson, A.L. Influence of CT Acquisition and Reconstruction Parameters on Radiomic Feature Reproducibility. J. Med. Imaging 2018, 5, 011020. [Google Scholar] [CrossRef]
- Baeßler, B.; Weiss, K.; Pinto Dos Santos, D. Robustness and Reproducibility of Radiomics in Magnetic Resonance Imaging: A Phantom Study. Investig. Radiol. 2019, 54, 221–228. [Google Scholar] [CrossRef]
- Peng, X.; Yang, S.; Zhou, L.; Mei, Y.; Shi, L.; Zhang, R.; Shan, F.; Liu, L. Repeatability and Reproducibility of Computed Tomography Radiomics for Pulmonary Nodules: A Multicenter Phantom Study. Investig. Radiol. 2022, 57, 242–253. [Google Scholar] [CrossRef]
- Li, Y.; Reyhan, M.; Zhang, Y.; Wang, X.; Zhou, J.; Zhang, Y.; Yue, N.J.; Nie, K. The Impact of Phantom Design and Material-dependence on Repeatability and Reproducibility of CT-based Radiomics Features. Med. Phys. 2022, 49, 1648–1659. [Google Scholar] [CrossRef]
- Granzier, R.W.Y.; Verbakel, N.M.H.; Ibrahim, A.; van Timmeren, J.E.; van Nijnatten, T.J.A.; Leijenaar, R.T.H.; Lobbes, M.B.I.; Smidt, M.L.; Woodruff, H.C. MRI-Based Radiomics in Breast Cancer: Feature Robustness with Respect to Inter-Observer Segmentation Variability. Sci. Rep. 2020, 10, 14163. [Google Scholar] [CrossRef]
- Traverso, A.; Kazmierski, M.; Shi, Z.; Kalendralis, P.; Welch, M.; Nissen, H.D.; Jaffray, D.; Dekker, A.; Wee, L. Stability of Radiomic Features of Apparent Diffusion Coefficient (ADC) Maps for Locally Advanced Rectal Cancer in Response to Image Pre-Processing. Phys. Med. 2019, 61, 44–51. [Google Scholar] [CrossRef] [Green Version]
- Pavic, M.; Bogowicz, M.; Würms, X.; Glatz, S.; Finazzi, T.; Riesterer, O.; Roesch, J.; Rudofsky, L.; Friess, M.; Veit-Haibach, P.; et al. Influence of Inter-Observer Delineation Variability on Radiomics Stability in Different Tumor Sites. Acta Oncol. 2018, 57, 1070–1074. [Google Scholar] [CrossRef] [Green Version]
- Wong, J.; Baine, M.; Wisnoskie, S.; Bennion, N.; Zheng, D.; Yu, L.; Dalal, V.; Hollingsworth, M.A.; Lin, C.; Zheng, D. Effects of Interobserver and Interdisciplinary Segmentation Variabilities on CT-Based Radiomics for Pancreatic Cancer. Sci. Rep. 2021, 11, 16328. [Google Scholar] [CrossRef]
- Sung, H.; Ferlay, J.; Siegel, R.L.; Laversanne, M.; Soerjomataram, I.; Jemal, A.; Bray, F. Global Cancer Statistics 2020: GLOBOCAN Estimates of Incidence and Mortality Worldwide for 36 Cancers in 185 Countries. CA Cancer J. Clin. 2021, 71, 209–249. [Google Scholar] [CrossRef]
- Pantuck, A.J.; Zisman, A.; Rauch, M.K.; Belldegrun, A. Incidental Renal Tumors. Urology 2000, 56, 190–196. [Google Scholar] [CrossRef]
- Vasudev, N.S.; Wilson, M.; Stewart, G.D.; Adeyoju, A.; Cartledge, J.; Kimuli, M.; Datta, S.; Hanbury, D.; Hrouda, D.; Oades, G.; et al. Challenges of Early Renal Cancer Detection: Symptom Patterns and Incidental Diagnosis Rate in a Multicentre Prospective UK Cohort of Patients Presenting with Suspected Renal Cancer. BMJ Open 2020, 10, e035938. [Google Scholar] [CrossRef]
- Said, D.; Hectors, S.J.; Wilck, E.; Rosen, A.; Stocker, D.; Bane, O.; Beksaç, A.T.; Lewis, S.; Badani, K.; Taouli, B. Characterization of Solid Renal Neoplasms Using MRI-Based Quantitative Radiomics Features. Abdom. Radiol. 2020, 45, 2840–2850. [Google Scholar] [CrossRef]
- Massa’a, R.N.; Stoeckl, E.M.; Lubner, M.G.; Smith, D.; Mao, L.; Shapiro, D.D.; Abel, E.J.; Wentland, A.L. Differentiation of Benign from Malignant Solid Renal Lesions with MRI-Based Radiomics and Machine Learning. Abdom. Radiol. 2022, 47, 2896–2904. [Google Scholar] [CrossRef]
- Lu, L.; Ahmed, F.S.; Akin, O.; Luk, L.; Guo, X.; Yang, H.; Yoon, J.; Hakimi, A.A.; Schwartz, L.H.; Zhao, B. Uncontrolled Confounders May Lead to False or Overvalued Radiomics Signature: A Proof of Concept Using Survival Analysis in a Multicenter Cohort of Kidney Cancer. Front. Oncol. 2021, 11, 638185. [Google Scholar] [CrossRef]
- Khodabakhshi, Z.; Amini, M.; Mostafaei, S.; Haddadi Avval, A.; Nazari, M.; Oveisi, M.; Shiri, I.; Zaidi, H. Overall Survival Prediction in Renal Cell Carcinoma Patients Using Computed Tomography Radiomic and Clinical Information. J. Digit. Imaging 2021, 34, 1086–1098. [Google Scholar] [CrossRef]
- Han, D.; Yu, N.; Yu, Y.; He, T.; Duan, X. Performance of CT Radiomics in Predicting the Overall Survival of Patients with Stage III Clear Cell Renal Carcinoma after Radical Nephrectomy. Radiol. Med. 2022, 127, 837–847. [Google Scholar] [CrossRef]
- Johnson, W.E.; Li, C.; Rabinovic, A. Adjusting Batch Effects in Microarray Expression Data Using Empirical Bayes Methods. Biostatistics 2007, 8, 118–127. [Google Scholar] [CrossRef]
- Fortin, J.-P.; Parker, D.; Tunç, B.; Watanabe, T.; Elliott, M.A.; Ruparel, K.; Roalf, D.R.; Satterthwaite, T.D.; Gur, R.C.; Gur, R.E.; et al. Harmonization of Multi-Site Diffusion Tensor Imaging Data. Neuroimage 2017, 161, 149–170. [Google Scholar] [CrossRef]
- Fortin, J.-P.; Cullen, N.; Sheline, Y.I.; Taylor, W.D.; Aselcioglu, I.; Cook, P.A.; Adams, P.; Cooper, C.; Fava, M.; McGrath, P.J.; et al. Harmonization of Cortical Thickness Measurements across Scanners and Sites. Neuroimage 2018, 167, 104–120. [Google Scholar] [CrossRef]
- Da-Ano, R.; Masson, I.; Lucia, F.; Doré, M.; Robin, P.; Alfieri, J.; Rousseau, C.; Mervoyer, A.; Reinhold, C.; Castelli, J.; et al. Performance Comparison of Modified ComBat for Harmonization of Radiomic Features for Multicenter Studies. Sci. Rep. 2020, 10, 10248. [Google Scholar] [CrossRef]
- Ligero, M.; Jordi-Ollero, O.; Bernatowicz, K.; Garcia-Ruiz, A.; Delgado-Muñoz, E.; Leiva, D.; Mast, R.; Suarez, C.; Sala-Llonch, R.; Calvo, N.; et al. Minimizing Acquisition-Related Radiomics Variability by Image Resampling and Batch Effect Correction to Allow for Large-Scale Data Analysis. Eur. Radiol. 2021, 31, 1460–1470. [Google Scholar] [CrossRef]
- Ibrahim, A.; Lu, L.; Yang, H.; Akin, O.; Schwartz, L.H.; Zhao, B. The Impact of Image Acquisition Parameters and ComBat Harmonization on the Predictive Performance of Radiomics: A Renal Cell Carcinoma Model. NATO Adv. Sci. Inst. Ser. E Appl. Sci. 2022, 12, 9824. [Google Scholar] [CrossRef]
- Heller, N.; Sathianathen, N.; Kalapara, A.; Walczak, E.; Moore, K.; Kaluzniak, H.; Rosenberg, J.; Blake, P.; Rengel, Z.; Oestreich, M.; et al. C4KC KiTS Challenge Kidney Tumor Segmentation Dataset 2019. Available online: https://wiki.cancerimagingarchive.net/pages/viewpage.action?pageId=61081171 (accessed on 2 October 2022).
- Clark, K.; Vendt, B.; Smith, K.; Freymann, J.; Kirby, J.; Koppel, P.; Moore, S.; Phillips, S.; Maffitt, D.; Pringle, M.; et al. The Cancer Imaging Archive (TCIA): Maintaining and Operating a Public Information Repository. J. Digit. Imaging 2013, 26, 1045–1057. [Google Scholar] [CrossRef]
- Zwanenburg, A.; Vallières, M.; Abdalah, M.A.; Aerts, H.J.W.L.; Andrearczyk, V.; Apte, A.; Ashrafinia, S.; Bakas, S.; Beukinga, R.J.; Boellaard, R.; et al. The Image Biomarker Standardization Initiative: Standardized Quantitative Radiomics for High-Throughput Image-Based Phenotyping. Radiology 2020, 295, 328–338. [Google Scholar] [CrossRef] [PubMed] [Green Version]
- Team, R.C. R Language Definition; R Foundation for Statistical Computing: Vienna, Austria, 2000. [Google Scholar]
- Gandrud, C. Reproducible Research with R and R Studio; CRC Press: Boca Raton, FL, USA, 2013; ISBN 9781466572843. [Google Scholar]
- Lin, L.I. A Concordance Correlation Coefficient to Evaluate Reproducibility. Biometrics 1989, 45, 255–268. [Google Scholar] [CrossRef] [PubMed]
- Daya, S. Paired Comparisons in Contingency Tables–the McNemar Chi-Square Test. Evid.-Based Obstet. Gynecol. 2002, 4, 56–57. [Google Scholar] [CrossRef]
- Zar, J.H. Spearman Rank Correlation. In Encyclopedia of Biostatistics; John Wiley & Sons, Ltd.: Hoboken, NJ, USA, 2005. [Google Scholar]
- Smith, L. Cox Regression Model; Louisiana State University: Baton Rouge, LA, USA, 2004. [Google Scholar]
- Harrell, F.E., Jr.; Lee, K.L.; Mark, D.B. Multivariable Prognostic Models: Issues in Developing Models, Evaluating Assumptions and Adequacy, and Measuring and Reducing Errors. Stat. Med. 1996, 15, 361–387. [Google Scholar] [CrossRef]
- McKight, P.E.; Najab, J. Kruskal-Wallis Test. In The Corsini Encyclopedia of Psychology; John Wiley & Sons, Ltd.: Hoboken, NJ, USA, 2010. [Google Scholar]
Figure 1.
CCC values for RFs across the different imaging phases before harmonization.

Figure 2.
CCC values for RFs across the different imaging phases after ComBat harmonization.

Figure 3.
Boxplot comparison of the C-indices across the imaging phases.


Table 1.
Imaging hardware and parameters of the data included.
| Vendor | Number of Scans | Convolution Kernels | Slice Thickness (mm) | Pixel Spacing (mm2) |
|---|---|---|---|---|
| GE | 12 | Standard | 1.25–5.0 | 0.69 × 0.69–0.86 × 0.86 |
| Philips | 2 | B | 3, 4 | 0.68 × 0.68–0.97 × 0.97 |
| Siemens | 54 | B20f, B30f, B30s, B31f, B31s, B41f, I26f, I30f, I40f, I41f, I44f | 1–7 | 0.55 × 0.55–0.98 × 0.98 |
| Toshiba | 1 | FC18 | 2 | 0.74 × 0.74 |
Table 2.
Patient characteristics.
| Characteristic | N = 69 |
|---|---|
| Gender, male (%) | 41 (59.4%) |
| Age (years), median (range) | 61 (27–90) |
| Malignancy, yes (%) | 65 (94.2%) |
| Pathology | |
| Oncocytoma (benign) | 3 (4.3%) |
| Angiomyolipoma (benign) | 1 (1.4%) |
| Renal cell carcinoma | 65 (94.2%) |
| Median survival time (months) (interquartile ranges) | 32.3 (18.8, 47.3) |
| Censored patients (Total N = 56) (%) | 52 (92.9%) |
Publisher’s Note: MDPI stays neutral with regard to jurisdictional claims in published maps and institutional affiliations. |
© 2022 by the authors. Licensee MDPI, Basel, Switzerland. This article is an open access article distributed under the terms and conditions of the Creative Commons Attribution (CC BY) license (https://creativecommons.org/licenses/by/4.0/).
Share and Cite
MDPI and ACS Style
Alkhafaji, H.; Ibrahim, A. Effects of Contrast Enhancement Phase on the Reproducibility and Predictivity of CT-Based Renal Lesions Radiomic Features. Appl. Sci. 2022, 12, 12599. https://doi.org/10.3390/app122412599
AMA Style
Alkhafaji H, Ibrahim A. Effects of Contrast Enhancement Phase on the Reproducibility and Predictivity of CT-Based Renal Lesions Radiomic Features. Applied Sciences. 2022; 12(24):12599. https://doi.org/10.3390/app122412599
Chicago/Turabian StyleAlkhafaji, Hayder, and Abdalla Ibrahim. 2022. "Effects of Contrast Enhancement Phase on the Reproducibility and Predictivity of CT-Based Renal Lesions Radiomic Features" Applied Sciences 12, no. 24: 12599. https://doi.org/10.3390/app122412599
Note that from the first issue of 2016, this journal uses article numbers instead of page numbers. See further details here.