
Aquila Optimization with Transfer Learning Based Crowd Density Analysis for Sustainable Smart Cities
 ,
,  ,
,
Abstract
:1. Introduction
2. Literature Survey
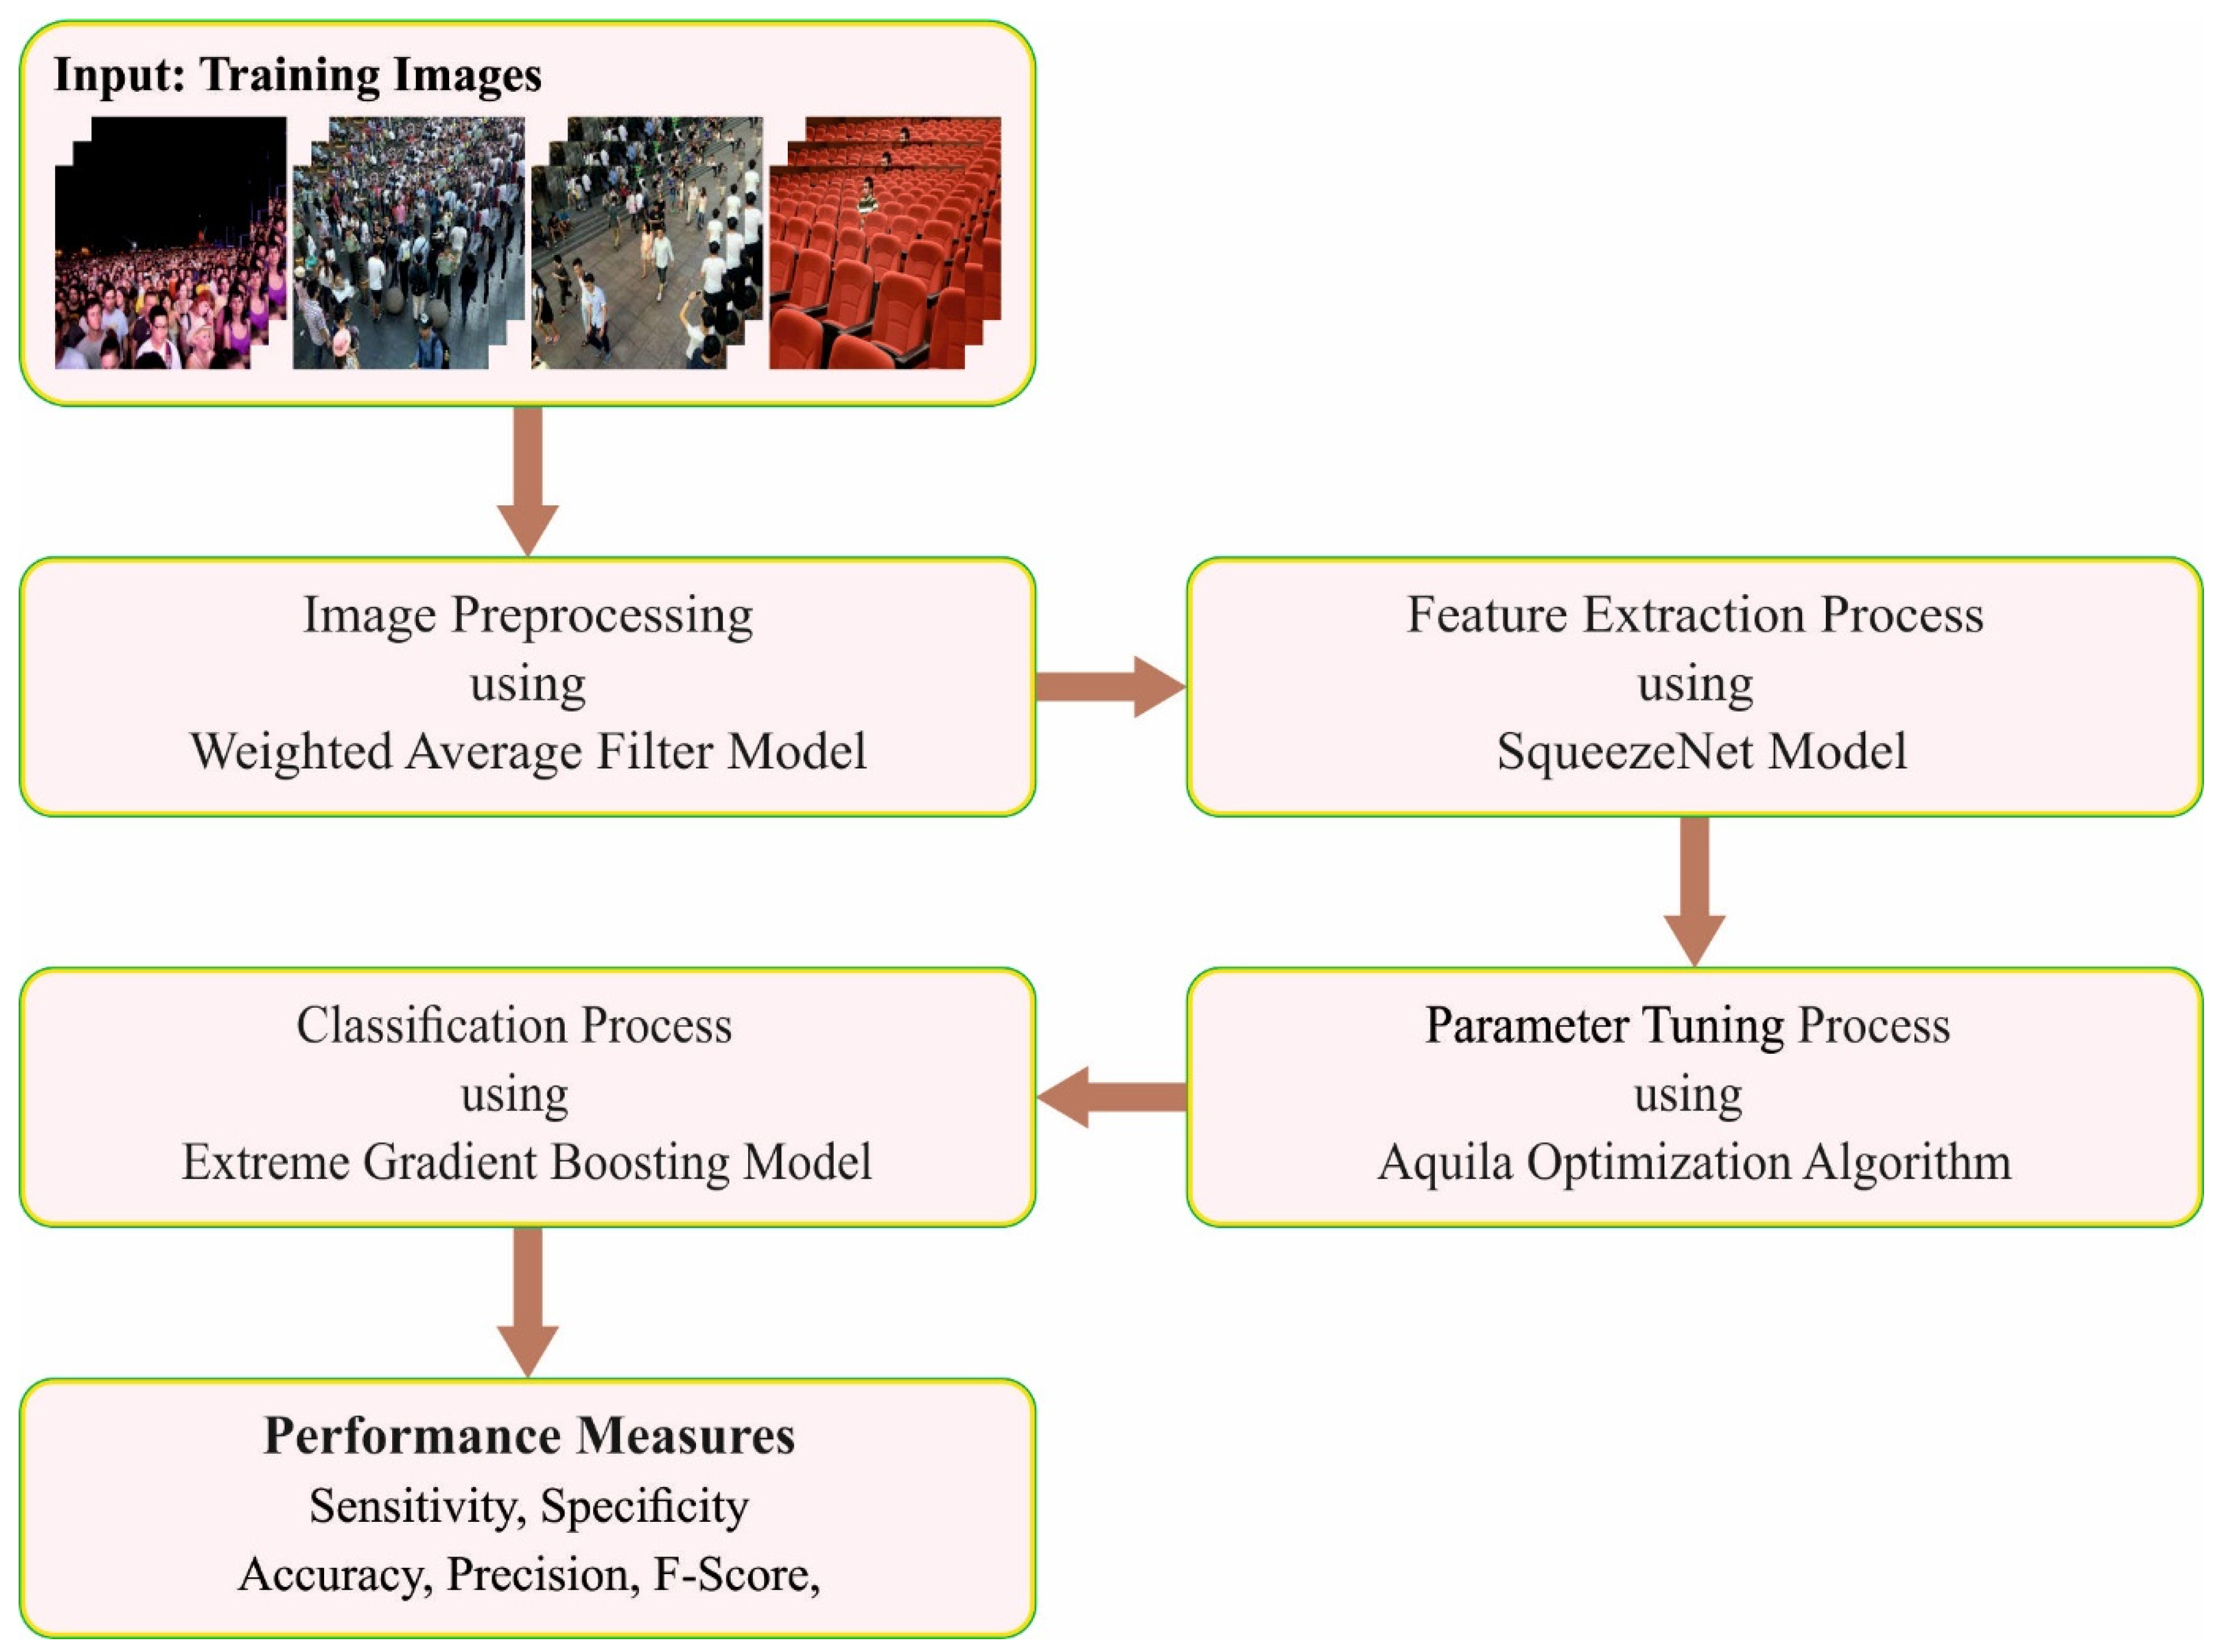
3. The Proposed Model
3.1. Image Pre-Processing
3.2. Feature Extraction
| Algorithm 1: Pseudocode of AO algorithm |
| Parameter initialization WHILE (Termination criteria is unsatisfied) do Determine value of fitness function Compute optimal attained solution based on fitness value do . , Levy(D), etc. then then Upgrade present solution then then end if end if else } Upgrade current solution. then then end if end if end if else then } Upgrade present solution then then end if end if else Upgrade present solution then then end if end if end if end if end for end while . |
3.3. Crowd Density Classification
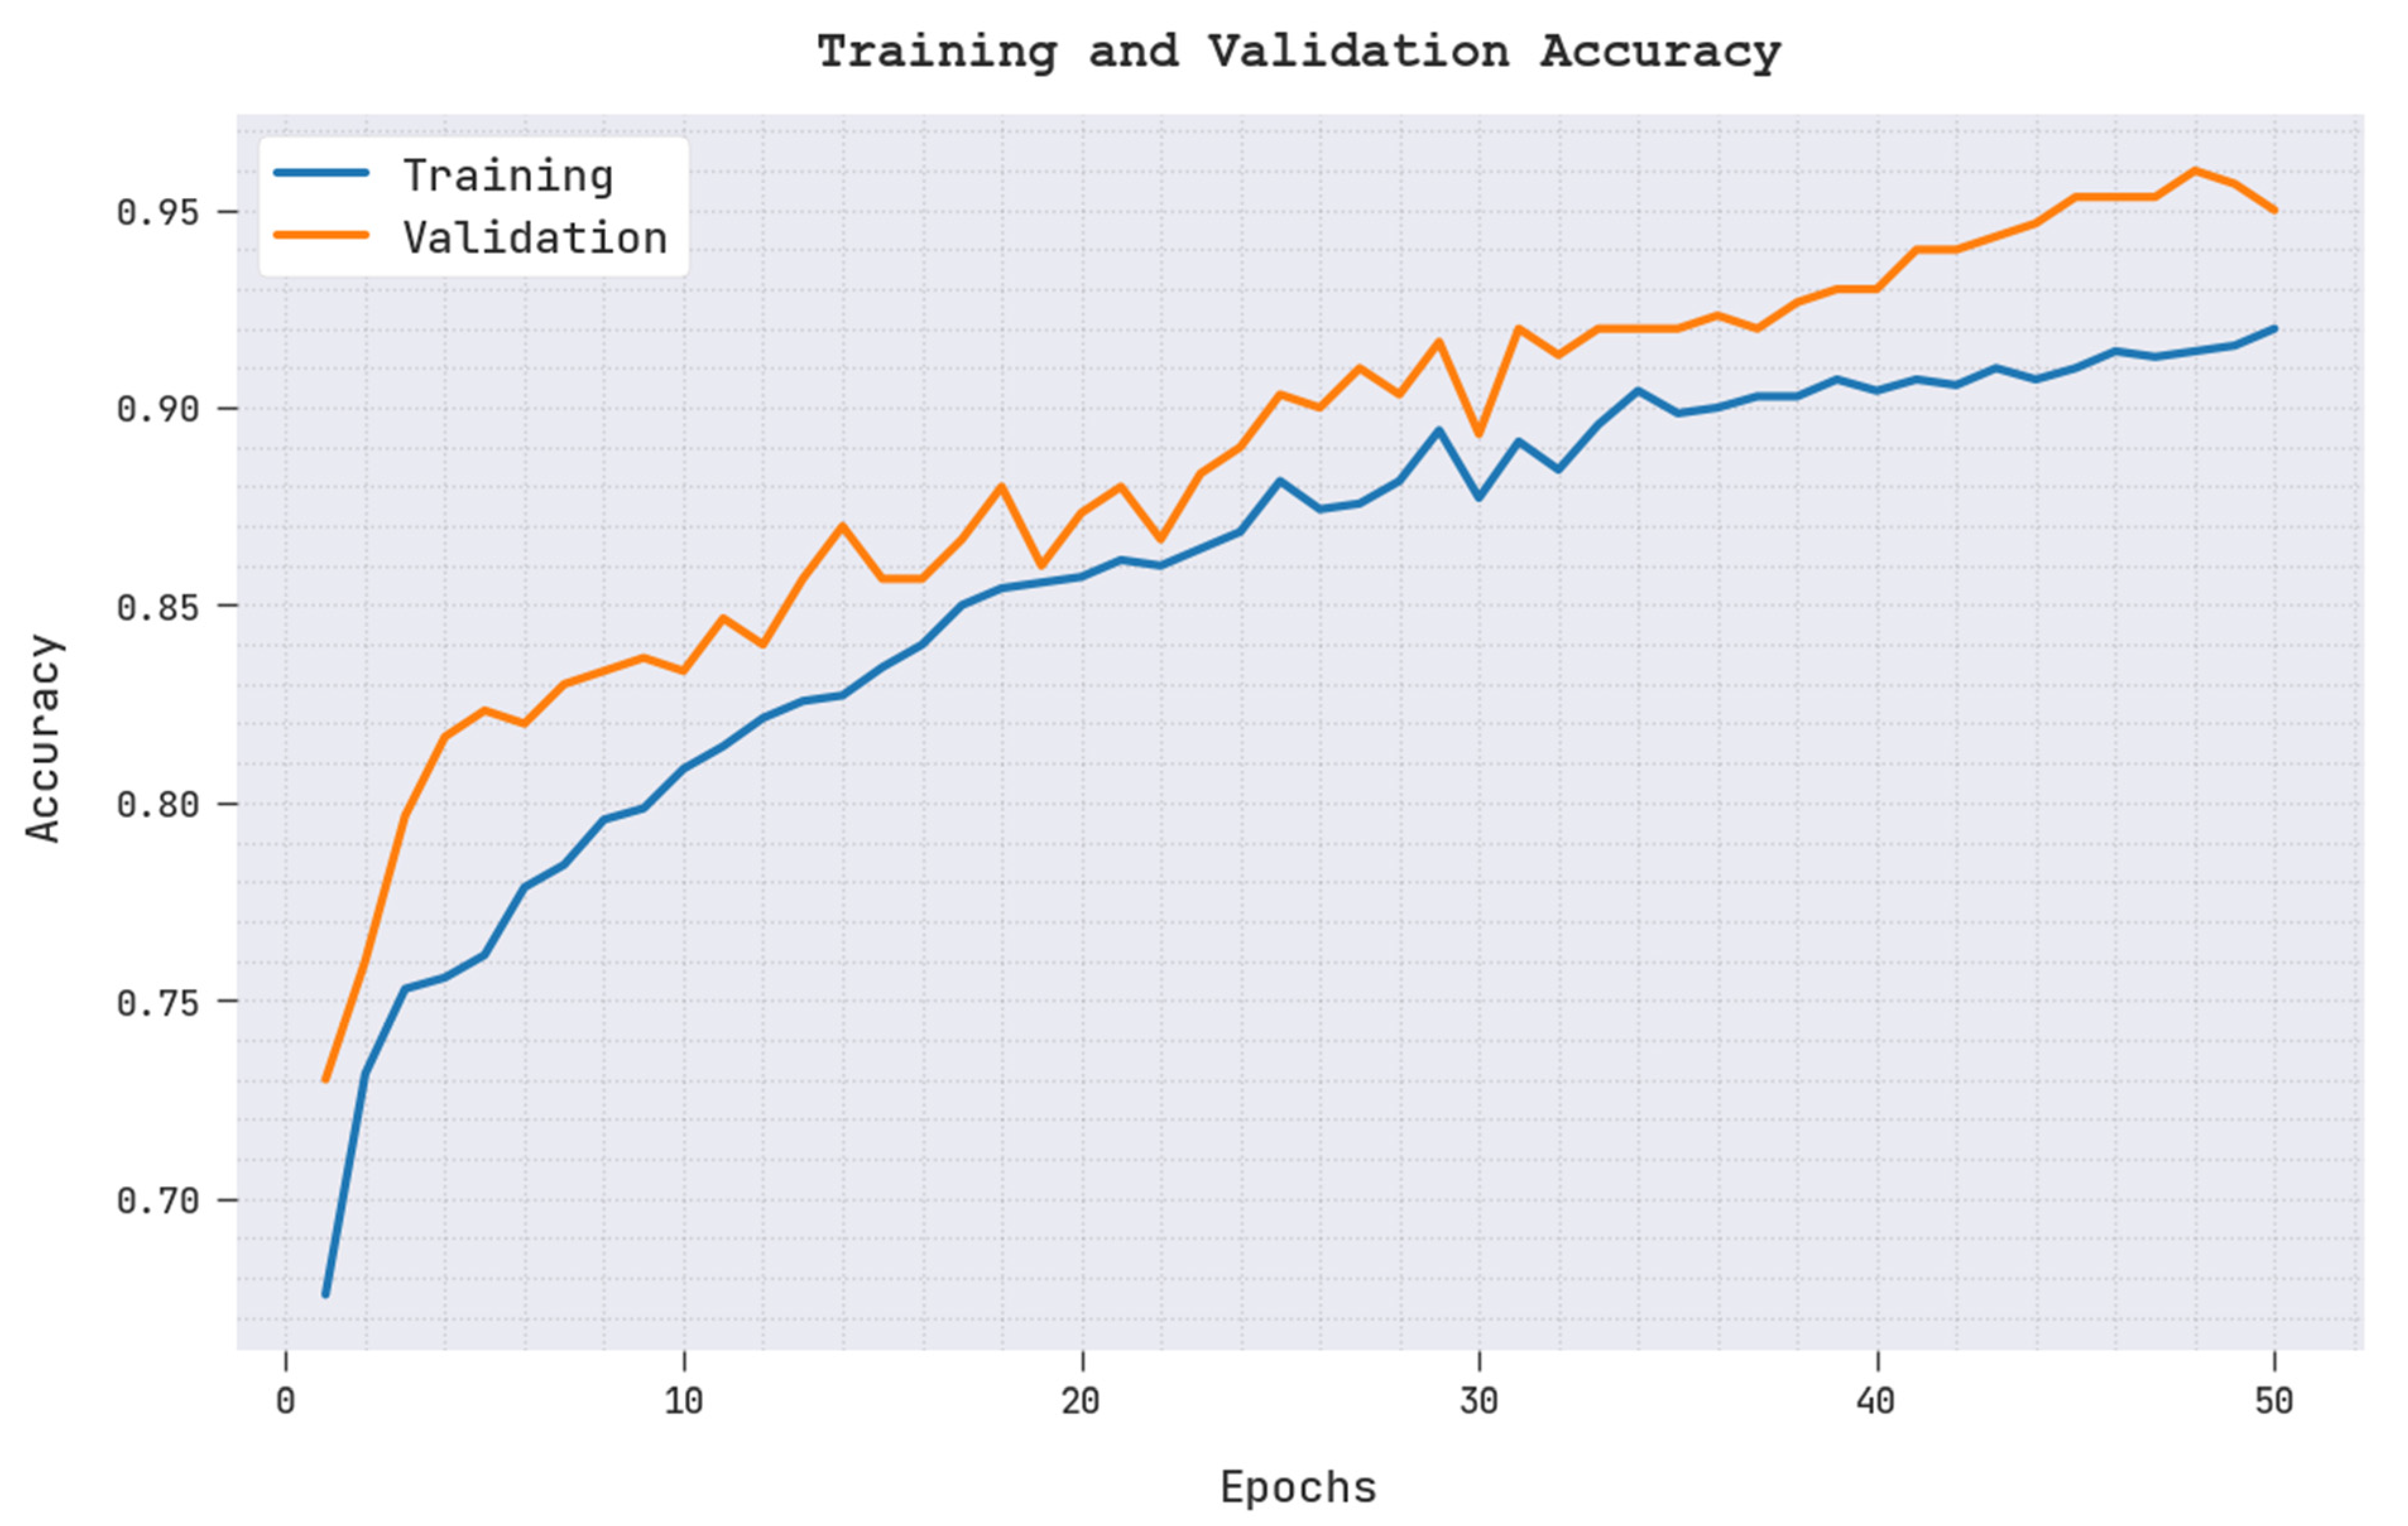
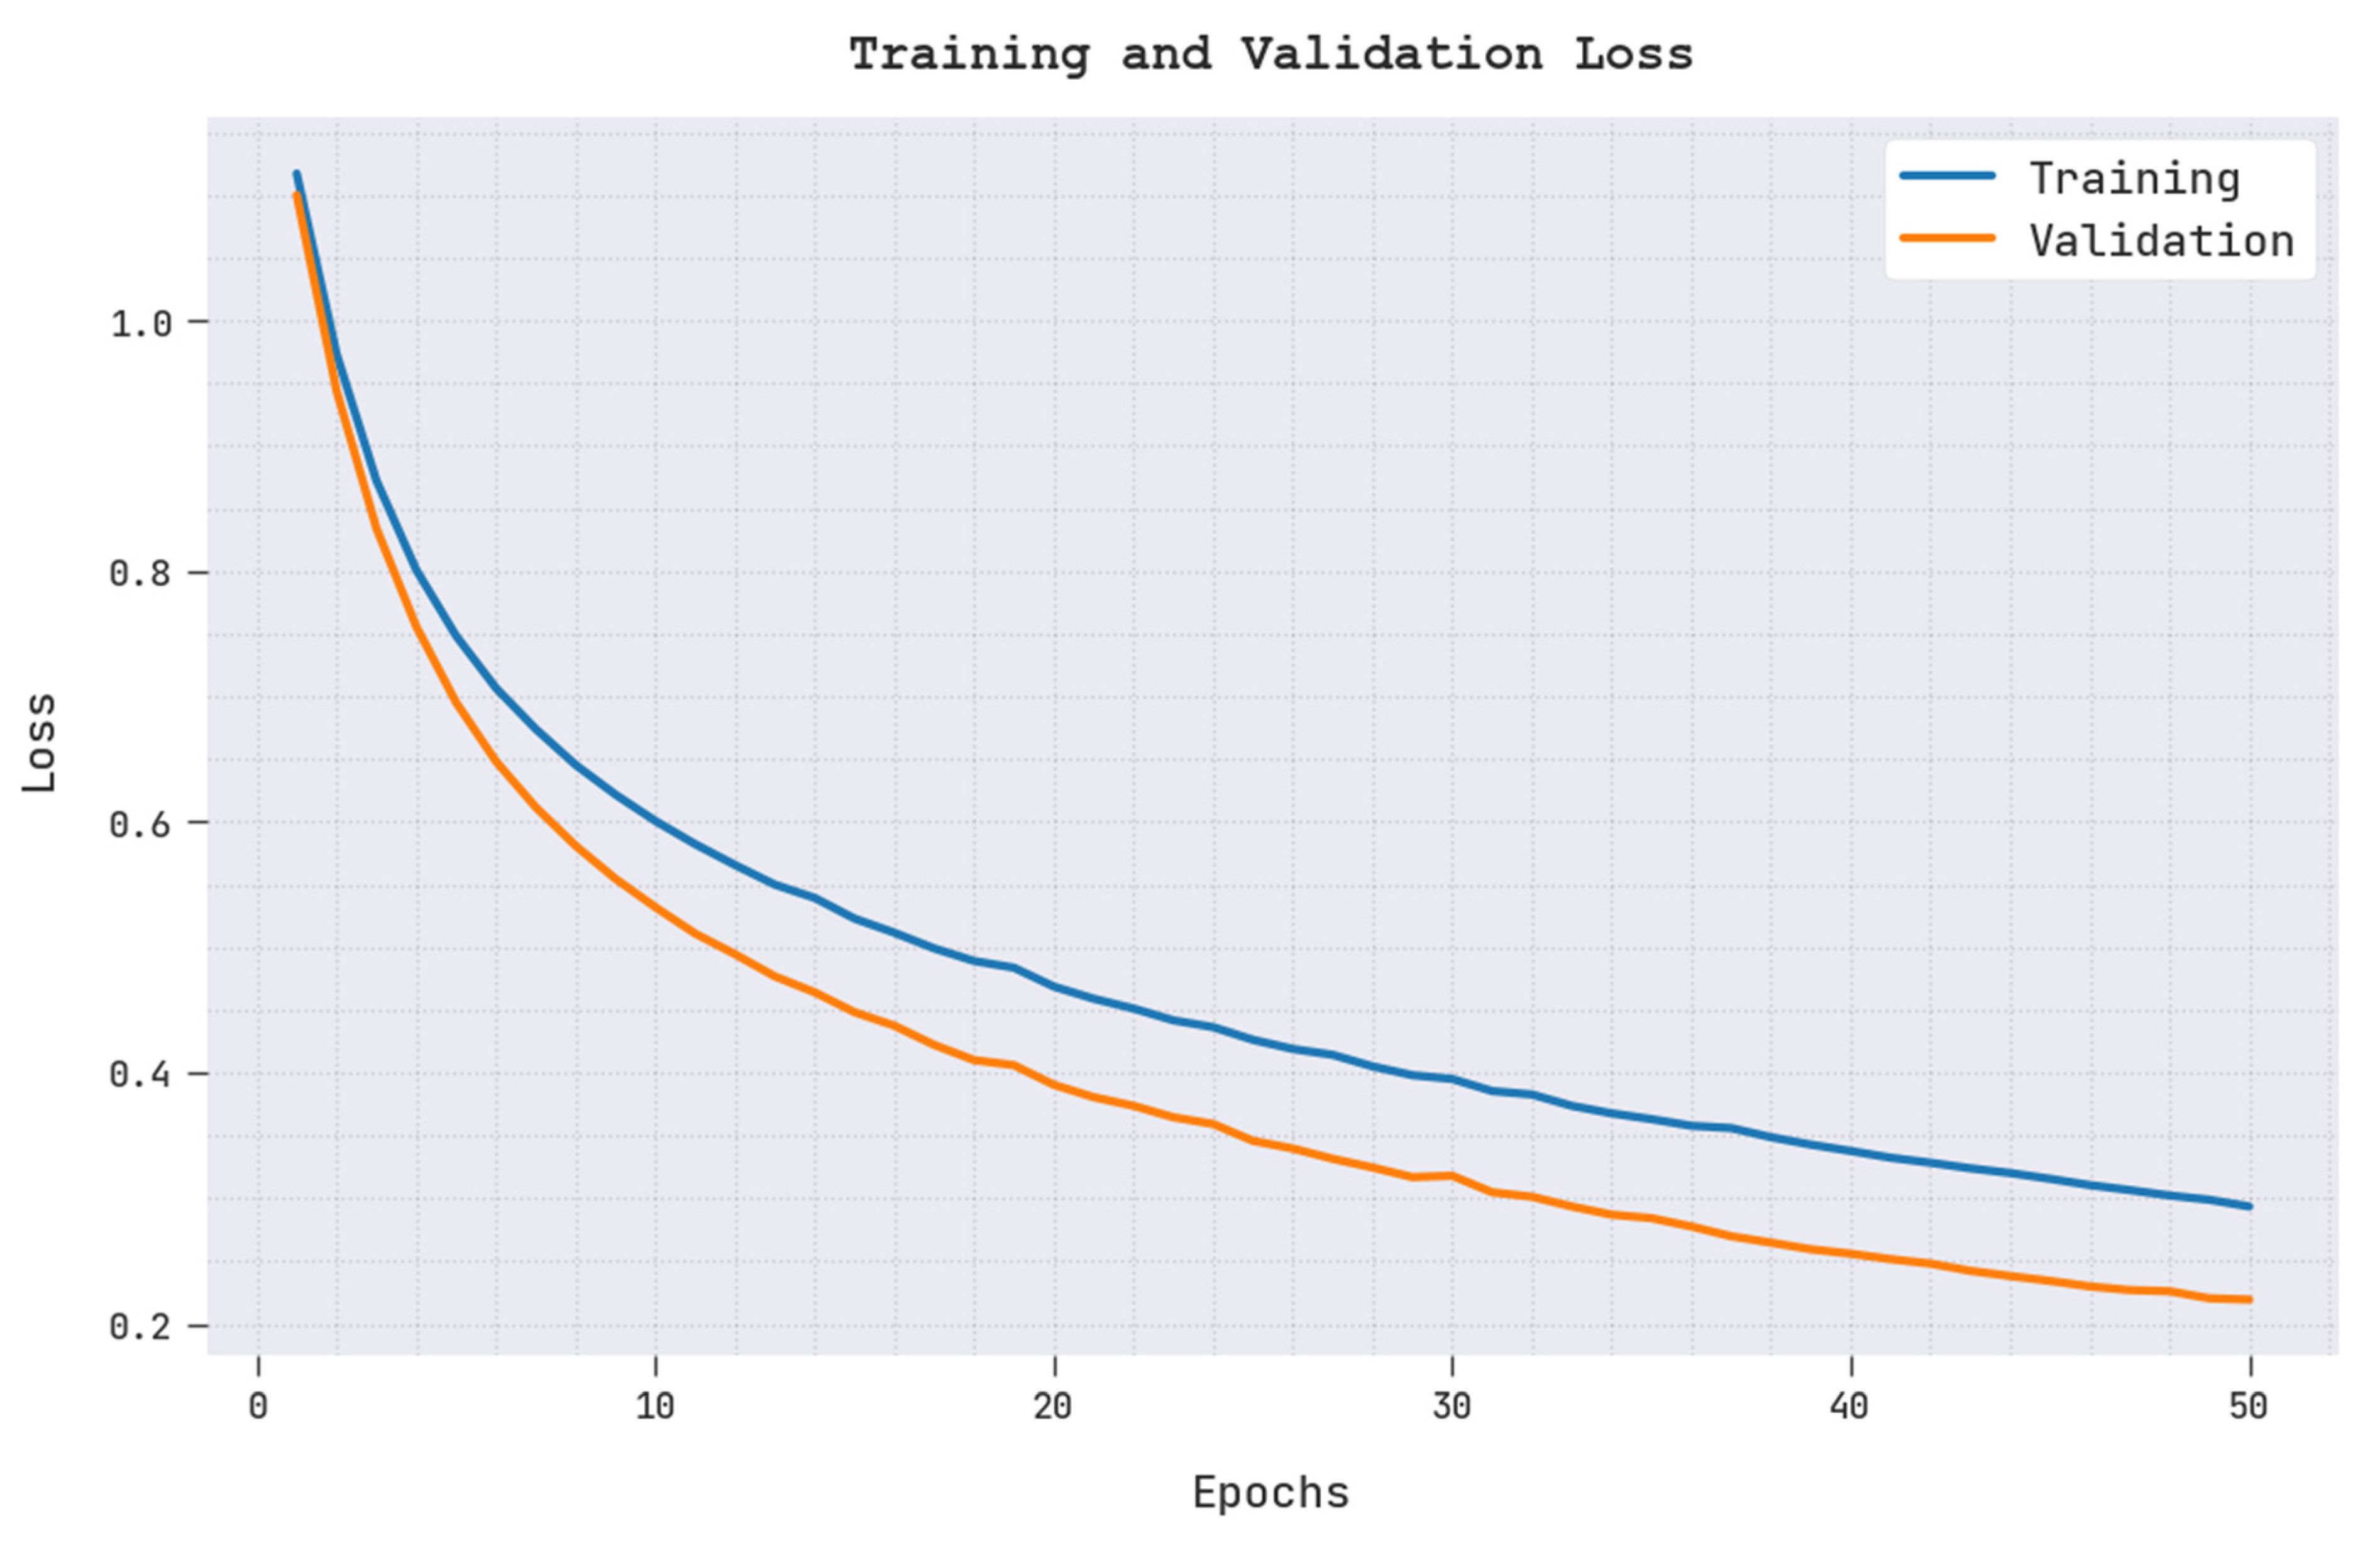
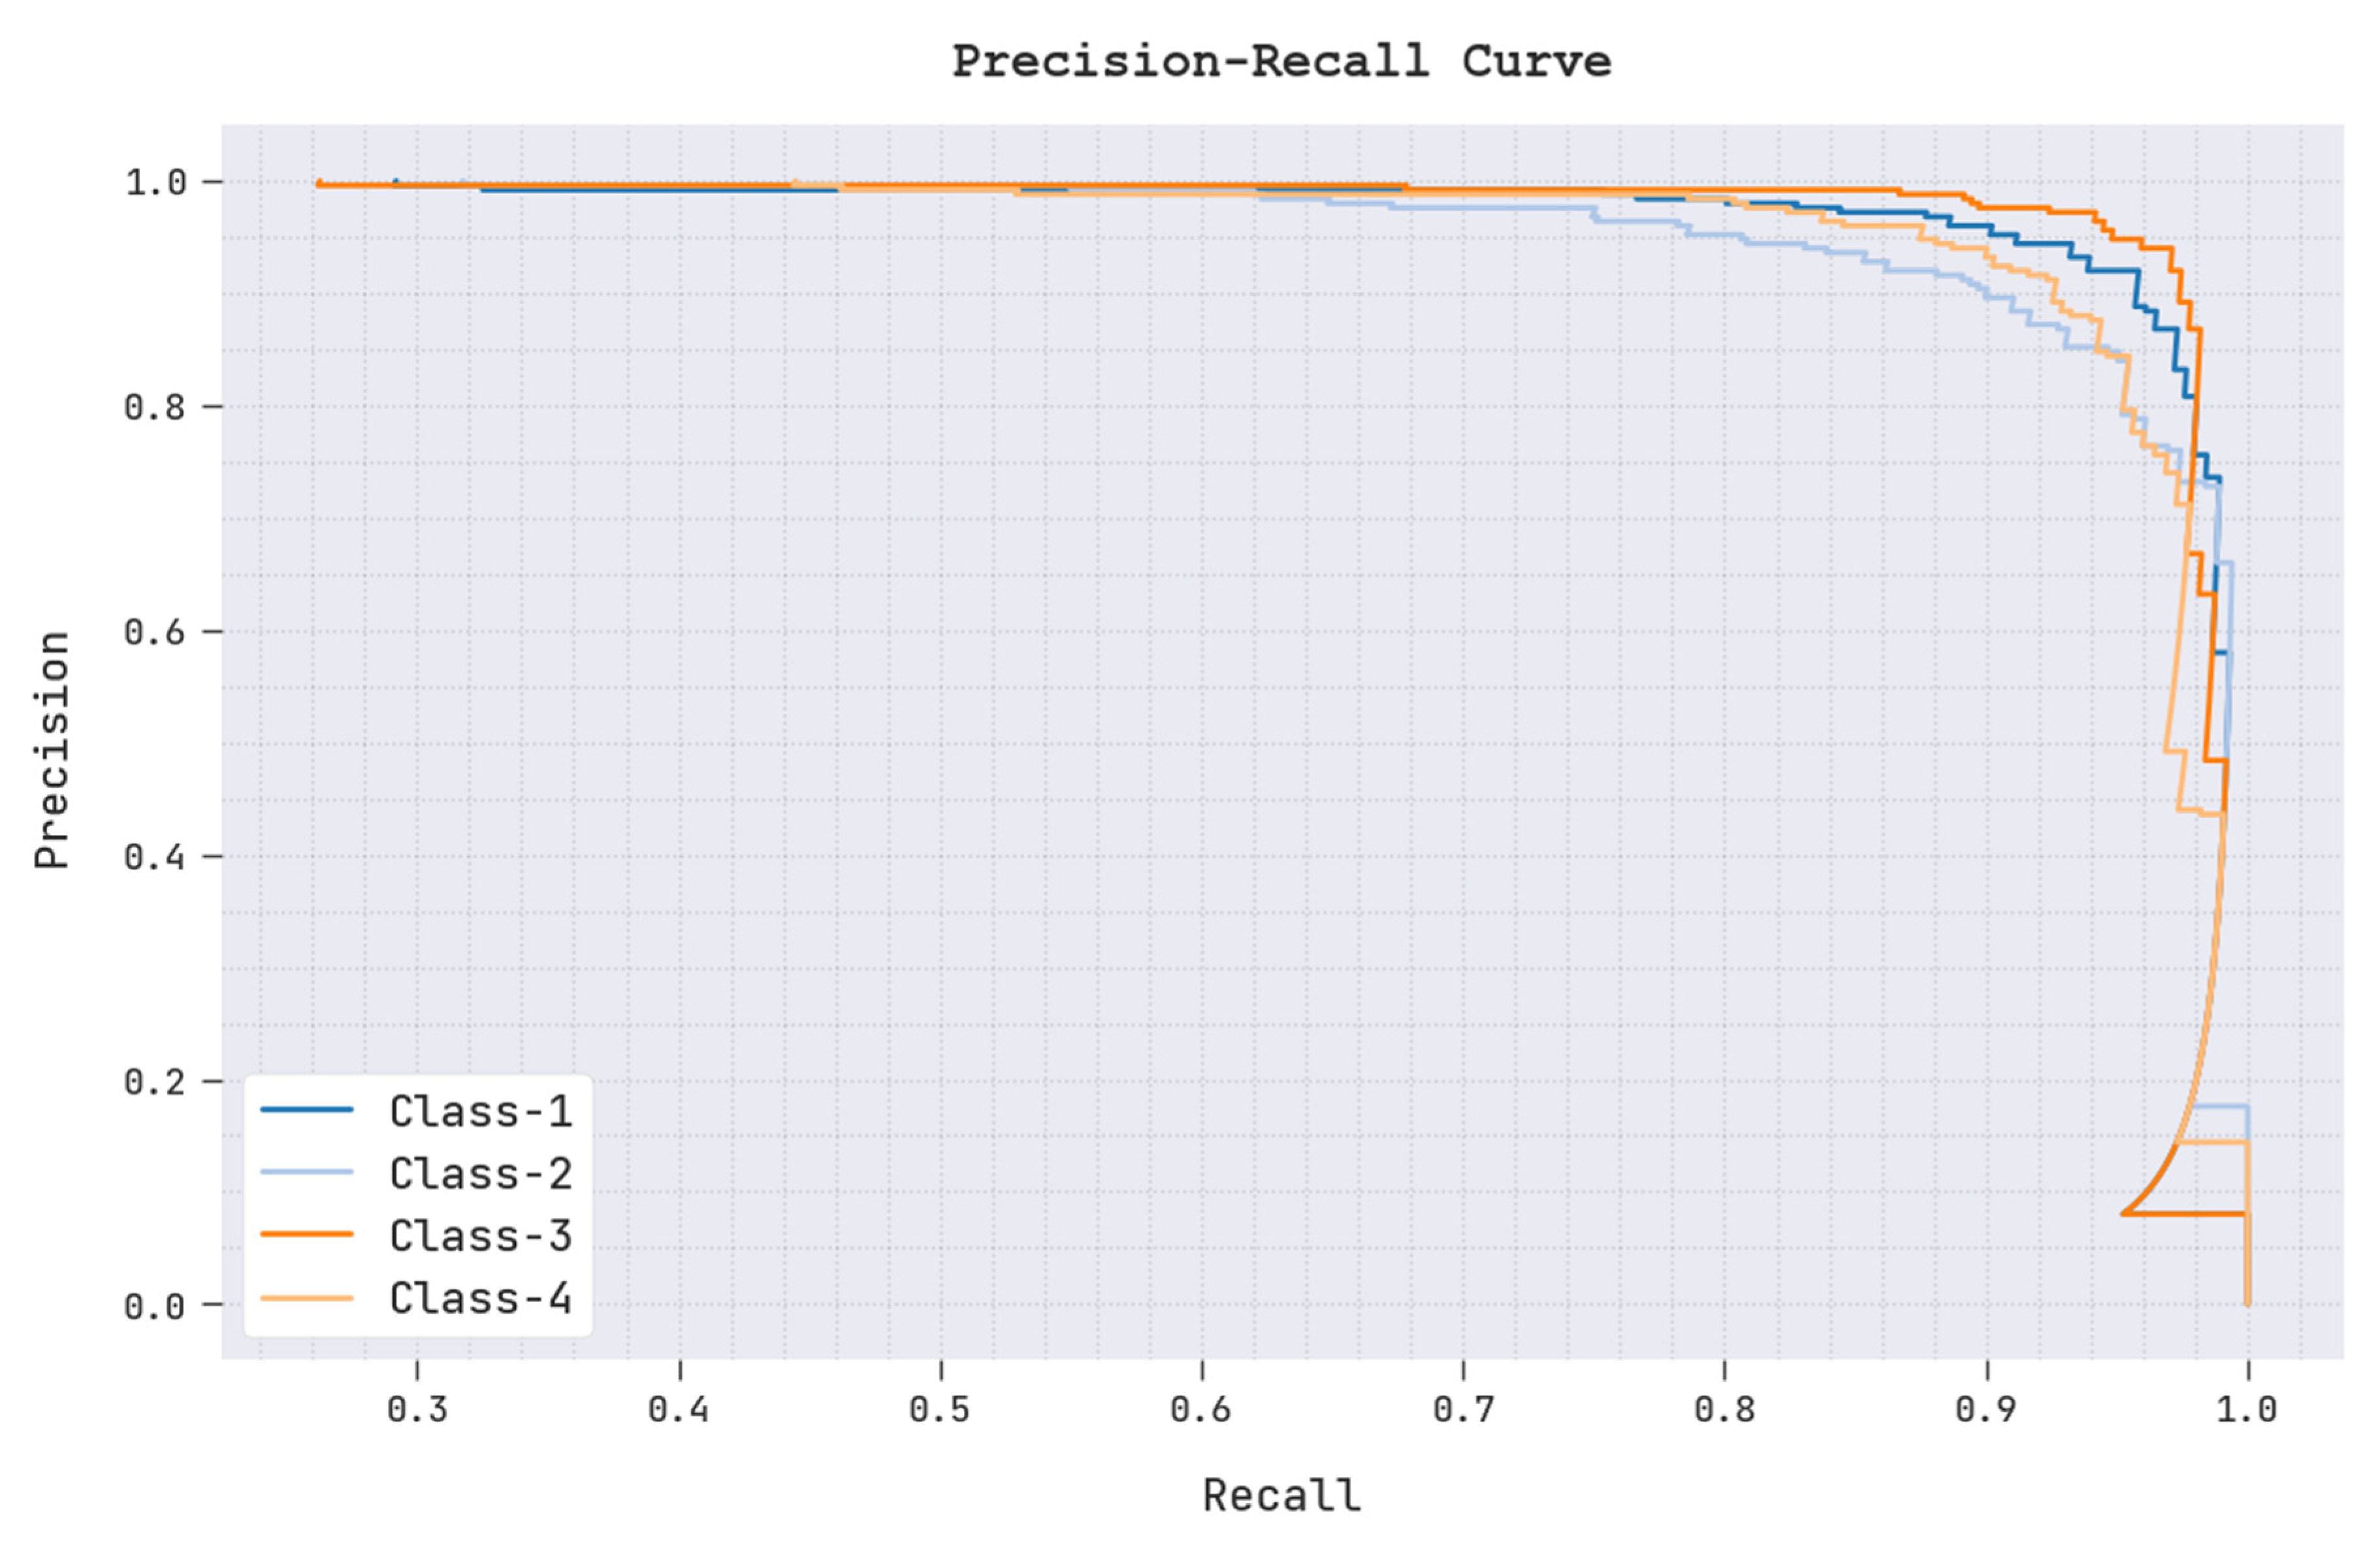
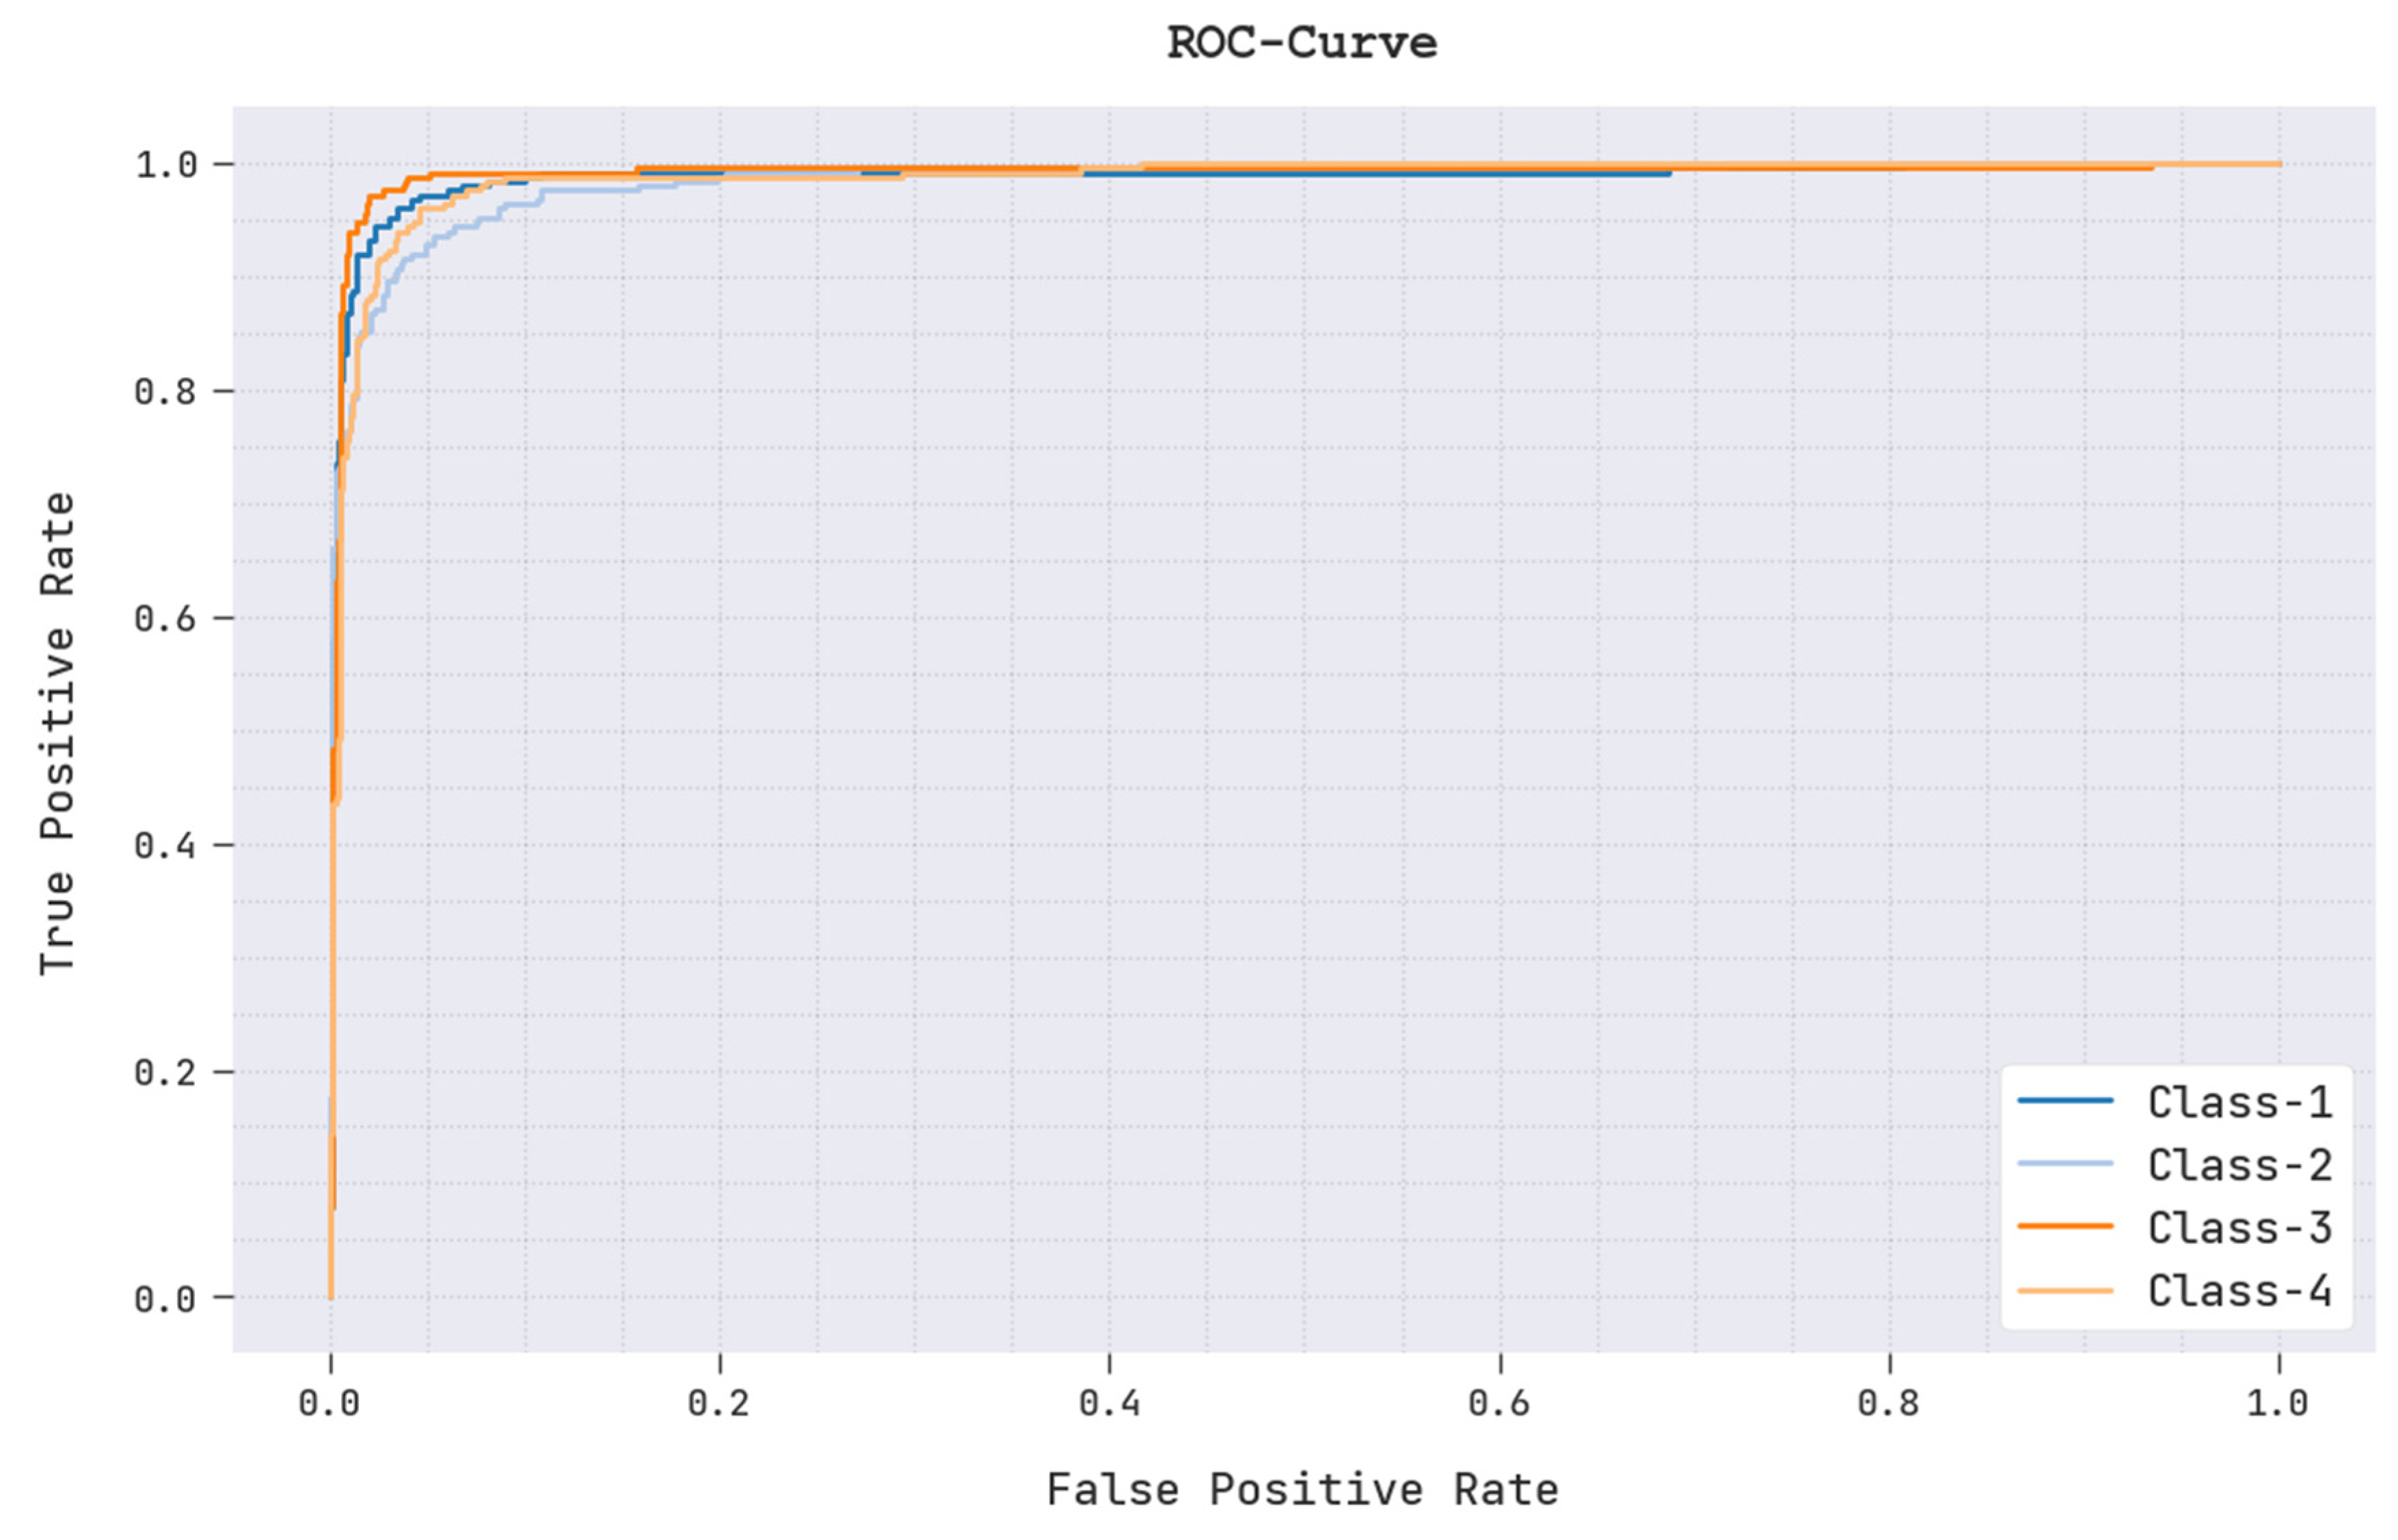
4. Performance Evaluation
5. Conclusions
Author Contributions
Funding
Informed Consent Statement
Data Availability Statement
Conflicts of Interest
References
- Fan, Z.; Zhang, H.; Zhang, Z.; Lu, G.; Zhang, Y.; Wang, Y. A survey of crowd counting and density estimation based on convolutional neural network. Neurocomputing 2022, 472, 224–251. [Google Scholar] [CrossRef]
- Garcia-Retuerta, D.; Chamoso, P.; Hernández, G.; Guzmán, A.S.R.; Yigitcanlar, T.; Corchado, J.M. An efficient management platform for developing smart cities: Solution for real-time and future crowd detection. Electronics 2021, 10, 765. [Google Scholar] [CrossRef]
- Sreenu, G.; Durai, S. Intelligent video surveillance: A review through deep learning techniques for crowd analysis. J. Big Data 2019, 6, 1–27. [Google Scholar] [CrossRef]
- Solmaz, G.; Baranwal, P.; Cirillo, F. CountMeIn: Adaptive Crowd Estimation with Wi-Fi in Smart Cities. In Proceedings of the 2022 IEEE International Conference on Pervasive Computing and Communications (PerCom), Pisa, Italy, 21–25 March 2022; pp. 187–196. [Google Scholar]
- Minoura, H.; Yonetani, R.; Nishimura, M.; Ushiku, Y. Crowd density forecasting by modeling patch-based dynamics. IEEE Robot. Autom. Lett. 2020, 6, 287–294. [Google Scholar] [CrossRef]
- Fitwi, A.; Chen, Y.; Sun, H.; Harrod, R. Estimating interpersonal distance and crowd density with a single-edge camera. Computers 2021, 10, 143. [Google Scholar] [CrossRef]
- Fu, X.; Pace, P.; Aloi, G.; Li, W.; Fortino, G. Toward robust and energy-efficient clustering wireless sensor networks: A double-stage scale-free topology evolution model. Comput. Netw. 2021, 200, 108521. [Google Scholar] [CrossRef]
- Fu, X.; Pace, P.; Aloi, G.; Yang, L.; Fortino, G. Topology optimization against cascading failures on wireless sensor networks using a memetic algorithm. Comput. Netw. 2020, 177, 107327. [Google Scholar] [CrossRef]
- Premkumar, M.; Jangir, P.; Kumar, C.; Sundarsingh Jebaseelan, S.D.T.; Alhelou, H.H.; Madurai Elavarasan, R.; Chen, H. Constraint estimation in three-diode solar photovoltaic model using Gaussian and Cauchy mutation-based hunger games search optimizer and enhanced Newton–Raphson method. IET Renew. Power Gener. 2022, 16, 1733–1772. [Google Scholar] [CrossRef]
- Premkumar, M.; Jangir, P.; Sowmya, R.; Alhelou, H.H.; Mirjalili, S.; Kumar, B.S. Multi-objective equilibrium optimizer: Framework and development for solving multi-objective optimization problems. J. Comput. Des. Eng. 2022, 9, 24–50. [Google Scholar] [CrossRef]
- Ding, X.; He, F.; Lin, Z.; Wang, Y.; Guo, H.; Huang, Y. Crowd density estimation using fusion of multi-layer features. IEEE Trans. Intell. Transp. Syst. 2020, 22, 4776–4787. [Google Scholar] [CrossRef]
- Alrowais, F.; Alotaibi, S.S.; Al-Wesabi, F.N.; Negm, N.; Alabdan, R.; Marzouk, R.; Mehanna, A.S.; Al Duhayyim, M. Deep Transfer Learning Enabled Intelligent Object Detection for Crowd Density Analysis on Video Surveillance Systems. Appl. Sci. 2022, 12, 6665. [Google Scholar] [CrossRef]
- Wang, S.; Pu, Z.; Li, Q.; Wang, Y. Estimating crowd density with edge intelligence based on lightweight convolutional neural networks. Expert Syst. Appl. 2022, 206, 117823. [Google Scholar] [CrossRef]
- Almagbile, A. Estimation of crowd density from UAVs images based on corner detection procedures and clustering analysis. Geo-Spat. Inf. Sci. 2019, 22, 23–34. [Google Scholar] [CrossRef]
- Purwar, R.K. Crowd density estimation using hough circle transform for video surveillance. In Proceedings of the 2019 6th International Conference on Signal Processing and Integrated Networks (SPIN), Noida, India, 7–8 March 2019; pp. 442–447. [Google Scholar]
- Alashban, A.; Alsadan, A.; Alhussainan, N.F.; Ouni, R. Single Convolutional Neural Network with Three Layers Model for Crowd Density Estimation. IEEE Access 2022, 10, 63823–63833. [Google Scholar] [CrossRef]
- Zhou, B.; Song, B.; Hassan, M.M.; Alamri, A. Multilinear rank support tensor machine for crowd density estimation. Eng. Appl. Artif. Intell. 2018, 72, 382–392. [Google Scholar] [CrossRef]
- Zhao, R.; Dong, D.; Wang, Y.; Li, C.; Ma, Y.; Enríquez, V.F. Image-Based Crowd Stability Analysis Using Improved Multi-Column Convolutional Neural Network. IEEE Trans. Intell. Transp. Syst. 2021, 23, 5480–5489. [Google Scholar] [CrossRef]
- Liu, W.; Yang, Y.; Zhong, J. Towards Dual-Modal Crowd Density Forecasting in Transportation Building. In Proceedings of the 2022 International Joint Conference on Neural Networks (IJCNN), Padua, Italy, 18–23 July 2022; pp. 1–8. [Google Scholar]
- Wang, S.; Lyu, Y.; Xu, Y.; Wu, W. MSCDP: Multi-Step Crowd Density Predictor in Indoor Environment. 2022. [Google Scholar] [CrossRef]
- Tang, X.; Xiao, B.; Li, K. Indoor crowd density estimation through mobile smartphone wi-fi probes. IEEE Trans. Syst. Man Cybern. Syst. 2018, 50, 2638–2649. [Google Scholar] [CrossRef]
- Li, P.; Liu, X.; Xiao, H. Quantum image weighted average filtering in spatial domain. Int. J. Theor. Phys. 2017, 56, 3690–3716. [Google Scholar] [CrossRef]
- Ucar, F.; Korkmaz, D. COVIDiagnosis-Net: Deep Bayes-SqueezeNet based diagnosis of the coronavirus disease 2019 (COVID-19) from X-ray images. Med. Hypotheses 2020, 140, 109761. [Google Scholar] [CrossRef]
- Abualigah, L.; Yousri, D.; Abd Elaziz, M.; Ewees, A.A.; Al-Qaness, M.A.; Gandomi, A.H. Aquila optimizer: A novel meta-heuristic optimization algorithm. Comput. Ind. Eng. 2021, 157, 107250. [Google Scholar] [CrossRef]
- Zheng, H.; Yuan, J.; Chen, L. Short-term load forecasting using EMD-LSTM neural networks with a Xgboost algorithm for feature importance evaluation. Energies 2017, 10, 1168. [Google Scholar] [CrossRef] [Green Version]


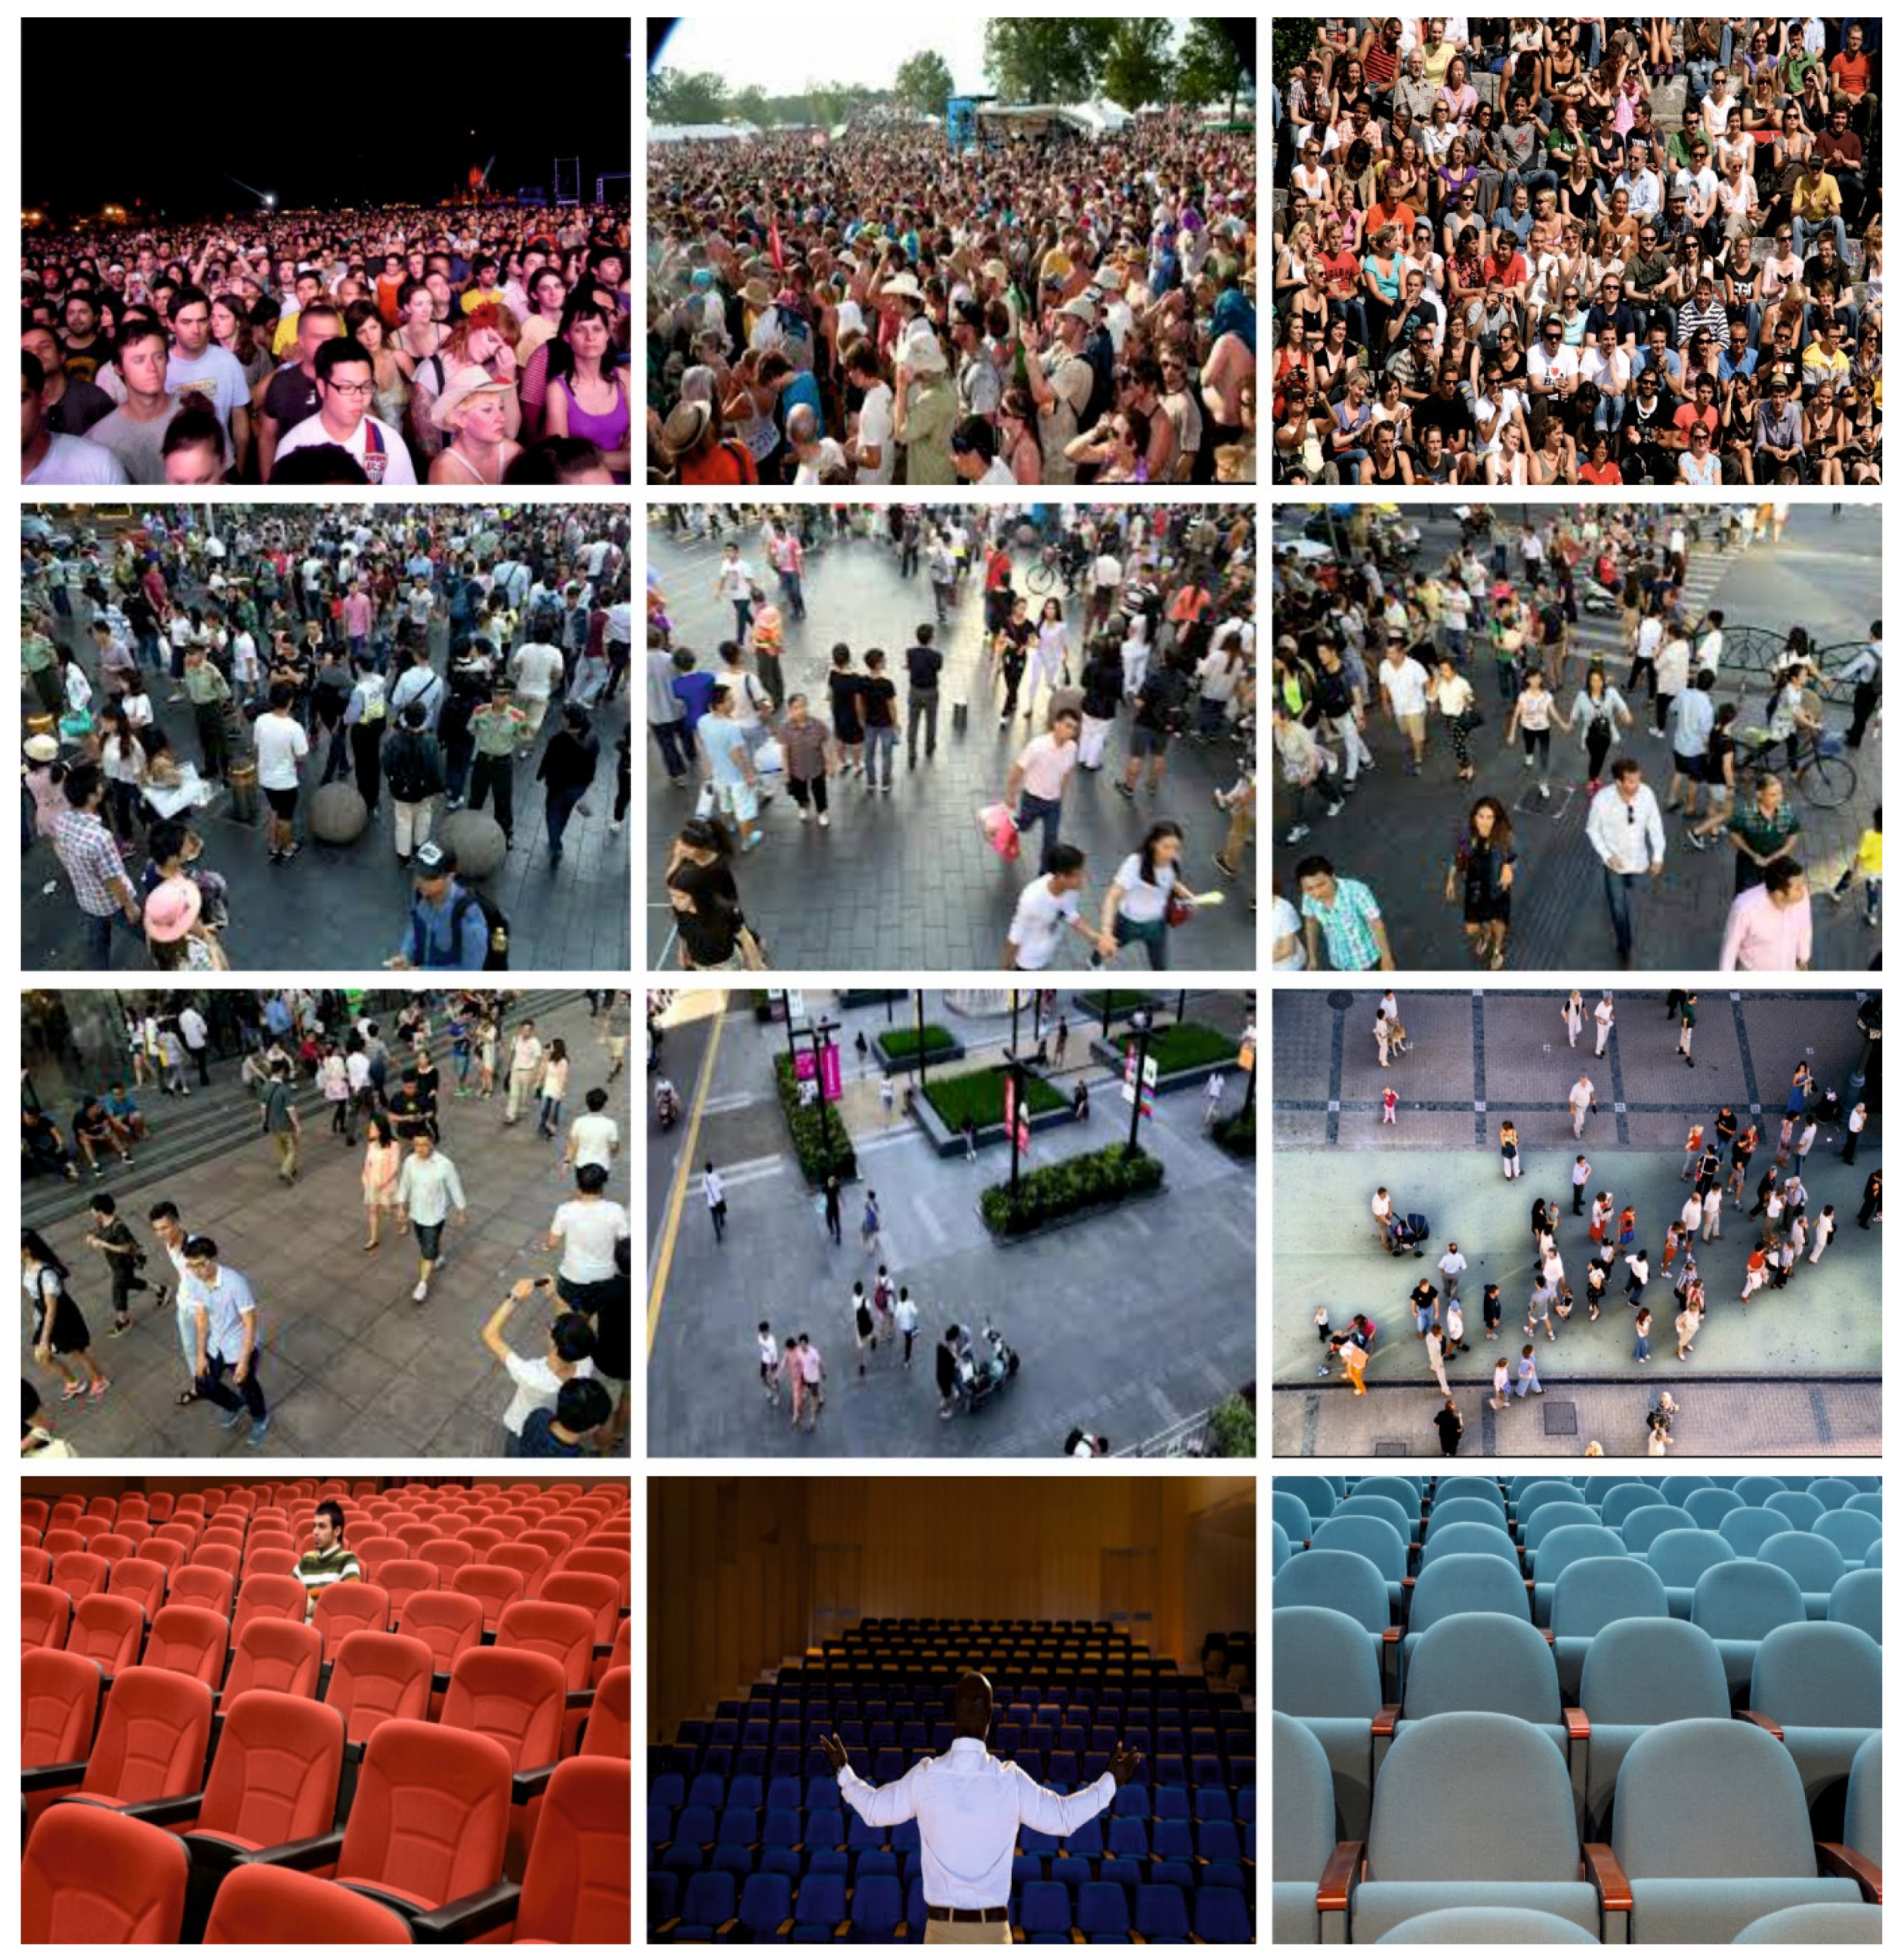
| Labels | Class | Sample count |
|---|---|---|
| C1 | Dense Crowd | 250 |
| C2 | Medium Dense Crowd | 250 |
| C3 | Sparse Crowd | 250 |
| C4 | No Crowd | 250 |
| Total Number of Samples | 1000 | |
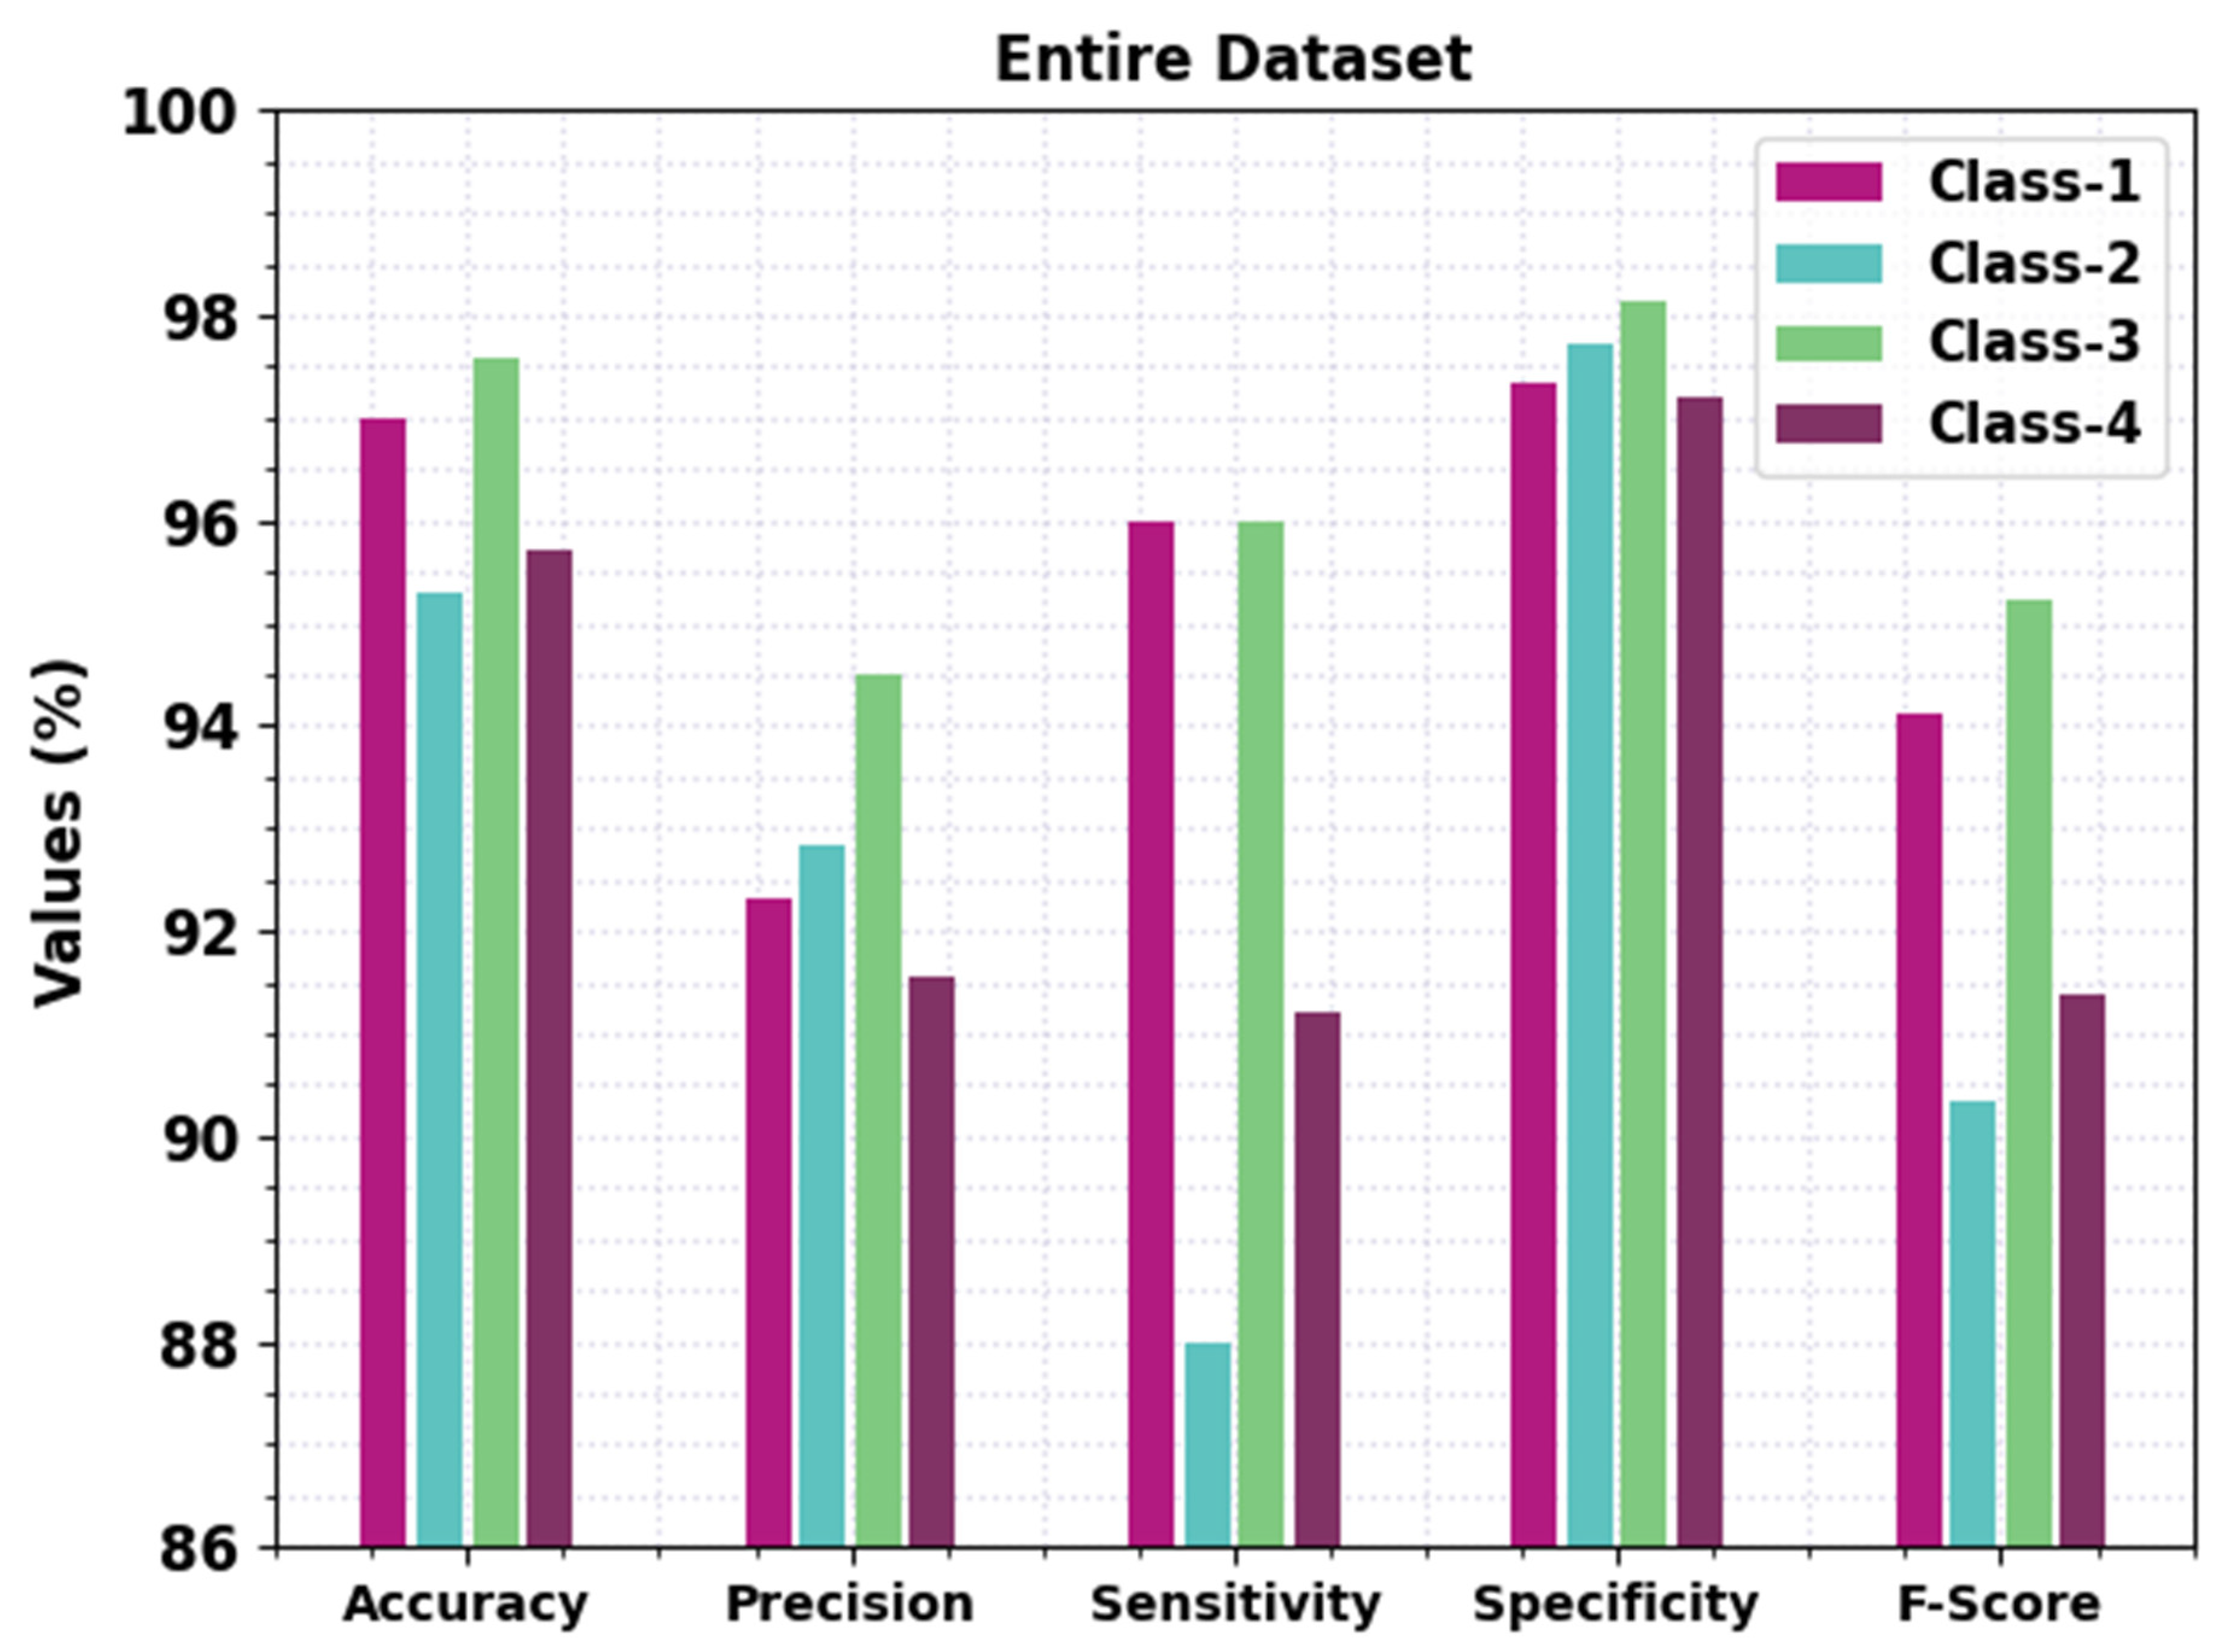
| Entire Dataset | |||||
|---|---|---|---|---|---|
| Labels | Accuracy | Precision | Sensitivity | Specificity | F-Score |
| Class-1 | 97.00 | 92.31 | 96.00 | 97.33 | 94.12 |
| Class-2 | 95.30 | 92.83 | 88.00 | 97.73 | 90.35 |
| Class-3 | 97.60 | 94.49 | 96.00 | 98.13 | 95.24 |
| Class-4 | 95.70 | 91.57 | 91.20 | 97.20 | 91.38 |
| Average | 96.40 | 92.80 | 92.80 | 97.60 | 92.77 |
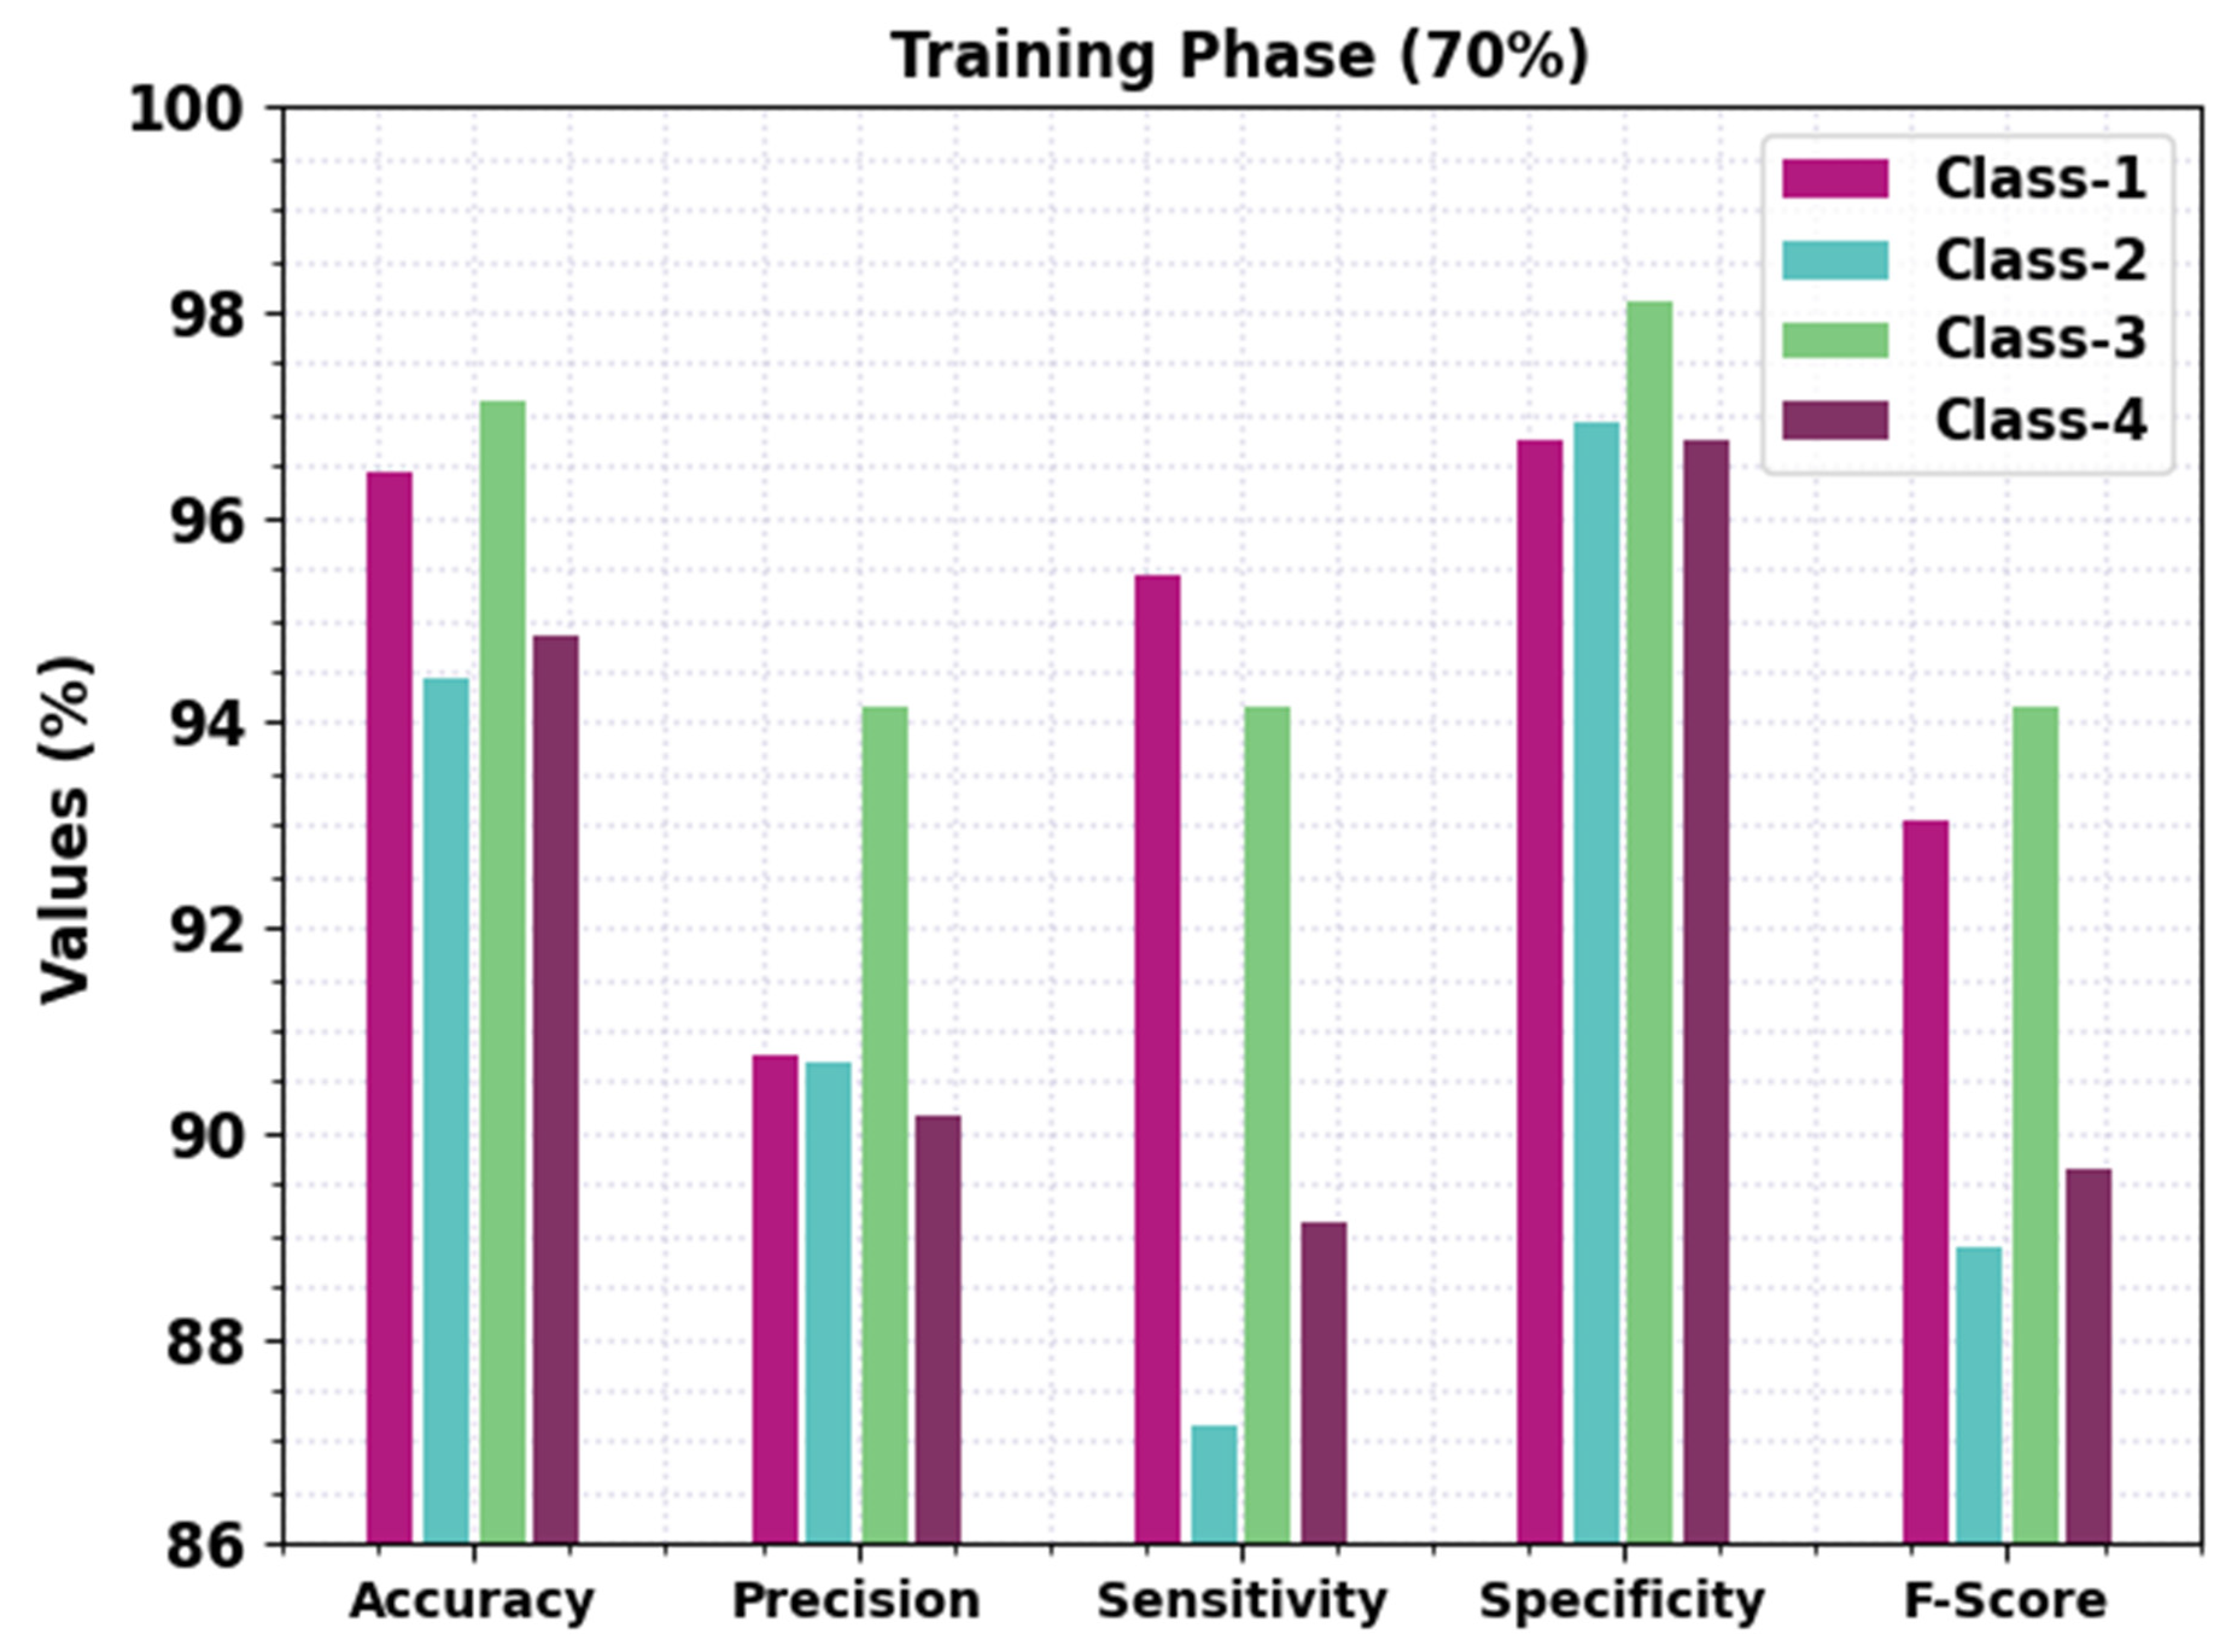
| Training Phase (70%) | |||||
|---|---|---|---|---|---|
| Labels | Accuracy | Precision | Sensitivity | Specificity | F-Score |
| Class-1 | 96.43 | 90.76 | 95.43 | 96.76 | 93.04 |
| Class-2 | 94.43 | 90.70 | 87.15 | 96.93 | 88.89 |
| Class-3 | 97.14 | 94.15 | 94.15 | 98.11 | 94.15 |
| Class-4 | 94.86 | 90.17 | 89.14 | 96.76 | 89.66 |
| Average | 95.71 | 91.45 | 91.47 | 97.14 | 91.43 |
| Testing Phase (30%) | |||||
|---|---|---|---|---|---|
| Labels | Accuracy | Precision | Sensitivity | Specificity | F-Score |
| Class-1 | 98.33 | 96.05 | 97.33 | 98.67 | 96.69 |
| Class-2 | 97.33 | 98.46 | 90.14 | 99.56 | 94.12 |
| Class-3 | 98.67 | 95.18 | 100.00 | 98.19 | 97.53 |
| Class-4 | 97.67 | 94.74 | 96.00 | 98.22 | 95.36 |
| Average | 98.00 | 96.11 | 95.87 | 98.66 | 95.93 |
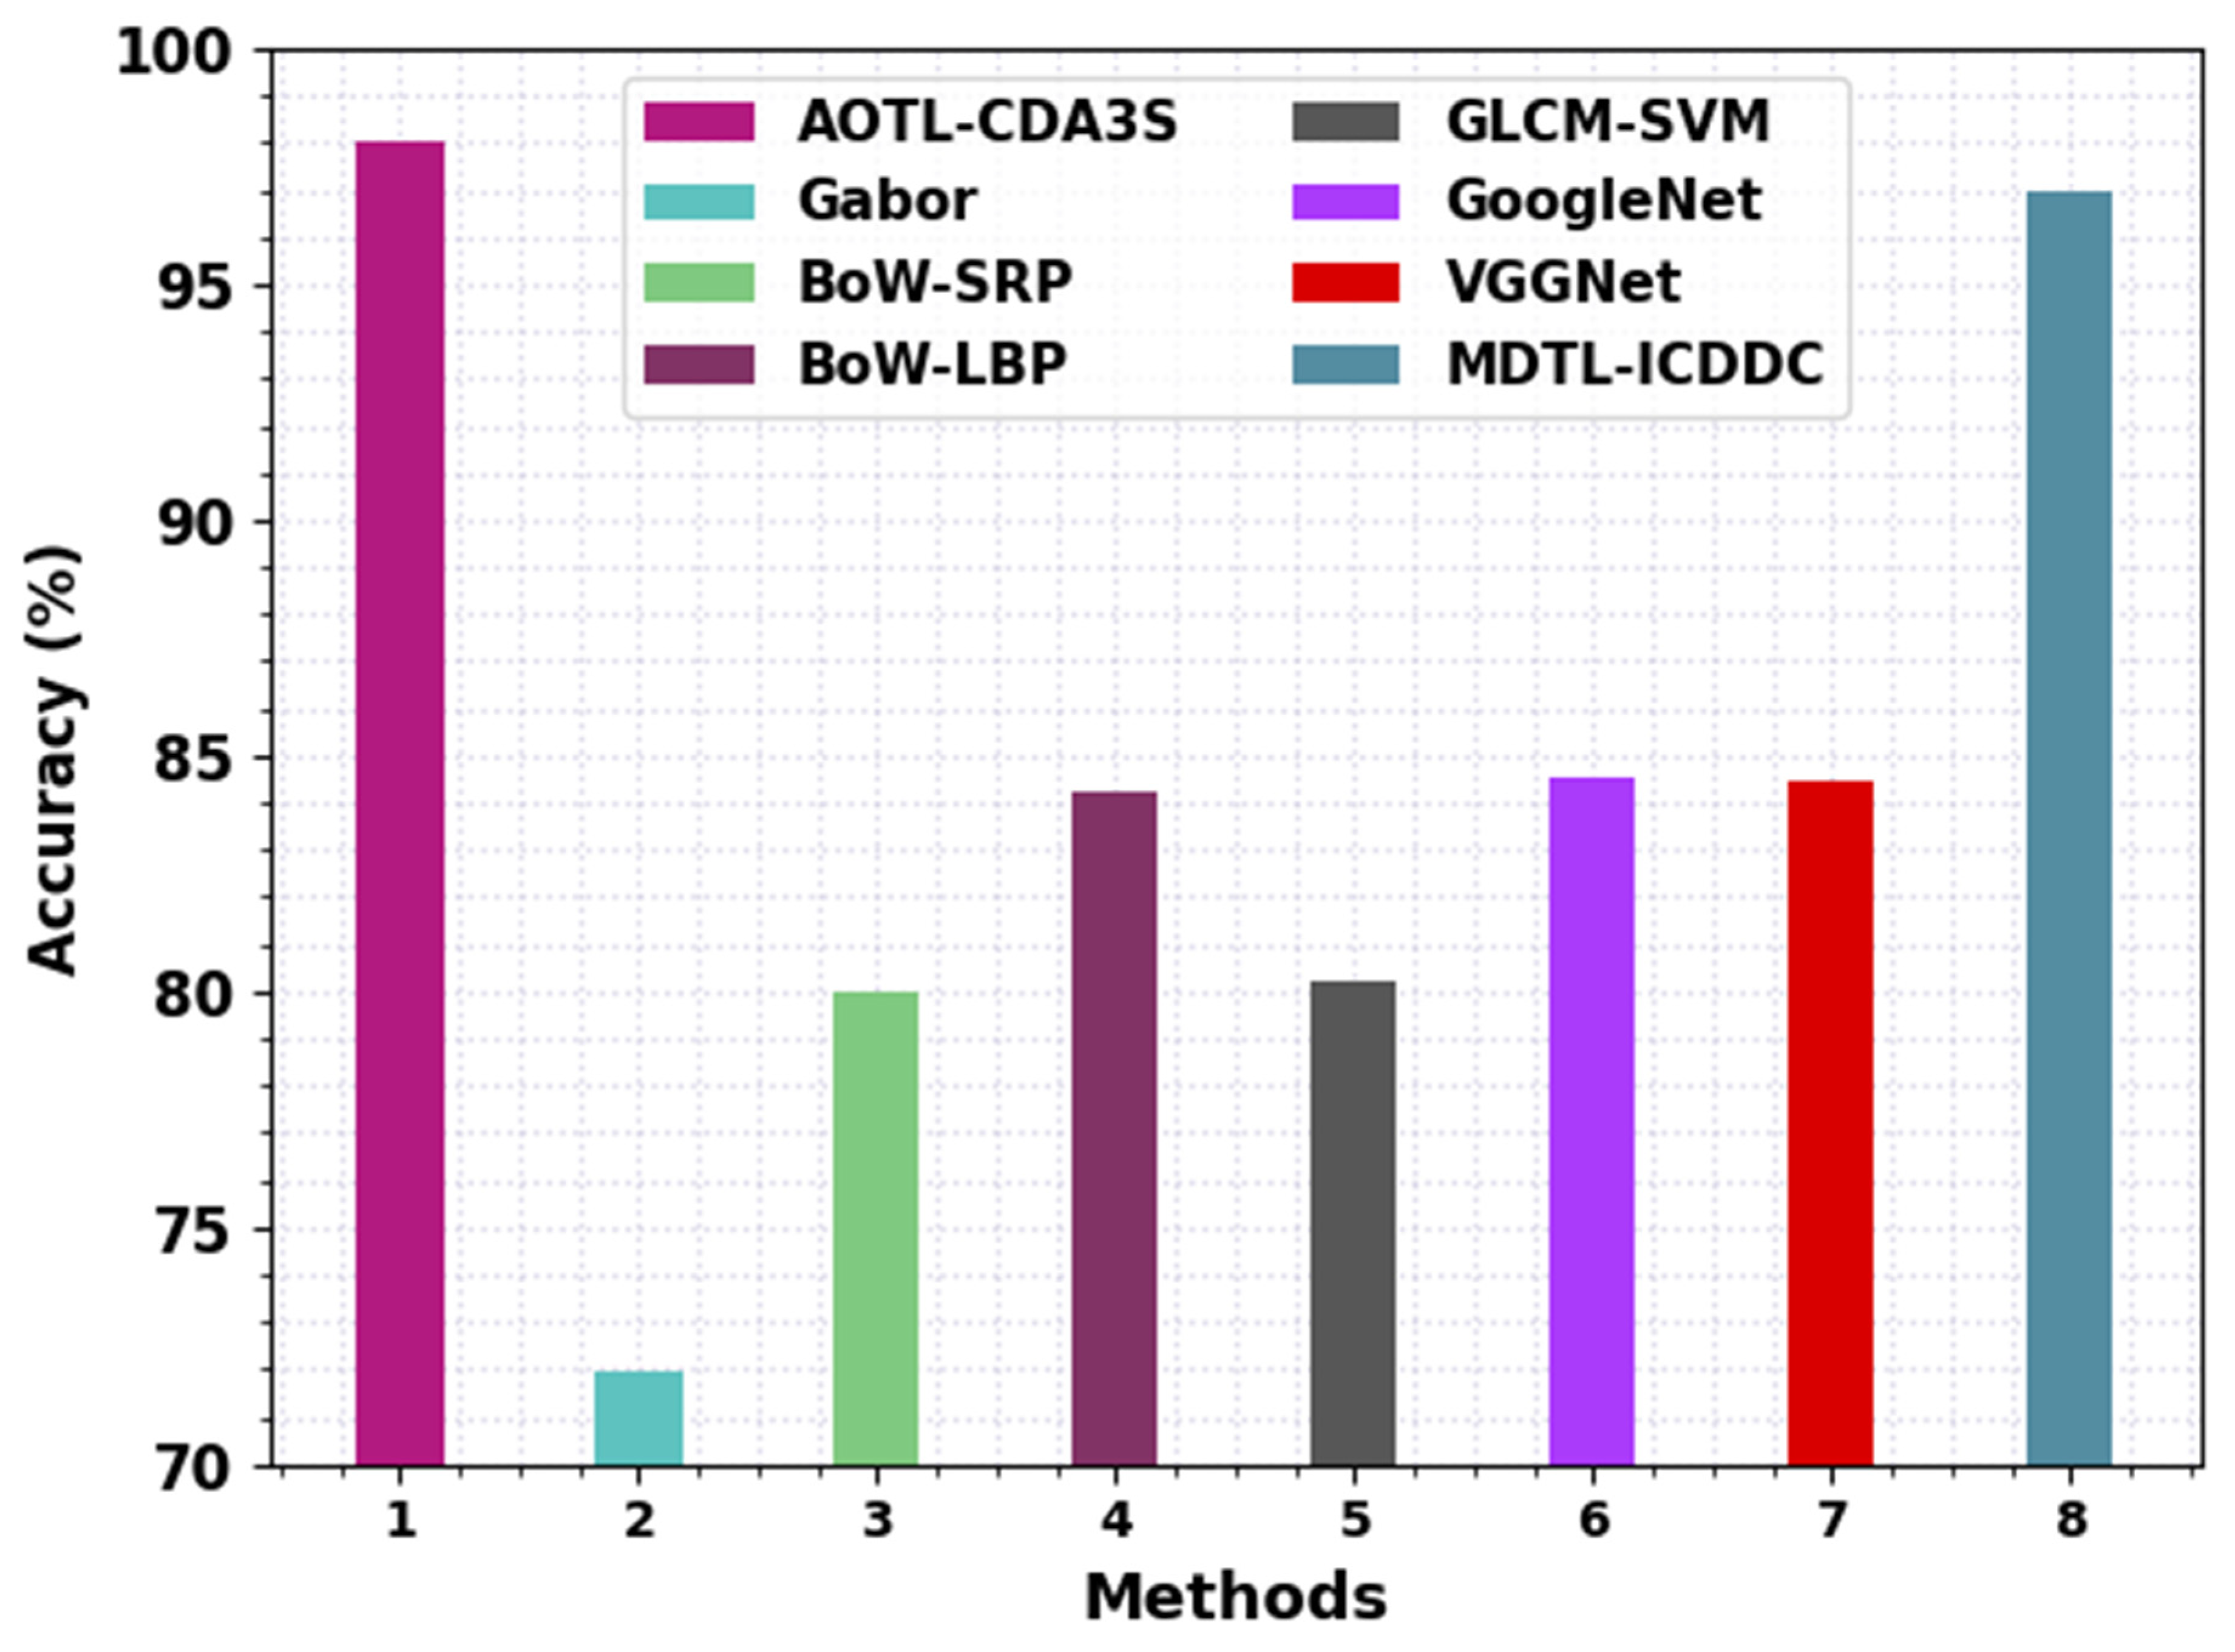
| Methods | Accuracy | Precision | Sensitivity | F-Score |
|---|---|---|---|---|
| AOTL-CDA3S | 98.00 | 96.11 | 95.87 | 98.66 |
| Gabor | 71.95 | 61.88 | 61.84 | 61.78 |
| BoW-SRP | 79.95 | 68.25 | 67.75 | 68.32 |
| BoW-LBP | 84.26 | 74.36 | 74.37 | 74.74 |
| GLCM-SVM | 80.20 | 75.57 | 73.63 | 87.99 |
| GoogleNet | 84.51 | 83.16 | 84.94 | 80.92 |
| VGGNet | 84.49 | 85.72 | 82.74 | 84.76 |
| MDTL-ICDDC | 96.94 | 93.24 | 93.11 | 93.29 |
Publisher’s Note: MDPI stays neutral with regard to jurisdictional claims in published maps and institutional affiliations. |
© 2022 by the authors. Licensee MDPI, Basel, Switzerland. This article is an open access article distributed under the terms and conditions of the Creative Commons Attribution (CC BY) license (https://creativecommons.org/licenses/by/4.0/).
Share and Cite
Al Duhayyim, M.; Alabdulkreem, E.; Tarmissi, K.; Aljebreen, M.; El Khier, B.S.I.A.; Zamani, A.S.; Yaseen, I.; I. Eldesouki, M. Aquila Optimization with Transfer Learning Based Crowd Density Analysis for Sustainable Smart Cities. Appl. Sci. 2022, 12, 11187. https://doi.org/10.3390/app122111187
Al Duhayyim M, Alabdulkreem E, Tarmissi K, Aljebreen M, El Khier BSIA, Zamani AS, Yaseen I, I. Eldesouki M. Aquila Optimization with Transfer Learning Based Crowd Density Analysis for Sustainable Smart Cities. Applied Sciences. 2022; 12(21):11187. https://doi.org/10.3390/app122111187
Chicago/Turabian StyleAl Duhayyim, Mesfer, Eatedal Alabdulkreem, Khaled Tarmissi, Mohammed Aljebreen, Bothaina Samih Ismail Abou El Khier, Abu Sarwar Zamani, Ishfaq Yaseen, and Mohamed I. Eldesouki. 2022. "Aquila Optimization with Transfer Learning Based Crowd Density Analysis for Sustainable Smart Cities" Applied Sciences 12, no. 21: 11187. https://doi.org/10.3390/app122111187