Article

Geochemical Characterization of Groundwater in the Confined and Unconfined Aquifers of the Northern Italy

BiGeA—Biological, Geological and Environmental Sciences Department, Alma Mater Studiorum, University of Bologna, Via S. Alberto 163, 48123 Ravenna, Italy
*
Author to whom correspondence should be addressed.
Appl. Sci. 2022, 12(15), 7944; https://doi.org/10.3390/app12157944
Submission received: 1 June 2022 / Revised: 18 July 2022 / Accepted: 20 July 2022 / Published: 8 August 2022
(This article belongs to the Section Environmental Sciences)

Abstract

:
Having an accurate and easily accessible geochemical database is crucial for a correct groundwater management. Here, for the first time in Italy, chemico-physical data of groundwater collected by different Environmental Protection Agencies during the 2018 were integrated into a single database to assess the geochemical status of a wide and complex aquifer system. Data were assembled, reformatted, corrected, homogenized, and then grouped according to the aquifer type (phreatic, semi-confined, and confined) and the sampling seasons. A total of 3671 validated samples were classified into hydrochemical facies; inorganic N compounds and trace elements were also evaluated. The water were classified mainly as Ca-HCO3 and Ca-Mg-HCO3 (90%); locally, Na-HCO3, Mg-HCO3, Ca-SO4, Na-Cl, and Ca-Cl types were detected. In the phreatic aquifers, NO3 contamination and high concentrations of Na+, K+, and NH4+ were found and linked to anthropogenic sources, such as agricultural and livestock activities. Along the Adriatic coast, Na-Cl water confirmed saltwater intrusion phenomena. Landward, evaporitic rocks dissolution, and the upconing of relict marine water explained high EC, Na+, K+, Cl, and SO42− concentrations. The dissolution of Fe-Mn oxide-hydroxides coupled with organic carbon oxidation under reducing environment justified high NH4+, Fe, Mn, and As recorded in the semi-confined and confined aquifers.

1. Introduction

Despite the increasing investment in the expansion of open water data and the incredible amount of freely available water data provided by the different environmental agencies and institutions in charge of surface and groundwater monitoring within countries, there are still many obstacles of having available homogeneous and integrated water databases [1,2]. The data quality depends on their own completeness, accuracy, traceability (of dataset creation and updates), contemporaneity, validation, compliance (as with unified metadata standards), and understandability [3].
The availability of long-term water datasets is important to reveal important patterns, which allow trends, cycles, and pollution events to be identified [4]. The benefits ascribed to long-term water quality databases range from scientific advancement, improved government and governance (i.e., better transparency, accountability, and decision-making processes), and operational and technical efficiency (i.e., improved services, identification of tempestive solutions).
With the enactment of the Italian legislation on water resources (D.Lgs 152/06 and related updates, [5]), in transposition of the Water Framework Directive (WFD, Dir. 2000/60/EC, [6]), monitoring of water bodies is mandatory to assess their environmental quality status. The groundwater monitoring network in Italy is not centralized and all monitoring activities (identification of networks, choice of analytical pools, and monitoring frequencies) and groundwater sample analysis are in charge of each Italian region and the related Regional Agencies for Environmental Protection (ARPAs). The ARPAs are responsible for the quantitative and qualitative monitoring of surface and groundwater. Sampling procedures, analysis methods, sampling material to be used are regulated by D.Lgs 152/2006 [5] and analyses must be performed by accredited laboratories. Data are collected in many ways and by using different protocols; the choice of sampling frequencies and analytical methods is defined by each region based on the characteristics of the territory, the resources vulnerability, pressures, impacts, and the availability of financial resources. Generally, at least two samplings are carried out per station, one in spring and one in autumn. ARPAs databases are proposed as usable and accessible tools, whose contents can be freely interrogated and downloaded. However, data organized in individual databases create the fragmentation of information and so far, a national geochemical database, which can be implemented overt time according to shared rules and standards, does not exist in Italy.
These actions generated and still generate a huge amount of data, which is often commented only in relation to water quality standards and relative thresholds, but that contains precious additional information that can be extracted. However, some critical issues arise when working with large heterogeneous datasets collected without shared protocols: data harmonization and cleaning, and long revision processes are required.
The Po Plain selected as study area of this work is one of the largest (about 48,000 km2 wide) alluvial plains in Europe and the largest of Italy, and it represents the most important groundwater reservoir of the Northern Italy because of its size, the feature of its deposits, and its possibility to recharge. The entire Po Plain and surrounding Alps and Apennines belong to five separate administrative entities called Regions; specifically Piedmont, Lombardy, Emilia Romagna, Veneto and Friuli-Venezia Giulia that individually manage and monitor their owned water resources. In this territory coexists some of the most famous and populated cities of Italy (e.g., Milan, Turin, Bologna, Venice, etc.,), huge industrial settlements, natural areas, and agricultural activities. All of these activities interact and influence surface and groundwater quality and quantity.
From a geochemistry point of view, groundwater has spatial differences and are influenced by natural geochemical processes, i.e., water–rock interactions, mixing with water from different origins, and human activities [7,8,9]. Due to the increasing water demand, as well as the alteration of pluviometric regimes because of climate change, much attention is paid to groundwater and its pollution around the world, especially in arid and semiarid conditions [10,11,12]. Although the Po Plain is under temperate climate, annual precipitation projections for the second part of the century suggest an overall drying for most of the Mediterranean basins [13]. In light of this, it is crucial to characterize groundwater quality and distinguish the effects of natural processes and impacts of anthropogenic activities to better understand the regional hydrochemical evolution and improve sustainable water resource management.
This work aims to integrate 2018 groundwater databases of the Northern Italian ARPAs (Piedmont, Lombardy, Veneto, Friuli-Venezia Giulia, and Emilia-Romagna) into a single database and assess the geochemical processes in the confined, semi-confined, and phreatic aquifers of the Northern Italy. In addition, this study attempts to build the groundwater database of the Northern Italy and highlights and discusses the main issues encountered during the data integration and harmonization processes and investigates more in detail some interesting or critical areas in the Po River plain.

2. Material and Methods

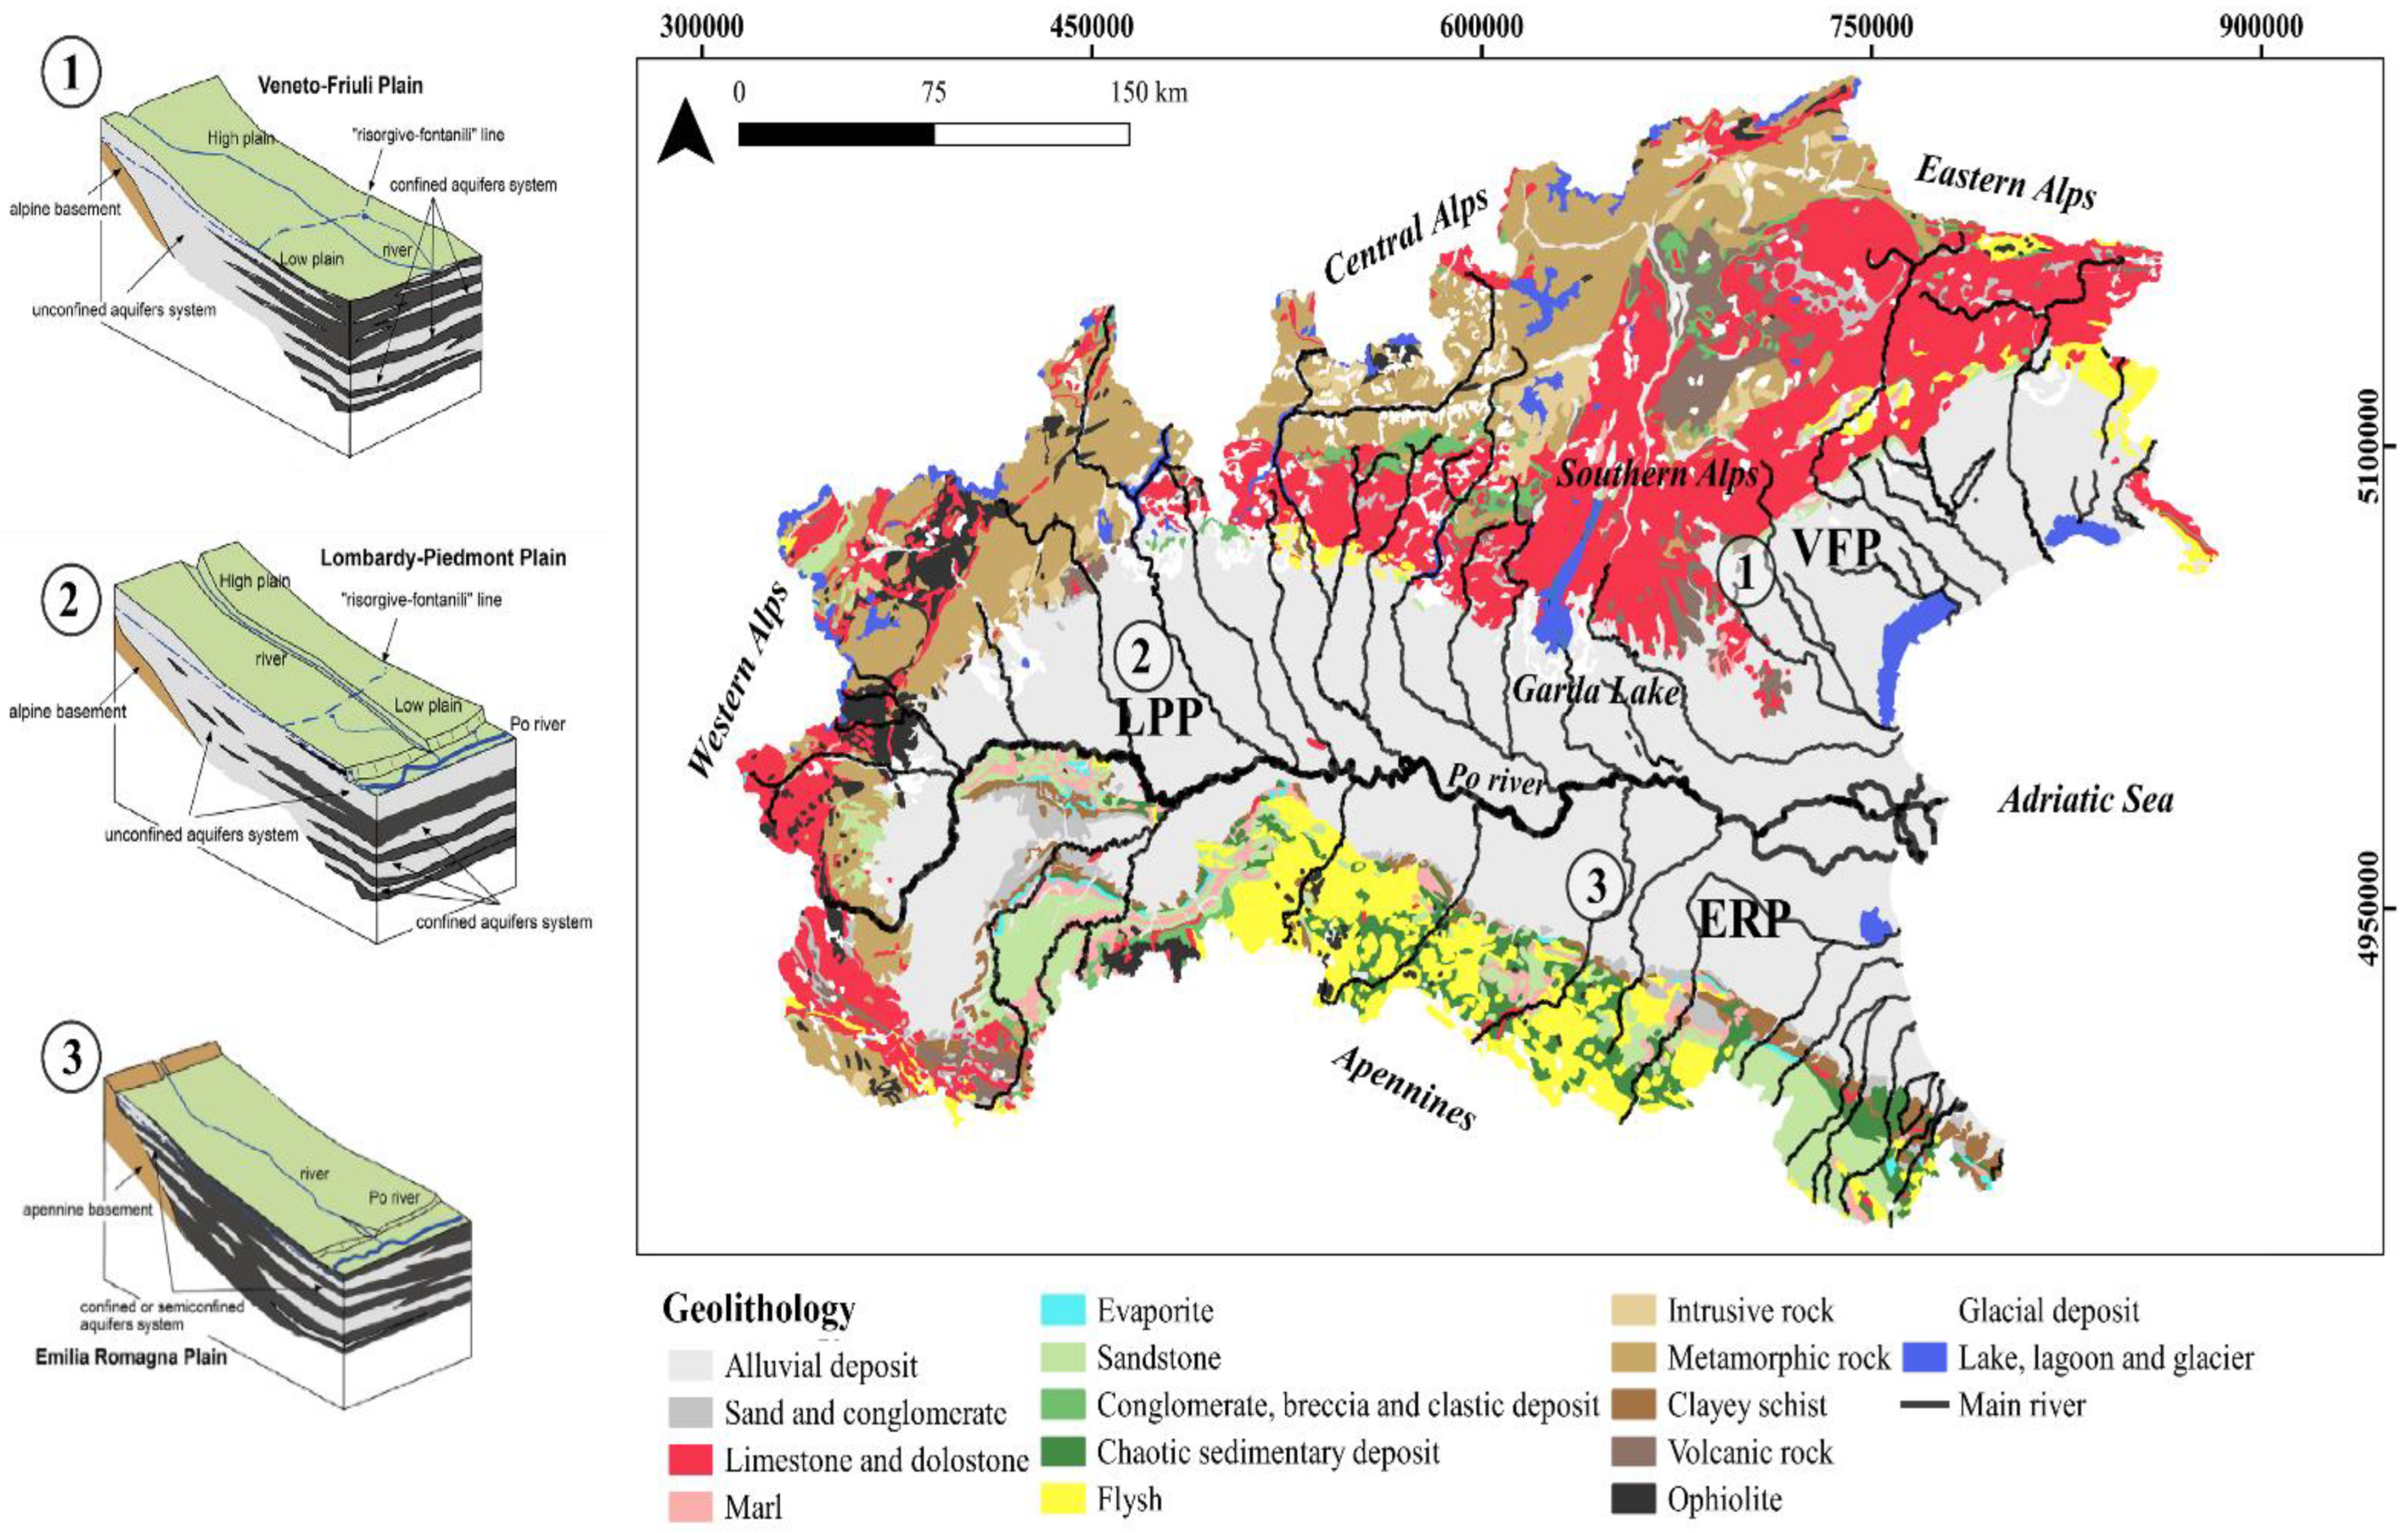
2.1. Geological Setting

The study area comprises the Po Plain, which represents the surface expression of a syntectonic sedimentary wedge framed between the Alps to the north and the Apennines to the south (Figure 1) [14]. The Po plain is drained by the Po River, the longest Italian river (652 km) that flows eastward from the western Alps into the Adriatic Sea (Figure 1). The Po River drainage basin is about 75,000 km2 [15] and includes about 141 tributaries emerging from the surrounding Apenninic and Alpine chains. These tributaries deliver water and sediment to the Po River from south and north, respectively (Figure 1). In the western sector of the Po drainage basin, including the Western Apennines, Western and Central Alps, crystalline-metamorphic and ophiolite complexes crop out extensively (Figure 1). On the other hand, Southern and Eastern Alps are mostly characterized by carbonate (limestone and dolostones) outcrops (Figure 1). The majority of the sediment delivered by the Apenninic rivers derives from Cretaceous to Pliocene sedimentary successions dominated by chaotic clays, turbidites (sandstone/marl alternations), and sandstones [16]. Important outcrops composed of evaporites (i.e., gypsum) from the Gessoso-Solfifera Formation are also present in the Apennines [17] (Figure 1).
The Po Plain can be subdivided into minor alluvial sectors as the easternmost Venetian-Friulian Plain (VFP in Figure 1), which was formed by alluvial systems external to the Po drainage basin [18]; the Lombardy-Piedmont Plain (LPP in Figure 1), west of the Garda Lake; and the Emilia-Romagna Plain (ERP in Figure 1), south of the Po River (Figure 1).
The Po Basin is filled with Plio-Quaternary sediments, up to 8 km-thick in the main depocenters south to the Po River, and thin northward [19,20]. Beneath the Venetian plain, thicknesses are about 1 km, and less than 500 m in the Friulian and Lombard areas [21]. The sedimentary infill is characterized by a shallowing-upward tendency, from Pliocene deep-marine to Quaternary shallow-marine and continental deposits [22,23]. Along the Po Basin, Late Quaternary strata show a vertical cyclic change in fluvial-channel stacking pattern (i.e., amalgamated fluvial-channel bodies vs. individual fluvial-channel deposits within mud-dominated strata) reflecting the alternation of glacial-interglacial periods during the Middle-Late Pleistocene [24]. Beneath the coastal plains, equivalent glacio-eustatic evidence on the stratigraphic architecture is documented by the cyclic alternation of vertically-stacked coastal to marine (interglacial) and continental (glacial) deposits [25,26,27,28]. The Holocene succession, in the Po coastal plain consists of a transgressive-regressive sedimentary wedge of coastal to marine sediments overlying fully alluvial Pleistocene deposits [29]. By contrast, the proximal and more superficial portion of the Po Plain is mainly characterized by modern river courses associated with abandoned fluvial channels and ribbon-shaped fluvial ridges, commonly elevated several meters above the adjacent floodplain [30].
Large alluvial fans, up to 3000 km2, composed of Late Pleistocene fluvioglacial deposits crop out extensively in the VFP and LPP [31,32]. Their piedmont sectors are generally characterized by gravel deposits, whereas the distal portion is generally composed of finer-grained materials. Alluvial fans of minor extent are also present in the ERP, close to the Apenninic margin [33,34]. These alluvial fans mainly consist of amalgamated gravel bodies that thin out toward more distal sectors, where gravels are progressively replaced by fluvial channel sands and floodplain silty-clays [35].

2.2. Hydrogeological Setting

The cyclic alternation of vertically stacked coarse-grained strata (fluvial to coastal) and finer-grained sediments (alluvial to marine), which characterizes the Late Quaternary succession of the Po Plain, has important implication from a hydrogeological point of view [18]. The aquifer system consists of shallow, unconfined aquifers and deeper, semi-confined and confined aquifers. The main aquifer system is mostly unconfined and consists of coarse-grained sedimentary units, 30 m in thickness and made of amalgamated gravel and sand bodies [26,36,37,38]. Fine-grained (silts and clays) units, with thickness ranging between about 5 and 50 m form the main aquiclude and/or aquitards [39,40,41]. Moving toward the coastline, some continental alluvial deposits (mostly clay and silt) are laid upon the coarse-grained sedimentary units, making the aquifer locally semi-confined, where recharge and discharge are reduced but can still occur (hydrogeological setting 3 in Figure 1). Then, as reported by Martinelli et al. (2018) [42], downwards in the Late Quaternary succession of the Po Plain several confined aquifers are recognized within the entire hydrogeological system.
Figure 1. Geolithology of the Northern Italy (from Geological map of Italy, 1:500,000 scale, Italian Geoportal http://www.pcn.minambiente.it/mattm/en/, accessed on 22 April 2022). The hydrogeological settings 1–3 are from Martinelli et al. (2018) [42], modified.
Applsci 12 07944 g001
Topographically high alluvial fans located at the more proximal locations of the Po Plain, at the margin of both mountain chains, are characterized by generally high permeability (up to 1–10 × 10−3 m/s of gravel and sand layers). These deposits represent the main direct recharge area of the entire hydrogeological system, including the deepest aquifers [31]. Moving toward increasingly lower and more distal portions of the alluvial plains, coarse-grained sediments are replaced by finer-grained deposits [32,35], with hydraulic conductivities in the order of 1–10 × 10−5 m/s. Here, the hydrogeological setting is characterized by the presence of multi-layer aquifers with shallow phreatic aquifers that are generally discontinuous and poorly connected to underlying ones (Figure 1). However, despite their low topographic gradient, relatively high permeability coefficients have been documented in some areas in the western Po Plain sector [38,42] and in the ERP coast (“shallow coastal aquifers” in Giambastiani et al., 2013; [43]).
The higher hydraulic gradients are recorded in proximity of the Alpine and Apennine chains, in alluvial fan area (“high plain” in Figure 1). Typical hydraulic gradients of these areas vary from 8‰ to 10‰ in the westernmost sectors, and from 4‰ to 8‰ in other portions of the Po Plain such as the VFP [42]. Lower hydraulic gradients (normally ranging from 1‰ to 4‰) characterize the more distal (“low plain” in Figure 1) aquifers along the Po River. The lowest values, ranging between 0.2 and 1‰, have been reported for the central-eastern Po Plain [44,45].
As the transition from higher to lower alluvial sectors is accompanied by the decrease in the hydraulic gradient and in grain size, this portion of the study area shows the emergence of peculiar lowland springs (fontanili), especially in the Veneto-Friulan plain and in the orographic left of the Po River. The “fontanili line” starts in the most western part of the Friuli plain and continues almost continuously to Piedmont; at the foothills of the Apennines this phenomenon is much more sporadic and occurs near Piacenza, Parma, Modena and east of Bologna [46,47,48].
The water level depth in shallow aquifers is highly variable in the Po Plain: minimum values of 1–5 m b.g.l. are recorded in the central sectors, whereas it may reach 10 m b.g.l. and up to 50 m b.g.l., close to Apenninic and Alpine margins, respectively. The groundwater flow in the unconfined aquifers is directed toward the Po River (i.e., oriented N–S in the pre-alpine sector and S–N closer to the Apennines; Figure 1). In the central western sector, the flow is strongly controlled by the draining action of the Po River and its tributaries, whereas, in the eastern sector, the Po River is not in hydraulic connection with groundwater [42].

2.3. Database Design

In Italy the Regional Environmental Protection Agencies (ARPA) are the institutions in charge of monitoring of the quantity and quality of surface and groundwater bodies, according to European (Directive 2000/60/EC, Water Framework Directive WFD, [6]), and national directives [5,49,50]. The monitoring of the quantitative state is carried out by measuring the piezometric levels with reference to the mean sea level; while the monitoring of the chemical status is based on the analysis of: pollutants subject to quality standards, identified at EU level (Annex III of D.Lgs 30/09, Table 2, [49]); and element subject to threshold values, identified at national level (Annex III of D.Lgs 30/09, Table 3, [49]). The decree provides indications on minimum sampling frequencies depending on the characteristics of the water body, the base parameters, and some additional ones to be controlled.
In this study we used the 2018 databases of qualitative and quantitative groundwater monitoring provided by the ARPAs of Piedmont (hereinafter referred to as PIE), Lombardy (LOM), Veneto (VEN), Friuli-Venezia Giulia (FVG), and Emilia-Romagna (EMR) through their OpenData portals. The databases were integrated with information of sampling stations (well or spring, coordinates, etc.,), related aquifer (phreatic, semi-confined, or confined), and monitoring depths.
Since each agency provided data according to its own standards (coordinate system, detection limits of analytical protocols, concentration units, and monitoring time interval), a great effort was dedicated to data homogenization and management to create an operational database describing the hydrogeochemical characterization of the 2018 groundwater of the Po and Venetian-Friulian plains. The inhomogeneities in the dataset depend on the choices made by each individual ARPAs, especially as regards metals and trace elements, as established in part III D.Lgs 30/09 [49]. Table S1 in Supplementary Material shows the parameters analyzed by each Region with the relative measurement units. After the verification and cleaning processes, consisting in the eliminations of samples without clear aquifer identification or located in aquifers other than semi-confined, confined, and phreatic (i.e., colluvial and mountainous aquifers), 3671 validated samples, out of the initial 4049, were used for data analysis and map elaborations.
The water samples were analyzed by different laboratories, and therefore had different detection limits for the same analyte, both at regional and in some cases even at the provincial level, as shown in Tables S1 and S2 in Supplementary Material. Another factor that caused low homogeneity of the final database concerns the different analytical pool analyzed between regions. Specific electrical conductivity at 20 °C (EC), hardness, pH, and temperature (T) were provided by at least 4 out of 5 agencies. For the other chemical and physical characteristics, instead, data obtained were fragmentary and incomplete over the whole considered time period. Concentrations of metals and compounds of environmental interest were not homogeneously collected by the agencies; the divergence is justified by the different operational choices adopted by the agencies, as allowed by the relevant legislation (Annex III of the D.Lgs. 30/09 [49]) as shown in Table S2 of Supplementary Material.
Several authors established strategies for using values below detection limit (<D.L.) as valid data [51,52,53]. However, in the present study the management of these data was not done using the proposed methods, because the characteristics of the database were not in line with the conditions set by the authors. The first difference concerns the presence of many different D.L. for each analyte, and secondly data population of several analytes was predominantly composed by values <D.L. The adopted solutions varied according to the data considered. For each element, value with the highest number of observations was identified and all the other different values “<D.L.” were replaced with the half of the identified detection limit, according to the methods proposed by Helsel and Hirsch (2002) [51] and Harter (2006) [52].
For metals and compounds of environmental relevance (NO3, NH4+), all <D.L. values were replaced with a single arbitrary value that was two or more orders of magnitude lower than the minimum value detected by the analyses. This strategy made possible to highlight and detect on the distribution maps the stations with concentrations below D.L., although prevented their complete statistical consideration.

2.4. Data Elaboration and Interpretation

After obtaining a homogeneous database, the concentrations of major ions were used to assess the hydrochemical facies. Distributions of chemical–physical parameters, metals, and compounds of environmental interest were also analyzed and discussed in relation to the aquifer types. The aquifer type was chosen as discriminating character to assess any difference in groundwater, since it was one of the most comprehensive and homogeneous characteristics provided by all regional datasets. Data were also divided according to the sampling season (spring-summer and autumn-winter considered from now on as “warm season” and “cold season”, respectively) to assess changes over the year. Analyses were carried out on 3671 samples distributed as follows:
  • 2243 in phreatic aquifers: 1220 for warm season, and 1023 for cold season;
  • 1149 in confined aquifers: 597 for warm season, and 552 for cold season;
  • 279 in semi-confined aquifers, equally divided between the two periods.
Considering the difficulty to distinguish between confined and semi-confined aquifers in the complex multilayer hydrogeological setting of the Po Plain (Figure 2), we decided to treat the data from confined and semi-confined aquifers together both for the statistical analysis and the map production.
In order to test for statistically significant differences between warm and cold seasons sub-populations and between different aquifer type, the Kruskal–Wallis nonparametric test was applied to our database [54,55].
The samples were classified according to the chemical and physical parameters (electrical conductivity-EC; water hardness; temperature). Boxplots for all components were created to assess the effects of aquifer type. Hydrochemical facies were assessed based on the concentrations of main dissolved ions using the Langelier–Ludwig diagram [56]. The ratios Na+/K+, Ca2+/Mg2+, SO42−/Cl were also calculated to distinguish the dominant species. The distributions of the associated ion pairs Ca2+-HCO3, Na+-Cl Mg2+-SO42−, K+-NO3 were defined to assess the origin of the main ions and the lithological effect on groundwater quality.
In order to investigate distributions of metals and compounds of environmental interest, three criteria of selection were applied:
Based on these criteria, the selected elements were: NO3, NH4+, As, Fe, and Mn.
Elaboration of all spatial distribution maps of groundwater parameters and components were carried out by QGIS software after the merge and conversion into a uniform coordinate system (WGS84/UTM zone 32N, EPSG: 32632).

3. Results and Discussion

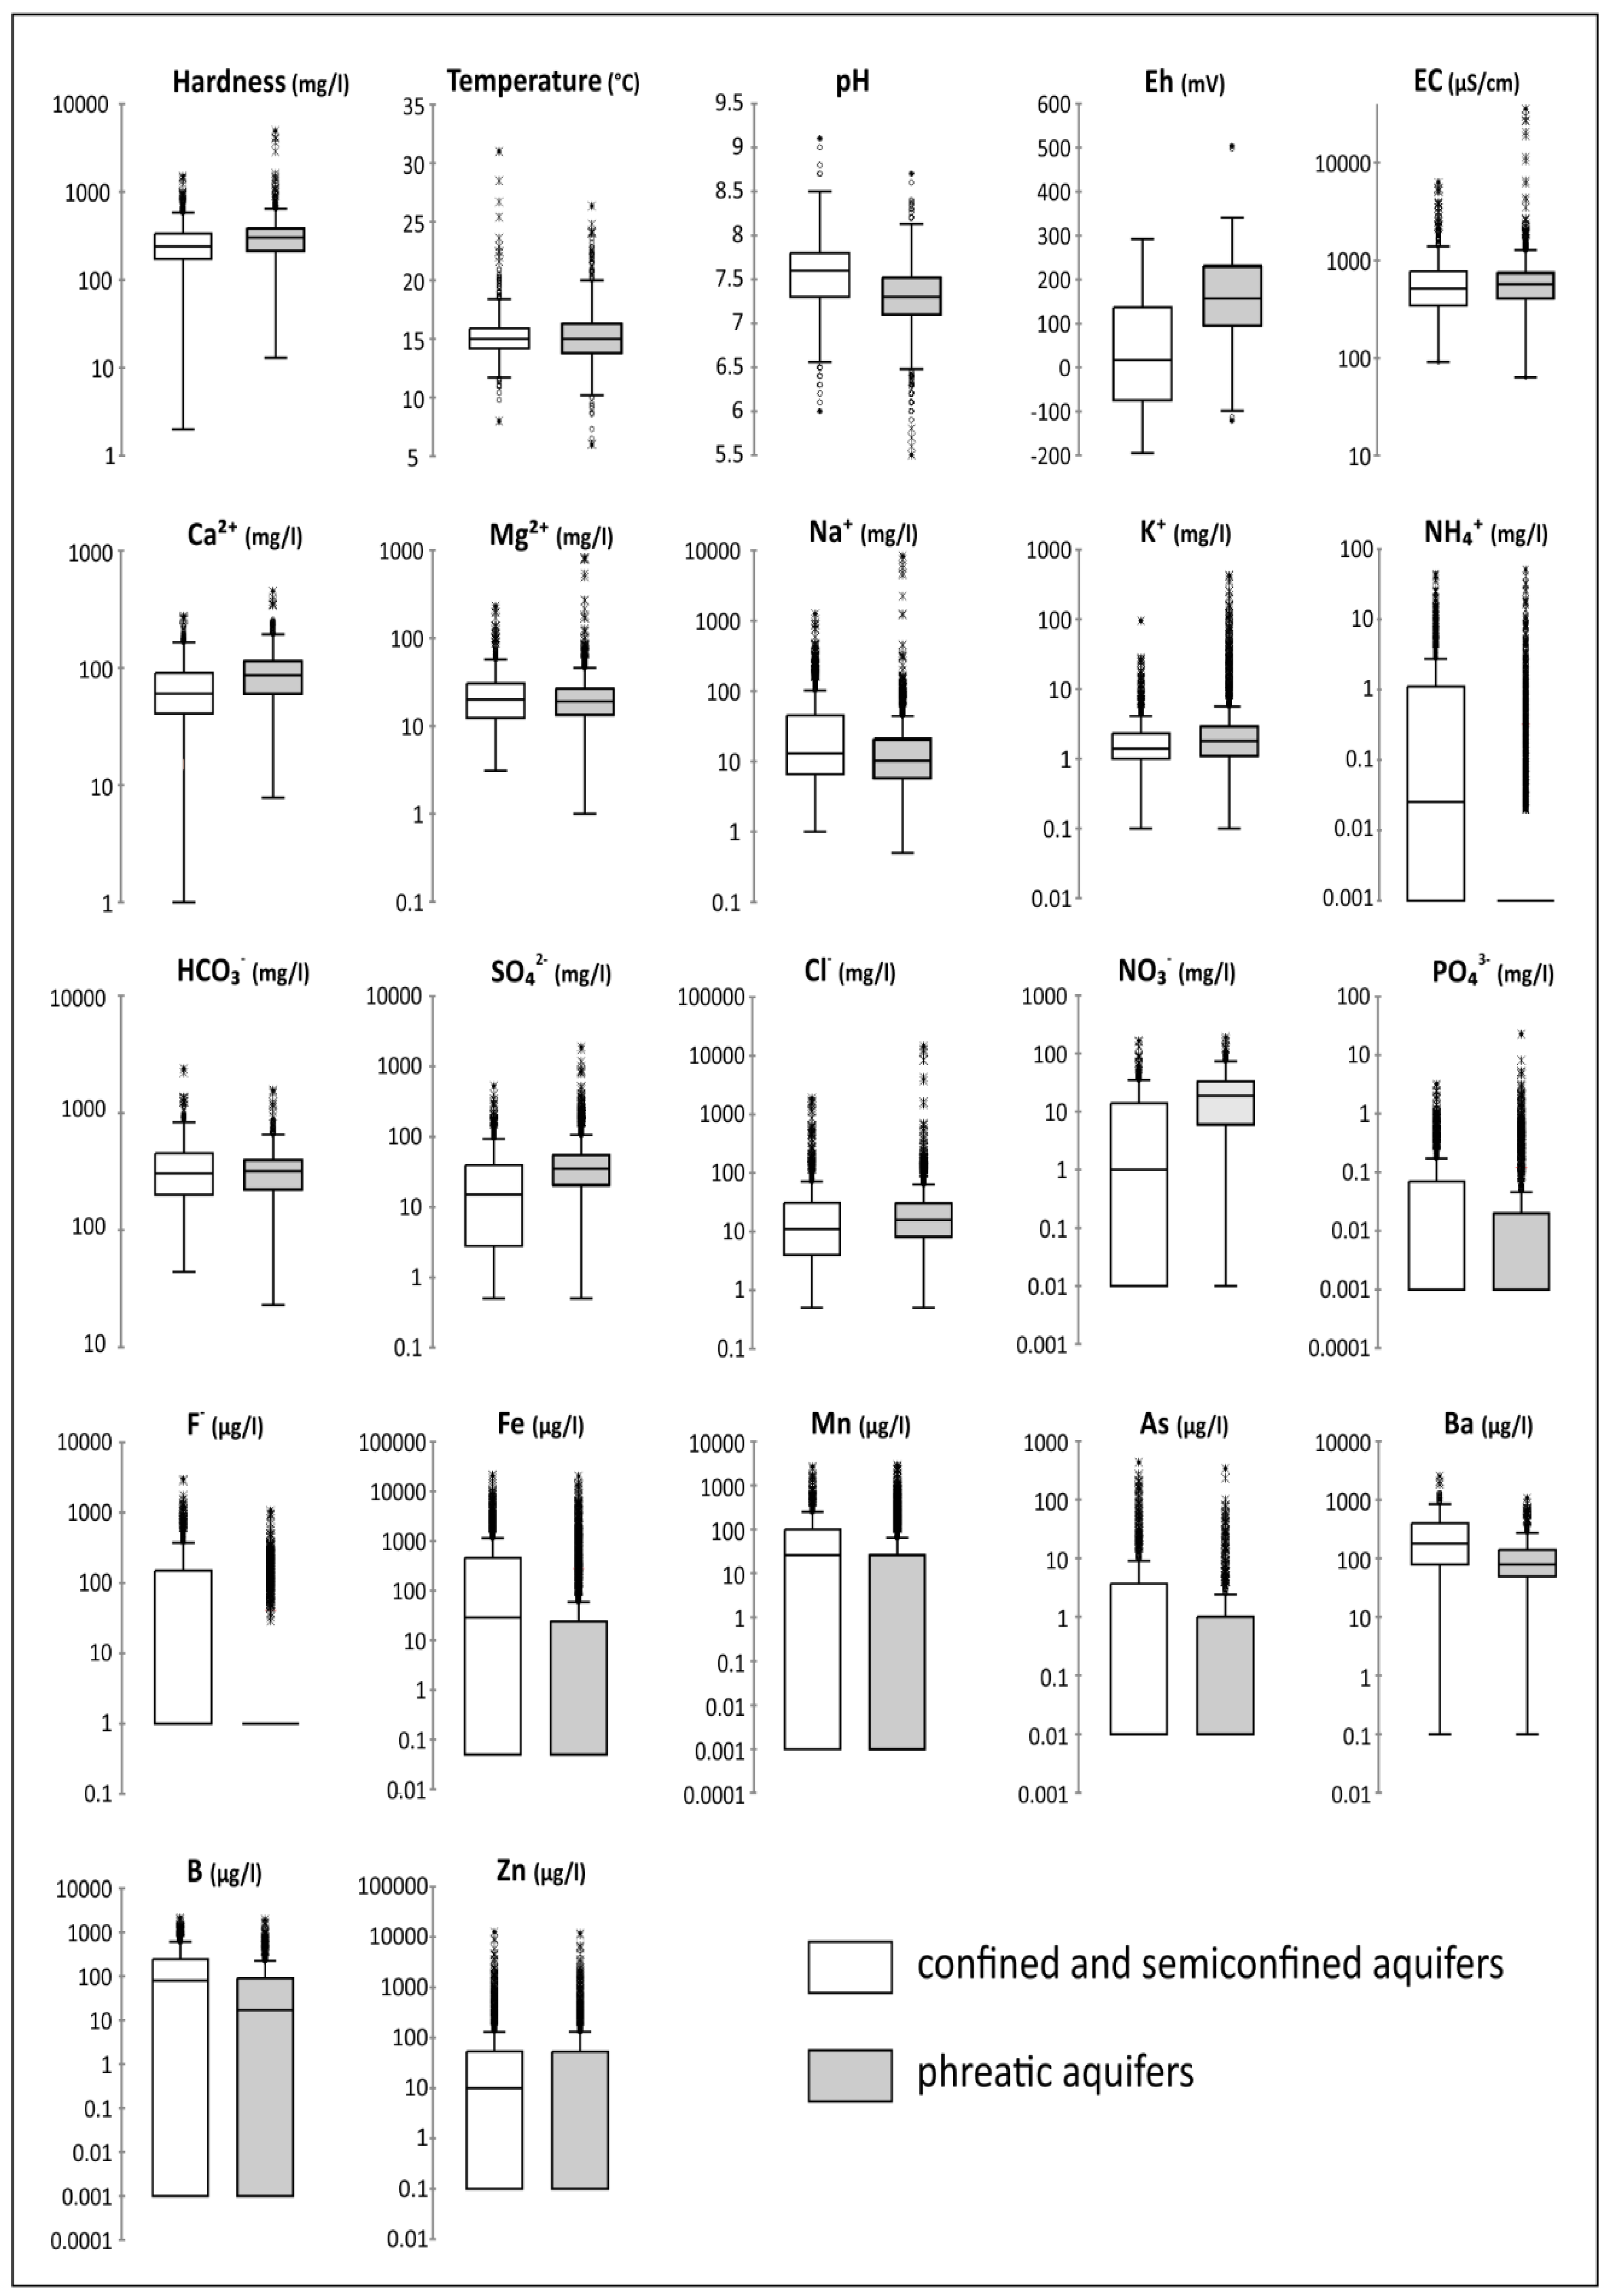
3.1. Groundwater Dataset

Table 1 shows the main descriptive statistics and Figure 2 the boxplots of all physic-chemical parameters and ions concentrations grouped according to the aquifer type. For completeness, the descriptive statistic of the entire database is reported in Table S1 of the Supplementary Material.
As can be seen in Table 1, the Kruskal–Wallis non-parametric test on the aquifer types shows a statistically significant differences for most chemical and physical parameters and these will be discussed in the following sections. On the other hand, the same test performed on warm and cold season datasets (Tables S3 and S4 in Supplementary Material) points out that the only statistically significant differences regard temperature and pH in the confined and semi-confined aquifers, while Eh and PO43− in the phreatic aquifers.
Generally, temperature values are slightly higher in the summer season and in the confined aquifers, as it is expected. Values range between 6.0 °C and 31.0 °C, with 98% of samples classified as cold water, and 2% as thermal water. As reported in Table S3 in Supplementary Material, the populations analyzed show the same median of 15.0 °C, and most values are between 13.7 °C and 16.4 °C in line with the Italian patterns of shallow groundwater temperatures [57]. Anomalous values above 20.0 °C were found in all aquifer types, regardless of the season. The differences found in most of the data are of the order of 1/10 of a degree, so effects related to seasonality or aquifer type cannot be established with certainty.
The distribution of pH values highlights the presence of an effect due to the type of aquifer (Table 1). The pH values increase from acidic and neutral condition in the phreatic aquifers to mean value of 7.5 and maximum of 9.1 in the confined aquifers. The median of the phreatic aquifers (7.3) is equal to the 25th percentile of the other population.
The recorded values are typical for groundwater; neutral and slightly acid pH values are found in the phreatic and shallow aquifers due to the contribution of meteoric water (meltwater and precipitation) that infiltrates and percolates. The pH varies depending on the composition of rocks and sediments that surround the pathway of the recharge water infiltrating to the ground and varies depending on the residence time. The longer the contact time, as in the confined aquifers, the larger the effect of the rock chemistry on the composition and on the groundwater pH. Dissolution of carbonate-rich rocks (limestones and marbles) and silicate weathering result in an increase of pH.
The water of the Po plain have a hardness ranging from 13 mg/L to 4950 mg/L (Table 1). In general, medium hard water prevail (32%), followed by hard water (29%), moderately hard (18%), and soft water (12%). The 7% of the samples analyzed had very high hardness values, exceeding 540 mg/L, which can be easily identified as the outliers in the distributions (Figure 2). There is a slight effect linked to the type of aquifer analyzing the different populations: in confined and semi-confined aquifers, low and medium hard water prevail, while in phreatic aquifers medium hard and hard water dominate. In phreatic aquifers located along the coastal areas of the plain, the absolute highest values of over 2000 mg/L are recorded. As can be seen in Figure 3a,b, water ranging from very soft to medium hard are found in PIE and in the western part of the plain. On the contrary, EMR water tend to be harder, with water from very to extremely hard and values that exceed 2000 mg/L along the Ravenna and Ferrara coastal areas, where the highest EC values are recorded, too (Figure 4). This different in values is related to the higher composition of carbonate rocks, sedimentary deposits, and flysch in the Apennine zone compared to the metamorphic rocks that characterize the PIE region, and volcanic rock in the north of VEN and FVG (Figure 1).
The EC referred to 20 °C shows a wide range of variation between 63 µS/cm 35,603 µS/cm (Table 1). The distribution is very non-homogeneous: most of the water are classified as medium-mineral (85%), 11% as low-mineral and 4% as mineral. In this case there are no differences due to seasonality, but the populations of the analyzed aquifers are slightly different from each other (Tables S3 and S4 in the Supplementary Material). Both types of aquifers have similar EC mean and differ in the interquartile range (Figure 2), which is higher for the confined aquifers. There are many outliers exceeding 2500 µS/cm (Figure 4). The highest EC values are recorded in the shallow unconfined coastal aquifers along the EMR coastal areas, with the maximum value of 35.6 mS/cm in the Comacchio (FE) area. Their origin can be related both to saltwater intrusion and to the presence of relict water that are well documented in this area [43,57,58,59]. High values recorded in the EMR Apennine zone are due to dissolution of evaporite formations present in that area (Figure 1, Gessoso-Solfifera and Anidriti di Burano formations) [60].
In the confined aquifers (Figure 4b) the highest values are found mainly along the Po River course and the EMR coastline, corresponding to extremely hard water shown in Figure 3.

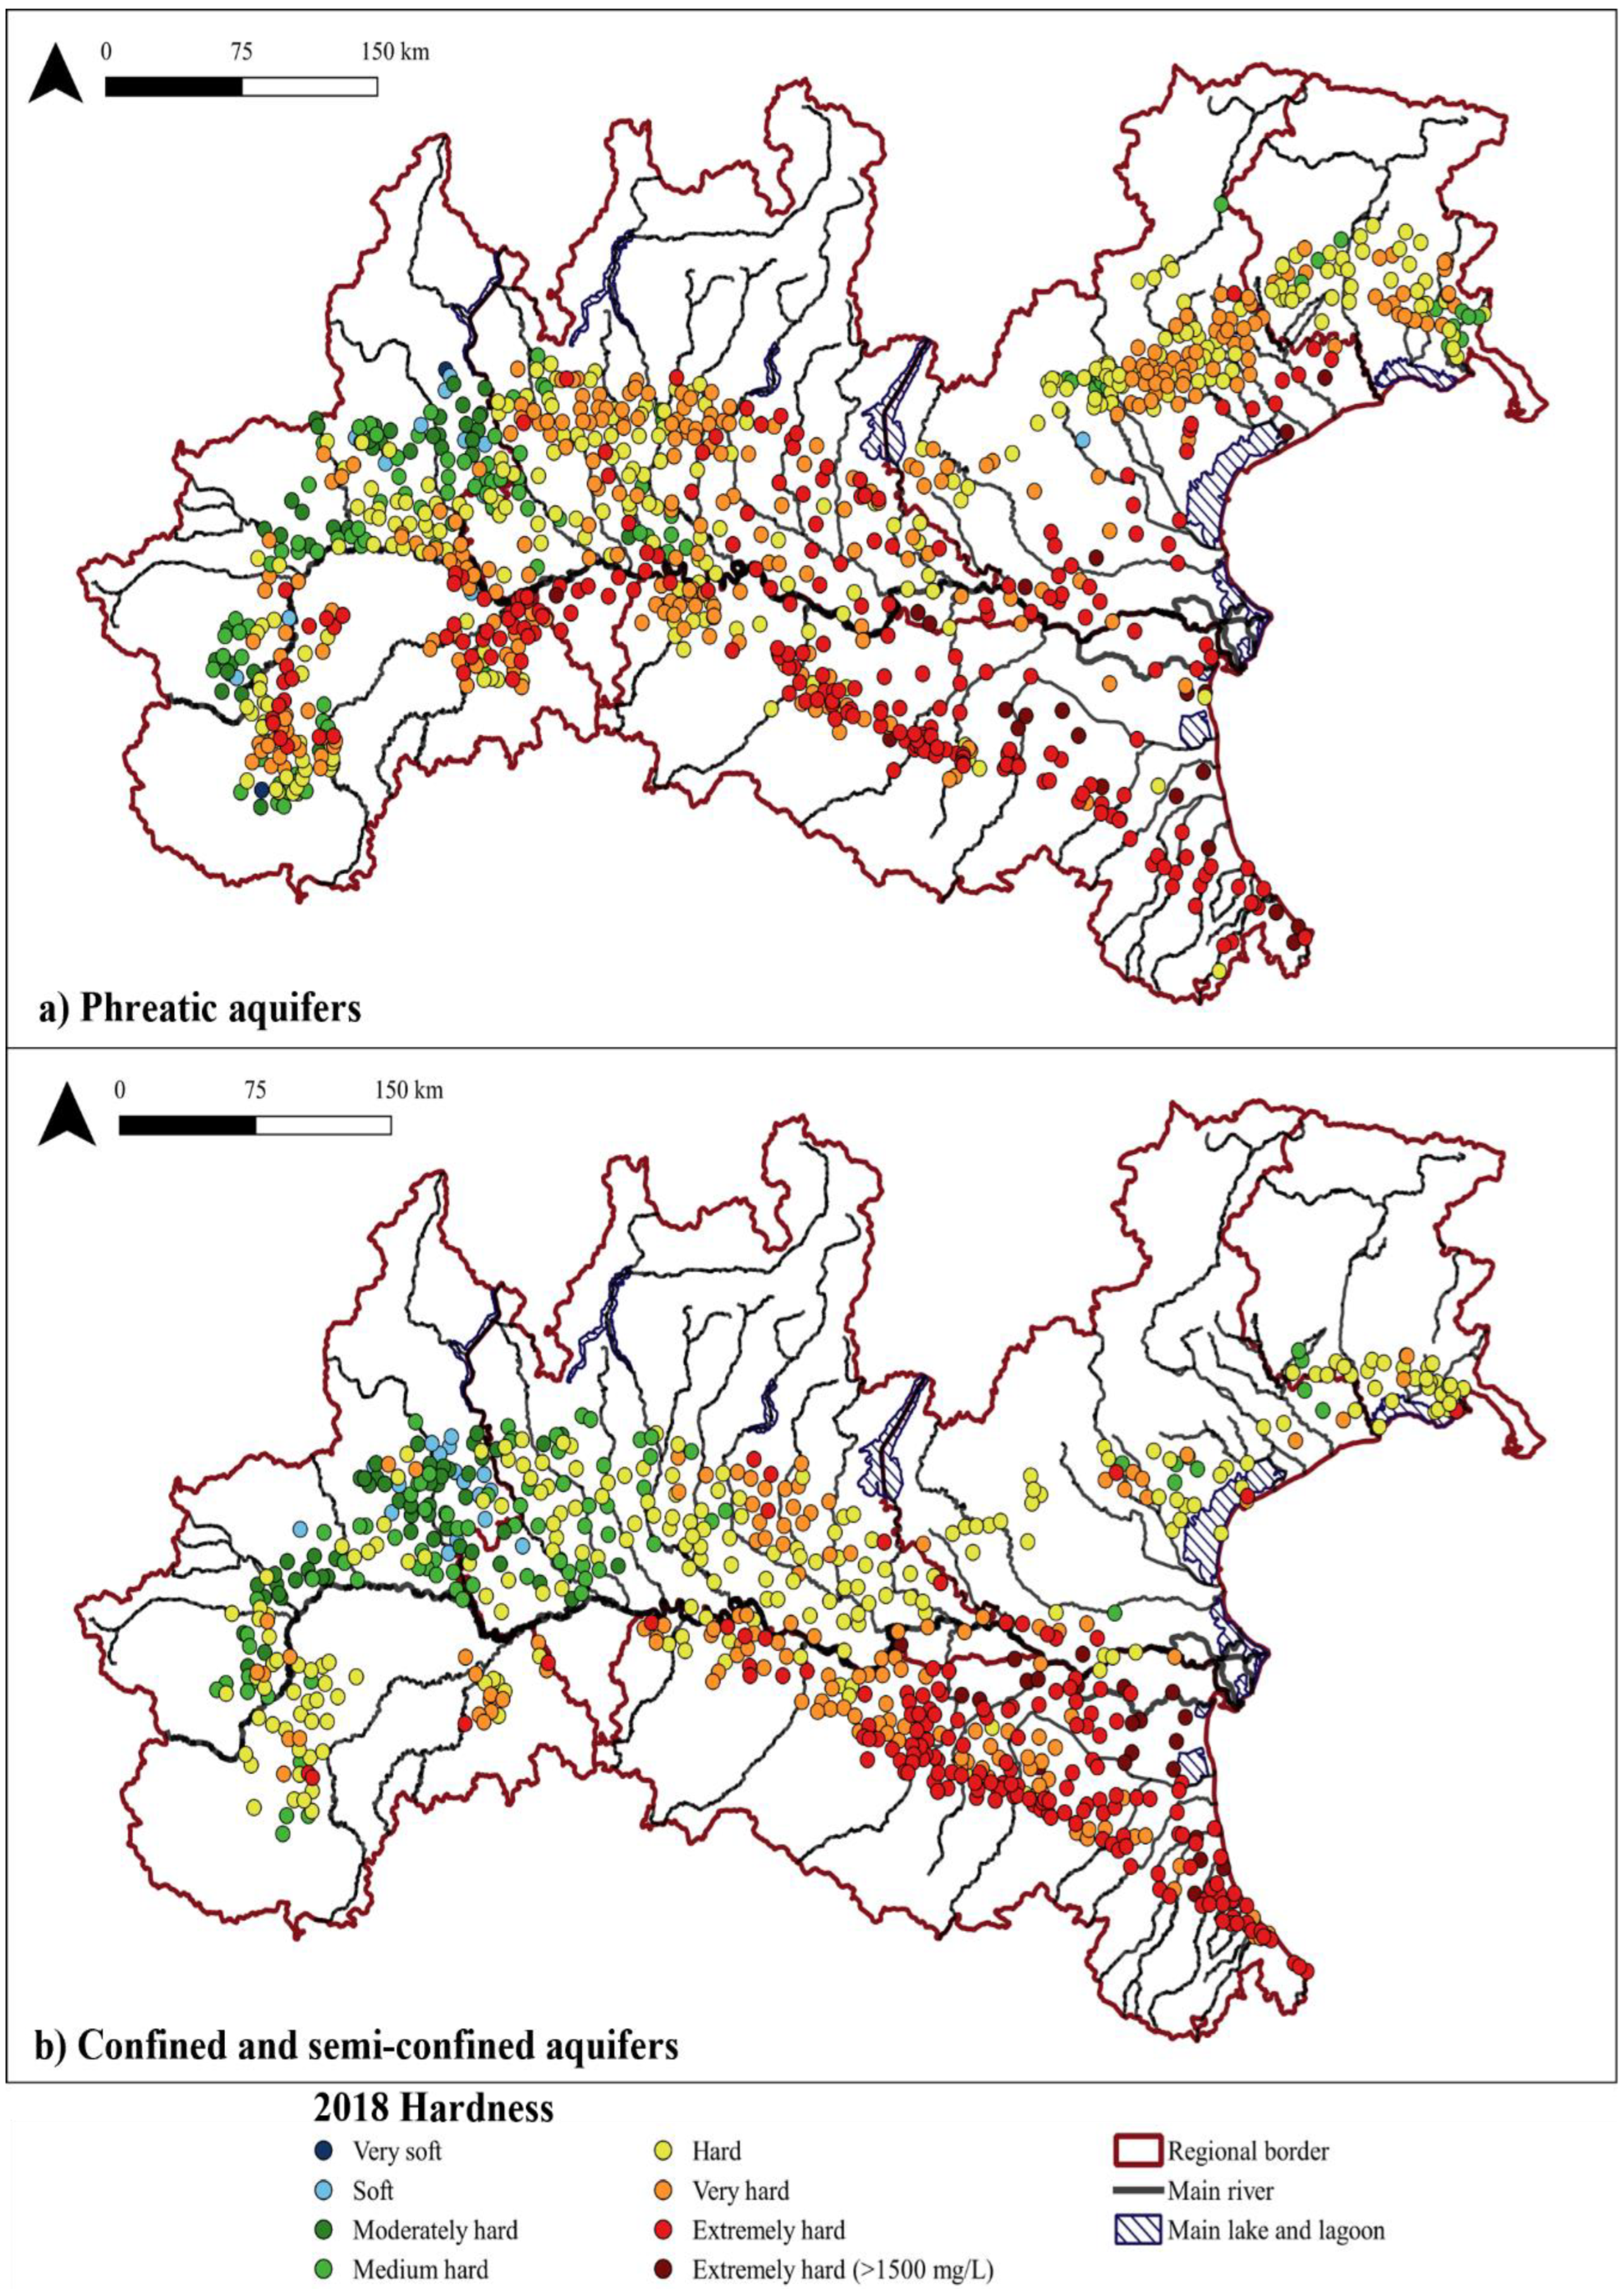
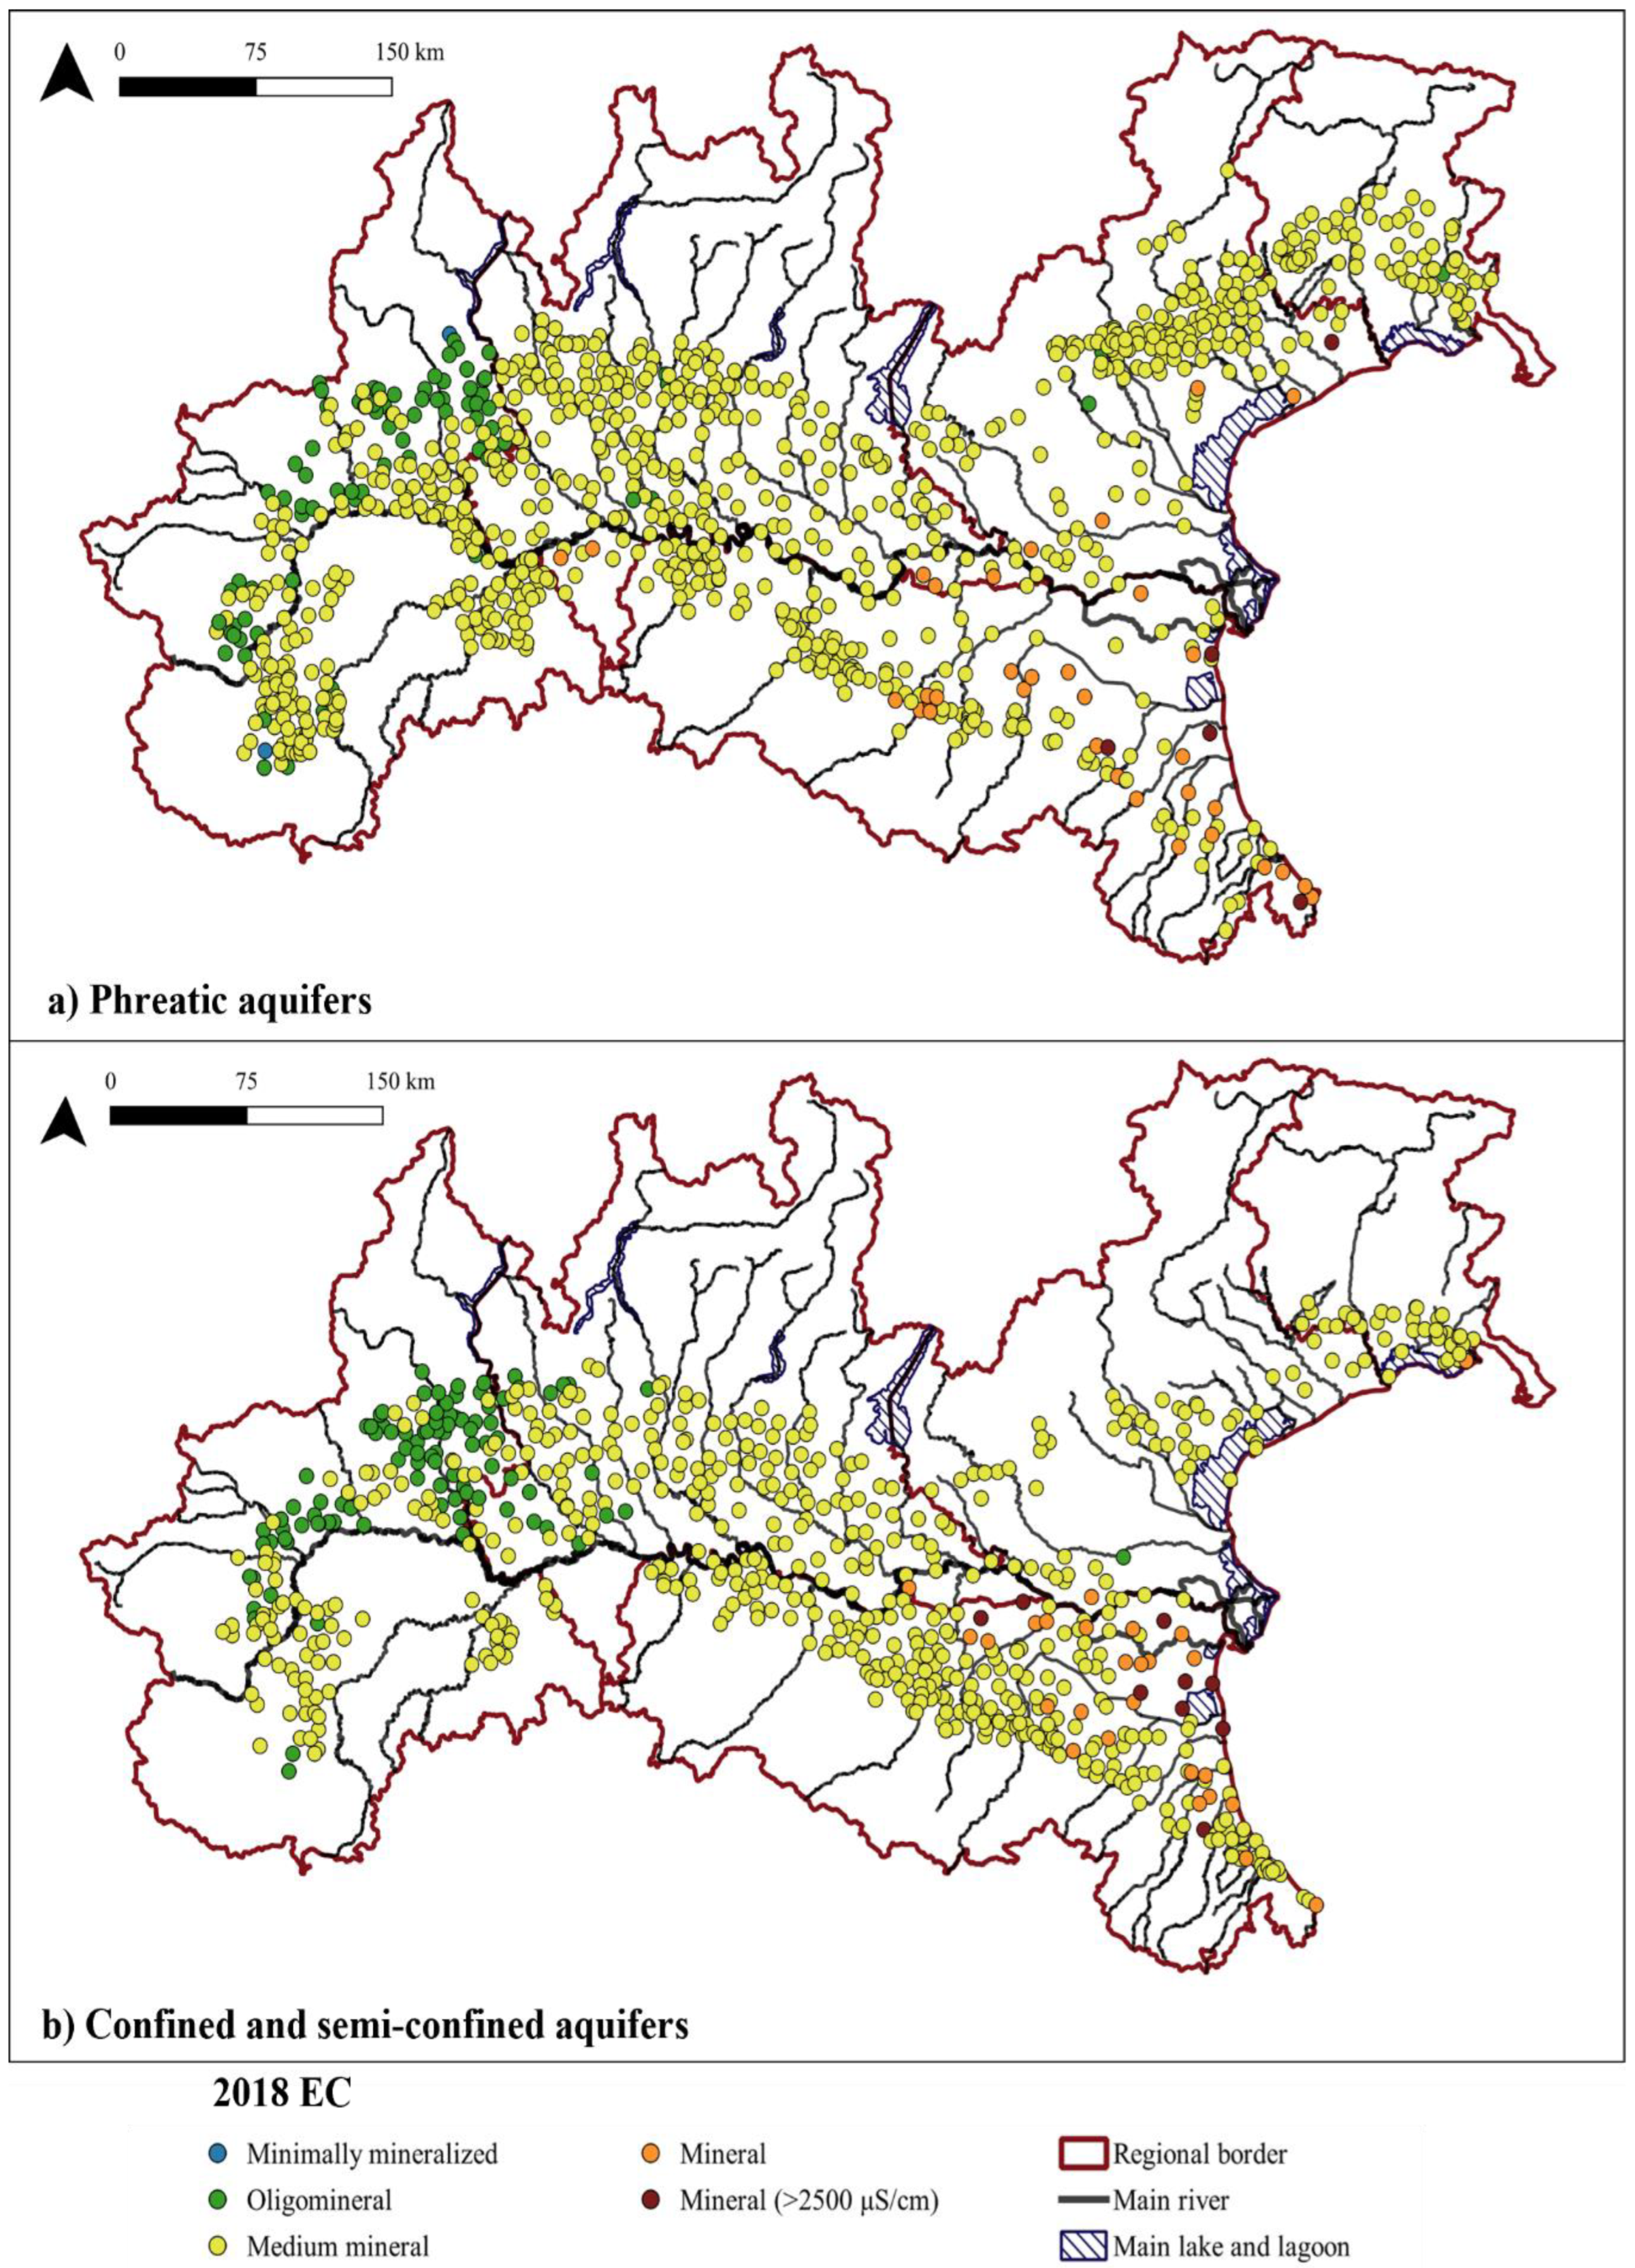
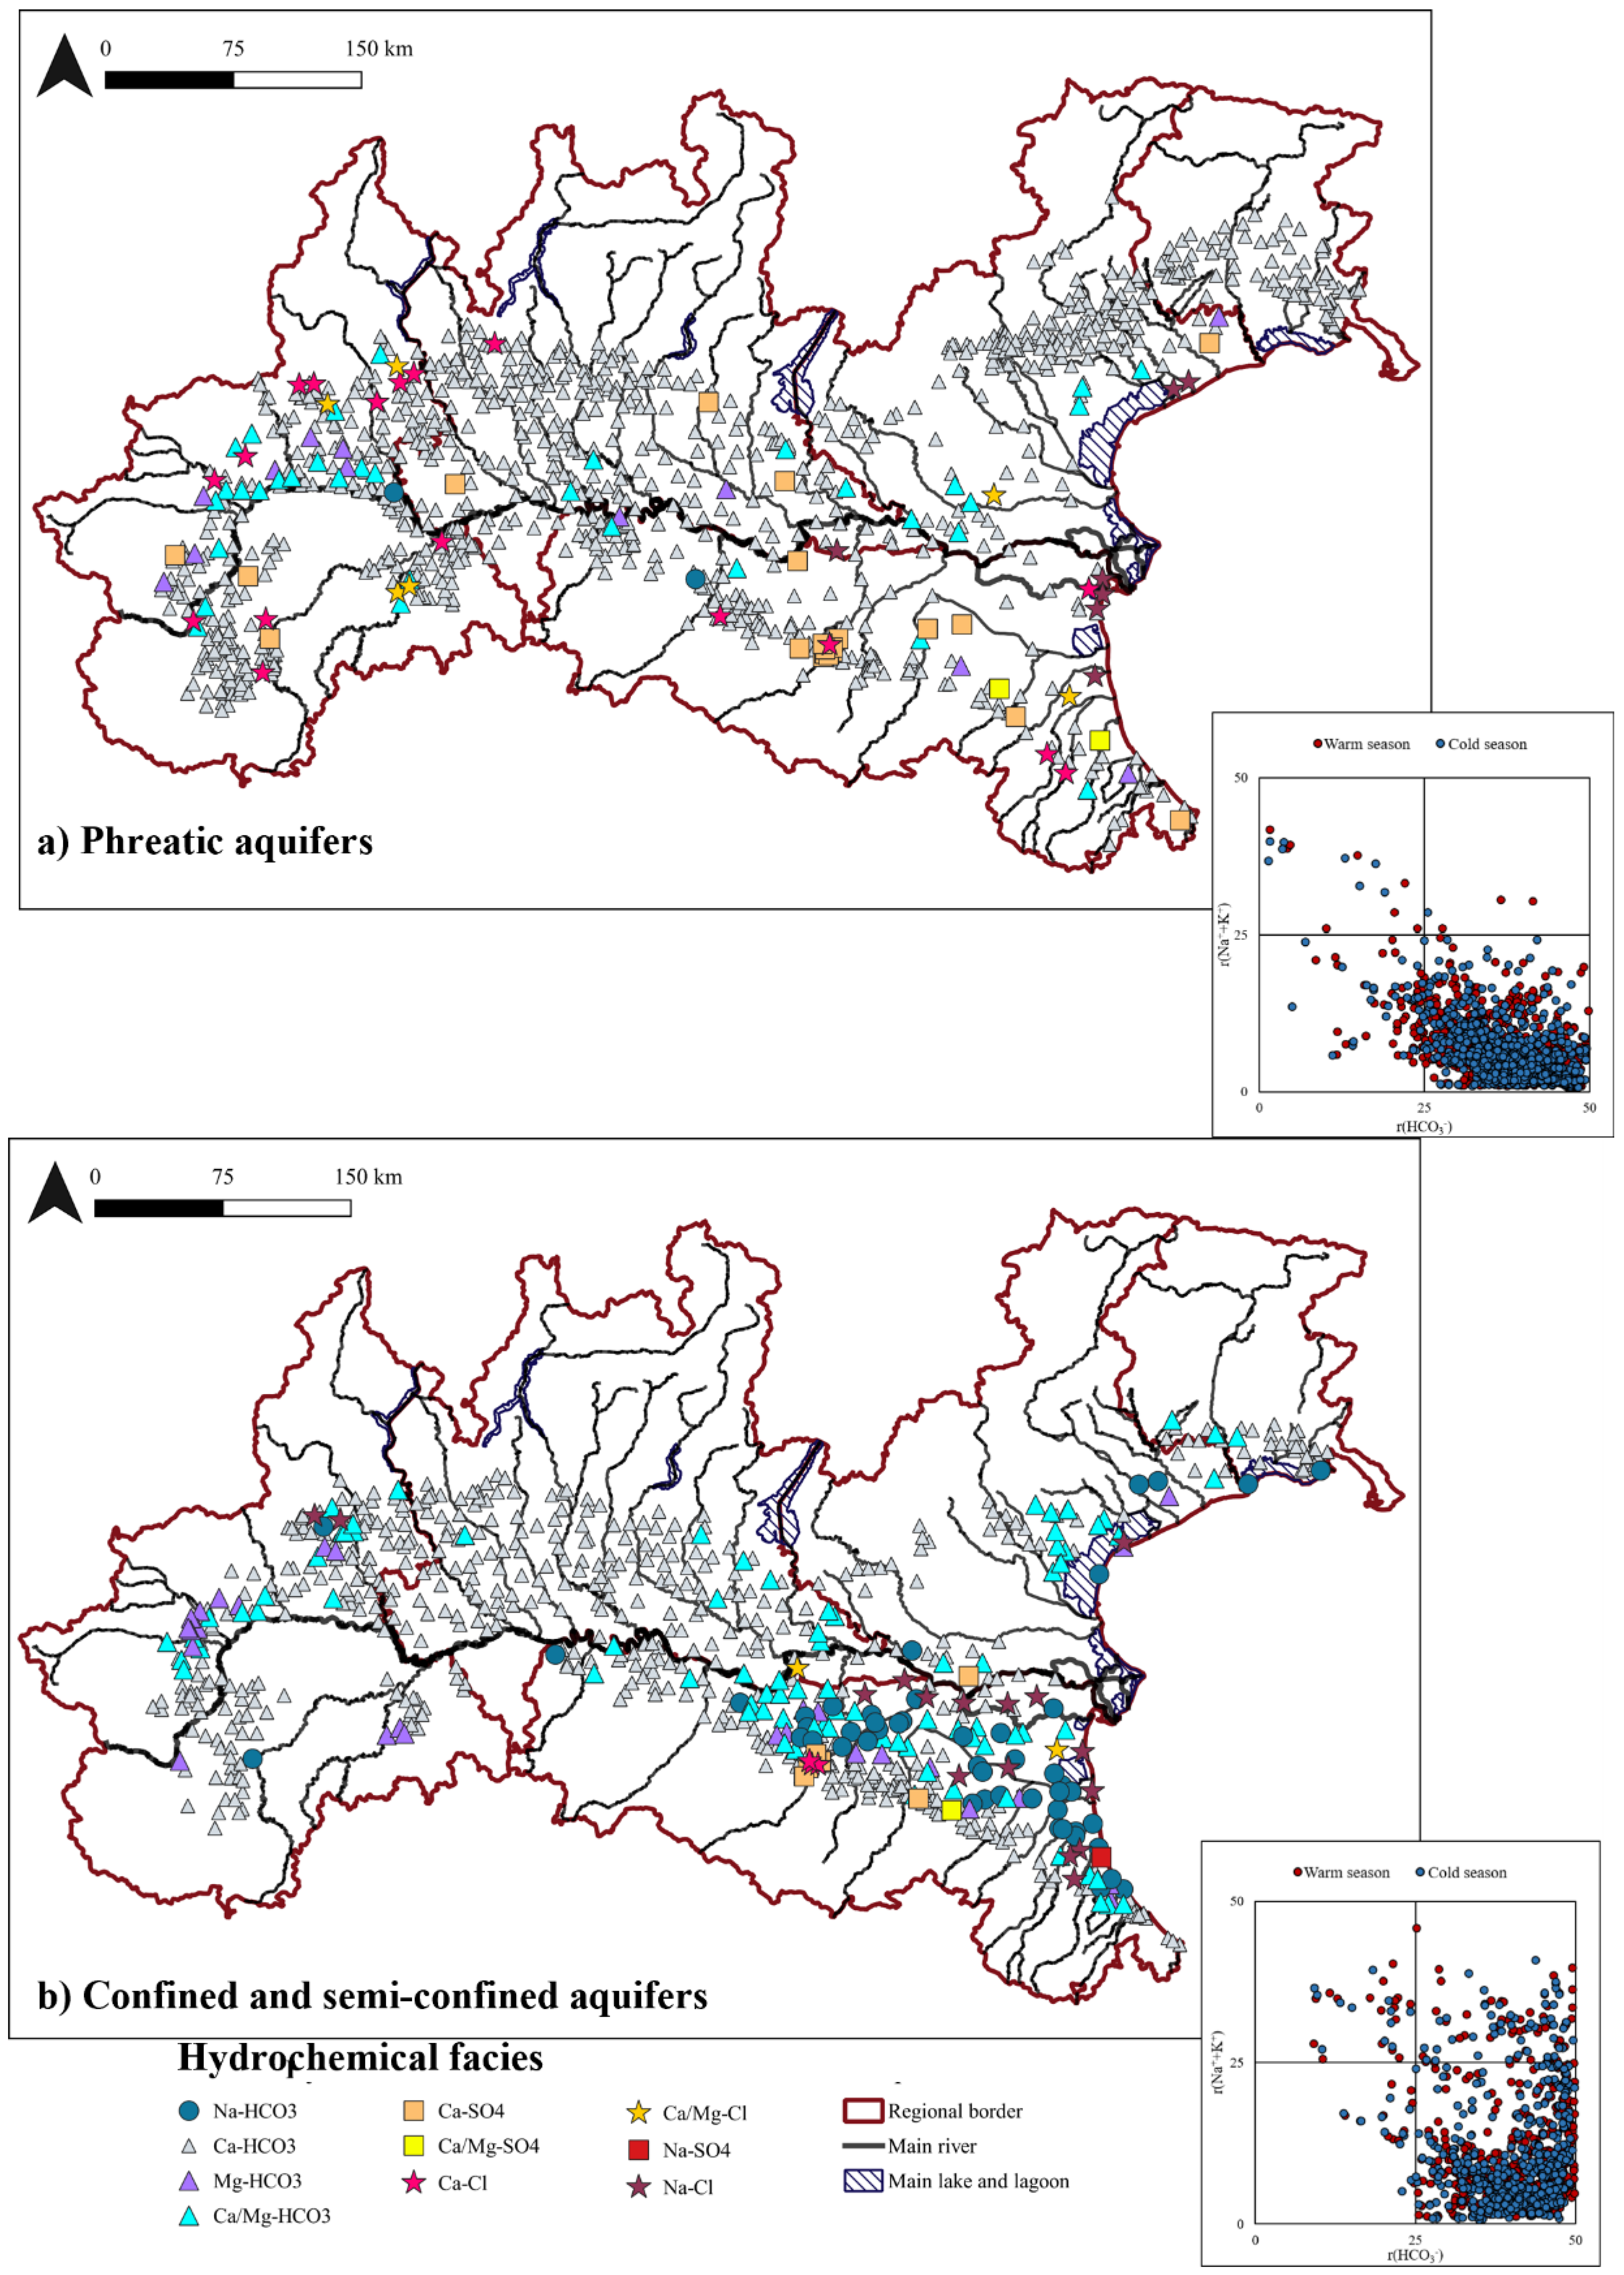
3.2. Hydrochemical Facies and Major Elements

Given that the statistically significant differences in the dataset are between aquifer types and not between seasons (cfr. the Kruskal–Wallis test results in Table 1 and Tables S3 and S4 in Supplementary Material), we decided to only show maps related to the warm season, which consists of the largest dataset.
In all aquifers (Figure 5), Ca-HCO3 is the dominant hydrochemical facies with 85% of water samples. The second most detected facies is Ca/Mg-HCO3 (5%) followed by Na-HCO3 (3%), Mg-HCO3 (2%), Ca-SO4 (1%), Na-Cl (1%), and Ca-Cl (1%), while the remaining water are classified as K-HCO3, Ca/Mg-Cl, Mg-Cl, Ca/Mg-SO4, Na-SO4, and Na/K-Cl.
Ca-HCO3 and Ca/Mg-HCO3 water are evenly distributed throughout the study area, in line with the characteristics of groundwater present in the aquifers of temperate regions as reported by various authors [42,61,62,63]. Their origin is due to the dissolution of carbonate deposits [64], which are the main minerals constituting the aquifers [14]. The distribution of other hydrochemical facies is not homogeneous in the different aquifers and it is conditioned by local effects as following described.
In the phreatic aquifers, the majority of samples are Ca/Mg-HCO3 water, while the second most numerous group includes Ca/Mg-Cl/SO4 water as shown in the Langelier–Ludwig diagram in Figure 5a. The Ca2+ and HCO3 are the dominant species, while high concentrations of Mg2+ are detected in PIE, linked to ophiolite outcrops [65], and in the area between Garda Lake and Veneto-Friulan high plain due to the dissolution of the abundant dolomite deposits [66].
The few water samples classified as Na/K- Cl/SO4 water are in the Emilian hinterland, in the high plain of the border between PIE and LOM, and along the Adriatic coast. In the Emilian hinterland, high concentrations of Na+, K+, and SO42− are due to the use of fertilizers that are rich in macro (N, P, and K) and meso elements (Mg, Ca, and S) and are important in plant nutrition, processes of integration, protection, and development of crops. Close to Imola and the border between Reggio-Emilia and Modena, the concentration of sulphates and calcium increases considerably, due to the local lithologic outcrops rich in Triassic evaporite formations and Messinian gypsum [67]. In the central-western aquifers (PIE and LOM) the effect is due to the interaction between water and evaporitic rocks formed during the phases of marine transgression of the Quaternary [42,68,69]. It is not excluded that the increase in concentrations of Na+, K+, Cl, and SO42− occurring at the border between LOM and PIE and in the central portion of the plain along the course of the Po River may be caused by anthropic activities, such as agriculture or urban wastewater treatment, being these phreatic aquifers in an agricultural context. Samples collected close to the low coastal plain of both EMR and VEN are affected by saltwater intrusion phenomena [57,59] and groundwater salinization due to relict water [43]. EMR coastal shallow aquifers are widely impacted by the phenomena of soil and water salinization [8,57,58,70,71], also testified by the highest EC values of the database, here recorded.
The presence of Ca-Cl or Ca/Mg-Cl water detected in the terminal portion of the Alpine chain (PIE, LOM, and EMR), could be due to processes of anaerobic decomposition of organic matter. These stations record high concentrations of HCO3, Fe, and Mn, low concentration of SO42−, and high EC values, all signals testifying processes of organic matter decomposition [72,73]. Redox values cannot be checked to confirm this hypothesis because the parameter is missing in the database. In addition, the dominant activity in these areas is agriculture, so the high Cl concentrations could also result from irrigation or fertilizer use [74]. A further hypothesis concerns the possibility that in these areas traces of contamination of chlorinated solvent are present as indicated by Vanzetti et al. (2016) [75]. These compounds could release chloride ion into the water when subjected to decomposition by microorganisms present in aquifers [75]. The Ca/Mg-SO4 water are limited in confined areas at the foot of the Apennine chain. In such areas, rainwater interacting with Triassic and Messinian evaporitic rocks causes dissolution and the release of SO42− and Ca2+ in groundwater [69].
In confined aquifers, 89% of the water samples are classified as Ca/Mg-HCO3, with an increase of 7% in Na/K-HCO3 water compared to the phreatic aquifers (Figure 5b); while Na-Cl, Na-SO4, and Ca-MgSO4 water constitute 4% of the total database for semi-confined and confined aquifers.
In the north-west confined aquifers, the water composition reflects the above phreatic aquifers: Mg2+ and HCO3 are the dominant ions and their origin is linked to the geological context [76]. The Mg-HCO3 facies located in the westernmost part of the plain (PIE) is due to the contribution of ultramafic rocks (Figure 1) and the dissolution of Mg2+. The samples have Ca2+/Mg2+ ratio of 1:3, typical of water circulating in serpentinites [76]. In this area of the plain, concentrations of Cr and Ni higher than threshold values (50 μg/L for Cr, 5 μg/L for CrVI and 20 μg/L for Ni) are found and originate from the ophiolites and serpentinites outcrops, which constitute a constant natural source of these elements into the water [65,77].
The sulfate-rich water are mainly detected in the central EMR area, close to the Apennine border but are present also as isolated samples moving towards the coastal area.
Na-HCO3 water are mainly located in the central area of the plain, in EMR. The water circulation inside the confined aquifers is very slow (less than 10 m/year), while in phreatic aquifers it is between 0.1 and 5.0 m/day [42]. The high residence times allows the cation exchange process in fine sediment between Na+ of marine water and Ca2+ of freshwater as found in previous studies carried out in EMR and FVG [63,78]. Ionic exchange processes between Ca2+ and Na+ are very evident in the central area of the plain, where many Na-HCO3 water samples with extremely high EC are detected [69]. The origin of these water is most probably linked to the presence of relict marine water, considering the distance from the current coastline.

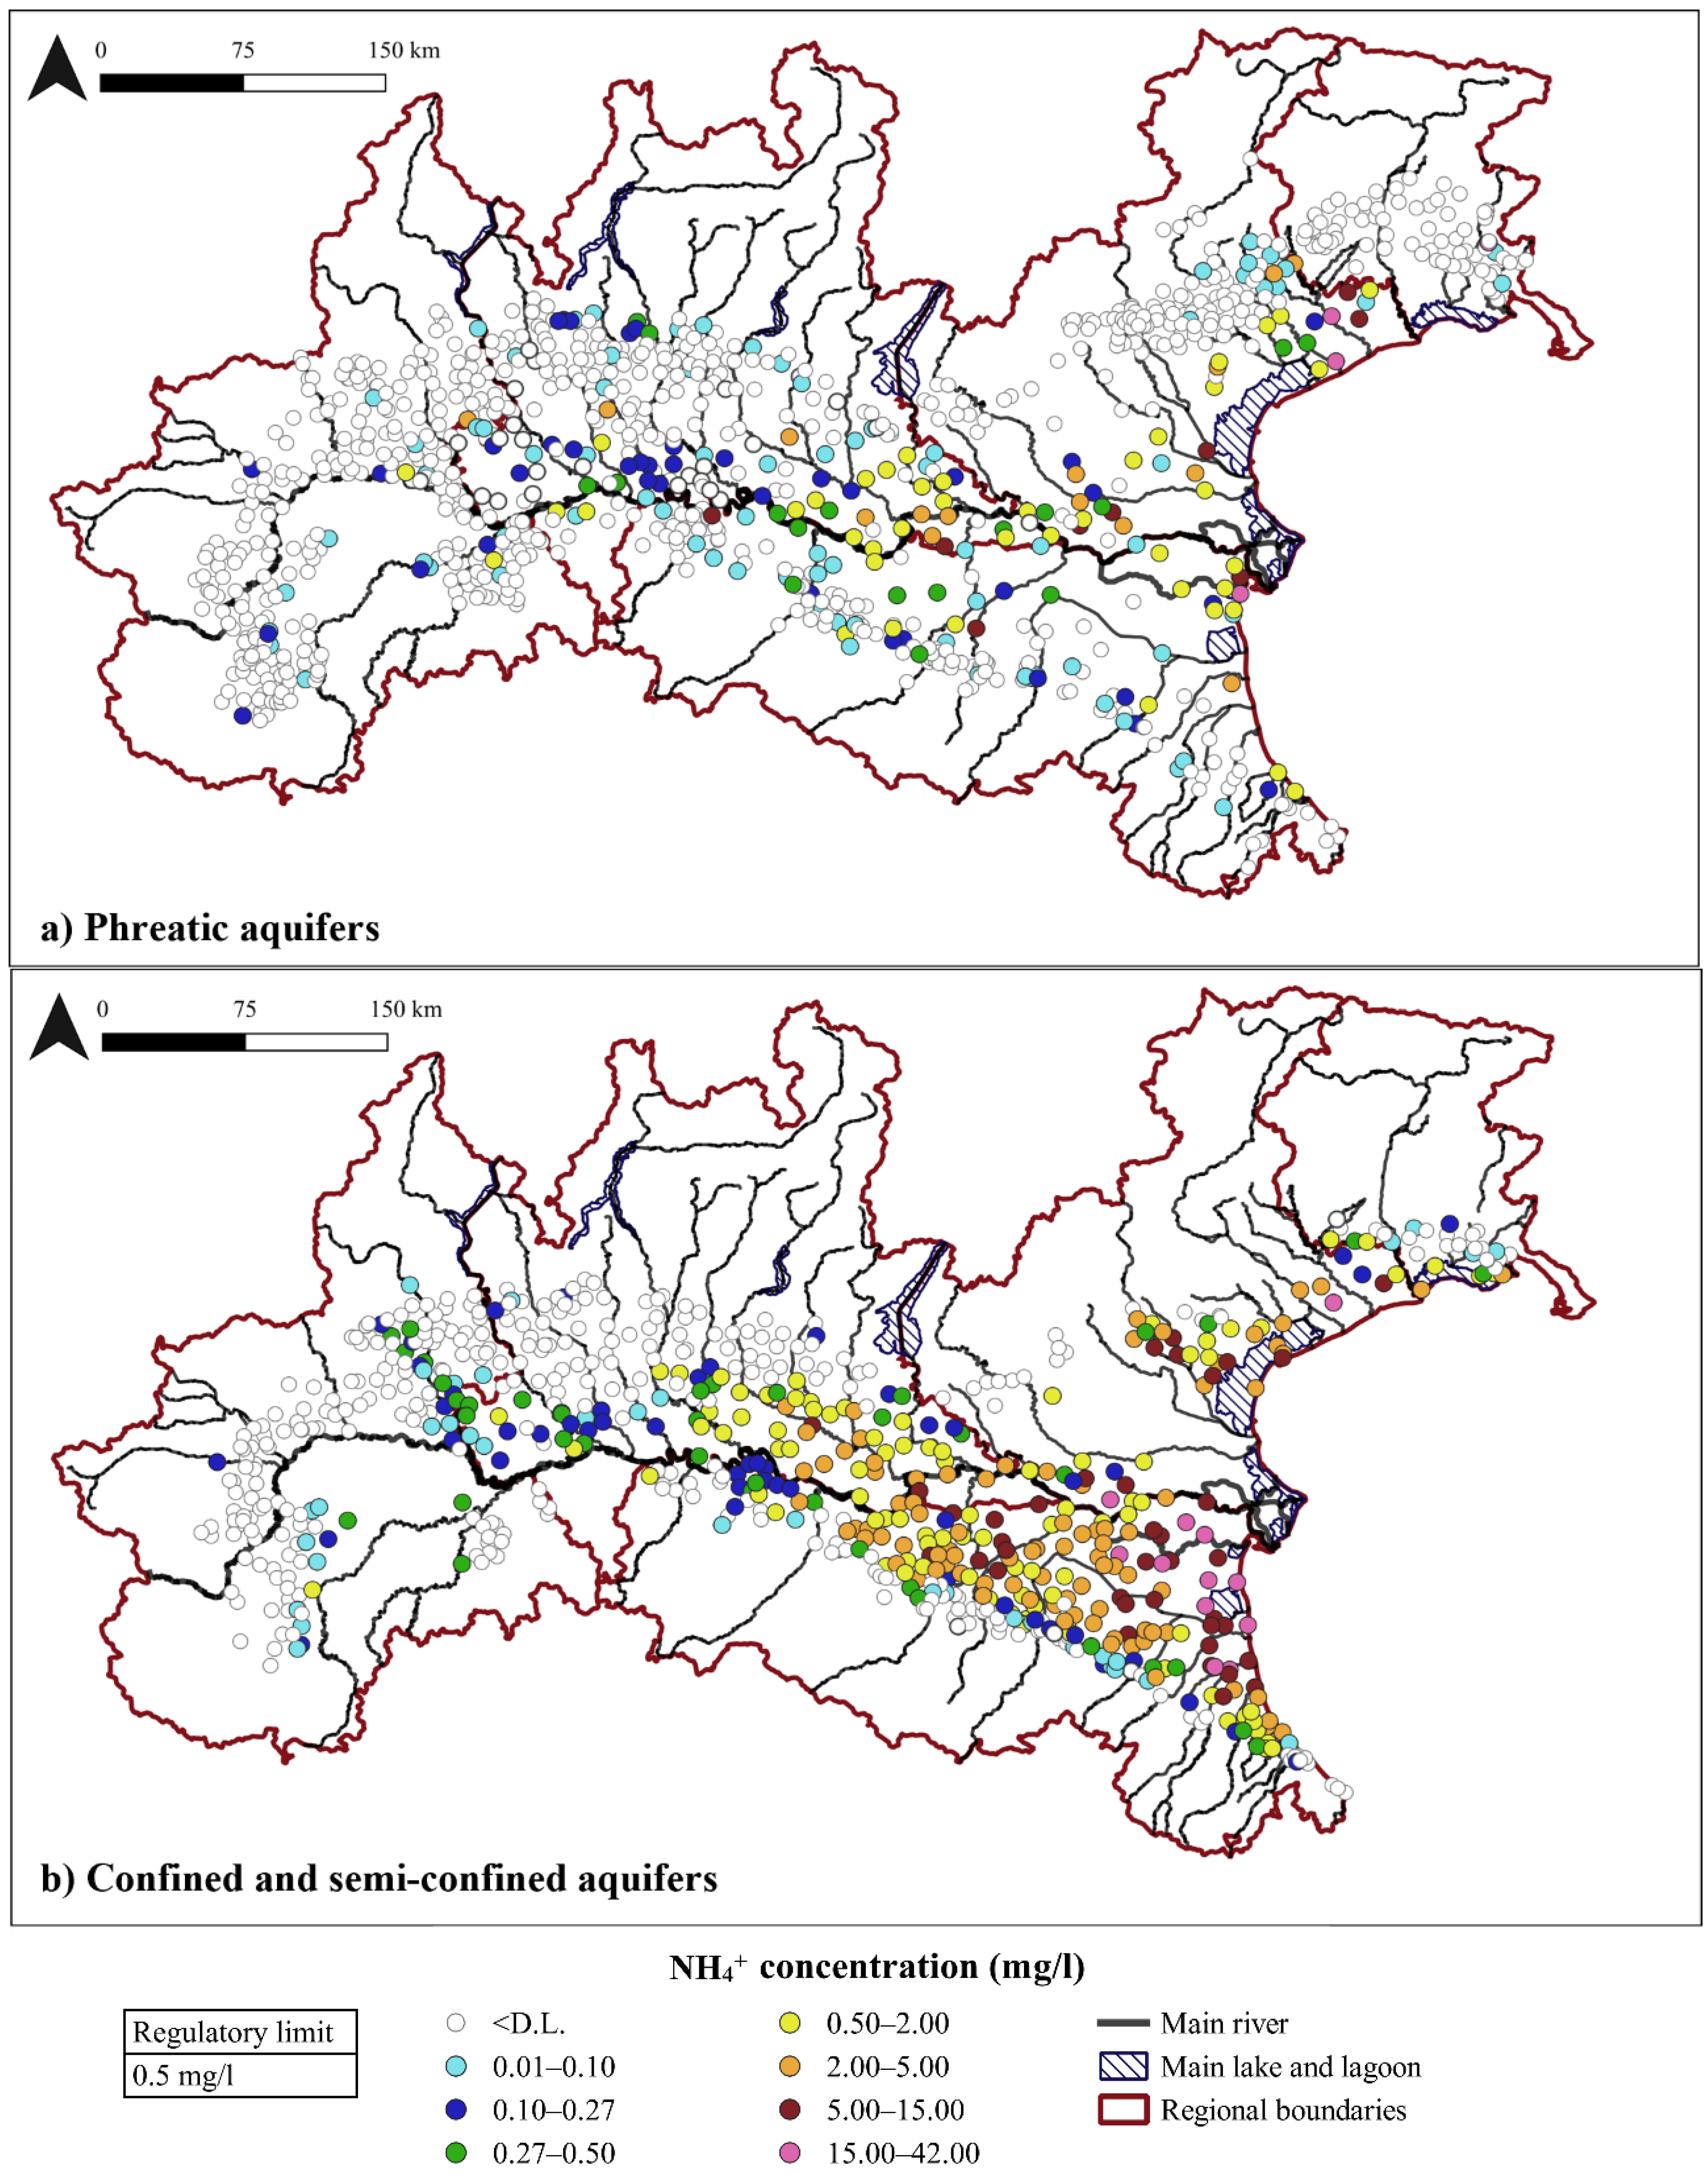
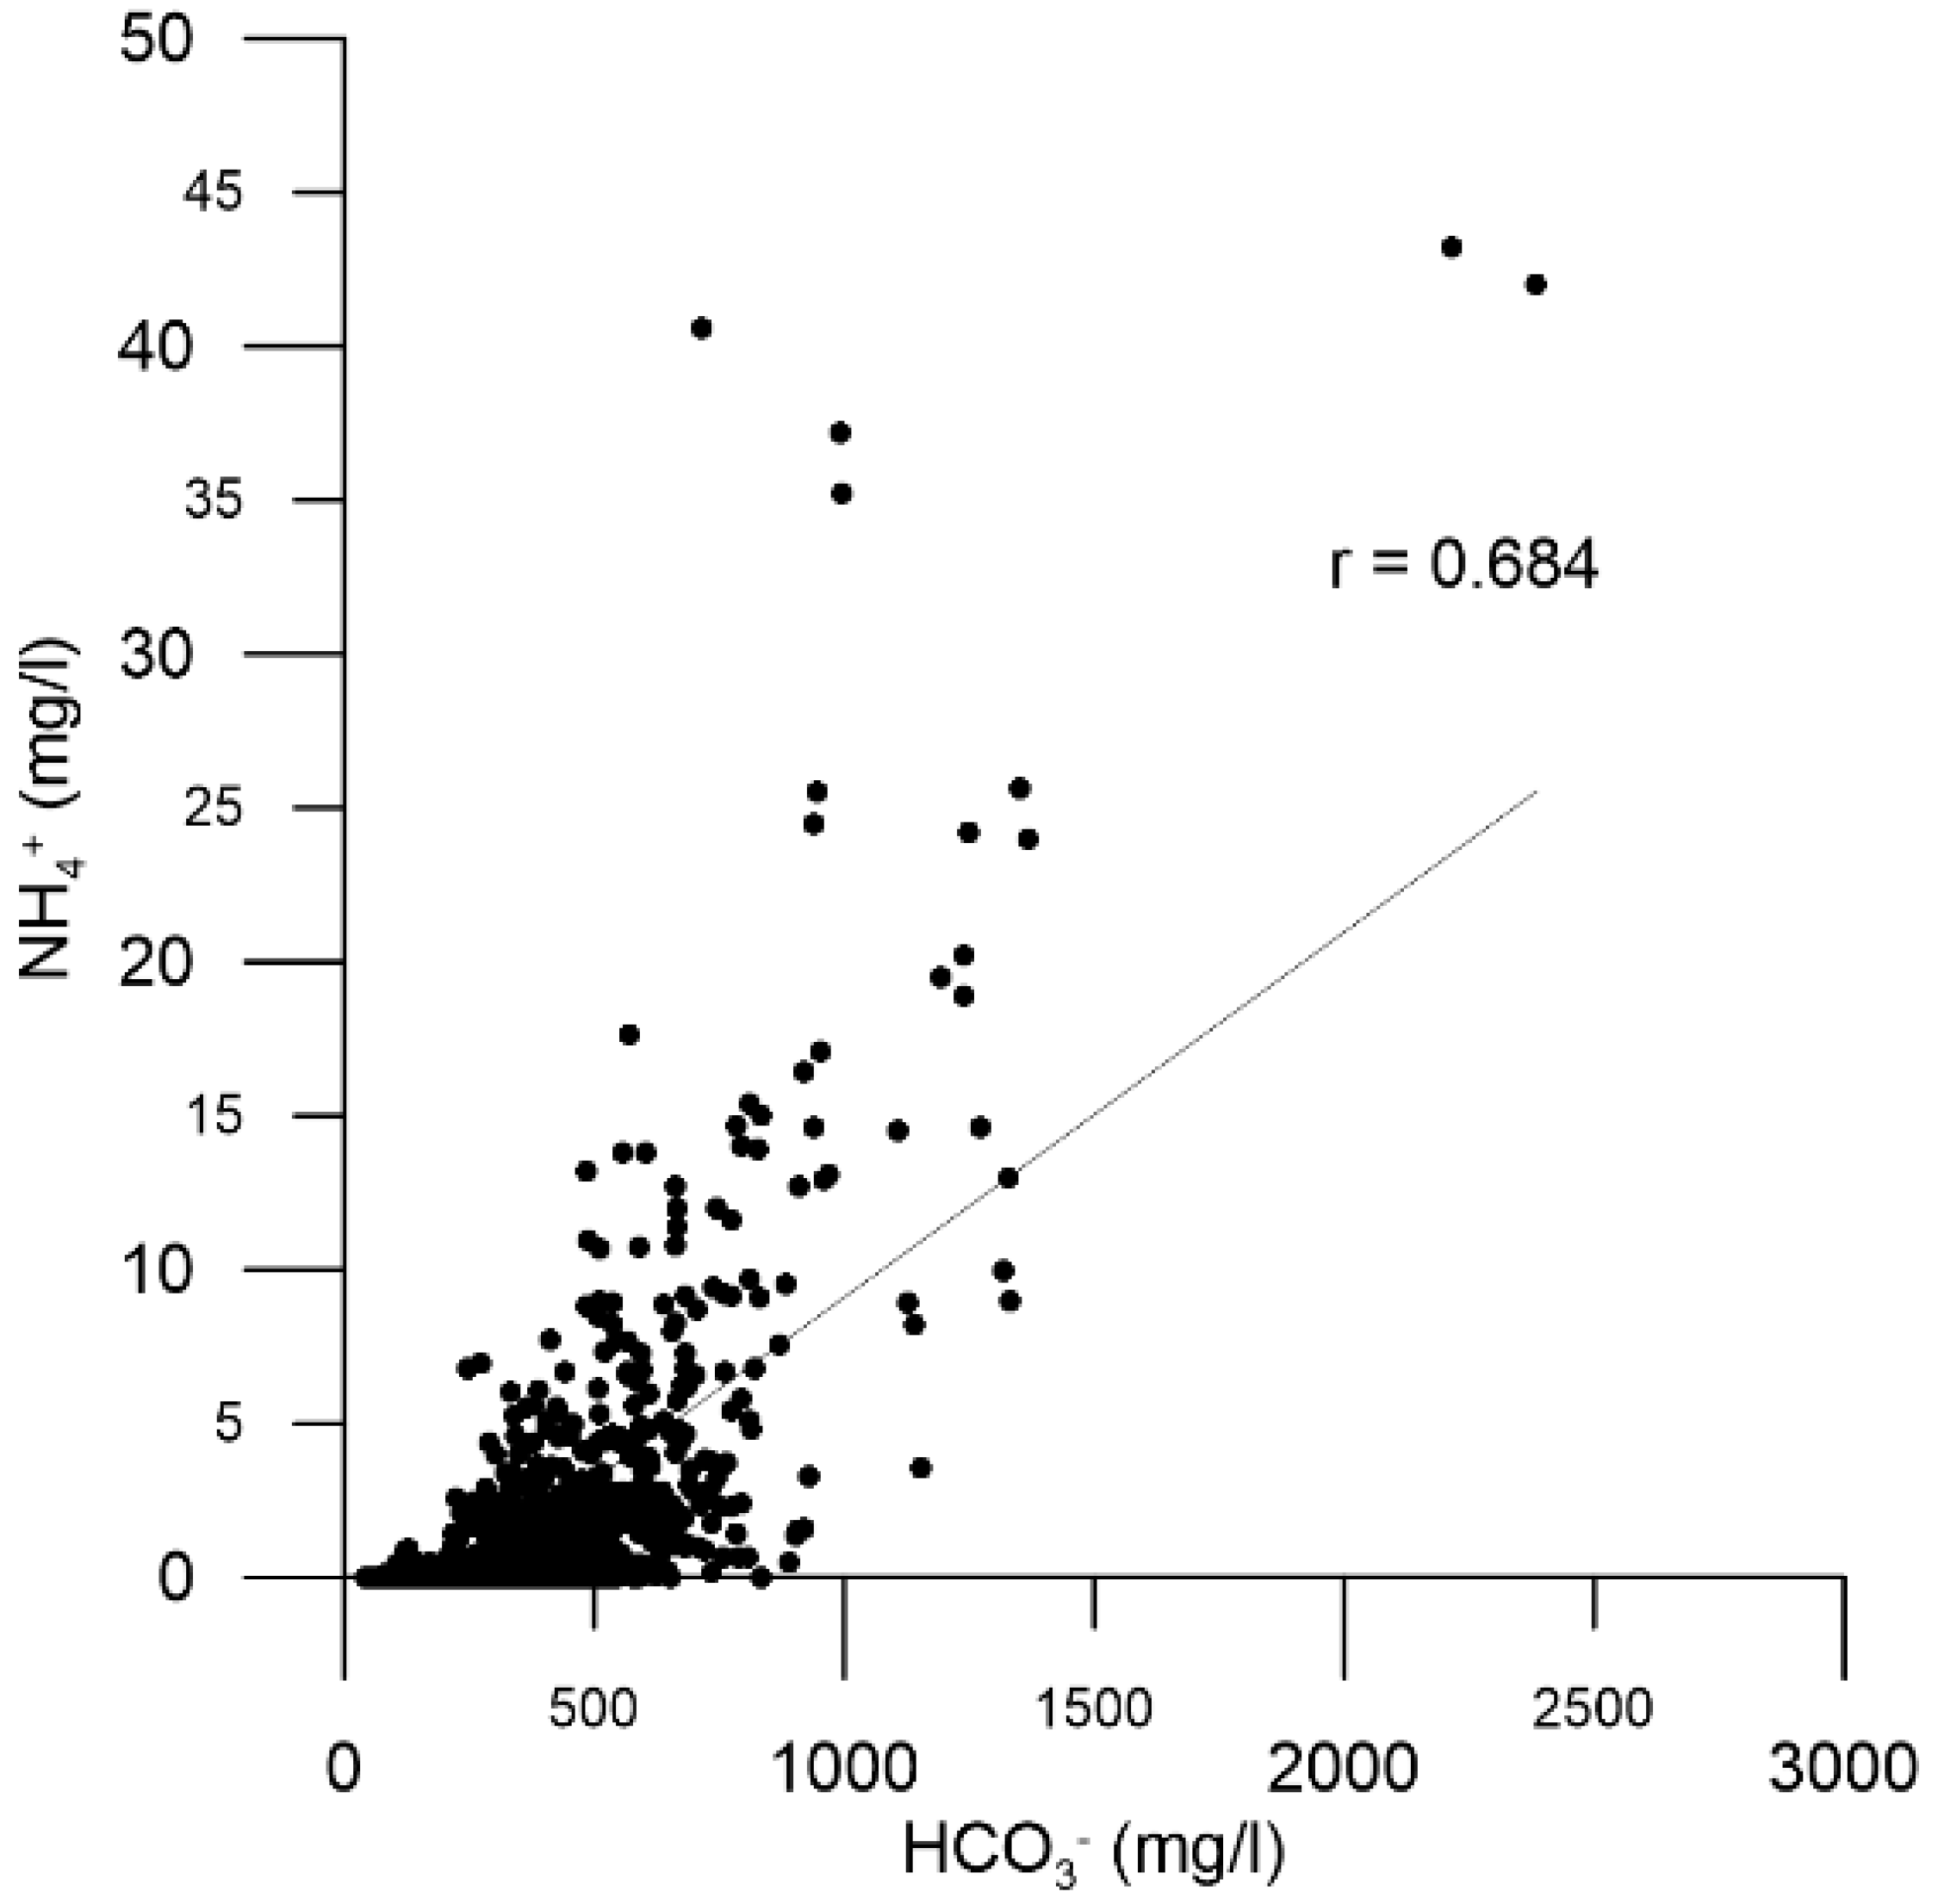
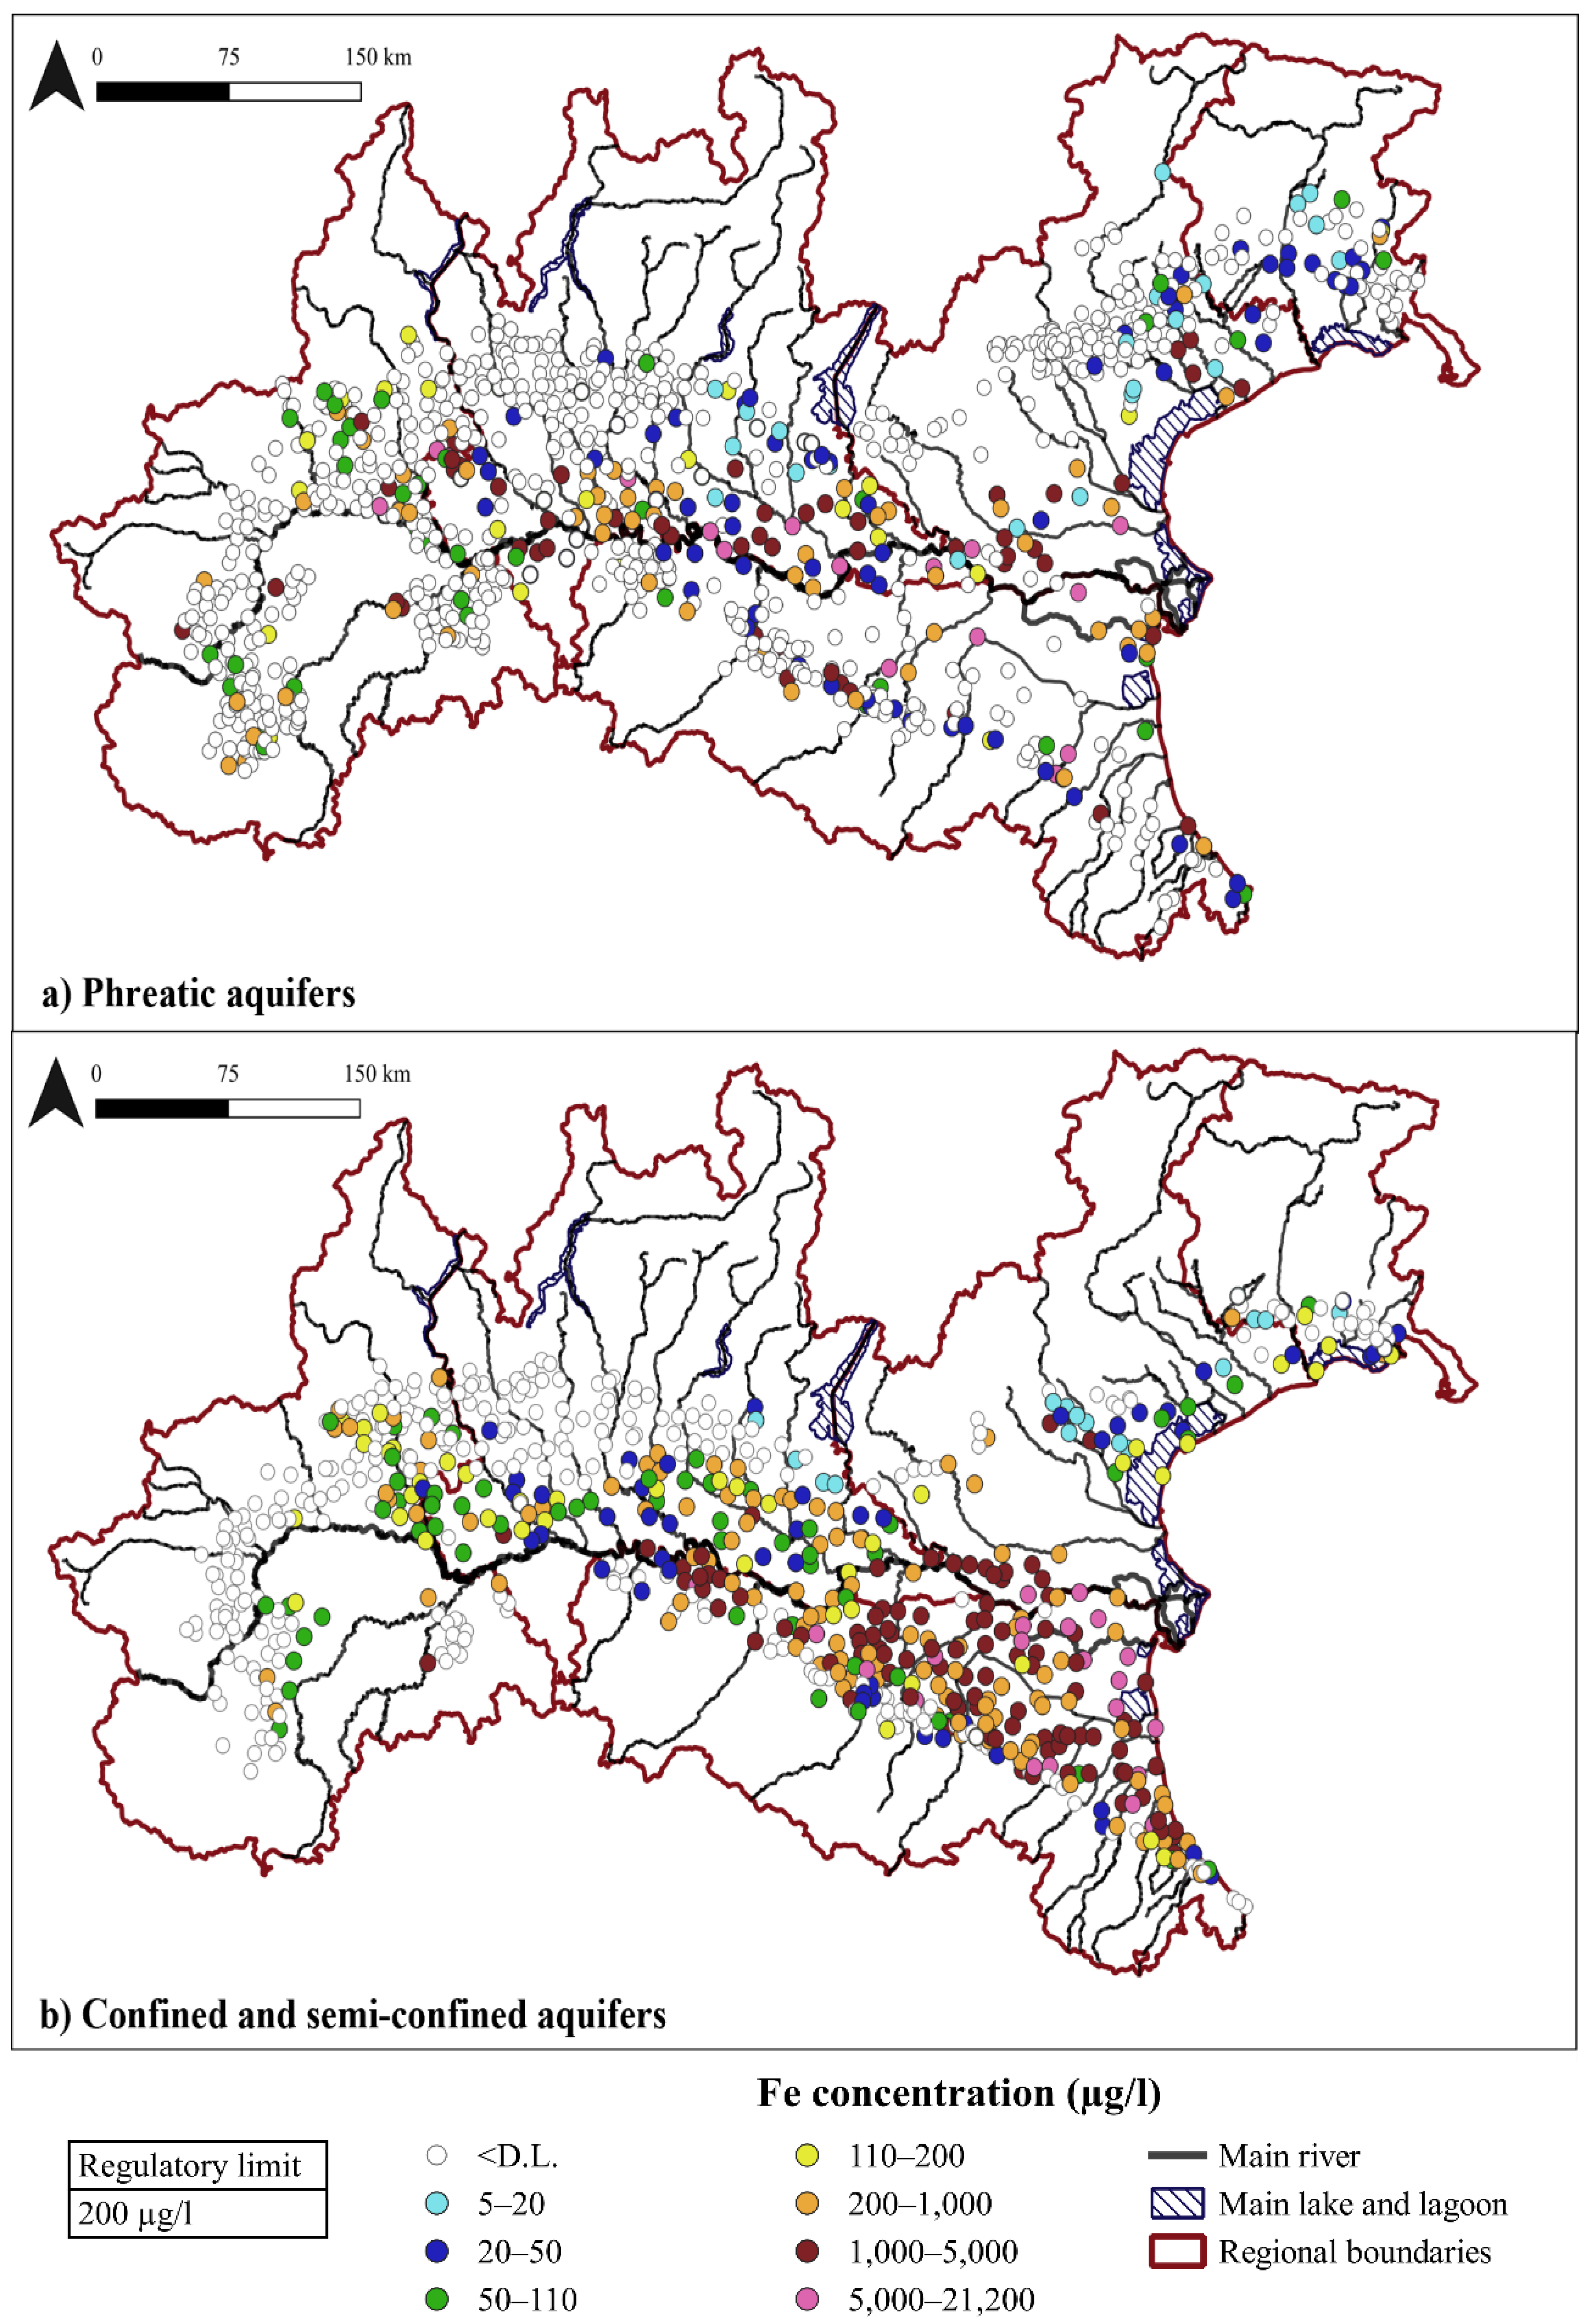
3.3. Trace Elements and Inorganic Nitrogen

Among the selected elements in paragraph 2.2., we present maps of NH4+, Fe, Mn, and As distributions in phreatic and confined aquifers.
Nitrate contamination of Northern Italian aquifers is well documented [79,80,81,82,83], while less is documented about NH4+ distribution. Nitrate pollution is widespread through much of the plain (in PIE, EMR, along the Apennine alluvial fans, and in the low LOM plain; cfr. Figure S1 in Supplementary Material). This is connected above all with the massive presence of intensive farming and extensive use of nitrate fertilizers, with the disposal of stockbreeding waste, and with seepage from the urban sewage systems [42,79]. Nitrate pollution reaches its highest levels (also over 100 mg/L) in the areas bordering the Alps and the Apennines where the hydrogeological structures appear to be the most vulnerable and land utilization the most intense. The absence of continuous aquitards, especially in the areas of aquifer recharge, allows nitrate leaching from shallow to deep aquifers. Contamination of confined aquifers is extremely localized since, in anaerobic condition, nitrate is reduced to NH4+.
Figure 6 shows NH4+ concentration in the phreatic and confined aquifers. While in shallow aquifers, most of the water samples (77%) have concentrations <0.10 mg/L, 32% of the samples collected in semi-confined and confined aquifers show values above the legal limit of 0.5 mg/L, set for water intended for human consumption (D.Lgs. 31/01 [84]). Ammonium in phreatic aquifers is found mainly in lowland areas (Figure 6a). Ammonium is used as fertilizer, especially in areas of intensive agriculture, such as the lower VEN plain. However, the presence of NH4+ is also strongly linked to organic matter decomposition processes, especially in aquifers characterized by the presence of peat and humic layers, such as in VEN, lower LOM and EMR [85,86]. Mastrocicco et al. (2013) [87] has demonstrated that in the phreatic coastal aquifers of the EMR, NH4+ is the prevalent nitrogen inorganic species in groundwater, and its concentration increases with depth and salinity. Very high NH4+ concentrations are found in coincidence with peaty sediments of salinized anoxic aquifers and in the low-lying aquitard and are not related to anthropogenic sources. In particular, the elevated NH4+ concentration derives from mineralization of organic matter present in fine sediments deposited in paleo-marsh environments, as supported by the significant correlation observed between HCO3 and NH4+ in the confined aquifers (Figure 7). It is difficult to certainly establish if water samples exceeding the NH4+ threshold in Figure 6 are due exclusively to anthropic impacts; it is more correct to affirm that farming activities cause a local intensification of natural NH4+ background.
In confined aquifers, NH4+ concentrations higher than 0.5 mg/L are found downstream of the spring line (fontanili), limited to the EMR plain and the lower VEN plain (Figure 6b); in both cases the natural origin is established [85,86].
Moreover, Fe and Mn distributions significantly differ between phreatic and confined aquifers (Figure 8 and Figure S2 in the Supplementary Material). Dissolved Fe and Mn concentrations in water are strongly influenced by redox conditions; Fe2+ and Mn2+ are more soluble in acid or reducing conditions, so higher concentrations are found in reducing groundwater, typical of deep aquifer; while are precipitated rapidly with increasing pH and Eh, forming (hydro)oxides and decreasing Fe and Mn concentration in water. The amount of dissolved Fe also depends on the presence of complexing agents in solution, such as Cl, F, SO42−, PO43−, and organic matter; while concentration of carbonate, bicarbonate and sulphate ions affect dissolved Mn due to the formation of complexes.
In the phreatic aquifers (Figure 8a), where oxidizing conditions should theoretically be dominant, 66% and 57% of the samples show Fe and Mn concentration <D.L., respectively. However, most of the remaining samples have values that well exceed the legislative threshold of 200 μg/L for Fe and 50 μg/L for Mn (D.Lgs 31/01 [84]), sometimes even 1 order of magnitude. Most of the samples with high Fe concentrations are located along the Po River, in the lower VEN plain and at the base of the Apennines. The high concentrations recorded on the border between PIE and LOM, showing an increase in the warm season compared to the cold period, could be due to the submersion of the paddy fields. This effect, however, has not been documented by local studies, but it is known in the literature [88,89]. Paddy fields are reducing environments developing because of the long term presence of water flooding the land. Here, the Fe/Mn mineral-rich strata and soil with abundant organic matter act as sources of Fe and Mn to the groundwater and the reductive environment in the lower terrain and areas containing water bodies favor Fe and Mn dissolution in the groundwater. Moreover, NH4+ generated by the application of N fertilizers during agricultural activities can promote the reduction of Fe–Mn oxides and cause Fe and Mn to be released into the water [89].
In confined and semi-confined aquifers (Figure 8b) more than 32% and 41% of samples have values higher than the Fe and Mn legal thresholds, respectively. Being the deep aquifer less affected by anthropogenic activities, these exceedances are due to natural background [90].
Figure 9 shows As distribution. The mobility of this element in water strongly depends on the oxidation state: the reduced form (As3+) has greater mobility, while the oxidized form (As5+), which is found as oxyanions, tends to be absorbed by Fe-, Al-, and Mn- hydroxides and, to a lesser extent, by clay minerals and organic matter, favoring precipitation and removal from solution. In alluvial plains, the reductive dissolution of Fe- and Mn- oxides and hydroxides, linked to the anaerobic degradation of peat layers, has been identified as the main As source from sediment to groundwater [91,92,93,94]. The peat was formed in the meanders abandoned by the rivers and in the water stagnation areas of the main watercourses and were buried and incorporated into the stratigraphic sequence by the subsequent alluvial depositions of the rivers [95].
The As distribution in the aquifers of the Po Valley reflects the NH4+ distribution (Figure 6). Most of the water samples (75%) have concentrations <L.R., while the majority of values above legal threshold (10 µg/L) are localized in the semi-confined aquifers, where the effect of organic matter degradation could be greater than in deeper confined aquifers. Moreover, Carraro et al. (2015) found the main anomalies at depths between 10 m and 80 m below the ground [93].
The anomalous samples are concentrated in the central area, in the lowlands of VEN, LOM and EMR. The presence of extreme values in these areas have been extensively documented by many studies [86,93,96]. It must be noted that some difference is found compared to our study. In the phreatic aquifers of the lower VEN plain, high concentrations (>100 µg/L) are mainly located in the province of Rovigo; however, Carraro et al. (2013) [97] detected concentrations higher than 300 µg/L in many wells around the Venetian area, which, according to the authors, represent natural hot-spots. In the EMR confined aquifers, several water samples exceed the background values of 170 µg/L identified by ARPAE [98], with values around 275 µg/L in the provinces of Bologna, Ferrara, and Ravenna.

4. Conclusions

For the first time in Italy, this study allowed to integrate in a single and homogeneous database all the freely available geochemical groundwater data separately collected by the ARPAs of the Northern Italy (Piedmont, Lombardy, Veneto, Friuli-Venezia Giulia, and Emilia-Romagna) during 2018. The developed database permitted to describe the geochemical processes of a wide and complex aquifers system, providing a complete and unique overview on the natural and anthropic processes characterizing the entire Po plain.
Nevertheless, the study demonstrated that the application of a rigid protocol of data management including data assembling, reformatting, correction, homogenization, and then grouping into homogeneous aquifer type (phreatic, semi-confined, and confined) allowed the comparison of groundwater data originally collected using different management and analytical protocols.
From the geochemical point of view, mineralization and hardness are higher in the Apennine and easter Alpine sectors than in the western Alpine sector due to the prevalence of carbonate sedimentary rock in the first case, and clasts of crystalline rock in the second.
The phreatic aquifers of Northern Italy are more exposed to contamination phenomena related to anthropic activities than confined aquifers, especially in the central area of the Po plain, where agricultural and livestock activities abound. In these contexts, water show high values of Na, K, and N, present both in the form of NO3 and NH4+, which can be linked to agricultural fertilizers. It is difficult to certainly establish if water samples exceeding the NH4+ threshold are due exclusively to anthropic impacts; it is more correct to affirm that farming activities cause a local intensification of natural NH4+ background. Paddy fields on the border between PIE and LOM seem to be responsible for high Fe and Mn concentrations due to local anoxic conditions during the flooded period.
Ongoing saltwater intrusion phenomena are evident in the shallow unconfined coastal aquifers along the EMR coastal areas. At the foot of the Apennine, the dissolution of evaporite formations is evident and marked by high EC values as well as Ca-SO4 dominant facies, recorded in shallow and deep water samples.
Throughout the Alps, regardless of the type of aquifer, high concentrations of Mg are found, the origin of which is identified with the dissolution of ultramafic rocks in PIE, and with the dissolution of dolomite in the stretches of the plain east of Garda lake in VEN. The presence of Na-Cl water along the Adriatic coast is associated with saltwater intrusion phenomena, while in the hinterland it is more due to the dissolution of evaporitic rocks or the upwelling of fossil water.
In the confined aquifers of the central plain, the long residence times of groundwater allow cation exchange processes in fine sediment between Na+ of relict marine water and Ca2+, generating Na- HCO3 water with extremely high EC. The negative redox potential, the absence of interaction with oxygenated water, and the dissolution of Fe and Mn oxide-hydroxides testified the mineralization of the abundant organic matter present in fine sediments, with consequent increase in NH4+, Fe, Mn, and also As in deep groundwater.

5. Recommendations

This work highlights the need of structuring a nationally (or even over-national) consistent geochemical database that provides baseline information on the abundance, temporal, and spatial variation of chemical elements in groundwater allowing a comprehensive overview of the entire groundwater resources that go beyond the regional or national borders. For these reasons the outcomes of this study should be used in the future for paving the road toward a shared analytical protocol between all the stakeholders involved in groundwater management aiming at developing a long-term groundwater monitoring plan that goes beyond the administrative regions or national borders. The final scope must be an integrated and homogeneous monitoring plan able to continuously highlight the status of wide and complex aquifer systems, like the one presented in this paper.
This could represent a significant added value to the knowledge that has been achieved over the years, by reducing the organizational and administrative fragmentation of water data platforms and local entities, and by bringing significant benefits to the consultation and management processes. However, the process could be quite expensive and time consuming because the implementation would require costs in terms of data management systems, data repositories and portals, as well as sharing analytical methods, data validation and processing by the different local environmental agencies in charge of the activities (ARPAs) or even between bordering Countries.
The main limits highlighted by this study have been in converting, reformatting, combining, and preserving disparate geochemical data (not homogenous analytical pools of metals and compounds, different D.L.s and CRSs, lack of metadata, missing data, etc.,) stored in different archives. It is necessary that the environmental data provided by the different local agencies (or bordering Countries) are homogeneous, consistent in sample collection protocols, analytical methods used, and number of analyzed elements, especially regarding trace elements. Long time-series of water quality observations, based on regular collection and processing, remain critically important for an integrated management of water resources.

Supplementary Materials

The following supporting information can be downloaded at: https://www.mdpi.com/article/10.3390/app12157944/s1, Table S1: Parameters monitored in the Regions; Table S2: Number of total analyzed water samples and % of data after the validation and cleaning processes; Table S3: Descriptive statistics of the database; Table S4: Comparison between cold and warm seasons databases for confined and semi-confined aquifers; Table S5: Comparison between cold and warm seasons database for phreatic aquifers; Figure S1: NO3 distribution; Figure S2. Mn distribution.

Author Contributions

Conceptualization: B.M.S.G. and E.D.; methodology: C.O. and E.D.; validation, B.M.S.G., N.G. and B.C.; formal analysis: C.O. and E.D.; data curation: B.M.S.G., N.G., B.C. and E.D.; writing—original draft preparation, B.M.S.G. and C.O.; writing—review and editing: B.M.S.G., N.G., B.C. and E.D.; supervision: E.D. All authors have read and agreed to the published version of the manuscript.

Funding

This research received no external funding.

Acknowledgments

The authors would like to thank the Regional Agency for Prevention, Environment and Energy of Piedmont, Lombardy, Veneto, Friuli-Venezia Giulia, and Emilia-Romagna for providing the datasets and technical support.

Conflicts of Interest

The authors declare no conflict of interest.

References

  1. Sugg, Z. Social Barriers to Open (Water) Data. WIREs Water 2022, 9, e1564. [Google Scholar] [CrossRef]
  2. Qiu, W.; Ma, T.; Wang, Y.; Cheng, J.; Su, C.; Li, J. Review on Status of Groundwater Database and Application Prospect in Deep-Time Digital Earth Plan. Geosci. Front. 2022, 13, 101383. [Google Scholar] [CrossRef]
  3. Vetrò, A.; Canova, L.; Torchiano, M.; Minotas, C.O.; Iemma, R.; Morando, F. Open Data Quality Measurement Framework: Definition and Application to Open Government Data. Gov. Inf. Q. 2016, 33, 325–337. [Google Scholar] [CrossRef] [Green Version]
  4. Burt, T.P.; Howden, N.J.K.; Worrall, F. On the Importance of Very Long-term Water Quality Records. WIREs Water 2014, 1, 41–48. [Google Scholar] [CrossRef] [Green Version]
  5. Normattiva. Decreto Legislativo 3 Aprile 2006, n. 152 Norma in Materia Ambientale. Normattiva. 2006. Available online: https://www.normattiva.it/uri-res/N2Ls?urn:nir:stato:decreto.legislativo:2006-04-03;152 (accessed on 12 February 2022).
  6. Water Framework Directive (WFD). 2000, pp. 1–73. Available online: https://eur-lex.europa.eu/legal-content/EN/TXT/?uri=CELEX:32000L0060 (accessed on 14 February 2022).
  7. Appelo, C.A.J.; Postma, D. Geochemistry, Groundwater and Pollution; Appelo, C.A.J., Postma, D., Eds.; CRC Press: Boca Raton, FL, USA, 2004; ISBN 978-0-429-15232-0. [Google Scholar]
  8. Greggio, N.; Giambastiani, B.M.S.; Mollema, P.; Laghi, M.; Capo, D.; Gabbianelli, G.; Antonellini, M.; Dinelli, E. Assessment of the Main Geochemical Processes Affecting Surface Water and Groundwater in a Low-Lying Coastal Area: Implications for Water Management. Water 2020, 12, 1720. [Google Scholar] [CrossRef]
  9. Winter, T.C.; Harvey, J.W.; Franke, O.L.; Alley, W.M. Ground Water and Surface Water—A Single Resource; U.S. Geological Survey Circular 1139; U.S. Geological Survey: Reston, VA, USA, 1998; ISBN 0-607-89339-7. [Google Scholar]
  10. Kharraz, J.E.; El-Sadek, A.; Ghaffour, N.; Mino, E. Water Scarcity and Drought in WANA Countries. Procedia Eng. 2012, 33, 14–29. [Google Scholar] [CrossRef] [Green Version]
  11. Wu, W.-Y.; Lo, M.-H.; Wada, Y.; Famiglietti, J.S.; Reager, J.T.; Yeh, P.J.-F.; Ducharne, A.; Yang, Z.-L. Divergent Effects of Climate Change on Future Groundwater Availability in Key Mid-Latitude Aquifers. Nat. Commun. 2020, 11, 3710. [Google Scholar] [CrossRef]
  12. El Osta, M.; Niyazi, B.; Masoud, M. Groundwater Evolution and Vulnerability in Semi-Arid Regions Using Modeling and GIS Tools for Sustainable Development: Case Study of Wadi Fatimah, Saudi Arabia. Environ. Earth Sci. 2022, 81, 248. [Google Scholar] [CrossRef]
  13. Zittis, G.; Hadjinicolaou, P.; Klangidou, M.; Proestos, Y.; Lelieveld, J. A Multi-Model, Multi-Scenario, and Multi-Domain Analysis of Regional Climate Projections for the Mediterranean. Reg. Environ. Chang. 2019, 19, 2621–2635. [Google Scholar] [CrossRef] [Green Version]
  14. Bruno, L.; Bohacs, K.M.; Campo, B.; Drexler, T.M.; Rossi, V.; Sammartino, I.; Scarponi, D.; Hong, W.; Amorosi, A. Early Holocene Transgressive Palaeogeography in the Po Coastal Plain (Northern Italy). Sedimentology 2017, 64, 1792–1816. [Google Scholar] [CrossRef]
  15. Dinelli, E.; Lucchini, F. Sediment Supply to the Adriatic Sea Basin from the Italian Rivers: Geochemical Features and Environmental Constraints. G. Geol. 1999, 61, 121–132. [Google Scholar]
  16. Amorosi, A.; Centineo, M.C.; Dinelli, E.; Lucchini, F.; Tateo, F. Geochemical and Mineralogical Variations as Indicators of Provenance Changes in Late Quaternary Deposits of SE Po Plain. Sediment. Geol. 2002, 151, 273–292. [Google Scholar] [CrossRef]
  17. Lugli, S.; Bassetti, M.A.; Manzi, V.; Barbieri, M.; Longinelli, A.; Roveri, M. The Messinian ‘Vena Del Gesso’ Evaporites Revisited: Characterization of Isotopic Composition and Organic Matter. Geol. Soc. Lond. Spec. Publ. 2007, 285, 179–190. [Google Scholar] [CrossRef]
  18. Castiglioni, G.B. Geomorphology of the Po Plain. Geogr. Fis. E Din. Quat. 1999, 7–20. [Google Scholar]
  19. Pieri, M.; Groppi, G. Subsurface Geological Structure of the Po Plain, Italy. Progett. Final. Geodin. 1981, 414, 1–23. [Google Scholar]
  20. Picotti, V.; Pazzaglia, F.J. A New Active Tectonic Model for the Construction of the Northern Apennines Mountain Front near Bologna (Italy): Active construction Apennines front. J. Geophys. Res. 2008, 113, B08412. [Google Scholar] [CrossRef] [Green Version]
  21. Bigi, G.; Cosentino, D.; Parotto, M.; Sartori, R.; Scandone, P. CNR Structural Model of Italy. Scale 1:500.000, Sheets I-II-III-IV; Selca Publisher: Firenze, Italy, 1990. [Google Scholar]
  22. Ori, G.G. Continental Depositional Systems of the Quaternary of the Po Plain (Northern Italy). Sediment. Geol. 1993, 83, 1–14. [Google Scholar] [CrossRef]
  23. Ricci Lucchi, F.; Colalongo, M.L.; Cremonini, G.; Gasperi, G.; Iaccarino, S.; Papani, G.; Raffi, I.; Rio, D. Evoluzione Sedimentaria e Paleogeografica Del Margine Appenninico. In Guida Alla Geologia del Margine Appenninico-Padano, Guide Geologiche Regionali; Cremonini, G., Ricci Lucchi, F., Eds.; Societa Geologiche Italiana: Bologna, Italy, 1982. [Google Scholar]
  24. Amorosi, A.; Pavesi, M.; Ricci Lucchi, M.; Sarti, G.; Piccin, A. Climatic Signature of Cyclic Fluvial Architecture from the Quaternary of the Central Po Plain, Italy. Sediment. Geol. 2008, 209, 58–68. [Google Scholar] [CrossRef]
  25. Amorosi, A.; Colalongo, M.L.; Fiorini, F.; Fusco, F.; Pasini, G.; Vaiani, S.C.; Sarti, G. Palaeogeographic and Palaeoclimatic Evolution of the Po Plain from 150-Ky Core Records. Glob. Planet. Chang. 2004, 40, 55–78. [Google Scholar] [CrossRef]
  26. Campo, B.; Bruno, L.; Amorosi, A. Basin-Scale Stratigraphic Correlation of Late Pleistocene-Holocene (MIS 5e-MIS 1) Strata across the Rapidly Subsiding Po Basin (Northern Italy). Quat. Sci. Rev. 2020, 237, 106300. [Google Scholar] [CrossRef]
  27. Massari, F.; Rio, D.; Serandrei Barbero, R.; Asioli, A.; Capraro, L.; Fornaciari, E.; Vergerio, P.P. The Environment of Venice Area in the Past Two Million Years. Palaeogeogr. Palaeoclimatol. Palaeoecol. 2004, 202, 273–308. [Google Scholar] [CrossRef]
  28. Fontana, A.; Mozzi, P.; Bondesan, A. Late Pleistocene Evolution of the Venetian–Friulian Plain. Rend. Fis. Acc. Lincei 2010, 21, 181–196. [Google Scholar] [CrossRef]
  29. Amorosi, A.; Bruno, L.; Campo, B.; Costagli, B.; Dinelli, E.; Hong, W.; Sammartino, I.; Vaiani, S.C. Tracing Clinothem Geometry and Sediment Pathways in the Prograding Holocene Po Delta System through Integrated Core Stratigraphy. Basin Res. 2020, 32, 206–215. [Google Scholar] [CrossRef] [Green Version]
  30. Bruno, L.; Piccin, A.; Sammartino, I.; Amorosi, A. Decoupled Geomorphic and Sedimentary Response of Po River and Its Alpine Tributaries during the Last Glacial/Post-Glacial Episode. Geomorphology 2018, 317, 184–198. [Google Scholar] [CrossRef]
  31. Fontana, A.; Mozzi, P.; Bondesan, A. Alluvial Megafans in the Venetian–Friulian Plain (North-Eastern Italy): Evidence of Sedimentary and Erosive Phases during Late Pleistocene and Holocene. Quat. Int. 2008, 189, 71–90. [Google Scholar] [CrossRef]
  32. Fontana, A.; Mozzi, P.; Marchetti, M. Alluvial Fans and Megafans along the Southern Side of the Alps. Sediment. Geol. 2014, 301, 150–171. [Google Scholar] [CrossRef]
  33. Amorosi, A.; Farina, M.; Severi, P.; Preti, D.; Caporale, L.; Di Dio, G. Genetically Related Alluvial Deposits across Active Fault Zones: An Example of Alluvial Fan-Terrace Correlation from the Upper Quaternary of the Southern Po Basin, Italy. Sediment. Geol. 1996, 102, 275–295. [Google Scholar] [CrossRef]
  34. Brandolini, F.; Carrer, F. Assessing the Role of Alluvial Geomorphology for Late-Holocene Settlement Strategies (Po Plain–N Italy) through Point Pattern Analysis. Environ. Archaeol. 2021, 26, 511–525. [Google Scholar] [CrossRef]
  35. Campo, B.; Bohacs, K.M.; Amorosi, A. Late Quaternary Sequence Stratigraphy as a Tool for Groundwater Exploration: Lessons from the Po River Basin (Northern Italy). Bulletin 2020, 104, 681–710. [Google Scholar] [CrossRef]
  36. Amorosi, A.; Pavesi, M. Memorie Descrittive della Carta Geologica d’Italia; ISPRA: Rome, Italy, 2009; pp. 7–20. [Google Scholar]
  37. Bersezio, R.; Bini, A.; Felletti, F. Il Quaternario; 2004; pp. 361–378. [Google Scholar]
  38. De Luca, D.A.; Lasagna, M.; Debernardi, L. Hydrogeology of the Western Po Plain (Piedmont, NW Italy). J. Maps 2020, 16, 265–273. [Google Scholar] [CrossRef]
  39. Regione Emilia-Romagna. ENI-AGIP Riserve Idriche Sotterranee della Regione Emilia-Romagna; S.EL.CA: Firenze, Italy, 1998. [Google Scholar]
  40. Regione Lombardia. ENI-AGIP Geologia Degli Acquiferi Padani della Regione Lombardia; S.EL.CA: Firenze, Italy, 2002. [Google Scholar]
  41. Fabbri, P.; Piccinini, L. Assessing Transmissivity from Specific Capacity in an Alluvial Aquifer in the Middle Venetian Plain (NE Italy). Water Sci. Technol. 2013, 67, 2000–2008. [Google Scholar] [CrossRef]
  42. Martinelli, G.; Dadomo, A.; De Luca, D.A.; Mazzola, M.; Lasagna, M.; Pennisi, M.; Pilla, G.; Sacchi, E.; Saccon, P. Nitrate Sources, Accumulation and Reduction in Groundwater from Northern Italy: Insights Provided by a Nitrate and Boron Isotopic Database. Appl. Geochem. 2018, 91, 23–35. [Google Scholar] [CrossRef]
  43. Giambastiani, B.M.S.; Colombani, N.; Mastrocicco, M.; Fidelibus, M.D. Characterization of the Lowland Coastal Aquifer of Comacchio (Ferrara, Italy): Hydrology, Hydrochemistry and Evolution of the System. J. Hydrol. 2013, 501, 35–44. [Google Scholar] [CrossRef]
  44. Giambastiani, B.M.; Colombani, N.; Mastrocicco, M. Multilevel characterization of vertical hydraulic gradients, permeability, temperature and salinity in shallow coastal aquifers with low pressure packers. In Proceedings of the 22nd Salt Water Intrusion Meeting: Salt Water Intrusion in Aquifers: Challenges and Perspectives, Cagliari, Italy; 2012; pp. 140–143. [Google Scholar]
  45. Mastrocicco, M.; Giambastiani, B.M.S.; Severi, P.; Colombani, N. The Importance of Data Acquisition Techniques in Saltwater Intrusion Monitoring. Water Resour. Manag. 2012, 26, 2851–2866. [Google Scholar] [CrossRef]
  46. Vorlicek, P.A.; Antonelli, R.; Fabbri, P.; Rausch, R. Quantitative Hydrogeological Studies of the Treviso Alluvial Plain, NE Italy. Q. J. Eng. Geol. Hydrogeol. 2004, 37, 23–29. [Google Scholar] [CrossRef] [Green Version]
  47. De Luca, D.A.; Destefanis, E.; Forno, M.G.; Lasagna, M.; Masciocco, L. The Genesis and the Hydrogeological Features of the Turin Po Plain Fontanili, Typical Lowland Springs in Northern Italy. Bull. Eng. Geol. Env. 2014, 73, 109–427. [Google Scholar] [CrossRef]
  48. Fumagalli, N.; Senes, G.; Ferrario, P.S.; Toccolini, A. A Minimum Indicator Set for Assessing Fontanili (Lowland Springs) of the Lombardy Region in Italy. Eur. Countrys. 2017, 9, 1–16. [Google Scholar] [CrossRef] [Green Version]
  49. D.Lgs 30/09 Attuazione Della Direttiva 2006/118/CE, Relativa Alla Protezione Delle Acque Sotterranee Dall’inquinamento e Dal Deterioramento. Off. Gaz. 2009. Available online: https://www.normattiva.it/uri-res/N2Ls?urn:nir:stato:decreto.legislativo:2009-03-16;30 (accessed on 20 February 2022).
  50. D.M. 260/10 Regolamento Recante i Criteri Tecnici per La Classificazione Dello Stato Dei Corpi Idrici Superficiali; Ministero Dell’ambiente e della Tutela del Territorio e del Mare: Rome, Italy, 2011.
  51. Helsel, D.R.; Hirsch, R.M. Statistical Methods in Water Resources. In Techniques of Water-Resources Investigations of the United States Geological Survey; Hydrologic Analysis and Interpretation; U.S. Geological Survey: Reston, VA, USA, 2022; Book 4. [Google Scholar]
  52. Harter, T. Nondetects and Data Analysis: Statistics for Censored Environmental Data. Vadose Zone J. 2006, 5, 508–509. [Google Scholar] [CrossRef]
  53. Lee, L.; Helsel, D. Statistical Analysis of Water-Quality Data Containing Multiple Detection Limits II: S-Language Software for Nonparametric Distribution Modeling and Hypothesis Testing. Comput. Geosci. 2007, 33, 696–704. [Google Scholar] [CrossRef]
  54. Kruskal, W.H. A Nonparametric Test for the Several Sample Problem. Ann. Math. Statist. 1952, 23, 525–540. [Google Scholar] [CrossRef]
  55. Kruskal, W.H.; Wallis, W.A. Use of Ranks in One-Criterion Variance Analysis. J. Am. Stat. Assoc. 1952, 47, 583–621. [Google Scholar] [CrossRef]
  56. Langelier, W.F.; Ludwig, H.F. Graphical Methods for Indicating the Mineral Character of Natural Waters. J. Am. Water Work Assoc. 1942, 34, 335–352. [Google Scholar] [CrossRef]
  57. Antonellini, M.; Mollema, P.; Giambastiani, B.; Bishop, K.; Caruso, L.; Minchio, A.; Pellegrini, L.; Sabia, M.; Ulazzi, E.; Gabbianelli, G. Salt Water Intrusion in the Coastal Aquifer of the Southern Po Plain, Italy. Hydrogeol. J. 2008, 16, 1541–1556. [Google Scholar] [CrossRef]
  58. Colombani, N.; Mastrocicco, M.; Giambastiani, B.M.S. Predicting Salinization Trends in a Lowland Coastal Aquifer: Comacchio (Italy). Water Resour. Manag. 2015, 29, 603–618. [Google Scholar] [CrossRef]
  59. Giambastiani, B.M.S.; Kidanemariam, A.; Dagnew, A.; Antonellini, M. Evolution of Salinity and Water Table Level of the Phreatic Coastal Aquifer of the Emilia Romagna Region (Italy). Water 2021, 13, 372. [Google Scholar] [CrossRef]
  60. De Waele, J.; Piccini, L.; Columbu, A.; Madonia, G.; Vattano, M.; Calligaris, C.; D’Angeli, I.; Parise, M.; Chiesi, M.; Sivelli, M.; et al. Evaporite Karst in Italy: A Review. IJS 2017, 46, 137–168. [Google Scholar] [CrossRef] [Green Version]
  61. Conti, A.; Sacchi, E.; Chiarle, M.; Martinelli, G.; Zuppi, G.M. Geochemistry of the Formation Waters in the Po Plain (Northern Italy): An Overview. Appl. Geochem. 2000, 15, 51–65. [Google Scholar] [CrossRef]
  62. Pilla, G.; Sacchi, E.; Zuppi, G.; Braga, G.; Ciancetti, G. Hydrochemistry and Isotope Geochemistry as Tools for Groundwater Hydrodynamic Investigation in Multilayer Aquifers: A Case Study from Lomellina, Po Plain, South-Western Lombardy, Italy. Hydrogeol. J. 2006, 14, 795–808. [Google Scholar] [CrossRef]
  63. Martelli, G.; Granati, C. Hydrochemical general characteristics of the Friuli Plain’s deep aquifers (Northern Italy). Ital. J. Eng. Geol. Environ. 2010, 1, 79–92. [Google Scholar] [CrossRef]
  64. Golubić, S.; Schneider, J. Chapter 2.4 Carbonate Dissolution. In Studies in Environmental Science; Elsevier: Amsterdam, The Netherlands, 1979; Volume 3, pp. 107–129. ISBN 978-0-444-41745-9. [Google Scholar]
  65. Piana, F.; Fioraso, G.; Irace, A.; Mosca, P.; d’Atri, A.; Barale, L.; Falletti, P.; Monegato, G.; Morelli, M.; Tallone, S.; et al. Geology of Piemonte Region (NW Italy, Alps–Apennines Interference Zone). J. Maps 2017, 13, 395–405. [Google Scholar] [CrossRef]
  66. Dal Piaz, G.V. The Italian Alps: A journey across two centuries of Alpine geology. The Geology of Italy: Tectonics and life along plate margins. J. Virtual Explor. 2010, 36, 77–106. [Google Scholar] [CrossRef]
  67. Manzi, V.; Lugli, S.; Lucchi, F.R.; Roveri, M. Deep-Water Clastic Evaporites Deposition in the Messinian Adriatic Foredeep (Northern Apennines, Italy): Did the Mediterranean Ever Dry Out? Sedimentology 2005, 52, 875–902. [Google Scholar] [CrossRef]
  68. Pilla, G.; Sacchi, E.; Gerbert-Gaillard, L.; Zuppi, G.M.; Peloso, G.F.; Ciancetti, G.G. Origine e distribuzione dei nitrati in falda nella Pianura Padana occidentale (Province di Novara, Alessandria e Pavia). Geol. Appl. 2005, 2, 144–150. [Google Scholar]
  69. Martinelli, G.; Chahoud, A.; Dadomo, A.; Fava, A. Isotopic Features of Emilia-Romagna Region (North Italy) Groundwaters: Environmental and Climatological Implications. J. Hydrol. 2014, 519, 1928–1938. [Google Scholar] [CrossRef]
  70. Mollema, P.N.; Antonellini, M.; Dinelli, E.; Gabbianelli, G.; Greggio, N.; Stuyfzand, P.J. Hydrochemical and Physical Processes Influencing Salinization and Freshening in Mediterranean Low-Lying Coastal Environments. Appl. Geochem. 2013, 34, 207–221. [Google Scholar] [CrossRef]
  71. Mastrocicco, M.; Colombani, N. The Issue of Groundwater Salinization in Coastal Areas of the Mediterranean Region: A Review. Water 2021, 13, 90. [Google Scholar] [CrossRef]
  72. Deng, Y.; Wang, Y.; Ma, T. Isotope and Minor Element Geochemistry of High Arsenic Groundwater from Hangjinhouqi, the Hetao Plain, Inner Mongolia. Appl. Geochem. 2009, 24, 587–599. [Google Scholar] [CrossRef]
  73. Jiang, Y.; Wu, Y.; Groves, C.; Yuan, D.; Kambesis, P. Natural and Anthropogenic Factors Affecting the Groundwater Quality in the Nandong Karst Underground River System in Yunan, China. J. Contam. Hydrol. 2009, 109, 49–61. [Google Scholar] [CrossRef] [PubMed]
  74. Huang, G.; Sun, J.; Zhang, Y.; Chen, Z.; Liu, F. Impact of Anthropogenic and Natural Processes on the Evolution of Groundwater Chemistry in a Rapidly Urbanized Coastal Area, South China. Sci. Total Environ. 2013, 463–464, 209–221. [Google Scholar] [CrossRef]
  75. Vanzetti, C.; Gianoglio, N.; Sesia, E. ARPA Piemonte. Studio sulla Contaminazione Diffusa da Solventi Clorurati nelle Acque Sotterranee 2016. Available online: https://www.arpa.piemonte.it/approfondimenti/temi-ambientali/acqua/acque-sotterranee/studio-sulla-contaminazione-diffusa-da-solventi-clorurati-nelle-acque-sotterranee (accessed on 1 March 2022).
  76. Margiotta, S.; Mongelli, G.; Summa, V.; Paternoster, M.; Fiore, S. Trace Element Distribution and Cr(VI) Speciation in Ca-HCO3 and Mg-HCO3 Spring Waters from the Northern Sector of the Pollino Massif, Southern Italy. J. Geochem. Explor. 2012, 115, 1–12. [Google Scholar] [CrossRef]
  77. Morrison, J.M.; Goldhaber, M.B.; Mills, C.T.; Breit, G.N.; Hooper, R.L.; Holloway, J.M.; Diehl, S.F.; Ranville, J.F. Weathering and Transport of Chromium and Nickel from Serpentinite in the Coast Range Ophiolite to the Sacramento Valley, California, USA. Appl. Geochem. 2015, 61, 72–86. [Google Scholar] [CrossRef]
  78. Chiogna, G.; Skrobanek, P.; Narany, T.S.; Ludwig, R.; Stumpp, C. Effects of the 2017 Drought on Isotopic and Geochemical Gradients in the Adige Catchment, Italy. Sci. Total Environ. 2018, 645, 924–936. [Google Scholar] [CrossRef]
  79. Giuliano, G. Ground Water in the Po Basin: Some Problems Relating to Its Use and Protection. Sci. Total Environ. 1995, 171, 17–27. [Google Scholar] [CrossRef]
  80. Soana, E.; Racchetti, E.; Laini, A.; Bartoli, M.; Viaroli, P. Soil Budget, Net Export, and Potential Sinks of Nitrogen in the Lower Oglio River Watershed (Northern Italy). Clean Soil Air Water 2011, 39, 956–965. [Google Scholar] [CrossRef]
  81. Lasagna, M.; De Luca, D.A.; Franchino, E. Nitrate Contamination of Groundwater in the Western Po Plain (Italy): The Effects of Groundwater and Surface Water Interactions. Environ. Earth Sci. 2016, 75, 240. [Google Scholar] [CrossRef]
  82. Rotiroti, M.; Bonomi, T.; Sacchi, E.; McArthur, J.M.; Stefania, G.A.; Zanotti, C.; Taviani, S.; Patelli, M.; Nava, V.; Soler, V.; et al. The Effects of Irrigation on Groundwater Quality and Quantity in a Human-Modified Hydro-System: The Oglio River Basin, Po Plain, Northern Italy. Sci. Total Environ. 2019, 672, 342–356. [Google Scholar] [CrossRef]
  83. Viaroli, P.; Soana, E.; Pecora, S.; Laini, A.; Naldi, M.; Fano, E.A.; Nizzoli, D. Space and Time Variations of Watershed N and P Budgets and Their Relationships with Reactive N and P Loadings in a Heavily Impacted River Basin (Po River, Northern Italy). Sci. Total Environ. 2018, 639, 1574–1587. [Google Scholar] [CrossRef] [PubMed]
  84. D.Lgs 31/01 Attuazione Della Direttiva 98/83/CE Relativa Alla Qualità Delle Acque Destinate al Consumo Umano. Off. Gaz. 2001. Available online: https://web.camera.it/parlam/leggi/deleghe/01031dl.htm (accessed on 2 March 2022).
  85. ARPAV. Le Acque Sotterranee Della Pianura Veneta-I Risultati Del Progetto SAMPAS; ARPAV: Venice, Italy, 2008. [Google Scholar]
  86. ARPAE. Valutazione dello Stato delle Acque Sotterranee 2014; ARPAE: Casalecchio Di Reno, Italy, 2018. [Google Scholar]
  87. Mastrocicco, M.; Giambastiani, B.M.S.; Colombani, N. Ammonium Occurrence in a Salinized Lowland Coastal Aquifer (Ferrara, Italy). Hydrol. Processes. 2013, 27, 3495–3501. [Google Scholar] [CrossRef]
  88. Azadi, A.; Baghernejad, M.; Gholami, A.; Shakeri, S. Forms and Distribution Pattern of Soil Fe (Iron) and Mn (Manganese) Oxides Due to Long-Term Rice Cultivation in Fars Province Southern Iran. Commun. Soil Sci. Plant Anal. 2021, 52, 1894–1911. [Google Scholar] [CrossRef]
  89. Zhai, Y.; Cao, X.; Xia, X.; Wang, B.; Teng, Y.; Li, X. Elevated Fe and Mn Concentrations in Groundwater in the Songnen Plain, Northeast China, and the Factors and Mechanisms Involved. Agronomy 2021, 11, 2392. [Google Scholar] [CrossRef]
  90. Rotiroti, M.; Fumagalli, L.; Bonomi, T. Come gestire potenziali contaminazioni da As, Fe e Mn nelle acque sotterranee della bassa Pianura Padana: Una proposta dal caso studio di Cremona. Acque Sotter.-Ital. J. Groundw. 2014, 2, 9–16. [Google Scholar] [CrossRef]
  91. Postma, D.; Larsen, F.; Minh Hue, N.T.; Duc, M.T.; Viet, P.H.; Nhan, P.Q.; Jessen, S. Arsenic in Groundwater of the Red River Floodplain, Vietnam: Controlling Geochemical Processes and Reactive Transport Modeling. Geochim. Cosmochim. Acta 2007, 71, 5054–5071. [Google Scholar] [CrossRef]
  92. Guo, H.; Zhang, D.; Wen, D.; Wu, Y.; Ni, P.; Jiang, Y.; Guo, Q.; Li, F.; Zheng, H.; Zhou, Y. Arsenic Mobilization in Aquifers of the Southwest Songnen Basin, P.R. China: Evidences from Chemical and Isotopic Characteristics. Sci. Total Environ. 2014, 490, 590–602. [Google Scholar] [CrossRef]
  93. Carraro, A.; Fabbri, P.; Giaretta, A.; Peruzzo, L.; Tateo, F.; Tellini, F. Effects of Redox Conditions on the Control of Arsenic Mobility in Shallow Alluvial Aquifers on the Venetian Plain (Italy). Sci. Total Environ. 2015, 532, 581–594. [Google Scholar] [CrossRef] [PubMed]
  94. Rotiroti, M.; Jakobsen, R.; Fumagalli, L.; Bonomi, T. Arsenic Release and Attenuation in a Multilayer Aquifer in the Po Plain (Northern Italy): Reactive Transport Modeling. Appl. Geochem. 2015, 63, 599–609. [Google Scholar] [CrossRef]
  95. Miola, A.; Bondesan, A.; Corain, L.; Favaretto, S.; Mozzi, P.; Piovan, S.; Sostizzo, I. Wetlands in the Venetian Po Plain (Northeastern Italy) during the Last Glacial Maximum: Interplay between Vegetation, Hydrology and Sedimentary Environment. Rev. Palaeobot. Palynol. 2006, 141, 53–81. [Google Scholar] [CrossRef]
  96. Rotiroti, M.; McArthur, J.; Fumagalli, L.; Stefania, G.A.; Sacchi, E.; Bonomi, T. Pollutant Sources in an Arsenic-Affected Multilayer Aquifer in the Po Plain of Italy: Implications for Drinking-Water Supply. Sci. Total Environ. 2017, 578, 502–512. [Google Scholar] [CrossRef] [Green Version]
  97. Carraro, A.; Fabbri, P.; Giaretta, A.; Peruzzo, L.; Tateo, F.; Tellini, F. Arsenic Anomalies in Shallow Venetian Plain (Northeast Italy) Groundwater. Environ. Earth Sci 2013, 70, 3067–3084. [Google Scholar] [CrossRef]
  98. ARPAE. Valori di Fondo Naturale di Arsenico Negli Acquiferi Profondi di Pianura per Classificare lo Stato Chimico delle Acque Sotterranee; ARPAE: Casalecchio Di Reno, Italy, 2012. [Google Scholar]
Figure 2. Boxplot of the geochemical parameters grouped according to aquifer type.
Applsci 12 07944 g002
Figure 3. 2018 Hardness distribution in the (a) phreatic, and (b) semi-confined and confined aquifers.
Applsci 12 07944 g003
Figure 4. 2018 EC distribution in the (a) phreatic, and (b) semi-confined and confined aquifers.
Applsci 12 07944 g004
Figure 5. Distribution of hydrochemical facies in the (a) phreatic, and (b) semi-confined and confined aquifers with related Langelier–Ludwig diagrams.
Applsci 12 07944 g005
Figure 6. NH4+ distribution in the (a) phreatic, and (b) semi-confined and confined aquifers.
Applsci 12 07944 g006
Figure 7. Correlation between HCO3 and NH4+ among the confined and semi-confined aquifers.
Applsci 12 07944 g007
Figure 8. Fe distribution in the (a) phreatic, and (b) semi-confined and confined aquifers.
Applsci 12 07944 g008
Figure 9. As distribution in the (a) phreatic, and (b) semi-confined and confined aquifers.
Applsci 12 07944 g009
Table 1. Descriptive statistics of the main chemical–physical parameters and ions concentrations grouped according to the aquifer type. * Parameters significantly different between seasons (Krustal–Wallis value < 0.05).
Confined and Semi-Confined AquifersPhreatic Aquifers
ParameterTotal ObsMissing ObsValid ObsMinMaxMeanStd. Dev.Total ObsMissing ObsValid ObsMinMaxMeanStd. Dev.Kruskal–Wallis
Hardness (mg/L)142819140921503274.6164.42243202223134950322.2234.0<0.0001 *
T (°C)1428376105283115.21.722436471596626.315.22.20.767
pH142824140469.17.50.322435021935.58.77.30.4<0.0001 *
Eh (mV)14281020408−19529230.7118.822431832411−121504152.392.8<0.0001 *
EC (μS/cm)1428201408916284643.6555.022433122126335,603704.11464.30.001 *
Ca (mg/L)1428191409127670.542.722431722267.8450.190.344.4<0.0001 *
Mg (mg/L)14282014083.122924.420.02243182225181624.339.80.096
Na (mg/L)14281914091125347.798.822431922240.58310.538.3331.6<0.0001 *
K (mg/L)14281614120.195.12.23.722431722260.1423.15.522.9<0.0001 *
HCO3 (mg/L)1428691359442385350.3217.922431372106231564320.5154.80.191
SO42− (mg/L)14283613920.552631.946.722433422090.5188852.589.0<0.0001 *
Cl (mg/L)14282414040.5187045.8149.022433522080.514,36263.9608.0<0.0001 *
PO43− (mg/L)142818512430.0013.1880.10.3224353217110.00122.90.10.7<0.0001 *
NO3 (mg/L)14282314050.011669.315.722433222110.0119022.521.0<0.0001 *
NO2 (mg/L)14286013680.131916.696.4224310021430.110858.043.7<0.0001 *
NH4+ (mg/L)14282014080.00143.21.43.722433122120.00150.00.32.2<0.0001 *
F (μg/L)1428128130013000125.6249.9224339518481106440.994.4<0.0001 *
Fe (μg/L)14283113970.0521,200682.51803.0224310121420.0520,100277.11190.6<0.0001 *
Mn (μg/L)14283213960.001265991.7202.222439821450.001286374.0229.8<0.0001 *
As (μg/L)142836310650.014347.727.9224371515280.013422.312.8<0.0001 *
Ba (μg/L)14288405880.12536285.7307.0224316535900.11059125.8145.0<0.0001 *
B (μg/L)142837010580.0012120209.4325.0224369815450.001196582.3175.6<0.0001 *
Zn (μg/L)14283713910.112,689139.4632.1224316020830.111,900106.1514.90.091
Publisher’s Note: MDPI stays neutral with regard to jurisdictional claims in published maps and institutional affiliations.

