Article

Cold Atmospheric Pressure Plasma Jet Operated in Ar and He: From Basic Plasma Properties to Vacuum Ultraviolet, Electric Field and Safety Thresholds Measurements in Plasma Medicine

by
Andrei Vasile Nastuta
1,* and
Torsten Gerling
2,3,*
1
Physics and Biophysics Education Research Laboratory (P&B-EduResLab), Biomedical Science Department, Faculty of Medical Bioengineering, ‘Grigore T. Popa’ University of Medicine and Pharmacy Iasi, Str. M. Kogalniceanu No. 9-13, 700454 Iasi, Romania
2
ZIK plasmatis, Leibniz Institute for Plasma Science and Technology (INP), Felix-Hausdorff-Str. 2, 17489 Greifswald, Germany
3
Diabetes Competence Centre Karlsburg (KDK), Leibniz Institute for Plasma Science and Technology (INP), 17495 Karlsburg, Germany
*
Authors to whom correspondence should be addressed.
Appl. Sci. 2022, 12(2), 644; https://doi.org/10.3390/app12020644
Submission received: 21 December 2021 / Revised: 5 January 2022 / Accepted: 6 January 2022 / Published: 10 January 2022
(This article belongs to the Special Issue Frontiers in Atmospheric Pressure Plasma Technology)

Abstract

:
Application desired functionality as well as operation expenses of cold atmospheric pressure plasma (CAP) devices scale with properties like gas selection. The present contribution provides a comparative investigation for a CAP system operated in argon or helium at different operation voltages and distance to the surface. Comparison of power dissipation, electrical field strength and optical emission spectroscopy from vacuum ultraviolet over visible up to near infrared ((V)UV-VIS-NIR) spectral range is carried out. This study is extended to safety relevant investigation of patient leakage current, induced surface temperature and species density for ozone (O 3 ) and nitrogen oxides (NO x ). It is found that in identical operation conditions (applied voltage, distance to surface and gas flow rate) the dissipated plasma power is about equal (up to 10 W), but the electrical field strength differs, having peak values of 320 kV/m for Ar and up to 300 kV/m for He. However, only for Ar CAP could we measure O 3 up to 2 ppm and NO x up to 7 ppm. The surface temperature and leakage values of both systems showed different slopes, with the biggest surprise being a constant leakage current over distance for argon. These findings may open a new direction in the plasma source development for Plasma Medicine.

1. Introduction

Cold atmospheric pressure plasma (CAP) sources are rapidly gaining importance as tools for material processing worldwide, since they are easy to use, technologically simple and environmentally friendly. Applications of these plasmas include: surface modification and deposition, plasma-based synthesis of bio-medical surfaces, decontamination and sterilization, oncotherapy and wound healing. Depending on the application, the plasma source must be tuned as to fulfill the application requirements. This is why it is important to characterize and monitor plasma sources from electrical and optical point of view. CAP’s are nowadays versatile tools involved in many applications, starting from basic surface cleaning to Plasma Medicine (covering also plasma pharmaceutics, plasma oncotherapy, plasma bioengineering, etc.) [1,2,3,4,5,6,7,8,9,10,11,12,13,14,15,16]; plasma for environment, gas conversion and agriculture [17,18,19,20]; plasma for plastics and textiles [21]; plasma for optics and glass [22]; and the future for plasma science and technology [23,24,25]; plasma for aerospace and automotive [26,27,28].
The variety of fields of application for cold atmospheric pressure plasmas each has different implications on the application conditions. While a surface treatment in industry is more flexible with operation temperatures, the reproducibility and long term stability are important conditions. For plasma medicine, it was recently found that the treatment distance impacts the effectivity and the fundamental plasma development [29]. While a close contact treatment produces a conductive operation with the plasma visibly interacting with the surface, at higher distances, the interaction is separated and a non-conductive mode is established. While both modes produce a significant level of reactive species, the composition of species as well as the efficiency of the device change. Furthermore, the literature presents a variety of e.g., plasma jet devices, while some operate in argon and others in helium with no clear comparison between both.
In the past few years, new diagnostic techniques were developed and used for CAP’s characterization, from which few have a significant role, due to the importance of the information that it can bring upfront for better understanding of plasma properties in correlation to future applications. The usage of vacuum-ultra-violet spectroscopy [30,31,32,33,34,35,36,37,38,39] and of electrical field determination through electro-optical crystals (Pockels electro-optic effect based sensors) [40,41,42,43,44] are such diagnostics. While these diagnostics are of a rather complex nature, the measurement of mainly safety relevant and basic characterization plasma values is a necessity when discussing medical usability. In order to evaluate any potential plasma source for a biomedical application with a potential patient contact, an initiative generated a German industrial norm proposal called DIN-specification 91315 [45]. This approach summarizes potential physical, chemical and biological risk aspects as well as performance criteria from plasma devices in application, and it is frequently used for such testings [46,47,48,49,50]. These measurements allow a standard-compliant assessment of the medical potential.
In this study, we report the results obtained from the diagnosis of a cold atmospheric pressure plasma jet running both in helium and argon. Using sinusoidal high voltage excitation, the plasma is generated using the principle of a dielectric barrier discharge inside a capillary. After leaving the dielectric tube, in air, plasma has a jet shape, with a length of up to few centimeters. The combination of the results retrieved from power measurements, safety characterization (leakage current, temperature, toxic species generation), the electrical field determinations and optical studies revealed new insights on the plasma jets properties and its potential applications (from industrial to biomedical ones).

2. Materials and Methods

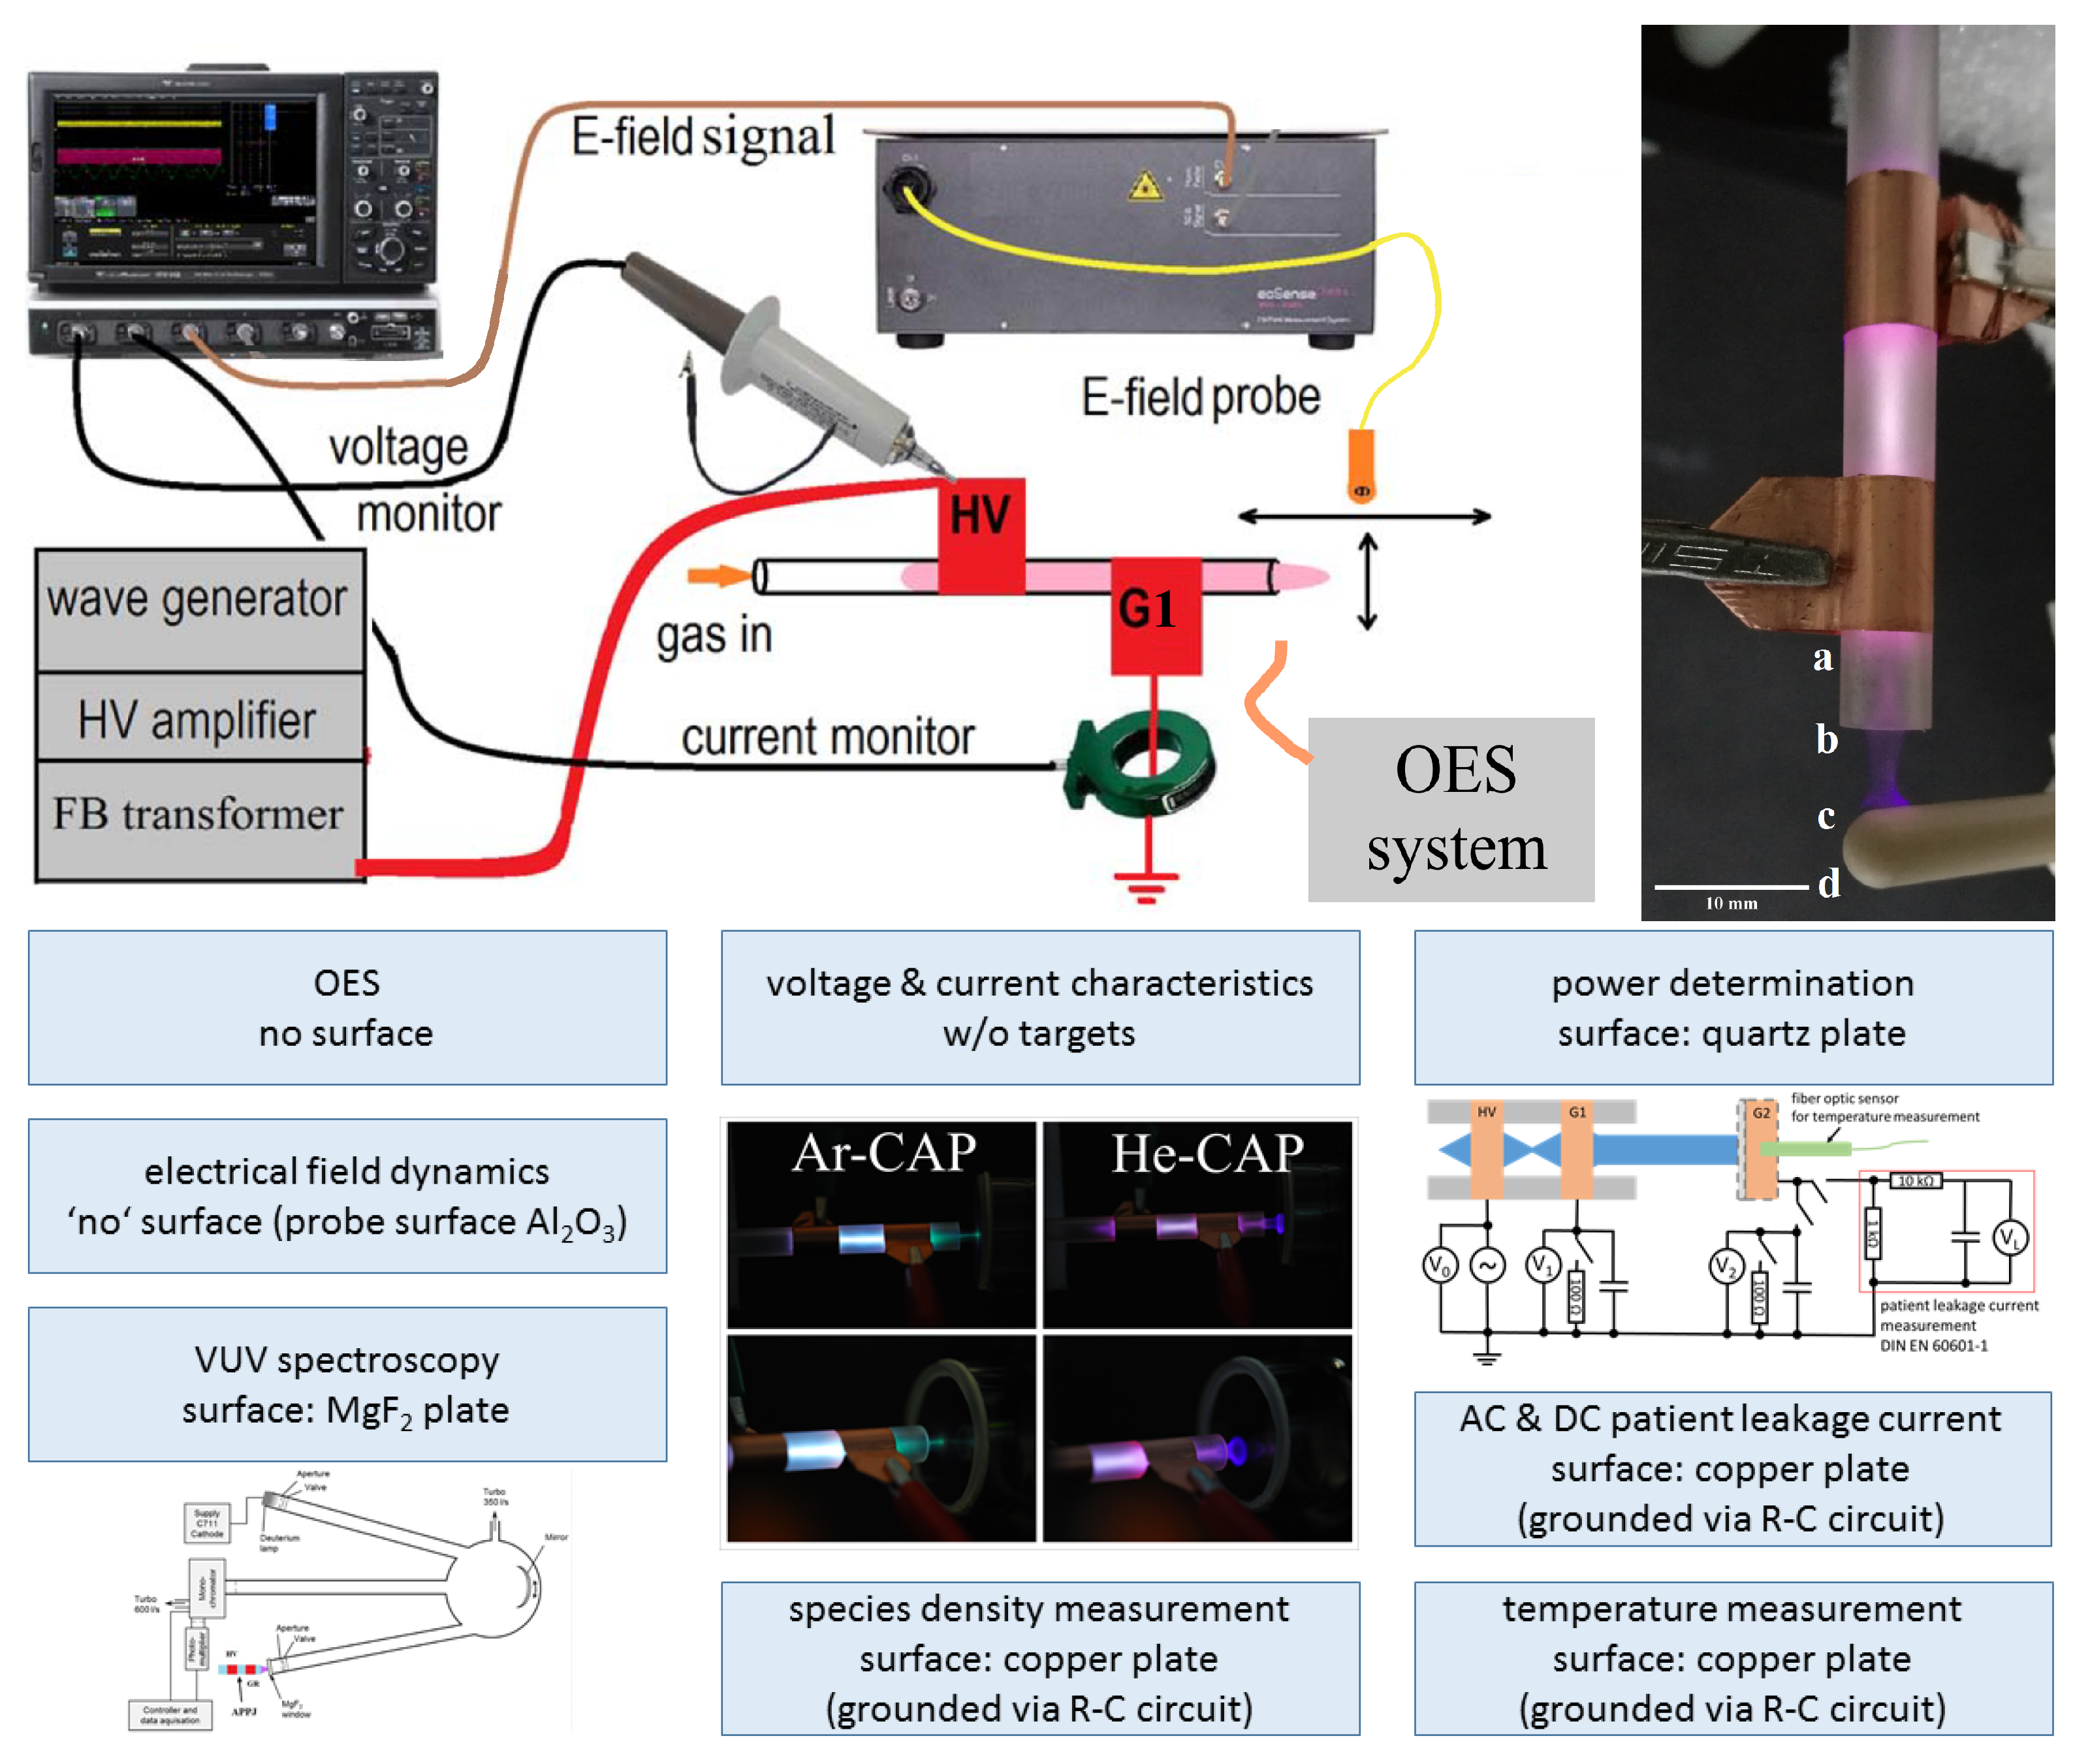
2.1. Plasma Source Configuration

The cold atmospheric pressure plasma jet (CAP) is generated using a 100 mm long quartz tube (inner diameter 4 mm, outer diameter 6.1 mm), having two copper tape electrodes (10 mm width, a power (HV) and a grounded (G1) electrode) wrapped on the external surface, with 10 mm gap, and 6 mm till the tube exit nozzle. Depending on the intended measurement, either a metallic (copper plate) or dielectric (alumina covered probe, quartz glass or magnesium fluoride MF 2 window) surface act as the second electrode (G2) placed at distance d and connected to the ground (Figure 1).
Two types of working gas were supplied through the discharge tube: pure helium (He 4.6) or a pure argon (Ar 4.8). The constant gas flow rate of 2 slm (ensuring a laminar flow regime) was regulated through a mass flow controller (MKS Multi Gas Controller 647C or Bronkhorst E-8412 with a F-201CV). In this way, an atmospheric pressure helium or argon plasma jet is generated and operates freely in air. For the comparative nature of the paper, the following abbreviations will be used: He-CAP for the helium jet and Ar-CAP for the argon jet. Long exposure photos were captured using a Nikon D80 camera (CCD: 23.6 × 15.8 mm, 10.2 Mpx, ISO: 100–3200, shutter speed: 30–1/4000 s, 3 fps) equipped with Tamron SP 180 mm f/3.5 Di LD Macro lenses.
The discharge was driven by a high voltage fly-back transformer (SAXAR MC-FB-001) fed by an amplifier (Amplifier T&C Power Conversion, Inc. AG Amplifier, Rochester, NY, USA) which was controlled by a function generator (Tektronix AFG 3101). The applied sinusoidal voltage U a (up to 20 kVpp, frequency 18 kHz) and the total current of the discharge I d were monitored using voltage and current probes (Tektronix 6015A and CT2, Pearson 6585 current monitor) and a 4-channel digital oscilloscope (Tektronix TDS 5104—1 GHz with 5 Gs/s, and Lecroy Waverunner 640 Zi—4 GHz with 40 Gs/s).

2.2. Characterization of Plasma Source: E-Field Measurement Set-Up

For the electrical field (E-field) measurements, we used a 1 transverse electrical field component optical probe (Kapteos, EoProbe ET5-air, low permittivity ∼3.6, sensitivity 250 mV/m, up to 10 MV r m s /m, bandwidth 10–12 GHz, spatial resolution of 1 mm, 5 m optical fiber cord) coupled to an electromagnetic field measurement system (Kapteos, EoSense LF 100U-1). The ET5-air is an electrooptic (EO) probe based on an isotropic EO crystal that acts as a transducer (due to the Pockels effect) converting the E-field to be determined into an optical modulation of a laser beam that can be measured via a polarizer and a photodiode [40,44,52,53,54,55].
The EO probe was moved axially to the CAP tube and measurements were made at the nozzle exit (marked as ‘b’, 0 mm), at 5 mm away from nozzle (‘c’), at 10 mm away from nozzle (‘d’) and near the ground electrode, on the tube at −5 mm from the nozzle exit (positioned instead of the letter ‘a’), exactly as in Figure 1 and further on presented in the electrical field characterization paragraph.

2.3. Characterization of Plasma Source: Power Measurement Setup

The power dissipation at different locations inside the discharge were determined from the area underneath the voltage-charge plot according to [56,57]. A dielectric quartz plate was placed at a distance d from 0 mm to 20 mm towards the tube edge. Behind the quartz, a copper electrode was connected via a capacity of 4.7 nF towards ground. The capacity was determined by measuring the setup capacity as being between 0.2 pF and 0.6 pF with a LCR meter (GW Instek LCR-8110G), rounded towards 1 pF to correct for uncertainty and multiplying with 1000 (“rule of thumb”) [58]. An identical capacity was connected between the second ring electrode and ground. A voltage probe (PP023, Teledyne Lecroy) was placed each to determine the charge accumulation. Together with the high voltage measurement (P 6015A, Tektronix) and an oscilloscope (Waverunner 640 Zi, Teledyne Lecroy), a setup for power determination at different settings of working gas, distance and applied voltage was realized. Data acquisition was set on 50 averages to account for variances due to the wide range of operation voltage. The evaluation of the acquired data sets was performed via a Matlab script (R2012a Matlab, Mathworks Inc., Carlsbad, CA, USA) performing the polyarea function. A comparison with our previous Python scripts [57] were consistent.

2.4. Characterization of Plasma Source: Basic Safety Properties Setup According to DIN SPEC 91315

The temperature of the plasma source was measured at a distance d from 0 mm to 20 mm towards the tube edge. A 10 × 10 mm² copper disc acted as the surface with an extension to host a fiber optic temperature sensor (FOT Labor Kit, LumaSense Technologies, Inc. GmbH, Santa Clara, CA, USA). To simultaneously determine the patient leakage current (PLC), an RC-circuit according to DIN 60601-1-6 [51] via UNIMET® 800ST (Bender GmbH & Co. KG, Gruenberg, Germany) was connected to the copper surface [50]. The combined setup was mounted via an x-y-z-linear stage system (Qioptiq Photonics GmbH & Co. KG, Gö ttingen, Germany) with 10 µm precision for ideal placement. Data acquisition was performed with a home made Python software PlaDinSpec (made with Python 3.8, Python Software Foundation, Wilmington, DE, USA) [59], measuring and averaging 100 values.
Densities of reactive oxygen and nitrogen species (ROS and RNS) in ambient air were further measured at practical distances (50 mm to 500 mm) along a copper surface with a focus on long living species, namely by using ozone and nitrogen oxides monitors (O 3 : APOA-360, NO x : APNA-370, Horiba Europe GmbH, Oberursel, Germany).

2.5. Characterization of Plasma Source: Spectroscopic VUV to UV-VIS-NIR Measurement Set-Up

The spectral emission of the discharge in the ultra-violet, visible and near infrared spectral range (UV-VIS-NIR) was analyzed by using a fiber optic monochromator (Avantes, AvaSpec 3648, 200–1100 nm range, ∼2 nm resolution, 300 lines/mm grating, blazed at 300 nm, deep-UV-detector coated CCD linear array) with a 0.4 mm diameter orifice and a 0.5 m long optical fiber placed at 5 mm from the plasma. The optical emission spectroscopy (OES) of the discharge in the vacuum ultra-violet (V-UV) range was measured by using a calibrated 0.5 m VUV-monochromator (Acton Research Corp., VM-505, 110–280 nm range, ∼0.1 nm accuracy, 1200 lines/mm grating, Thorn/EMI 9635 QB detector), described also in [31,48,60]. For these measurements, the CAP was placed in front of the MgF 2 entrance window (cut off wavelength of 115 nm) of the monochromator, at a distance d = 4 mm, as depicted in Figure 1.

3. Results and Discussion

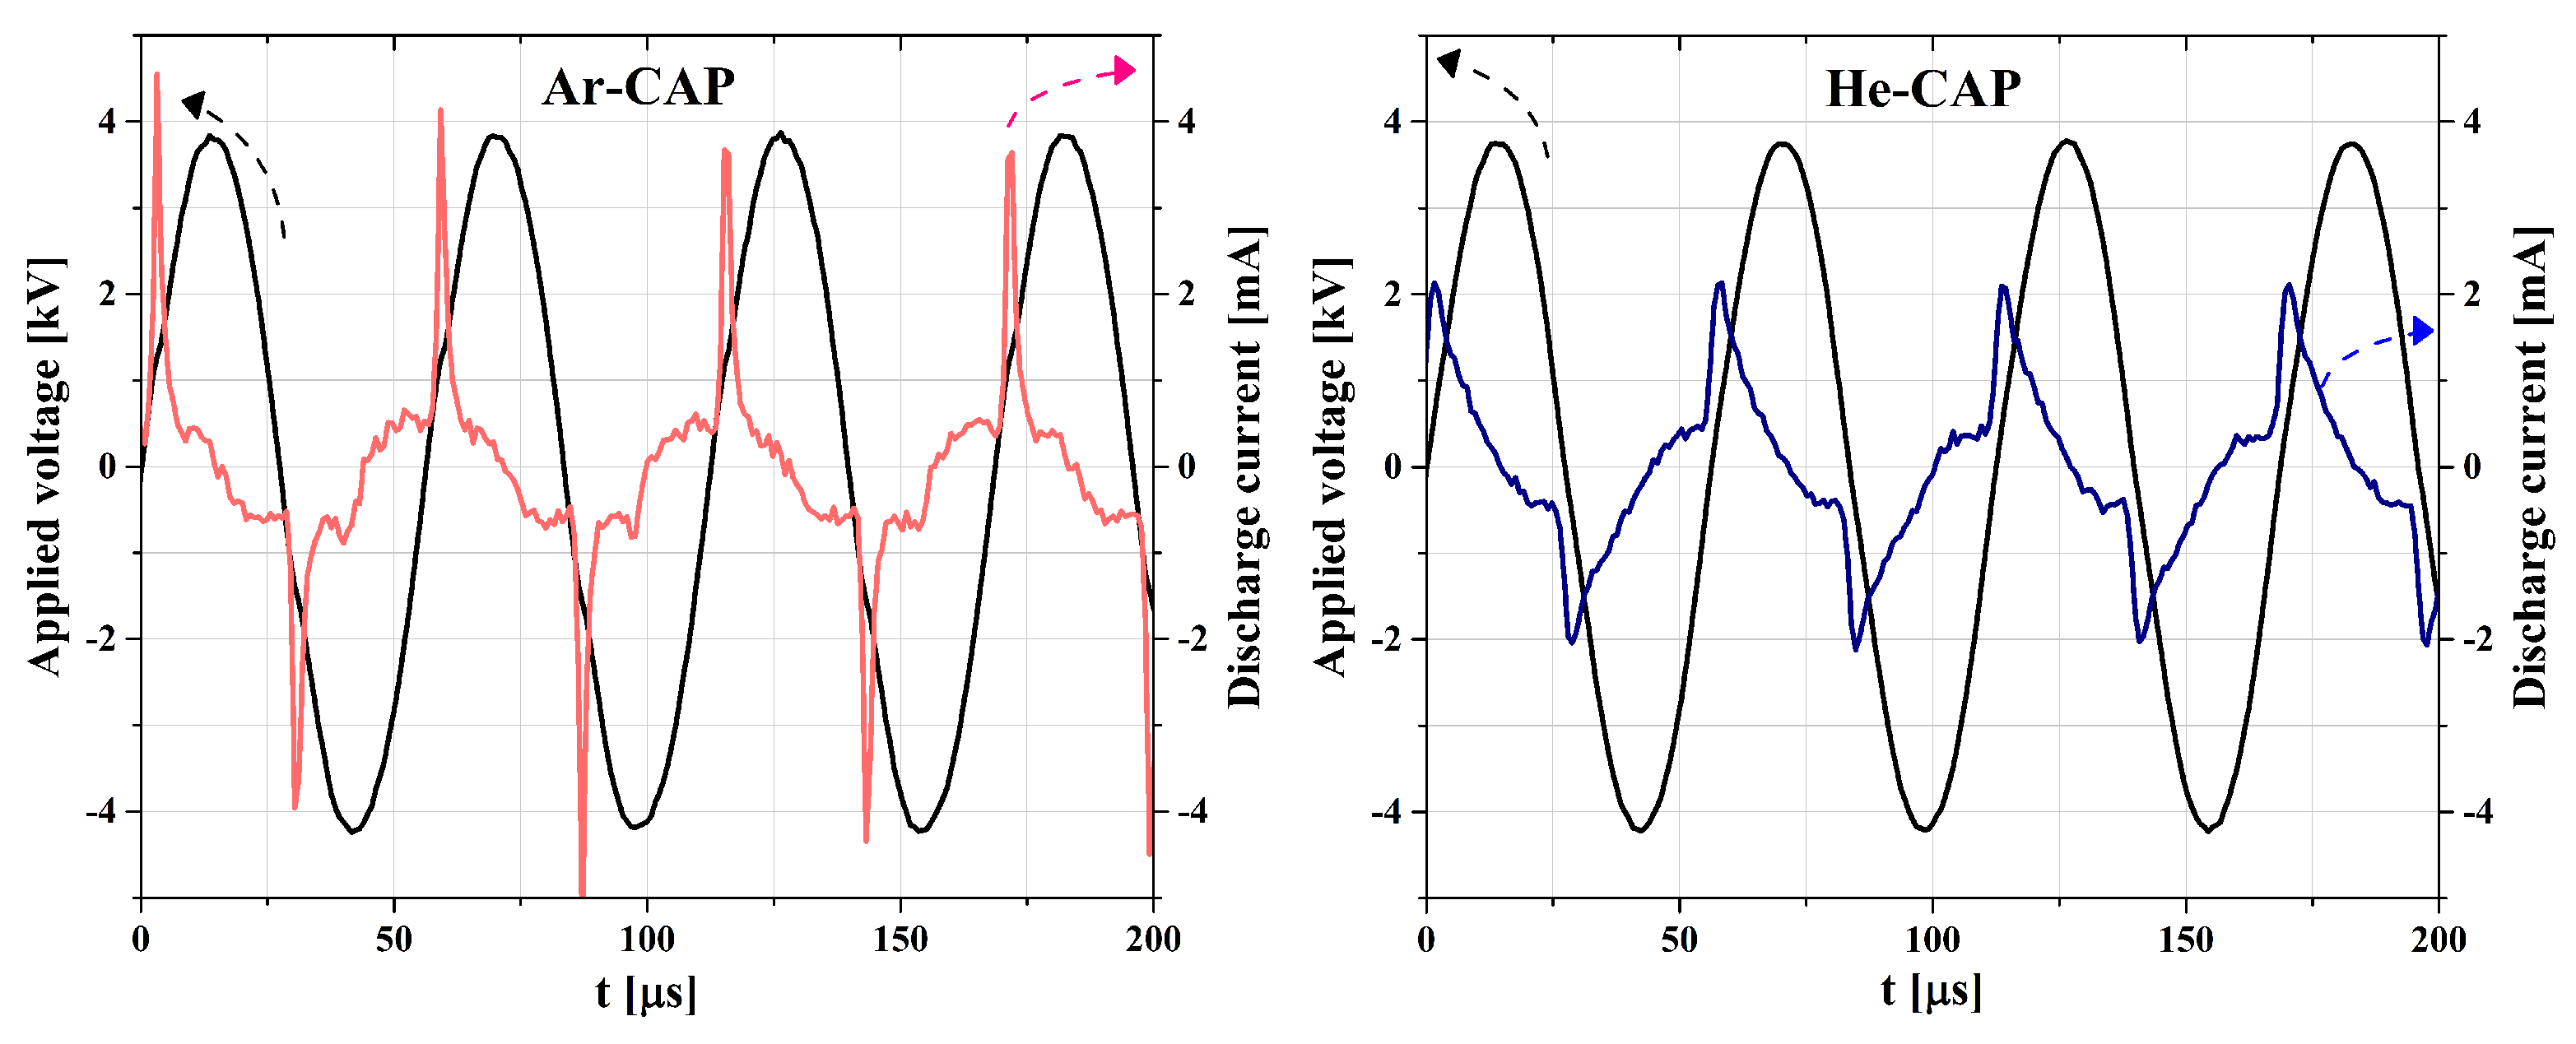
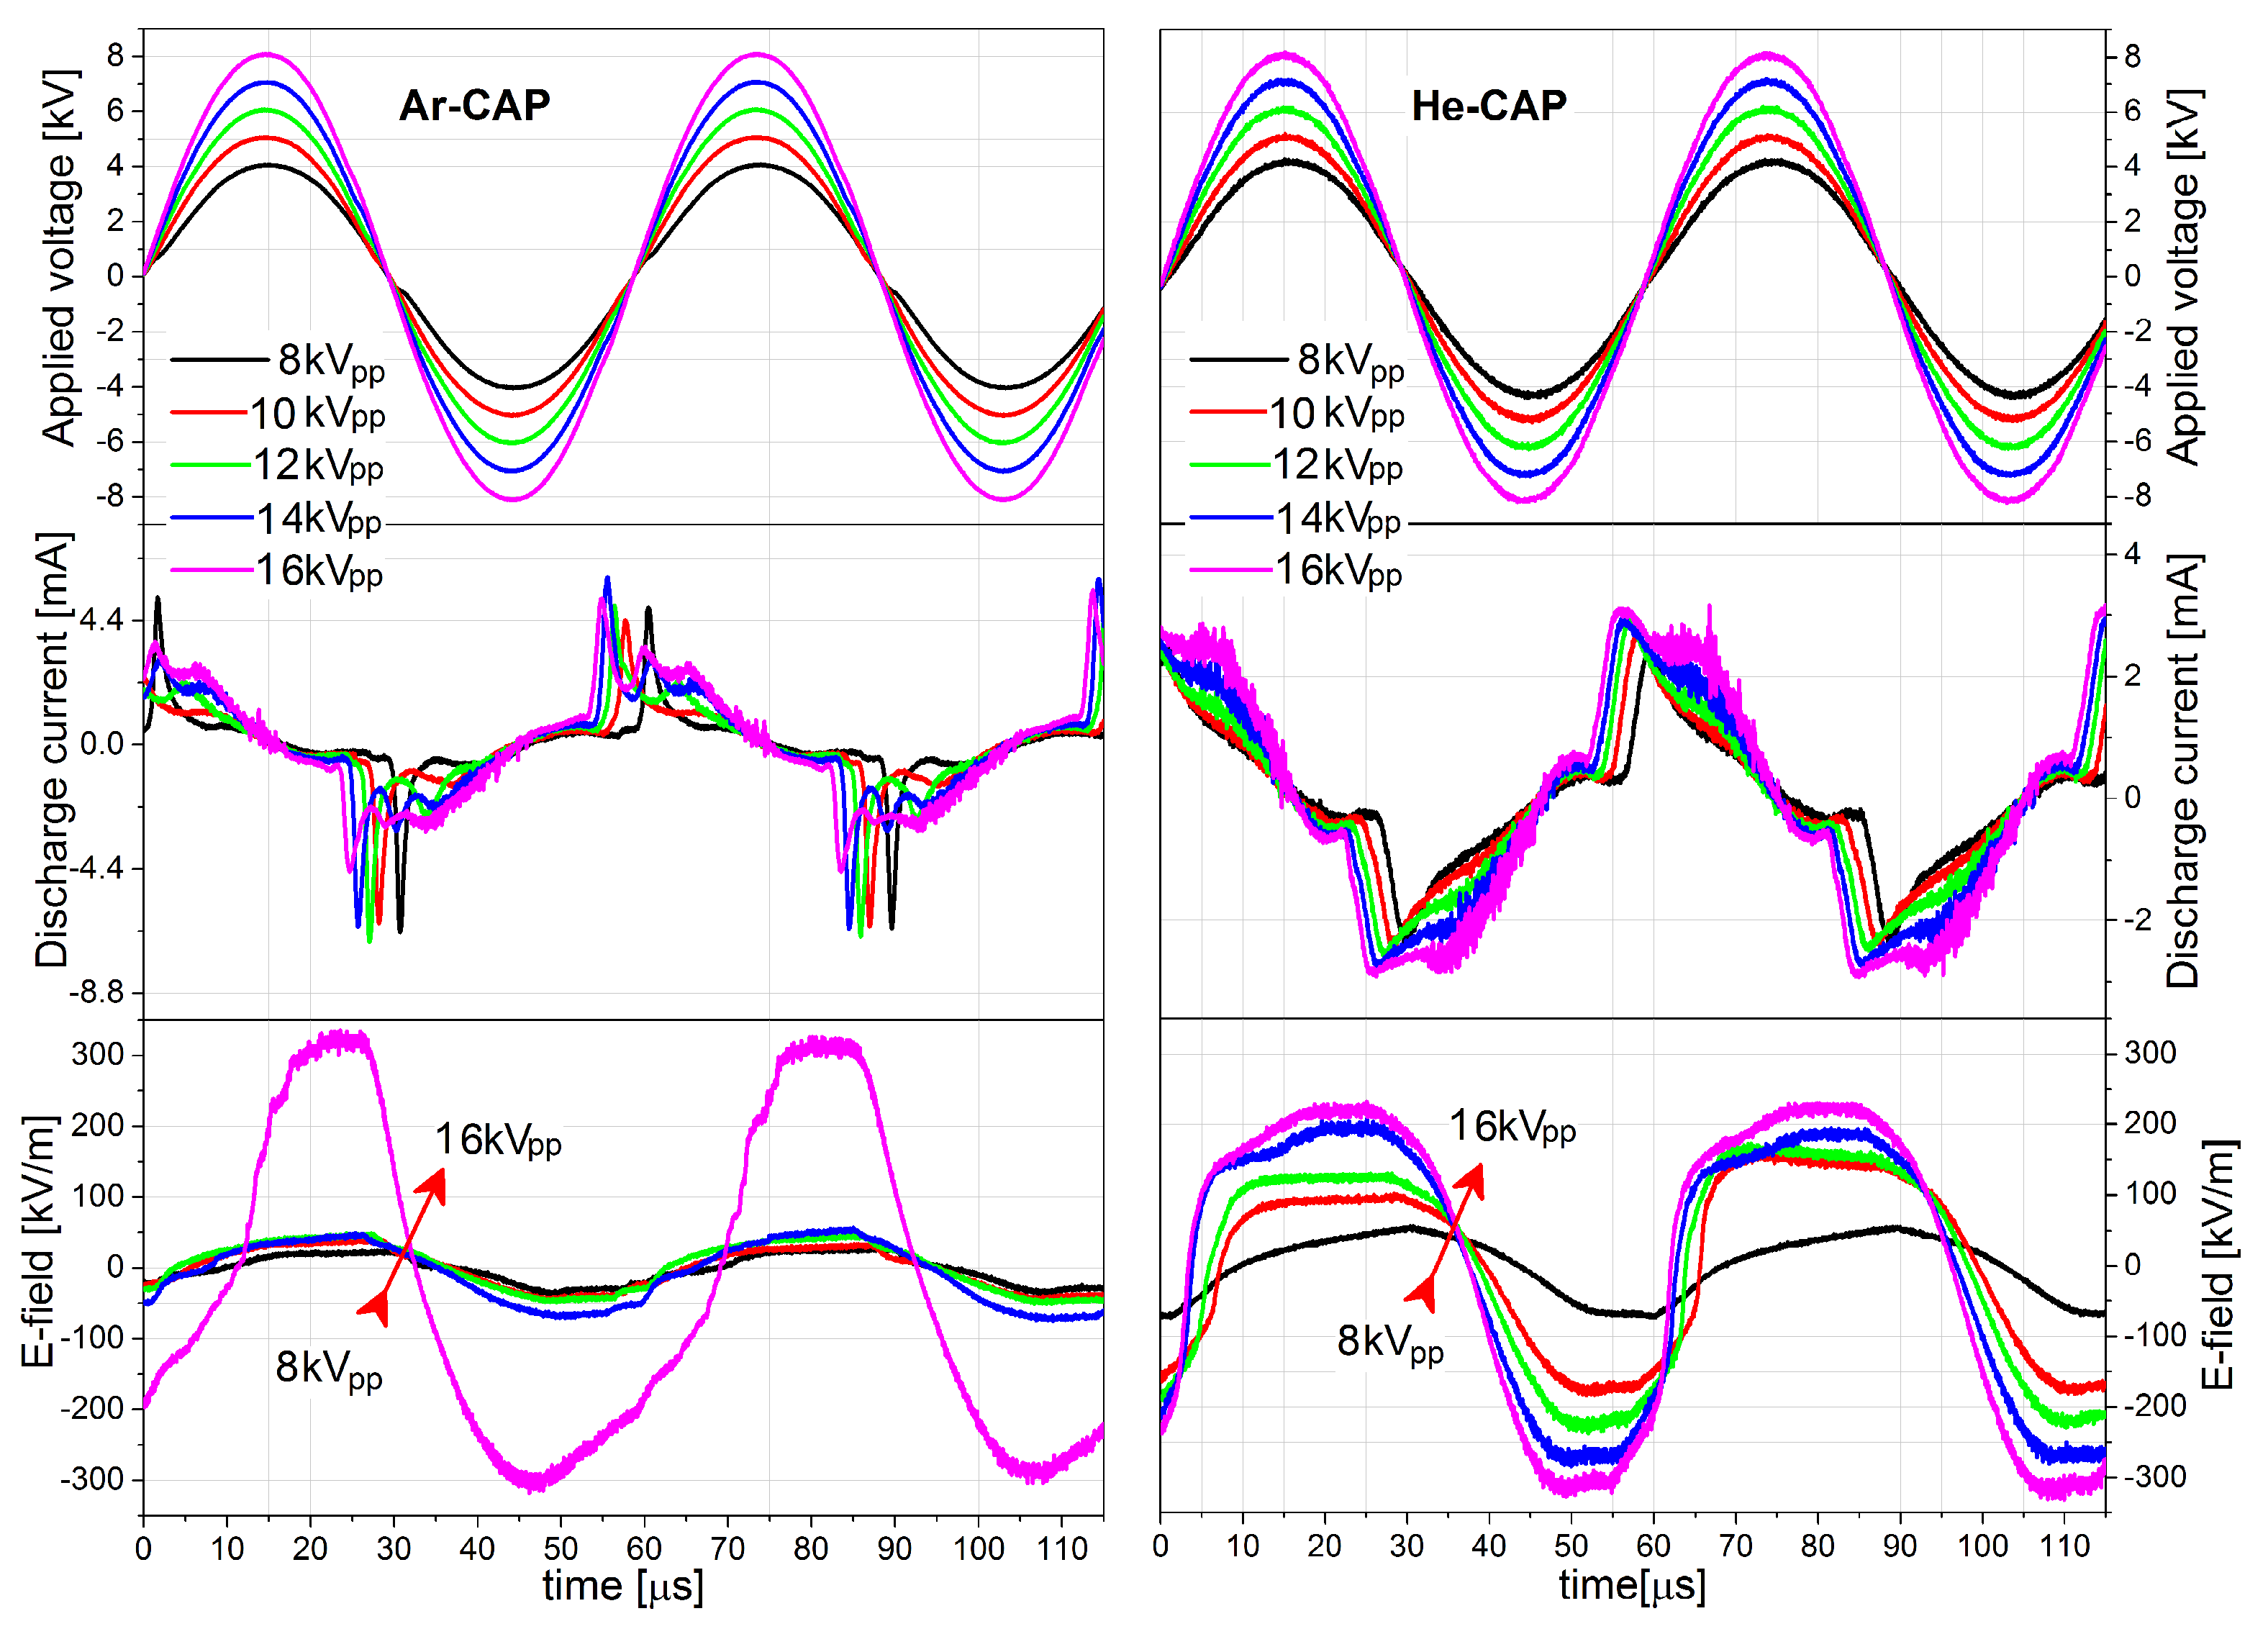
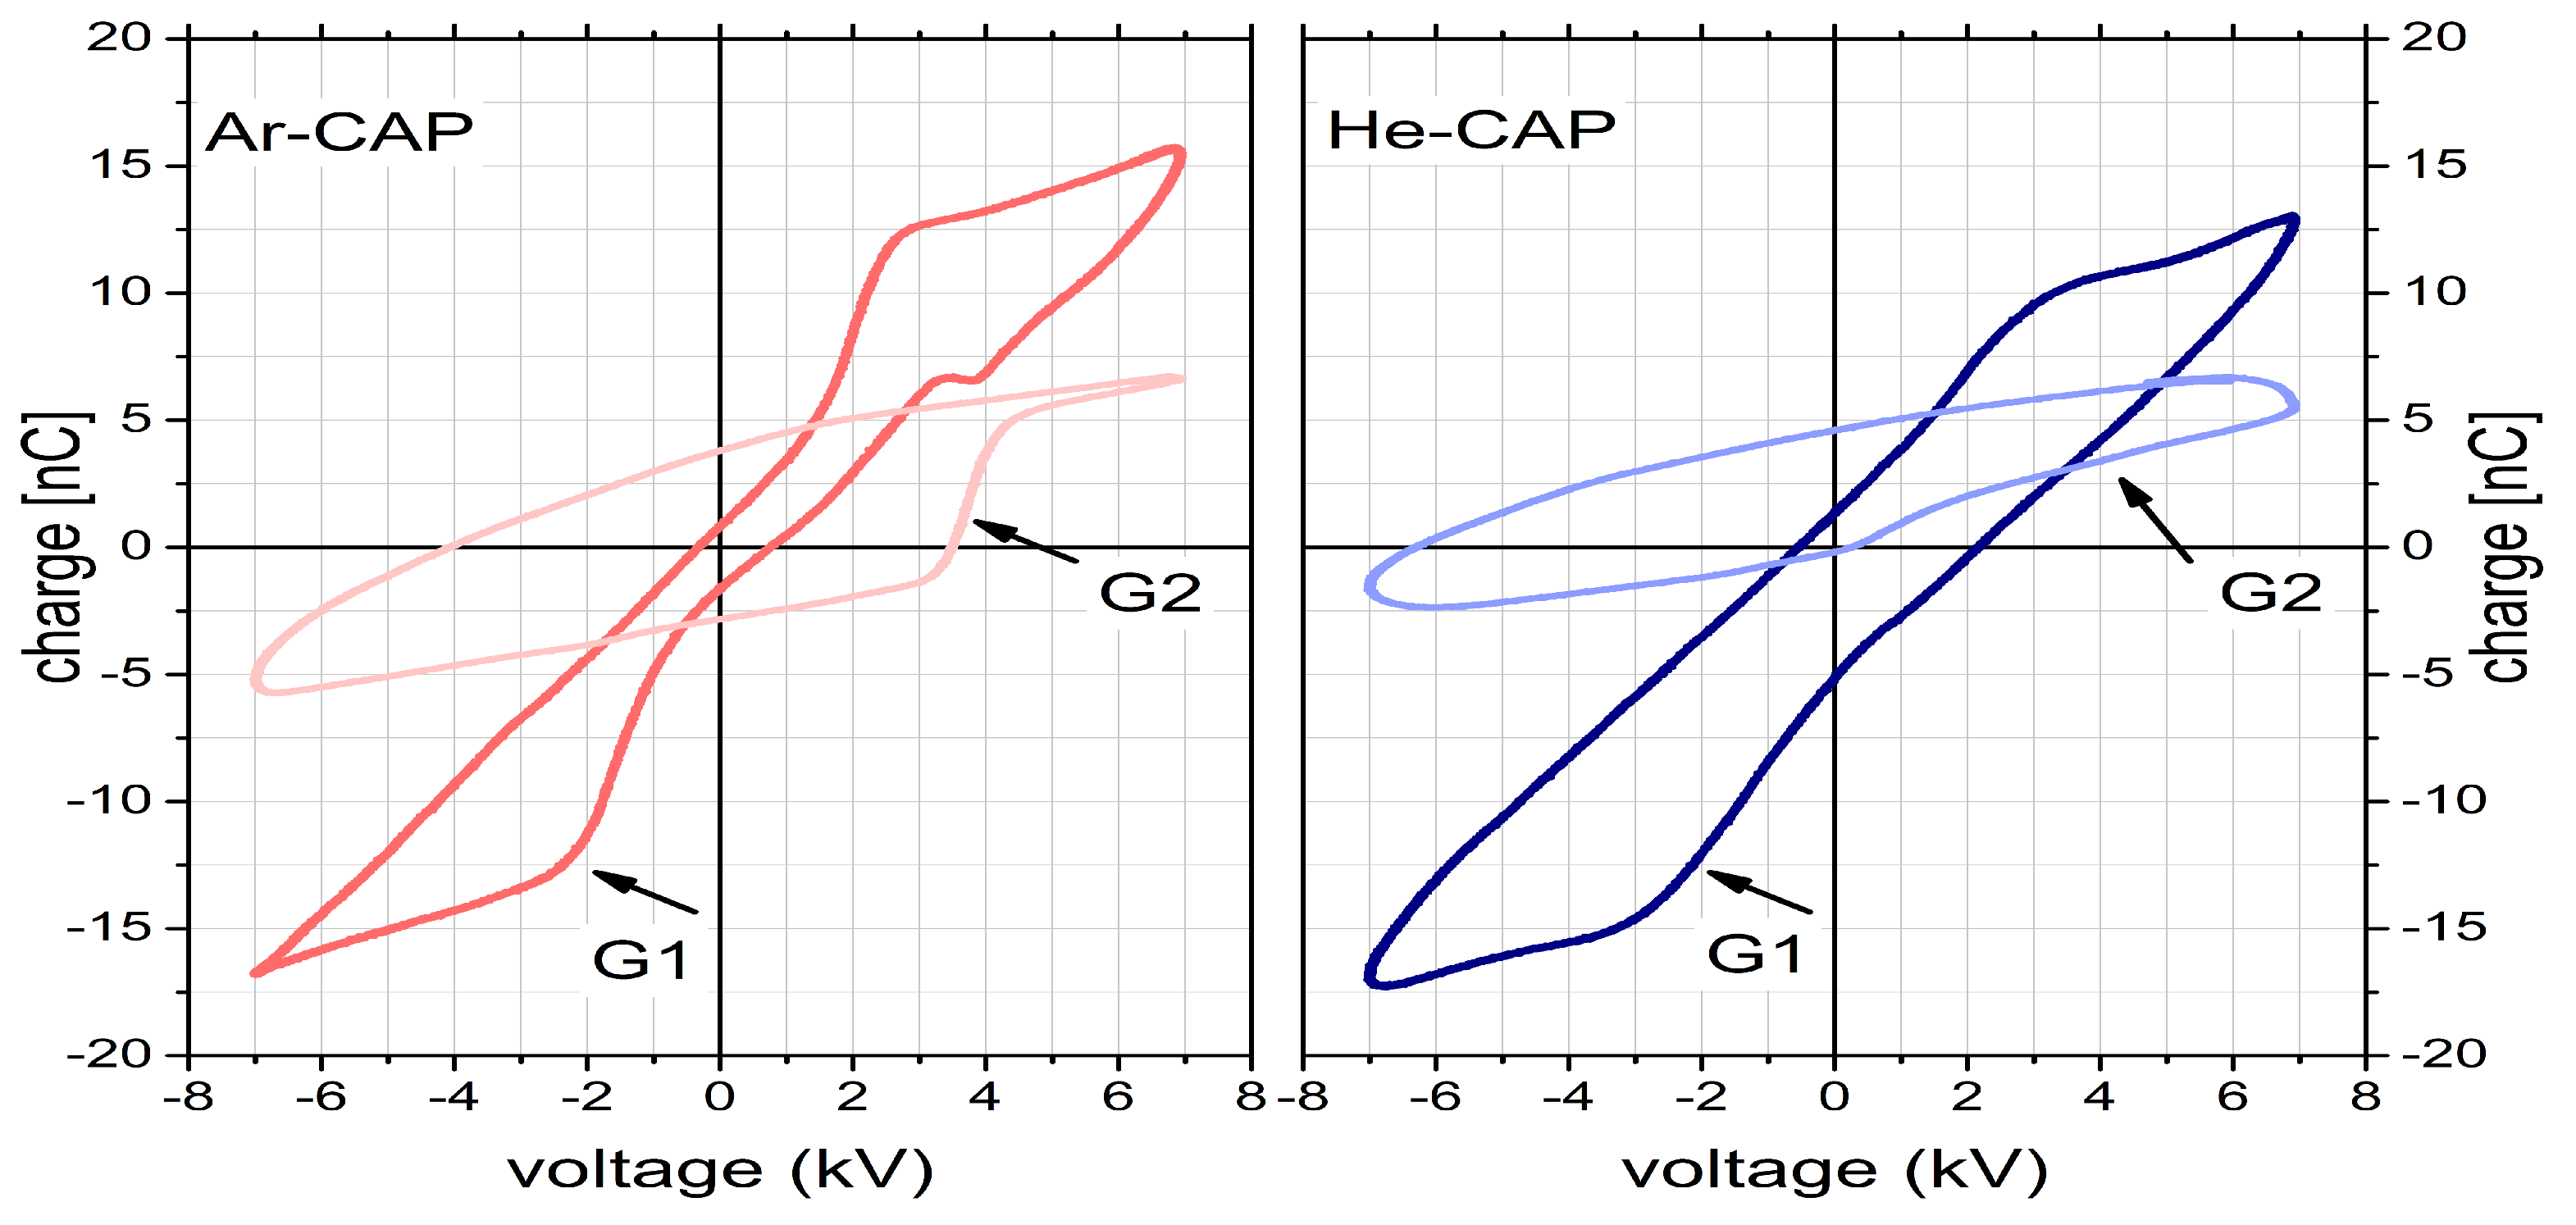
3.1. Basic Electrical and E-Field Characterization of Plasma Source

The voltage and current curves for helium and argon operation show a periodic signal with a dominant symmetry between the positive and negative voltage period (Figure 2). For identical applied voltage, the current shape under argon generates a main discharge current up to 4.2 mA with a duration of about 6 μ s and a second discharge current of 4.5 mA and a duration of 3 to 6 μ s. The helium cap shows discharge conditions of 2 mA amplitudes and a discharge duration of 12 μ s. The estimated electrical power for the Ar-CAP, using the traditional applied voltage multiply by discharge current, revealed a mean value of 0.7 to 1 W, while for He-CAP 0.4 to 0.96 W.
While the geometry is rather simple, the operation in argon especially is scarce in literature and comparison hence not easy. Considering the works in a similar frequency range for argon, an investigation on argon metastable density distribution with a capillary wrapped by the grounded electrode and an internal powered electrode correlated phase resolved imaging with the main current peak with the discharge inside the capillary between both electrodes and the second peak with the generation of the guided streamer exiting the capillary [61,62]. Another recent work with a close geometry focused on the atomic auroral oxygen line emission rather than the discharge current [63]. The described phase should be similar, while the geometric properties and the flow range differ. However, the current was only measured on the input line and an overall high displacement current is included.
The helium signals for voltage and current are comparable to characteristics in other studies indicating the jet current signal relates to the guided streamer propagation [64,65]. Our previous works with a similar basic geometry showed discharge peaks of shorter duration [57,66,67]. When comparing images of the different systems, the effluent differs from the previous system with a filamented effluent and the present system with a rather diffuse discharge (as in discharge photos from Figure 1).
Electric field diagnosis
The presented voltage and current characteristics in Figure 2 are for the case without a surface. Meanwhile, the signals measured when placing the electrical field probe represent the operation with a dielectric target placed in front (Figure 3). As it is observed, the basic characteristics are similar, with comparable time scales and slightly increased amplitudes. The symmetry between negative and positive half phase of the voltage period remains as well. The main change is, however, the occurrence of more consecutive discharge peaks after the first, increasing in amplitude and number in accordance with the applied voltage. Operation in argon generates up to three peaks per half cycle while helium goes up to two peaks, respectively. Consecutive discharge peaks like these were already reported to correlate with weaker but dominantly repeating discharge dynamics [31].
In a previous study for an in principle identical electrode setting, we reported the generation of an inverse current pulse following the primary discharge pulse which correlated with the bullet propagation and charge exchange processes [66,67]. While voltage settings and electrode geometries equal the present setup, changes in capillary dimension, implying flow condition changes, dielectric properties and electrode dimensions are present.
The electrical field probe shows an increase of electrical field amplitudes with increasing applied voltage. The signal correlates with events observed on the current signal. An enhanced electrical field amplitude from 25 kV/m up to 320 kV/m in argon and from 50 kV/m up to 300 kV/m in helium is achieved (see Figure 4). For Ar-CAP and He-CAP operation, a plateau dominates each discharge cycle. While the discharge peak is still proven to result from the discharge between the two ring electrodes around the capillary, the guided streamers leaving the system follow shortly after [67]. This correlates with the observed peaks in the electrical field strength measurements that are delayed by few microseconds from the main discharge peak.
The probe is actively placed into the discharge channel and the dielectric surface acts as a third electrode, including charging and discharging through the plasma channel as measured previously [66]. While the maximal value correlates with measured and simulated values from other groups in helium or argon discharges [64,68,69,70], the high plateau is interpreted to result more from charge accumulation than from ongoing discharge dynamics.

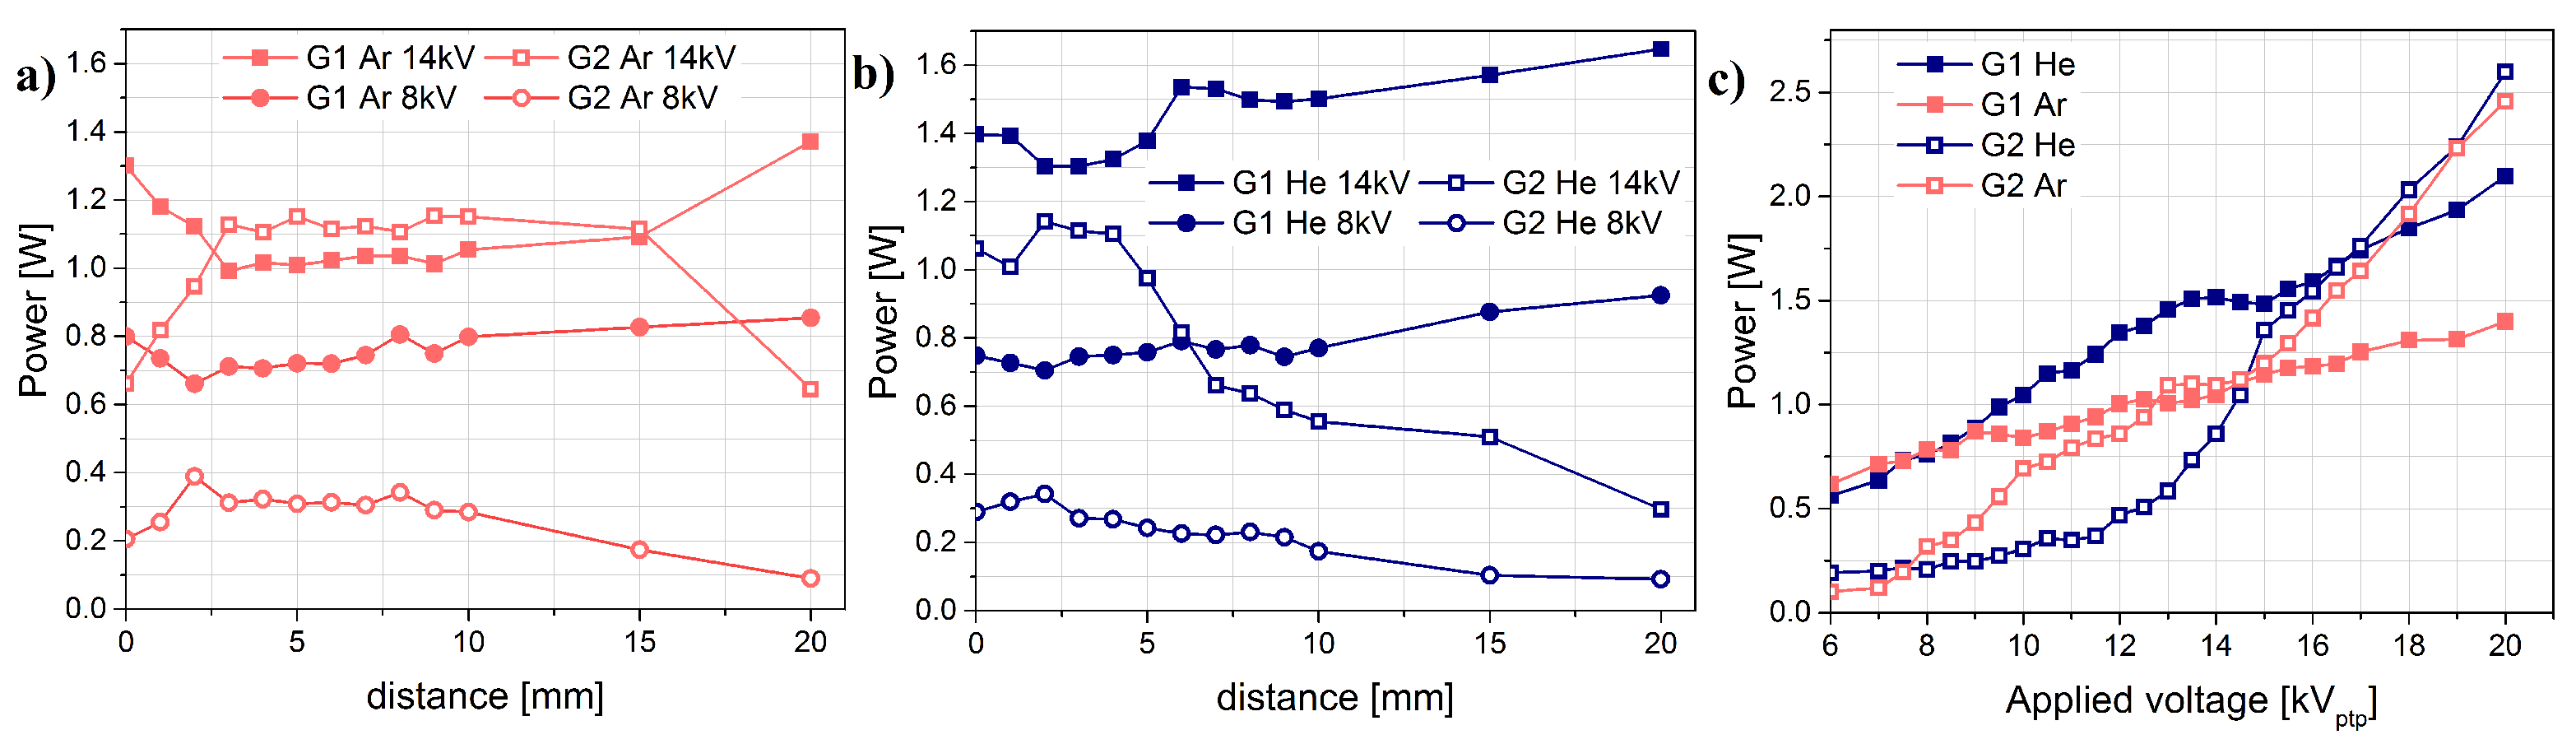
3.2. Determination of Dissipated Power

The representative acquired voltage charge plots (Q-V plots) with a quartz substrate placed 5 mm away are shown in Figure 5. For the grounded ring electrode around the capillary, the voltage-charge curve does not resemble a parallelogram but is similar to the shape of another system [57]. The shape remains similar with increased applied voltage, but the charge amplitude increases for argon and helium operation. The quartz surface is placed on top of a grounded copper plate and the measured voltage-charge curve is mostly rounded with one more or less pronounced jump on the rising slope.
From the enclosed loop of the Q-V plot, one can determine the energy of a cycle and by multiplying with the frequency the determination of power is possible [71]. The respective energy values are 56 μ J (G1), 63 μ J (G2) for argon and 76 μ J (G1), 54 μ J (G2) for helium operation, representing a power dissipation of 1.00 W (G1), 1.15 W (G2) for argon and 1.38 W (G1), 0.97 W (G2) for helium. Previous investigation already states that plasma jet systems are not closed and energy is consumed by further reactions of the plasma inside as well as outside the capillary like light emission, heat production, and reactive species generation [56,72].
In Figure 6a–c, the determined power is presented at given applied voltage over different distances as well as for given distance over increased applied voltage. When changing the distance at constant voltage, a constant power is observed for helium and argon while an increase in power is found when the voltage amplitude is increased.
Between G1 and G2 in each case, a tendency is observed for an increase in power dissipation for G1 in exchange for a decrease in power dissipation for G2. Increasing the applied voltage at a fixed distance leads to a continuous increase of dissipated power in G1 and G2. For the highest investigated voltage settings, G2 surpasses G1 in dissipated power. The power range overall between helium and argon shows comparable values for G2, while G1 in helium surpasses argon by a total amount of 0.7 W with a final value around 2.1 W. The total power dissipation achieved within this measurements is 3.9 W for argon and 4.7 W for helium operation. For further investigations, the applied voltage was set to either 8 kV p p with identical power dissipation values or 14 kV p p with comparable G2 values yet already increased G1 value for helium.

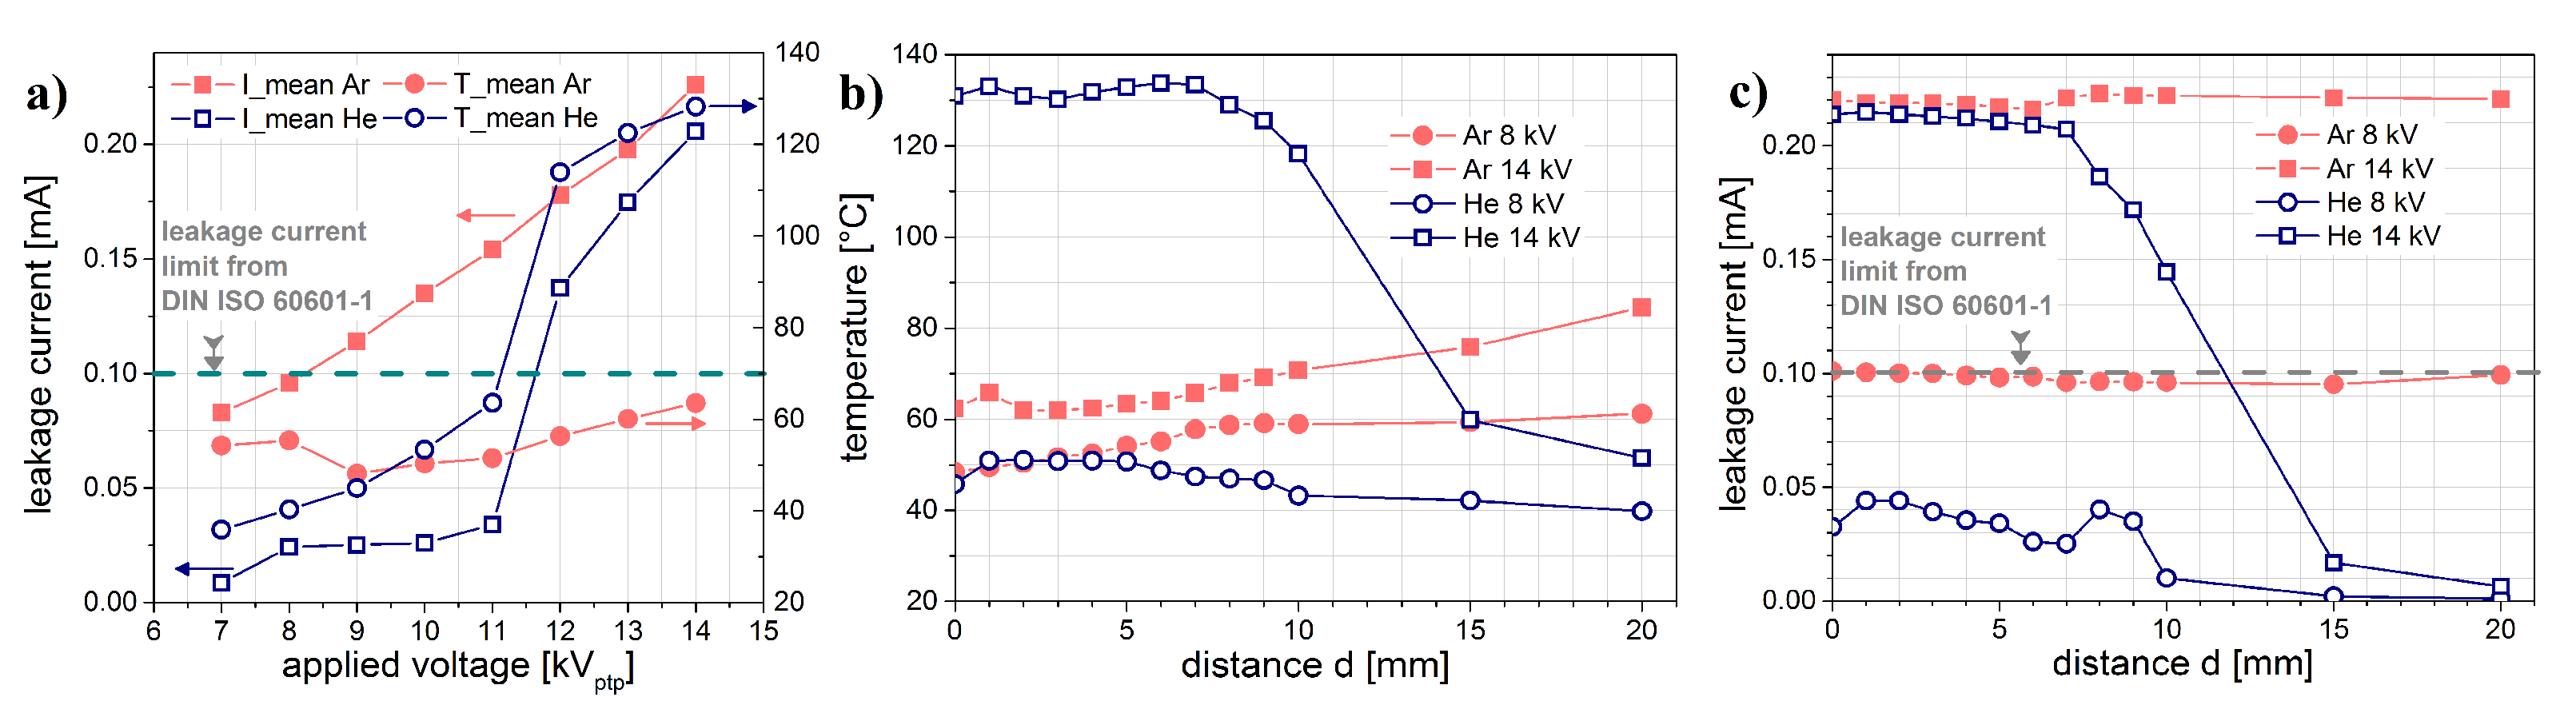
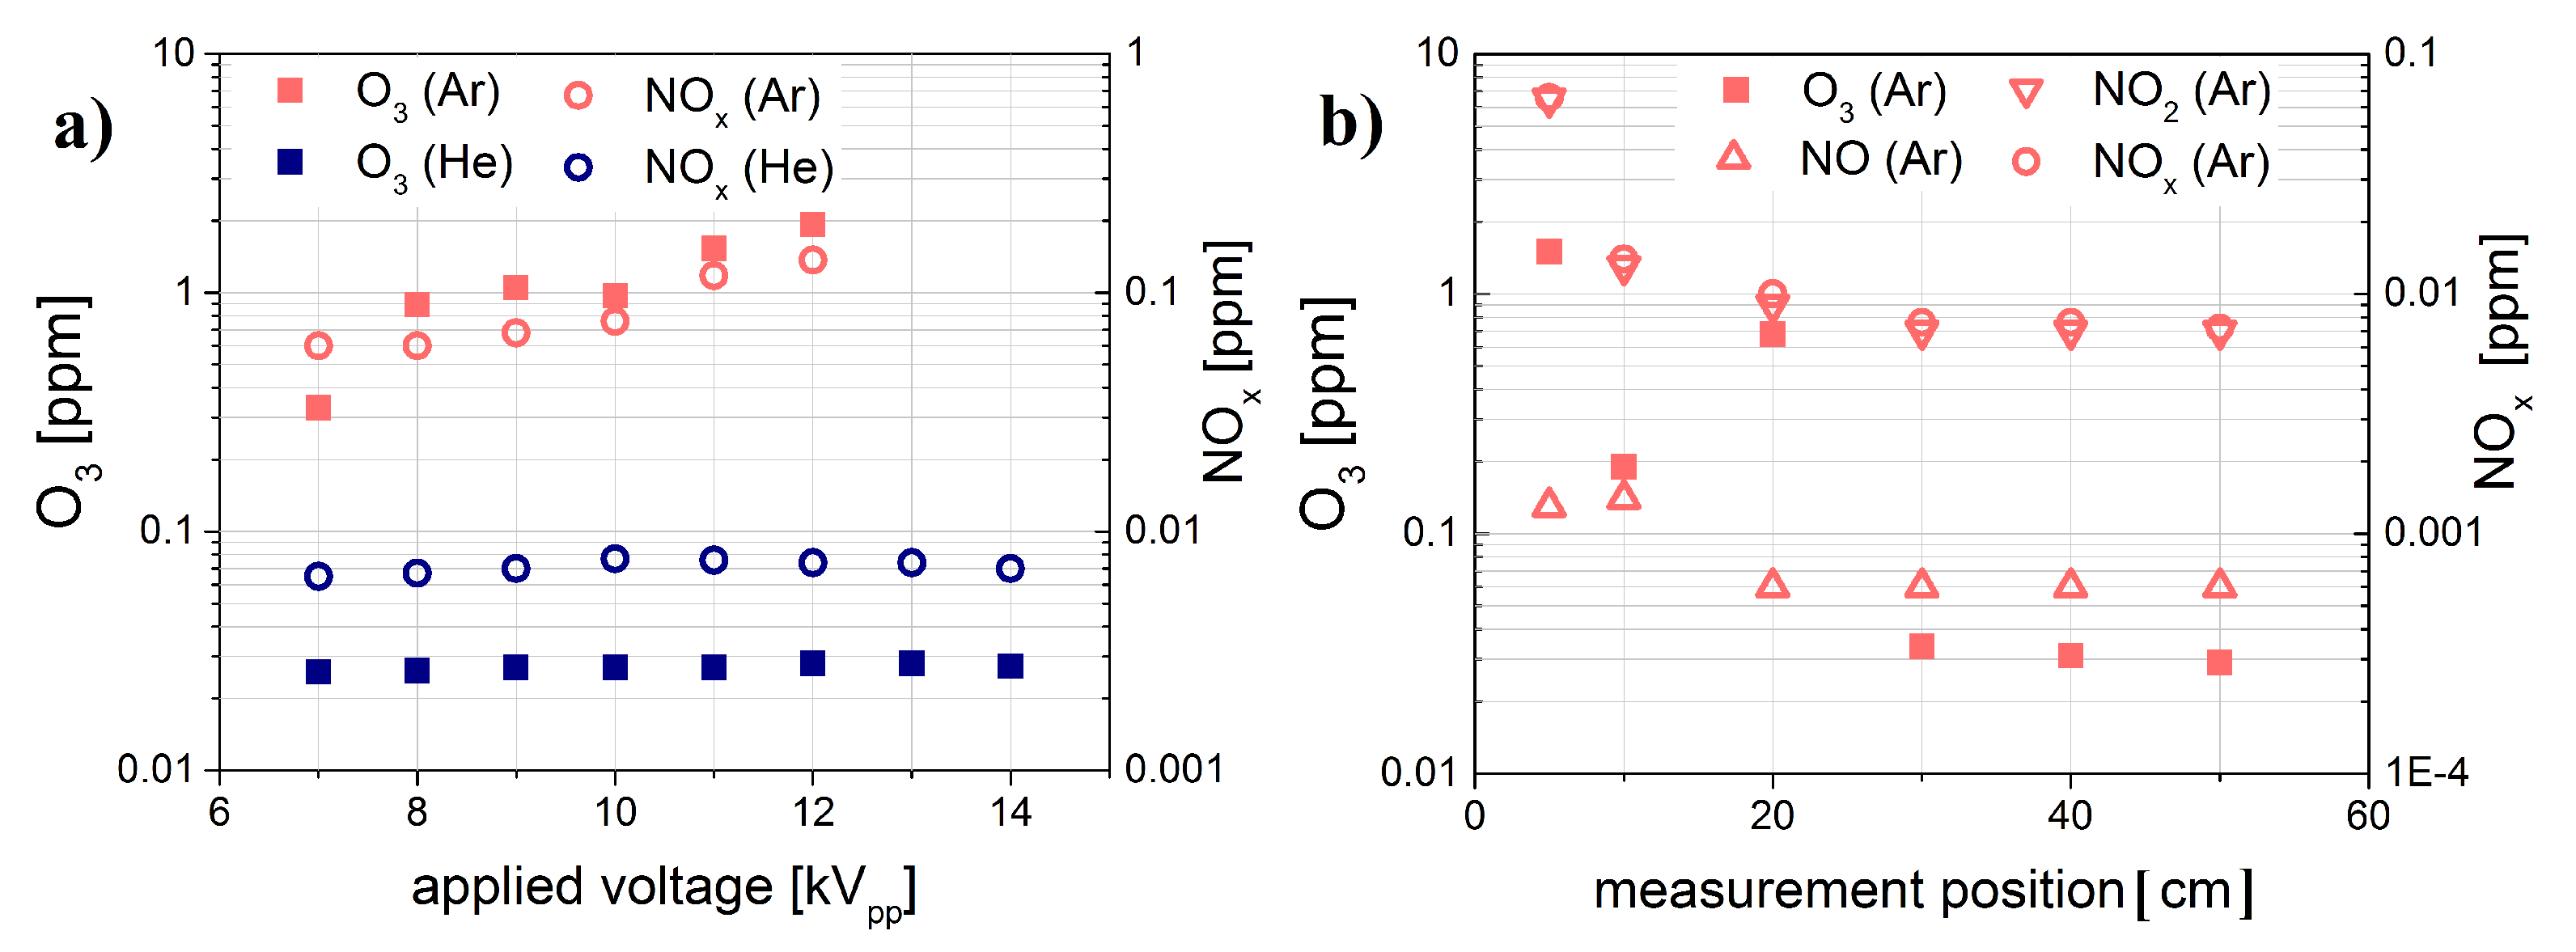
3.3. Basic Safety Properties

When considering dissipated power values of up to 5 W in the system, the range of safety relevant parameters should be considered to qualify potential application relevant settings. The results on patient leakage current and temperature of a treated copper surface are shown in Figure 7. According to DIN SPEC 91315 [45] and the norms within the leakage current, the safety threshold is set to 0.1 mA in AC and 0.01 mA in DC mode. Temperature should not cross 40 C to avoid denaturation of proteins.
Results within a certain range of these thresholds can be adjusted by further adjustment of system parameters, while significant overvalues cast doubts on a direct medical application. In addition, these values are correlated with efficacy parameters, so that a device is always both safe and effective and not just either. Here, that value is accessed via reactive oxygen and nitrogen species (ROS and RNS) measurements. While intuitively a higher power value implies an improved effectivity, the present system will show for the first time that this correlation is not that simple. Concerning the AC patient leakage current at different voltage amplitudes, the overall range for helium and argon are comparable, with no DC leakage current detectable in either He-CAP and Ar-CAP. While the He-CAP delivers AC leakage current values of 10 μ A at 7 kV p p , the Ar-CAP delivers 80 μ A at identical settings.
In the Ar-CAP, the values rise continuously with increased voltage up to 250 μ A. In contrast, the He-CAP provides a constant leakage current up to 11 kV p p and a jump with a further on increase up to 200 μ A. The surface temperature rises in dependence on the leakage current curve for He-CAP with values from 35 C up to 130 C. For Ar-CAP, the temperature ranges between 40 C and 60 C. In case of Ar-CAP, the temperature could be reduced by increasing the gas flow to optimize for a potential medical setting with compliant leakage current values at lower amplitudes. For the He-CAP, the range of operation voltage with a compliant set of leakage current and temperature is increased with a more pronounced threshold transgression.
A variation of the distance for these measurements considers application relevant uncertainties since a fixed treatment distance in complex geometries is neither possible in hand-held operation nor in case of complex geometries with robotic operation. For the temperature values in He-CAP, a drop is observed for longer distance of over 10 mm, while prior to it a mostly constant value is detected (Figure 7b). In Ar-CAP, interestingly, the value rises slightly over the whole distance for both investigated voltages. On the contrary, for Ar-CAP, the cooling effect of the working gas is reduced the further away the treated surface is moved. Hence, here again an adjustment of gas flow range could impact the temperature amplitude. For He-CAP, it seems that most of the heat is produced inside the capillary with a volume discharge while outside mainly diffusion and buoyancy cools the output gas from the capillary [72,73].
When the temperature drops for the He-CAP, a correlating drop in leakage current is observed in Figure 7c as described previously for the voltage variation (Figure 7a). For the Ar-CAP, however, a constant leakage current is measured over the whole investigated range of 20 mm with a filament reaching the surface continuously. A constant leakage value over the whole range is not reported in literature yet and could neutralize distance uncertainties in applications caused by user errors or complex geometries.
The correlation of He-CAP and Ar-CAP operation at different applied voltage amplitudes and ROS and RNS density production is presented in Figure 8 with ozone and nitrogen oxides as semi stable products from the chemistry between plasma and neutral gas [74].
For Ar-CAP, the density is exponentially increasing with the increased voltage and hence scales with the dissipated power. He-CAP, on the other hand, is not affected by the increased applied voltage or the correlating increase in dissipated power. The measurements for He-CAP were within range of the environmental offset and hence the species density could not be detected. A further investigation considered the ROS and RNS species density over the distance to the device. For He-CAP, the densities remained below the detection limit and the results are hence not shown. For Ar-CAP, a strong decrease over distance with a local maximum at about 20 cm is measured and in accordance with previous measurements before the values drop below the thresholds [46,50]. For both cases, He-CAP and Ar-CAP, the ROS and RNS content will be further evaluated qualitatively with OES in the next chapter.

3.4. Optical Diagnosis of the Plasma Source

Using OES on the He-CAP and Ar-CAP allows a relative access to the generation and excitation of reactive oxygen and nitrogen species within the plasma. If OES is used in the UV, VIS to NIR spectral range, the existence of atomic lines from hydrogen, nitrogen and oxygen as well as molecular bands of nitrogen oxide NO, hydroxyl OH, molecular nitrogen (N 2 ) and molecular nitrogen ion (N 2 + ) can be detected [31,75]. The measurement of radiation in the VUV further provides information on atomic lines from nitrogen, hydrogen and oxygen as well as the molecular argon excimer continuum and even ozone [30,76,77].

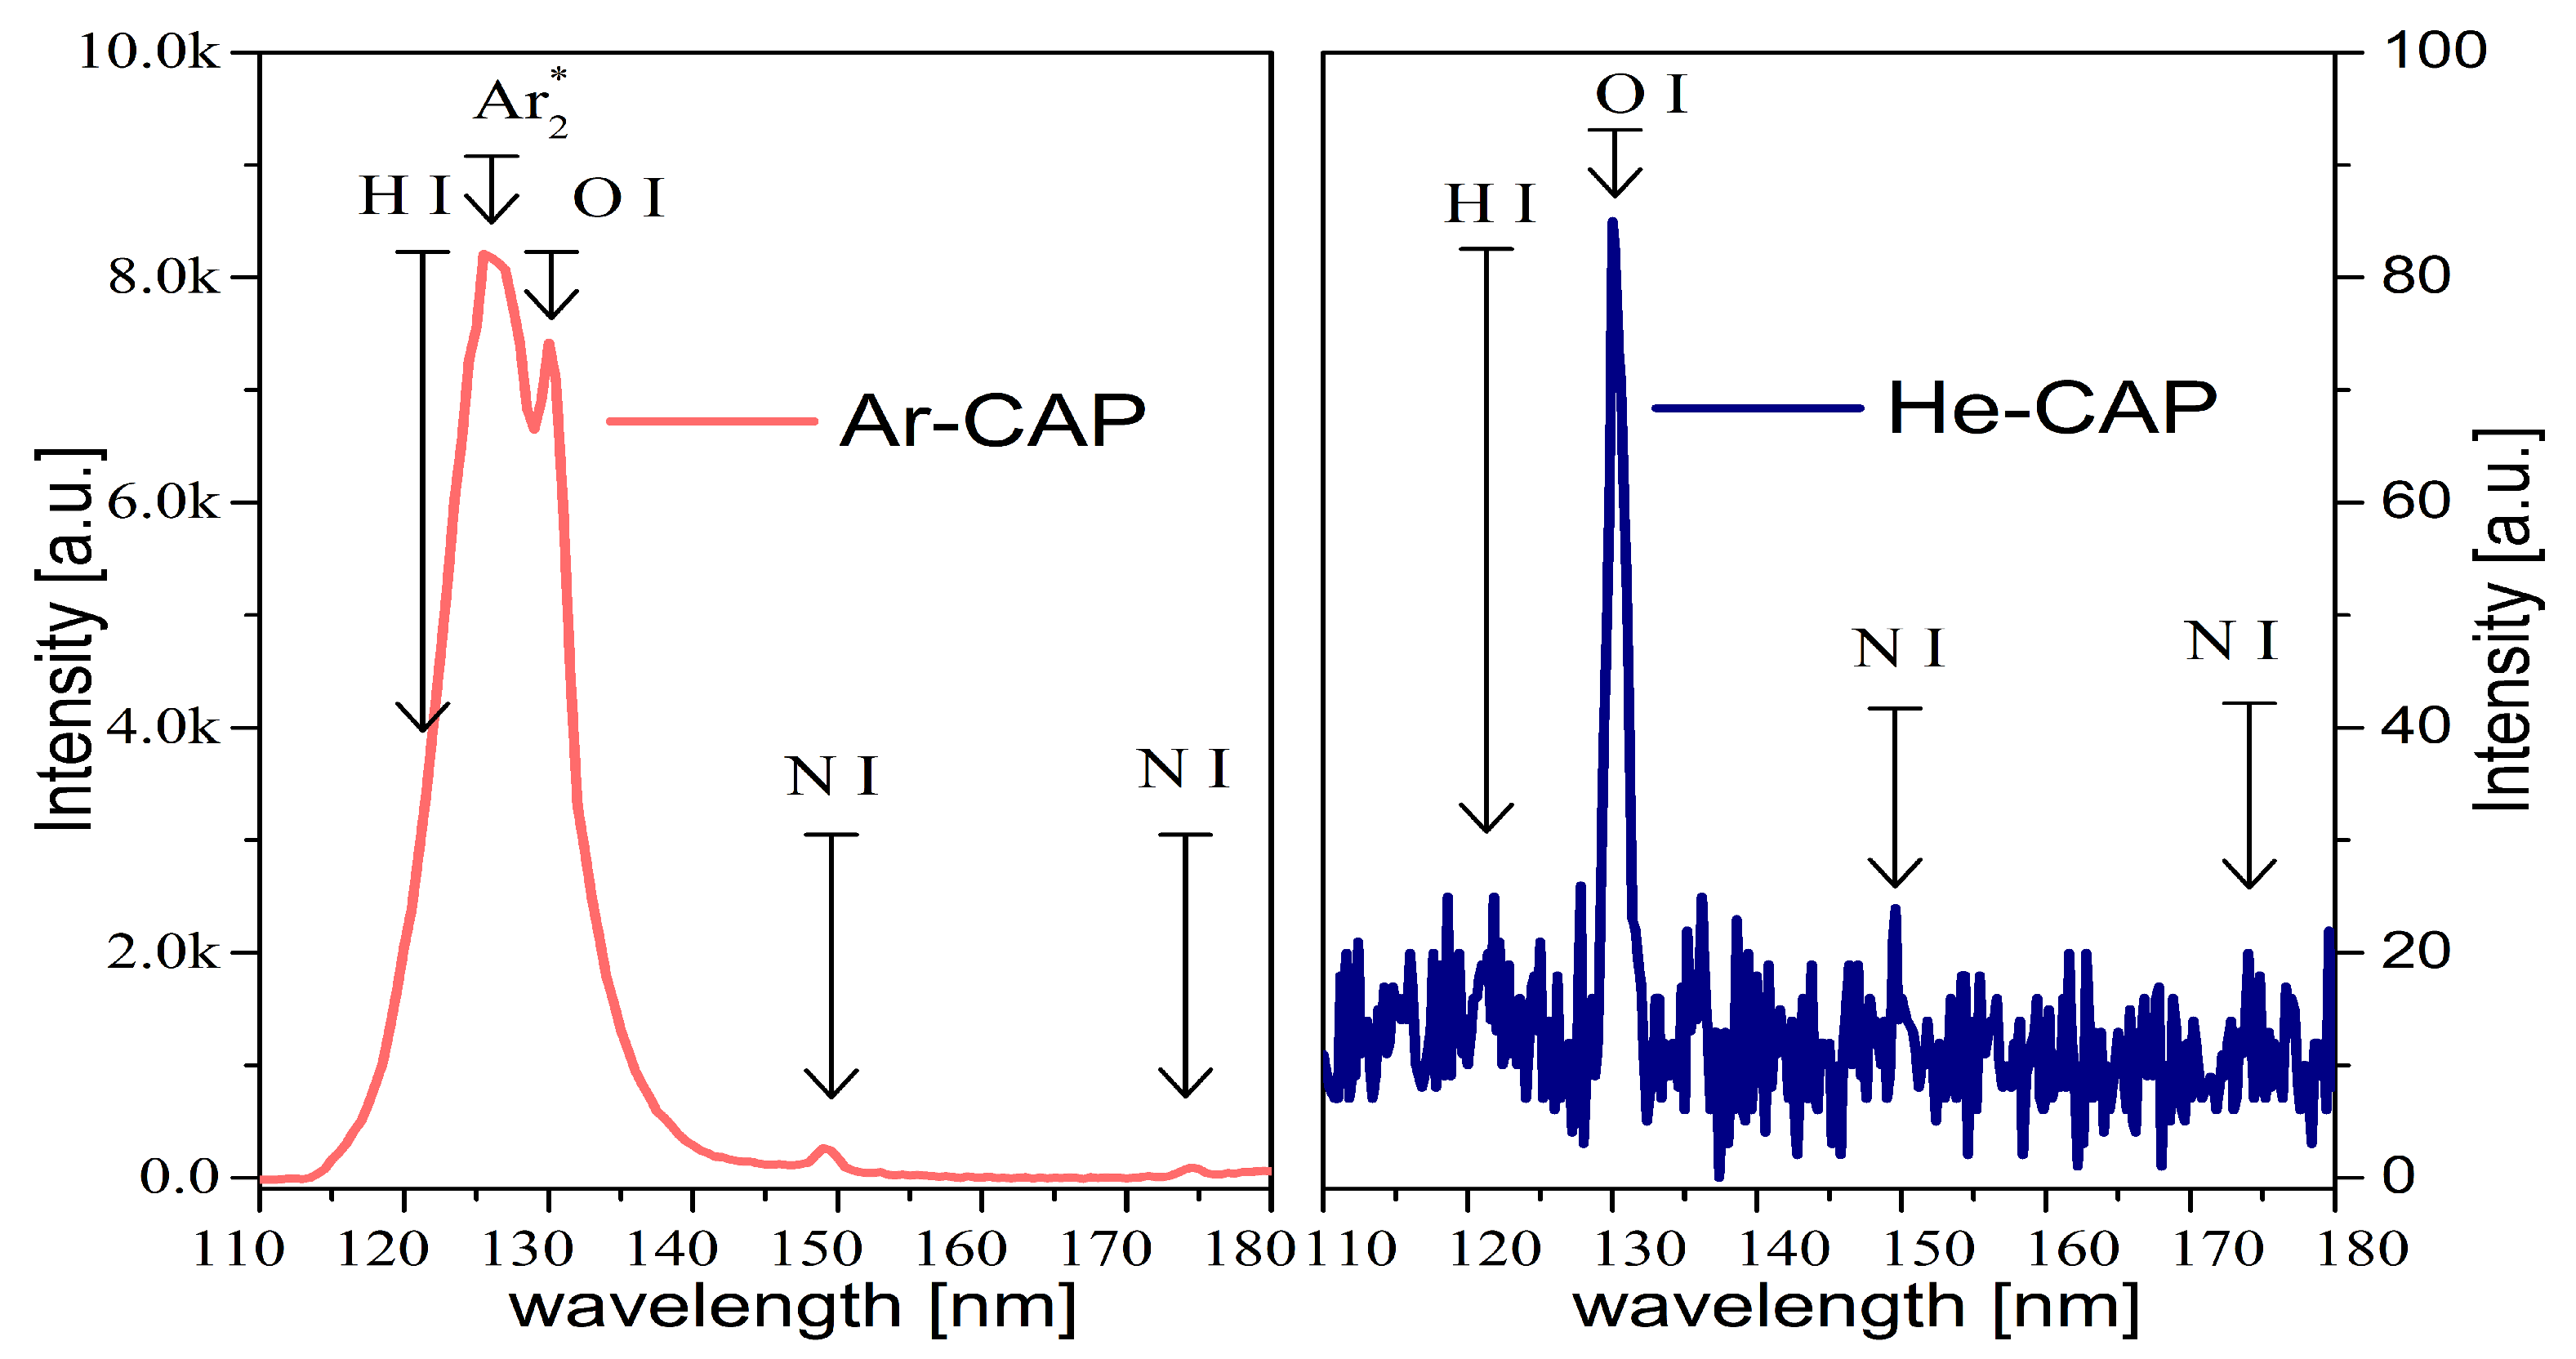
3.4.1. VUV-Radiance Measurements

The emission spectra in the 110–200 nm range using a VUV scanning monochromator are presented in Figure 9. A set of atomic lines of hydrogen (121.5 nm), oxygen (130.5 nm) and nitrogen (149.5 nm and 174.5 nm) is detected, emitting powerful VUV radiation with energies from 7 eV to 9.5 eV. In addition, the continuous profile of the molecular argon excimer is detected for the Ar-CAP from 110 nm up to 140 nm. These species are of interest due to their energy that can be transferred to the surface under treatment. These values of dissociation energies under consideration are between 4.3 eV (for atomic H and Ar) to 9.8 eV (for atomic N and O) [78,79]. It has to be noted that the helium excimer is located below the detection limit of the applied system and hence no information on it can be stated here [37].
When comparing the intensities of He-CAP and Ar-CAP, a much more intense VUV emission in argon could be found. While Ar-CAP radiance could be quantified to reach up to 350 mW/(nm mm 2 sr), no radiance level could be determined for He-CAP. The VUV radiance results present another indication that the RONS production is better observed for the Ar-CAP.

3.4.2. OES Measurements

Emission spectra in the 200–900 nm spectral range of the plasma jets show signatures of molecular and atomic excited species (Figure 10). The molecular bands are assigned to nitrogen oxide (NO γ system), hydroxyl radicals (OH), neutral nitrogen molecules ( N 2 ) and nitrogen molecular ion ( N 2 + ). The NO γ system is observed in the 200–280 nm region with characteristic bands, as for the OH radical, their signature is between 306–310 nm. Bands of N 2 are observable in the spectral range of 315–380 nm and 399–405.9 nm. The N 2 + have bands at 391.4 nm, 427.8 nm and 470.0 nm. The atomic lines form the emitted spectra are assigned to helium atoms (lines at 588.8 nm, 668.5 nm, 706.6 nm and 727.5 nm) or to argon atoms (lines between 680 to 850 nm) as working gas, but also to oxygen atoms (lines at 777.8 nm and 845.5 nm) as products of ambient O 2 and H 2 O dissociation [31,65,67,80,81,82].
In the 220–280 nm spectral region (the UV-C), we observed only for the Ar-CAP the emission signatures of the nitric oxide molecular band (NO γ , in Figure 10), well known for their role as signaling molecules involved in wound healing [83]. The OH and O lines are observed for He-CAP and Ar-CAP, while the line intensity was higher in Ar-CAP. This observation supplements the data acquired from VUV measurements as well as the species density measurements. Another characteristic of the OES spectra of the He-CAP is that the presence of excited nitrogen species is dominantly observed for both N 2 and N 2 + compared to Ar-CAP due to the discharge mechanisms, mainly based on penning effect for helium. In particular, the nitrogen molecular ion is observed in helium CAP as the most intense line. Nonetheless, in the Ar discharge, the NO bands are observed at a lower temperature than in He discharges.
Variations of the atomic lines and bands emitted intensities for the plasma jet operating in air, depending on the working gas, can be easily observed in Figure 10. Moreover, the importance of such plasma active/reactive species is to be considered also from the energetic point of view of these species. Thus, energy values from 4 eV up to 23 eV are attributed to OH radicals, N 2 and N 2 + molecules, hydrogen He, Ar and O atoms, as reported by [78,84].
The results until now show that both devices operated at comparable power values, identical flow and voltage settings generate species with a different efficiency. One way to explain this tendency is via the basic plasma properties of rotational temperature and by considering the given temperatures involved in the chemistry. The ratio between O 3 and NO x is known to depend on the temperature [85]. However, our measurement of the surface temperature, via a temperature optical fiber, in Figure 7 shows a temperature range from 35 C up to 135 C for the He-CAP and a more or less constant temperature for the Ar-CAP in between the helium range. According to neutral gas temperature alone, this effect of species densities can not be explained. Since the studied plasma source is at atmospheric pressure, a non-thermal plasma is assumed. Therefore, the temperature of the electrons is significantly higher than the temperature of the ions and of the neutrals. A frequently used assumption considers the rotational temperature of neutral molecules to be close to the neutral temperature. Therefore, a further investigation of the rotational and vibrational temperatures in He-CAP and Ar-CAP will be performed. Moreover, using simulation software like Lifbase [86] and Spectrum Analyzer [87], we determined from the acquired plasma emission spectra the characteristic plasma temperatures, such as the rotational temperature of OH radicals (T r o t (OH)), the rotational temperature of nitrogen molecular ions N 2 + (T r o t (N 2 + )) and the vibrational temperature of nitrogen molecules N 2 (T v (N 2 )).
As a result, we estimated for Ar-CAP a T r o t (OH) around 420 ± 25 K (∼146 C), T r o t (N 2 + ) 450 ± 50 K (∼176 C), and T v (N 2 ) 1766 ± 167 K. Moreover, for He-CAP, the T r o t (OH) around 420 ± 20 K (∼146 C), T r o t (N 2 + ) 425 ± 25 K (∼151 C), and T v (N 2 ) 2381 ± 603 K. In most cases, cold atmospheric pressure plasmas are considered non-thermal plasmas, and thus the rotational temperatures are often equivalent to those of the working gas. These estimated values of the rotational temperatures of OH radicals and molecular ions of N 2 + are slightly higher than those measured using FOT optical fiber. No significant rotational temperature difference was to be observed between the Ar and He-CAP, this leading to the idea that these two plasmas are at the same temperature, when ignited at the same parameters.
However, it must be borne in mind that these values correspond to ‘spectroscopic temperatures’ referring to the energies that those plasma species (OH, N 2 and N 2 + ) can be achieved by various processes (dissociation, Penning, etc.) and can be further used in the plasma environment to initiate various physico-chemical processes that can take place on the surface or in the plasma volume. The noticeable difference is within the vibration temperature, when He-CAP T v is almost 35% higher than that estimated for Ar-CAP. In addition, it might be that a higher T v (N 2 ) found for He-CAP to be to blamed for the small or even non-existent production of NO x and O 3 .

4. Conclusions

The present study shows for the first time a direct comparison of an identical setup within an identical range of operation settings with helium and argon operation. The range of applied voltage ranged from 8 kV p p up to 20 kV p p for both He-CAP and Ar-CAP, while the resulting dissipated power rises linearly up to 5 W for both systems. An investigation of the electrical field amplitude for He-CAP and Ar-CAP showed peak values of 300 kV/m and 320 kV/m, respectively.
As expected of such high power consumption, the temperature induced on a conductive surface ranges from 40 C up to 130 C for He-CAP and from 50 C up to 85 C for Ar-CAP. The temperature slope over distance is constant and further reduction can be achieved by parameter adjustment of e.g., gas flow. The patient leakage current for He-CAP ranges from 10 μ A up to 200 μ A over applied voltage and drops over distance. The leakage current measurement for Ar-CAP, however, shows a unique slope with a linear increase over applied voltage and a constant slope over distance. This was never observed in literature before and offers unique conditions for surface treatments with constant temperature and leakage values at changing treatment distance over a range of up to the investigated 20 mm.
The production of reactive species was investigated by emission spectroscopy in the (V)UV-VIS-NIR range. Atomic nitrogen and oxygen could be detected in VUV for both systems; however, Ar-CAP showed much stronger signals in all spectral ranges. In addition, the nitrogen oxide emission in the UV range was only measured for argon operation. In accordance with the OES results, species densities of O 3 and NO x could only be measured for Ar-CAP, while, for He-CAP, they were below the detection limits.
Plasma ’spectroscopic temperature’ values, rotational temperatures of OH and N 2 , were estimated to be the same for Ar-CAP and He-CAP, around 420 K (160 C), near the maximum values measured via FOT (130 C). The vibrational temperatures N 2 + revealed different values (higher for He-CAP than Ar-CAP), mainly due to different plasma ignition mechanisms. In addition, the higher T v in the case of helium plasma might be associated with lower production of NO x and O 3 .
At identical CAP settings of geometry and operation conditions, overall, the Ar-CAP shows the more promising parameters, a constant leakage current over distance and a significant species production. Meanwhile, He-CAP generates comparable values in power, electrical field, temperature and leakage current with no detectable reactive species density. It is an interesting observation and further investigations are clearly required to trace the pathways of the helium power consumption leading to the presented observations. In the meantime, the Ar-CAP provides the interesting property of constant leakage current over distance that indicates a voltage dependent current limitation of the conductive channel that is generated by the discharge. The He-CAP might be an interesting approach for a high electrical field application with no toxic species as byproducts. These findings may open a new direction in the plasma source development for Plasma Medicine.
Nevertheless, more experiments should be made, like surface charge production, ultra-fast photography or mass spectrometry in order to have the whole understanding of the plasma source.

Author Contributions

Conceptualization, A.V.N. and T.G.; methodology, A.V.N. and T.G.; validation, A.V.N. and T.G.; formal analysis, A.V.N. and T.G.; investigation, A.V.N. and T.G.; data curation, A.V.N. and T.G.; writing—review and editing, A.V.N. and T.G. All authors have read and agreed to the published version of the manuscript.

Funding

The research of A.V.N. was funded by the UEFISCDI, PNCDI III, project PN-III-P1-1.1-MC-2017-1098 and by ‘Gr. T. Popa’ University of Medicine and Pharmacy Iasi, project GI No. 30339/28.12.2017. T.G. research was funded by the German Ministry of Education and Research (BMBF 13N13960) and by the Ministry of Education, Science and Culture of the State of Mecklenburg-Vorpommern (AU 15 001).

Institutional Review Board Statement

Not applicable.

Informed Consent Statement

Not applicable.

Data Availability Statement

Raw data may be available, on reasonable request, from the authors.

Acknowledgments

The authors would like to acknowledge Laura Vilardell Scholten for writing the customized code “PlaDinSpec” for CAP temperature and leakage current analysis. Furthermore, Peter Druckrey, Peter Holtz, Christiane Meyer and Rüdiger Titze are acknowledged for technical assistance.

Conflicts of Interest

The authors declare no conflict of interest.

References

  1. Han, J. Review of major directions in non-equilibrium atmospheric plasma treatments in medical, biological, and bioengineering applications. Plasma Med. 2013, 3, 175–243. [Google Scholar] [CrossRef] [Green Version]
  2. Von Woedtke, T.; Reuter, S.; Masur, K.; Weltmann, K.D. Plasmas for medicine. Phys. Rep. 2013, 530, 291–320. [Google Scholar] [CrossRef]
  3. Topala, I.; Nastuta, A. Helium atmospheric pressure plasma jet: Diagnostics and application for burned wounds healing. In Plasma for Bio-Decontamination, Medicine and Food Security; Machala, Z., Hensel, K., Akishev, Y., Eds.; Springer: Berlin/Heidelberg, Germany, 2012; pp. 335–345. [Google Scholar] [CrossRef]
  4. Bruggeman, P.J.; Kushner, M.J.; Locke, B.R.; Gardeniers, J.G.; Graham, W.; Graves, D.B.; Hofman-Caris, R.; Maric, D.; Reid, J.P.; Ceriani, E.; et al. Plasma–liquid interactions: A review and roadmap. Plasma Sources Sci. Technol. 2016, 25, 053002. [Google Scholar] [CrossRef]
  5. Bekeschus, S.; Mueller, A.; Miller, V.; Gaipl, U.; Weltmann, K.D. Physical plasma elicits immunogenic cancer cell death and mitochondrial singlet oxygen. IEEE Trans. Radiat. Plasma Med. Sci. 2017, 2, 138–146. [Google Scholar] [CrossRef]
  6. Bekeschus, S.; Wende, K.; Hefny, M.M.; Rödder, K.; Jablonowski, H.; Schmidt, A.; von Woedtke, T.; Weltmann, K.D.; Benedikt, J. Oxygen atoms are critical in rendering THP-1 leukaemia cells susceptible to cold physical plasma-induced apoptosis. Sci. Rep. 2017, 7, 2791. [Google Scholar] [CrossRef] [PubMed] [Green Version]
  7. Gerber, I.; Mihaila, I.; Hein, D.; Nastuta, A.; Jijie, R.; Pohoata, V.; Topala, I. Time Behaviour of Helium Atmospheric Pressure Plasma Jet Electrical and Optical Parameters. Appl. Sci. 2017, 7, 812. [Google Scholar] [CrossRef] [Green Version]
  8. Laroussi, M.; Lu, X.; Keidar, M. Perspective: The physics, diagnostics, and applications of atmospheric pressure low temperature plasma sources used in plasma medicine. J. Appl. Phys. 2017, 122, 020901. [Google Scholar] [CrossRef]
  9. Dai, X.; Bazaka, K.; Richard, D.J.; Thompson, E.R.W.; Ostrikov, K.K. The emerging role of gas plasma in oncotherapy. Trends Biotechnol. 2018, 36, 1183–1198. [Google Scholar] [CrossRef] [PubMed]
  10. Bekeschus, S.; Favia, P.; Robert, E.; von Woedtke, T. White paper on plasma for medicine and hygiene: Future in plasma health sciences. Plasma Process. Polym. 2019, 16, 1800033. [Google Scholar] [CrossRef] [Green Version]
  11. Branỳ, D.; Dvorská, D.; Halašová, E.; Škovierová, H. Cold Atmospheric Plasma: A Powerful Tool for Modern Medicine. Int. J. Mol. Sci. 2020, 21, 2932. [Google Scholar] [CrossRef] [PubMed] [Green Version]
  12. Busco, G.; Robert, E.; Chettouh-Hammas, N.; Pouvesle, J.M.; Grillon, C. The emerging potential of cold atmospheric plasma in skin biology. Free. Radic. Biol. Med. 2020, 161, 290–304. [Google Scholar] [CrossRef] [PubMed]
  13. Hahn, V.; Grollmisch, D.; Bendt, H.; von Woedtke, T.; Nestler, B.; Weltmann, K.D.; Gerling, T. Concept for Improved Handling Ensures Effective Contactless Plasma Treatment of Patients with kINPen® MED. Appl. Sci. 2020, 10, 6133. [Google Scholar] [CrossRef]
  14. Keidar, M. Introduction: Plasma for Cancer Therapy; Springer: Berlin/Heidelberg, Germany, 2020; pp. 1–13. [Google Scholar] [CrossRef]
  15. Liu, D.; Zhang, Y.; Xu, M.; Chen, H.; Lu, X.; Ostrikov, K. Cold atmospheric pressure plasmas in dermatology: Sources, reactive agents, and therapeutic effects. Plasma Process. Polym. 2020, 17, 1900218. [Google Scholar] [CrossRef]
  16. von Woedtke, T.; Emmert, S.; Metelmann, H.R.; Rupf, S.; Weltmann, K.D. Perspectives on cold atmospheric plasma (CAP) applications in medicine. Phys. Plasmas 2020, 27, 070601. [Google Scholar] [CrossRef]
  17. Brandenburg, R.; Bogaerts, A.; Bongers, W.; Fridman, A.; Fridman, G.; Locke, B.R.; Miller, V.; Reuter, S.; Schiorlin, M.; Verreycken, T.; et al. White paper on the future of plasma science in environment, for gas conversion and agriculture. Plasma Process. Polym. 2019, 16, 1700238. [Google Scholar] [CrossRef] [Green Version]
  18. Adhikari, B.; Adhikari, M.; Park, G. The Effects of Plasma on Plant Growth, Development, and Sustainability. Appl. Sci. 2020, 10, 6045. [Google Scholar] [CrossRef]
  19. Varilla, C.; Marcone, M.; Annor, G.A. Potential of Cold Plasma Technology in Ensuring the Safety of Foods and Agricultural Produce: A Review. Foods 2020, 9, 1435. [Google Scholar] [CrossRef]
  20. Huzum, R.; Nastuta, A.V. Helium Atmospheric Pressure Plasma Jet Source Treatment of White Grapes Juice for Winemaking. Appl. Sci. 2021, 11, 8498. [Google Scholar] [CrossRef]
  21. Cvelbar, U.; Walsh, J.L.; Černák, M.; de Vries, H.W.; Reuter, S.; Belmonte, T.; Corbella, C.; Miron, C.; Hojnik, N.; Jurov, A.; et al. White paper on the future of plasma science and technology in plastics and textiles. Plasma Process. Polym. 2019, 16, 1700228. [Google Scholar] [CrossRef] [Green Version]
  22. Šimek, M.; Černák, M.; Kylián, O.; Foest, R.; Hegemann, D.; Martini, R. White paper on the future of plasma science for optics and glass. Plasma Process. Polym. 2019, 16, 1700250. [Google Scholar] [CrossRef] [Green Version]
  23. Weltmann, K.D.; Kolb, J.F.; Holub, M.; Uhrlandt, D.; Šimek, M.; Ostrikov, K.; Hamaguchi, S.; Cvelbar, U.; Černák, M.; Locke, B.; et al. The future for plasma science and technology. Plasma Process. Polym. 2019, 16, 1800118. [Google Scholar] [CrossRef] [Green Version]
  24. Lietz, A.M.; Damany, X.; Robert, E.; Pouvesle, J.M.; Kushner, M.J. Ionization wave propagation in an atmospheric pressure plasma multi-jet. Plasma Sources Sci. Technol. 2019, 28, 125009. [Google Scholar] [CrossRef]
  25. Slikboer, E.; Sobota, A.; Garcia-Caurel, E.; Guaitella, O. In-situ monitoring of an organic sample with electric field determination during cold plasma jet exposure. Sci. Rep. 2020, 10, 13580. [Google Scholar] [CrossRef] [PubMed]
  26. Keidar, M.; Beilis, I. Plasma Engineering: Applications from Aerospace to Bio and Nanotechnology; Academic Press: London, UK, 2013. [Google Scholar] [CrossRef]
  27. Sim, K.B.; Baek, D.; Shin, J.H.; Shim, G.S.; Jang, S.W.; Kim, H.J.; Hwang, J.W.; Roh, J.U. Enhanced Surface Properties of Carbon Fiber Reinforced Plastic by Epoxy Modified Primer with Plasma for Automotive Applications. Polymers 2020, 12, 556. [Google Scholar] [CrossRef] [PubMed] [Green Version]
  28. GmbH, P. Plasma processes reduce costs in automotive manufacturing. IST Int. Surf. Technol. 2020, 13, 28–29. [Google Scholar] [CrossRef]
  29. Miebach, L.; Freund, E.; Clemen, R.; Weltmann, K.D.; Metelmann, H.; von Woedtke, T.; Gerling, T.; Wende, K.; Bekeschus, S. Conductivity augments ROS and RNS delivery and tumor toxicity of an argon plasma jet. Free Radic. Biol. Med. in press.
  30. Brandenburg, R.; Lange, H.; von Woedtke, T.; Stieber, M.; Kindel, E.; Ehlbeck, J.; Weltmann, K.D. Antimicrobial effects of UV and VUV radiation of nonthermal plasma jets. IEEE Trans. Plasma Sci. 2009, 37, 877–883. [Google Scholar] [CrossRef]
  31. Gerling, T.; Nastuta, A.; Bussiahn, R.; Kindel, E.; Weltmann, K. Back and forth directed plasma bullets in a helium atmospheric pressure needle-to-plane discharge with oxygen admixtures. Plasma Sources Sci. Technol. 2012, 21, 034012. [Google Scholar] [CrossRef] [Green Version]
  32. Schneider, S.; Lackmann, J.W.; Ellerweg, D.; Denis, B.; Narberhaus, F.; Bandow, J.E.; Benedikt, J. The role of VUV radiation in the inactivation of bacteria with an atmospheric pressure plasma jet. Plasma Process. Polym. 2012, 9, 561–568. [Google Scholar] [CrossRef] [Green Version]
  33. Reuter, S.; Sousa, J.S.; Stancu, G.D.; van Helden, J.P.H. Review on VUV to MIR absorption spectroscopy of atmospheric pressure plasma jets. Plasma Sources Sci. Technol. 2015, 24, 054001. [Google Scholar] [CrossRef]
  34. Jablonowski, H.; Bussiahn, R.; Hammer, M.; Weltmann, K.D.; von Woedtke, T.; Reuter, S. Impact of plasma jet vacuum ultraviolet radiation on reactive oxygen species generation in bio-relevant liquids. Phys. Plasmas 2015, 22, 122008. [Google Scholar] [CrossRef] [Green Version]
  35. Es-sebbar, E.t.; Bénilan, Y.; Fray, N.; Cottin, H.; Jolly, A.; Gazeau, M.C. VUV Spectral Irradiance Measurements in H2/He/Ar Microwave Plasmas and Comparison with Solar Data. Astrophys. J. Suppl. Ser. 2019, 240, 7. [Google Scholar] [CrossRef] [Green Version]
  36. Zhang, Y.; Ishikawa, K.; Mozetič, M.; Tsutsumi, T.; Kondo, H.; Sekine, M.; Hori, M. Polyethylene terephthalate (PET) surface modification by VUV and neutral active species in remote oxygen or hydrogen plasmas. Plasma Process. Polym. 2019, 16, 1800175. [Google Scholar] [CrossRef]
  37. Golda, J.; Biskup, B.; Layes, V.; Winzer, T.; Benedikt, J. Vacuum ultraviolet spectroscopy of cold atmospheric pressure plasma jets. Plasma Process. Polym. 2020, 17, 1900216. [Google Scholar] [CrossRef] [Green Version]
  38. Liu, F.; Nie, L.; Lu, X.; Stephens, J.; Ostrikov, K. Atmospheric plasma VUV photon emission. Plasma Sources Sci. Technol. 2020, 29, 065001. [Google Scholar] [CrossRef]
  39. Zaplotnik, R.; Vesel, A. Effect of VUV Radiation on Surface Modification of Polystyrene Exposed to Atmospheric Pressure Plasma Jet. Polymers 2020, 12, 1136. [Google Scholar] [CrossRef] [PubMed]
  40. Gaborit, G.; Reuter, S.; Iseni, S.; Duvillaret, L. Cold plasma diagnostic using vectorial electrooptic probe. In Proceedings of the 5th International Conference on Plasma Medicine (ICPM 5), Nara, Japan, 18–23 May 2014. [Google Scholar]
  41. Darny, T.; Pouvesle, J.M.; Puech, V.; Douat, C.; Dozias, S.; Robert, E. Analysis of conductive target influence in plasma jet experiments through helium metastable and electric field measurements. Plasma Sources Sci. Technol. 2017, 26, 045008. [Google Scholar] [CrossRef]
  42. Lu, X.P.; Reuter, S.; Laroussi, M.; Liu, D.W. Nonequilibrium Atmospheric Pressure Plasma Jets: Fundamentals, Diagnostics, and Medical Applications, 1st ed.; CRC Press: Boca Raton, FL, USA, 2019. [Google Scholar] [CrossRef]
  43. Iséni, S. Mapping the electric field vector of guided ionization waves at atmospheric pressure. Plasma Res. Express 2020, 2, 025014. [Google Scholar] [CrossRef]
  44. Aljammal, F.; Gaborit, G.; Bernier, M.; Iséni, S.; Galtier, L.; Revillod, G.; Duvillaret, L. Pigtailed Electrooptic Sensor for Time-and Space-Resolved Dielectric Barrier Discharges Analysis. IEEE Trans. Instrum. Meas. 2021, 70, 1–9. [Google Scholar] [CrossRef]
  45. DIN SPEC 91315:2014-06. General Requirements for Plasma Sources in Medicine. 2014. Available online: https://www.beuth.de/en/technical-rule/din-spec-91315/203493369 (accessed on 1 November 2021).
  46. Mann, M.S.; Tiede, R.; Gavenis, K.; Daeschlein, G.; Bussiahn, R.; Weltmann, K.D.; Emmert, S.; von Woedtke, T.; Ahmed, R. Introduction to DIN-specification 91315 based on the characterization of the plasma jet kINPen® MED. Clin. Plasma Med. 2016, 4, 35–45. [Google Scholar] [CrossRef]
  47. Lehmann, A.; Pietag, F.; Arnold, T. Human health risk evaluation of a microwave-driven atmospheric plasma jet as medical device. Clin. Plasma Med. 2017, 7, 16–23. [Google Scholar] [CrossRef]
  48. Xaubet, M.; Baudler, J.S.; Gerling, T.; Giuliani, L.; Minotti, F.; Grondona, D.; Von Woedtke, T.; Weltmann, K.D. Design optimization of an air atmospheric pressure plasma-jet device intended for medical use. Plasma Process. Polym. 2018, 15, 1700211. [Google Scholar] [CrossRef]
  49. Thana, P.; Wijaikhum, A.; Poramapijitwat, P.; Kuensaen, C.; Meerak, J.; Ngamjarurojana, A.; Sarapirom, S.; Boonyawan, D. A compact pulse-modulation cold air plasma jet for the inactivation of chronic wound bacteria: Development and characterization. Heliyon 2019, 5, e02455. [Google Scholar] [CrossRef] [PubMed] [Green Version]
  50. Timmermann, E.; Bansemer, R.; Gerling, T.; Hahn, V.; Weltmann, K.D.; Nettesheim, S.; Puff, M. Piezoelectric-driven plasma pen with multiple nozzles used as a medical device: Risk estimation and antimicrobial efficacy. J. Phys. D Appl. Phys. 2020, 54, 025201. [Google Scholar] [CrossRef]
  51. DIN EN 60601-1:2013-12 VDE 0750-1:2013-12. Medical Electrical Equipment—Part 1: General Requirements for Basic Safety and Essential Performance (IEC 60601-1:2005 + Cor.:2006 + Cor.:2007 + A1:2012); German Version EN 60601-1:2006 + Cor.:2010 + A1:2013. 2013. Available online: https://www.beuth.de/en/standard/din-en-60601-1/193923032 (accessed on 1 November 2021).
  52. Gaborit, G.; Dahdah, J.; Lecoche, F.; Jarrige, P.; Gaeremynck, Y.; Duraz, E.; Duvillaret, L. A nonperturbative electrooptic sensor for in situ electric discharge characterization. IEEE Trans. Plasma Sci. 2013, 41, 2851–2857. [Google Scholar] [CrossRef]
  53. Gaborit, G.; Jarrige, P.; Lecoche, F.; Dahdah, J.; Duraz, E.; Volat, C.; Duvillaret, L. Single shot and vectorial characterization of intense electric field in various environments with pigtailed electrooptic probe. IEEE Trans. Plasma Sci. 2014, 42, 1265–1273. [Google Scholar] [CrossRef]
  54. Gaborit, G.; Dahdah, J.; Lecoche, F.; Treve, T.; Jarrige, P.; Gillette, L.; Piquet, J.; Duvillaret, L. Optical sensor for the vectorial analysis of the plasma induced electric field. In Proceedings of the 2015 IEEE International Conference on Plasma Sciences (ICOPS), Antalya, Turkey, 24–28 May 2015; p. 15360911. [Google Scholar] [CrossRef]
  55. Aljammal, F.; Gaborit, G.; Revillod, G.; Iséni, S.; Duvillaret, L. Optical Probe for the Real Time and Vectorial Analysis of the Electric Field Induced by Ionized Gazes. In Proceedings of the 24th International Symposium on Plasma Chemistry (ISPC), Naples, Italy, 9–14 June 2019; pp. 1–3. [Google Scholar]
  56. Gerling, T.; Brandenburg, R.; Wilke, C.; Weltmann, K.D. Power measurement for an atmospheric pressure plasma jet at different frequencies: Distribution in the core plasma and the effluent. Eur. Phys. J. Appl. Phys. 2017, 78, 10801. [Google Scholar] [CrossRef] [Green Version]
  57. Teschner, T.; Bansemer, R.; Weltmann, K.D.; Gerling, T. Investigation of power transmission of a helium plasma jet to different dielectric targets considering operating modes. Plasma 2019, 2, 348–359. [Google Scholar] [CrossRef] [Green Version]
  58. Brandenburg, R. Dielectric barrier discharges: Progress on plasma sources and on the understanding of regimes and single filaments. Plasma Sources Sci. Technol. 2017, 26, 053001. [Google Scholar] [CrossRef]
  59. Scholten, L.V. PlaDinSpec. 2021. Available online: https://pm-gitlab.intranet.inp-greifswald.de/vilardell/pladinspec (accessed on 1 November 2021).
  60. Foest, R.; Kindel, E.; Lange, H.; Ohl, A.; Stieber, M.; Weltmann, K.D. RF capillary jet-a tool for localized surface treatment. Contrib. Plasma Phys. 2007, 47, 119–128. [Google Scholar] [CrossRef]
  61. Bussiahn, R.; Kindel, E.; Lange, H.; Weltmann, K. Spatially and temporally resolved measurements of argon metastable atoms in the effluent of a cold atmospheric pressure plasma jet. J. Phys. D Appl. Phys. 2010, 43, 165201. [Google Scholar] [CrossRef] [Green Version]
  62. Boeuf, J.; Yang, L.; Pitchford, L. Dynamics of a guided streamer (‘plasma bullet’) in a helium jet in air at atmospheric pressure. J. Phys. D Appl. Phys. 2012, 46, 015201. [Google Scholar] [CrossRef]
  63. Jaiswal, S.; Aguirre, E.; Prakash, G.V. A KHz frequency cold atmospheric pressure argon plasma jet for the emission of O (1 S) auroral lines in ambient air. Sci. Rep. 2021, 11, 1893. [Google Scholar] [CrossRef]
  64. Sretenović, G.B.; Krstić, I.B.; Kovačević, V.V.; Obradović, B.M.; Kuraica, M.M. Spatio-temporally resolved electric field measurements in helium plasma jet. J. Phys. D Appl. Phys. 2014, 47, 102001. [Google Scholar] [CrossRef]
  65. Nastuta, A.V.; Pohoata, V.; Topala, I. Atmospheric pressure plasma jet—living tissue interface: Electrical, optical, and spectral characterization. J. Appl. Phys. 2013, 113, 183302. [Google Scholar] [CrossRef]
  66. Wild, R.; Gerling, T.; Bussiahn, R.; Weltmann, K.; Stollenwerk, L. Phase-resolved measurement of electric charge deposited by an atmospheric pressure plasma jet on a dielectric surface. J. Phys. D Appl. Phys. 2013, 47, 042001. [Google Scholar] [CrossRef]
  67. Gerling, T.; Wild, R.; Nastuta, A.V.; Wilke, C.; Weltmann, K.D.; Stollenwerk, L. Correlation of phase resolved current, emission and surface charge measurements in an atmospheric pressure helium jet. Eur. Phys. J. Appl. Phys. 2015, 71, 20808. [Google Scholar] [CrossRef]
  68. Sobota, A.; Guaitella, O.; Garcia-Caurel, E. Experimentally obtained values of electric field of an atmospheric pressure plasma jet impinging on a dielectric surface. J. Phys. D Appl. Phys. 2013, 46, 372001. [Google Scholar] [CrossRef]
  69. Norberg, S.A.; Johnsen, E.; Kushner, M.J. Helium atmospheric pressure plasma jets touching dielectric and metal surfaces. J. Appl. Phys. 2015, 118, 013301. [Google Scholar] [CrossRef]
  70. Goldberg, B.M.; Reuter, S.; Dogariu, A.; Miles, R.B. 1D time evolving electric field profile measurements with sub-ns resolution using the E-FISH method. Opt. Lett. 2019, 44, 3853–3856. [Google Scholar] [CrossRef] [PubMed]
  71. Kettlitz, M.; Höft, H.; Hoder, T.; Reuter, S.; Weltmann, K.; Brandenburg, R. On the spatio-temporal development of pulsed barrier discharges: Influence of duty cycle variation. J. Phys. D Appl. Phys. 2012, 45, 245201. [Google Scholar] [CrossRef]
  72. Schmidt-Bleker, A.; Reuter, S.; Weltmann, K. Quantitative schlieren diagnostics for the determination of ambient species density, gas temperature and calorimetric power of cold atmospheric plasma jets. J. Phys. D Appl. Phys. 2015, 48, 175202. [Google Scholar] [CrossRef]
  73. Jiang, N.; Yang, J.L.; He, F.; Cao, Z. Interplay of discharge and gas flow in atmospheric pressure plasma jets. J. Appl. Phys. 2011, 109, 093305. [Google Scholar] [CrossRef] [Green Version]
  74. Schmidt-Bleker, A.; Winter, J.; Bösel, A.; Reuter, S.; Weltmann, K.D. On the plasma chemistry of a cold atmospheric argon plasma jet with shielding gas device. Plasma Sources Sci. Technol. 2015, 25, 015005. [Google Scholar] [CrossRef]
  75. Gerling, T.; Hoder, T.; Bussiahn, R.; Brandenburg, R.; Weltmann, K. On the spatio-temporal dynamics of a self-pulsed nanosecond transient spark discharge: A spectroscopic and electrical analysis. Plasma Sources Sci. Technol. 2013, 22, 065012. [Google Scholar] [CrossRef]
  76. Reuter, S.; Winter, J.; Schmidt-Bleker, A.; Schroeder, D.; Lange, H.; Knake, N.; Schulz-Von Der Gathen, V.; Weltmann, K. Atomic oxygen in a cold argon plasma jet: TALIF spectroscopy in ambient air with modelling and measurements of ambient species diffusion. Plasma Sources Sci. Technol. 2012, 21, 024005. [Google Scholar] [CrossRef]
  77. Bruno, G.; Wenske, S.; Mahdikia, H.; Gerling, T.; von Woedtke, T.; Wende, K. Radiation Driven Chemistry in Biomolecules—Is (V)UV Involved in the Bioactivity of Argon Jet Plasmas? Front. Phys. 2021, 9, 708. [Google Scholar] [CrossRef]
  78. Radzig, A.A.; Smirnov, B.M. (Eds.) Reference Data on Atoms, Molecules, and Ions; Springer: Berlin/Heidelberg, Germany, 1985. [Google Scholar] [CrossRef]
  79. Capitelli, M.; Ferreira, C.M.; Osipov, A.I.; Gordiets, B.F. Plasma Kinetics in Atmospheric Gases; Springer: Berlin/Heidelberg, Germany, 2000. [Google Scholar]
  80. Nastuta, A.V.; Topala, I.; Grigoras, C.; Pohoata, V.; Popa, G. Stimulation of wound healing by helium atmospheric pressure plasma treatment. J. Phys. D Appl. Phys. 2011, 44, 105204. [Google Scholar] [CrossRef] [Green Version]
  81. Nastuta, A.; Topala, I.; Pohoata, V.; Mihaila, I.; Agheorghiesei, C.; Dumitrascu, N. Atmospheric pressure plasma jets in inert gases: Electrical, optical and mass spectrometry diagnosis. Rom. Rep. Phys. 2017, 69, 407. [Google Scholar]
  82. Nastuta, A.; Popa, G. Surface oxidation and enhanced hydrophilization of polyamide fiber surface after He/Ar atmospheric pressure plasma exposure. Rom. Rep. Phys. 2019, 71, 413. [Google Scholar]
  83. Dobrynin, D.; Arjunan, K.; Fridman, A.; Friedman, G.; Clyne, A.M. Direct and controllable nitric oxide delivery into biological media and living cells by a pin-to-hole spark discharge (PHD) plasma. J. Phys. D Appl. Phys. 2011, 44, 075201. [Google Scholar] [CrossRef]
  84. Kramida, A.; Ralchenko, Y.; Reader, J.; Team, N.A. NIST Atomic Spectra Database; Version 5.8. 2020. Available online: https://physics.nist.gov/asd (accessed on 1 December 2020).
  85. Bansemer, R.; Schmidt-Bleker, A.; van Rienen, U.; Weltmann, K.D. Investigation and control of the-to-transition in a novel sub-atmospheric pressure dielectric barrier discharge. Plasma Sources Sci. Technol. 2017, 26, 065005. [Google Scholar] [CrossRef]
  86. Luque, J.; Crosley, D. LIFBASE: Database and Spectral Simulation Program; SRI International Report; Technical Report MP 99-009; Scientific Research Publishing: Wuhan, China, 1999. [Google Scholar]
  87. Navrátil, Z.; Trunec, D.; Šmíd, R.; Lazar, L. A software for optical emission spectroscopy-problem formulation and application to plasma diagnostics. Czechoslov. J. Phys. 2006, 56, B944–B951. [Google Scholar] [CrossRef]
Figure 1. Overview of the experimental arrangements: (top) CAP, E-field and VUV set-up with a photo of the CAP and E-field probe; (bottom) CAP facing the VUV MgF 2 window with a list of performed diagnostics throughout the manuscript and the description of w/o surface. Leakage current circuit in accordance with [51].
Applsci 12 00644 g001
Figure 2. The applied voltage and discharge current for the Ar (left) and He (right) CAP in mid air (no surface).
Applsci 12 00644 g002
Figure 3. The applied voltage, discharge current and electrical field data for the Ar (left) or He (right) CAP facing a dielectric surface at a distance d = 10 mm (probe head).
Applsci 12 00644 g003
Figure 4. Electrical field strength as function of applied voltage for Ar-CAP and He-CAP (left) and for He-CAP as function of distance from the G1 electrode to 10 mm in front of the exit nozzle (right). The EO-probe was moved axially to the CAP tube and measurements were made at the nozzle exit (‘b’= 0 mm), at 5 mm away from nozzle (‘c’), at 10 mm away from nozzle (‘d’) and near the ground electrode, on the tube at −5 mm from the nozzle exit (positioned instead of the letter ‘a’), exactly as in the right figure (orange circles = EO-probe).
Applsci 12 00644 g004
Figure 5. Charge-voltage plot for device operation in argon (left) and helium (right), each for an applied voltage of 14 kV p p and a quartz plate at 5 mm distance.
Applsci 12 00644 g005
Figure 6. Dissipated power as a function of (a,b) distance and (c) applied voltage (at d = 5 mm) for helium and argon operation. G1 and G2 describe the measurement position of either grounded ring electrode at the capillary (G1) and ground surface (G2).
Applsci 12 00644 g006
Figure 7. Measured values of patient leakage current and temperature for different voltage and distance settings in helium and argon. (a) shows the AC-leakage current for various applied voltages and the temperature for d = 5 mm to a copper surface (the DC-leakage current is below the detection limit of 1 μ A for all conditions); (b) shows the temperature as a function of distance for two applied voltages (8 and 14 kV p p ); (c) shows the AC-leakage current for different distances for two investigated voltages (8 and 14 kV p p ).
Applsci 12 00644 g007
Figure 8. Distribution of ROS and RNS production for argon and helium operation for a conductive surface at d = 5 mm for different (a) applied voltages and (b) different measurement positions of the gas inlet at 8 kV p p .
Applsci 12 00644 g008
Figure 9. VUV spectra of the discharge in argon (left) and helium (right) for an applied voltage of 8 kV p p and a distance to the MgF 2 window of 4 mm. Ar-CAP generated a spectral radiance of up to 350 mW/(nm mm 2 sr) at around 125 nm.
Applsci 12 00644 g009
Figure 10. The emitted light in the UV-Vis-NIR from CAP in Ar (red line) and He (blue line), acquired at 5 mm from the nozzle exit, in mid air, 8 kV p p applied voltage.
Applsci 12 00644 g010
Publisher’s Note: MDPI stays neutral with regard to jurisdictional claims in published maps and institutional affiliations.

