
Edge and Notch Detection in a Plate Using Time Reversal Process of Leaky Lamb Waves
by
 , and
, and
Jean-Christophe Vallée
1,2,*, 
Marie-Aude Ploix
2,
François Baqué
1,
Matthieu Cavaro
1 and
Jean-François Chaix
2 1
CEA, DES, IRESNE, DTN, Center of Cadarache, F-13108 Saint-Paul-Lez-Durance, France
2
Aix Marseille Univ, CNRS, Centrale Marseille, LMA UMR 7031, F-13453 Marseille, France
*
Author to whom correspondence should be addressed.
Appl. Sci. 2022, 12(1), 228; https://doi.org/10.3390/app12010228
Submission received: 23 November 2021
/
Revised: 15 December 2021
/
Accepted: 23 December 2021
/
Published: 27 December 2021
(This article belongs to the Special Issue Ultrasonic Modelling for Non-destructive Testing)
Abstract
:Leaky Lamb waves are proven effective to carry out nondestructive testing especially on parallel and immersed plates. To detect and localize defects in such a set, this work associates for the first time the topological energy method and leaky Lamb waves. This methodology is applied in a single immersed plate to validate its application. Firstly, Lamb mode A1 is generated in the plate, and the reflected waves on the defect are measured. A first case is examined where the edge is considered as a defect to be localized. Then, measurements are taken on a plate where a notch is machined. The measurements are time reversed and reinjected in a finite-element simulation. The results are then correlated with the direct problem of the topological energy method that is also simulated. In both cases, the defects are precisely localized on the energy images. This work is the preliminary step to an application of the topological energy method to a set of two parallel and immersed plates where the research defect is located in the second plate.
1. Introduction
Ultrasonic methods are proven to be particularly relevant within the inspection and monitoring of sodium-cooled fast reactors (SFR) due to opacity and the oxidizing property of liquid sodium that prevents optical inspection and the immersion of conventional ultrasonic transducers. Thus, it has been shown previously that nondestructive testing from the outside of the main vessel allows generating and propagating guided waves in the internal structures, similar to a layered structure (parallel steel plates) immersed in liquid [1,2]. The context implies a main restriction: the only available access to position the transducers is the outside face of the first plate.
These immersed guided waves, called leaky Lamb waves, have been widely studied in the literature [3,4,5,6] and applied to damage detection in plate-like structures [7,8]. In 1917, Sir Horace Lamb investigated the theory of vibration of thin plates and rods [4]. Later, Merkulov and Viktorov studied the vibration of immersed plates in depth [5,6]. The Lamb waves are called “leaky” because of the re-emission of bulk waves in the surrounding fluid. Attenuation due to the leakage is mostly preponderant versus the intrinsic attenuation due to the material [6]. The latter is then not taken into account in this work. This re-emission in the fluid propagates towards the second plate and generates Lamb waves in it.
In order to perform nondestructive testing, the knowledge of the behavior of the Lamb waves is essential. Multiple Lamb modes may coexist and propagate simultaneously at different group and phase velocities. Velocities and attenuations are frequency dependent so that a broadband signal presents a dispersive behavior. The dispersion leads to a spread of the wave packets during the propagation [9]. Nevertheless, by selecting a mode and a frequency range where the group velocity is quite constant, the dispersion can be limited. The selection of the mode can be done by imposing an incidence to the generated acoustic beam through a wedge or a delay law if a linear array transducer is used [10].
Several imaging methods involving Lamb waves are proven effective. For example, a classical B-scan may provide an image of a defect assuming the knowledge of the propagating mode and its velocity in a single plate or in the second plate of the layered structure [2]. Other linear methods using delay-and-sum can also be applied, such as the Synthetic Aperture Focusing Technique (SAFT) [11,12,13], the Total Focusing Method (TFM) [14,15] and their adaptation to Lamb waves, Lamb-SAFT [16] to take into account the dispersive behavior of the Lamb waves, and the sparse-TFM [17] to carry out short range inspection. However, those techniques are focused on the time travel of a single mode and do not use information of the mode conversion that may occur at the reflection on a defect, such as a crack [18,19]. Later on, time-reversal techniques were introduced [20,21,22,23,24] to optimize the resolution of a reconstructed image of an inspected medium. For example, the DORT (Decomposition of the Time-Reversal Operator) method [21] is a selective detection of scatterers using the eigenvectors of the time-reversal operator, extracted from the full-matrix capture of a linear array of transducers. Each significant eigenvector is associated with a scatterer in the inspected medium, and the associated signal can be retropropagated independently in a numerical medium to locate the scatterer. This operation is made possible because of the completeness of the fundamental Lamb modes as proven by Kirrmann [3]. Meanwhile, the topological energy method [22,24,25,26,27,28] requires the numerical solution of only two problems: the direct problem where the experimental source is generated in the healthy corresponding structure and the adjoint problem where the source is the time-reversed difference between the ultrasonic field measured on the transducers of the inspected medium and the reference medium. This time-reversed source can be interpreted as the time-reversed signature of the defects and could provide data of very good quality.
This method has already been applied on Lamb waves in the literature. For example, Rodriguez et al. applied it to the inspection of a free anisotropic plate by a monomodal inspection. The transducers are located on the edge of the plate, and several defects are detected [29]. Further works of Sun et al. showed the efficiency of the topological imaging method towards other methods, notably the TFM [27]. Thus, this method is applicable and efficient in cases of free single plates. But no work was found concerning the leaky Lamb waves in a set of immersed plates.
The topological energy method was preferred in this work because the adjoint field and the time reversal phenomenon allow maintaining a good sensibility and a great localization. Moreover, it involves fewer simulations that can become very time consuming. The topological energy method is also more versatile regarding the complex geometry of two parallel and immersed plates, in particular considering the multiple reflections between the two plates. This work is the first step towards this final issue, and the purpose here is to prove the applicability and efficiency of this method to detect and localize a defect in a single immersed plate using experimental data, where the transducers are set in the fluid above one face of the plate only. The use of leaky Lamb waves associated with the topological energy method constitutes an innovative work in view of the existing literature.
Firstly, the generation and propagation of leaky Lamb waves in parallel and immersed plates are pointed out. Dispersion equations that apply to the Lamb wave propagation are solved numerically and discussed. Then, the topological energy imaging method is applied in order to detect and to localize two kinds of defects: the edge of the plate (representative of a through-crack) and a notch close to the edge. The mode A1 is experimentally generated, and a phased array system acquires the ultrasonic signature of the defect. Afterwards, the two propagation problems are solved numerically. Results eventually show the reconstructed images based on the experimental datasets in two cases.
2. Theoretical Background of the Leaky Lamb Wave Propagation and Generation
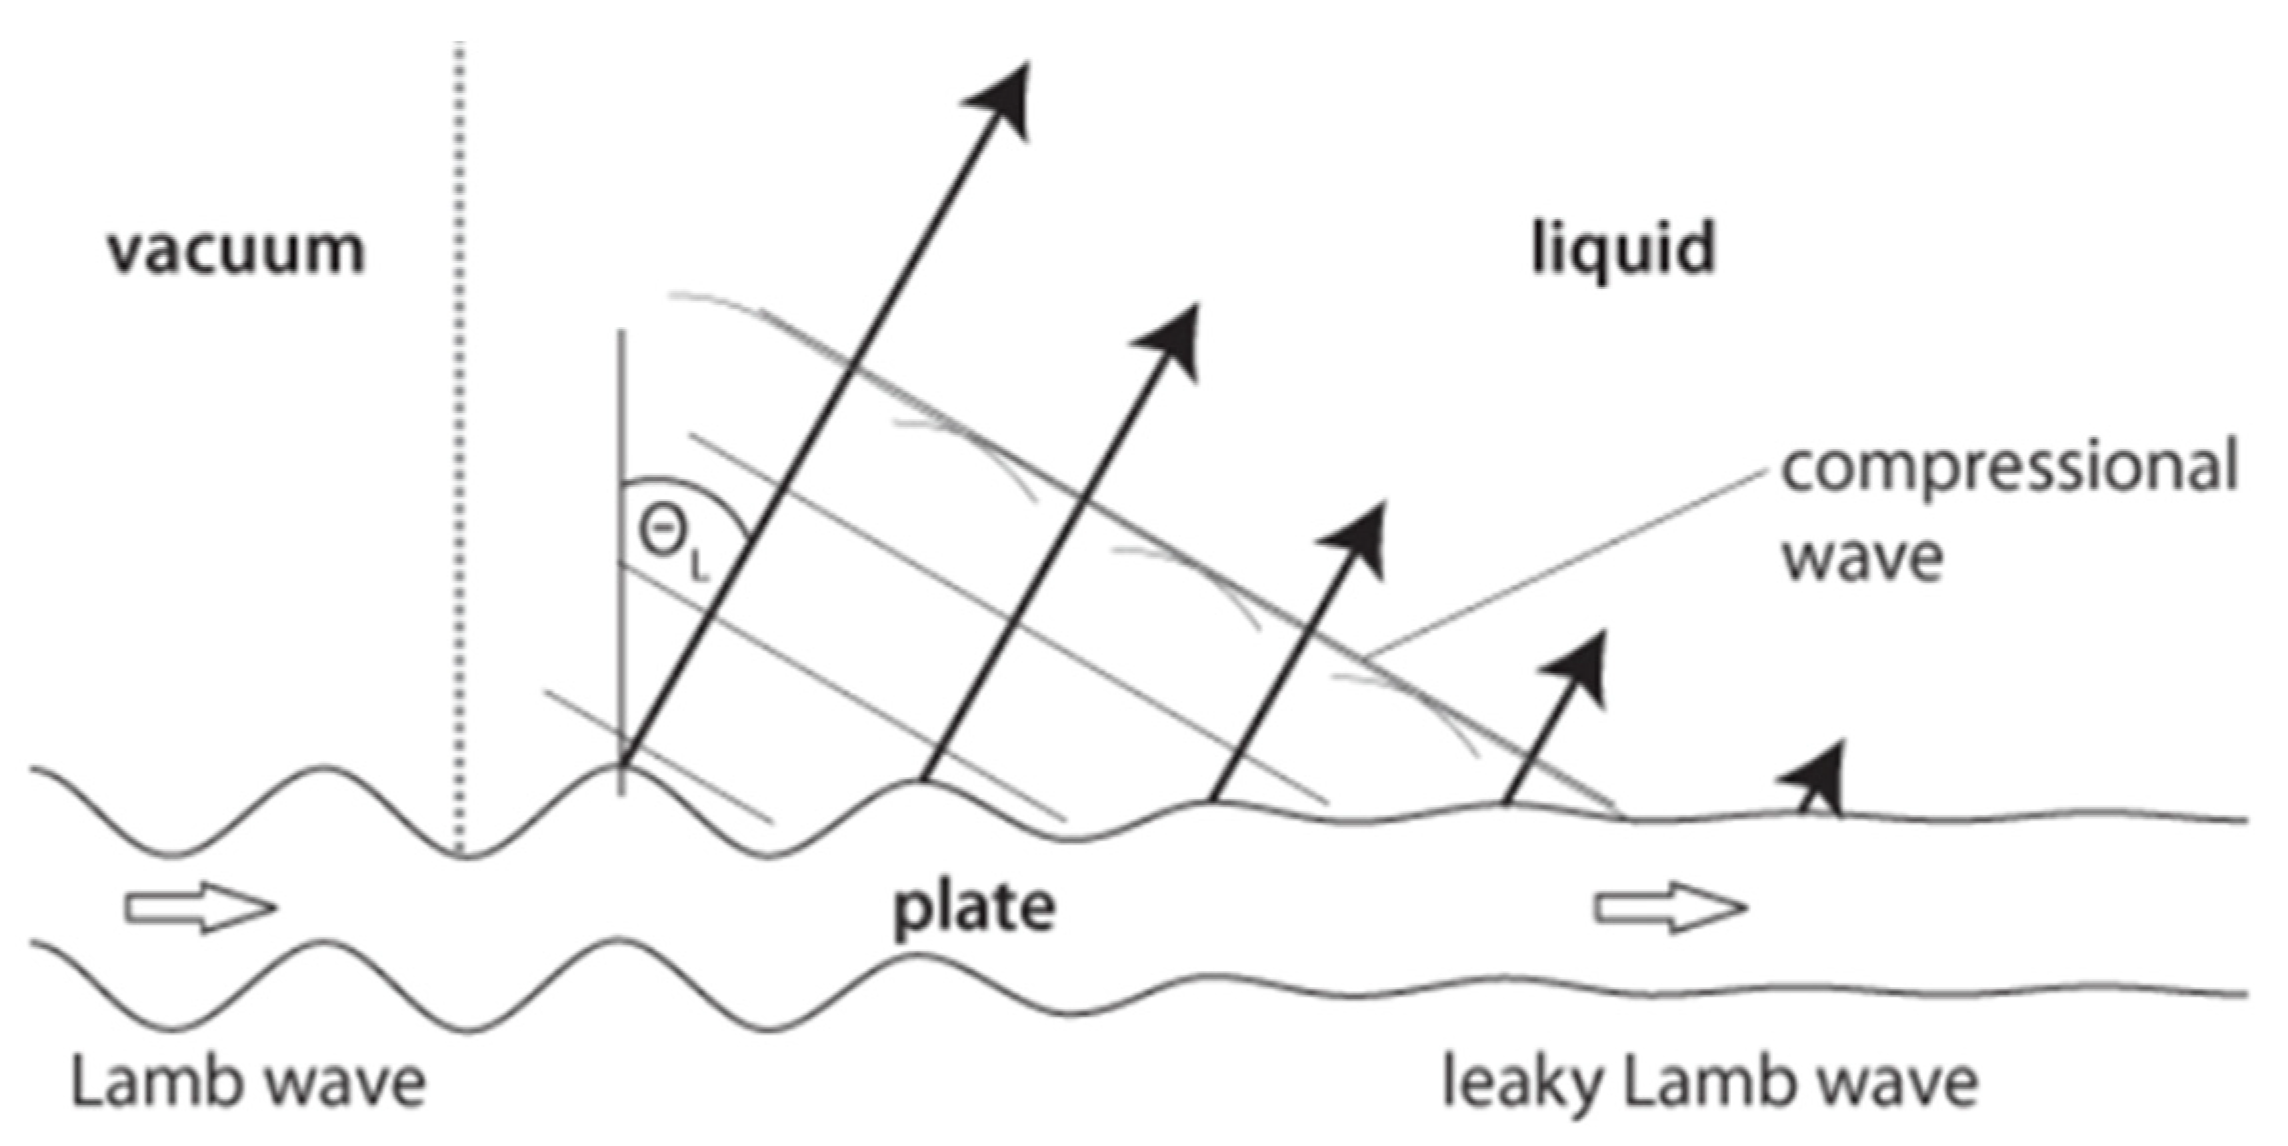
Lamb waves were first discovered by Sir Horace Lamb in 1917 [4]. Lamb waves are comparable to resonances resulting from the superposition of longitudinal and shear waves in thin plates. In free plates, Lamb waves can travel long distances that allow them to be a useful tool for long-range inspection. The Lamb modes can be separated into two categories: symmetrical (S) and antisymmetric (A). This denomination is based on the symmetrical nature of the displacement profile parallel to the surface of the plate. An infinite number of harmonics of the symmetrical and antisymmetric modes exist [6]. When a fluid surrounds the plate, a leaky attenuation appears as explained by Merkulov [5]. The energy of the Lamb waves is converted into compressional waves in the liquid as shown in Figure 1. Each Lamb wave mode is associated with an angle of re-emission (and by reciprocity to an angle of incidence, as explained later).
The dispersion equations that govern respectively symmetrical and antisymmetric leaky Lamb wave modes are recalled [6]:
where is the imaginary unit. is the thickness of the plate. , , , , (the wave number) and (the frequency) are the solutions. and are respectively the longitudinal and transversal wave numbers in the plate. and are respectively the speed of the longitudinal and transversal wave in the plate. is the speed of waves in the fluid. is the density of the plate, and is the density of the fluid.
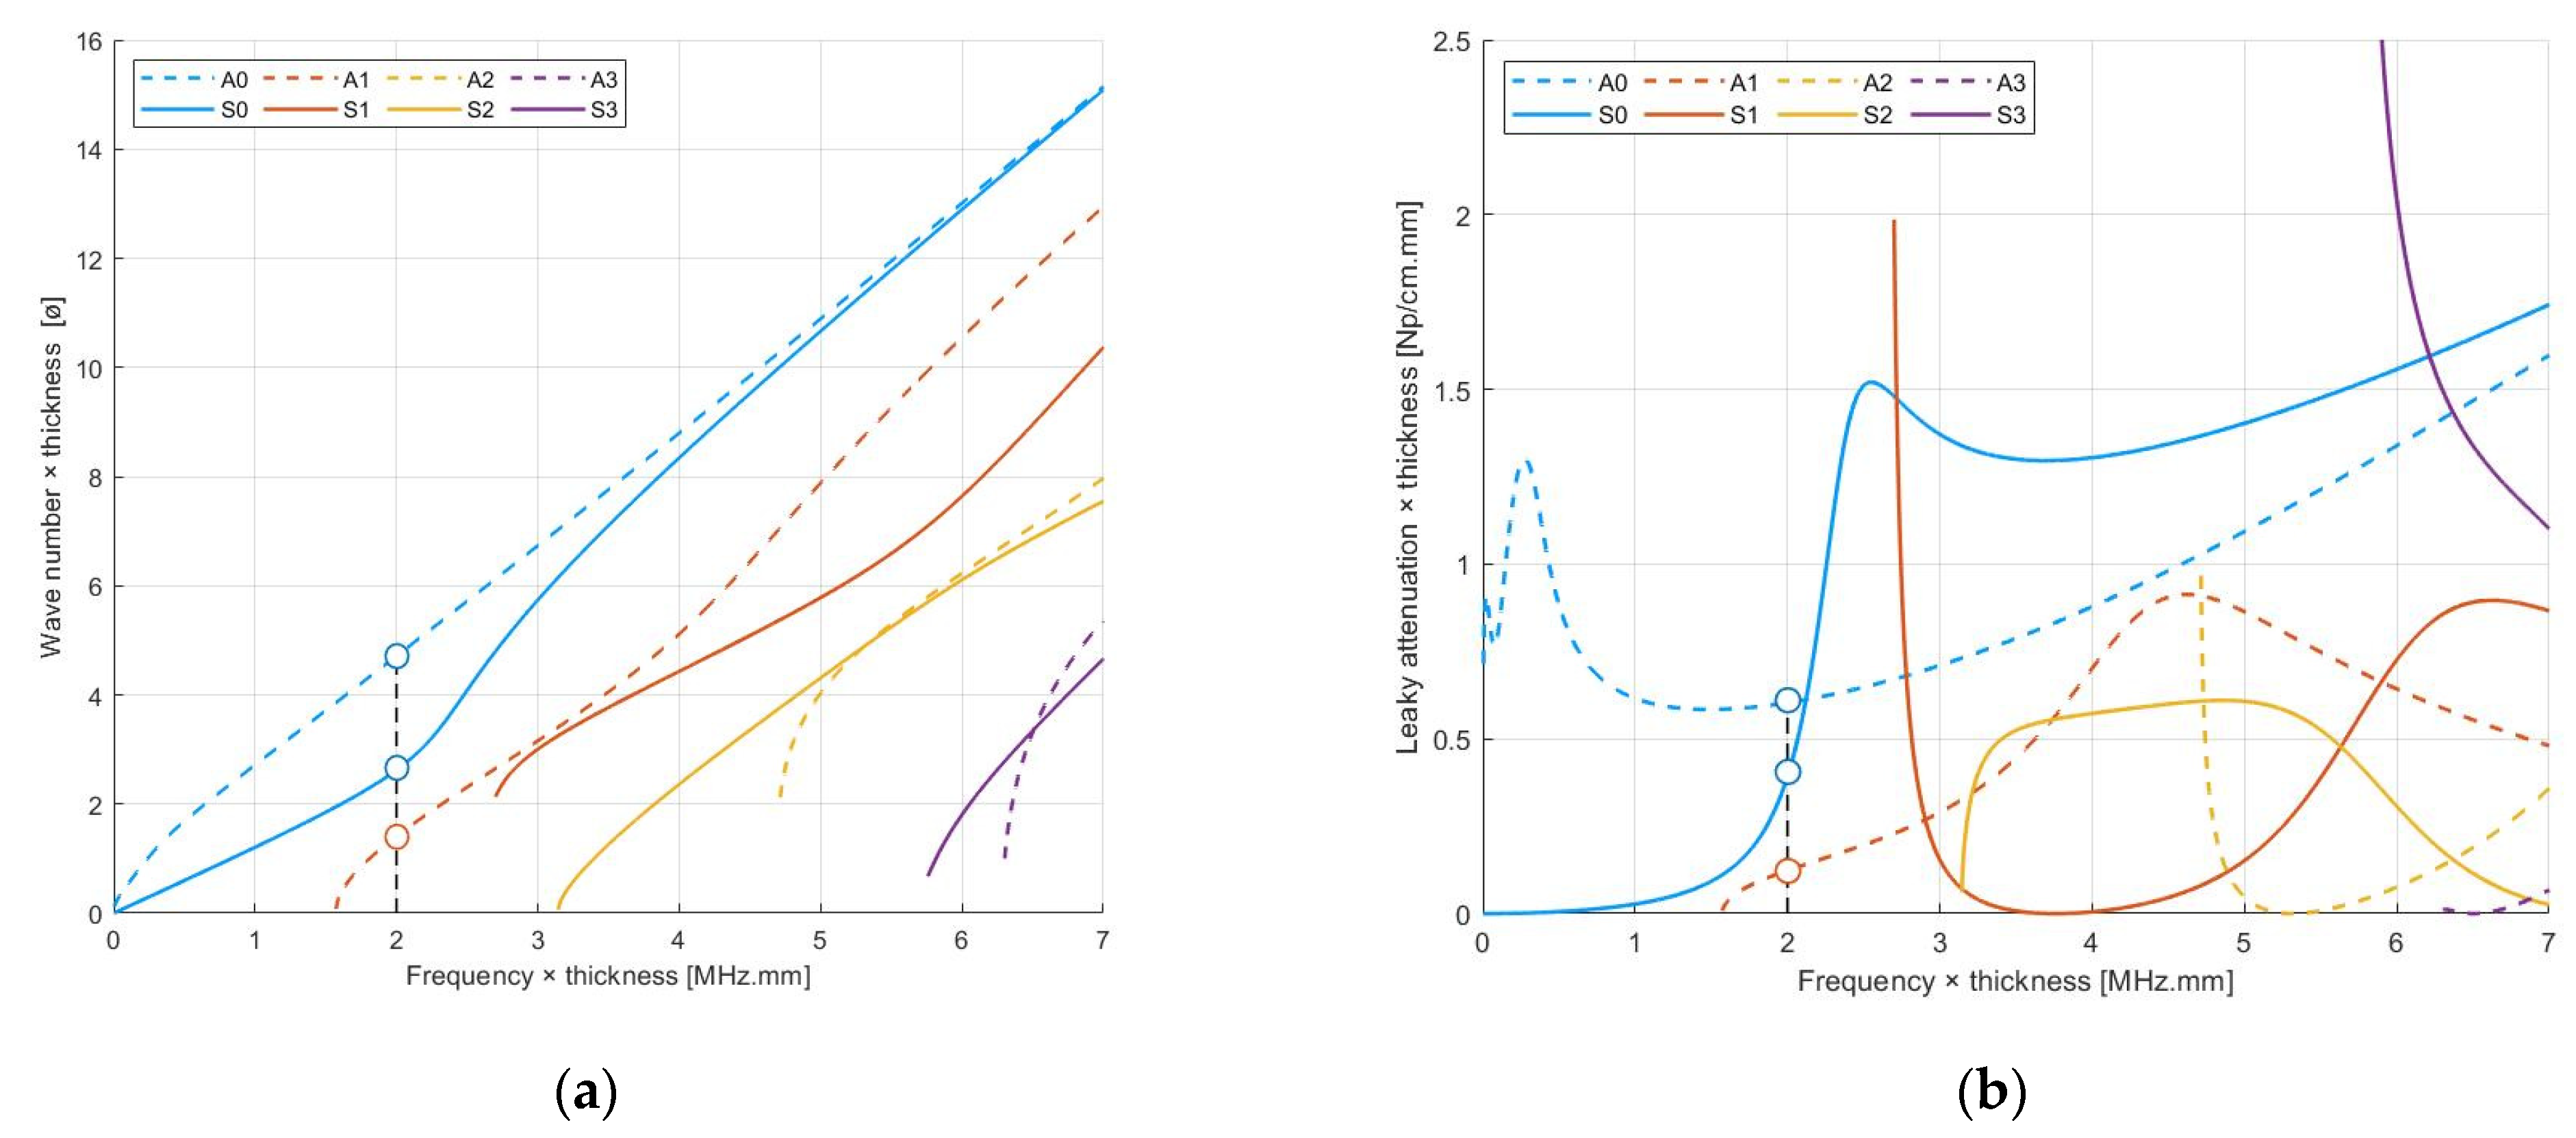
One can notice that the real part of the equations corresponds to the dispersion equations of a free plate [4]. The imaginary part corresponds to the fluid–structure interaction and is proportional to the ratio . The wave number solution of these equations is a complex number . Its real part represents the propagative properties of the wave, and its imaginary part represents the leaky attenuation by re-emission in the fluid.
The duets solutions of the dispersion equations are plotted in Figure 2a regarding the real part of and in Figure 2b regarding the imaginary part of .
In this work, the plate is mm thick and made of stainless steel. The density of the plate is , and the celerities of the longitudinal and transversal waves are respectively and . The density of the water is , and the velocity of the compressional wave in the water is On the one hand, a normalization on the frequency is performed because the dispersion equations are invariant regarding the product frequency × thickness. On the other hand, the wave number and the attenuation are inversely proportional to the thickness, and a normalization is also performed.
At a given frequency × thickness, several modes may coexist and propagate at the same time. For example, in Figure 2a, at 2 MHz.mm, the modes A0, S0, and A1 may propagate together. One can note in Figure 2b that the modes A0 and S0 present a high attenuation, whereas the mode A1 presents a lower leakage by re-emission.
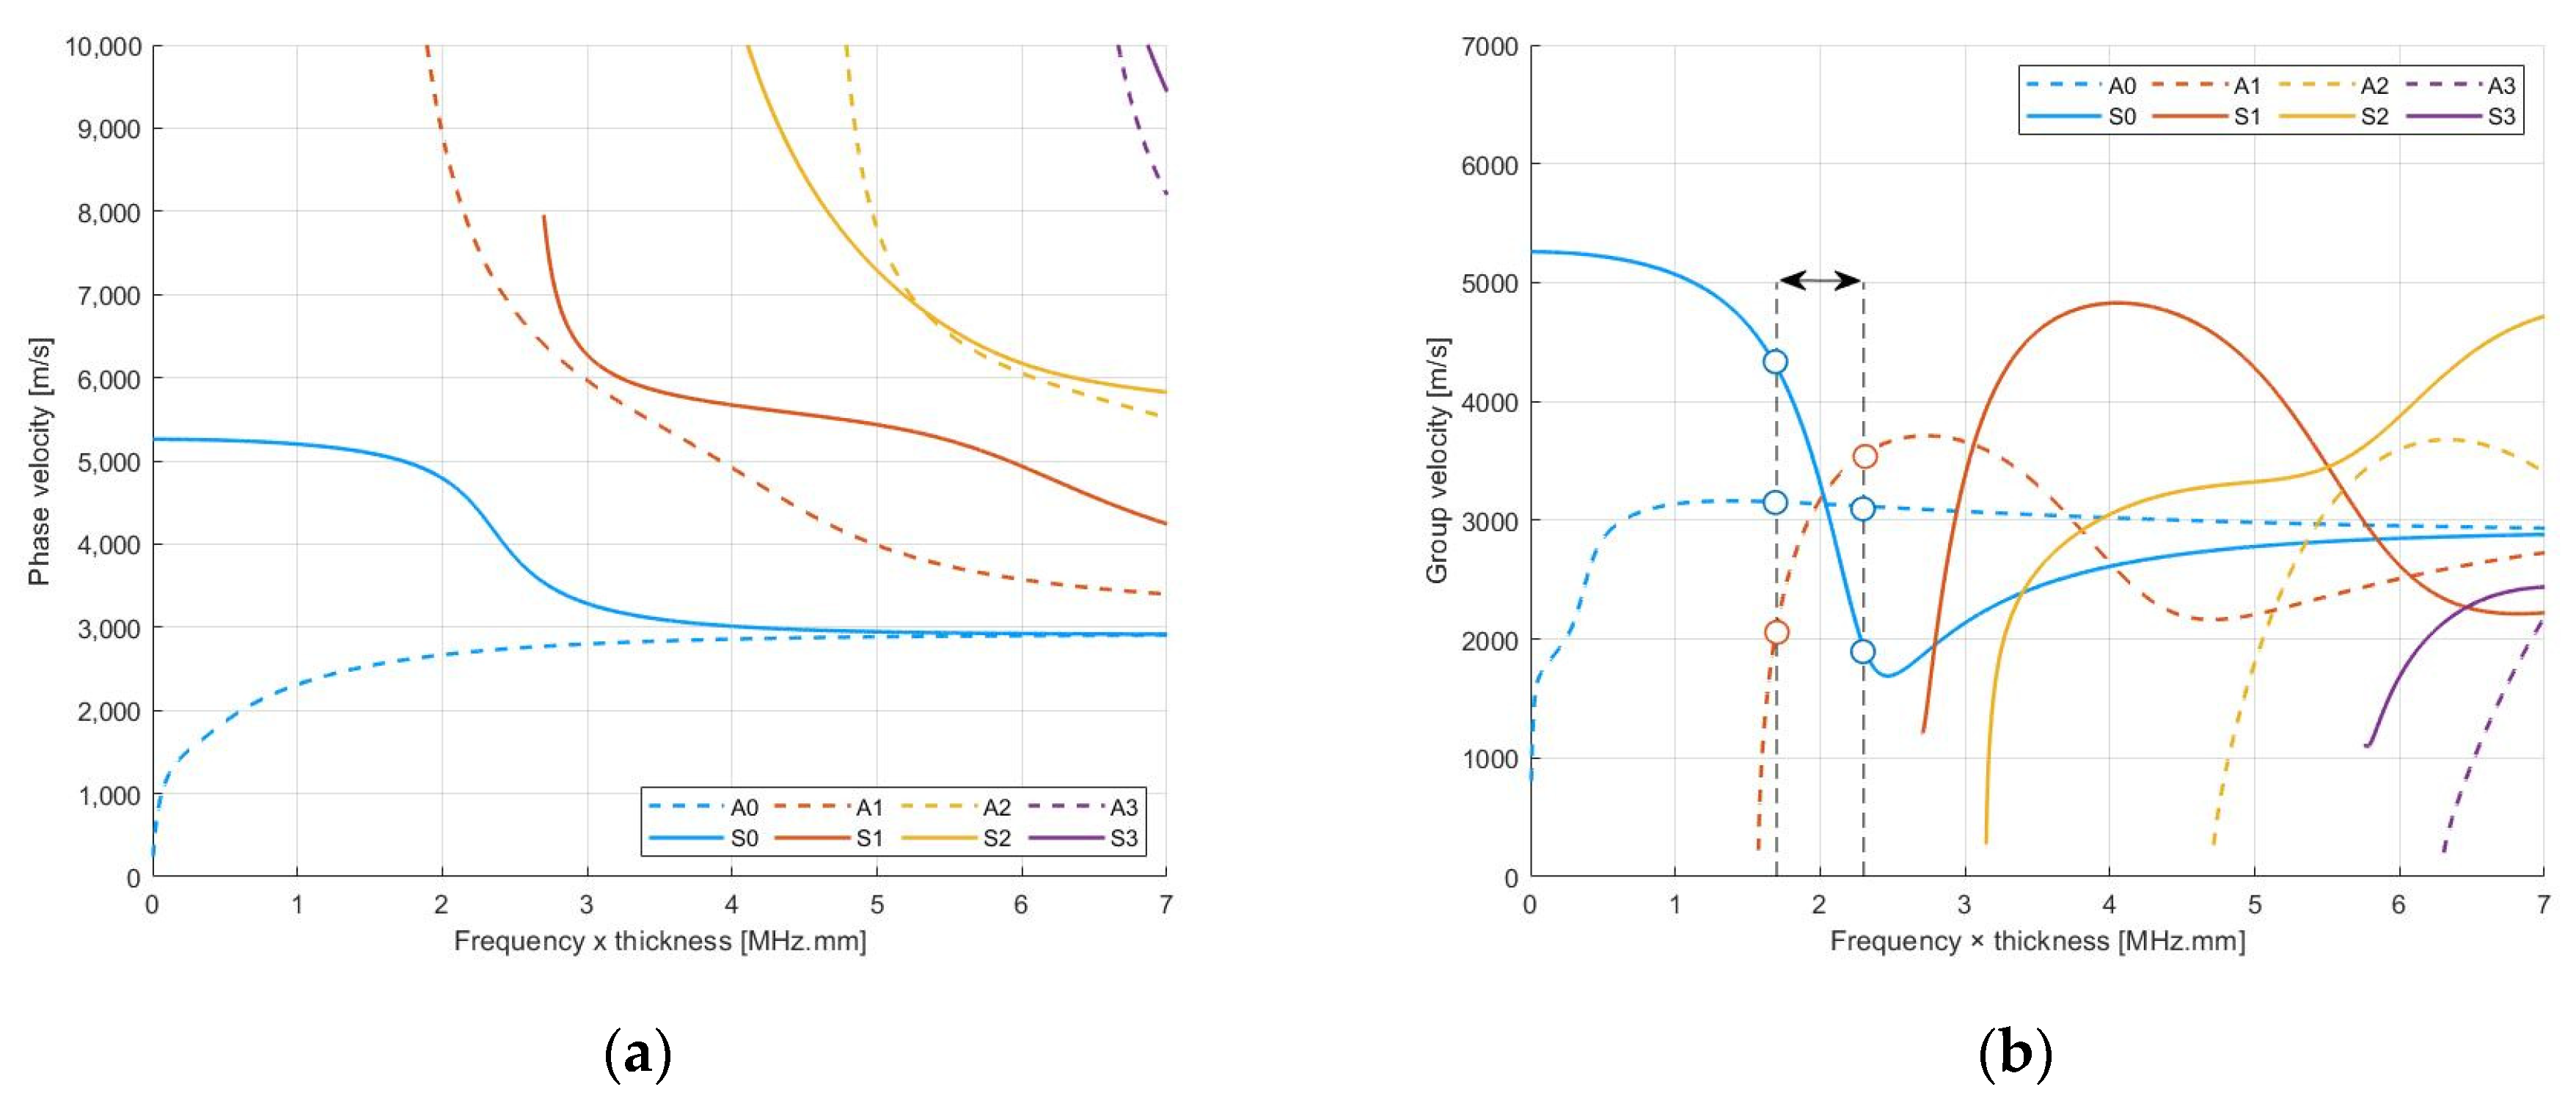
The phase velocity of the modes is evaluated using the real part of the wave numbers . The group velocity is derived from the phase velocity: , where . Both phase and group velocities are plotted respectively in Figure 3a,b. A real signal is never purely monochromatic. Its spectrum is defined by a band. That is why group velocities are of interest. In the example given by Figure 3b around , the modes have different group velocities. On the bandwidth, the group velocity of the mode A0 is rather constant, whereas the group velocity of the mode S0 varies by up to 100%. This highlights the dispersive property of the Lamb wave, described in detail in [9].
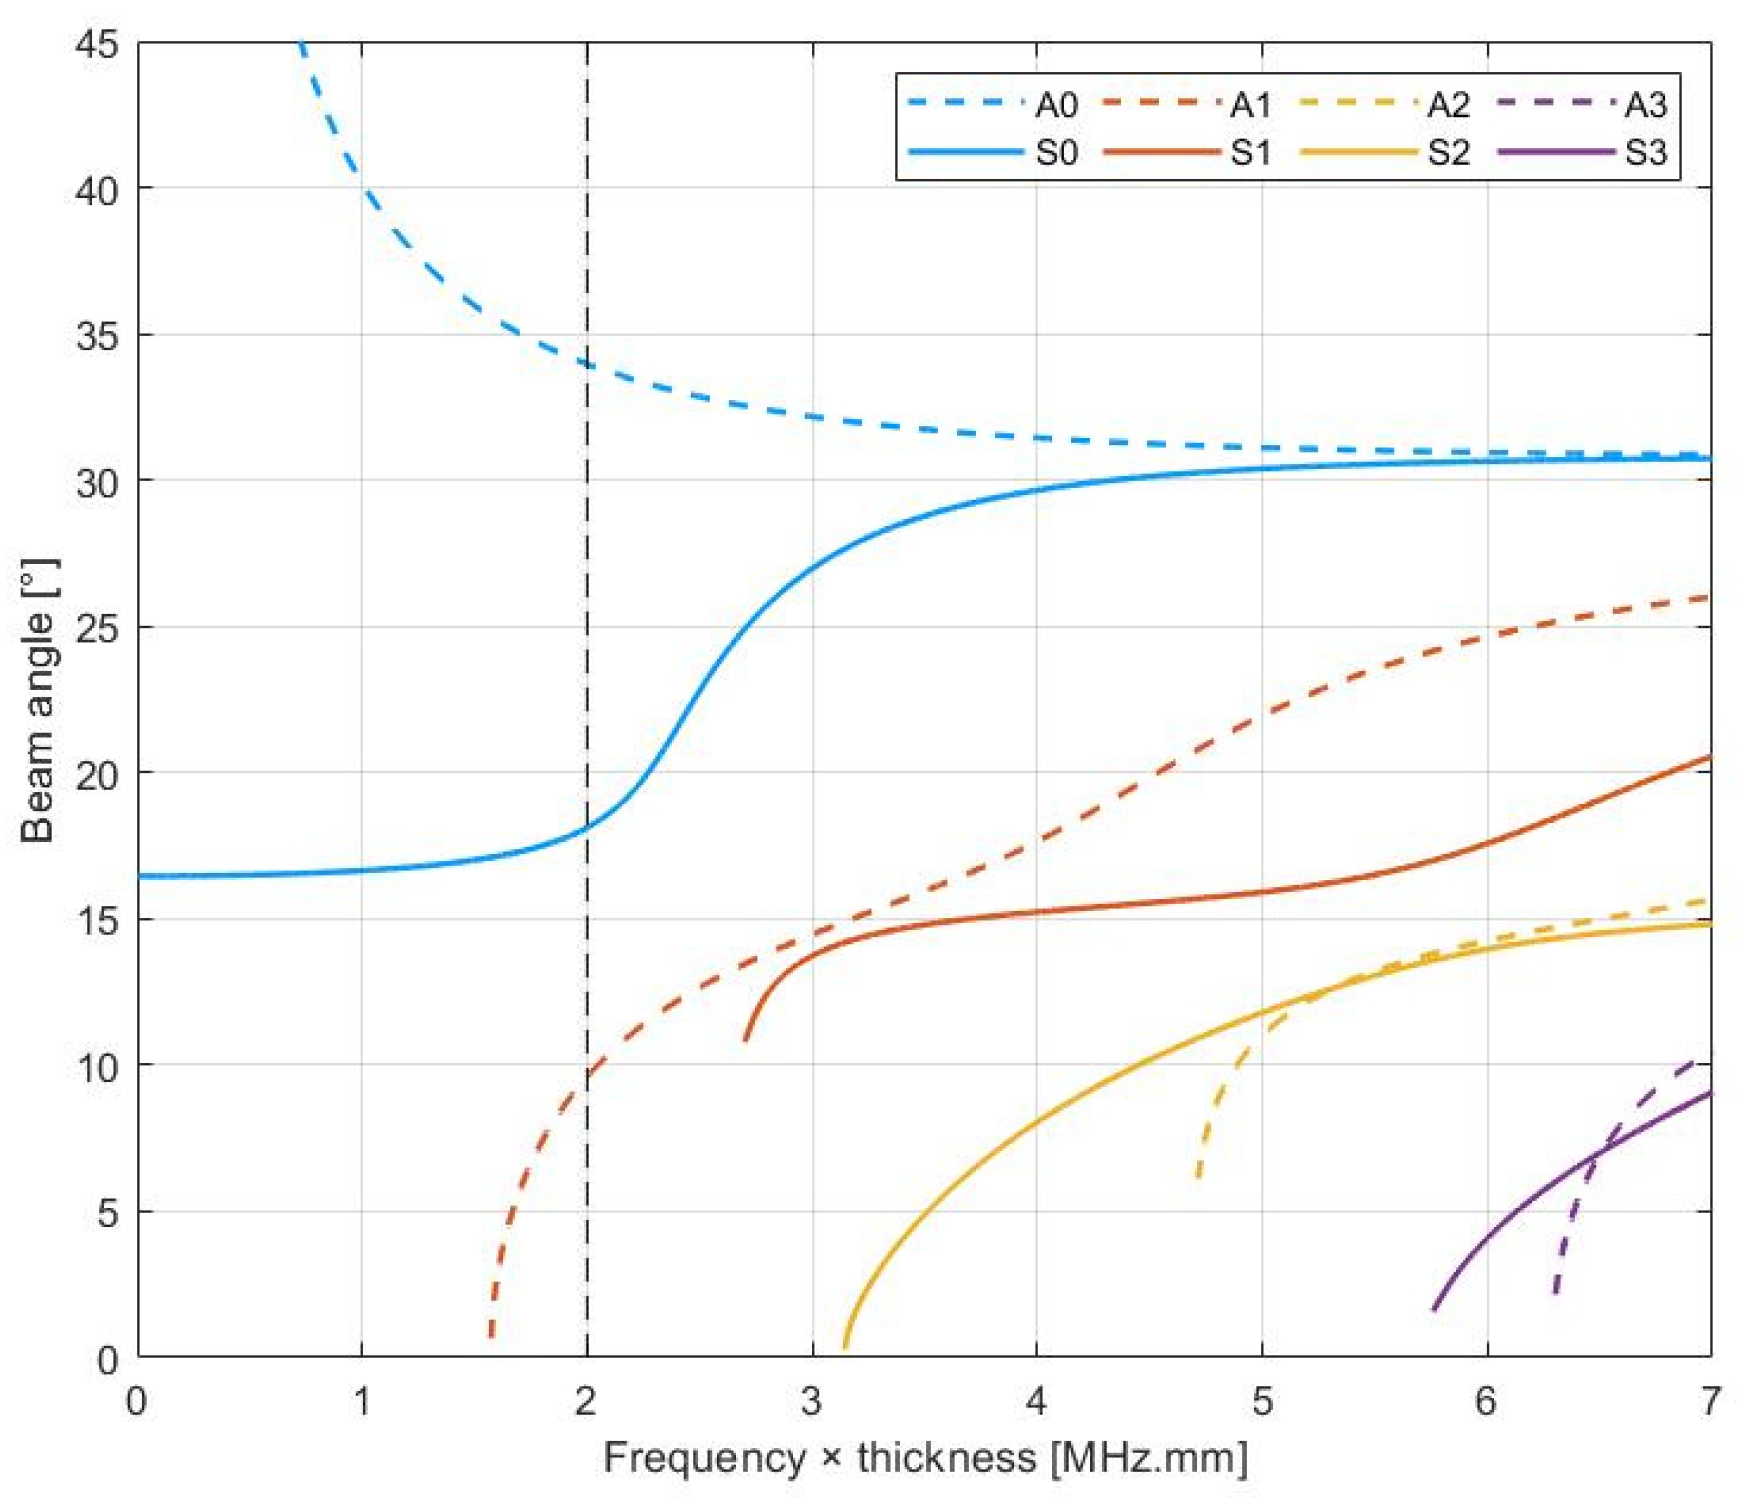
By reciprocity of the re-emission shown in Figure 1, Lamb waves can be generated in an immersed plate by a steered incident beam. The acoustic wave propagates in the fluid to the plate, where a reflected wave and a transmitted wave appear [31]. One can find the angles that maximize the transmitted wave in the plate [32]. Those angles tie in with the angles that can be found using Snell’s law, and the phase velocity of each mode is
where is the beam incidence angle in the fluid, in the plate. is the wave velocity in the fluid. is the phase velocity of the aimed mode at a given product frequency × thickness. The beam angles in the case of our experiments are plotted in Figure 4. For example, at , the A1 mode can be generated by an incident wave with an angle of .
3. Imaging Method and Configuration
3.1. Topological Energy Imaging Computation
The topological energy imaging method comes from the optimization for inverse problems [33] and was first introduced by Dominguez [22]. This method is defined as a minimization problem of the mathematical distance between an unknown inspected medium and a simulated reference medium. One can assume that the reference undamaged medium has the same material properties as the damaged unknown one. In our case, the simulation is achievable and workable using a finite-element model with Comsol Multiphysics®.
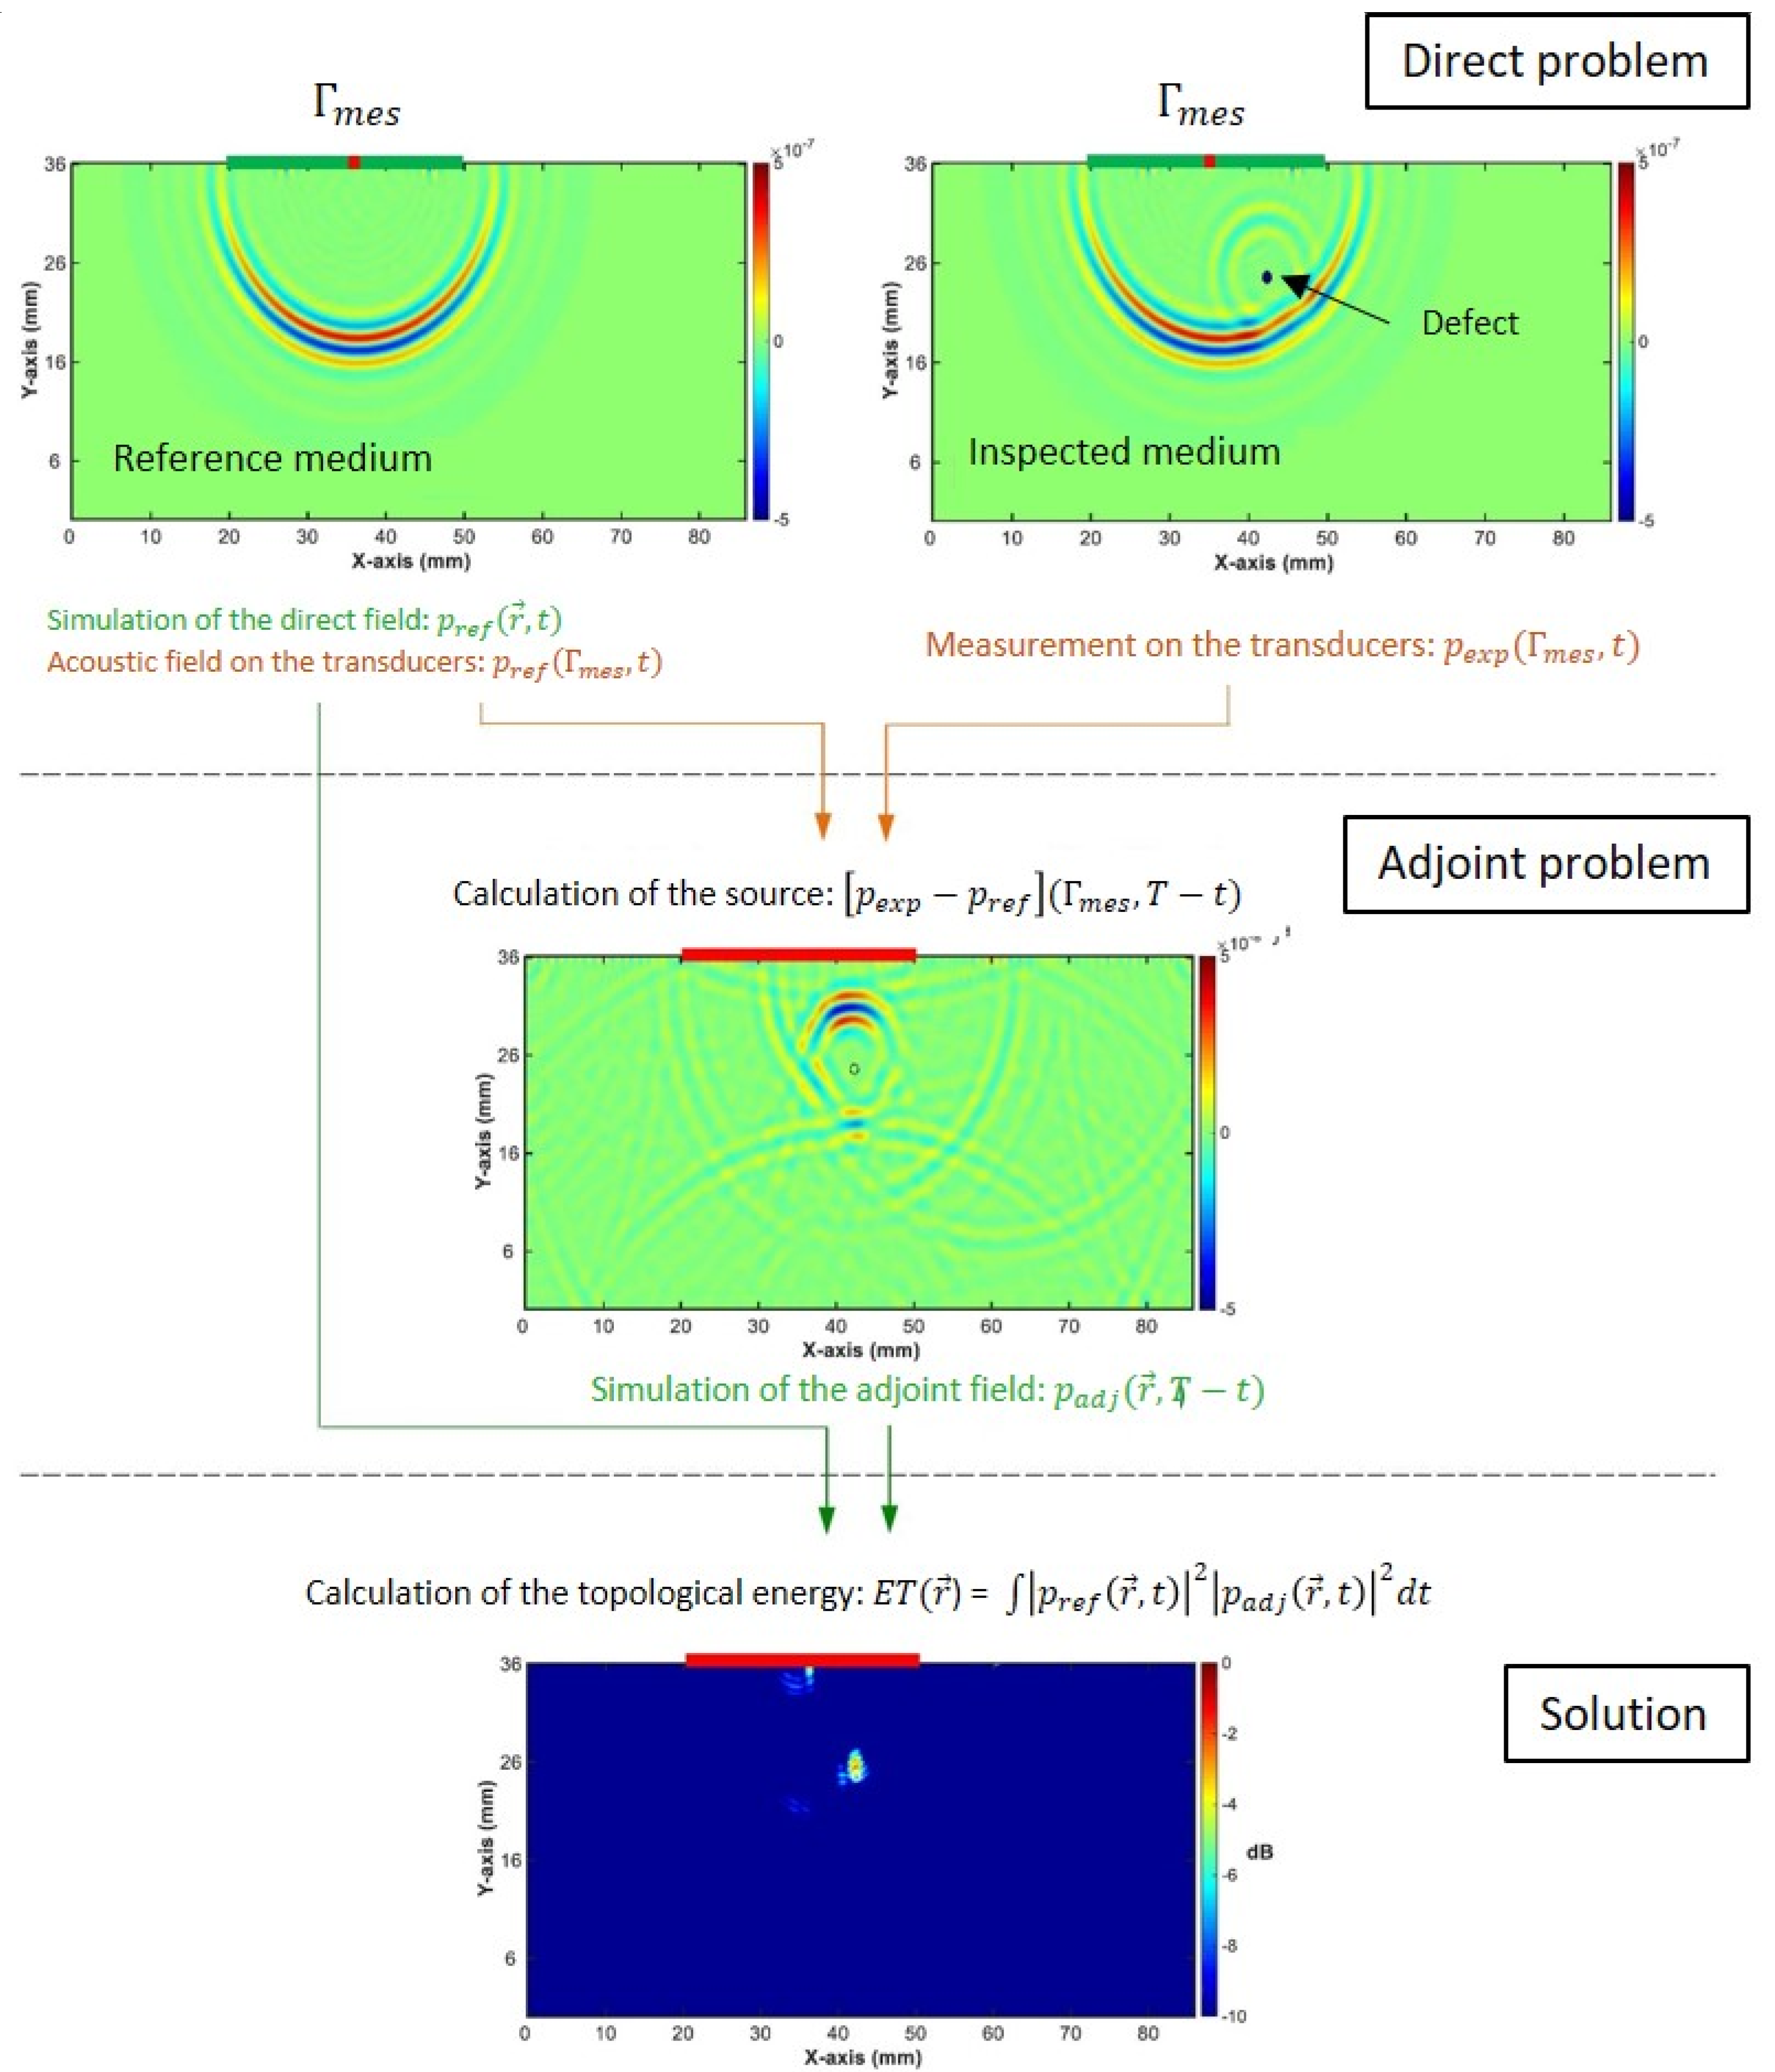
The principle of the method is to minimize a cost function defined as the distance between the two media so that the reference medium, by inserting defects at the right locations, converges to the unknown one. The mathematical proofs are not presented in this paper and can be found in [22,33]. Nevertheless, a summary of the steps needed in the application of the topological energy method to obtain a map of the unknown medium is proposed (Figure 5 illustrates the steps in the application of the topological imaging method in a general case of bulk waves in a homogeneous material):
- Measurement in the experimental unknown medium of the acoustic field on the surface .
- Numerical resolution in the reference medium of the direct problem by emitting the same initial signal. Thus, measurement of the acoustic field in the whole medium, and especially on the surface .
- Numerical resolution in the reference medium of the adjoint problem. The source term of the adjoint problem is defined as the time reversal of the difference between and . The acoustic field is then measured in the whole medium and on the surface .
- Evaluation of the topological gradient defined by the limit conditions of the problem and the material properties, and and that are respectively the solutions of the direct and the adjoint problem.
As said previously, the topological imaging method consists of an optimization; the optimization is iterative and can become very time consuming. A Fast Topological Imaging Method (FTIM) is used in [22,29] to overcome this problem and gives reliable results. Only the first iteration of the algorithm is computed. The result of this method is an image of the medium and is given for each point by:
In this equation, the square of the acoustic fields is used to enhance the high value of the topological energy on the final image.
This Fast Topological Imaging Method is used here.
One can interpret the topological energy as a temporal correlation between two simulated wave fields (direct and adjoint). The direct field corresponds to the propagation of the waves in the undamaged medium. The adjoint problem corresponds to the field induced by the backward propagation of the acoustic signature of the difference between the reference medium and the experimental medium (with defects). The topological energy between those fields takes maximum value at the location of the defects, where the two fields coincide.
3.2. Experimental Setup
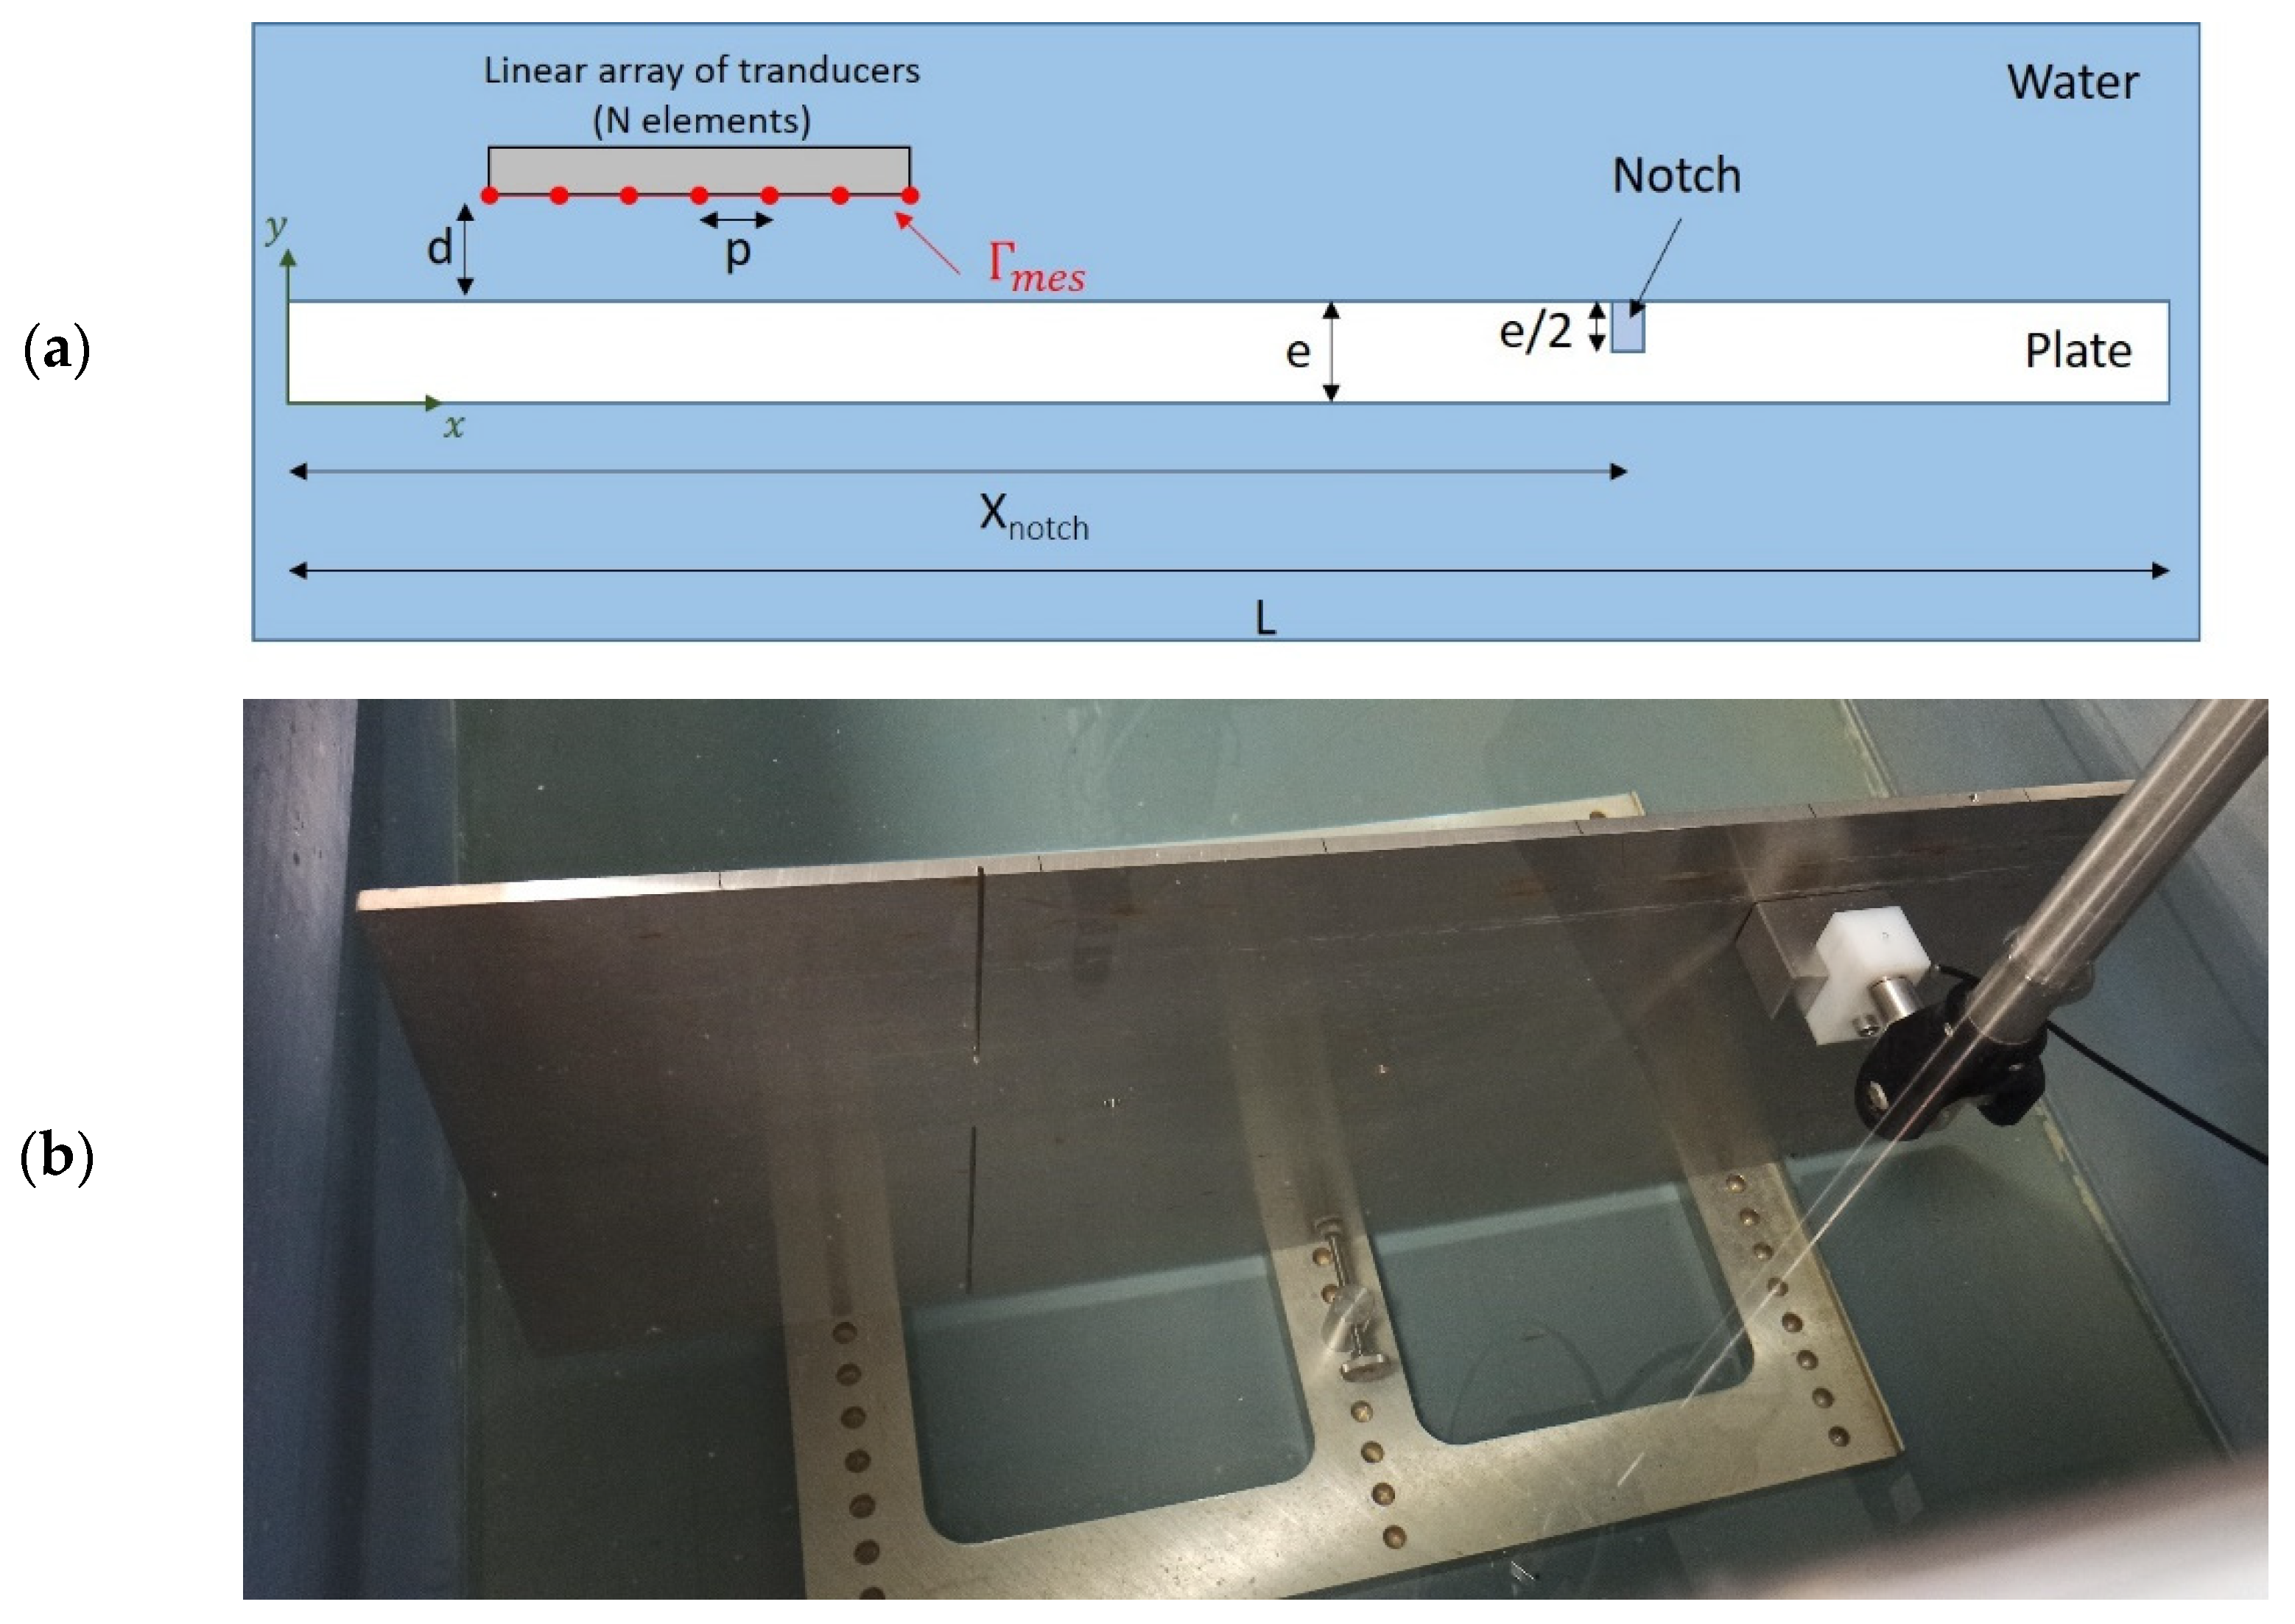
The considered plate is made of stainless steel and is immersed in water (schematic configuration and picture of the experimental setup are represented in Figure 6). Its thickness and length are defined by and . A linear phased array transducer with 16 elements that defines the surface parallel to the plate, is used as a transmitter–receiver sensor. The central frequency is . The pitch of the linear array is .
A delay law is applied to the linear array that imposes the beam angle at the emission, and thus the Lamb wave mode is generated in the plate. The linear array is positioned very close to the plate ( to lower successive reflections between the linear array and the plate that would lead to the generation of multiple Lamb waves in the experience. The topological energy is calculated inside the plate that implies the use of the horizontal or vertical displacements in the calculation of the latter.
In an initial stage, a plate without any defect is studied. The objective is the detection of the edge of the plate at . Then, the application of the method on a second plate containing a notch at is carried out.
The measurements are performed with a Sonaxis® ultrasonic linear array composed of sixteen 1.8 mm wide elements and a Lecoeur® OPEN system. The experimental acquisition and the simulations are done for a beam angle that corresponds to the mode A1. The emitted signal is a ten-period sinus signal filtered by a Hanning window in order to lower the dispersion phenomenon. The mode A1 has been chosen because it presents a low attenuation along the propagation so that it is easily detectable. The linear array transducer is set at 40 cm of the left edge of the plate.
3.3. Finite-Element Simulation
In this section, the finite-element model is exposed—necessary for the implementation of the topological energy method—and developed with Comsol Multiphysics® and the postprocessing techniques in order to analyze the experimental signals.
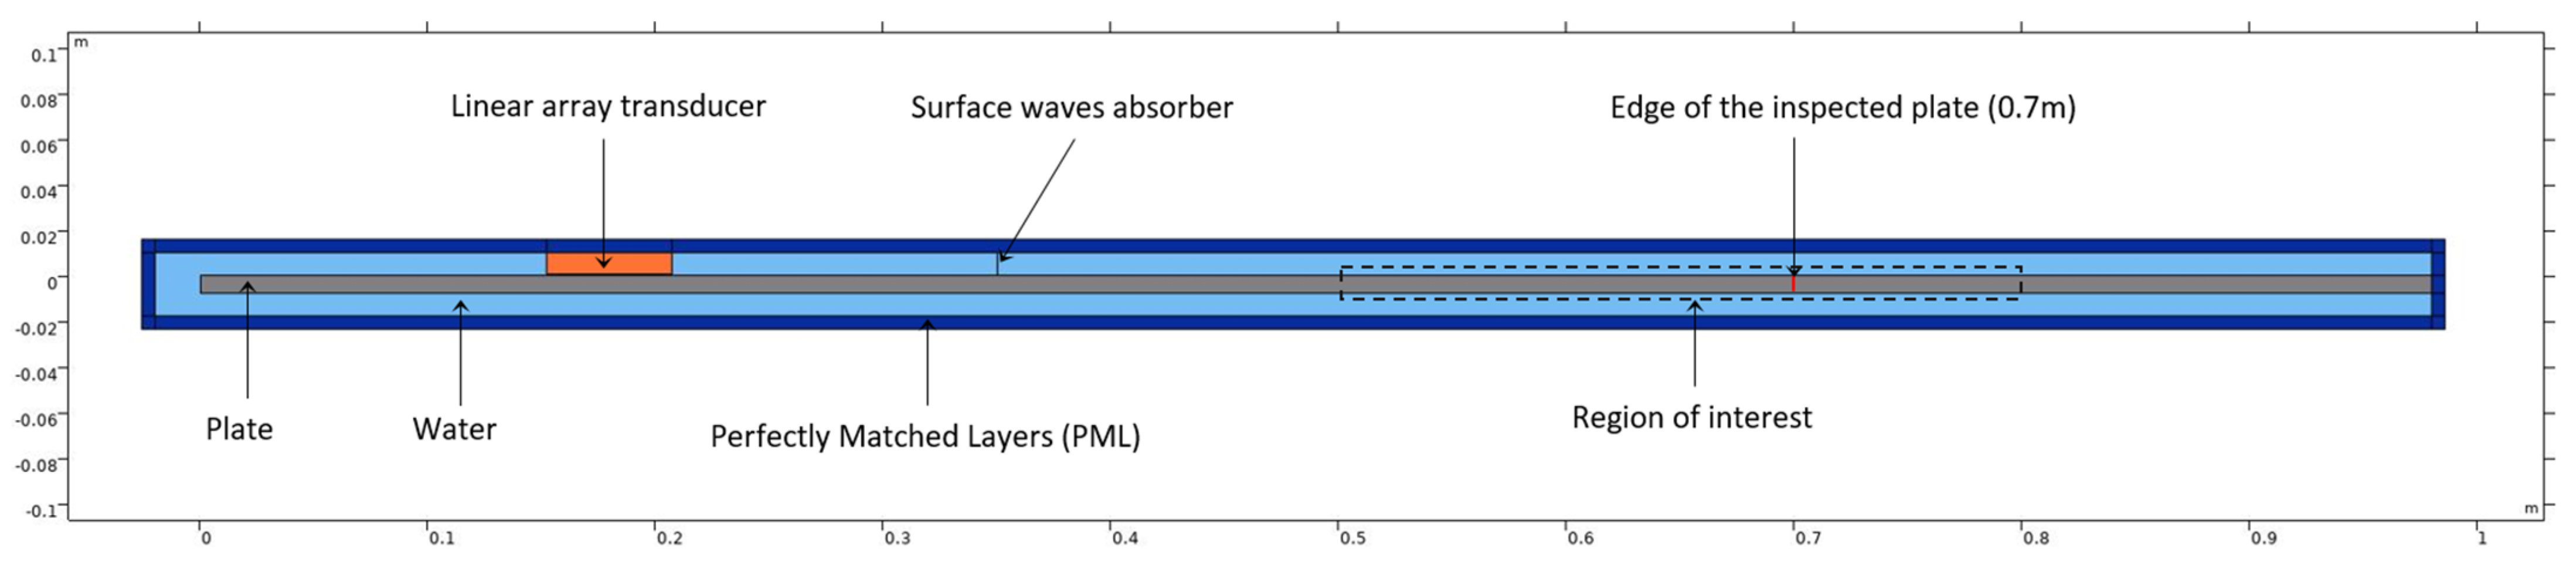
As illustrated in Figure 7, the plate is immersed in the water. Perfectly Matched Layers (PMLs) are set to simulate an infinite domain, especially at the right end of the plate to simulate the flawless infinite plate and around the domain to avoid reflections on the calculation boundaries. In the experimentation, the tank edges are far enough apart to avoid reflected waves in the studied time interval.
Segments that represent each element of the transducer define the linear phased array. This simple definition leads to a surface wave in the water in the numerical model that is not observed in the experimental propagation. That is why a thin absorbent layer in the upper part of the water is introduced to cancel this numerical surface wave.
The mesh is described by triangular elements. The maximum size of the elements is given by in the plate and the water, where represents the smallest wavelength that can exist in the considered bandwidth.
4. Results and Discussion
Two kinds of defects are studied and discussed: the edge of the plate that approximates the behavior of a vertical through-crack and a machined mid-thickness notch. They allow evaluating the methodology in two typical calibrating situations in NDT when searching cracks.
4.1. Edge Plate Detection
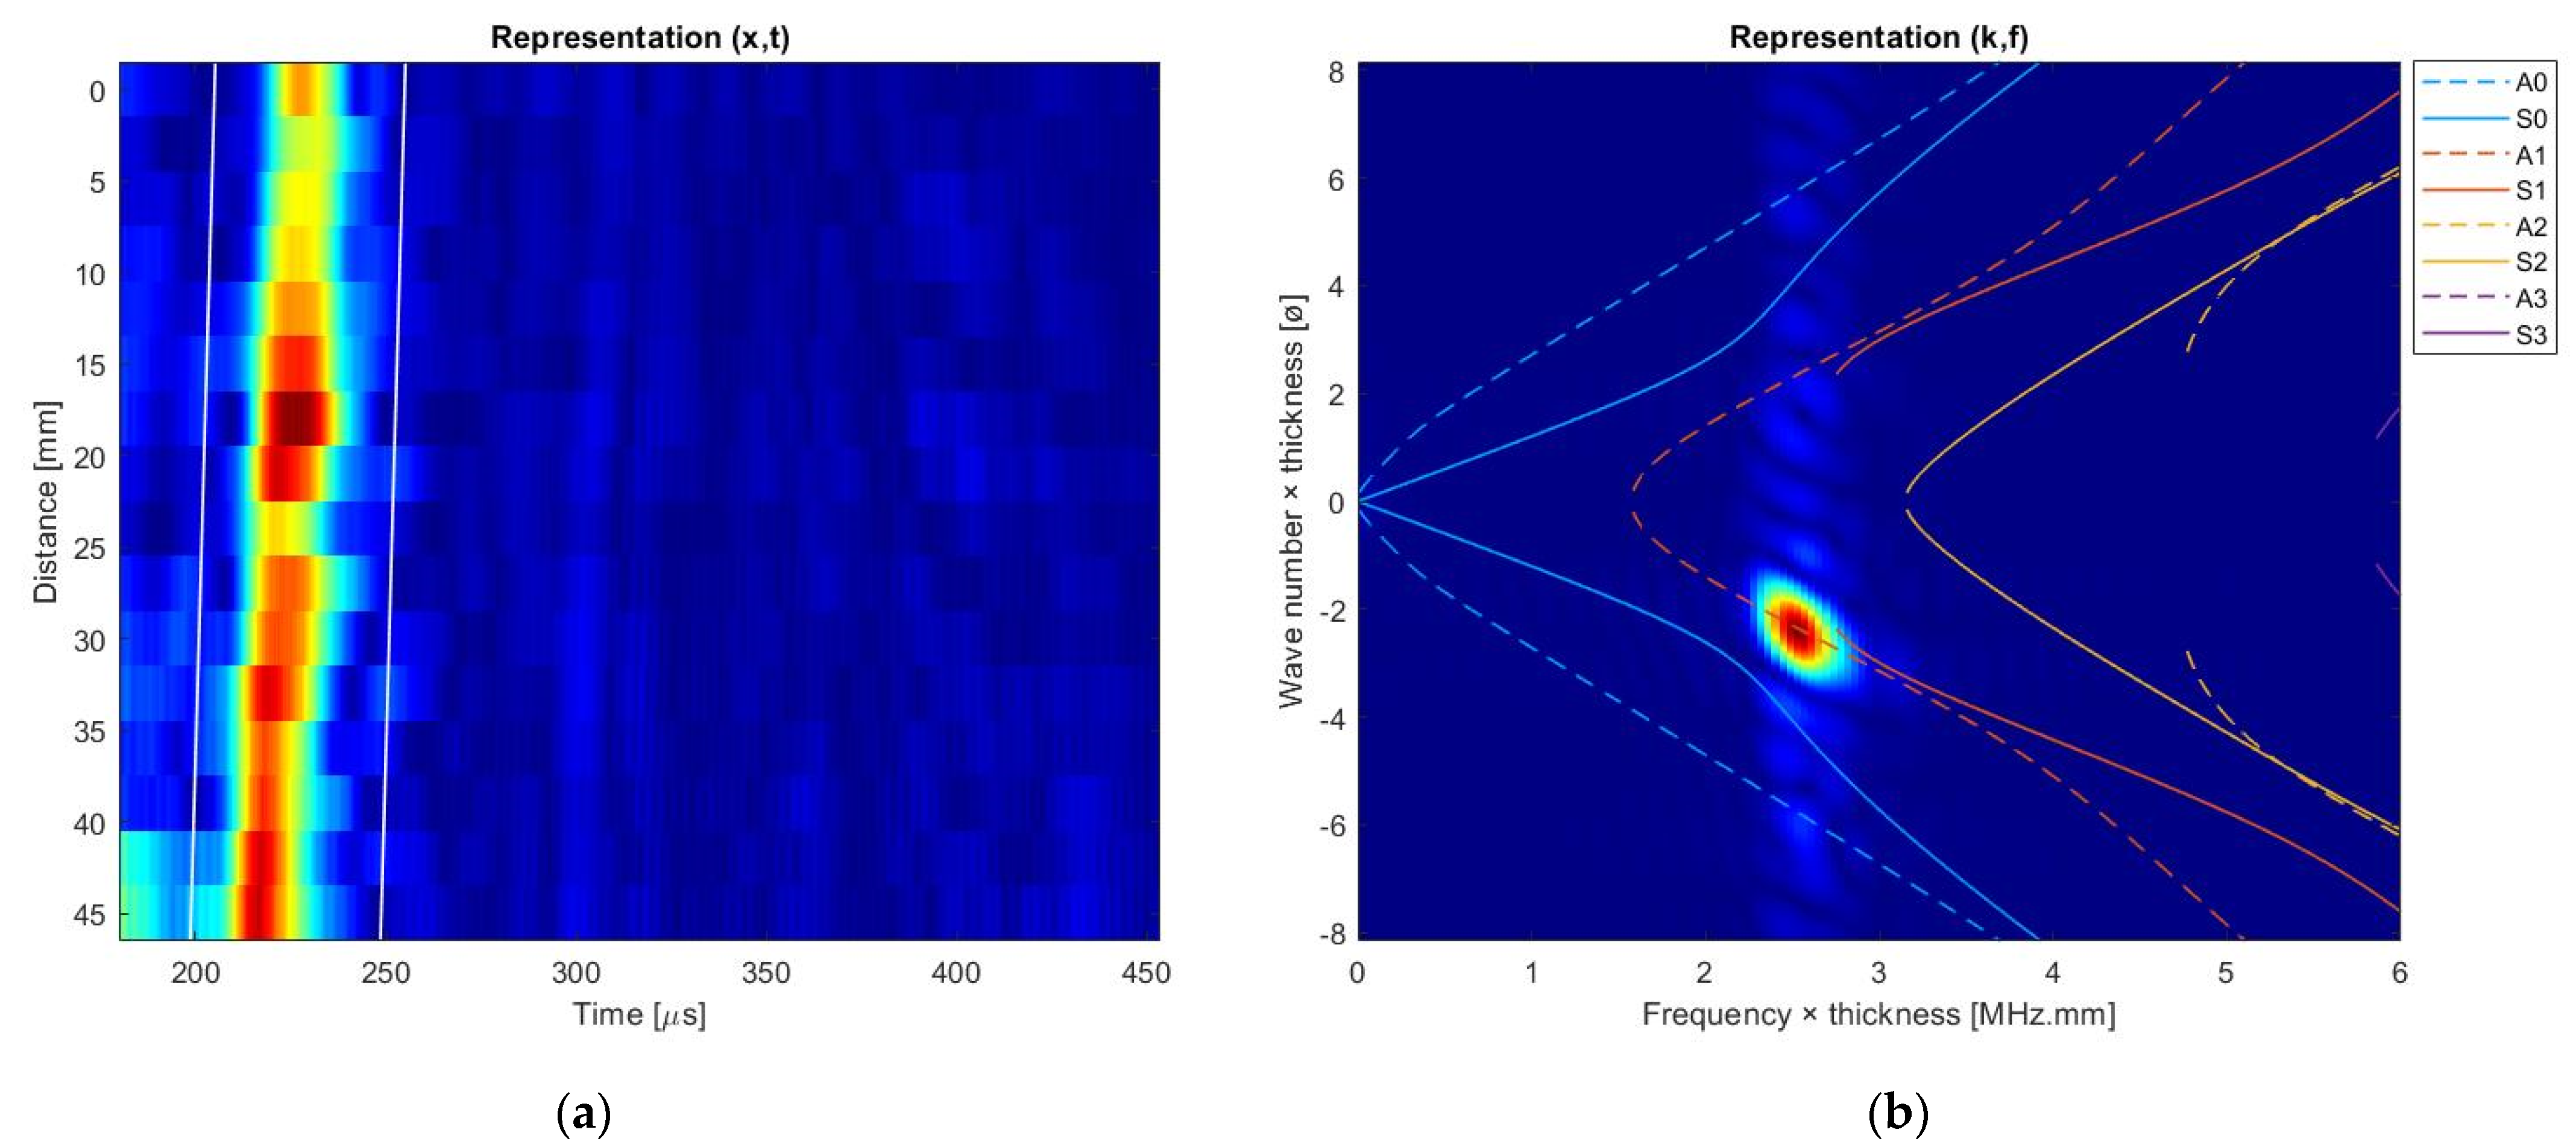
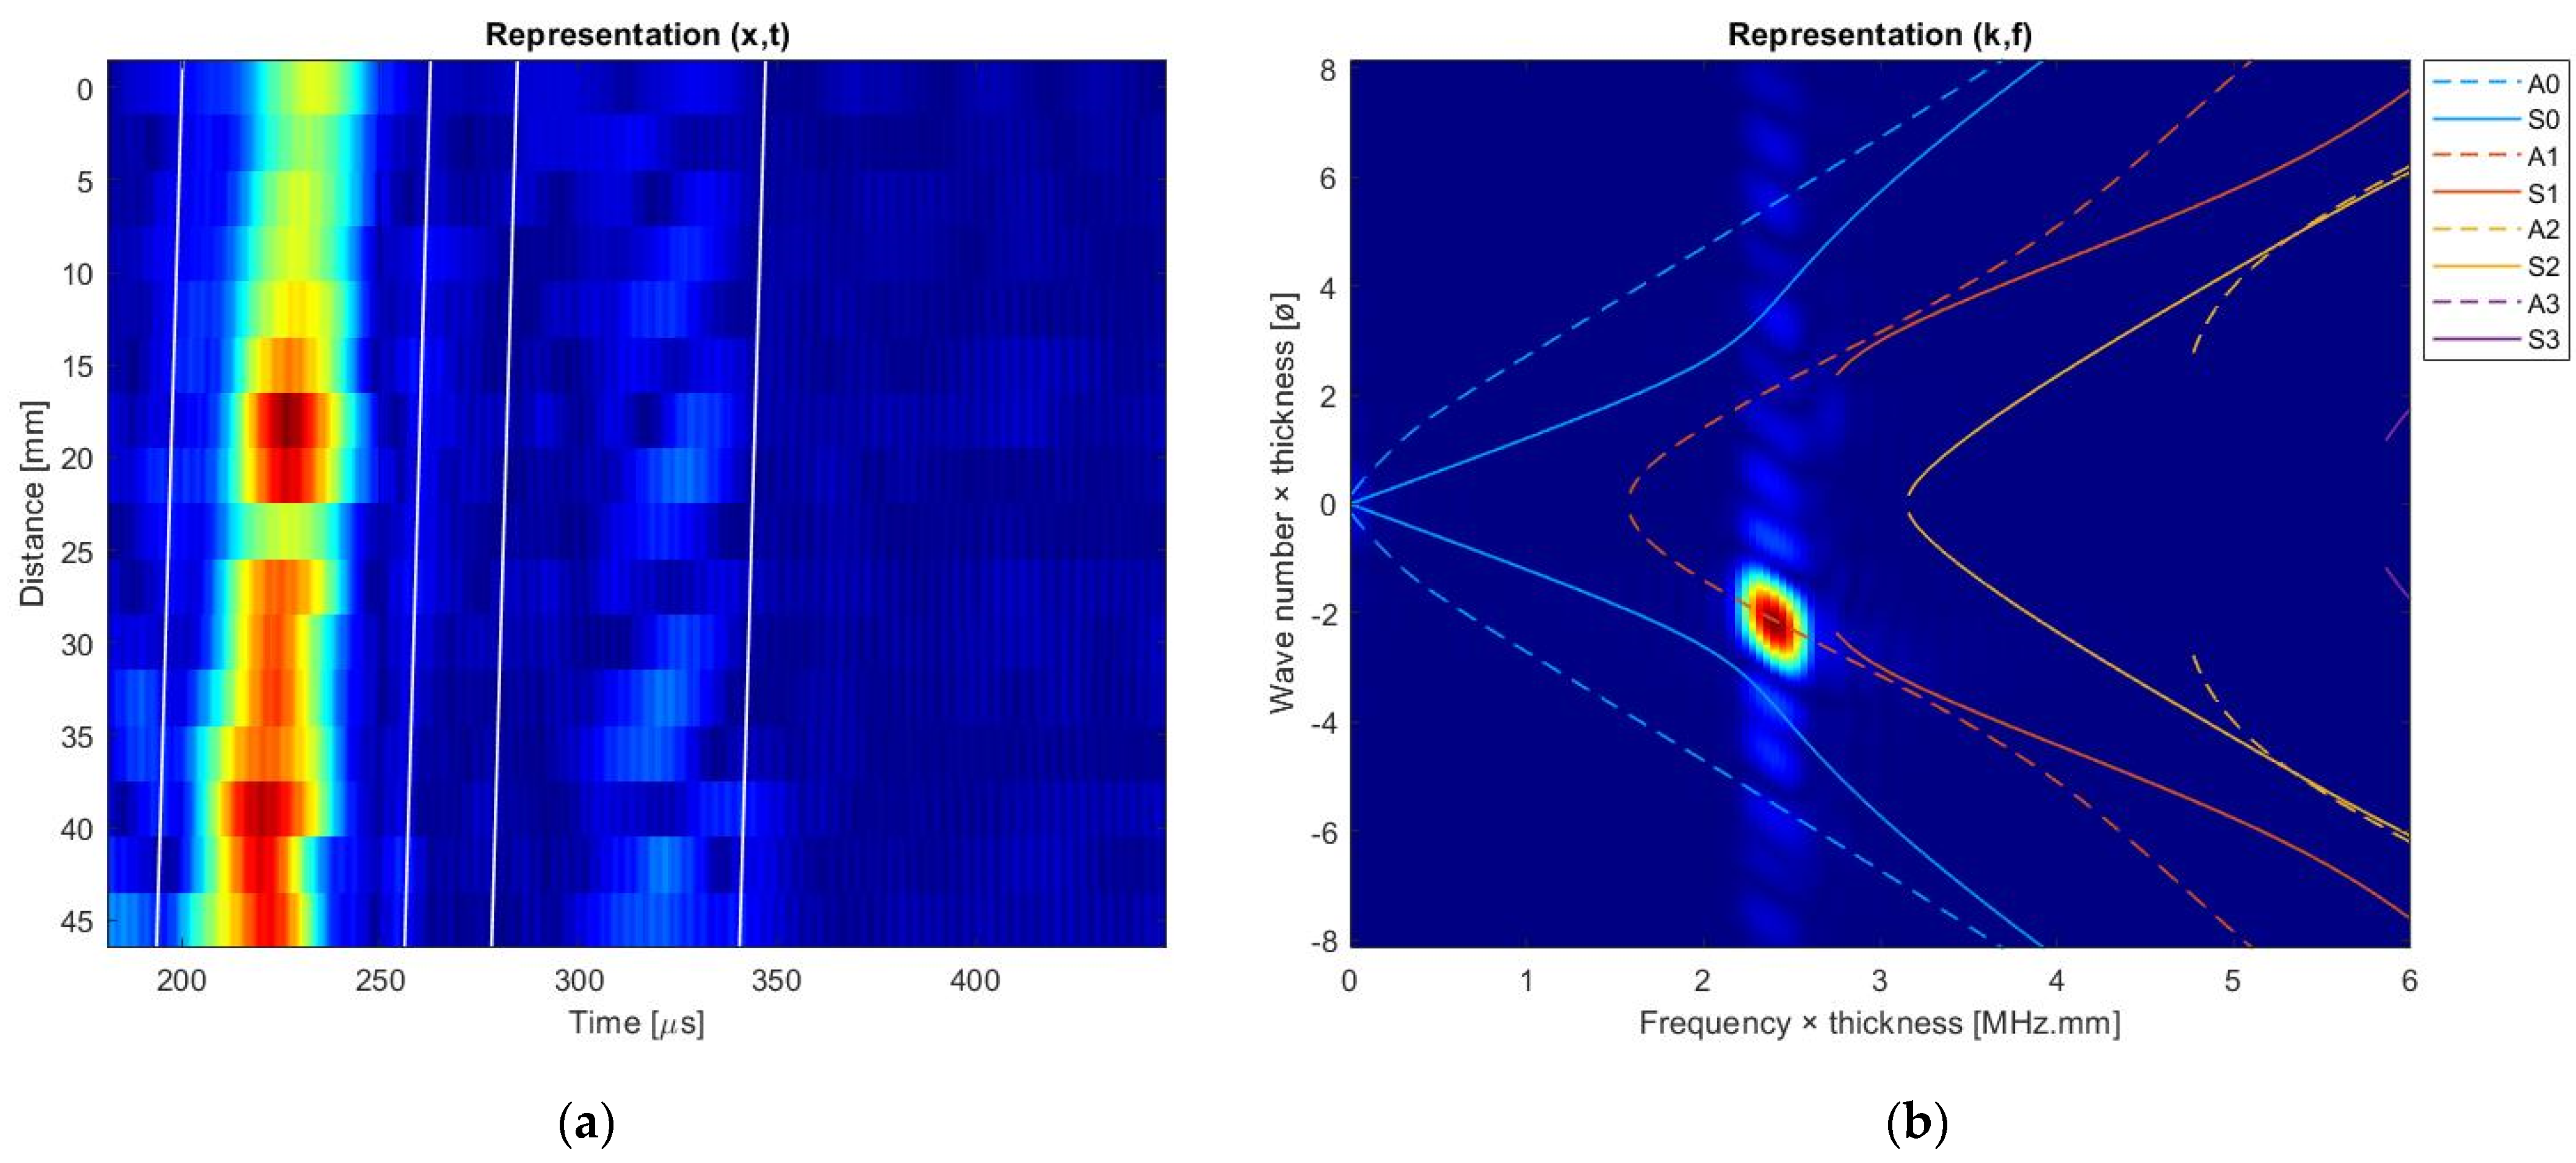
Leaky Lamb waves reflect on the edge of the plate and propagate back toward the transducer. The experimental temporal signals are extracted from each element of the linear array, and each line in Figure 8a is the envelope of the signal acquired on an element. The signals are then processed with 2D Fast Fourier Transform (2D-FFT) to transform the space–time domain into a wavenumber-frequency representation as shown in Figure 8b. This transformation allows measuring the real part of the wavenumber, the leaky attenuation, and the phase velocity of the Lamb wave. Superimposing the theoretical dispersion curves allows verifying the nature of the Lamb wave mode involved in the propagation. The emitted wave packet propagates along the x-axis and is reflected by the right edge of the plate. The wavenumber in Figure 8b is negative because of the propagation of the reflected wave along the decreasing x-axis.
One can verify that the reflected mode corresponds to the initial propagative A1 mode: no conversion has occurred.
The selected wave packet for following the time reversal process is chosen as the more energetic one in the negative wavenumbers that corresponds to a reflective wave. Considering the mode A1 at this product frequency × thickness, the horizontal displacement has more amplitude than the vertical displacements. Thus, the topological energy is calculated using at each point of the plate.
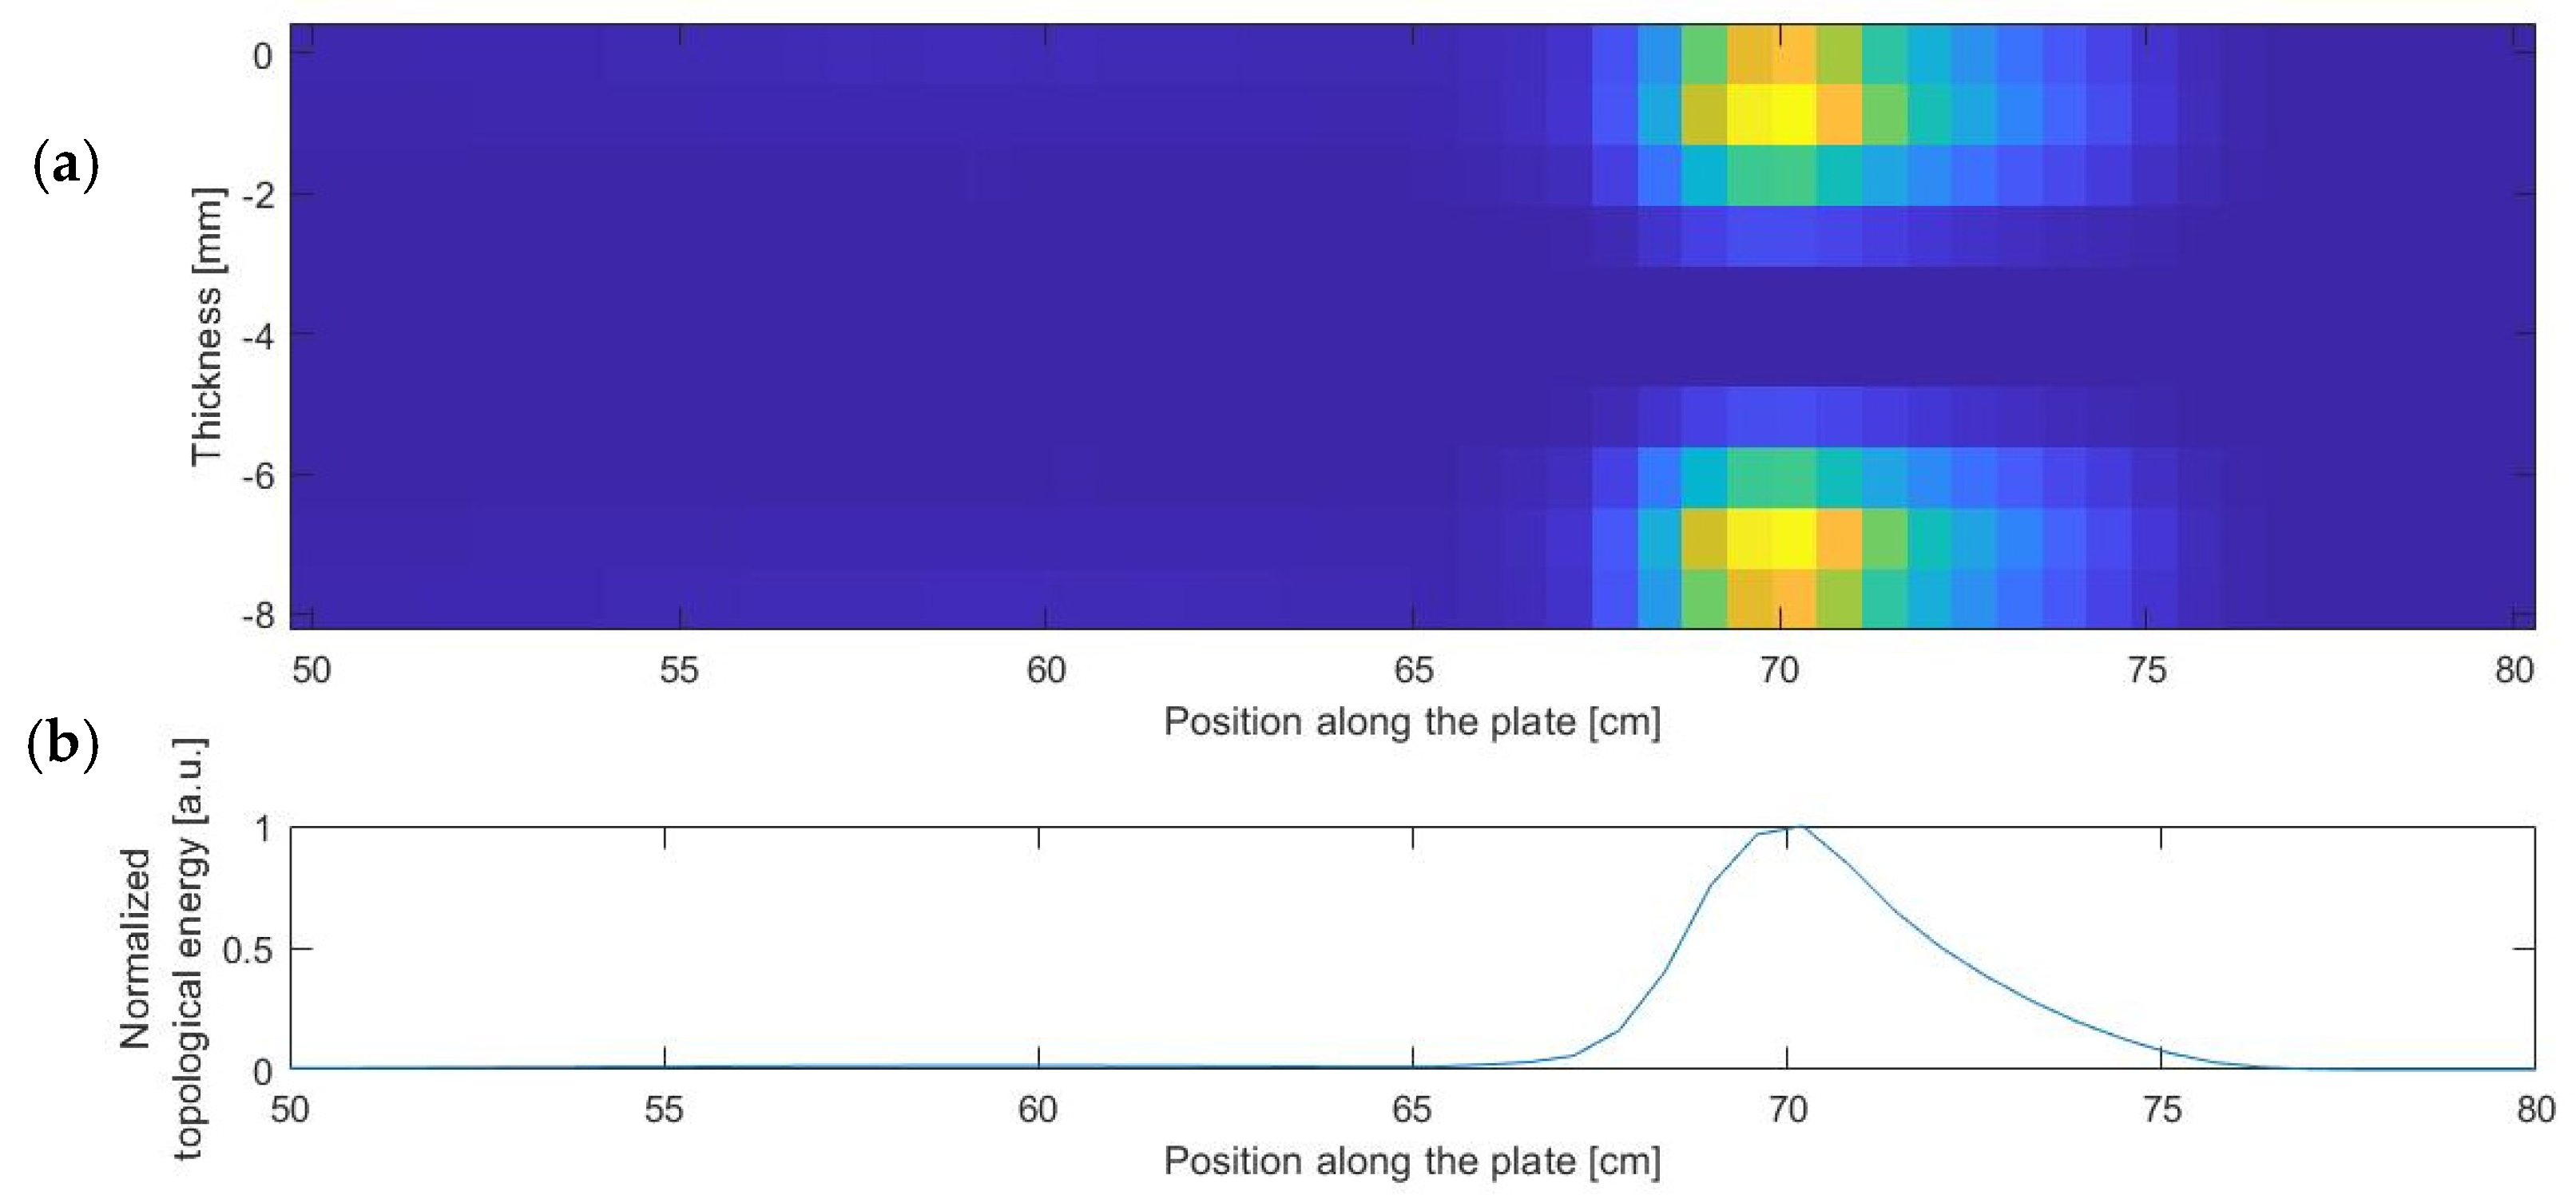
In this particular case, the computation of the source in the adjoint problem is different as described previously in Section 3. One can assume that in the reference medium in the direct problem, the plate is infinite, and there are no reflected waves (. Thus, the calculation of the source of the adjoint problem is straightforward: the wave packet delimited by the white lines in Figure 8a corresponds to the signal that will be time reversed and reinjected in the adjoint problem. The topological energy is then computed using the horizontal displacements in the zone of interest (represented in Figure 6), and the result is plotted in Figure 9. One can note that the distribution of the maximum of topological energy in the thickness of the plate follows the displacement profile of the considered mode.
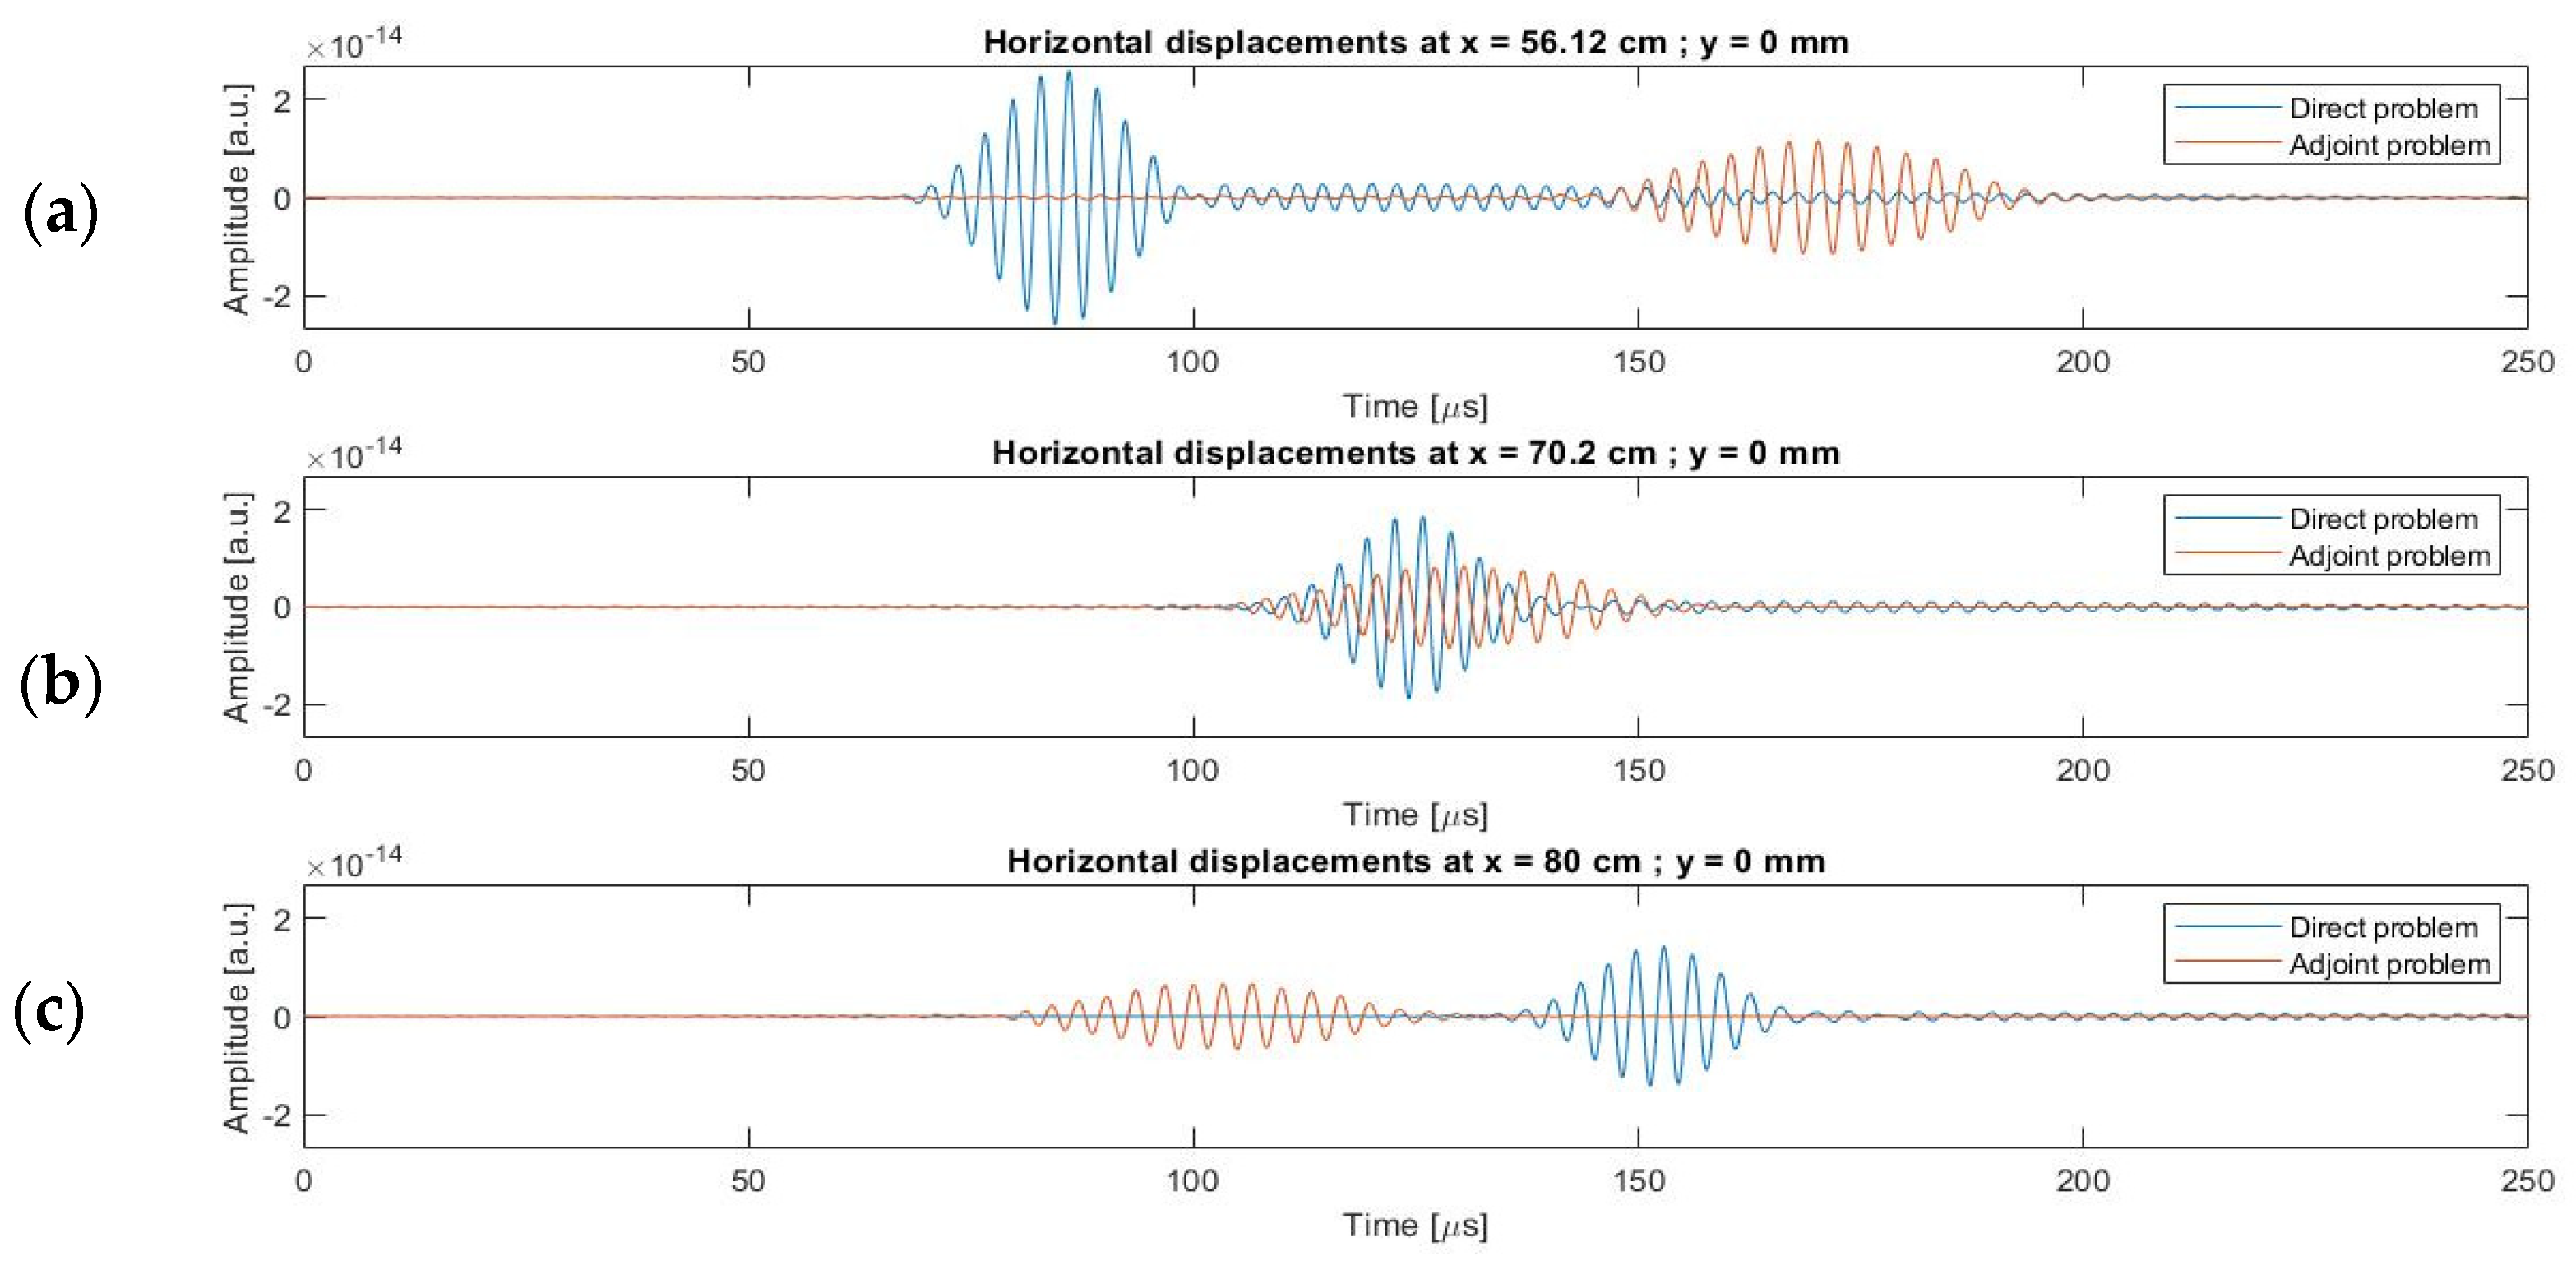
The maximum of the topological energy occurs at . The results are in good agreement with the real location of the edge (. Indeed, the difference with the real location of the edge is under the uncertainty based on the regular grid used in the postprocessing (). At this location, the fields in the direct and the adjoint problems cross and lead to the highest value of the topological energy (Figure 10b). On the contrary, the correlation between the fields before and after the edge is much lower (examples on Figure 10a,c).
One can notice the decrease in the amplitude of the direct problem along the propagation and the increase in the amplitude of the adjoint problem due to the leaky attenuation. To improve the contrast of the topological image, an idea would be to compensate the attenuation knowing the attenuation coefficient of the mode involved. Indeed, such a compensation can only work in a purely monomodal propagation. The compensation cannot be done if at least two modes propagate.
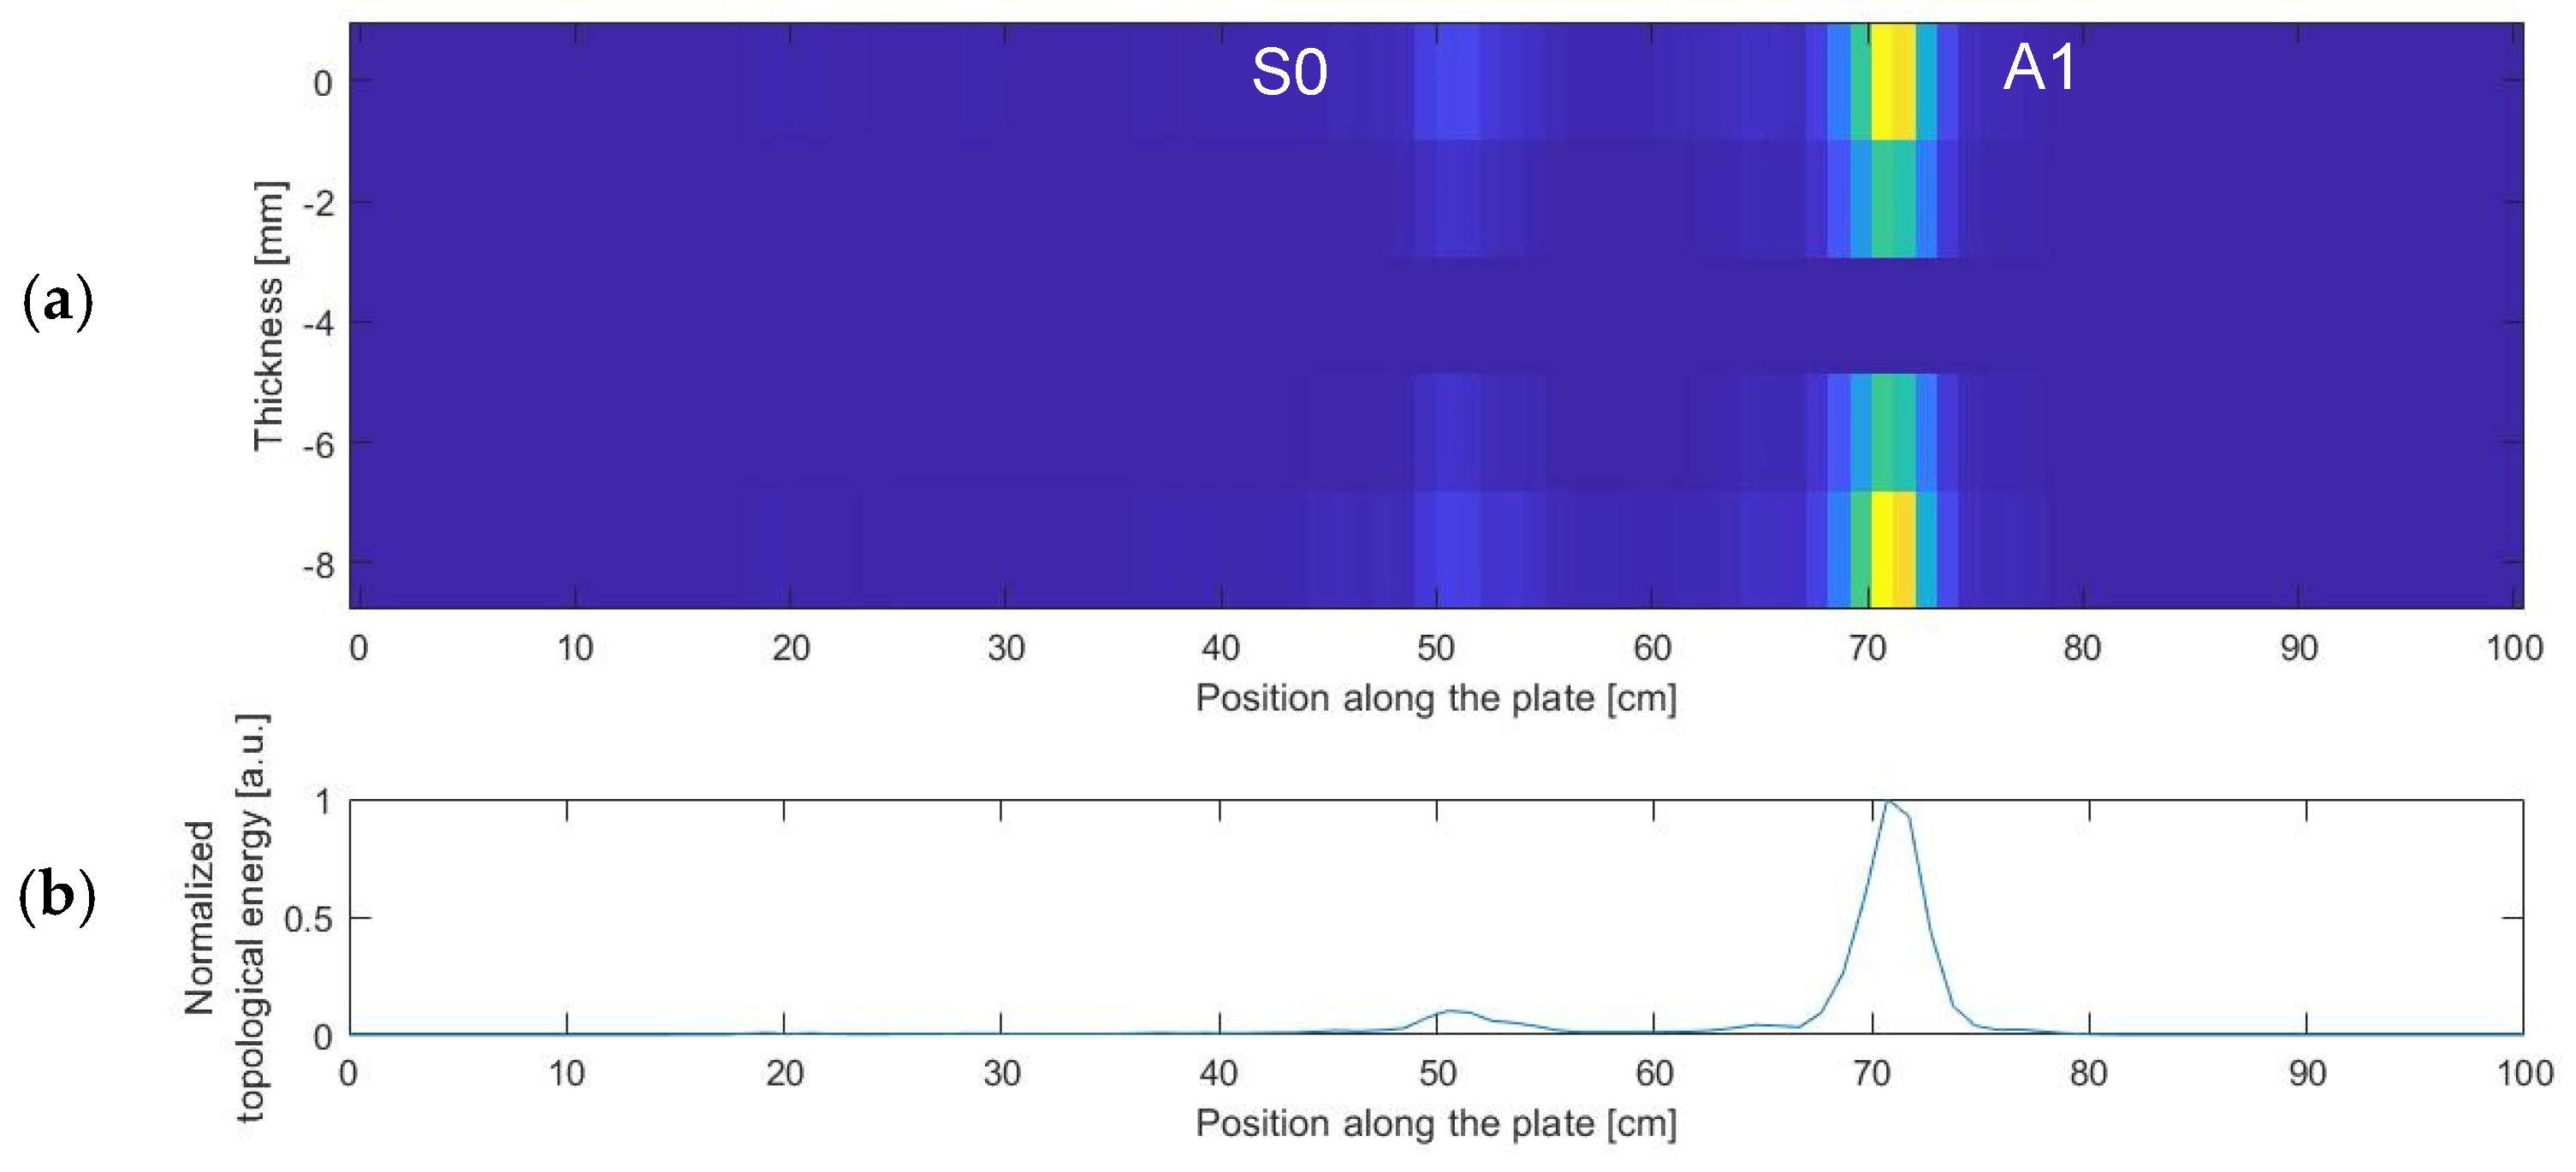
4.2. Notch Detection
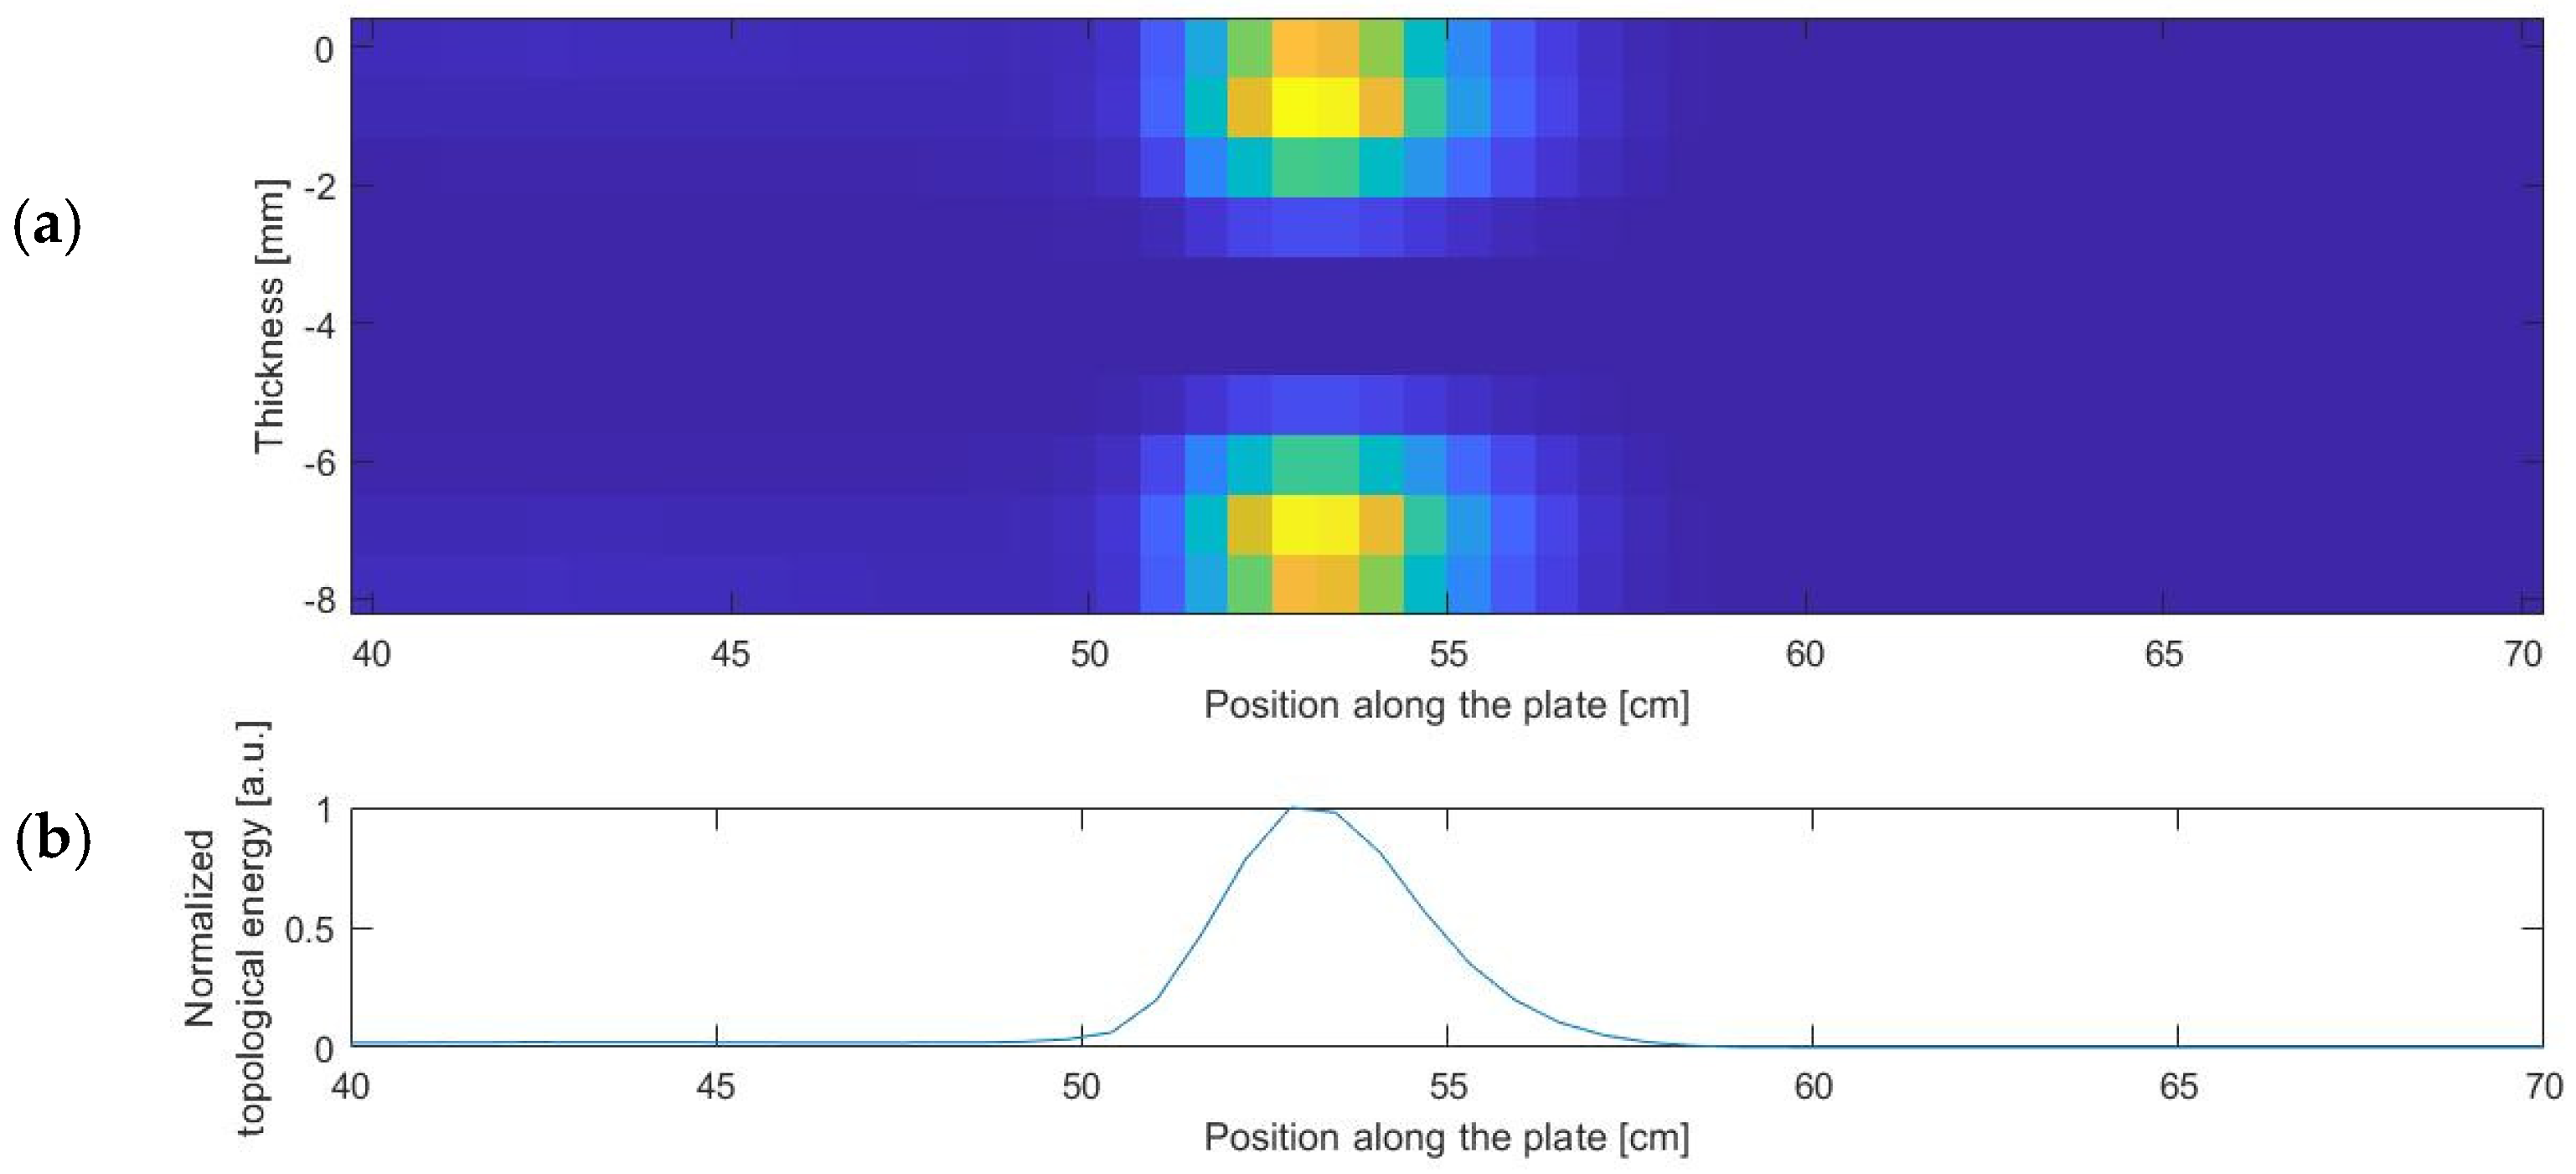
The second studied case is the detection of a notch machined with depth e/2 (see Figure 6) in a plate that has the same physical properties and thickness as previously. The notch is located at cm. The emitted signal is the same as previously. One can observe two wave packets on the spatial time representation on the signals plotted in Figure 11a. The selected wave packet for the time reversal is chosen again as the most energetic one. It corresponds to the reflection on the notch.
The topological energy is computed using the horizontal displacements in the region of interest, and the results are plotted in Figure 12. The maximum of the topological energy occurs at . The error of the location is higher than the uncertainty due to the regular grid (), but the difference remains lower than the wavelength of the mode A1 at , . So, the result is considered acceptable.
The second wave packet shown in Figure 11a can also be time reversed and studied. In this case, the maximum of the topological energy plotted in Figure 13 occurs at and corresponds to the edge of the plate. A local maximum is also present at and is linked to the notch.
One can thus assume that the second wave packet contains information about both defects (notch and edge). Further investigations have shown that two modes coexist: the S0 and A1 modes. The A1 mode comes from the initial A1 mode that reflects on the edge. The S0 mode comes from the mode conversion that takes place at the reflection at the notch.
The results obtained with the A1 mode on the edge and on the notch are reliable. The A1 mode has a low attenuation along the propagation at the studied frequency × thickness (Figure 2). Another mode, S0 or A0, would have leaked in the surrounded fluid before any reflected signal returned on the transducers. Lowly attenuated modes are preferred for a long-range inspection in a single plate. Nevertheless, considering the final aim of the work, that being the research of a defect in the second plate in a set of two parallel and immersed plates, the highly attenuated modes may be considered in order to maximize the energy incident to the second plate. This assumption will be studied in a future work.
The results presented in this paper are in good agreement with the results of Rodriguez et al., which is the most similar work found in the literature in a free isotropic plate [25] and a free anisotropic plate [29]. The locations of the defects are found to be good and accurate. Nevertheless, it has to be pointed out that those studies are not properly comparable. The emitter’s positioning differs, and since the plates in Rodriguez’s studies are free, the Lamb waves do not leak into the surrounding medium.
5. Conclusions and Perspectives
The theory of leaky Lamb waves was discussed in the first part. Dispersive and multimodal behaviors were highlighted by solving the dispersion equations and plotting the duets solution . The selective generation of a Lamb wave mode was explained. Then, the main steps of the topological energy method were outlined. Two problems had to be solved: the direct one and the adjoint one. The time reversal process in the adjoint problem allowed us to overcome the complexity induced by the dispersion and to sustain a good sensibility. To validate the process in a simple case, we performed experimental measurements on a plate without any defects. The detection and the localization of the edge were reached. In this configuration, we could assume that a through-crack has the same effect as the edge and could be detected. Then, measurements were performed on a plate with a machined half-thickness notch. By retropropagating separately the two wave packets acquired, both the notch and the edge were detected and localized. The mode conversion that occurs at the reflection on the notch provides more information than expected. That could lead to the detection and localization of cracks in the plate.
This work shows the applicability of the topological energy method on a single immersed plate. It constitutes the first step of the topological energy method implementation in a set of parallel and immersed plates with the goal of detecting and localizing a defect in the second and then the third plates. The transducers were positioned in the fluid above the upper face of the first plate, and the multiple reflections between the two plates had to be studied. The topological energy method appears to be a reliable method to filter those reflections in the calculation of the source term of the adjoint problem in order to retropropagate only the diffracted signal by the defect in the second plate.
Author Contributions
Methodology, J.-C.V., J.-F.C. and M.-A.P.; software, J.-C.V.; writing—original draft preparation, J.-C.V.; writing—review and editing, all authors; supervision, J.-F.C. and M.-A.P. project administration, F.B. and M.C. All authors have read and agreed to the published version of the manuscript.
Funding
This research received no external funding.
Institutional Review Board Statement
Not applicable.
Informed Consent Statement
Not applicable.
Acknowledgments
This work was developed within the framework of the MISTRAL joint research laboratory between Aix-Marseille University, CNRS, Centrale Marseille and CEA.
Conflicts of Interest
The authors declare no conflict of interest.
References
- Kauffmann, P.; Ploix, M.-A.; Chaix, J.-F.; Potel, C.; Gueudre, C.; Corneloup, G.; Baque, F. Multi-Modal Leaky Lamb Waves in Two Parallel and Immersed Plates: Theoretical Considerations, Simulations, and Measurements. J. Acoust. Soc. Am. 2019, 145, 1018–1030. [Google Scholar] [CrossRef] [PubMed] [Green Version]
- Kauffmann, P. Étude de la propagation, réémission et transmission des ondes de Lamb en vue du Contrôle Non Destructif de structures de réacteurs nucléaires immergées en sodium liquide. Ph.D. Thesis, Aix-Marseille Université, Marseille, France, 2018. [Google Scholar]
- Kirrmann, P. On the Completeness of Lamb Modes. J. Elast. 1994, 37, 39–69. [Google Scholar] [CrossRef]
- Lamb, H. On Waves in an Elastic Plate. Proc. R. Soc. Lond. A Math. Phys. Eng. Sci. 1917, 93, 114–128. [Google Scholar] [CrossRef] [Green Version]
- Merkulov, L.G. Damping of Normal Modes in a Plate Immersed in a Liquid. Sov. Phys. Acoust. 1964, 10, 169–173. [Google Scholar]
- Viktorov, I.A. Rayleigh and Lamb Waves: Physical Theory and Applications; Softcover Reprint of the Original 1st ed. 1967 edition; Springer: Berlin/Heidelberg, Germany, 2013; ISBN 978-1-4899-5683-5. [Google Scholar]
- Cawley, P.; Alleyne, D. The Use of Lamb Waves for the Long Range Inspection of Large Structures. Ultrasonics 1996, 34, 287–290. [Google Scholar] [CrossRef]
- Carboni, M.; Gianneo, A.; Giglio, M. A Lamb Waves Based Statistical Approach to Structural Health Monitoring of Carbon Fibre Reinforced Polymer Composites. Ultrasonics 2015, 60, 51–64. [Google Scholar] [CrossRef]
- Alleyne, D.; Cawley, P. Optimization of Lamb Wave Inspection Techniques. NDT E Int. 1992, 25, 11–22. [Google Scholar] [CrossRef]
- Wilcox, P.D.; Lowe, M.J.S.; Cawley, P. Mode and Transducer Selection for Long Range Lamb Wave Inspection. J. Intell. Mater. Syst. Struct. 2001, 12, 553–565. [Google Scholar] [CrossRef]
- Jensen, J.A.; Nikolov, S.I.; Gammelmark, K.L.; Pedersen, M.H. Synthetic Aperture Ultrasound Imaging. Ultrasonics 2006, 44, e5–e15. [Google Scholar] [CrossRef]
- Schickert, M.; Krause, M.; Müller, W. Ultrasonic Imaging of Concrete Elements Using Reconstruction by Synthetic Aperture Focusing Technique. J. Mater. Civ. Eng. 2003, 15, 235–246. [Google Scholar] [CrossRef]
- Schmitz, V.; MÜller, W. Synthetic Aperture Focusing Technique for Industrial Applications. In Acoustical Imaging; Arnold, W., Hirsekorn, S., Eds.; Acoustical Imaging; Springer: Dordrecht, The Netherlands, 2004; Volume 27, pp. 57–68. ISBN 978-90-481-6652-7. [Google Scholar]
- Muller, A.; Robertson-Welsh, B.; Gaydecki, P.; Gresil, M.; Soutis, C. Structural Health Monitoring Using Lamb Wave Reflections and Total Focusing Method for Image Reconstruction. Appl. Compos. Mater. 2017, 24, 553–573. [Google Scholar] [CrossRef]
- Holmes, C.; Drinkwater, B.W.; Wilcox, P.D. Post-Processing of the Full Matrix of Ultrasonic Transmit–Receive Array Data for Non-Destructive Evaluation. NDT E Int. 2005, 38, 701–711. [Google Scholar] [CrossRef]
- Sicard, R.; Goyette, J.; Zellouf, D. A Numerical Dispersion Compensation Technique for Time Recompression of Lamb Wave Signals. Ultrasonics 2002, 40, 727–732. [Google Scholar] [CrossRef]
- Zhang, H.; Liu, Y.; Fan, G.; Zhang, H.; Zhu, W.; Zhu, Q. Sparse-TFM Imaging of Lamb Waves for the Near-Distance Defects in Plate-Like Structures. Metals 2019, 9, 503. [Google Scholar] [CrossRef] [Green Version]
- Alkassar, Y. Simulation of Lamb Wave Modes Conversions in a Thin Plate for Damage Detection. Procedia Eng. 2017, 173, 948–955. [Google Scholar] [CrossRef]
- Castaings, M.; Le Clezio, E.; Hosten, B. Modal Decomposition Method for Modeling the Interaction of Lamb Waves with Cracks. J. Acoust. Soc. Am. 2002, 112, 2567–2582. [Google Scholar] [CrossRef]
- Chakroun, N.; Fink, M.A.; Wu, F. Time Reversal Processing in Ultrasonic Nondestructive Testing. IEEE Trans. Ultrason. Ferroelect. Freq. Contr. 1995, 42, 1087–1098. [Google Scholar] [CrossRef]
- Prada, C.; Wu, F.; Fink, M. The Iterative Time Reversal Mirror: A Solution to Self-focusing in the Pulse Echo Mode. J. Acoust. Soc. Am. 1991, 90, 1119–1129. [Google Scholar] [CrossRef]
- Dominguez, N.; Gibiat, V.; Esquerre, Y. Time Domain Topological Gradient and Time Reversal Analogy: An Inverse Method for Ultrasonic Target Detection. Wave Motion 2005, 42, 31–52. [Google Scholar] [CrossRef]
- Minonzio, J.-G.; Prada, C.; Chambers, D.; Clorennec, D.; Fink, M. Characterization of Subwavelength Elastic Cylinders with the Decomposition of the Time-Reversal Operator: Theory and Experiment. J. Acoust. Soc. Am. 2005, 117, 789–798. [Google Scholar] [CrossRef]
- Rodriguez, S.; Sahuguet, P.; Gibiat, V.; Jacob, X. Fast Topological Imaging. Ultrasonics 2012, 52, 1010–1018. [Google Scholar] [CrossRef]
- Rodriguez, S.; Deschamps, M.; Castaings, M.; Ducasse, E. Guided Wave Topological Imaging of Isotropic Plates. Ultrasonics 2014, 54, 1880–1890. [Google Scholar] [CrossRef]
- Dominguez, N.; Gibiat, V. Non-Destructive Imaging Using the Time Domain Topological Energy Method. Ultrasonics 2010, 50, 367–372. [Google Scholar] [CrossRef]
- Sun, L.-J.; Zhu, W.-F.; Shao, W.; Zheng, S.-B.; Fan, G.-P.; Zhang, H.; Li, Z.-W. Using Lamb Wave TDTE Method to Realize Ultrasonic Array Super-Resolution Imaging of Multiple Asymmetric Defects. Sens. Actuators A Phys. 2021, 332, 113102. [Google Scholar] [CrossRef]
- Zhu, W.-F.; Shao, W.; Peng, L.-L.; Fan, G.-P.; Chen, X.-J.; Zheng, S.-B.; Zhang, H.-Y. Time-Domain Topological Energy Imaging Method of Concrete Cavity Defect by Lamb Wave. Shock Vib. 2019, 2019, 6294603. [Google Scholar] [CrossRef] [Green Version]
- Rodriguez, S.; Castaings, M.; Deschamps, M.; DUCASSE, E. Topological Imaging of Defects in Anisotropic Plates. In EWSHM—7th European Workshop on Structural Health Monitoring; Le Cam, V., Mevel, L., Schoefs, F., Eds.; IFFSTTAR, Inria, Université de Nantes: Nantes, France, 2014. [Google Scholar]
- Schmitt, M.; Schmidt, K.; Olfert, S.; Rautenberg, J.; Lindner, G.; Henning, B.; Reindl, L.M. Detection of Coatings within Liquid-Filled Tubes and Containers by Mode Conversion of Leaky Lamb Waves. J. Sens. Sens. Syst. 2013, 2, 73–84. [Google Scholar] [CrossRef] [Green Version]
- Bertoni, H.L.; Tamir, T. Unified Theory of Rayleigh-Angle Phenomena for Acoustic Beams at Liquid-Solid Interfaces. Appl. Phys. 1973, 2, 157–172. [Google Scholar] [CrossRef]
- Ngoc, T.D.K.; Mayer, W.G. A General Description of Ultrasonic Nonspecular Reflection and Transmission Effects for Layered Media. IEEE Trans. Sonics Ultrason. 1980, 27, 229–235. [Google Scholar] [CrossRef]
- Garreau, S.; Guillaume, P.; Masmoudi, M. The Topological Asymptotic for PDE Systems: The Elasticity Case. SIAM J. Control Optim. 2001, 39, 1756–1778. [Google Scholar] [CrossRef]
- Lubeigt, E. Imagerie Topologique de Domaines Élastiques Bornés: Application Au Contrôle Non Destructif Des Soudures. Ph.D. Thesis, Aix-Marseille Université, Marseille, France, 2017. [Google Scholar]
Figure 1.
Generation of a compressional wave in the liquid by a leaky Lamb wave in the plate [30].
Figure 1.
Generation of a compressional wave in the liquid by a leaky Lamb wave in the plate [30].

Figure 2.
(a) Wave number of leaky Lamb waves normalized by the plate thickness; (b) Attenuation of leaky Lamb waves, as a function of the product frequency × thickness.
Figure 2.
(a) Wave number of leaky Lamb waves normalized by the plate thickness; (b) Attenuation of leaky Lamb waves, as a function of the product frequency × thickness.

Figure 3.
(a) Phase velocity of leaky Lamb waves; (b) Group velocity of leaky Lamb waves, as a function of the product frequency × thickness. Arrow indicates the bandwidth of a real signal and highlights the dispersion phenomenon in the propagation of the Lamb waves.
Figure 3.
(a) Phase velocity of leaky Lamb waves; (b) Group velocity of leaky Lamb waves, as a function of the product frequency × thickness. Arrow indicates the bandwidth of a real signal and highlights the dispersion phenomenon in the propagation of the Lamb waves.

Figure 4.
Beam incidence angle needed to generate Lamb modes in an immersed plate.

Figure 5.
Diagram of the general principle of the topological imaging method in an isotropic medium [34]. Reproduced with permission from E. Lubeigt.
Figure 5.
Diagram of the general principle of the topological imaging method in an isotropic medium [34]. Reproduced with permission from E. Lubeigt.

Figure 6.
(a) Geometry of the experimental setup; (b) Experimental setup.

Figure 7.
Sketch of the simulation under COMSOL Multiphysics®.

Figure 8.
(a) Envelope of the experimental signals recorded by each element of the linear array—(x,t) representation; (b) 2D-FFT of the signals marked by the white lines—(k,f) representation.
Figure 8.
(a) Envelope of the experimental signals recorded by each element of the linear array—(x,t) representation; (b) 2D-FFT of the signals marked by the white lines—(k,f) representation.

Figure 9.
(a) Topological image in the zone of interest of the simulated plate; (b) Normalized sum of the topological energy at each position along the plate.
Figure 9.
(a) Topological image in the zone of interest of the simulated plate; (b) Normalized sum of the topological energy at each position along the plate.

Figure 10.
Horizontal displacements of the direct and adjoint problems at (a) cm; cm; (b) cm; cm; and (c) cm; cm.
Figure 10.
Horizontal displacements of the direct and adjoint problems at (a) cm; cm; (b) cm; cm; and (c) cm; cm.

Figure 11.
(a) Envelope of the signals recorded by each element of the linear array—(x,t) representation; (b) 2D-FFT of the first wave packet—(k,f) representation.
Figure 11.
(a) Envelope of the signals recorded by each element of the linear array—(x,t) representation; (b) 2D-FFT of the first wave packet—(k,f) representation.

Figure 12.
(a) Topological image in the region of interest of the simulated plate. (b) Normalized sum of the topological energy at each position along the plate.
Figure 12.
(a) Topological image in the region of interest of the simulated plate. (b) Normalized sum of the topological energy at each position along the plate.

Figure 13.
(a) Topological image in the region of interest of the simulated plate; (b) Normalized sum of the topological energy at each position along the plate.
Figure 13.
(a) Topological image in the region of interest of the simulated plate; (b) Normalized sum of the topological energy at each position along the plate.

Publisher’s Note: MDPI stays neutral with regard to jurisdictional claims in published maps and institutional affiliations. |
© 2021 by the authors. Licensee MDPI, Basel, Switzerland. This article is an open access article distributed under the terms and conditions of the Creative Commons Attribution (CC BY) license (https://creativecommons.org/licenses/by/4.0/).
Share and Cite
MDPI and ACS Style
Vallée, J.-C.; Ploix, M.-A.; Baqué, F.; Cavaro, M.; Chaix, J.-F. Edge and Notch Detection in a Plate Using Time Reversal Process of Leaky Lamb Waves. Appl. Sci. 2022, 12, 228. https://doi.org/10.3390/app12010228
AMA Style
Vallée J-C, Ploix M-A, Baqué F, Cavaro M, Chaix J-F. Edge and Notch Detection in a Plate Using Time Reversal Process of Leaky Lamb Waves. Applied Sciences. 2022; 12(1):228. https://doi.org/10.3390/app12010228
Chicago/Turabian StyleVallée, Jean-Christophe, Marie-Aude Ploix, François Baqué, Matthieu Cavaro, and Jean-François Chaix. 2022. "Edge and Notch Detection in a Plate Using Time Reversal Process of Leaky Lamb Waves" Applied Sciences 12, no. 1: 228. https://doi.org/10.3390/app12010228
Note that from the first issue of 2016, this journal uses article numbers instead of page numbers. See further details here.