
ZFTool: A Software for Automatic Quantification of Cancer Cell Mass Evolution in Zebrafish
by
 , , and
María J. Carreira
1,2,3,* ,
,
Nicolás Vila-Blanco
1,3,
Pablo Cabezas-Sainz
3,4 and
Laura Sánchez
3,4 1
Centro Singular de Investigación en Tecnoloxías Intelixentes (CiTIUS), Universidade de Santiago de Compostela, 15782 Santiago de Compostela, Spain
2
Departamento de Electrónica e Computación, Universidade de Santiago de Compostela, 15782 Santiago de Compostela, Spain
3
Instituto de Investigación Sanitaria de Santiago de Compostela (IDIS), 15706 Santiago de Compostela, Spain
4
Department of Zoology, Genetics and Physical Anthropology, Universidade de Santiago de Compostela, 27002 Lugo, Spain
*
Author to whom correspondence should be addressed.
Appl. Sci. 2021, 11(16), 7721; https://doi.org/10.3390/app11167721
Submission received: 21 May 2021
/
Revised: 7 August 2021
/
Accepted: 20 August 2021
/
Published: 22 August 2021
(This article belongs to the Special Issue Image Processing and Analysis for Preclinical and Clinical Applications)
Abstract
:Background: Zebrafish (Danio rerio) is a model organism for the study of human cancer. Compared with the murine model, the zebrafish model has several properties ideal for personalized therapies. The transparency of the zebrafish embryos and the development of the pigment-deficient ”casper“ zebrafish line give the capacity to directly observe cancer formation and progression in the living animal. Automatic quantification of cellular proliferation in vivo is critical to the development of personalized medicine. Methods: A new methodology was defined to automatically quantify the cancer cellular evolution. ZFTool was developed to establish a base threshold that eliminates the embryo autofluorescence, automatically measures the area and intensity of GFP (green-fluorescent protein) marked cells, and defines a proliferation index. Results: The proliferation index automatically computed on different targets demonstrates the efficiency of ZFTool to provide a good automatic quantification of cancer cell evolution and dissemination. Conclusion: Our results demonstrate that ZFTool is a reliable tool for the automatic quantification of the proliferation index as a measure of cancer mass evolution in zebrafish, eliminating the influence of its autofluorescence.
1. Introduction
Over the past 15 years, the zebrafish (Danio rerio) has emerged as a model system for the study of human cancer. The transparency of the zebrafish embryos and the development of the pigment-deficient “casper” zebrafish line allow scientists to observe cancer formation and progression directly in the living animal. The optical clarity of zebrafish can be exploited further by the use of fluorescent tags to label specific cell lineages to visualize tumor processes including initiation, progression, and regression. The zebrafish is experimentally amenable to transplantation assays that test the serial passage and malignant potential of fluorescently-labeled tumor cells as well as their capacity to disseminate and/or metastasize. Due to its fecundity and the optical clarity during embryonic development, the zebrafish has proven to be an excellent in vivo model system for high-throughput drug screening, because it allows the visual assessment of both drug efficacy and toxicity [1]. During recent years, the improvement of xenotransplantation of human cancer cells into zebrafish embryos has emerged as a powerful tool, complementary to murine models [2]. Mikut et al. [3] described the state of the art for automated processing of zebrafish imaging data and identified future challenges for zebrafish image analysis research. The zebrafish characteristics are exploited to address important questions in genetics, developmental biology, drug discovery, toxicology, and biomedical research. Zebrafish models exist for a broad range of human diseases, such as cardiovascular diseases [4], cancer [5], or movement disorders [6]. The present paper describes our research about measuring evolution on cancer cells on zebrafish. Although several articles have been published on zebrafish xenotransplantation [7,8,9,10], our aim is to optimize this technique for primary cultures originated from colorectal cancer patients in 48 h zebrafish embryos. Previously, RT qPCR and 2D imaging have been used to quantify both proliferation and migration. However, the techniques described so far do not provide an accurate measurement for both parameters. We propose accurate quantification on zebrafish embryos by temporal analysis of xenotransplanted cells marked with GFP (green-fluorescent protein). In the literature, some other works have conducted research on measuring the evolution of cancer cells and some of them developed an image analysis tool for it, such as ZebIAT [11], the Fiji distribution of the free software ImageJ, pioneer in bioimage analysis [12], or using commercial software [13]. A good revision of software for zebrafish image processing is in [3]. Nevertheless, these software tools are too specific, and none of them perform the analysis objective of our research, so we had to develop our own methodology.
2. Materials and Methods
2.1. Material
The images used in this paper were captured from zebrafish embryos, as described in the previous study for which this software was initially developed [14]. In the following, we resume those conditions.
Zebrafish embryos were obtained from mating adults according to standard procedures. The human colorectal cancer cell line HCT116 was obtained from American Type Culture Collection (ATCC, Manassas, VA, USA, Catalog No. CCL-247) and cultured using McCoy’s 5A Medium containing 10% FBS (GIBCO, Invitrogen, Waltham, MA, USA) and 1% Pen/Strep (GIBCO, Invitrogen) at 37 C with 5% CO2 in a humidified atmosphere. The HCT116 cell line was transfected to express GFP constitutively. HCT116 cells were transduced using a lentiviral-driven GFP construct (Sigma, Darmstad, Germany, Mission TurboGFP, SHC003 V). Cells were placed 72 h postinfection under selective pressure using 10 g/mL puromycin.
Two days postfertilization (dpf), zebrafish embryos were dechorionated (if needed) and anesthetized with 0.003% tricaine (Sigma). Cell injections were performed manually directly into the yolk of the embryo. Incorrectly injected embryos without cells inside the yolk or showing them in the circulation after xenotransplantation were discarded. After injection, 2 dpf embryos were incubated at 36 C in 24-well plates with salt dechlorinate tap water (SDTW, chlorine free water obtained with a reverse osmosis filter system) for 72 h to check the proliferation of the cell line by ZFTool. Each embryo was photographed with an AZ-100 Nikon fluorescence stereomicroscope (same exposure times, gamma correction set to 1) at 0 h postinjection (hpi) and 72 hpi to be analyzed by ZFTool software. This software analyzes the green channel image. The gray image of the fish is used only for visualization purposes.
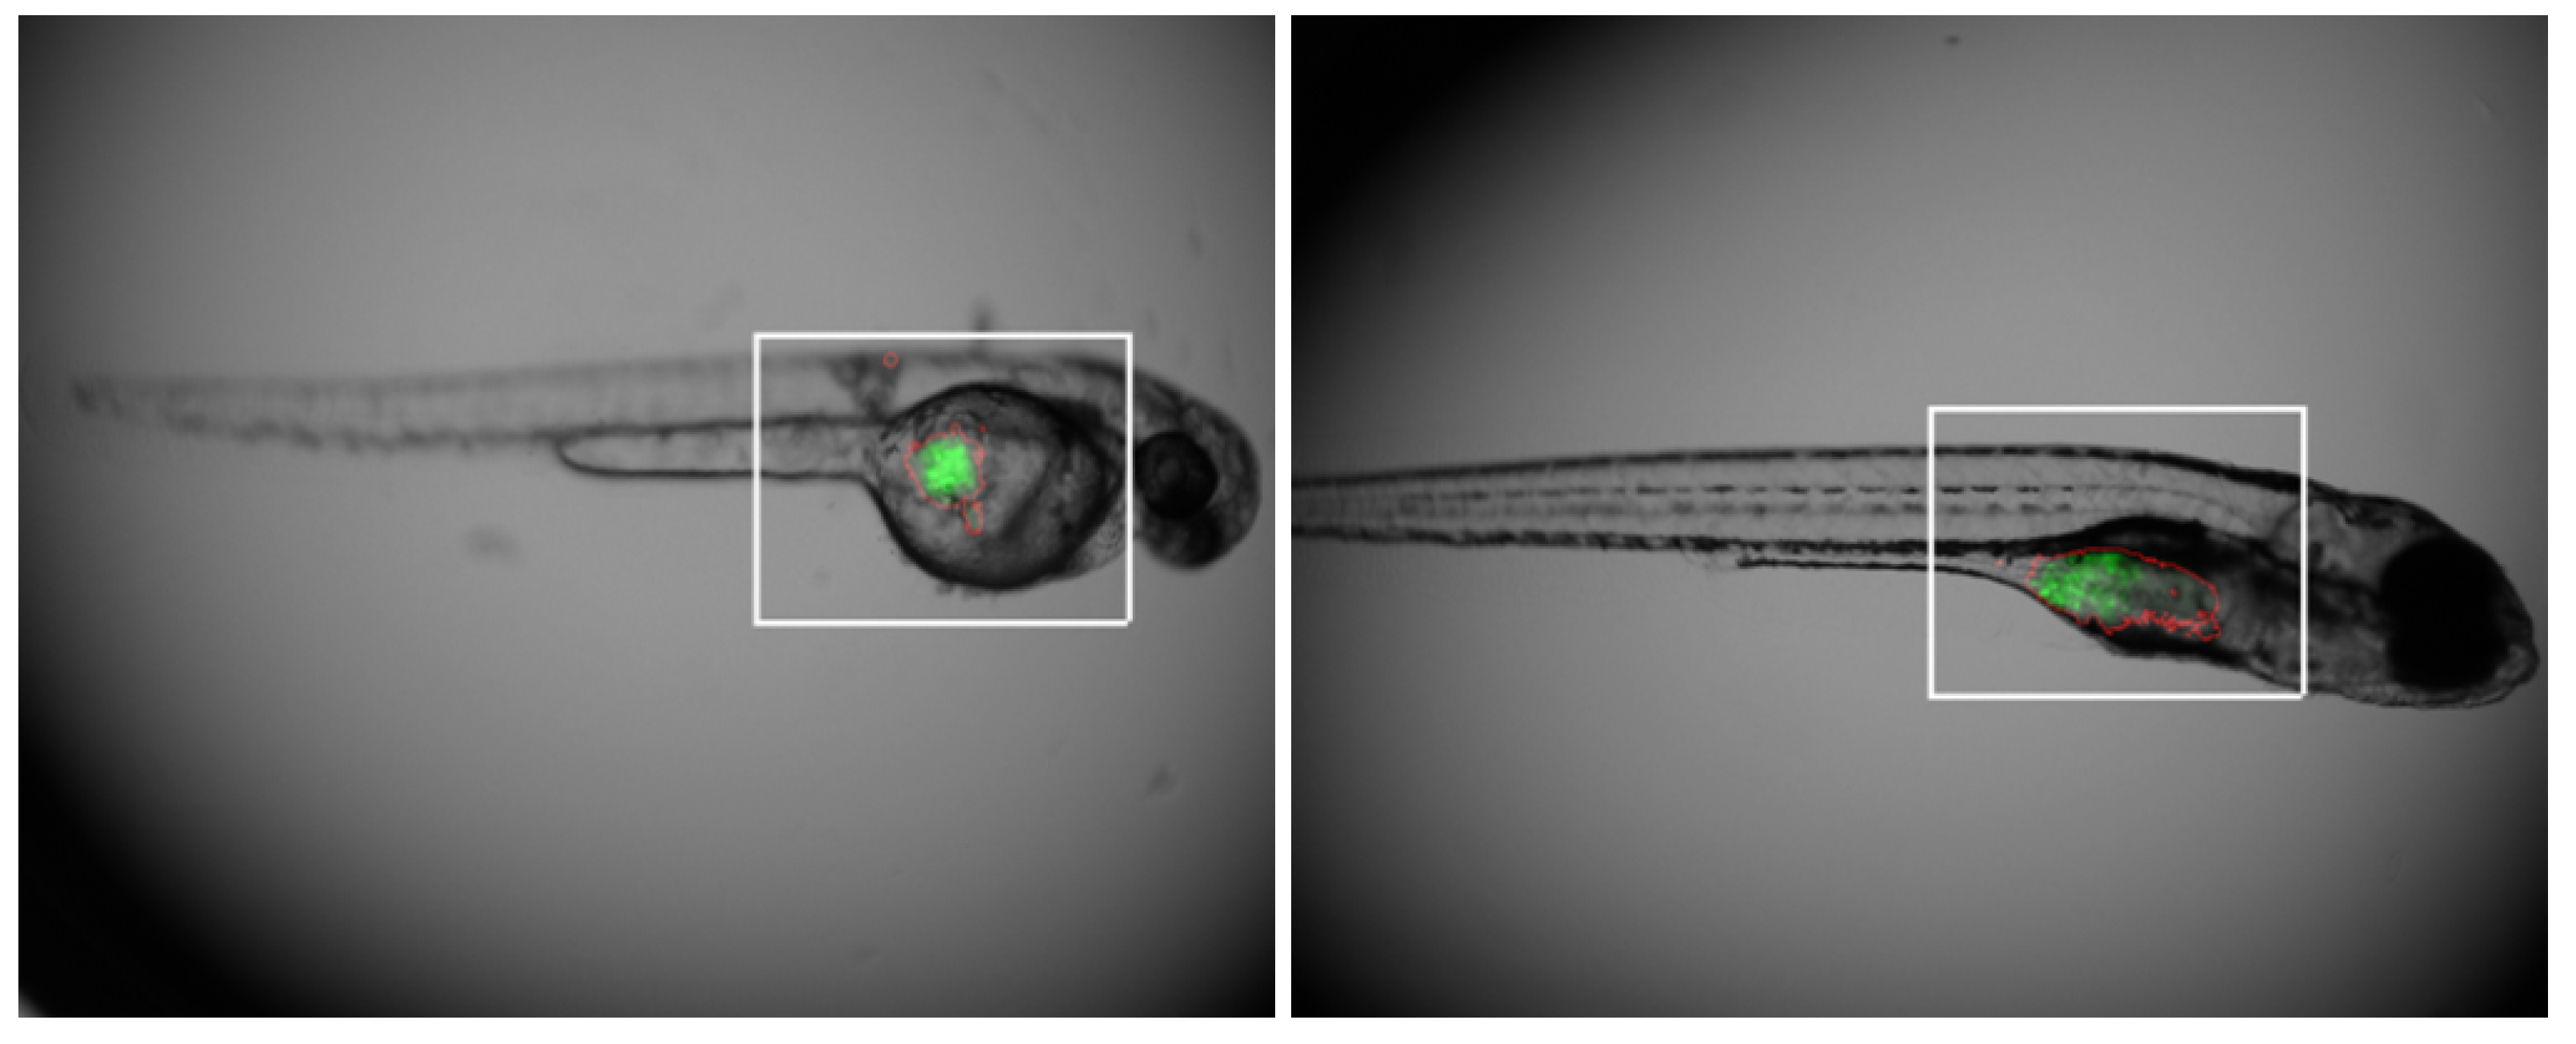
Figure 1 shows a typical image of both zebrafish and GFP mass at 0 hpi and 72 hpi. The GFP image is overlaid over the original embryo image just for positioning it over the zebrafish.
2.2. Methods
The objective of ZFTool is to automatize and improve the task of measuring the number and mean value of GFP pixels to compare them for 0 hpi and 24, 48, or 72 hpi (depending on the experiment) in order to quantify cancer mass evolution with time. ZFTool was developed as a Matlab toolbox and is available at https://gitlab.citius.usc.es/zebrafish/zftool. (Accessed on 22 August 2021). ZFTool eliminates the autofluorescence of the zebrafish through computation of the area with different intensity thresholds and automatically computing the autofluorescence threshold, which is established for both images at 0 hpi and 24, 48, or 72 hpi. ZFTool can establish a base threshold that eliminates embryo autofluorescence and measures the area of marked cells (GFP) and the intensity of those cells to define a proliferation index.
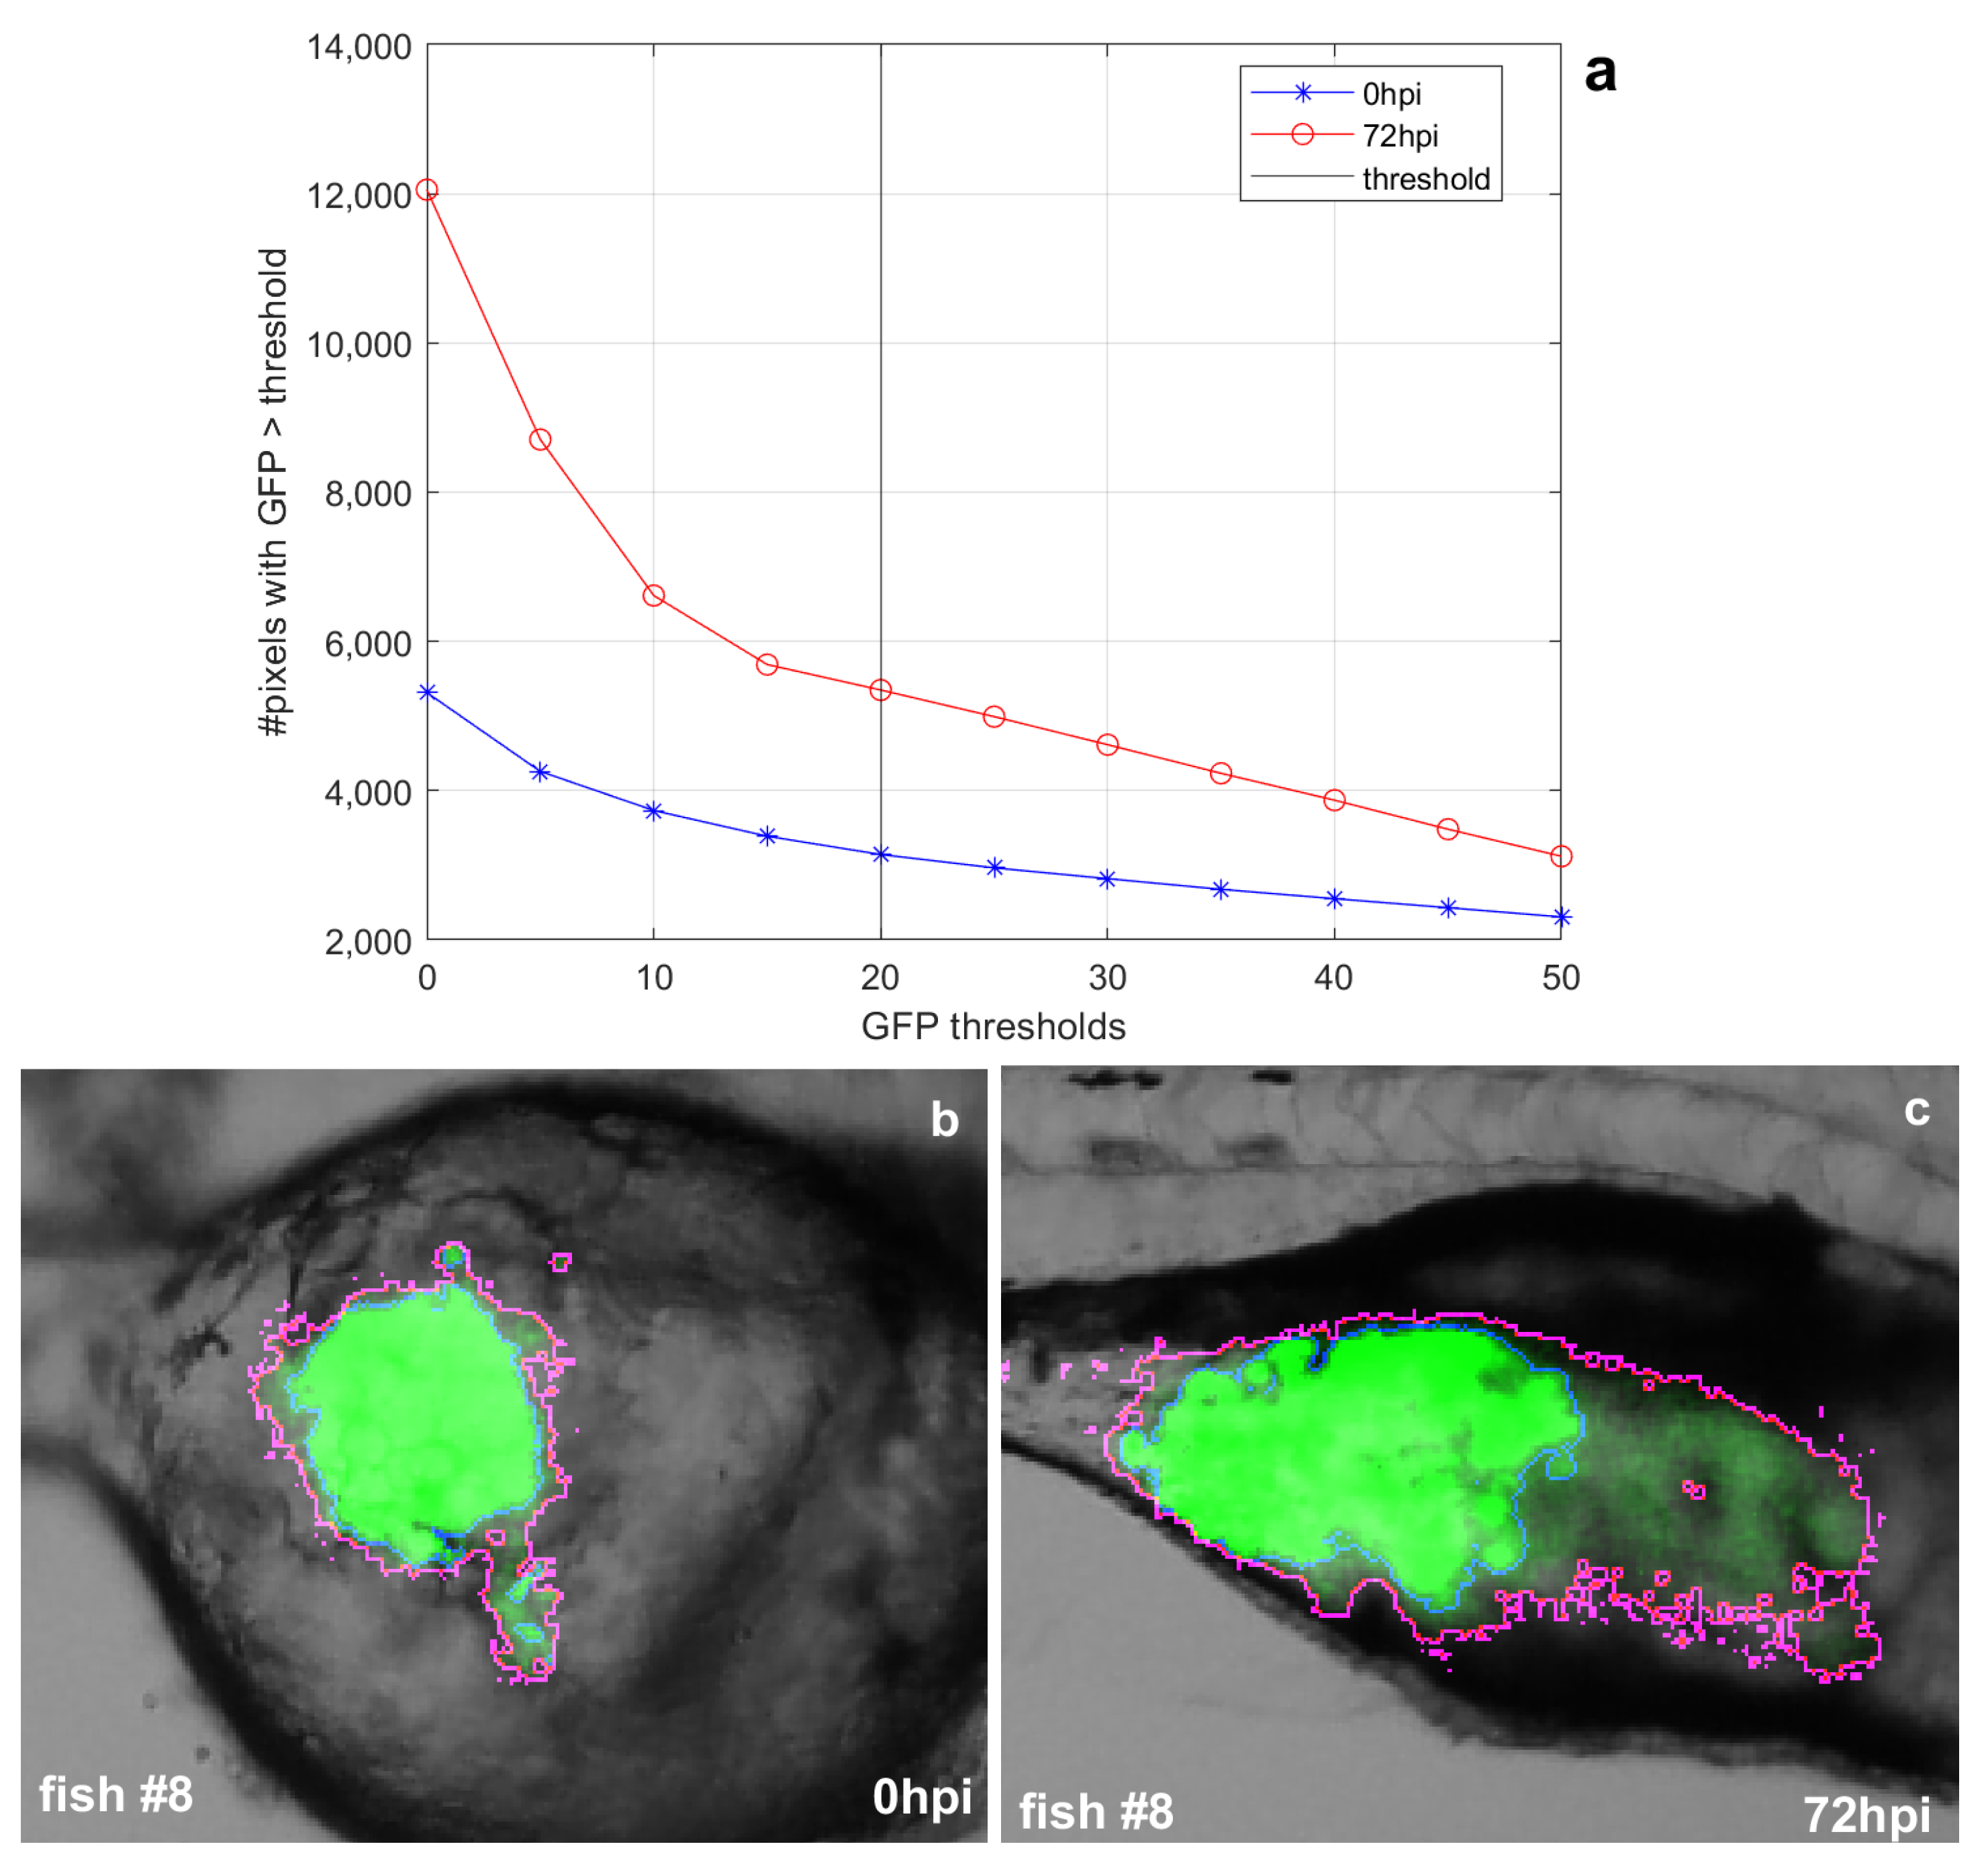
The input to the system are two images at 0 hpi and two images at 24, 48, or 72 hpi (the user selects the time to measure the tumor evolution, ZFTool works with any of these values). The output is both numerical (final threshold, mean areas and GFP intensities, proliferation index) and graphical (GFP intensity and area evolution, threshold, and images with initial and final perimeter). As was stated before, zebrafish is ideal for quantification of GFP masses because of its transparency, but a problem arises caused by the variable autofluorescence of the fish, especially in the yolk area. In order to accurately quantify the GFP evolution, a preprocessing must be applied to eliminate the autofluorescence region from the count. This preprocessing is based on the observation of evolution of GFP area with a threshold from 0 (no threshold) to 50 in steps of 5 (see an example in Figure 2).
As was stated before, this autofluorescence is variable, depending of the fish and on the hpi, so this threshold must be adapted to each case. The ZFTool software evaluated the graph of GFP threshold with respect to the area and selected as threshold the point in which this area remains stable.
Once this autofluorescence is eliminated, some parameters are computed in order to measure the cancer mass evolution: the number of GFP pixels in the image (nGFP), which represents the area of the cells inside the yolk sac at two different times, and the GFP intensity Medium Value (GMV), which represents the medium intensity of the fluorescence inside the yolk. By multiplying the nGFP number by the GMV of each image, we determined the proliferation ratio between 0 hpi and 72 hpi to estimate the cell growth. The result obtained at 72 hpi was divided by that obtained at 0 hpi, yielding a proliferation index value ():
A value = 1 means that cells remain stable during incubation, a slightly higher than 1 usually indicates a dissemination of cells (greater area, similar intensity), a near or over 2 indicates a proliferation of cells (greater area, greater intensity), and a lower than 1 indicates tumor cell death.
We must have in mind that, in order to compare these measures at 0 hpi and at 72 hpi, the threshold in both cases must be the same, so we will compute these two thresholds automatically and the biggest one will be applied to both images.
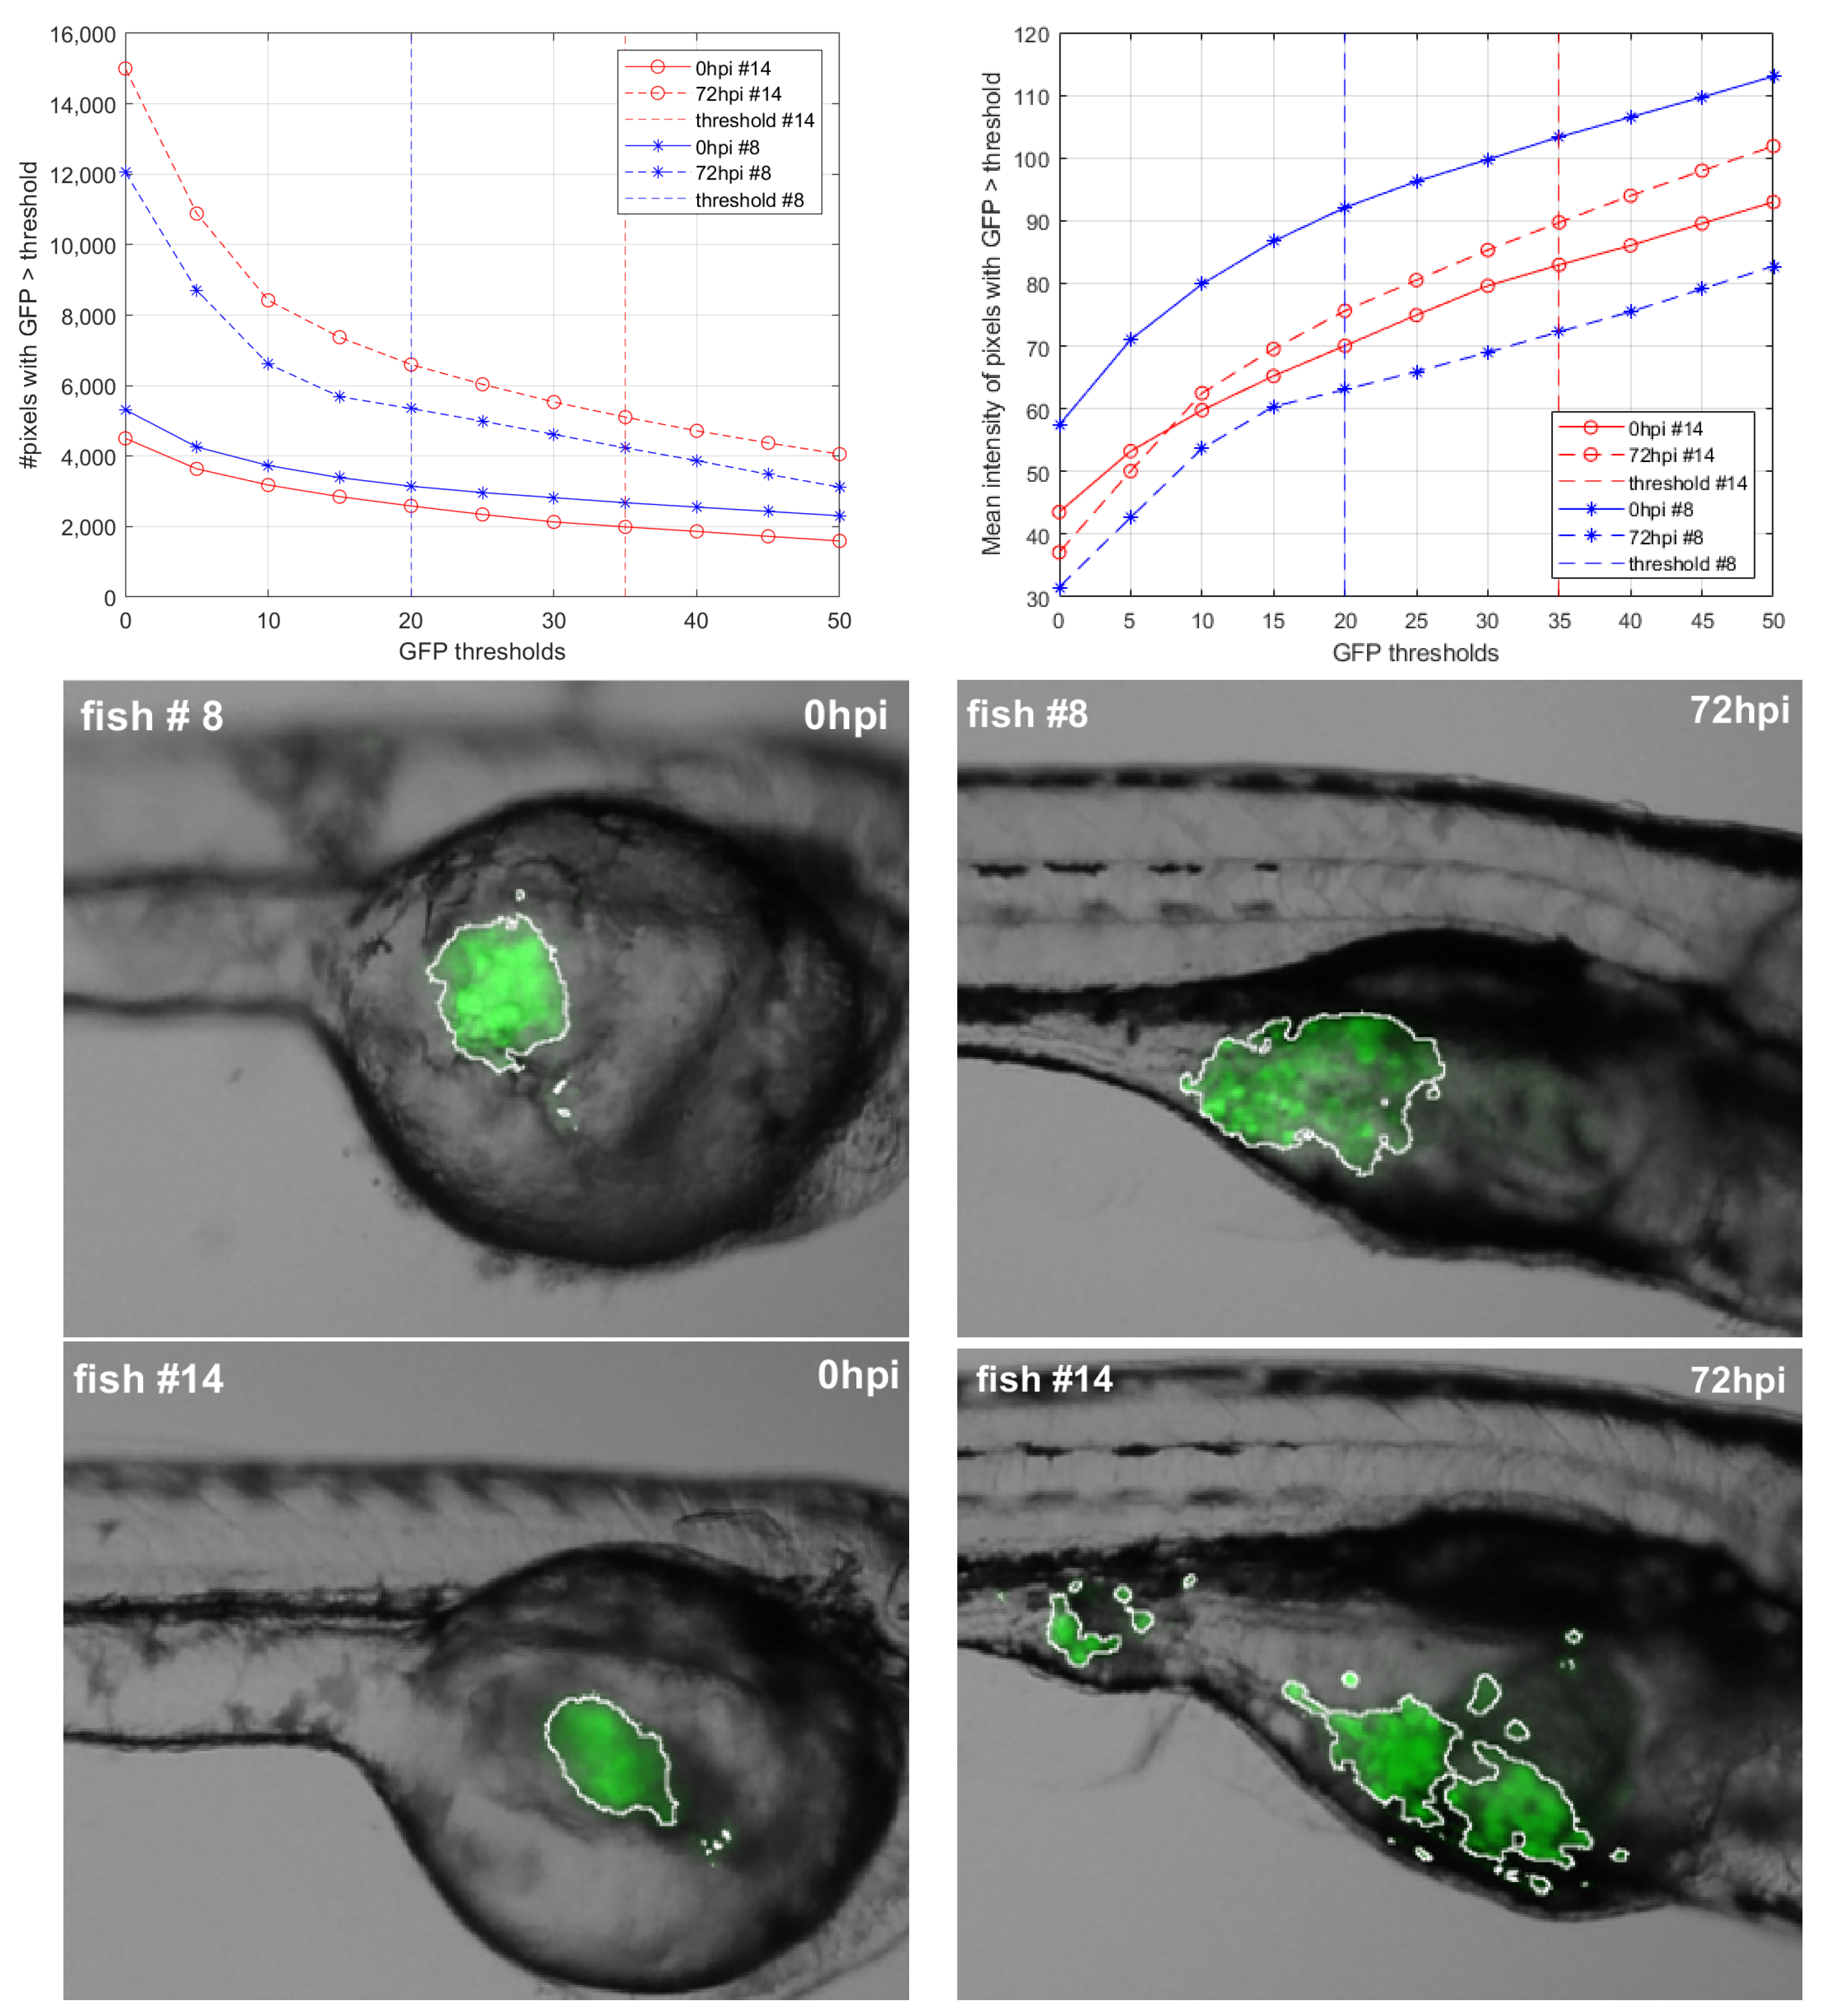
Due to zebrafish autofluorescence and the variability of capture conditions, the segmentation threshold will not be always the same. In order to design a methodology for automatic computation of this threshold, several tests were performed with a training set of 14 zebrafish, applying thresholds from 0 to 50 in 5 intervals and discarding regions with areas less than 10 pixels. Figure 3 shows the evolution of area and intensity for two characteristic zebrafish (#8 and #14), one with no proliferation of cell mass and another one with proliferation of cancer cell mass.
After applying the whole algorithm to the test set, we can conclude that when the cancer cells disseminate over the fish, the GFP region area is greater but the mean GFP intensity becomes lower for 72 hpi than those values for 0 hpi. On the other hand, when there is cell multiplication, both the GFP area and GFP mean intensity achieve greater values, depending on the proliferation factor. This fact can be observed in Figure 3, where we can conclude dissemination of cells for fish #8 and proliferation for fish #14. For fish #8, the regions after applying the threshold can be seen in Figure 3 (middle), where it can be seen that the region is more irregular and the cells are disseminated over the region. For fish #14, we can observe in Figure 3 (bottom) a proliferation of cells, the GFP intensity is greater and the area is also greater.
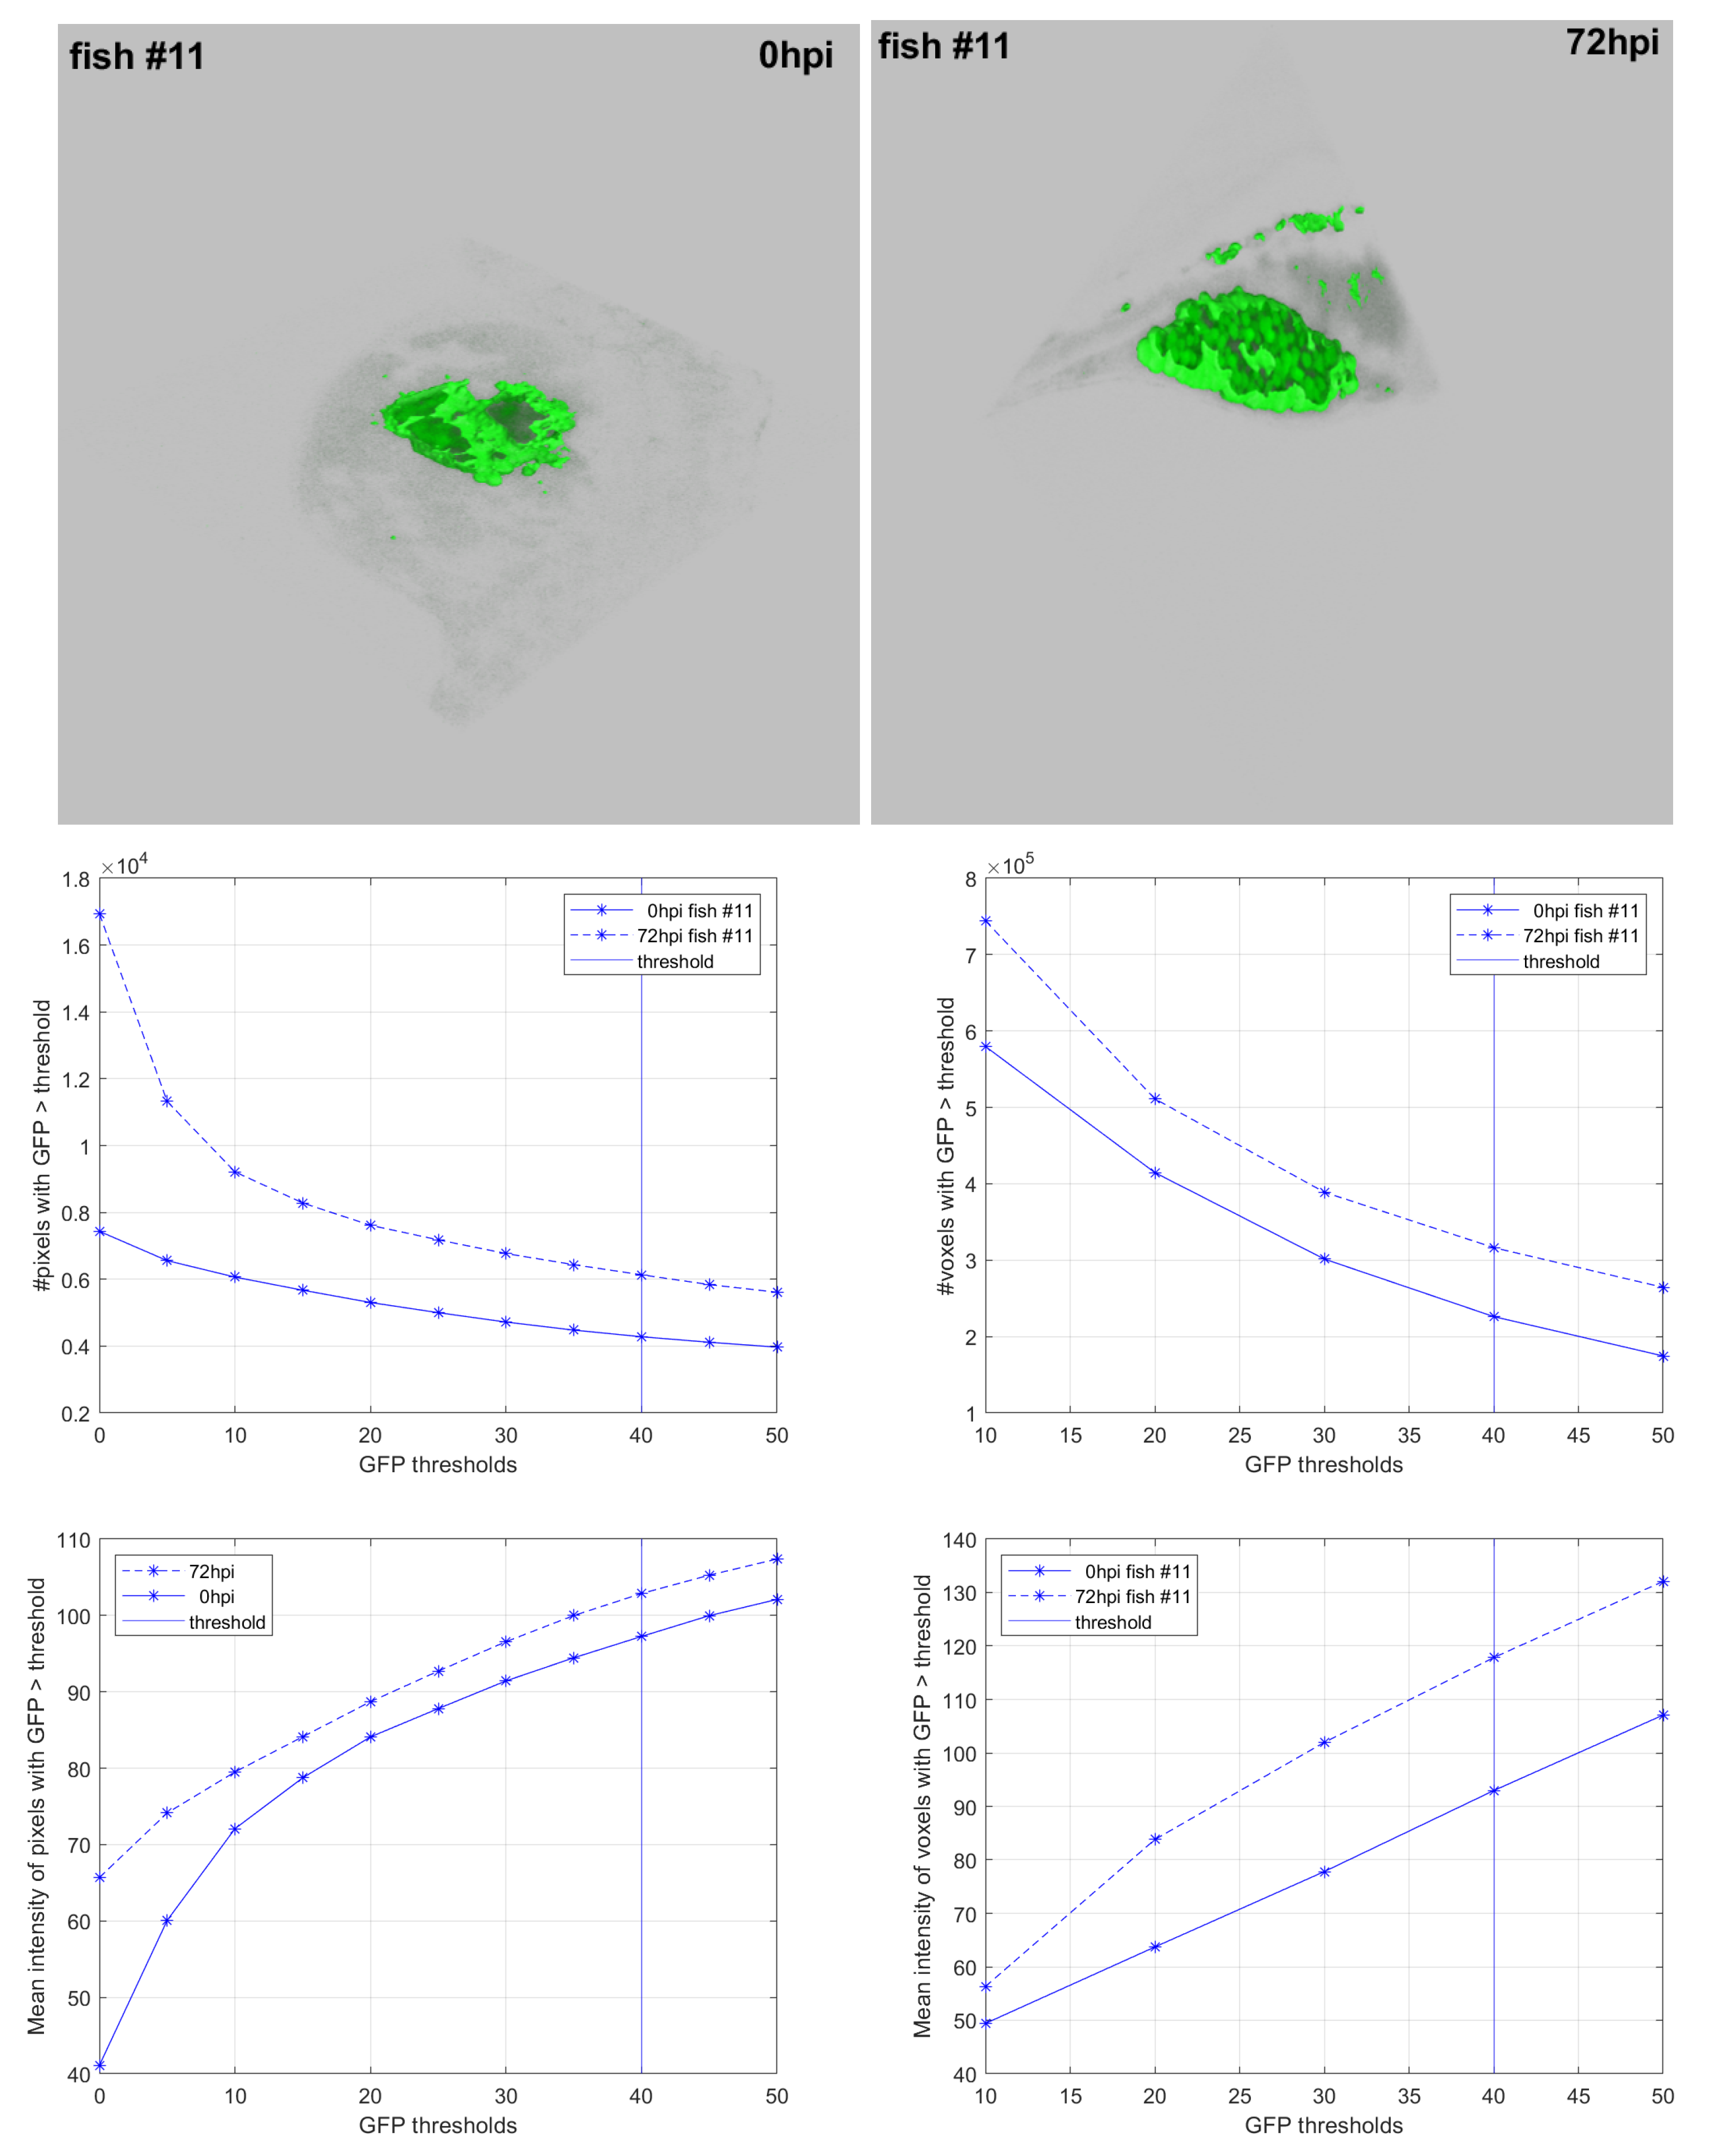
As 2D images are more easily captured and do not require as expensive instrumentation as for 3D images (confocal microscope), we will work with 2D images for quantifying cancer mass evolution. We have previously conducted experimentation [15] in order to establish a correspondence between 2D and 3D image analysis. These results are resumed in Figure 4, where both 2D and a z-stack of 25 images were captured for fish #11 at 0 hpi and 72 hpi. 2D images were acquired under the same conditions of images in this manuscript (AZ-100 microscope). The z-stack of 25 images separated by 1 was acquired using a confocal microscope. We used BioimageXD [16] to reconstruct the volume and compute the thresholded values to eliminate autofluorescence, as performed with 2D images.
As shown in Figure 4, the graphs follow the same evolution for 2D and 3D analysis, so we can use the 2D analysis of ZFTool as an estimation of the evolution of the tumor. The proliferation index obtained for fish #11 is 1.52 for 2D analysis and 1.77 for 3D analysis, concluding that there is a proliferation of cells (greater area and greater intensity) in both cases.
3. Results
To prove the algorithm and assess its performance, we analyzed images belonging to a test set. This test set is composed of 18 zebrafish with captures taken at 0 hpi and 72 hpi. Results confirmed the assumption made in the previous section that when area and intensity reach greater values, it is a symptom of proliferation, and when the area is greater and intensity is lower, it is a symptom of dissemination of cancer cells. The applied automatic threshold performs well in all cases and agrees with the expectations concluded by an expert. Table 1 shows the measurements for zebrafish #8, #11, and #14 and the final proliferation index.
4. Discussion and Conclusions
In this manuscript, we presented ZFTool, a software to quantify tumor evolution. Some issues to discuss are related with the correlation between 2D and 3D analysis, the affection of autofluorescence, and the biomarkers. Related to the first issue, although the relation between 2D and 3D measurements must be demonstrated, some previous experimentation conducted by the authors [15] explored the correlation between 2D and 3D tumor evolution, as shown in Figure 4 for fish #11, which obtained a similar value for the proliferation index (1.52 in 2D and 1.77 in 3D). With respect to autofluorescence, as ZFTool works directly with the channel green image, if another image (i.e., channel red) is provided, all the computations will work properly, as results do not depend on the channel being used. In case the fish do not have autofluorescence in that channel, the graphs of evolution shown in Figure 2 and Figure 3 will have an almost horizontal tendency, so the value of the threshold will be almost indifferent; ZFTool will be able to work in this case also.
While working with different biomarkers, we decided to optimize the software with a permanent labeling of the cells, expressing GFP protein in the cytoplasm. In this way, cells were able to maintain the GFP intensity throughout the experiment, allowing to quantify the proliferation of the cells through the integrated density, leading to a proliferation index. Nevertheless, not all the xenograft assays are performed with this ideal labeling, requiring lipophilic dyes (DiI, DiD, DiO) to label the membrane of the cells. Using this approach, ZFTool functions as previously described, erasing the autofluorescence, which is important because working with a lypophilic dye could lead to an increase in autofluorescence or artifacts due to the lysis of the injected cells and the spread of the dye across areas of the zebrafish embryo. Even so, when a lipophilic dye is used, it is not possible to calculate a proliferation ratio, but a more accurate fold change between the conditions tested against the control.
Another issue is if it would be adequate to fix the autofluorescence of the fish previously to the injection. We have decided not to do this as the autofluorescence is dependent of each individual, by the stage of development and by the drugs under research. This is precisely why we fixed the threshold in this way: we computed the first possible threshold for each fish in each moment and fixed the greater value as the common threshold. As the graphs in Figure 2 and Figure 3 show, this will be the first possible threshold, when the autofluorescence is eliminated, although selecting a subsequent threshold barely affected the mean area and intensity of the tumor.
In our research, a proliferation index was defined, as indicated in Equation (1). This parameter by itself should be an indicator of proliferation in most of the experiments. Nevertheless, there are different scenarios for the proliferation index, considering that if the dissemination is larger than the proliferation, the increase in the proliferation index could be due exclusively to spread instead of division of the cells. For this reason, ZFTool also offers as output both the intensity and area and, apart from that, the graphs and the images to be used as complementary diagnostics by the researchers. Although a nuclear marker could be used for quantifying cell proliferation, the quality of the images and its 2D character does not permit such exact counting, so we used the intensity of the GPF as an indicator of the number of superposed cells.
As a future perspective and projection of the software, once systematized, improved, and tested, it will help to automatize part of the xenograft procedure and conduct an in vivo assay screening that could help clinicians decide the best chemotherapy combinations for each patient through the injection of patient cancer cells into the zebrafish embryos. Although this objective could be achieved, there are many variables that this technique needs to take into consideration to evaluate the proliferation of the cancer cells and treatments, such as the microenvironment of the tumor and the matrix in the human body.
As a conclusion, in this work, we designed an algorithm to automatically perform the thresholding and computation of GFP area and mean intensity values. These values are characteristics that demonstrate the evolution of the injection of cancer cells into the yolk sac of a zebrafish embryo. This computation is of great interest for cancer research as zebrafish allow in vivo assays and we can perform a reliable, repeatable, and quick computation of characteristic features. We also defined a so-called proliferation index as a measure of the degree of dissemination or multiplication of tumor cells.
Author Contributions
Conceptualization, M.J.C. and L.S.; methodology, M.J.C. and N.V.-B.; software, M.J.C. and N.V.-B.; validation, P.C.-S. and L.S.; investigation, M.J.C., N.V.-B., P.C.-S., and L.S.; writing—original draft preparation, M.J.C. and N.V.-B.; writing—review and editing, M.J.C. and P.C.-S. All authors have read and agreed to the published version of the manuscript.
Funding
This work has received financial support from Consellería de Cultura, Educación e Ordenación Universitaria (accreditation 2019-2022 ED431G-2019/04) and the European Regional Development Fund (ERDF), which acknowledges the CiTIUS-Research Center in Intelligent Technologies of the University of Santiago de Compostela as a Research Center of the Galician University System.
Institutional Review Board Statement
The care, use, and treatment of zebrafish were performed in agreement with the Animal Care and Use Committee of the University of Santiago de Compostela and the standard protocols of Spain (Directive 2012-63-UE). The protocol was approved by the Animal Care and Use Committee of the University of Santiago de Compostela.
Informed Consent Statement
Not applicable.
Conflicts of Interest
The authors declare no conflict of interest.
Abbreviations
The following abbreviations are used in this manuscript:
| 5-FU | 5-Fluorouracil |
| dpf | Days postfertilization |
| GFP | Green-Fluorescent Protein |
| GMV | GFP medium value |
| hpf | Hours postfecundation |
| hpi | Hours postinjection |
| nGFP | Number of GFP pixels |
References
- Ali, S.; Champagne, D.; Spaink, H.; Richardson, M. Zebrafish embryos and larvae: A new generation of disease models and drug screens. Birth Defects Res. Part C Embryo Today 2011, 93, 115–133. [Google Scholar] [CrossRef] [PubMed]
- Drabsch, Y.; He, S.; Zhang, L.; Snaar-Jagalska, B.; Ten Dijke, P. Transforming growth factor-β signaling controls human breast cancer metastasis in a zebrafish xenograft model. Breast Cancer Res. 2013, 15, R106. [Google Scholar] [CrossRef]
- Mikut, R.; Dickmeis, T.; Driever, W.; Geurts, P.; Hamprecht, F.; Kausler, B.; Ledesma-Carbayo, M.; Marée, R.; Mikula, K.; Pantazis, P.; et al. Automated Processing of Zebrafish Imaging Data: A Survey. Zebrafish 2013, 10, 401–421. [Google Scholar] [CrossRef] [Green Version]
- Bakkers, J. Zebrafish as a model to study cardiac development and human cardiac disease. Cardiovasc. Res. 2011, 91, 279–288. [Google Scholar] [CrossRef] [Green Version]
- Mione, M.; Trede, N. The zebrafish as a model for cancer. Dis. Model. Mech. 2010, 3, 517–523. [Google Scholar] [CrossRef] [PubMed] [Green Version]
- Flinn, L.; Bretaud, S.; Lo, C.; Ingham, P.; Bandmann, O. Zebrafish as a new animal model for movement disorders. J. Neurochem. 2008, 106, 1991–1997. [Google Scholar] [CrossRef] [PubMed]
- Bentley, V.; Veinotte, C.; Corkery, D.; Pinder, J.; LeBlanc, M.; Bedard, K.; Weng, A.; Berman, J.; Dellaire, G. Focused chemical genomics using zebrafish xenotransplantation as a preclinical therapeutic platform for T-cell acute lymphoblastic leukemia. Haematologica 2015, 100, 70–76. [Google Scholar] [CrossRef]
- Jung, D.W.; Oh, E.S.; Park, S.H.; Chang, Y.T.; Kim, C.H.; Choi, S.Y.; Williams, D. A novel zebrafish human tumor xenograft model validated for anti-cancer drug screening. Mol. Biosyst. 2012, 8, 1930–1939. [Google Scholar] [CrossRef]
- Konantz, M.; Balci, T.; Hartwig, U.; Dellaire, G.; André, M.; Berman, J.; Lengerke, C. Zebrafish xenografts as a tool for in vivo studies on human cancer. Ann. N. Y. Acad. Sci. 2012, 1266, 124–137. [Google Scholar] [CrossRef]
- Veinotte, C.; Dellaire, G.; Berman, J. Hooking the big one: The potential of zebrafish xenotransplantation to reform cancer drug screening in the genomic area. Dis. Model. Mech. 2014, 7, 745–754. [Google Scholar] [CrossRef] [PubMed] [Green Version]
- Annila, T.; Lihavainen, E.; Marques, I.; Williams, D.; Yli-Harja, O.; Ribeiro, A. ZebIAT, an image analysis tool for registering zebrafish embryos and quantifying cancer metastasis. BMC Bioinform. 2013, 14, S5. [Google Scholar] [CrossRef] [PubMed] [Green Version]
- Teng, Y.; Xie, X.; Walker, S.; White, D.; Mumm, J.; Cowell, J. Evaluating human cancer cell metastasis in zebrafish. BMC Cancer 2013, 13, 453. [Google Scholar] [CrossRef] [PubMed] [Green Version]
- Ghotra, V.; He, S.; de Bont, H.; van der Ent, W.; Spaink, H.; van de Water, B.; Snaar-Jagalska, B.; Danen, E. Automated whole animal bio-imaging assay for human cancer dissemination. PLoS ONE 2012, 7, e31281. [Google Scholar] [CrossRef] [PubMed]
- Cabezas-Sainz, P.; Guerra-Varela, J.; Carreira, M.J.; Mariscal, J.; Roel, M.; Rubiolo, J.; Sciara, A.; Abal, M.; Botana, L.; López, R.; et al. Improving zebrafish embryo xenotransplantation conditions by increasing incubation temperature and establishing a proliferation index with ZFTool. BMC Cancer 2018, 18, 3. [Google Scholar] [CrossRef] [PubMed]
- Guerra-Varela, J.; Terriente, J.; Mariscal, J.; Cabezas-Sainz, P.; Calzolari, S.; Dyballa, S.; Abal, M.; López, R.; Sánchez, L. Assessing proliferation and metastasis of human cancer cells trhough 3D imaging. In Proceedings of the 7th Zebrafish Disease Models Conference, Madison, WI, USA, 28 June–1 July 2014. 100–P1. [Google Scholar]
- Kankaanpää, P.; Paavolainen, L.; Tiitta, S.; Karjalainen, M.; Päivärinne, J.; Nieminen, J.; Marjomäki, V.; Heino, J.; White, D. BioImageXD: An open, general-purpose and high-throughput image-processing platform. Nat. Methods 2012, 9, 683–689. [Google Scholar] [CrossRef] [PubMed]
Figure 1.
Example of segmentation over a characteristic image (zebrafish #8 at 0 hpi and 72 hpi) where the GFP value and the contour image are overlaid in green and red, respectively. The white rectangle will be the region of interest in the next figures.
Figure 1.
Example of segmentation over a characteristic image (zebrafish #8 at 0 hpi and 72 hpi) where the GFP value and the contour image are overlaid in green and red, respectively. The white rectangle will be the region of interest in the next figures.

Figure 2.
Example of autofluorescence in the yolk sac for fish #8 at 0 hpi and 72 hpi. (a) The graph shows the area evolution with respect to the GFP threshold in steps of 5. The abrupt decay in the area caused by the fish autofluorescence can be observed. When the area remains stable for 3 iterations, the threshold is fixed. (b) threshold at 0 hpi in magenta and final threshold (20 in this case) in blue. The GFP (green channel) was artificially enhanced in order to make visible the autofluorescence causing the initial contour. This is better seen in the image at 72 hpi (c). The original images are shown in Figure 3, where the autofluorescence cannot be appreciated.

Figure 3.
Characteristic zebrafish #8 and #14. Up: fish #8 (blue) presents greater area and lower intensity after 72 h while fish #14 (red) presents greater area and higher intensity after 72 h. Threshold final values for zebrafish #8 and #14 are 20 and 35, respectively. Middle and bottom rows: thresholded GFP regions for zebrafish #8 (middle) and zebrafish #14 (bottom) for 0 hpi (left) and 72 hpi (right).

Figure 4.
Comparison of 2D and 3D analyses for fish #11. First row: 2D analysis with ZFTool. Second row: 3D analysis with BioimageXD. Third row: # pixels evolution and # voxels evolution. Fourth row: GFP intensity evolution for pixels (left) and voxels (right).
Figure 4.
Comparison of 2D and 3D analyses for fish #11. First row: 2D analysis with ZFTool. Second row: 3D analysis with BioimageXD. Third row: # pixels evolution and # voxels evolution. Fourth row: GFP intensity evolution for pixels (left) and voxels (right).


Table 1.
Final thresholds and measurements of areas and mean green value for zebrafish #8 (dissemination, PI around 1), #11 (proliferation, PI greater than 1), and #14 (proliferation and dissemination, PI greater than 2).
Table 1.
Final thresholds and measurements of areas and mean green value for zebrafish #8 (dissemination, PI around 1), #11 (proliferation, PI greater than 1), and #14 (proliferation and dissemination, PI greater than 2).
| Zebrafish # | Threshold | PI | ||||
|---|---|---|---|---|---|---|
| #8 | 20 | 3144 | 92.08 | 5349 | 63.07 | 1.16 |
| #11 | 40 | 4279 | 97.25 | 6133 | 102.88 | 1.52 |
| #14 | 35 | 1991 | 82.94 | 5106 | 89.72 | 2.77 |
Publisher’s Note: MDPI stays neutral with regard to jurisdictional claims in published maps and institutional affiliations. |
© 2021 by the authors. Licensee MDPI, Basel, Switzerland. This article is an open access article distributed under the terms and conditions of the Creative Commons Attribution (CC BY) license (https://creativecommons.org/licenses/by/4.0/).
Share and Cite
MDPI and ACS Style
Carreira, M.J.; Vila-Blanco, N.; Cabezas-Sainz, P.; Sánchez, L. ZFTool: A Software for Automatic Quantification of Cancer Cell Mass Evolution in Zebrafish. Appl. Sci. 2021, 11, 7721. https://doi.org/10.3390/app11167721
AMA Style
Carreira MJ, Vila-Blanco N, Cabezas-Sainz P, Sánchez L. ZFTool: A Software for Automatic Quantification of Cancer Cell Mass Evolution in Zebrafish. Applied Sciences. 2021; 11(16):7721. https://doi.org/10.3390/app11167721
Chicago/Turabian StyleCarreira, María J., Nicolás Vila-Blanco, Pablo Cabezas-Sainz, and Laura Sánchez. 2021. "ZFTool: A Software for Automatic Quantification of Cancer Cell Mass Evolution in Zebrafish" Applied Sciences 11, no. 16: 7721. https://doi.org/10.3390/app11167721
Note that from the first issue of 2016, this journal uses article numbers instead of page numbers. See further details here.