
Efficient and Accurate Hemorrhages Detection in Retinal Fundus Images Using Smart Window Features


School of Information, Computer and Communication Technology, Sirindhorn International Institute of Technology, Thammasat University, Pathum-Thani 12000, Thailand
*
Author to whom correspondence should be addressed.
Appl. Sci. 2021, 11(14), 6391; https://doi.org/10.3390/app11146391
Submission received: 29 April 2021
/
Revised: 23 June 2021
/
Accepted: 6 July 2021
/
Published: 10 July 2021
(This article belongs to the Topic Medical Image Analysis)
Abstract
:Diabetic retinopathy (DR) is one of the diseases that cause blindness globally. Untreated accumulation of fat and cholesterol may trigger atherosclerosis in the diabetic patient, which may obstruct blood vessels. Retinal fundus images are used as diagnostic tools to screen abnormalities linked to diseases that affect the eye. Blurriness and low contrast are major problems when segmenting retinal fundus images. This article proposes an algorithm to segment and detect hemorrhages in retinal fundus images. The proposed method first performs preprocessing on retinal fundus images. Then a novel smart windowing-based adaptive threshold is utilized to segment hemorrhages. Finally, conventional and hand-crafted features are extracted from each candidate and classified by a support vector machine. Two datasets are used to evaluate the algorithms. Precision rate (P), recall rate (R), and F1 score are used for quantitative evaluation of segmentation methods. Mean square error, peak signal to noise ratio, information entropy, and contrast are also used to evaluate preprocessing method. The proposed method achieves a high F1 score with 83.85% for the DIARETDB1 image dataset and 72.25% for the DIARETDB0 image dataset. The proposed algorithm adequately adapts when compared with conventional algorithms, hence will act as a tool for segmentation.
1. Introduction
The world health organization (WHO) estimates Diabetic retinopathy (DR) as the fifth leading cause of visual impairment and the fourth cause of blindness in the world. Globally, 800 million people have myopia, hypermetropia, presbyopia. Out of this, 100 million have moderate-to-severe distance vision blindness [1]. The increasing number of individuals suffering from diabetes mellitus (DM) has made the number of DR patients rise inevitably. Factors responsible for the prevalence of DM include obesity, sedentary lifestyle, physical inactivity, and lack of awareness [2]. Early detection and prevention are important steps to avoid blindness from DR disease. Effective control of vision loss includes regular eye examination and management of risk factors (such as glycemic, hypertension, and hyperlipidemia) [3,4]. The American Diabetes Association (ADA) recommends that type 1 diabetes patients be screened three to five years after onset, and type 2 diabetic patients be screened one year after onset [5,6]. Abnormalities in DR are categorized as non-proliferative diabetic retinopathy (NPDR) and proliferative diabetic retinopathy (PDR). NPDR disease is the earliest stage of DR that changes the blood vessel of the eye. The changes in NPDR do not present any symptoms and are not visible to the naked eye. During the later stage of pathology, microaneurysms turn into hemorrhages.
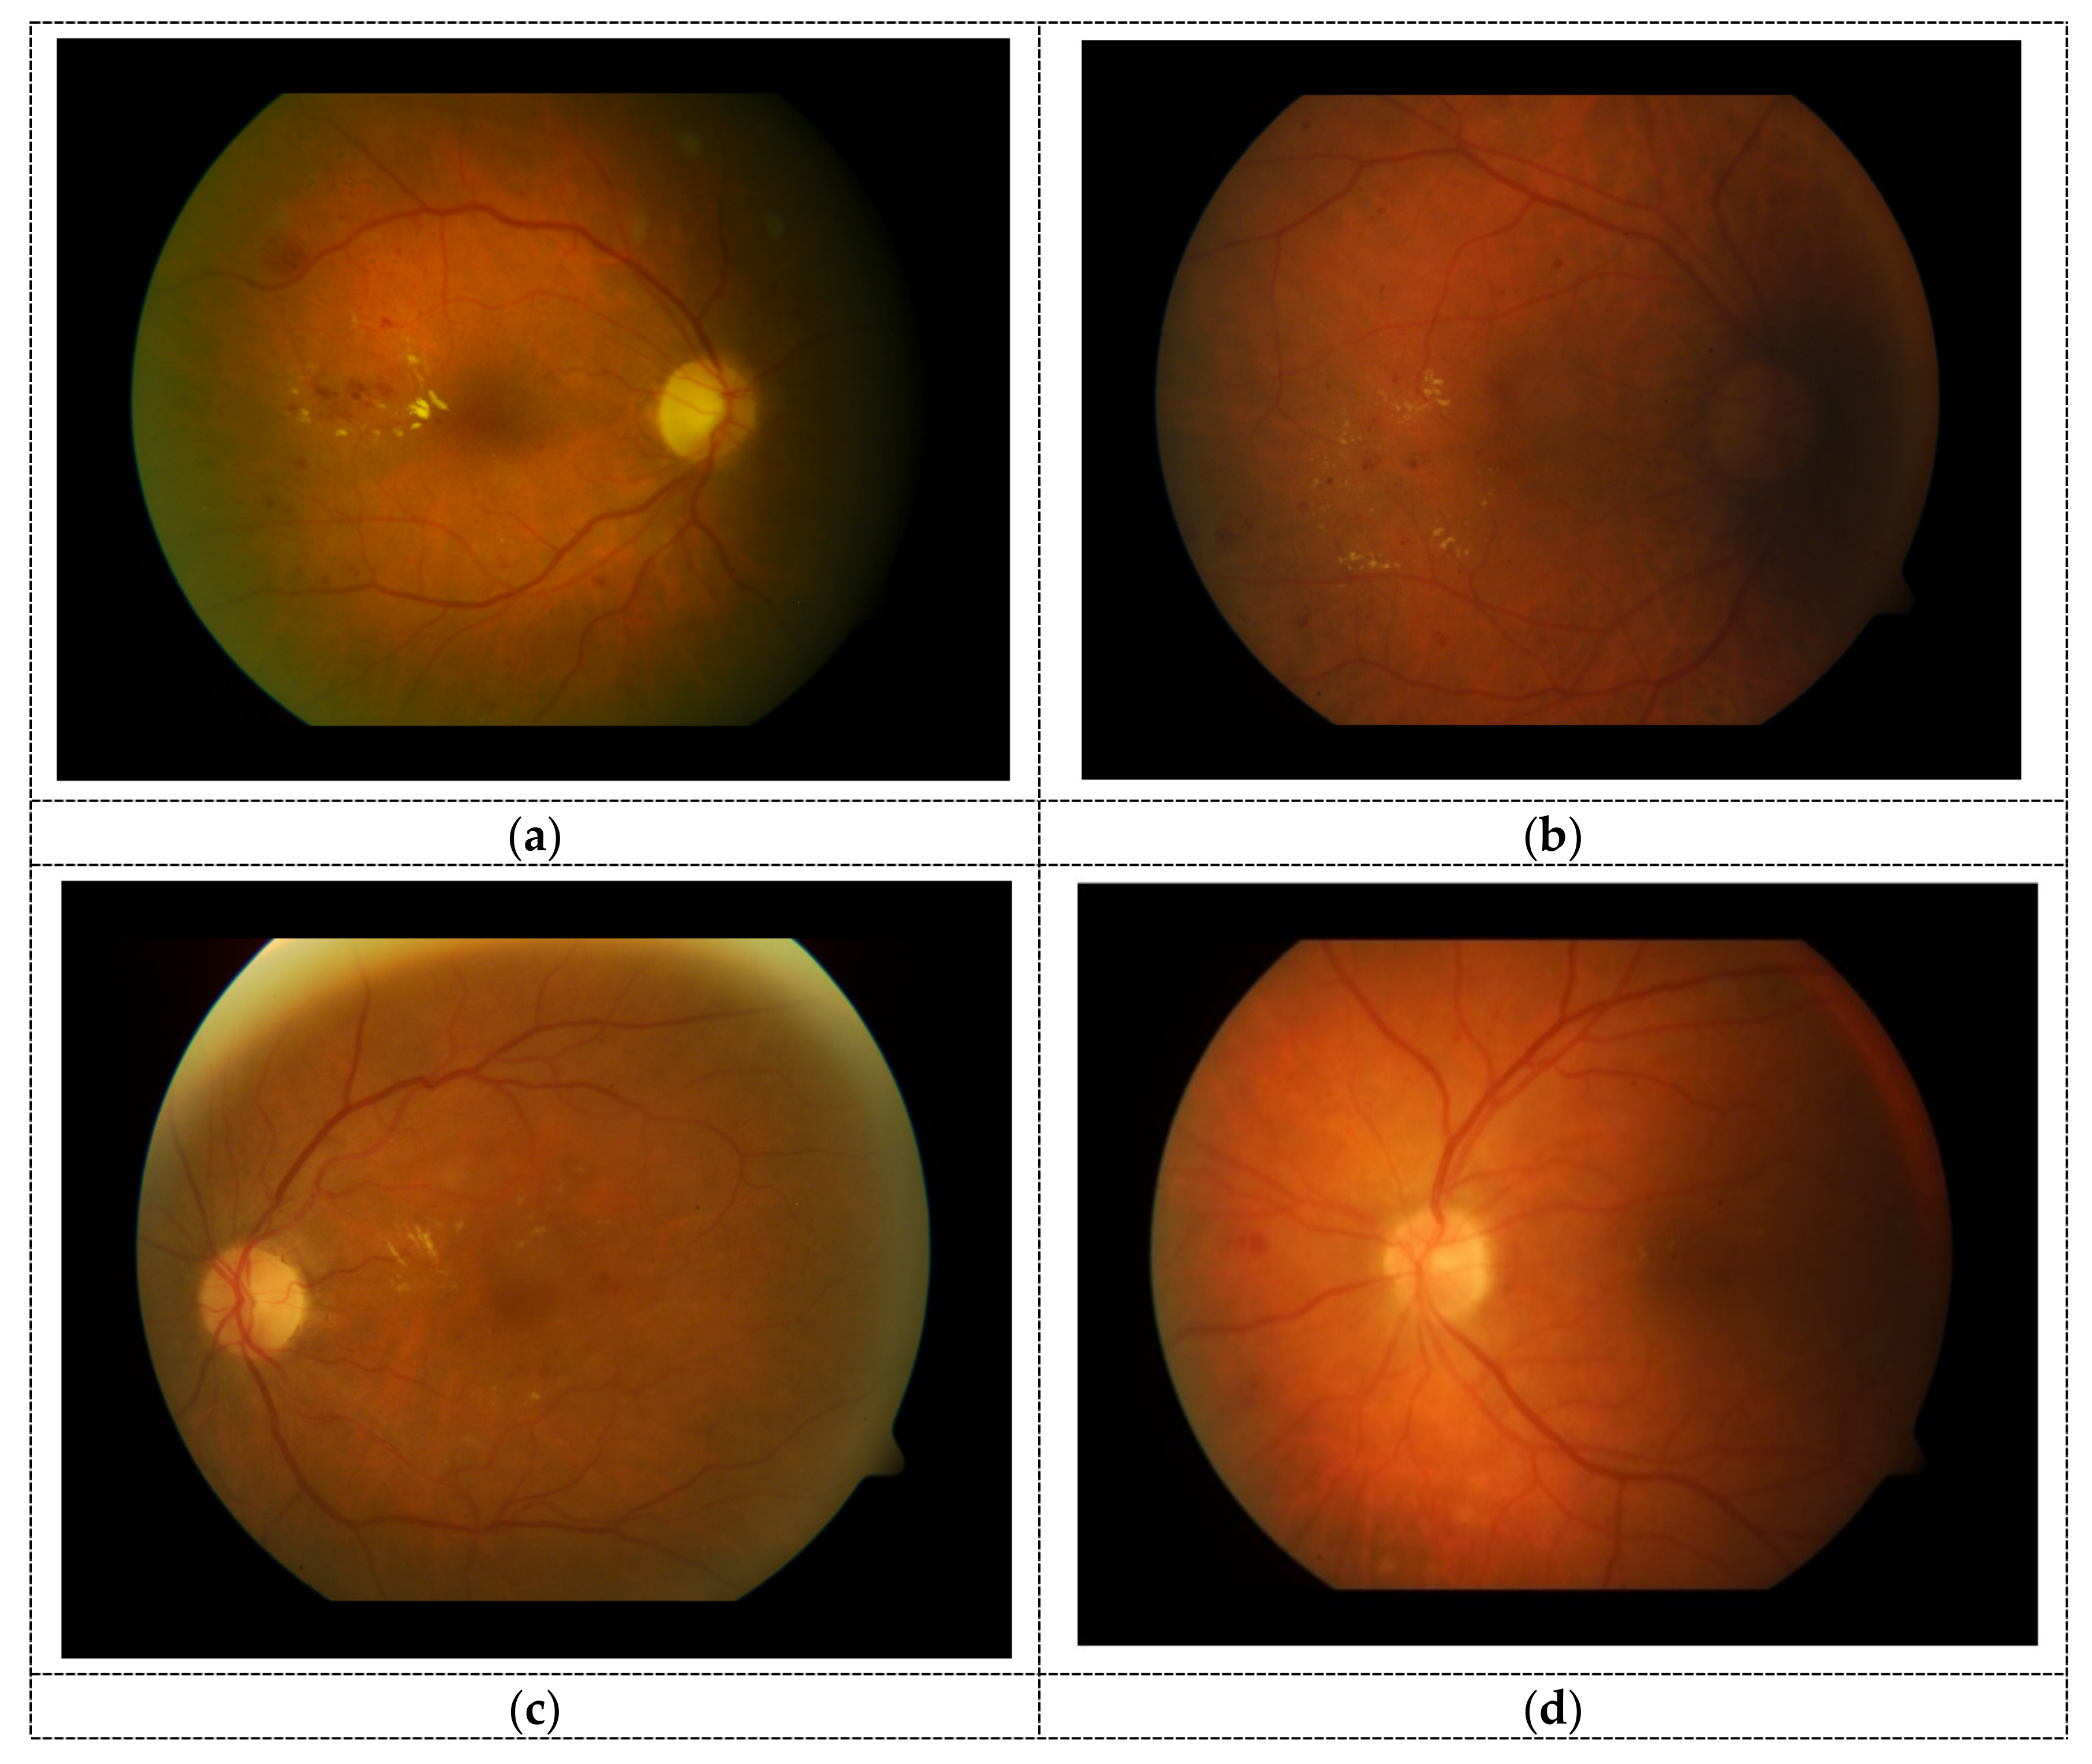
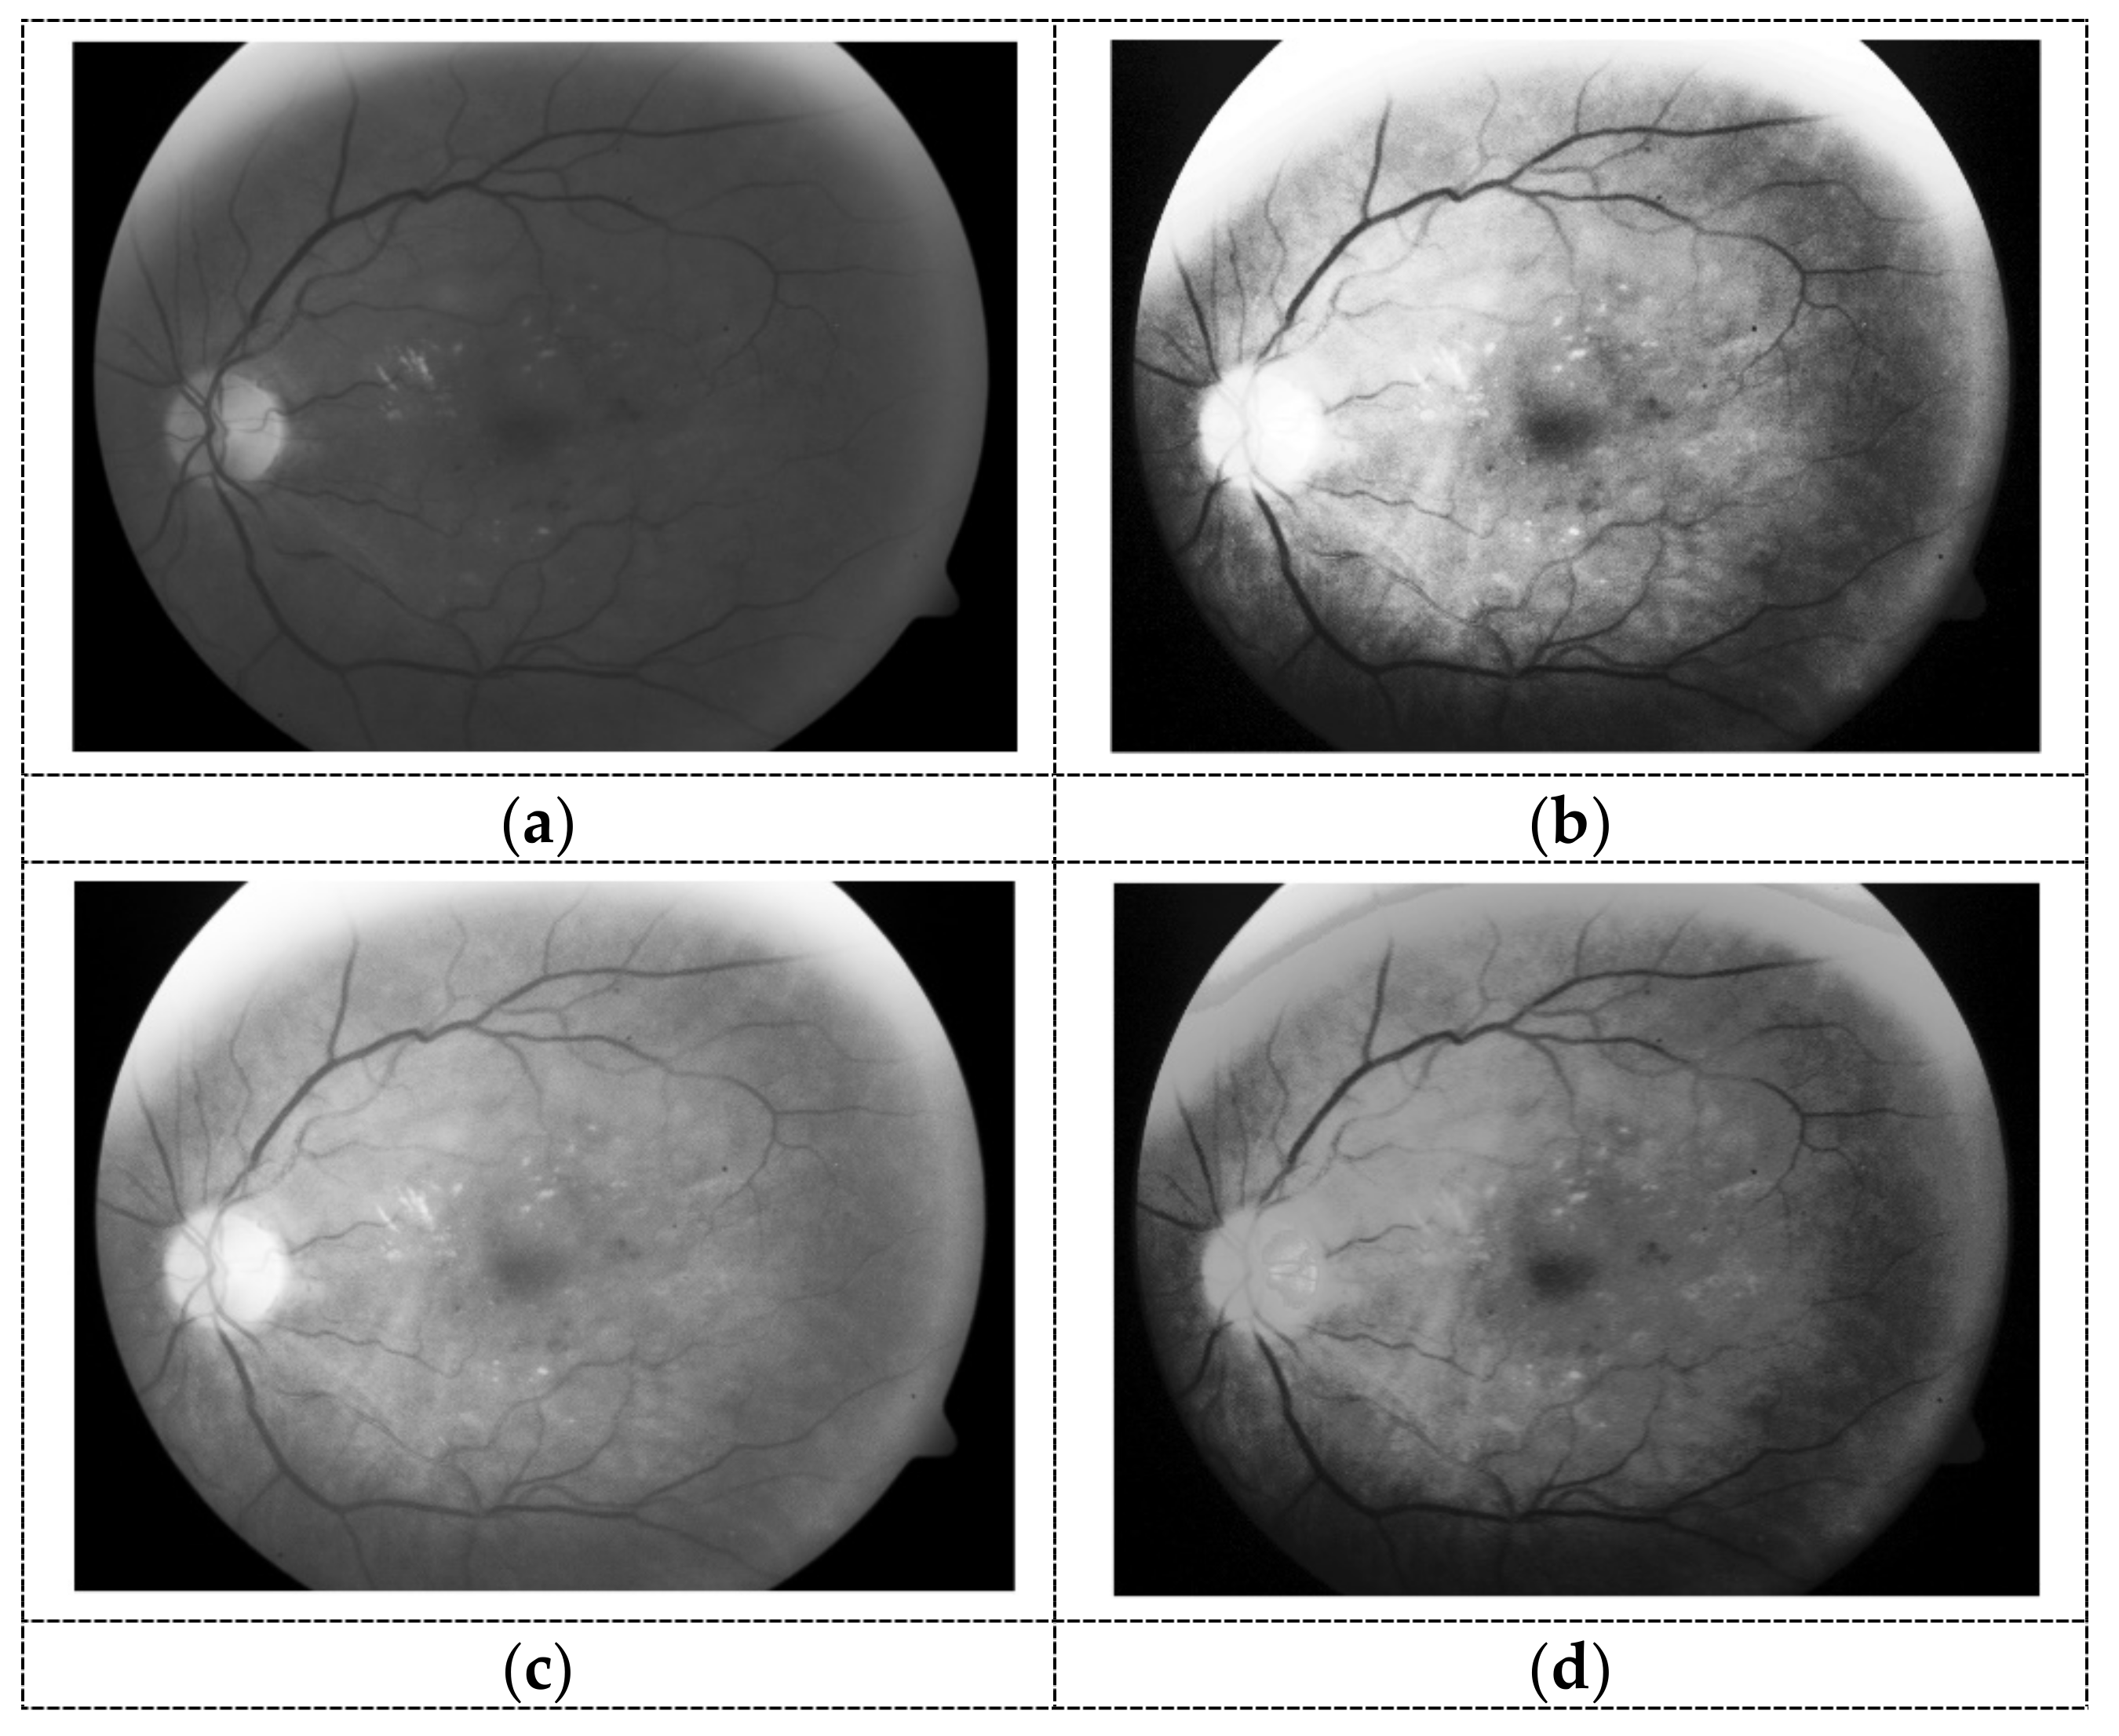
In the past decades, eye examinations were performed sequentially. The best-corrected vision is first located, and then a slit-lamp microscope obtains the pressure of the eye. Next, the ophthalmoscopy is used to judge the entire retinal (macular area, retinal periphery, and ora Serrata). This procedure requires the judgment of an experienced ophthalmologist [7]. Recently, refined techniques such as digital retinal imaging, fundus photographs, and fluorescein angiography are popular methods to perform retinal examination [8]. However, this does not replace the primary examination of the eye. The new modalities advance the field of ophthalmology; hence they act as the second interpreter for the ophthalmologist to make findings plausible. Regular eye examination reduces the risk of permanent vision loss and alerts many people of serious health problems (such as high blood pressure, high cholesterol, diabetes, and cancer). Retinal imaging produces a clearer view into the eye for the doctor to see any early signs of health conditions [9]. Despite the numerous advantages associated with retinal imaging, they are often blurry, poorly illuminated, and have a narrow field of view. The characteristics of the hemorrhages are similar to some of the dark regions caused by lighting conditions and the blood vessels; hence segmenting hemorrhages in retinal images becomes difficult. Figure 1 is an example of retinal images.
The problems of retinal images necessitated an algorithm that can segment hemorrhages efficiently and accurately. The proposed algorithm first enhances the contrast of the fundus image with the adaptive histogram equalization. Then the edge information manipulates the intensity transformation adaptively to make the hemorrhage appear more prominently. Next, a fuzzy-logic-based filter is used to sharpen the images. Finally, the candidate image is extracted, segmented, and classified. The major contributions of this paper are summarized as follows:
- A method to overcome the problem of blurriness and to distinguish hemorrhages from the blood vessels;
- A preprocessing and candidate extraction method for hemorrhage detection;
- A smart window-based feature extraction procedure for segmentation of hemorrhages.
Related Work
Several methods [10,11,12,13,14,15,16,17,18,19,20,21,22] were proposed in the literature for retinal image segmentation. Reference [10] provides a detailed review of retinal blood vessel segmentation. Several empirical and machine learning-based image processing approaches were employed for hemorrhage segmentation. Reference [13] is a survey of recent developments in automatic detection of DR. References [14,15,16] used the k-Nearest neighbor algorithm to cluster lesions in fundus images. Kande et al. [17] and García et al. [18] used a support vector machine to categorize the performance prowess of different classifiers. Although these methods produce good results, they evaluated their output based on lesion and image.
Huang et al. [11] used a convolutional neural network (CNN) for hemorrhage segmentation. This method preprocesses, trains, refines the data, and finally segments with CNN. The technique consists of the coarsely annotated bounding box for each hemorrhage. The box size is increased at random and accompanied by hemorrhage. Next, a refining network is used to capture the data from the bounding box procedure. Finally, CNN is applied for the automatic detection of hemorrhages. Although this method gives accurate results, they require a large amount of training data for effective segmentation. Rani et al. [12] combined edge detection, morphology, and connected components for the segmentation of blood vessels and hemorrhages. This method involves segmentation and classification stages. In the segmentation stage, blood vessels and lesions are extracted from the fundus image, and then the local binary features are extracted. Finally, the Naïve Bayesian classifier is used to discriminate between hemorrhage and non-hemorrhage. This method may produce a high false-positive rate (common to edge segmentation approaches). Arun et al. [20] segmented hemorrhages using the splat feature. First, the images are segmented into different partitions (called splats). Then the watershed algorithm is used to extract boundaries. Next, pixels are grouped by an irregular grid algorithm and are estimated with boundaries from the magnitude of the gradient. Srivastava et al. [21] used a Frangi-based filter for red lesion detection in retinal fundus images, while Mohamed et al. [22] used mathematical morphology to detect non-proliferative diabetic retinopathy.
Most of these studies evaluate their output based on lesion or image. Output evaluation by image count the number of lesion or image and then find the sensitivity or specificity of the output. This paper proposes a different output evaluation method. Unlike the several existing literature, we evaluate output based on the pixel. It is believed that output evaluation using pixels instead of lesion/images provides a clearer assessment when detecting retinal images [19]. Our method detects hemorrhages (NPDR or PDR) from retinal fundus images.
Furthermore, previous algorithms perform segmentation of non-hemorrhage candidate regions based on estimations of morphology or connected component analysis. They reduce the false-positive rate with the formation of hemorrhages using the concepts of any irregular shape. The proposed method, unlike previous methods, considers all candidates for analysis and detection.
2. Materials and Methods
2.1. Dataset Setup
The proposed method was tested with two datasets (DIARETDB0 and DIARETDB1). The first dataset has 130 retinal fundus images, 110 images contain the signs of DR, and 20 normal images [23]. The second dataset has 89 fundus images, with 84 of these images having mild non-proliferative signs and 5 normal images [24]. The images in both datasets have the dimension of 1152 × 1500 pixels and a 50-degree field of view digital fundus camera with various imaging settings.
2.2. Methodology
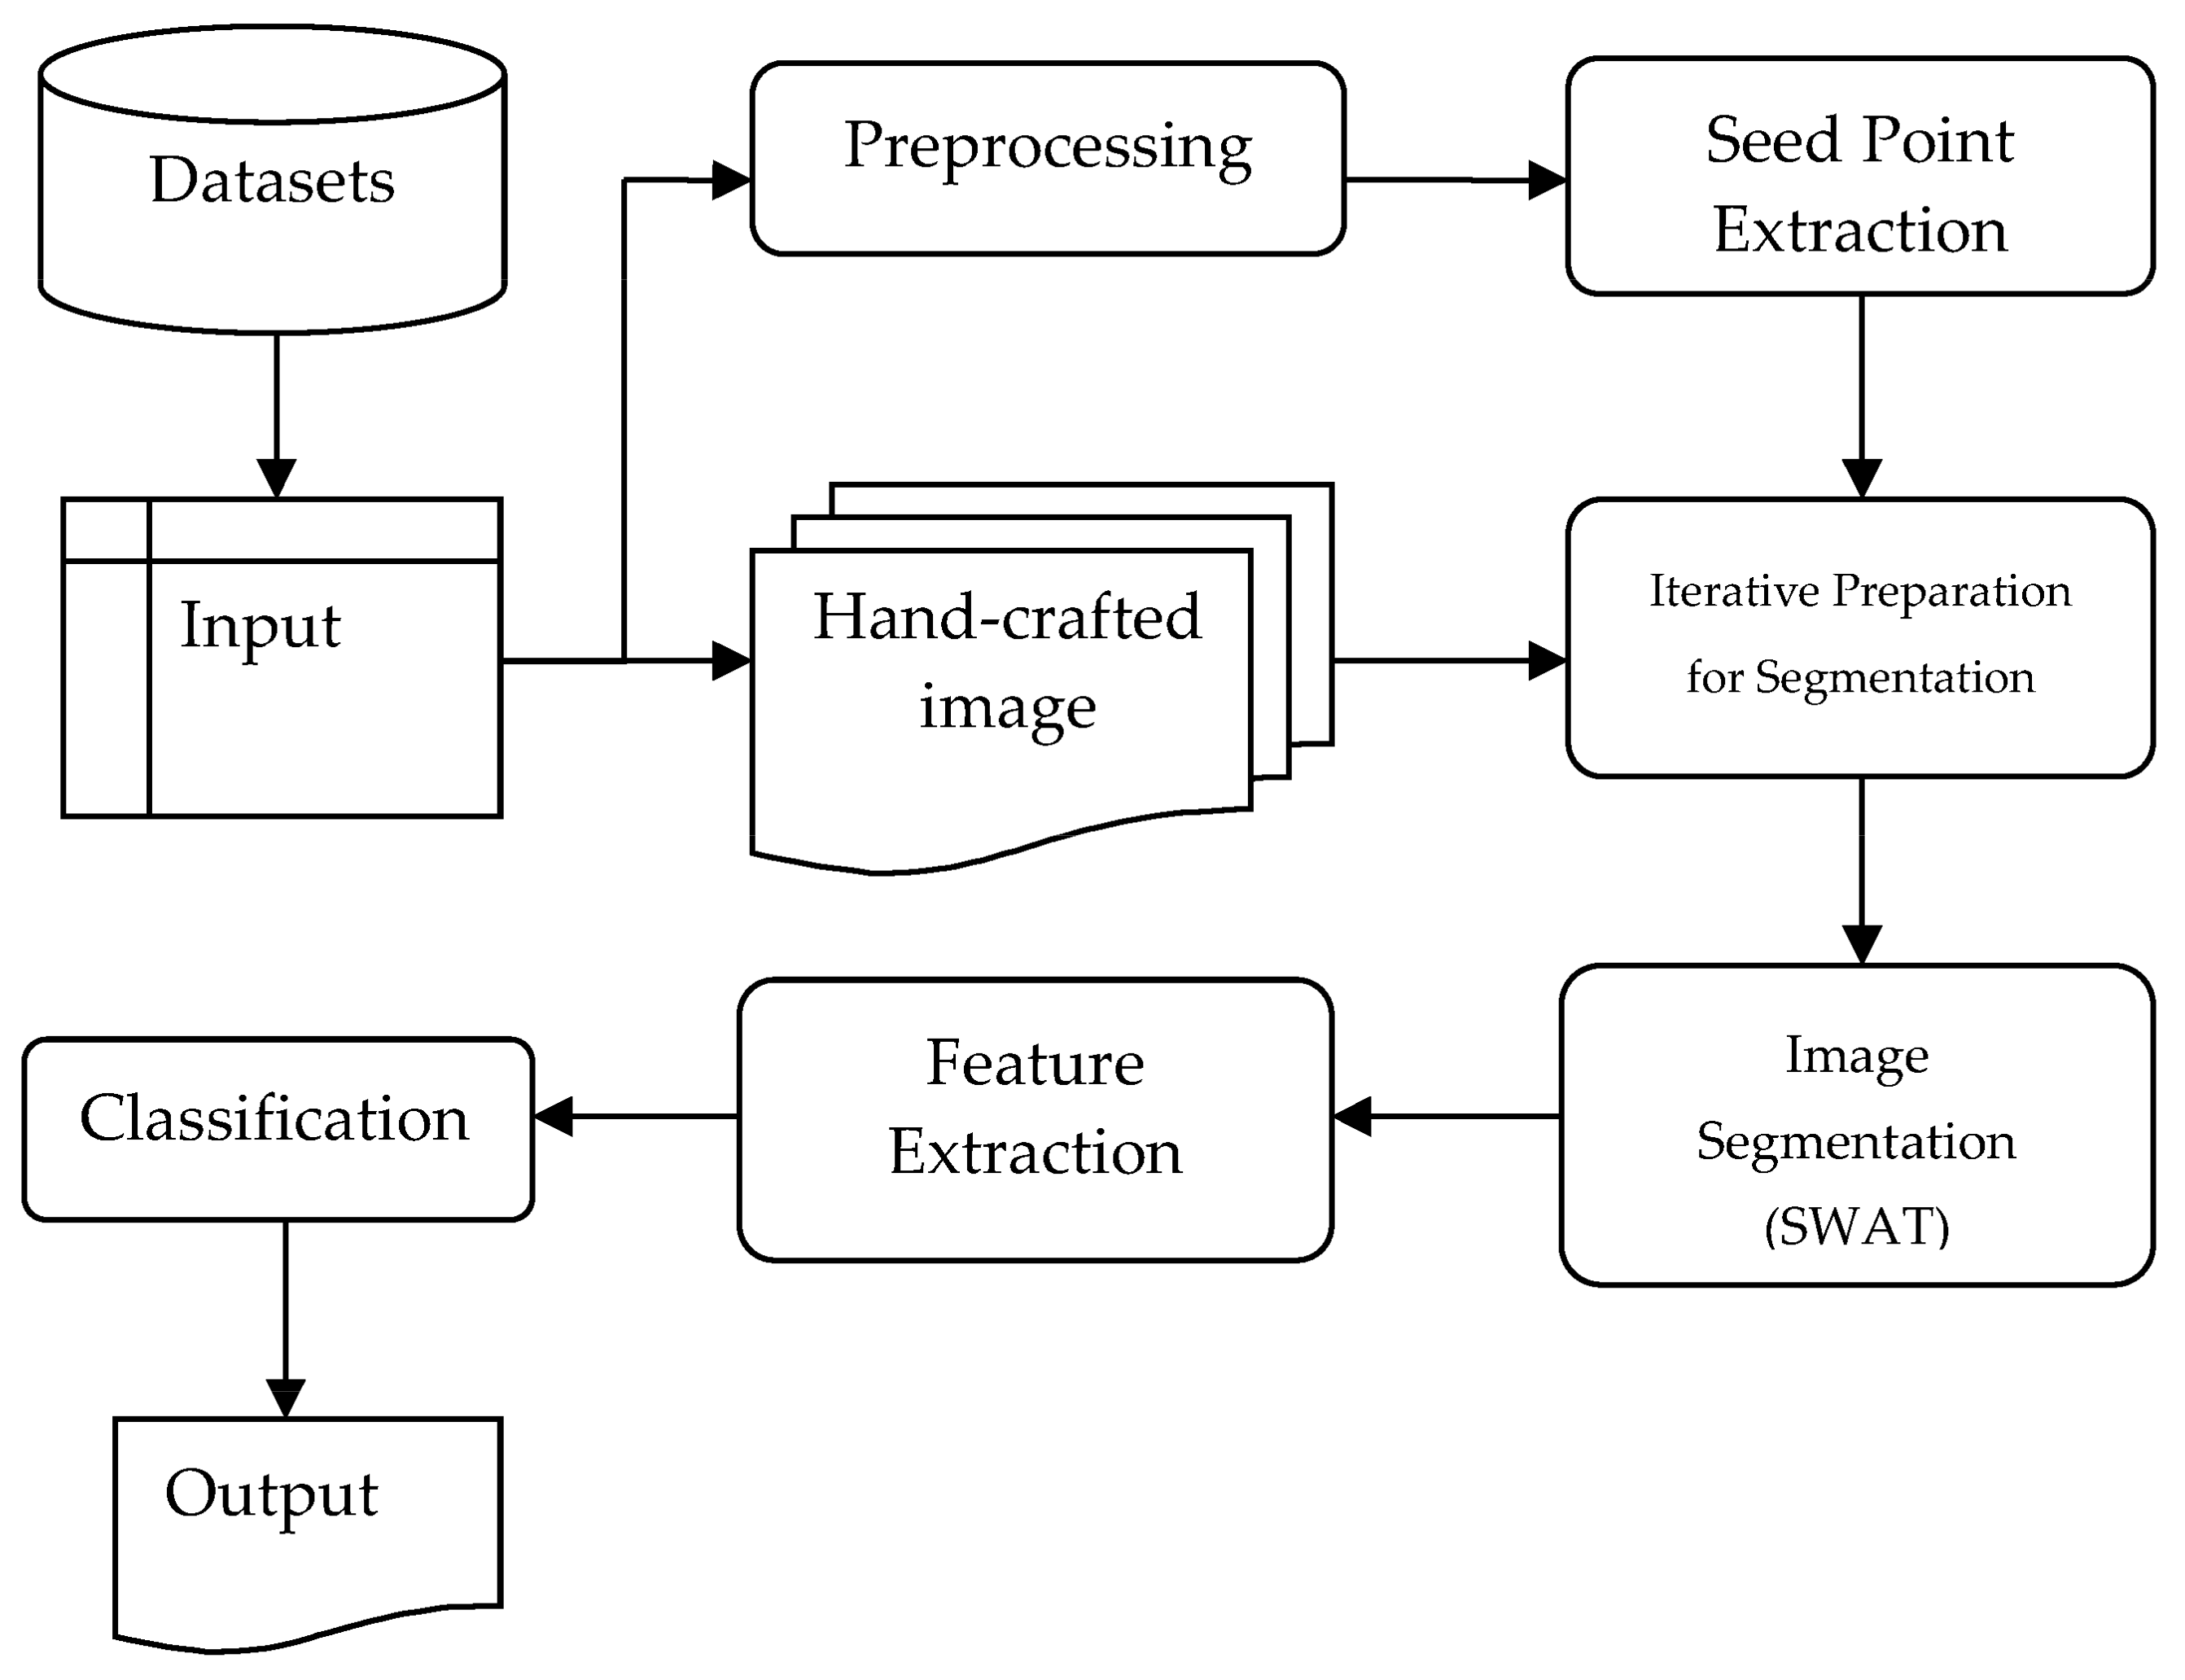
The proposed method involves three stages: preprocessing, segmentation, feature extraction, and classification. Figure 2 is the block diagram depicting various steps of the proposed method.
2.2.1. Preprocessing Stage
Some retinal images have lower quality because the images are taken under different lighting conditions. The common characteristics of images include: (1) exposure to external light ruins some regions close to the rim; (2) the edges of the hemorrhage are blurry, and the contrast is low. Therefore, we preprocess retinal fundus images with two approaches: (a) contrast enhancement and image brightness and (b) image sharpening. These approaches will be discussed subsequently.
Brightness and Contrast Enhancement
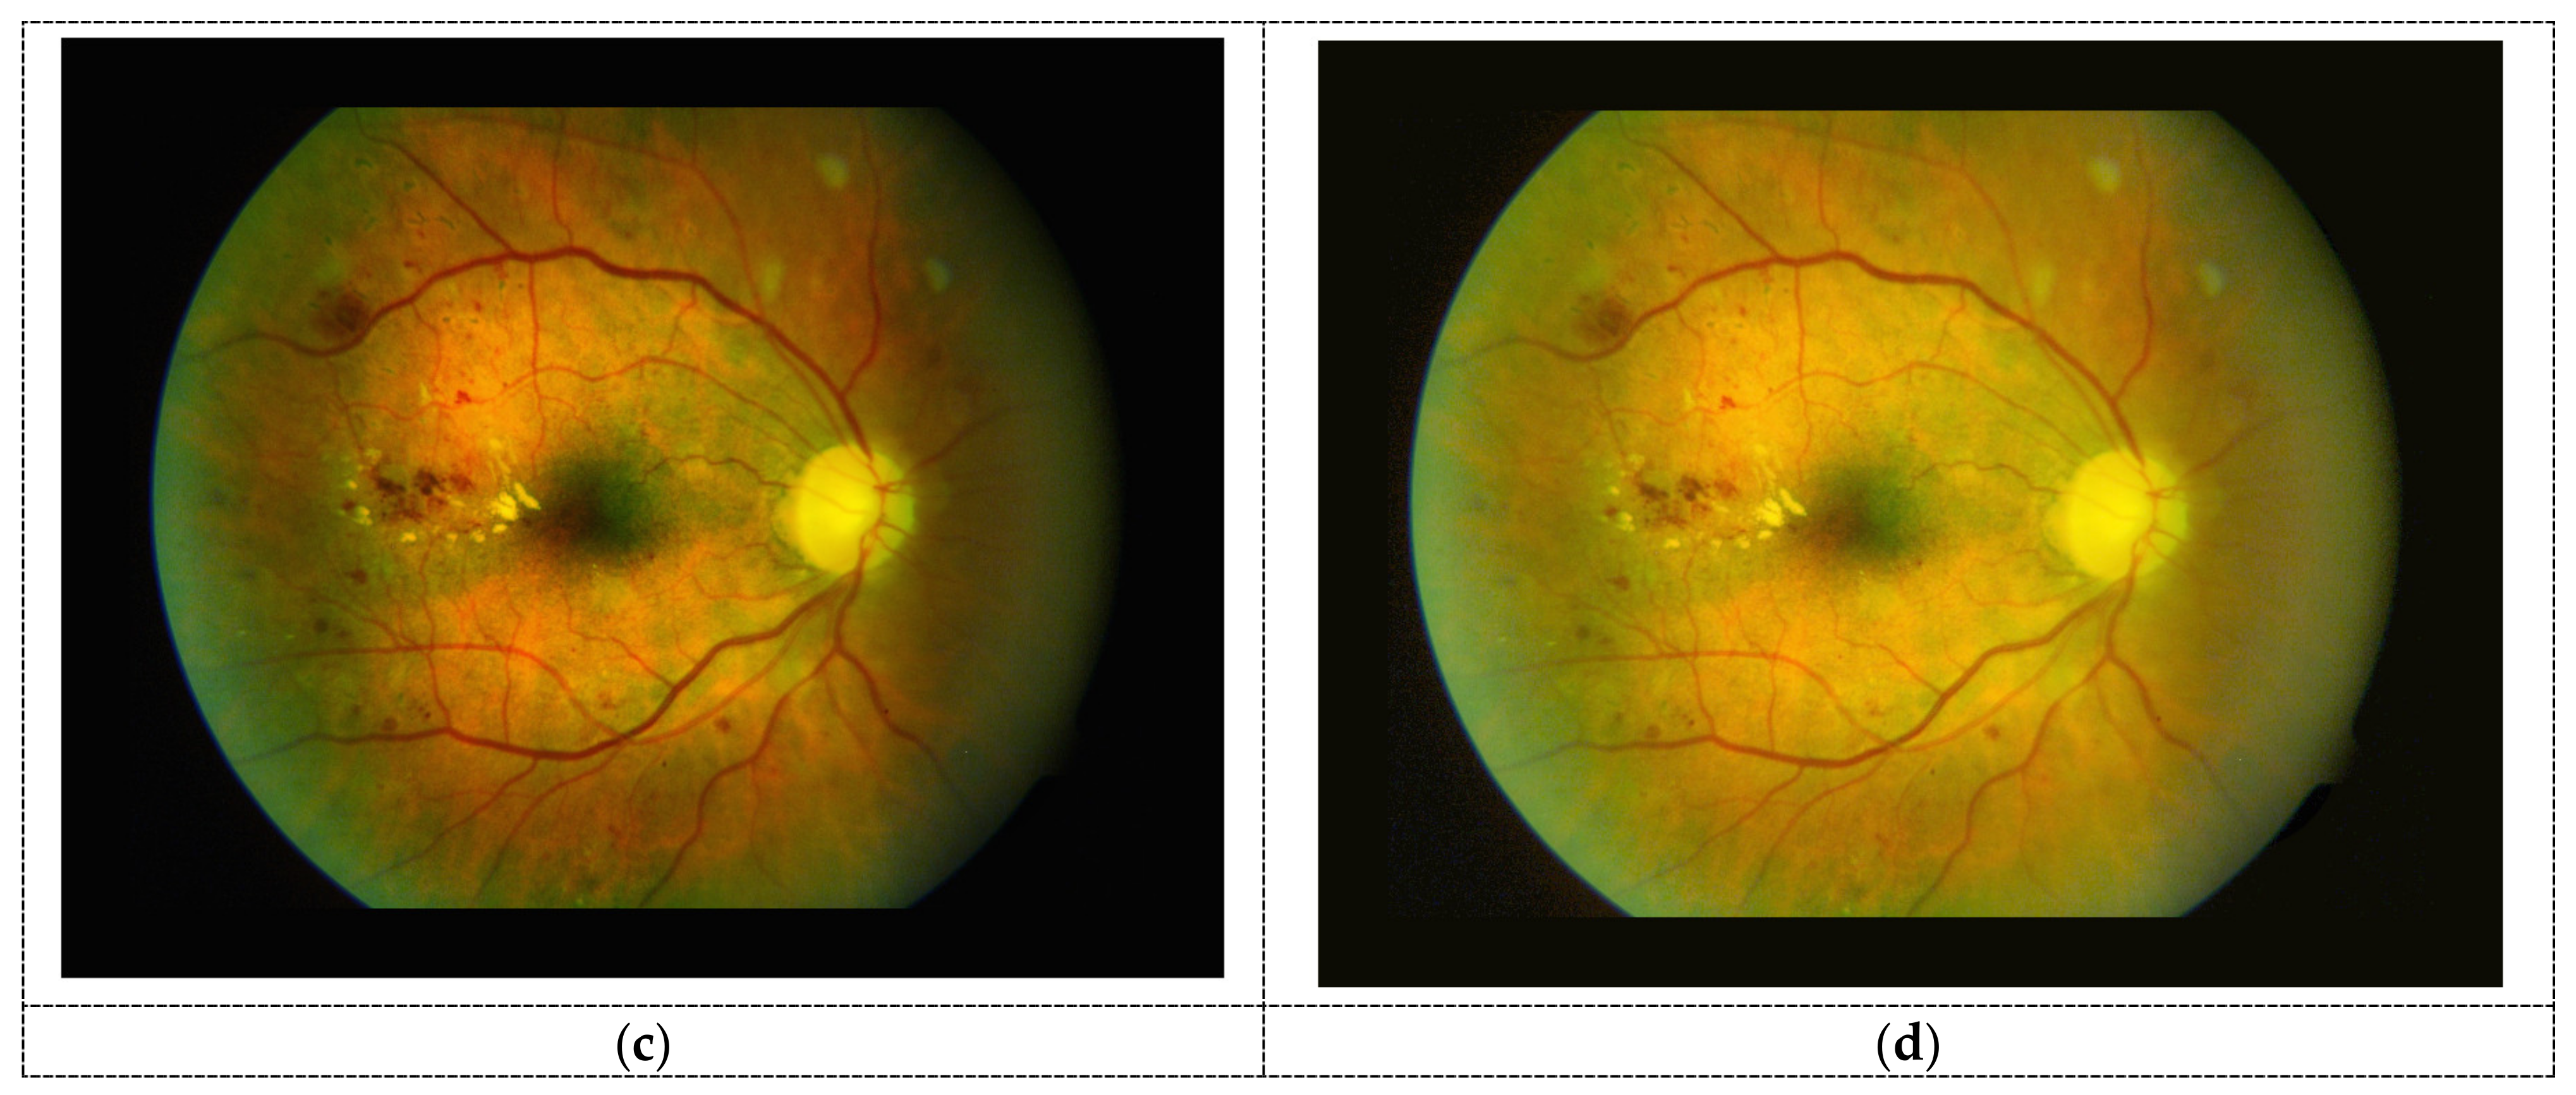
To increase the contrast of color channels, contrast-limited adaptive histogram equalization (CLAHE) [25] is used. A sample of enhanced images is depicted in Figure 3c. Image brightness is adjusted using an adaptive gamma correction technique [26,27]. Gamma correction method is obtained by using adaptive parameter [28]. The conventional transform-based gamma correction is given by:
where P and is the maximum gray-value of the image, is the correct parameter. Reference [26] obtained the gamma value based on an improved cumulative density function (CDF). The improved CDF produced a good result; however, images are over-enhanced (which may result in loss of vital information). The gamma in the range is used to brighten the dark regions. To create an adjustment that can withstand low light images, we obtain gamma value using Sobel operator given by:
where and are gradient in x and y directions. The gamma value is applied to the individual color channel, as shown in Figure 3. The graph in Figure 3b explains the brightness correction for different values of gamma.
Image Sharpening
The experiment suggests that images in the green channel provide better quality for the retinal component; hence images in the green channel are adopted for this study [29]. Image sharpening is the inverse method of image blurriness. The blurred image does not contain meaningful texture and edge information, thus show low quality. The purpose of image sharpening is to make objects clear. Linear image sharpening techniques are proven adequate for many applications, but they are more susceptible to noise. The non-linear techniques preserve the edges and image information efficiently.
This research used fuzzy logic-based non-linear unsharp masking [30] to refine the blurriness of fundus photographs. The benefit of adopting fuzzy logic is to enhance the edges and sharpen the smooth areas. In addition, it can better deal with noise by controlling the parameter due to the physical randomness of the image acquisition system. The method computes the fuzzy relationship between the intensities of the focused pixel and its neighbor in a moving window (W) of size 3 × 3.
For each pixel in image , the intensity value obtained in Equation (4) is adjusted linearly with a high pass filter , defined as follows:
where is a constant, and
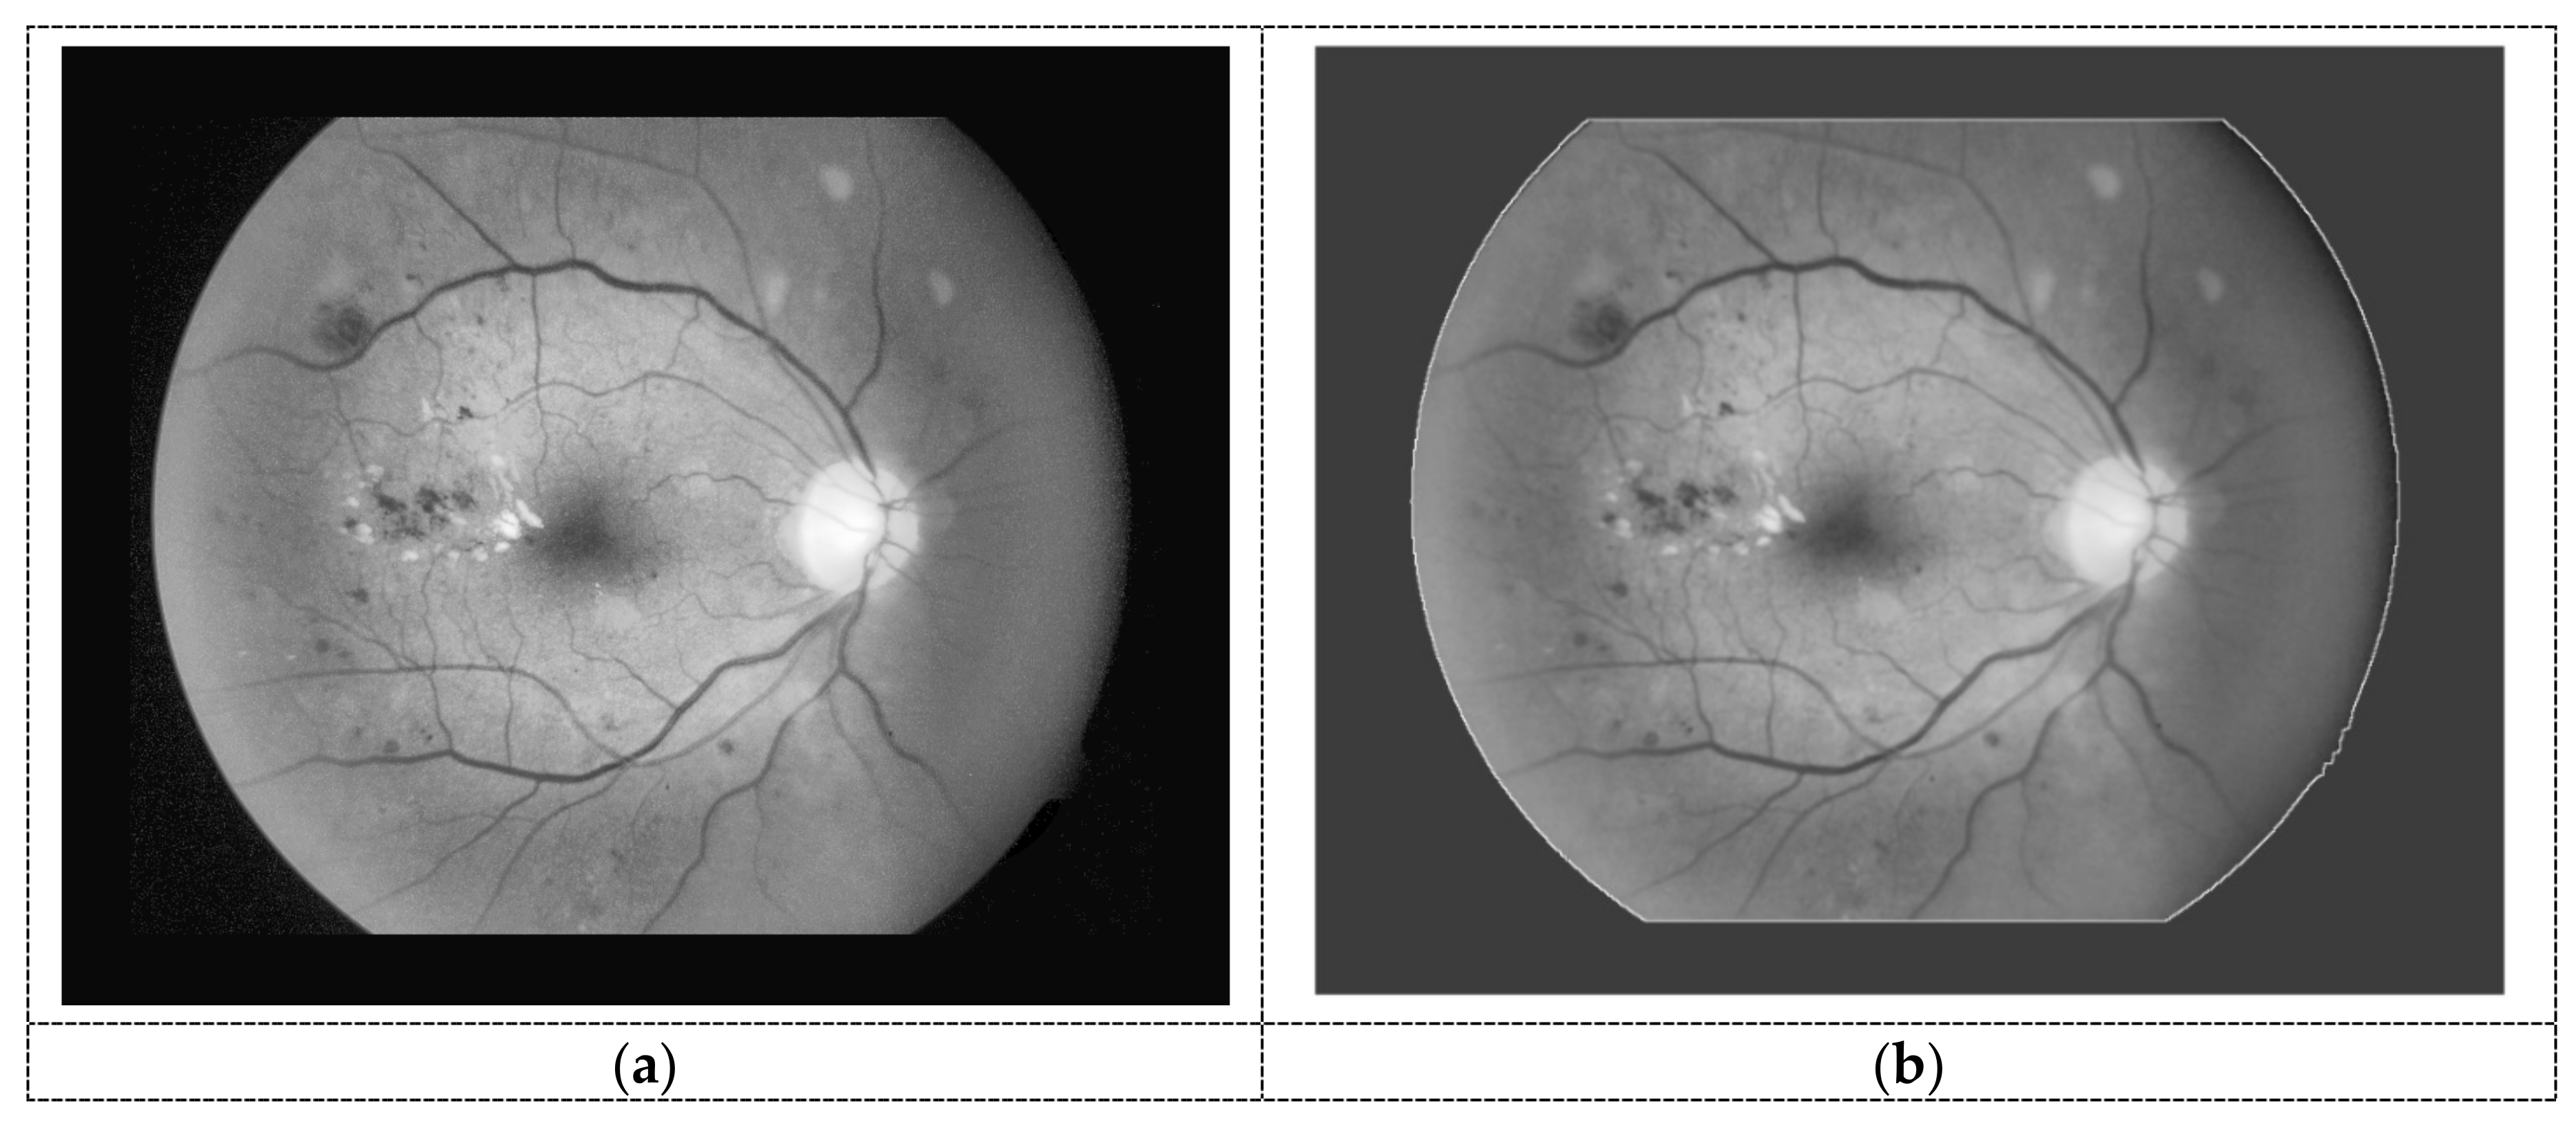
is the parameterized membership function that analyzes the intensity difference between two pixels, is the output of the pseudo-high-pass filter, is a set of neighboring pixel N around , and a, b, c are parameters. In this work, the parameter function classifies the intensity difference into four levels through parameters and . The intensity difference in the range is considered noise that does not contribute to the membership function. The difference in the range yields the strong sharpening effect to highlight image details. The sharpening effect is limited when the difference follows the range . Previous experiments suggested that when the values and are set to 2, 5, and 50, respectively, they provide effective results. Therefore, we set the values of and to 2, 10, and 50, respectively, and is set to 1.5. A sample of image sharpening is depicted in Figure 4a.
2.2.2. Segmentation Stage
Image segmentation of objects and patterns has become the hallmark of digital image processing. Obtaining good performance for many segmentation tasks is a great challenge. In this paper, we adopt three procedures to segment fundus images. They include hand-crafted procedures, seed points of candidates, and the SWAT. These procedures are discussed in subsequent subsections.
Hand-Crafted Image
A common procedure to achieve good accuracy for segmentation tasks is to extract the region of interest (ROI) before segmentation. The black background is unnecessary because the hemorrhages appear at the vitreous humour of the retina. The background is illuminated to reduce the search space and achieves automation. This retinal mask is constructed by binarizing the median filter applied on the green channel of the image. The eroded mask is subtracted from the retinal mask to obtain the boundary of the retina. The image with illuminated background (Figure 4b) is used for feature extraction in subsequent steps.
Seed Points of the Hemorrhage Candidates
To extract the seed points, the Gray Level Co-Occurrence Matrix (GLCM) based local cross-entropy thresholding [29] eliminates the low response of the matched filter [31]. Then, the morphological operation isolates the objects from the blood vessels, thereby producing the seed points.
Blood vessels and hemorrhages share intensity information because of their similar appearance (they look darker in comparison with the surrounded regions). Their edges are sharp when compared with other retinal structures. These features are useful for creating a matched filter that enhances the edges of the retinal structures (for details about matched filters, see [32]). The method proposed by Fangyan et al. [29] excellently suppresses the weak response of the matched filter. Sample results of matched filter and GLCM based local cross-entropy are shown in Figure 5a,b.
We use mathematical morphology to analyze spatial structures. The morphological opening, erosion followed by dilation, is used to eliminate redundant objects and to break retinal structures larger than the structuring element. The size of the structuring element used in this experiment is . A sample result of morphology operation is shown in Figure 5c. The output points acted as seed/initial points for the automatic segmentation of hemorrhages.
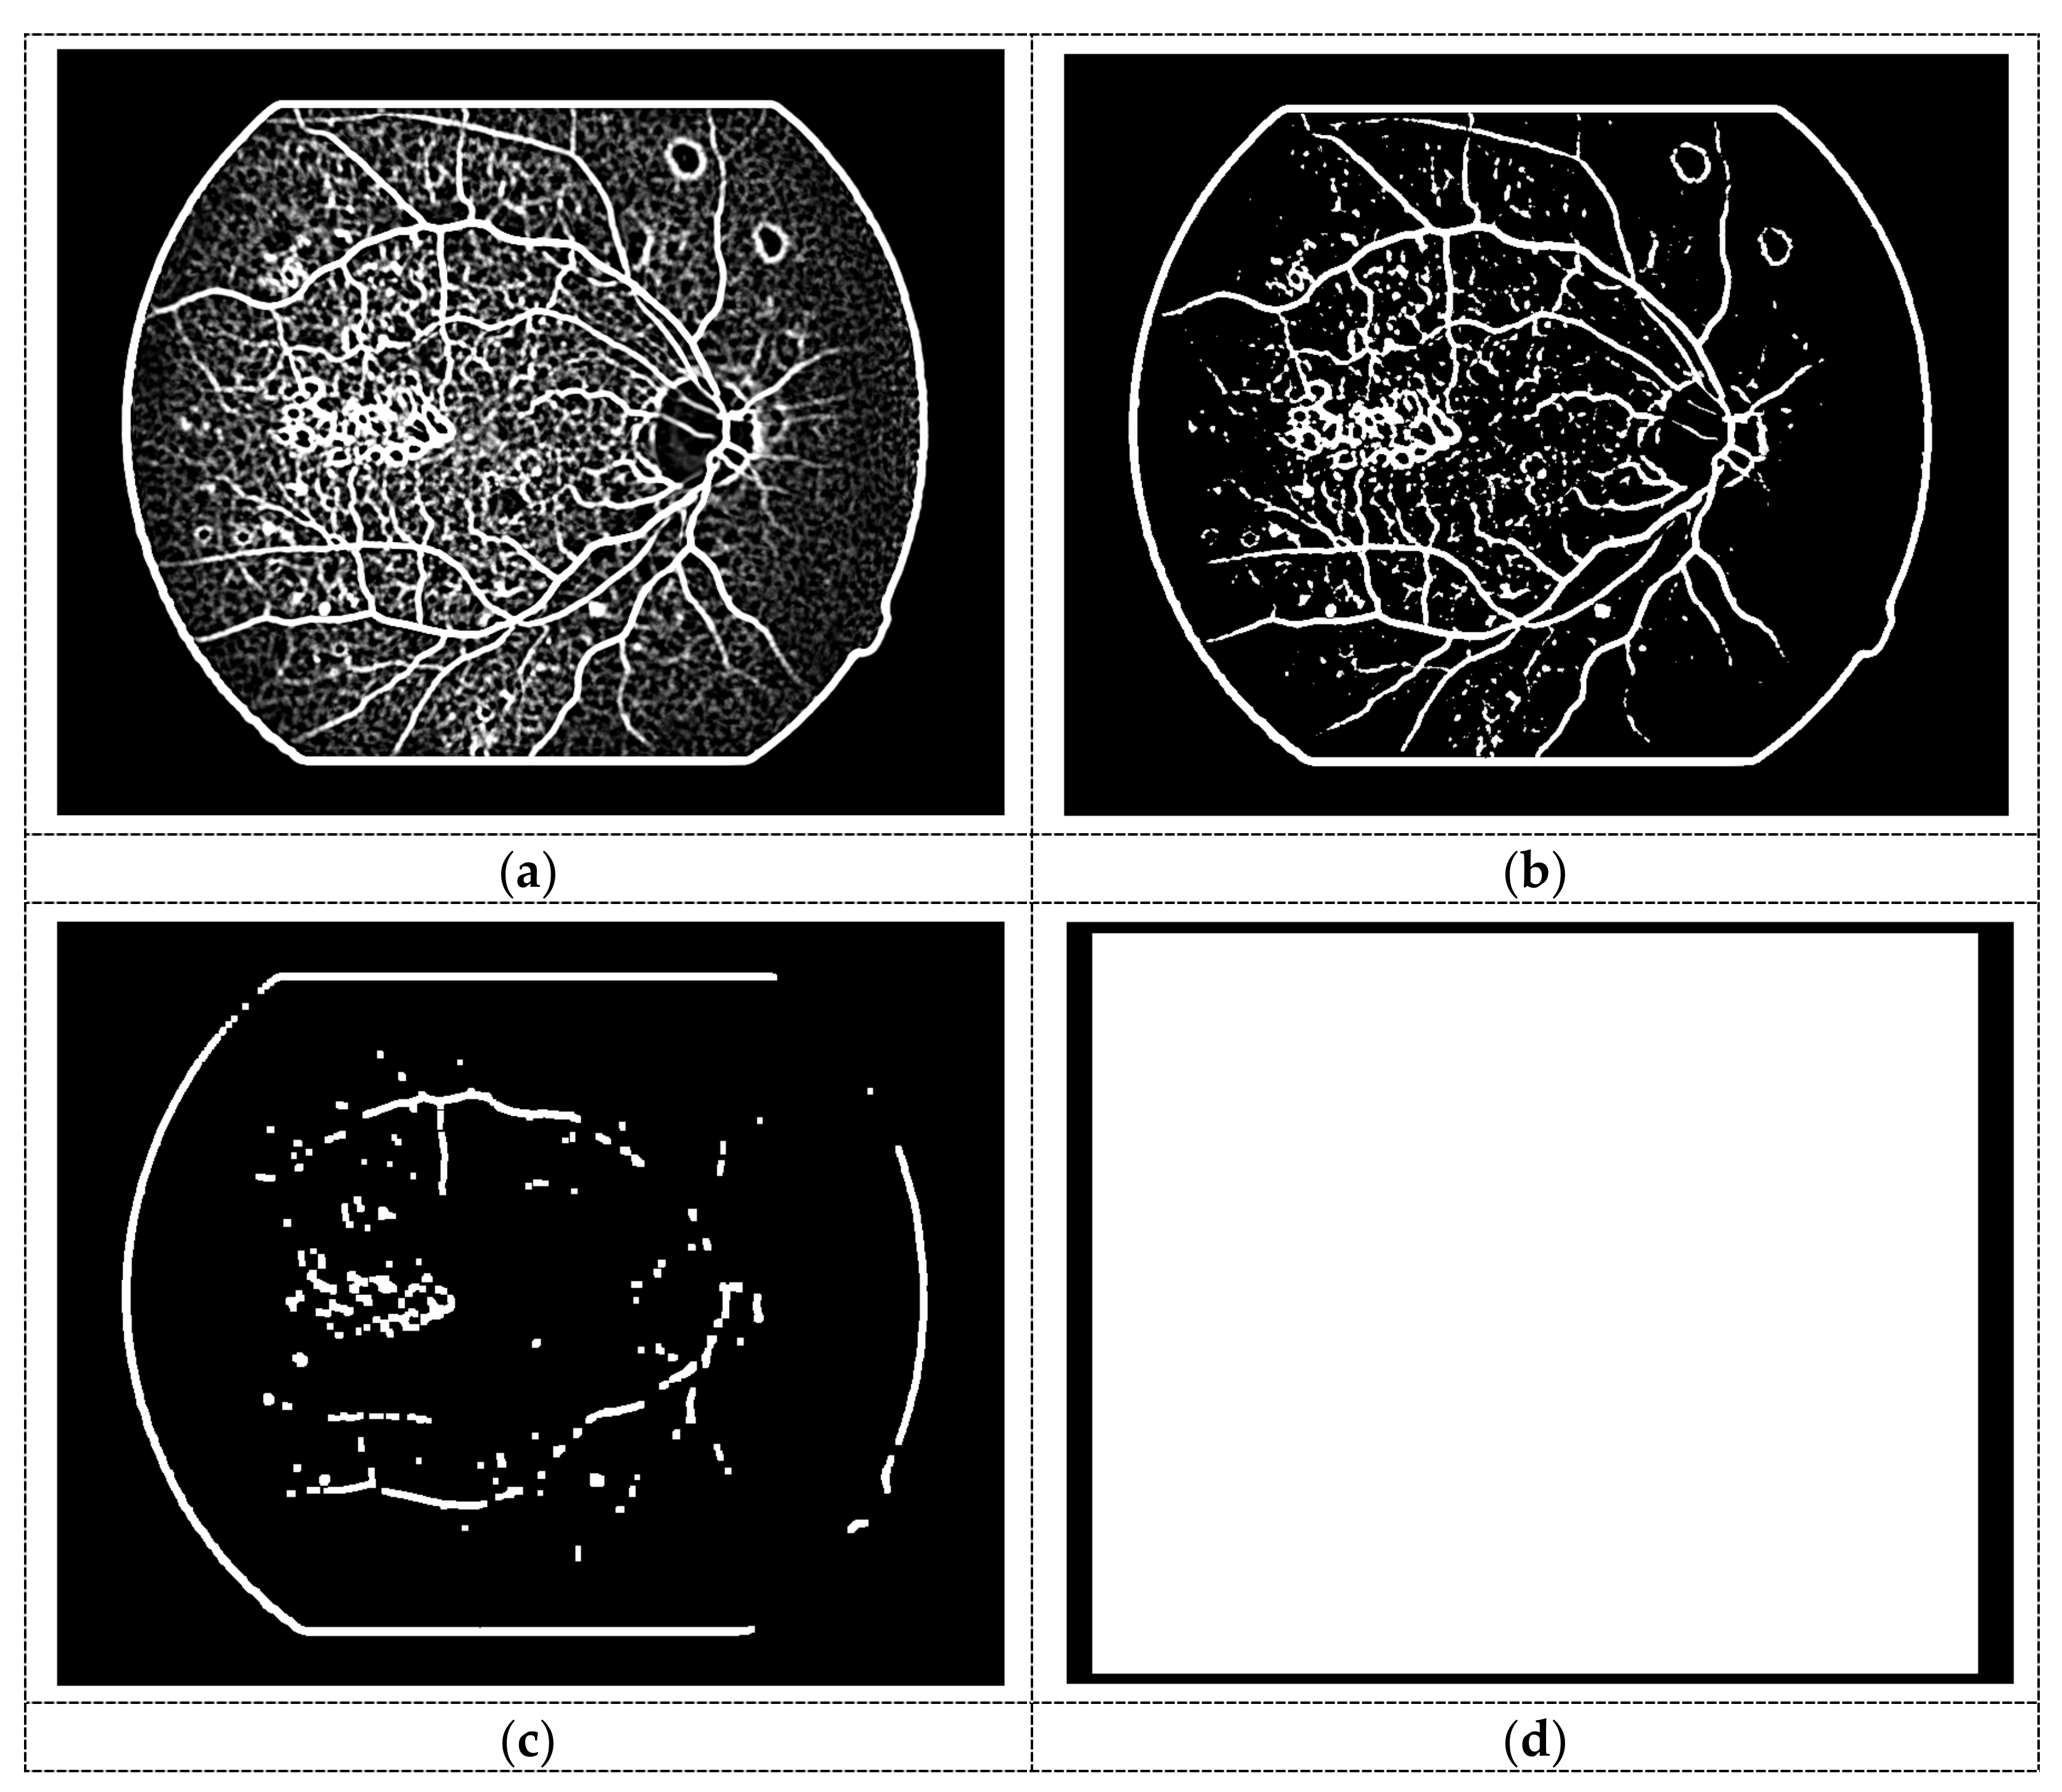
Smart Window-Based Adaptive Thresholding for Segmentation (SWAT)
The major faction of segmentation algorithms is to locate the precise contour of an object. This task becomes easy when the region to be segmented is simplified. There should be a significant dissimilarity between surrounded regions and objects. Since hemorrhages share intensity information with other retinal structures and can be located anywhere in the retinal region, a novel smart window-based adaptive thresholding (SWAT) is proposed to segment hemorrhages.
Hemorrhage inhibiting at the rim of the retina sometimes blends with a darkish background. Detecting hemorrhage that belongs to this category is a challenging task. The proposed segmentation method (SWAT algorithm) is automated with the help of a bounding box of the retinal mask (binary mask is achieved in the previous section). Then the bounding box is stretched 80 pixels wide towards each direction to achieve a sufficient search space for hemorrhage segmentation (see Figure 5d). The white portion of the image corresponds to the search region and is surrounded by the black region. In addition, we segment those hemorrhages that are attached to blood vessels. The segmentation of such hemorrhages is complicated due to the homogeneity between the two retinal structures. This problem is resolved by using the effectiveness value method. The higher the effectiveness value yields, the higher the degree of segmentation from its surroundings. The appropriate selection of threshold levels imparts maximum value of effectiveness that could better segment the retinal structures from each other.
The SWAT initiates the segmentation process from the seed points that emerge from the blood vessels and hemorrhages. A seed is used to estimate retinal structures from the hand-crafted image (Figure 5c). The SWAT originates from each seed to capture the hemorrhages in the window. The window size increases after every iteration.
Otsu’s method [33] finds the threshold value successively and maximizes the inter-region variance using an image histogram. This method utilizes the complete gray range and chooses the best range that provides maximum inter-region variance. The normalized histogram of an image is given by:
where is the frequency of intensity occurring in the image. In our experiment, the number of threshold levels tarts from one and goes up to twenty. Optimum threshold value is computed by taking the weighted variance between regions.
where is the total probability, the mean value, and is the weighted variance of the individual region in the total number of regions . The threshold levels split the image into regions. For instance, if is equal to one and the threshold value is , then the intensities are divided into two regions as and It can be observed that the mean does not depend upon the threshold value . The effectiveness value is used to control the degree of thresholding. It provides information about how well the threshold value can distinguish the specified region from the rest of the regions in a window. It is computed by:
The proposed SWAT employs the optimum threshold , the effectiveness value , the seed points of the morphological opened image, and the hand-crafted image for segmentation and feature extraction. The search process starts by computing the bounding box from a seed point.
Let the vertices of a bounding box be represented by a vector . The vector is determined by the minimum box that can contain a seed point. The hand-crafted image is cropped using the vector to obtain a window. Let the cropped window become thresholded iteratively using Otsu’s method. To obtain appropriate , the window was thresholded until the iteration stops by using criteria in Equation (11):
where is a vector that comprises threshold levels. The maximum length of the and the number of iterations can be 20. Equation (11) assumes that the intensities of the hemorrhage are lower than the minimum threshold value of the vector , while the rest of them belong to the non-hemorrhage regions. After the selection of , the window is binarized using the minimum threshold of the vector given by:
The conditions in Equation (11) adapt the regional diversity between the hemorrhages and foregrounds. When a bright foreground encompasses hemorrhage, the iterative process approaches the specified effectiveness value ( is equal to 0.8) in fewer iterations and a smaller number of threshold levels. When a dark region surrounds a hemorrhage, it reaches the effectiveness value comparatively in more iterations and threshold levels.
A window can have more than one hemorrhage. Priority is given to hemorrhages with larger areas because they are more important than smaller ones in the diagnostic process. All objects are removed except larger ones. This maneuver is performed so that the dark shade will not mislead the segmentation, and the actual hemorrhage may not be eliminated. This rationale is adopted because a seed point may belong to a hemorrhage as well as to the intensity variations around the dark shades. Furthermore, objects closer to the center of the window are retained because of the higher probability that they are hemorrhages. The probability criterion is proposed because the window emerges from the seed point. The seed point is more likely to belong to a hemorrhage because its intensity profile analogous to the matched filter. The distance between the centers of the window to the object computed using the Euclidean distance is given by:
where denotes the spatial locations of pixels in the object while denotes the y spatial locations of pixels in the object. is part of the set , and is a vector having two distances belong to two different objects. From the vector the object with the longest distance from the center is eliminated. The pixels at the border of the window guarantee either to stop or to keep growing. If the hemorrhage is smaller than the window, then SWAT stops because the pixels are not found at the border of the window. The size of the window increases when it is bigger than the window. This task is accomplished by checking the border pixels of the window. For every instance of iteration, the size of the window is increased by updating the vertices in with the equation below:
Q is a vector that contains the information of border pixels. The binary variables ,, and represent the left, top, right, and bottom border pixels. Once all the variables in Q are 0, then it shows that the SWAT has segmented the object (no further iteration is required to grow the size of the window). Any variable in Q has a value of 1, which represents that the border is not empty, and the object is bigger towards a specific direction. The size of the window is increased, and the hand-crafted image is cropped using an updated vector .
In addition, the white region is characterized as the search region (see Figure 5d). The vector represents the indices of the white region. If the window forms the seed point relevant to dark shade, the window may keep increasing and can go beyond the image range. To achieve the automation, the conditions (Equation (14)) check whether the vertices of the vector are in the search space or not. The segmentation process is implemented iteratively until all conditions are met (conditions: the vertices of vector Q become zero or the vector ).
2.2.3. Feature Extraction
In our problem, features are extracted to classify hemorrhages and non-hemorrhages. Shape and geometric features are extracted using connected component analysis [34]. These features are effective to separate hemorrhages from blood vessels. Eleven shape features (area, major axis length, minor axis length, eccentricity, orientation, convex area, filled area, the equivalent diameter of the circle, solidity, perimeter, and mean intensity) and 20 texture features (autocorrelation, contrast, correlation, cluster prominence, cluster shade, dissimilarity, energy, entropy, homogeneity, maximum probability, sum of squares, sum average, sum variance, sum entropy, difference variance, difference entropy, measurement of correlation 1, information measurement of correlation 2, inverse difference normalized, and inverse difference moment normalized) are extracted.
Furthermore, CIE LAB and HSV color spaces features are used in this research. The CIE LAB isolates the color information in light (L*) and colors (a* and b*) channels while HSV retains the information as hue, saturation, and value [35,36]. Apart from the features mentioned, four hand-crafted features are used. The SWAT can segment the hemorrhages completely; however, some other structures such as blood vessels and dark shades cannot be restricted within the windows. The reason is that the window stops when the vertices of the window go beyond the search region. Hence, the open and closed contour of the object is taken as a feature. Similarly, the blood or liquid at vitreous humour spreads in each direction that yields a shape of hemorrhage with regular and fewer corners as compared to other segmented objects. Therefore, the distance of the spatial locations and the object’s corner from its center is taken as a feature. Similarly, the sum of squares of gray levels at the object’s contour from its mean is used as a feature. The macula of the retinal also has the same intensity profile as hemorrhage, but the edges of the macula are blurrier than hemorrhages. To distinguish hemorrhage from the macula, one feature using Laplacian of Gaussian is extracted. Overall, forty-one (41) features are extracted for classification.
2.2.4. Classification
In machine learning, the support vector machine (SVM) is a statistical learning algorithm for classification and learning problems. SVM maximizes the margin between positive and negative classes by placing a hyperplane into them. A kernel function makes SVM capable of learning adaptively with the help of features. The SVM is used to classify windows between hemorrhages and non-hemorrhages. A radial basis function (RBF) is used as a kernel to classify the two categories. The windows that belong to the hemorrhages are labeled as the positive class. The rest of the windows are the negative class. The features are used to train the SVM and tested for the classification of hemorrhages.
3. Experiment and Result Analysis
3.1. Experiments Setup
The proposed method was developed with a 3.40 GHz, 16 GB RAM computer. Random subsets of images are used as the validation set during training. Segmentation results (region-based pixel-by-pixel) are compared with the ground truths. Metrics such as precision, recall, and F1 score are used to evaluate segmentation methods. In addition, five evaluation parameters are used to analyze the performance of the preprocessing stage: mean squared error (MSE), peak signal to noise ratio (PSNR), information entropy (IE), contrast (C), and combination of PSNR, IE, and C (denoted as S). The equations of the evaluation metrics are given below:
- Precision Rate (P)
- Recall Rate (R)
- F1 Score
- Mean Square Error (MSE)
- Peak signal to noise ratio (PSNR)
- Information Entropy (IE)
- Contrast (C)
- Combination of PSNR, IE, and C (S)
3.2. Segmentation Result
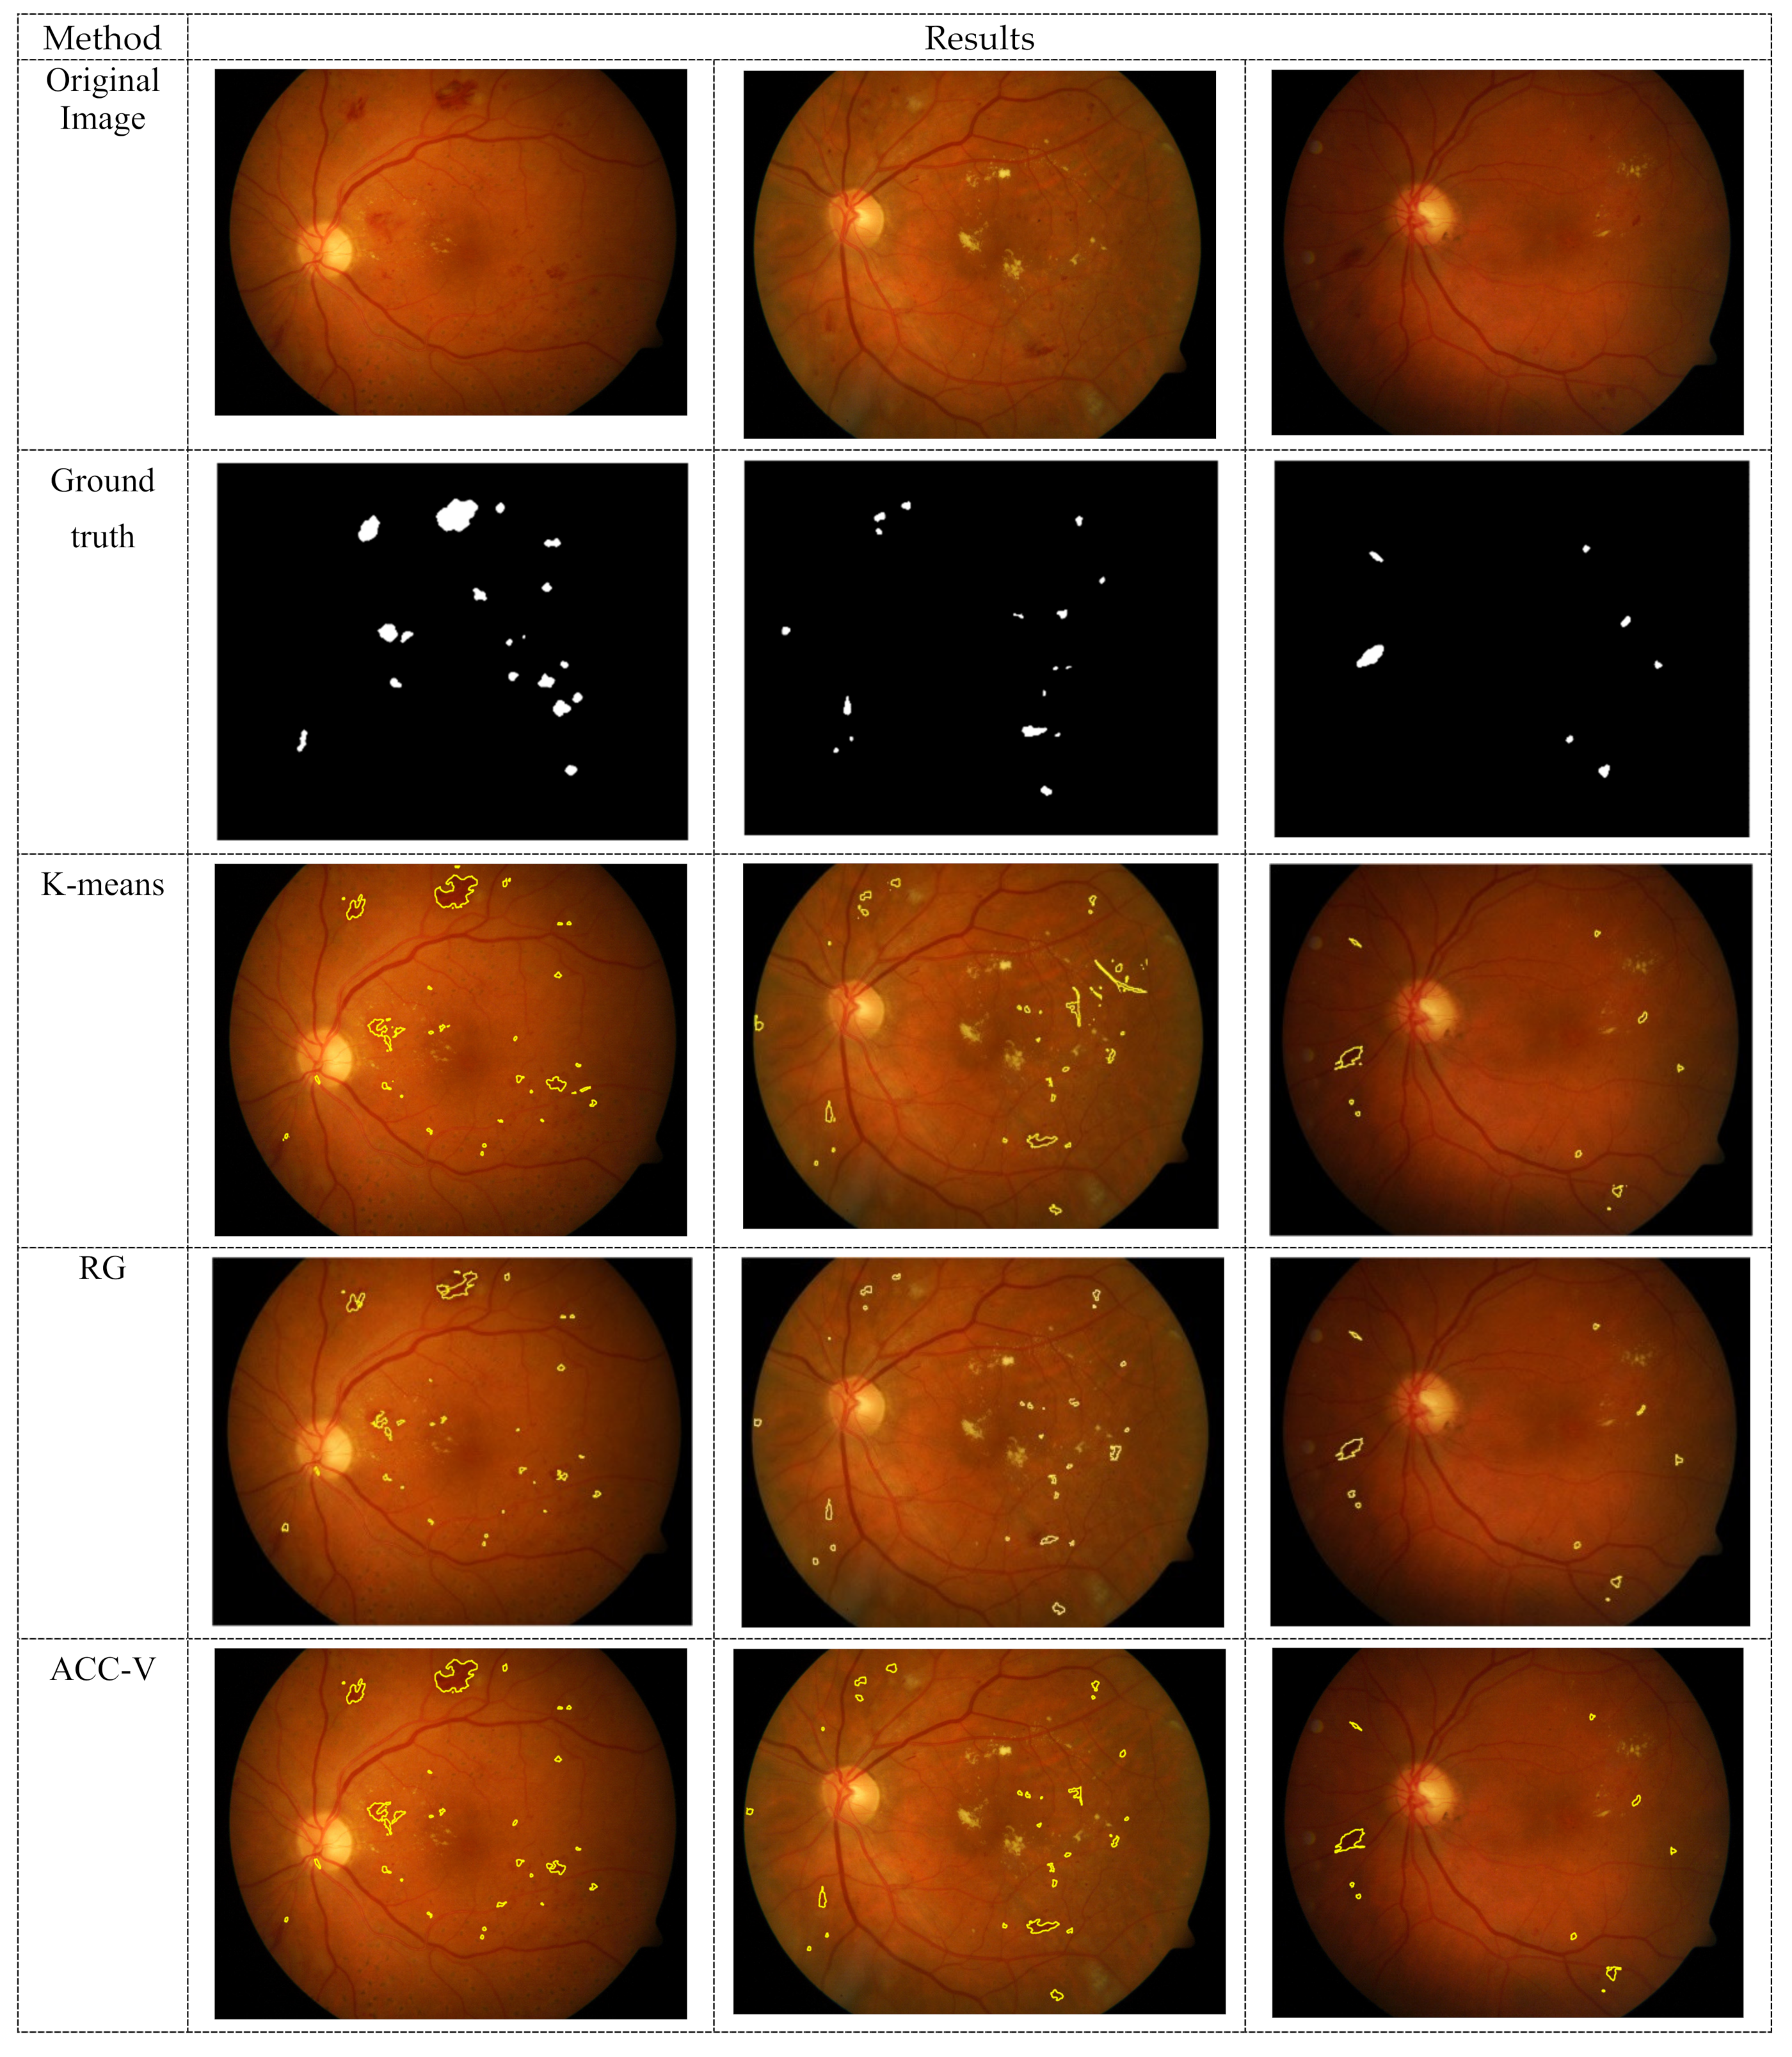
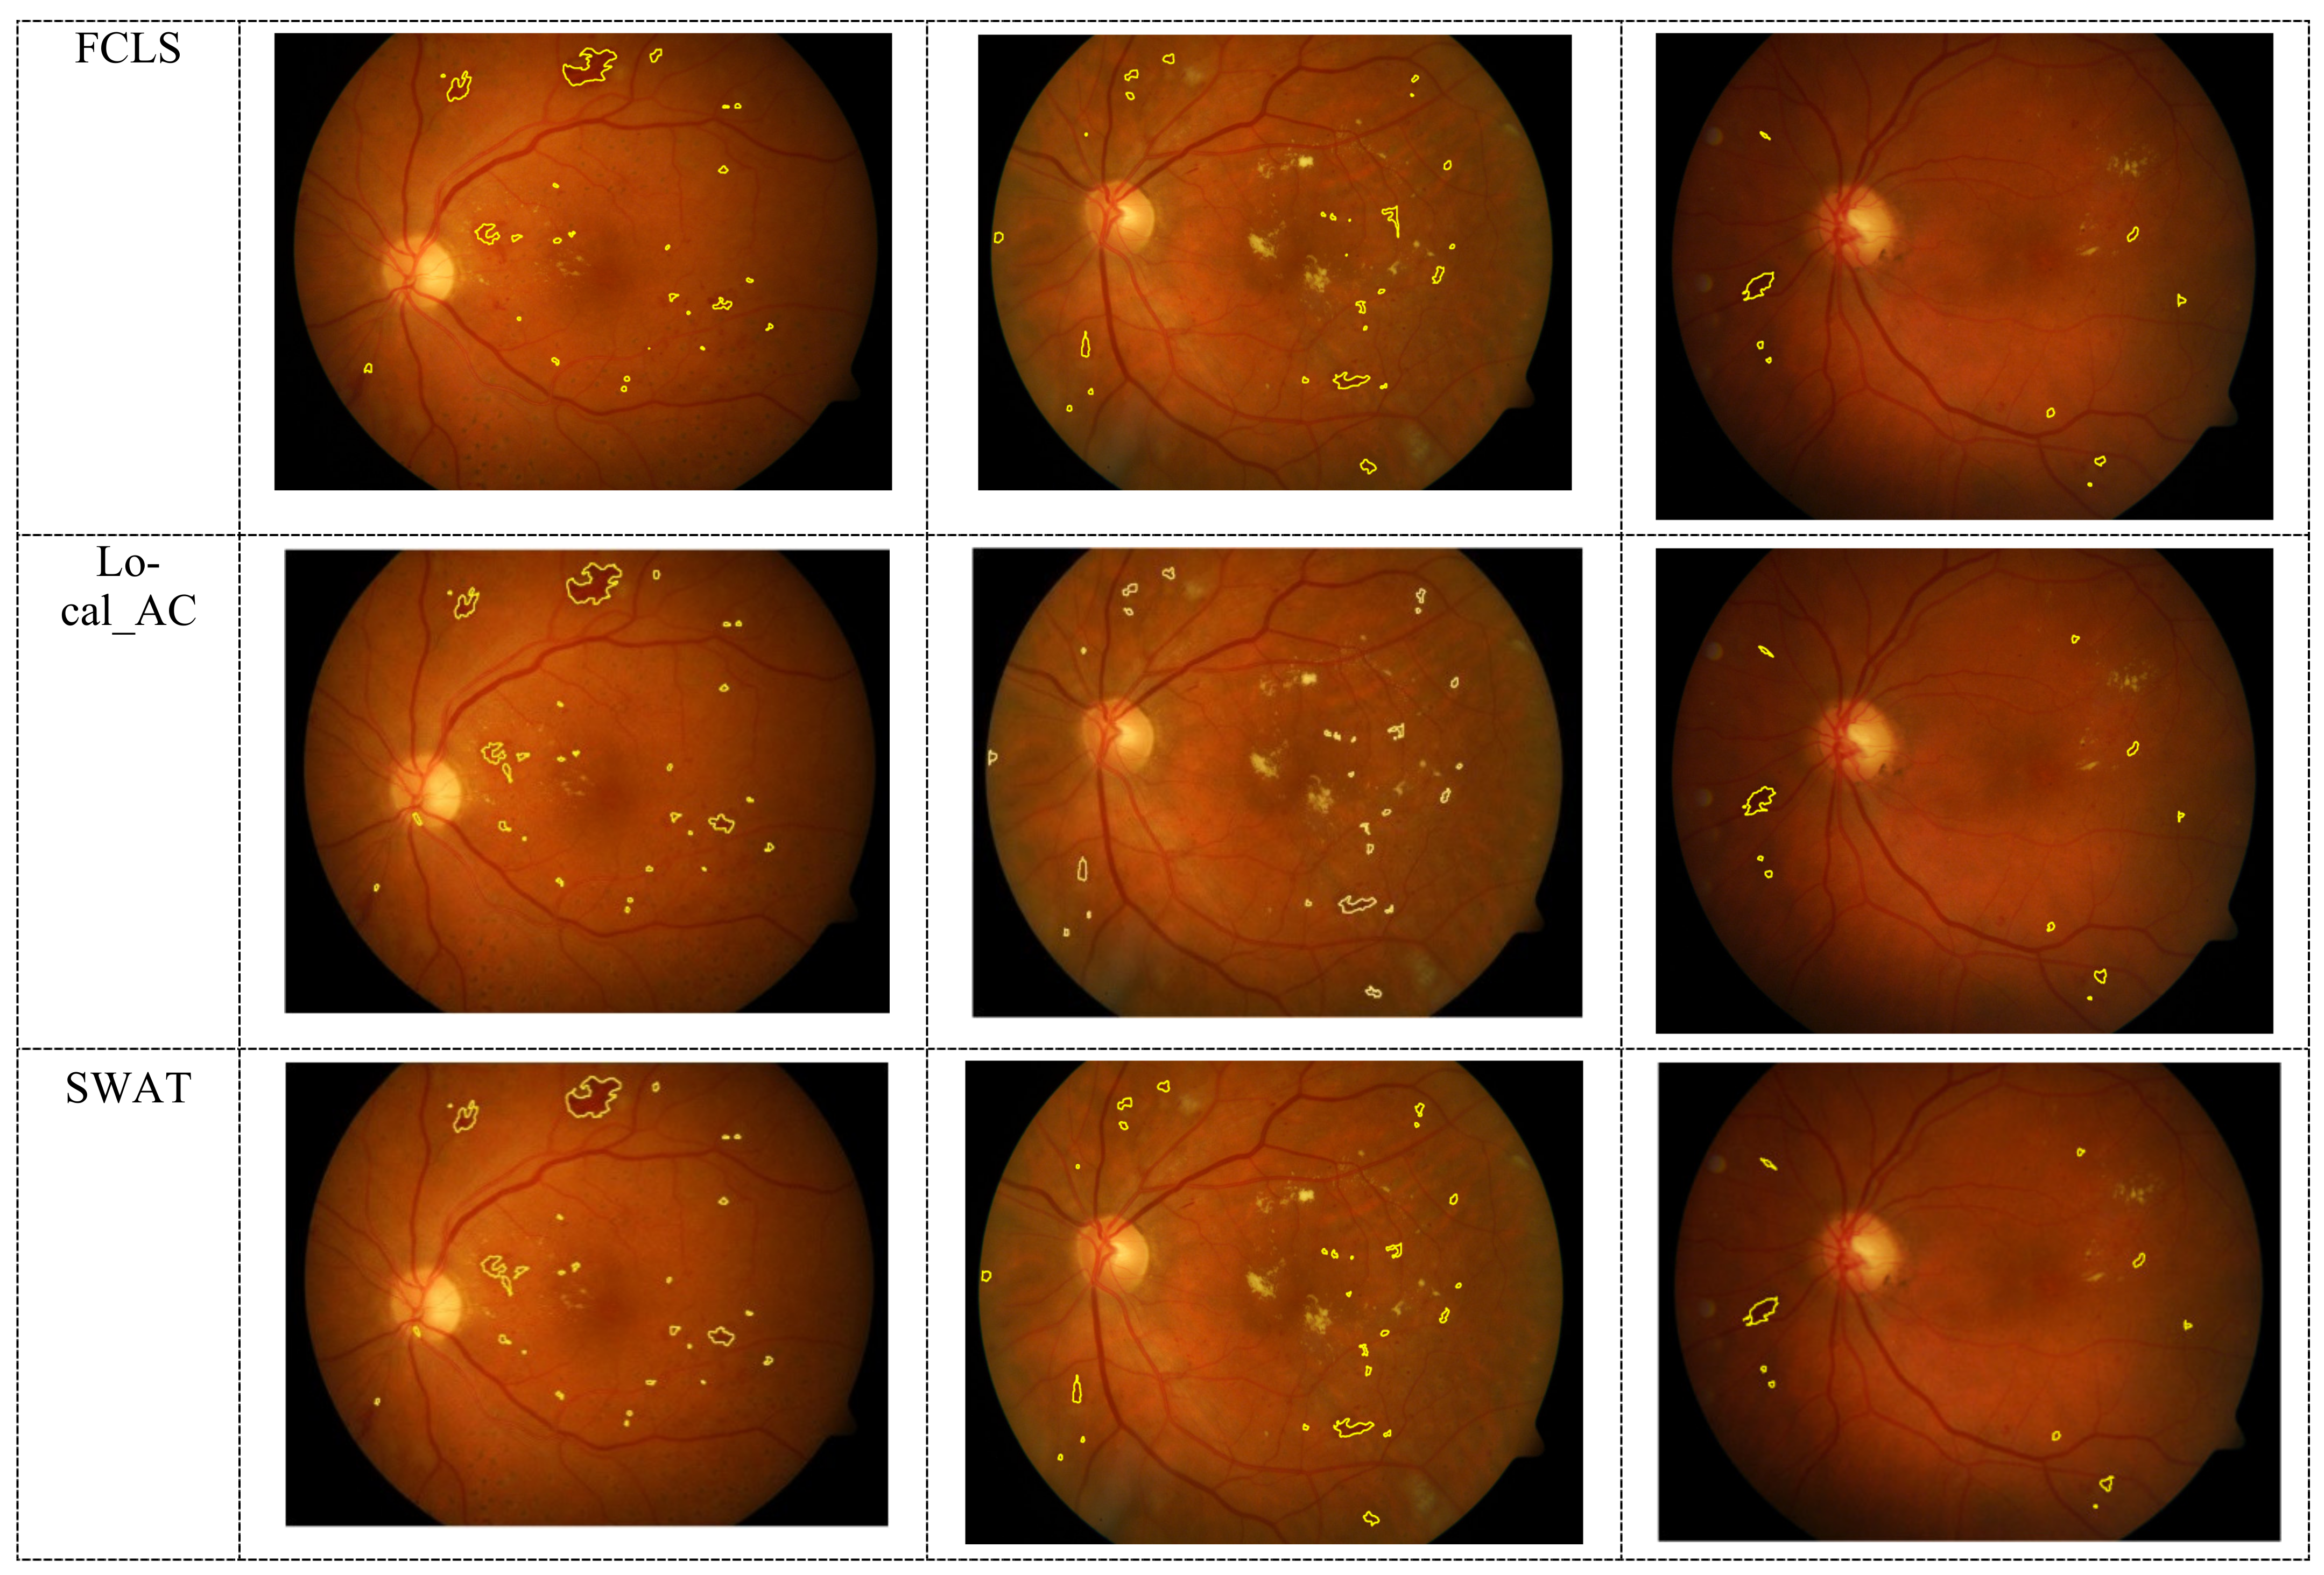
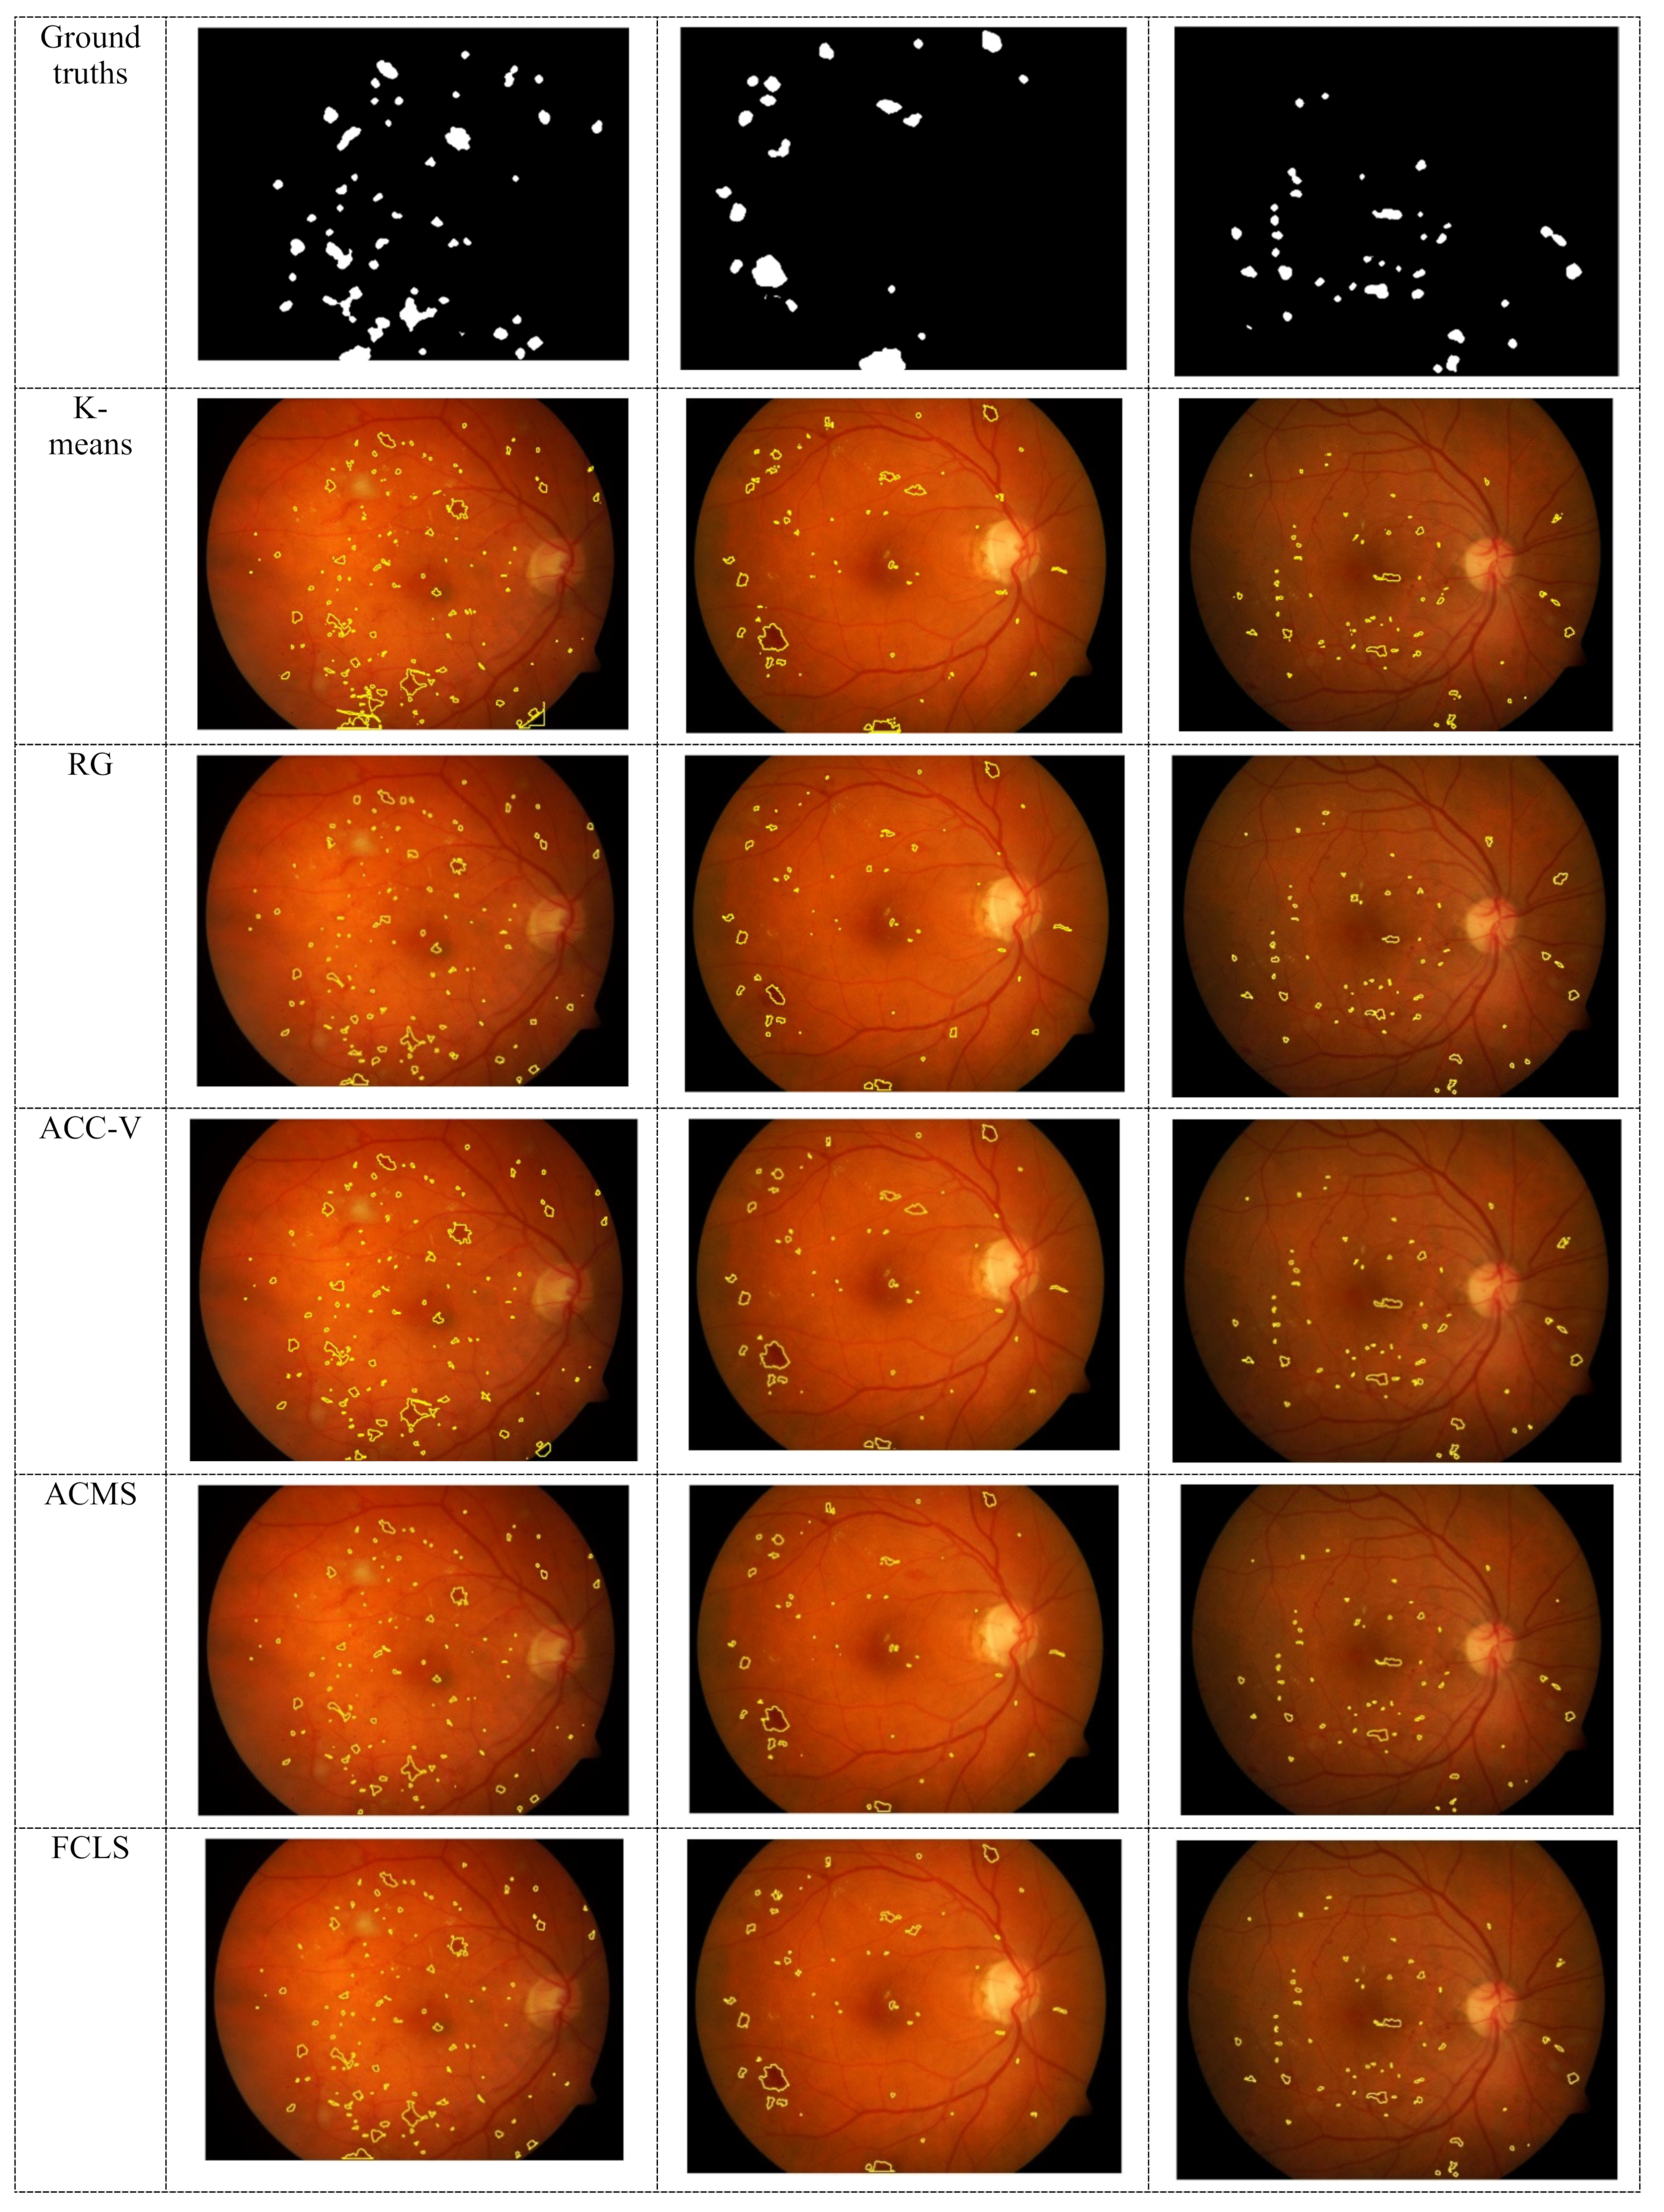
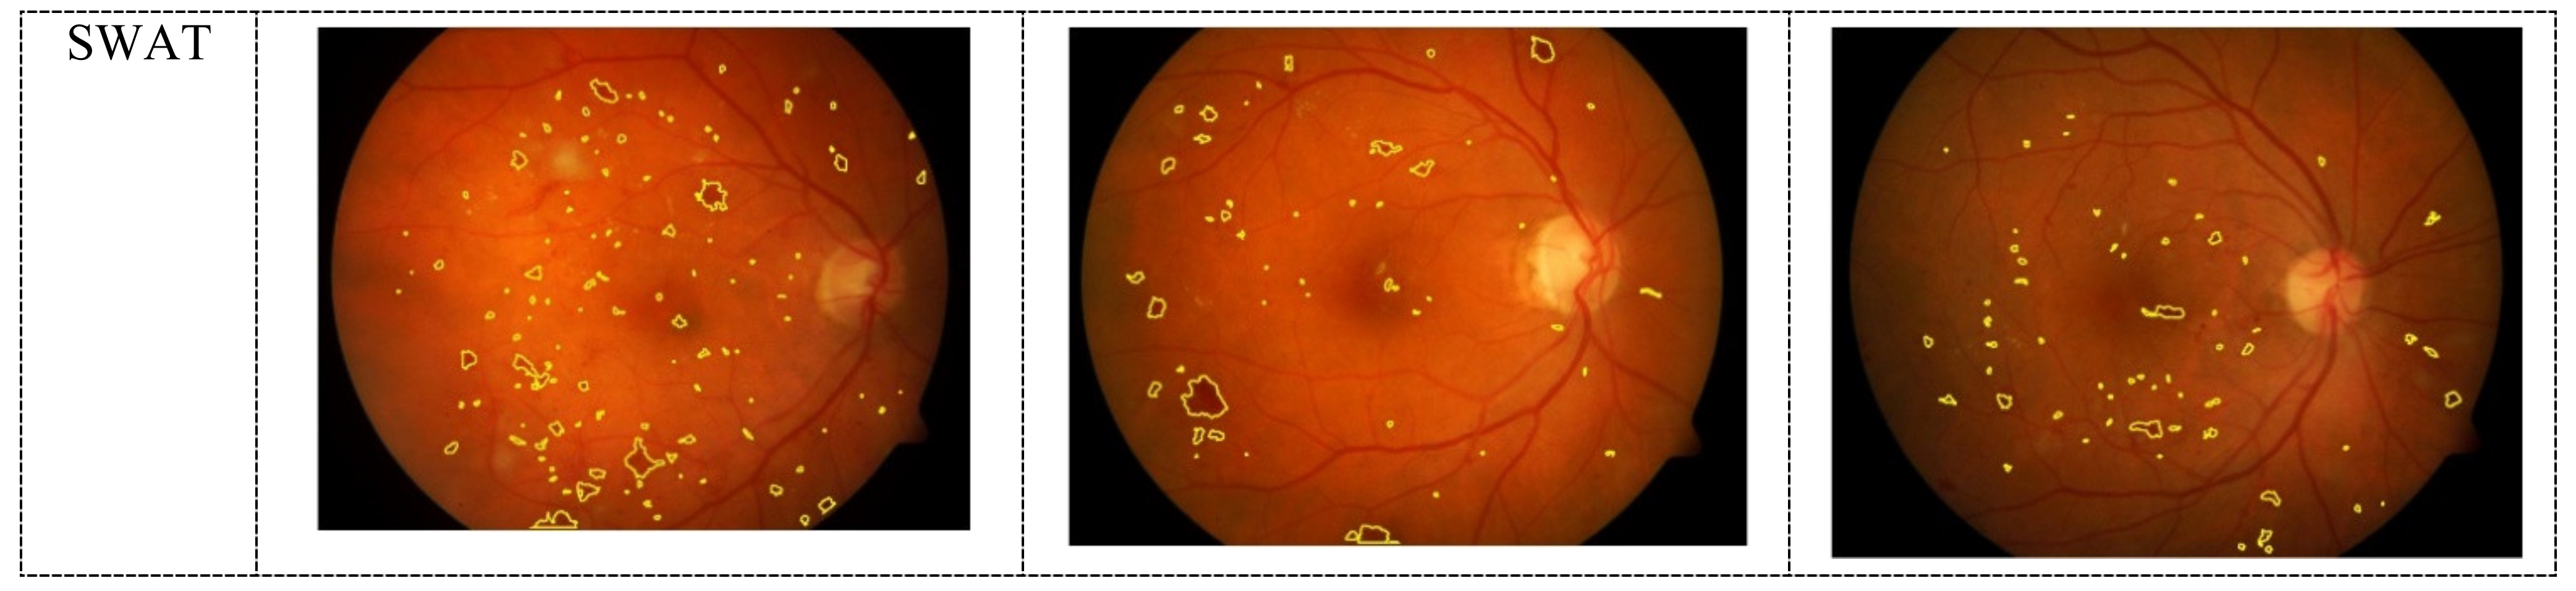
The proposed segmentation algorithm (SWAT) is compared with five state-of-the-art segmentation techniques: spatial fuzzy clustering with level set (FCLS) [37], active contour mean separation (ACMS), active contour Chan–Vese (ACC–V) [38], k-means clustering (KMC) [39], and region growing (RG) [40]. All the methods are applied on DIARETDB1 and DIARETDB0 datasets. The statistical results of the DIARETDB1 dataset are provided in Table 1 and can be depicted in Figure 6. The statistical results of the DIARETDB0 dataset are provided in Table 2, and visual inspection can be seen in Figure 7.
The proposed algorithm segments hemorrhage attached to blood vessels or with a black background. Although, ACMS and FCLS perform well with 67.45% and 78.23% F1 scores, respectively. However, the proposed method performs better than other methods in terms of precision rate, recall rate, and F1 score by achieving an 83.85% F1 score.
3.3. Preprocessing Result
The proposed preprocessing technique is compared with other brightness enhancement methods such as histogram equalization (HE) [41], adaptive gamma correction using weighting distribution (AGCWD) [28], brightness preserving dynamic fuzzy histogram equalization (BPDFHE) [42], and non-parametric modified histogram equalization (NMHE) [43]. The results of all algorithms, including the proposed gradient-based adaptive gamma correction method (GAGC), are provided in Table 3 and Figure 8.
From Figure 8, we observe that HE introduces over-saturation at the smooth areas (because of probability distribution uniformly on all intensities), producing a black and white smooth region. Meanwhile, AGCWD performs better on the dark smooth regions; however, bright smooth regions are also enhanced. Because the bright smooth regions contribute to the cumulative distribution function (CDF) of the image, an over-saturation procedure is introduced. The BPDFHE modifies the image histogram using fuzzy algorithms and does not produce over-saturation. However, dark shade cannot be brightened through this method. NMHE performs well for intensity variations and mutates histograms by a weighting factor that is computed by a local variance of pixels with the same intensity values. A lesser weight is introduced to the smooth regions and higher weights in varying regions. The proposed preprocessing method (GAGC) does not have a problem with over-saturation and performs well in dark regions. The smooth areas (intensity peaks in the histogram) do not contribute too much to the gradient of the image. Overall, the proposed preprocessing algorithm and AGCWD perform better than other methods.
4. Discussion
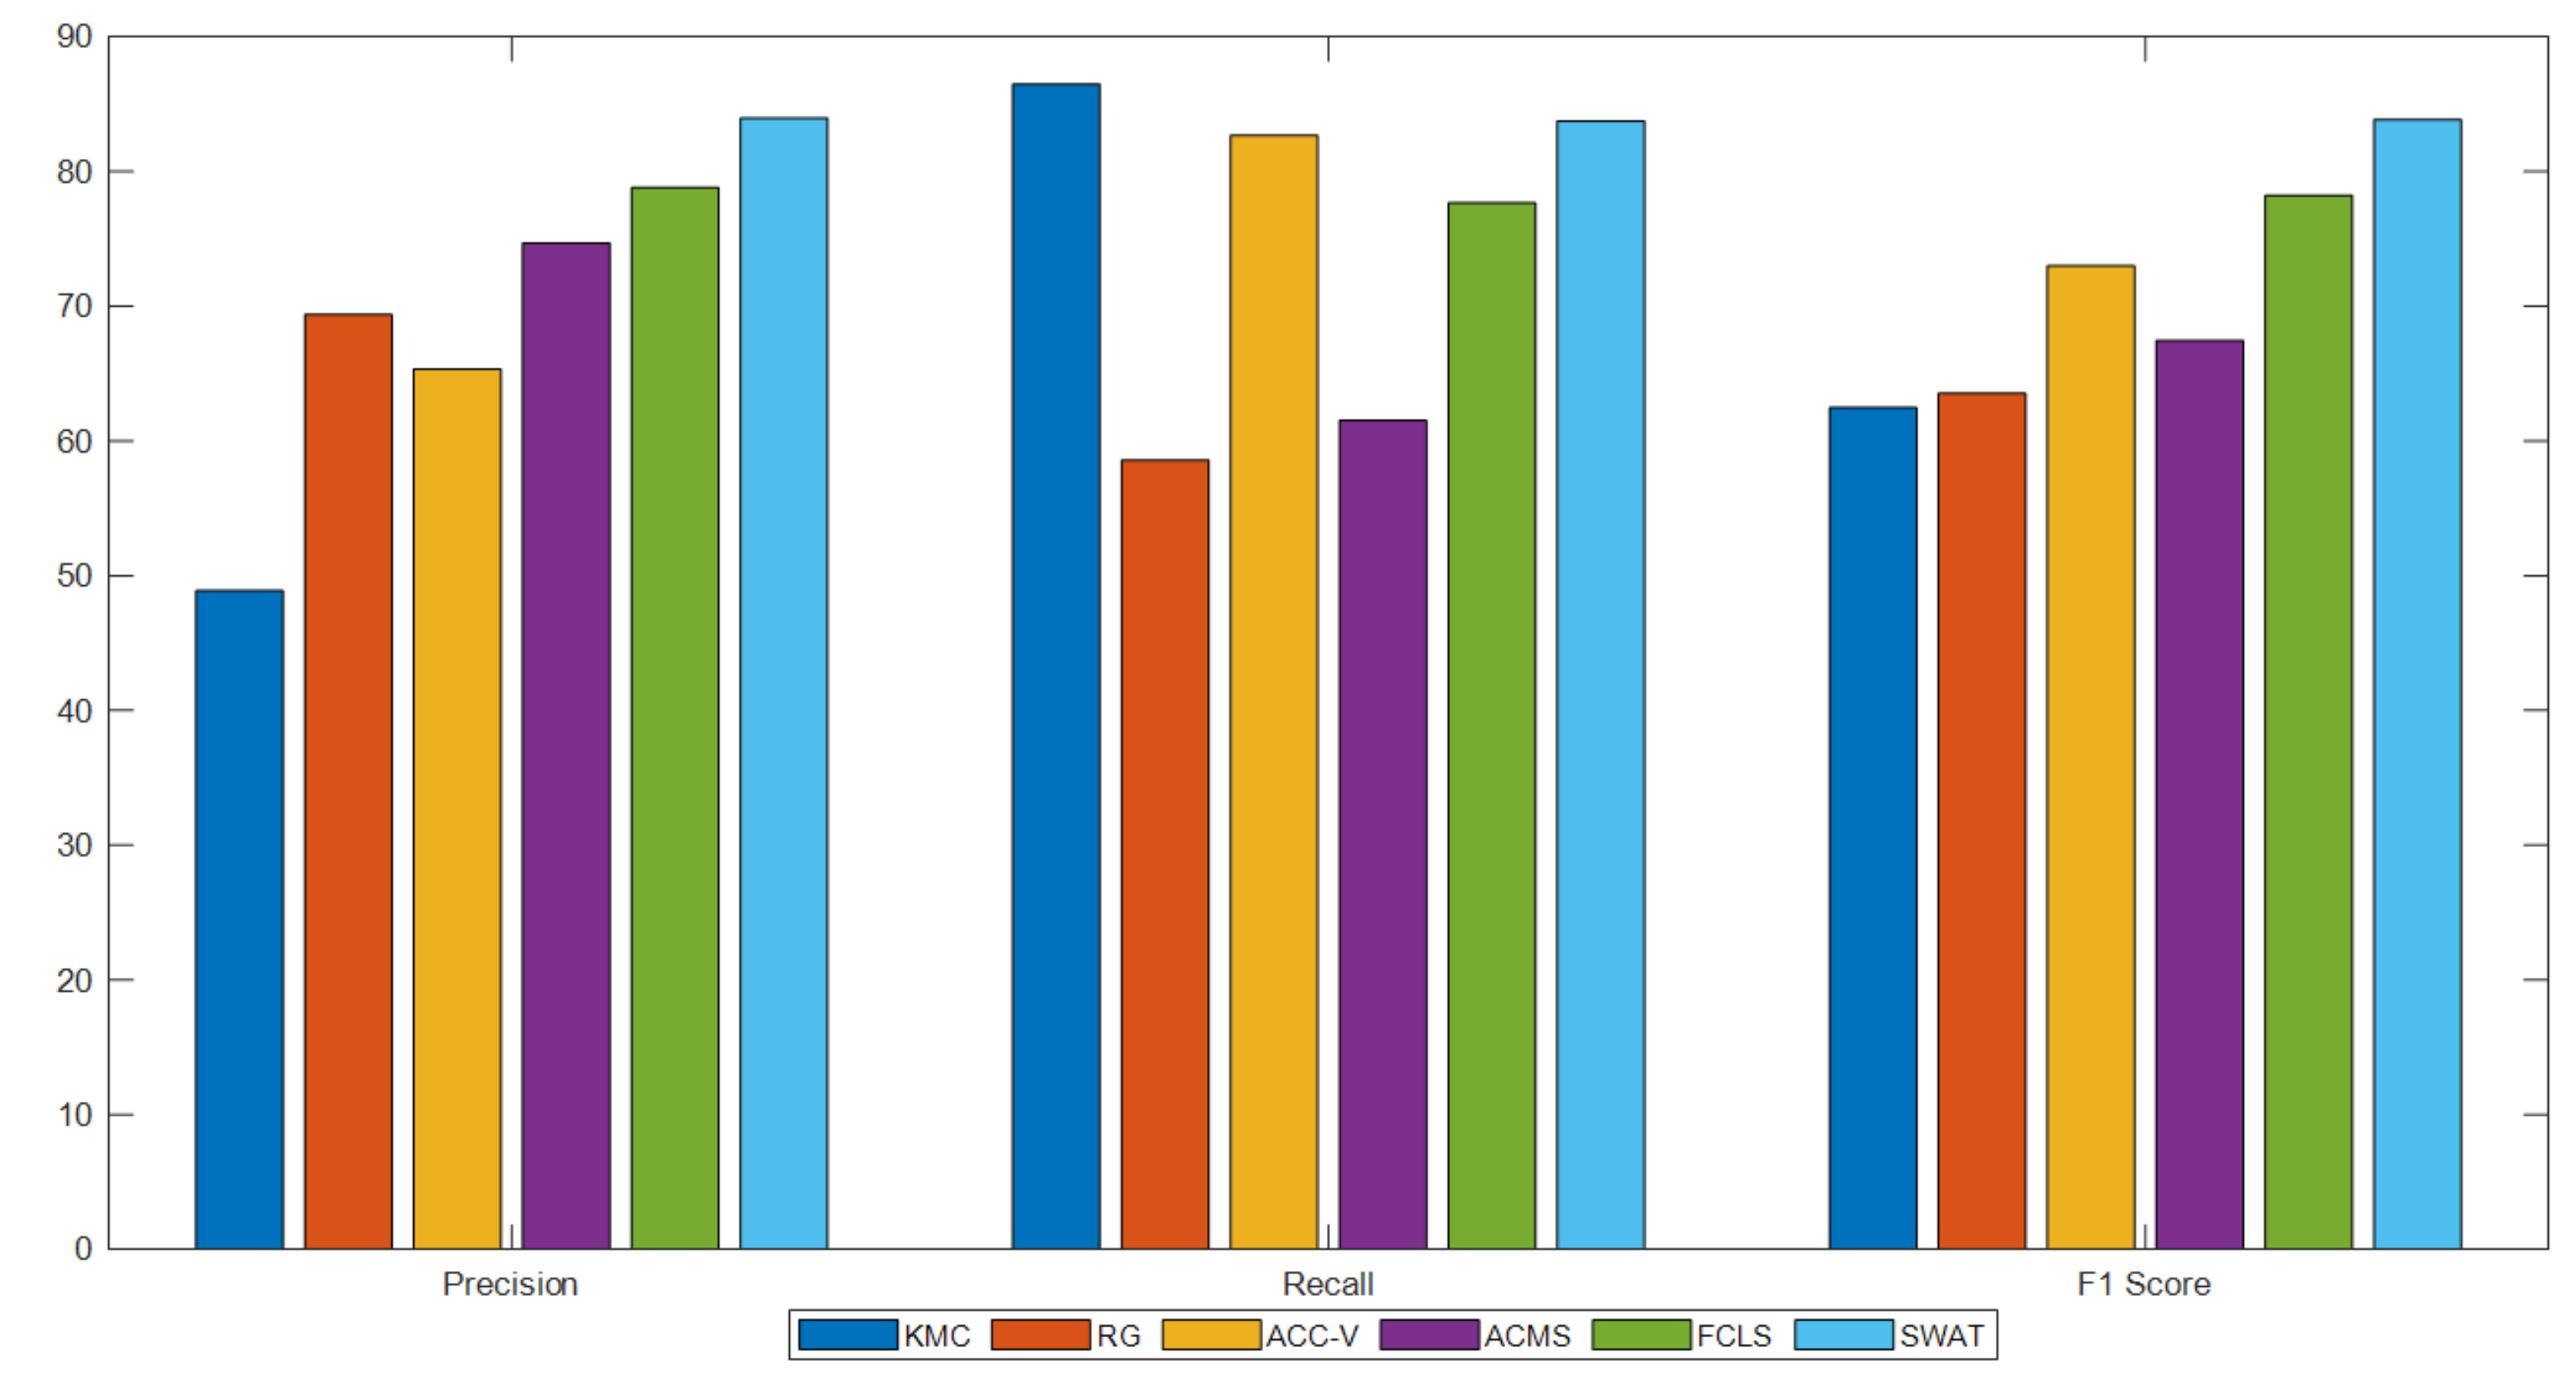
This paper presents a three-stage technique to detect hemorrhages in retinal fundus images. The proposed method can perform effectively with images obtained under different illumination conditions. Regardless of size and location, the proposed method effectively detects hemorrhage attached to a blood vessel (see Figure 6 and Figure 7). Separate estimations were performed for precision, recall, and F1 scores for both datasets. The results of precision, recall, and F1 scores for the proposed method produced higher values for the DIARETDB1 dataset when compared with results from DIARETDB0. For DIARETDB1, the results of precision, recall, and F1 score were estimated to be 83.97%, 83.74%, and 83.85%. For DIARETDB0, the results decreased to 70.51%, 74.08%, and 72.25%. A major reason for the decrease could be the quality of images. The proposed method also offers a high level of preprocessing (contrast and enhancement) which gives the segmentation algorithm higher visual and quantitative results. While the state-of-the-art segmentation techniques perform well, their results are not satisfactory. For example, KMC, RG, ACC-V, ACMS, and FCLS produce F1 scores of 62.46, 63.53, 72.99, 67.45, and 78.23, respectively. Specifically, KMC and RG produced the worse performance, while ACMS and FCLS produced the best results among competing methods. Overall, the proposed method performs better than all the methods. Figure 9 and Figure 10 depict the statistical comparison of all methods.
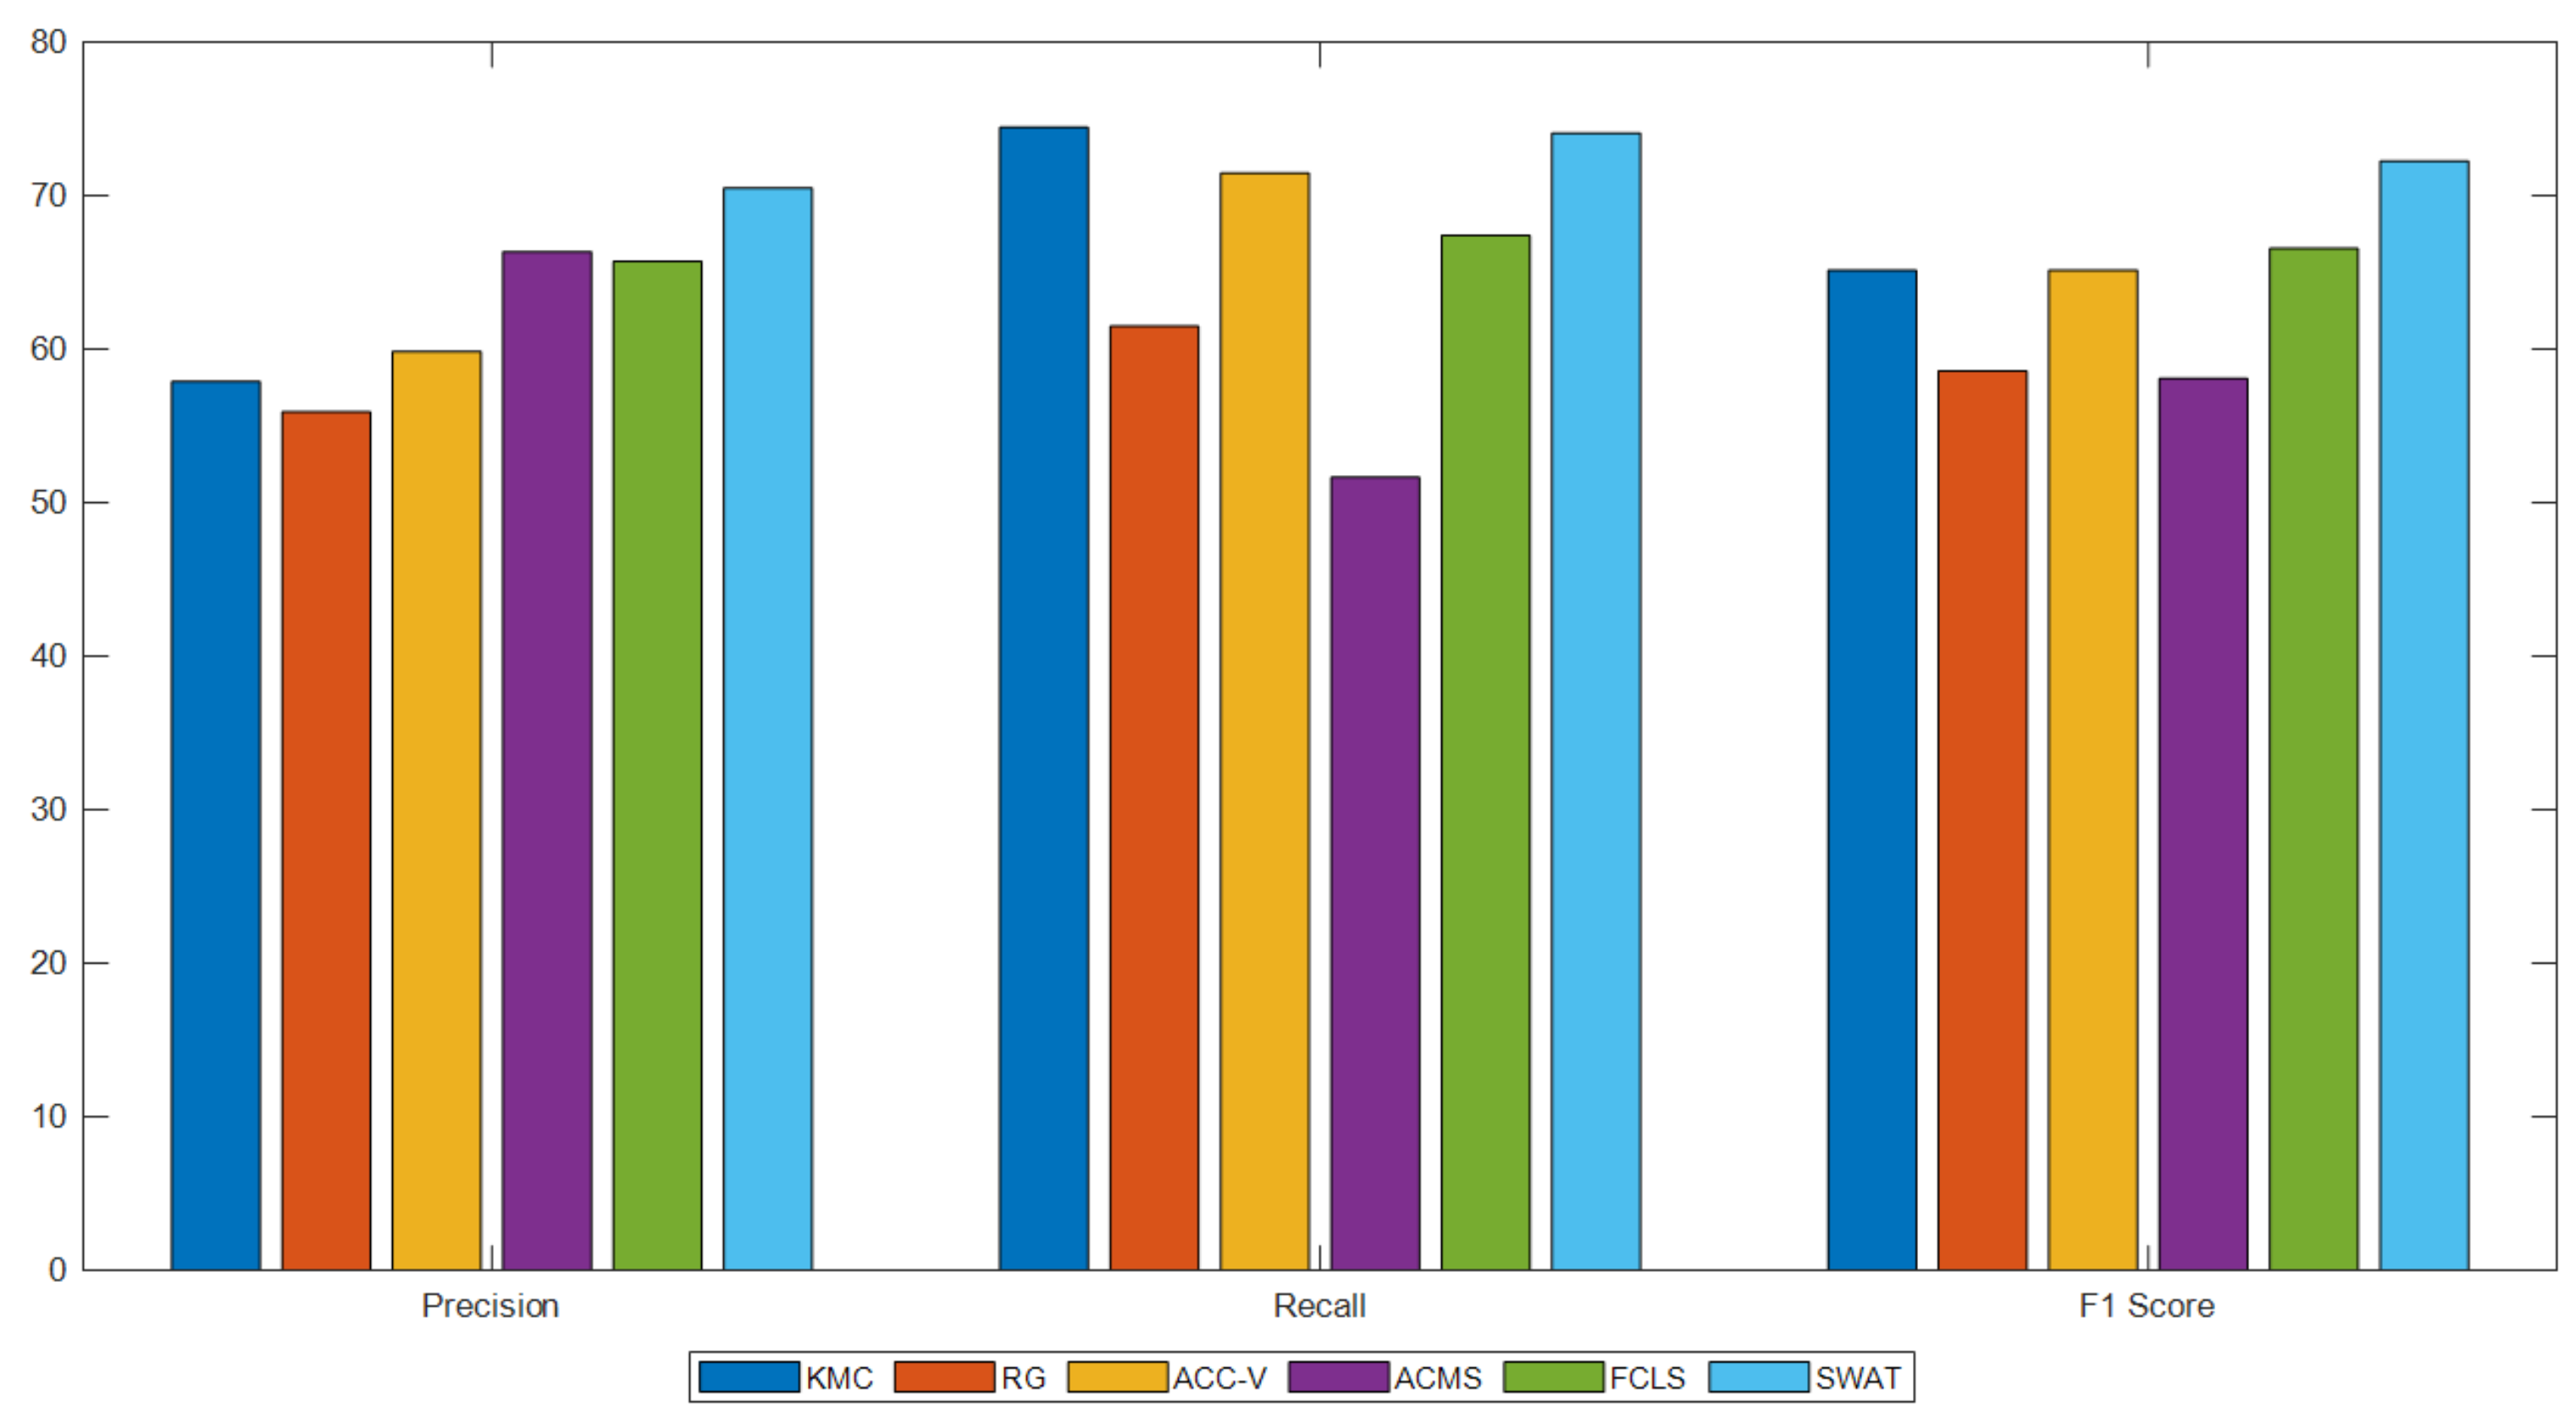
Comparison of methods with the DIARETDB1 dataset (Figure 9) shows that KMC produces a good result for recall; however, results for precision and F1 score are not satisfactory. The RG algorithm produces a good result for precision, but results for recall and F1 score are not satisfactory. In addition, ACMS, ACC-V, and FCLS produce average results for all evaluation metrics. Overall, the proposed method produces a good result for all evaluation metrics. In the DIARETDB0 dataset (Figure 10), all methods closely compete, especially with the precision evaluation metrics. However, for recall and F1 score, the proposed method, KMC, ACC-V, and FCLS algorithm, perform well. The reason for good performance by the proposed method is because of the SWAT technique and the efficient preprocessing procedure.
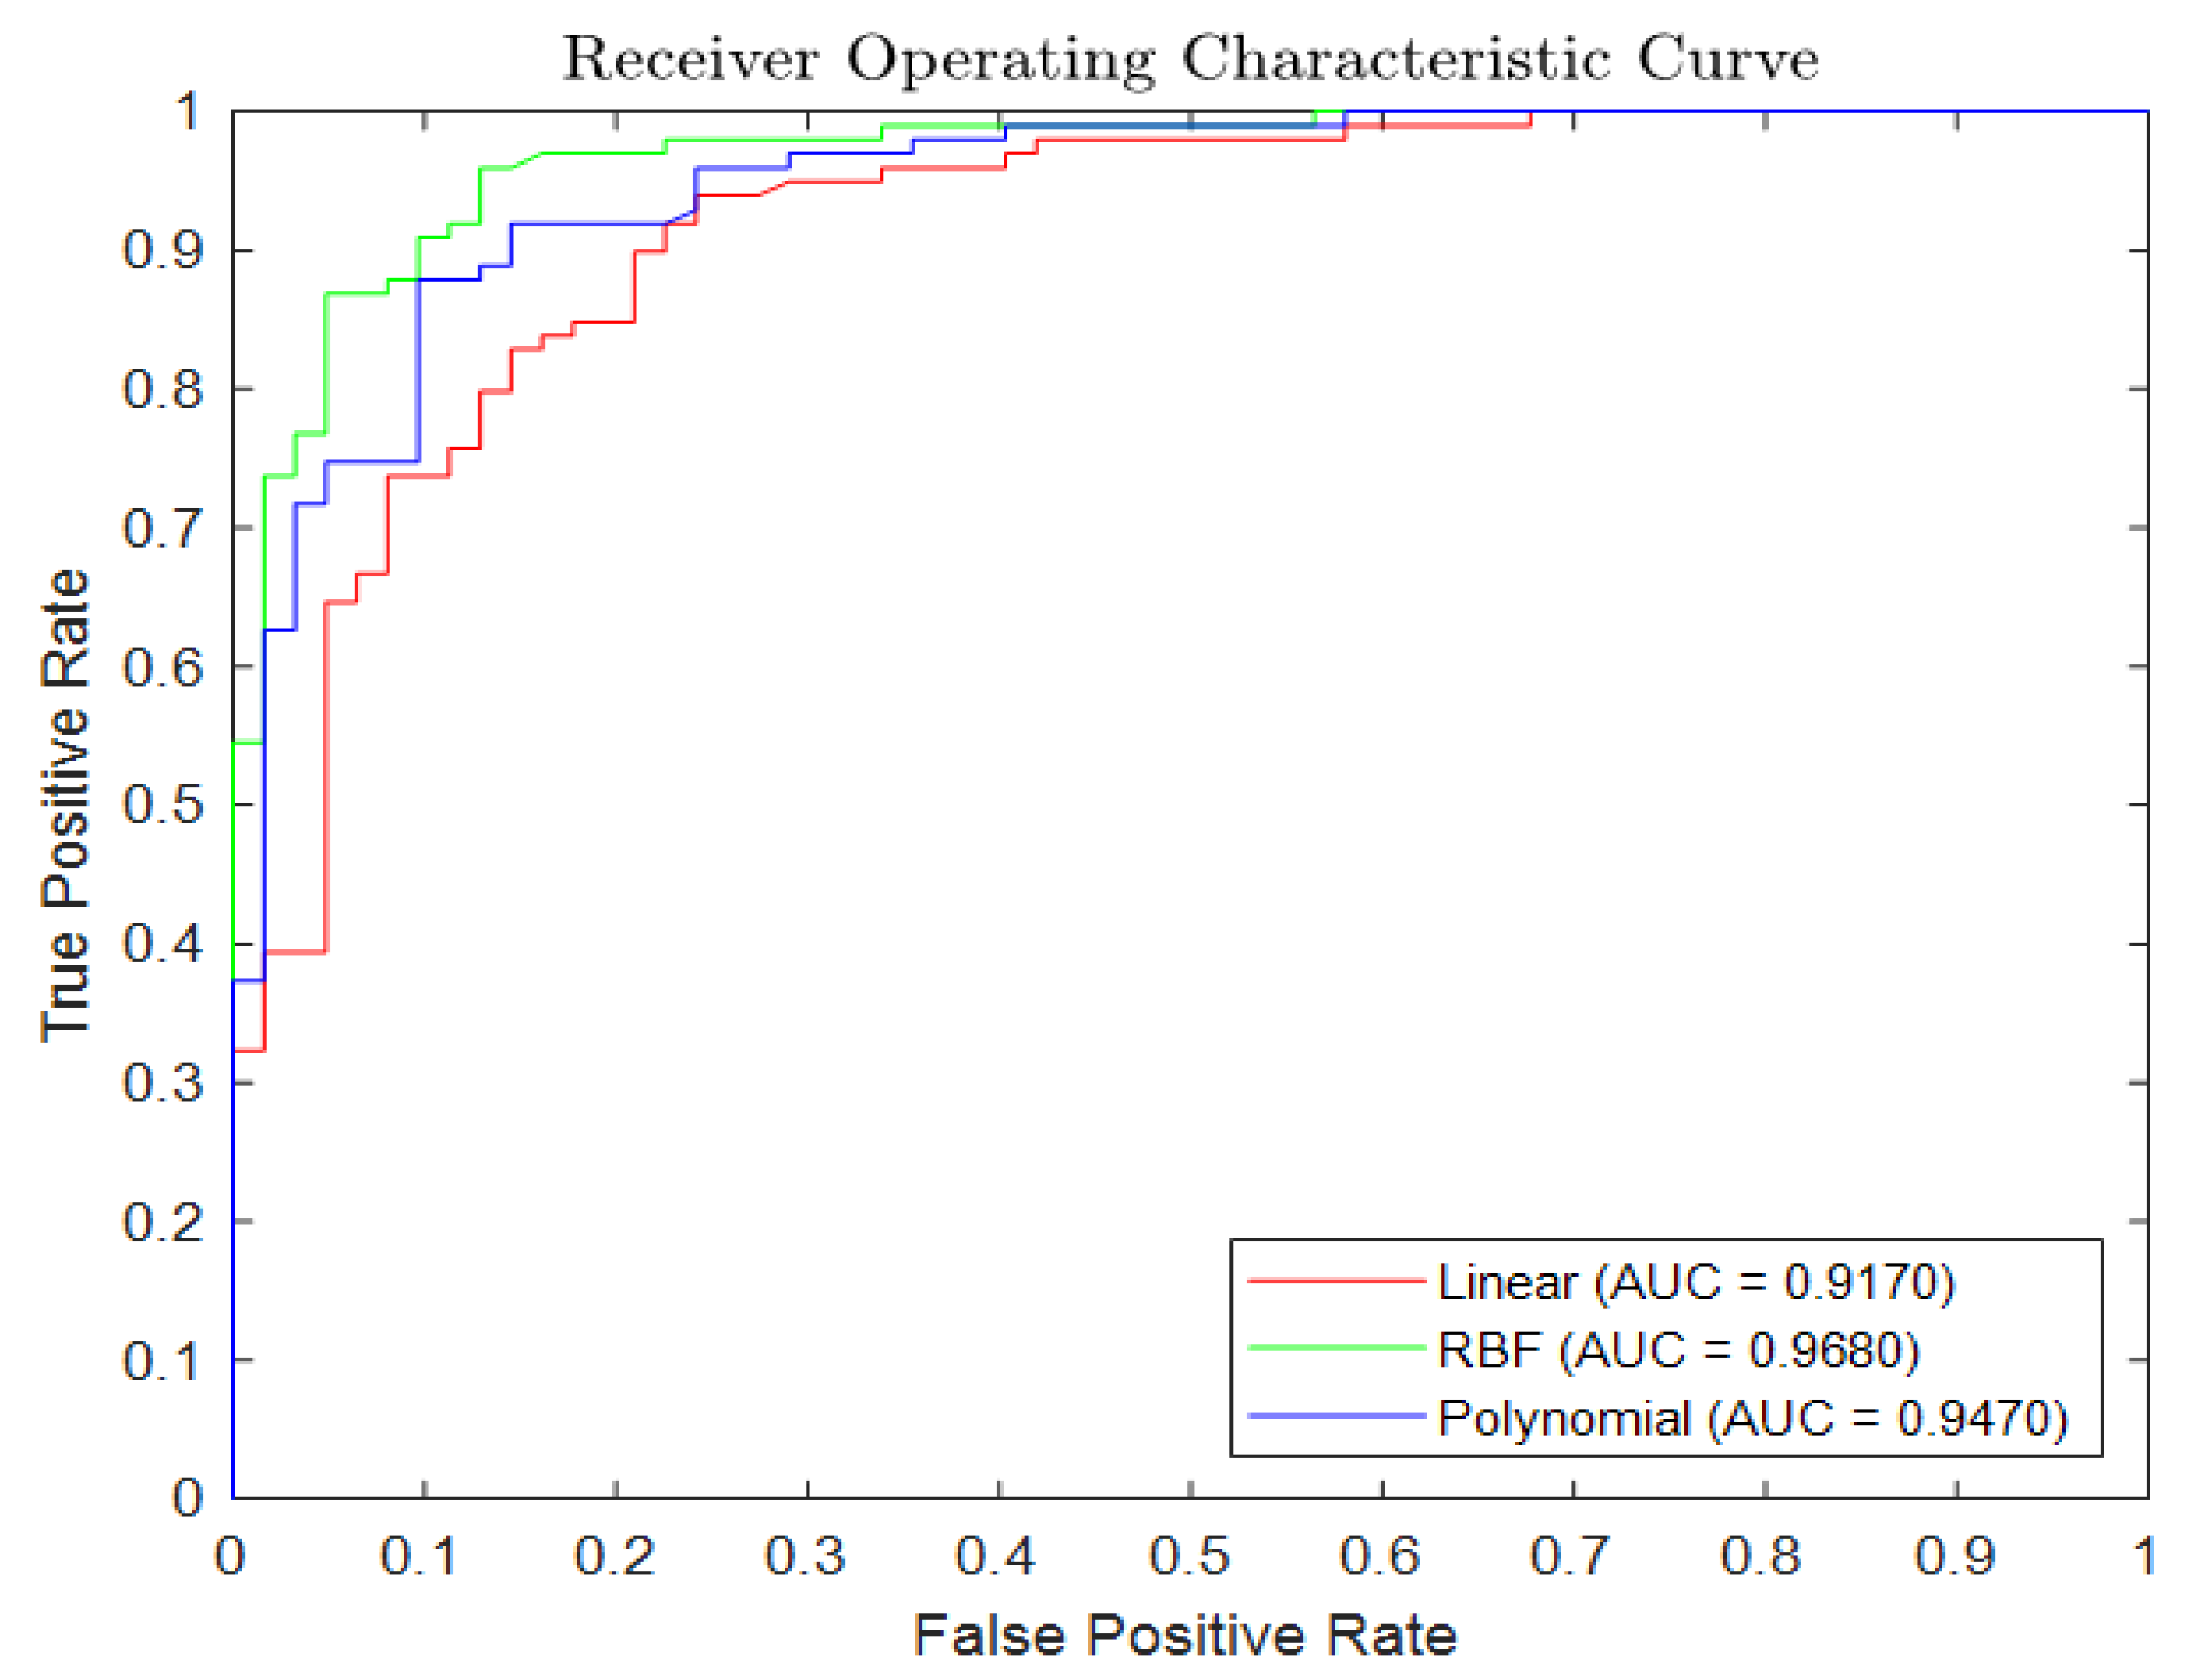
Figure 11 shows the plot of the curve between the true positive (TP) rate and the false positive (FP) rate for different probability thresholds. A higher area under the curve (AUC) value shows a higher capability of the classifier. The behavior of the classifier changes significantly by changing the kernel function. The selection of suitable kernel function is very important and is carried out by analyzing the ROC curves of the linear, radial basis function (RBF), and polynomial kernels. The AUC of RBF is the largest; therefore, we use it to classify hemorrhages. By visual comparison, cases with extreme difficulty further demonstrate that the proposed method produces accurate segmentation results. In the two datasets, when the proposed method was compared with other competing methods, we discover that the proposed method produces an acceptable result despite some missing targets.
We tried to test our research on a dataset collected from the local hospital. However, the availability and copyright law were the major delimitations during our experiment.
5. Conclusions
This paper presents an algorithm to detect and segment hemorrhages. The previous experiments performed by the research community suggest that two categories of hemorrhages are difficult to segment. The first category of hemorrhages is located at the retinal border blended with the black background. The second category of hemorrhages is attached to the blood vessels. The proposed algorithm segments both categories satisfactorily. The proposed algorithm preprocesses, segments, and classifies hemorrhages from retinal fundus images. Two well-known datasets (DIARETDB1 and DIARETDB0) are used in this research. State-of-the-art methods are used for benchmarking, while quality evaluation criteria are used to report the results. The SWAT algorithm (proposed method) segments hemorrhages efficiently and accurately. Our results suggest that the proposed method performs better than other methods in terms of quantitative and visual inspection (see Table 1, Table 2 and Table 3 and Figure 6, Figure 7 and Figure 8). The preprocessing and enhancement techniques are used in the detection phase, while the SWAT algorithm isolates the hemorrhages from other pathological features and non-hemorrhage regions.
Finally, since the SWAT algorithm is adaptive and has better segmentation characteristics, it could be helpful in other ophthalmological conditions as well. The proposed model is expected to be useful in clinical medicine, such as surgery navigation and diagnosis. It can be promising to extend the proposed method by using information from the original image as a guide for preprocessing and segmentation. In the future, we plan to extend and combine the proposed method with a deep learning framework.
Author Contributions
T.A.: investigation, methodology, software, writing—original draft, conceptualization, formal analysis. A.E.I.: resources, visualization, writing—original draft, validation, methodology, conceptualization. C.C.: funding acquisition, project administration, supervision, writing—review and editing. All authors have read and agreed to the published version of the manuscript.
Funding
Thammasat University Research Fund, SIIT Research Fund.
Institutional Review Board Statement
Not applicable.
Informed Consent Statement
Not applicable.
Data Availability Statement
Publicly available datasets were analyzed in this study. This data can be found here: https://www.it.lut.fi/project/imageret/diaretdb0/, https://www.it.lut.fi/project/imageret/diaretdb1/index.html.
Conflicts of Interest
All authors in this paper have no potential conflict of interest.
References
- Global Eye Care Target, 74th World Assembly. 2021. Available online: www.who.int/news/item/27-05-2021-global-eye-care-targets. (accessed on 18 June 2021).
- Gangwani, R.A.; Lian, J.; McGhee, S.M.; Wong, D.; Li, K.K. Diabetic retinopathy screening: Global and local perspective. Hong Kong Med. J. 2016, 22, 486–495. [Google Scholar] [CrossRef]
- Stefansson, E.; Bek, T.; Porta, M.; Larsen, N.; Kristinsson, J.K.; Agardh, E. Screening and prevention of diabetic blindness. Acta Ophthalmol. Scand. 2000, 78, 374–385. [Google Scholar] [CrossRef] [PubMed]
- Zhu, C.-H.; Zhang, S.-S.; Kong, Y.; Bi, Y.-F.; Wang, L.; Zhang, Q. Effects of intensive control of blood glucose and blood pressure on microvascular complications in patients with type II diabetes mellitus. Int. J. Ophthalmol. 2013, 6, 141–145. [Google Scholar] [CrossRef] [PubMed]
- Moghissi, E.S.; Korytkowski, M.T.; Dinardo, M.; Einhorn, D.; Hellman, R.; Hirsch, I.B.; Inzucchi, S.E.; Ismail-Beigi, F.; Kirkman, M.S.; Umpierrez, G.E. American Association of Clinical Endocrinologists and American Diabetes Association Consensus Statement on Inpatient Glycemic Control. Diabetes Care 2009, 32, 1119–1131. [Google Scholar] [CrossRef] [PubMed] [Green Version]
- Li, B.; Li, N.; Guo, S.; Zhang, M.; Li, J.; Zhai, N.; Wang, H.; Zhang, Y. The changing features of serum adropin, copeptin, neprilysin and chitotriosidase which are associated with vascular endothelial function in type 2 diabetic retinopathy patients. J. Diabetes Complicat. 2020, 34, 107686. [Google Scholar] [CrossRef]
- Kampik, A. Imaging in ophthalmology and need for slit-lamp and ophthalmoscopy examinations. Oman J. Ophthalmol. 2016, 9, 79. [Google Scholar] [CrossRef]
- Fung, T.H.; Kuet, M.-L.; Patel, C.K.; Holden, R.; Ojha, S.; Amoaku, W.M. Retinal imaging in infants. Surv. Ophthalmol. 2021. [Google Scholar] [CrossRef]
- Wang, J.; Li, Y.-J.; Yang, K.-F. Retinal fundus image enhancement with image decomposition and visual adaptation. Comput. Biol. Med. 2021, 128, 104116. [Google Scholar] [CrossRef]
- Mookiah, M.R.K.; Hogg, S.; MacGillivray, T.J.; Prathiba, V.; Pradeepa, R.; Mohan, V.; Anjana, R.M.; Doney, A.S.; Palmer, C.N.; Trucco, E. A review of machine learning methods for retinal blood vessel segmentation and artery/vein classification. Med. Image Anal. 2021, 68, 101905. [Google Scholar] [CrossRef]
- Huang, Y.; Lin, L.; Li, M.; Wu, J.; Cheng, P.; Wang, K.; Yuan, J.; Tang, X. Automated Hemorrhage Detection from Coarsely Annotated Fundus Images in Diabetic Retinopathy. In Proceedings of the 2020 IEEE 17th International Symposium on Biomedical Imaging (ISBI), Iowa City, IA, USA, 3–7 April 2020; pp. 1369–1372. [Google Scholar]
- Rani, N.S.; Bipin, N.B.J.; Yadhu, C.R. Hemorrhage Segmentation and Detection in Retinal Images using Object Detection Techniques and Machine Learning Perspectives. In Proceedings of the 2019 Global Conference for Advancement in Technology (GCAT), Bangalore, India, 18–20 October 2019; pp. 1–5. [Google Scholar] [CrossRef]
- Randive, S.N.; Senapati, R.K.; Rahulkar, A.D. A review on computer-aided recent developments for automatic detection of diabetic retinopathy. J. Med. Eng. Technol. 2019, 43, 87–99. [Google Scholar] [CrossRef]
- Fleming, A.D.; Philip, S.; Goatman, K.A.; Olson, J.A.; Sharp, P.F. Automated microaneurysm detection using local contrast normalization and local vessel detection. IEEE Trans. Med. Imaging 2006, 25, 1223–1232. [Google Scholar] [CrossRef]
- Niemeijer, M.; Van Ginneken, B.; Staal, J.; Suttorp-Schulten, M.S.; Abramoff, M. Automatic detection of red lesions in digital color fundus photographs. IEEE Trans. Med. Imaging 2005, 24, 584–592. [Google Scholar] [CrossRef] [Green Version]
- Tang, L.; Niemeijer, M.; Reinhardt, J.; Garvin, M.K.; Abramoff, M. Splat Feature Classification With Application to Retinal Hemorrhage Detection in Fundus Images. IEEE Trans. Med. Imaging 2012, 32, 364–375. [Google Scholar] [CrossRef] [PubMed]
- Kande, G.B.; Savithri, T.S.; Subbaiah, P.V. Automatic detection of microaneurysms and hemorrhages in digital fundus images. J. Digit. Imaging 2009, 23, 430–437. [Google Scholar] [CrossRef] [Green Version]
- García, M.; López, M.I.; Alvarez, D.; Hornero, R. Assessment of four neural network based classifiers to automatically detect red lesions in retinal images. Med. Eng. Phys. 2010, 32, 1085–1093. [Google Scholar] [CrossRef]
- Tan, J.H.; Fujita, H.; Sivaprasad, S.; Bhandary, S.; Rao, A.K.; Chua, K.C.; Acharya, U.R. Automated segmentation of exudates, haemorrhages, microaneurysms using single convolutional neural network. Inf. Sci. 2017, 420, 66–76. [Google Scholar] [CrossRef]
- Arun, G.; Sasirekha, N. Detection of retinal hemorrhage in color fundus image using splat feature segmentation. In Proceedings of the 2015 International Conference on Innovations in Information, Embedded and Communication Systems (ICIIECS), Coimbatore, India, 19–20 March 2015; pp. 1–5. [Google Scholar] [CrossRef]
- Srivastava, R.; Wong, D.W.K.; Duan, L.; Liu, J.; Wong, T.Y. Red lesion detection in retinal fundus images using Frangi-based filters. In Proceedings of the 2015 37th Annual International Conference of the IEEE Engineering in Medicine and Biology Society (EMBC), Milan, Italy, 25–29 August 2015; pp. 5663–5666. [Google Scholar]
- Mohamed, B.; Yazid, C.; Nourreddine, B.; Abdelmalek, B.; Assia, C. Non-proliferative diabetic retinopathy detection using mathematical morphology. In Proceedings of the 2018 IEEE 4th Middle East Conference on Biomedical Engineering (MECBME), Tunis, Tunisia, 28–30 March 2018; pp. 219–224. [Google Scholar] [CrossRef]
- Kauppi, T.; Kalesnykiene, V.; Kamarainen, J.K.; Lensu, L.; Sorri, I.; Uusitalo, H.; Kälviäinen, H.; Pietilä, J. DIARETDB0: Evaluation Database and Methodology for Diabetic Retinopathy Algorithms; Machine Vision and Pattern Recognition Research Group, Lappeenranta University of Technology: Lappeenranta, Finland, 2006; Volume 73, pp. 1–17. [Google Scholar]
- Kauppi, T.; Kalesnykiene, V.; Kamarainen, J.K.; Lensu, L.; Sorri, I.; Raninen, A.; Voutilainen, R.; Uusitalo, H.; Kälviäinen, H.; Pietilä, J. The DIARETDB1diabetic retinopathy database and evaluation protocol. In Proceedings of the British Machine Vision Conference, Warwick, UK, 10–13 September 2007. [Google Scholar]
- Sahu, S.; Singh, A.K.; Ghrera, S.P.; Elhoseny, M. An approach for de-noising and contrast enhancement of retinal fun-dus image using CLAHE. Opt. Laser Technol. 2019, 110, 87–98. [Google Scholar]
- Veluchamy, M.; Subramani, B. Image contrast and color enhancement using adaptive gamma correction and histogram equalization. Optik 2019, 183, 329–337. [Google Scholar] [CrossRef]
- Huang, Z.; Zhang, T.; Li, Q.; Fang, H. Adaptive gamma correction based on cumulative histogram for enhancing near-infrared images. Infrared Phys. Technol. 2016, 79, 205–215. [Google Scholar] [CrossRef]
- Huang, S.-C.; Cheng, F.-C.; Chiu, Y.-S. Efficient contrast enhancement using adaptive gamma correction with weighting dis-tribution. IEEE Trans. Image Process. 2013, 22, 1032–1041. [Google Scholar] [CrossRef]
- Nie, F.; Gao, C.; Guo, Y.; Gan, M. Two-dimensional minimum local cross-entropy thresholding based on co-occurrence matrix. Comput. Electr. Eng. 2011, 37, 757–767. [Google Scholar] [CrossRef]
- Gui, Z.; Liu, Y.; Gui, Z.; Liu, Y. An image sharpening algorithm based on fuzzy logic. Optik 2011, 122, 697–702. [Google Scholar] [CrossRef]
- Matlab—Two-Dimensional Matched Filter—Stack Overflow. Available online: https://stackoverflow.com/questions/52331384/two-dimensional-matched-filter (accessed on 15 August 2020).
- Chaudhuri, S.; Chatterjee, S.; Katz, N.; Nelson, M.; Goldbaum, M. Detection of blood vessels in retinal images using two-dimensional matched filters. IEEE Trans. Med. Imaging 1989, 8, 263–269. [Google Scholar] [CrossRef] [Green Version]
- Sha, C.; Hou, J.; Cui, H. A robust 2D Otsu’s thresholding method in image segmentation. J. Vis. Commun. Image Represent. 2016, 41, 339–351. [Google Scholar] [CrossRef]
- Chatbri, H.; Kameyama, K. Document image dataset indexing and compression using connected components clustering. In Proceedings of the 2015 14th IAPR International Conference on Machine Vision Applications (MVA), Tokyo, Japan, 18–22 May 2015; pp. 267–270. [Google Scholar] [CrossRef]
- Murali, S.; Govindan, V.K. Shadow Detection and Removal from a Single Image Using LAB Color Space. Cybern. Inf. Technol. 2013, 13, 95–103. [Google Scholar] [CrossRef] [Green Version]
- Chen, T.-W.; Chen, Y.-L.; Chien, S.-Y. Fast image segmentation based on K-Means clustering with histograms in HSV color space. In Proceedings of the 2008 IEEE 10th Workshop on Multimedia Signal Processing, Cairns, Australia, 8–10 October 2008; pp. 322–325. [Google Scholar]
- Li, B.N.; Chui, C.K.; Chang, S.; Ong, S.H. Integrating spatial fuzzy clustering with level set methods for au-tomated medical image segmentation. Comput. Biol. Med. 2011, 41, 1–10. [Google Scholar] [CrossRef] [PubMed]
- Brown, E.S.; Chan, T.F.; Bresson, X. Completely Convex Formulation of the Chan-Vese Image Segmentation Model. Int. J. Comput. Vis. 2012, 98, 103–121. [Google Scholar] [CrossRef]
- Dhanachandra, N.; Manglem, K.; Chanu, Y.J. Image Segmentation Using K -means Clustering Algorithm and Subtractive Clustering Algorithm. Procedia Comput. Sci. 2015, 54, 764–771. [Google Scholar] [CrossRef] [Green Version]
- Espindola, G.; Camara, G.; Reis, I.A.; Bins, L.S.; Monteiro, A.M. Parameter selection for region-growing image segmentation algorithms using spatial autocorrelation. Int. J. Remote. Sens. 2006, 27, 3035–3040. [Google Scholar] [CrossRef]
- Verma, K.; Mehrotra, A.; Pandey, V.; Singh, S. Image processing techniques for the enhancement of brain tumor patterns. Int. J. Adv. Res. Electr. Electron.Instrum. Eng. 2013, 2, 1611–1615. [Google Scholar]
- Sheet, D.; Garud, H.; Suveer, A.; Mahadevappa, M.; Chatterjee, J. Brightness preserving dynamic fuzzy histogram equalization. IEEE Trans. Consum. Electron. 2010, 56, 2475–2480. [Google Scholar] [CrossRef]
- Poddar, S.; Tewary, S.; Sharma, D.; Karar, V.; Ghosh, A.; Pal, S.K. Non-parametric modified histogram equalisation for contrast enhancement. IET Image Process. 2013, 7, 641–652. [Google Scholar] [CrossRef] [Green Version]
Figure 1.
Example of retinal images, (a,b) dark images, (c,d) uneven illumination of fundus images.

Figure 2.
Block diagram depicting the proposed method.

Figure 3.
Illustration of preprocessing for hemorrhage candidate and feature extraction, (a) original RGB image, (b) brightness adjustment behavior for different values of gamma, (c) contrast-enhanced image, (d) brightness adjustment using adaptive gamma correction.
Figure 3.
Illustration of preprocessing for hemorrhage candidate and feature extraction, (a) original RGB image, (b) brightness adjustment behavior for different values of gamma, (c) contrast-enhanced image, (d) brightness adjustment using adaptive gamma correction.


Figure 4.
Image sharpening (a) non-linear unsharp masking, (b) hand-crafted image for feature extraction.
Figure 4.
Image sharpening (a) non-linear unsharp masking, (b) hand-crafted image for feature extraction.

Figure 5.
Illustration of candidate extraction, (a) results of matched filter, (b) result of minimum local cross-entropy thresholding, (c) result of morphological opening, (d) search region for hemorrhages.
Figure 5.
Illustration of candidate extraction, (a) results of matched filter, (b) result of minimum local cross-entropy thresholding, (c) result of morphological opening, (d) search region for hemorrhages.

Figure 6.
Results of the different segmentation methods on the DIARETDB1 fundus images dataset.


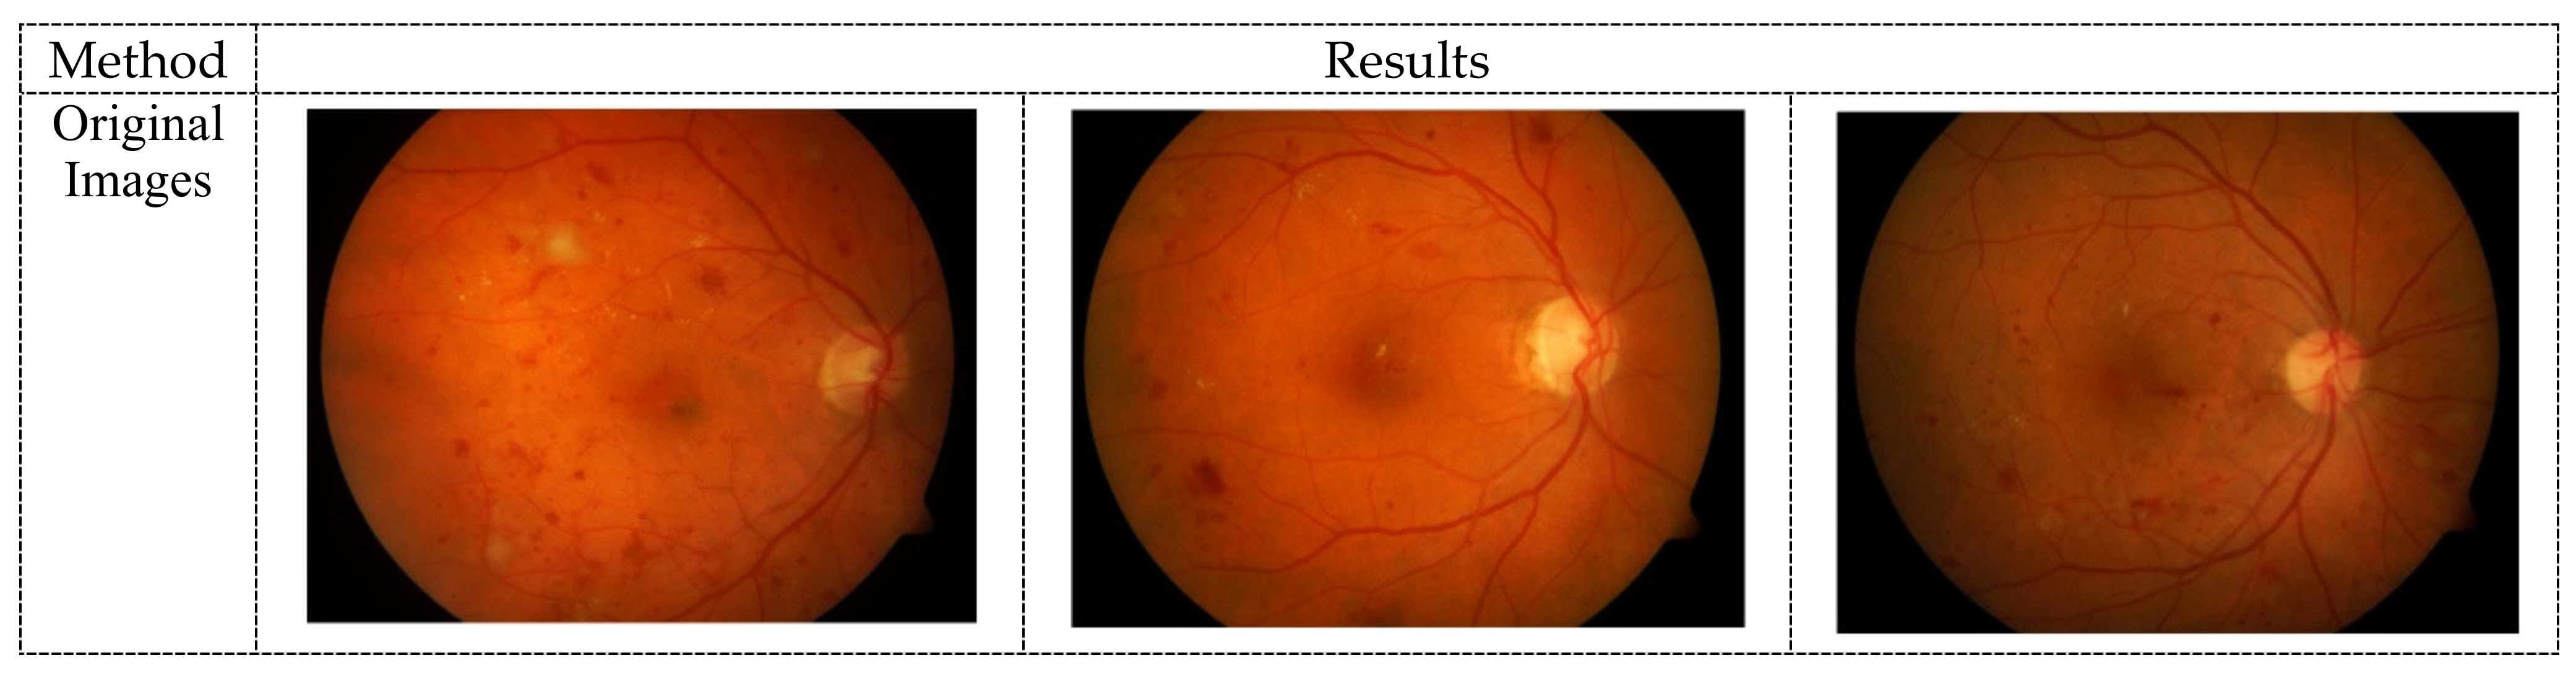
Figure 7.
Results of the different segmentation methods on the DIARETDB0 dataset.


Figure 8.
Results of pre-processing algorithm (a) original image, (b) HE, (c) AGCWD, (d) BPDFHE, (e) NMHE, (f) GAGC.
Figure 8.
Results of pre-processing algorithm (a) original image, (b) HE, (c) AGCWD, (d) BPDFHE, (e) NMHE, (f) GAGC.


Figure 9.
Statistical comparison of segmentation methods (DIARETDB1 dataset).

Figure 10.
Statistical comparison of segmentation methods (DIARETDB0 dataset).

Figure 11.
ROC curves of various kernels.


Table 1.
Statistical analysis of different methods on DIARETDB1 dataset.
| Method | Precision Rate (%) | Recall Rate (%) | F1 Score (%) |
|---|---|---|---|
| KMC | 48.88 | 86.49 | 62.46 |
| RG | 69.38 | 58.58 | 63.53 |
| ACC-V | 65.34 | 82.67 | 72.99 |
| ACMS | 74.68 | 61.51 | 67.45 |
| FCLS | 78.80 | 77.67 | 78.23 |
| SWAT | 83.97 | 83.74 | 83.85 |
Table 2.
Statistical analysis of different methods on DIARETDB0 dataset.
| Method | Precision Rate (%) | Recall Rate (%) | F1 Score (%) |
|---|---|---|---|
| KMC | 57.89 | 74.45 | 65.14 |
| RG | 55.92 | 61.50 | 58.58 |
| ACC-V | 59.86 | 71.48 | 65.15 |
| ACMS | 66.35 | 51.66 | 58.09 |
| FCLS | 65.73 | 67.41 | 66.56 |
| SWAT | 70.51 | 74.08 | 72.25 |
Table 3.
Results of the state-of-the-art contrast adjustment techniques.
| MSE | PSNR | IE | C | S | |
|---|---|---|---|---|---|
| HE | |||||
| AGCWD | |||||
| BPDFHE | |||||
| NMHE | |||||
| GAGC |
Publisher’s Note: MDPI stays neutral with regard to jurisdictional claims in published maps and institutional affiliations. |
© 2021 by the authors. Licensee MDPI, Basel, Switzerland. This article is an open access article distributed under the terms and conditions of the Creative Commons Attribution (CC BY) license (https://creativecommons.org/licenses/by/4.0/).
Share and Cite
MDPI and ACS Style
Aziz, T.; Ilesanmi, A.E.; Charoenlarpnopparut, C. Efficient and Accurate Hemorrhages Detection in Retinal Fundus Images Using Smart Window Features. Appl. Sci. 2021, 11, 6391. https://doi.org/10.3390/app11146391
AMA Style
Aziz T, Ilesanmi AE, Charoenlarpnopparut C. Efficient and Accurate Hemorrhages Detection in Retinal Fundus Images Using Smart Window Features. Applied Sciences. 2021; 11(14):6391. https://doi.org/10.3390/app11146391
Chicago/Turabian StyleAziz, Tamoor, Ademola E. Ilesanmi, and Chalie Charoenlarpnopparut. 2021. "Efficient and Accurate Hemorrhages Detection in Retinal Fundus Images Using Smart Window Features" Applied Sciences 11, no. 14: 6391. https://doi.org/10.3390/app11146391
Note that from the first issue of 2016, this journal uses article numbers instead of page numbers. See further details here.