
New Insight into Breast Cancer Cells Involving Drug Combinations for Dopamine and Serotonin Receptors


1
OncoPharma Research Group, Center for Health Technology and Services Research (CINTESIS), Rua Dr. Plácido da Costa, 4200-450 Porto, Portugal
2
Department of Pathology and Molecular Immunology, Institute of Biomedical Sciences Abel Salazar, University of Porto (ICBAS-UP), Rua Jorge Viterbo Ferreira 228, 4050-513 Porto, Portugal
3
i3S, Instituto de Investigação e Inovação em Saúde, University of Porto, Rua Alfredo Allen 208, 4200-135 Porto, Portugal
4
Department of Community Medicine, Information and Health Decision Sciences (MEDCIDS), Faculty of Medicine, University of Porto, Rua Dr. Plácido da Costa, s/n, 4200-450 Porto, Portugal
*
Author to whom correspondence should be addressed.
Appl. Sci. 2021, 11(13), 6082; https://doi.org/10.3390/app11136082
Submission received: 21 May 2021
/
Revised: 27 June 2021
/
Accepted: 28 June 2021
/
Published: 30 June 2021
(This article belongs to the Special Issue New Challenges in Integrative Biomedical Data Analysis)
Abstract
:The breast cancer therapies available are insufficient, especially since first-line treatments, such as paclitaxel, result in drug resistance and their toxicity often limits their concentration. Strategies like drug repurposing are beneficial, and novel treatments can emerge by repurposing drugs that interfere with the dopamine and serotonin receptors, and thus influence tumor growth. In this study, the MTT assay was used to test the efficacy of such repurposed drugs commonly used for neurodegenerative disorders that act on the dopamine and serotonin receptors to reduce the MCF-7 cell’s viability, either by their single use or in combination with the reference drug paclitaxel. Furthermore, the expression of vimentin and E-cadherin was assayed by immunofluorescence. The dopamine receptor-altering drugs benztropine and thioridazine resulted in the strongest reduction of cell viability when combined with paclitaxel, which may be connected to the alteration of E-cadherin rather than vimentin expression. More studies are needed to understand the mechanism of action of the combinations tested and the efficacious role of dopamine and serotonin.
1. Introduction
Paclitaxel has been widely used to treat several cancers such as breast, ovarian and lung cancer, among others [1]. Unfortunately, tumor resistance is one of the significant causes of death associated with treatment failure [2] and dose-dependent cytotoxicity [3]. The most common side effects of paclitaxel administration are hair loss, fatigue, nausea, vomiting, hypersensitivity reactions, myelosuppression, peripheral neuropathies and neutropenia [4]. These last two side effects are associated with reduced response rates of paclitaxel, although it varies from patient to patient [5]. The development of drug resistance in cancer rewires tumor metabolism and pharmacokinetics. In breast cancer, changes in fatty acid synthesis, redox metabolism, glycolysis and mitochondrial energy metabolism are associated with resistance to several drugs (adriamycin, tamoxifen, paclitaxel, trastuzumab and lapatinib). Therefore, complete tumor eradication is not always achievable [6]. Finding novel multitargeting drugs and combining them for personalized therapies will help overcome resistance and toxicity to chemotherapeutics in breast cancer. Tumors undergo multiple mutations and there are breast cancer stem cells that remain in the dormancy state (G0 phase of the cell cycle), safe from the action of chemotherapeutics and radiation [7,8].
Interestingly, clinical evidence suggests that breast cancer and neurodegenerative diseases are linked, indicating that some drugs can potentially be used for both therapeutic approaches. Evidence shows that dopamine and serotonin are associated with tumorigenesis regulation as they affect angiogenesis and cell proliferation [9,10]. Dopamine can reduce the frequency of cancer stem cells (CSC), inducing apoptosis. Some studies confirmed a significant synergism with conventional anticancer drugs by inhibiting tumor angiogenesis, which increased the patients’ life span [11]. Besides the effects on endothelial cells, dopamine can also act on mesenchymal stem cells and endothelial progenitor cells [12]. Serotonin stimulates the proliferation of endothelial cells and has also been associated with inflammatory processes. In vitro experiments demonstrated that serotonin stimulated tumor cell proliferation and prevented cell death [13,14]. In addition to acting straight on the tumor and its microenvironment, these neurotransmitters can modify the drugs’ efficiency for cancer treatment [15]. Current knowledge suggests that drugs that stimulate dopamine or inhibit serotonin can be clinically helpful. Validation of this crosstalk remains necessary [16].
This study aims to repurpose drugs that interfere with the dopamine and serotonin pathways and combine them with paclitaxel. The maximum efficacy with the lowest amount of toxicity should be guaranteed in this type of experiment [17,18]. According to the literature (Table 1), the drugs in question were selected for (1) their interference with dopamine and serotonin and (2) their described reductive effect on breast cancer cell viability. Due to their vast potential, in this study, the anticancer effect of thioridazine, quetiapine, benztropine, selegiline, rasagiline, tranylcypromine (2-PCPA) and m-chlorophenyl biguanide (m-CPBH) was assessed. As mentioned above, repurposing drugs meets the challenge of targeting CSCs, which significantly helps eliminate drug resistance [19]. Some of the drugs tested are reported to act on CSCs, an advantage for cancer treatment.
2. Materials and Methods
2.1. Materials
MCF-7 human mammary carcinoma cells were maintained in Dulbecco’s modified eagle (DMEM) medium, with 1% antibiotics and 10% fetal bovine serum (FBS), acquired from Millipore Sigma (Merck KGaA, Darmstadt, Germany). The drugs used were purchased from TOCRIS®, Sigma-Aldrich®, Cayman Chemical Company and MERK. Paclitaxel, thioridazine and quetiapine were dissolved in dimethyl sulfoxide (DMSO); benztropine, selegiline, rasagiline, 2-PCPA and m-CPBH were dissolved in autoclaved water. To ensure minimal cytotoxicity from DMSO, the concentration could not be higher than 0.1%. Paclitaxel, the antineoplastic drug, was used as a reference for breast cancer therapy.
2.2. Cell Line and Cell Culture
The MCF-7 cell line was obtained from the American Type Culture Collection (ATCC; Manassas, VA, USA) and kept according to ATCC’s recommendations at 37 °C and 5% CO2 in DMEM medium supplemented with 10% fetal bovine serum, 100 U/mL penicillin G and 100 µg/mL streptomycin. Cells were always maintained in the logarithmic growth phase. The media was renewed every two days, trypsinized with 0.25% trypsin-EDTA and subcultured in the same media. MCF-7 cells (1 × 10⁵ cell/well) were seeded in 48-well plates and allowed to adhere overnight before drug exposure. The cell culture media were then replaced with drug-containing media. Cells were exposed to drugs for 48 h before viability assays were performed to evaluate single and combination drug treatments on cell viability in these cells.
2.3. Drug Treatment
The half-maximal inhibitory concentration (IC50) value was first determined for each drug alone in MCF-7 cells. Paclitaxel concentrations ranged from 1 to 50 nM. The concentrations for the repurposed drugs ranged from 1 to 100 µM for the single-drug treatment. Combination studies were performed by combining paclitaxel with the repurposed drugs. Only drugs with the most promising pharmacological profiles, such as benztropine and thioridazine, were tested in combination with paclitaxel.
2.4. Growth Curve Determination
To obtain the growth curve and determine the doubling time (DT), MCF-7 cells were plated in a 48-well plate in the following concentrations: 1 × 10⁴ cells/mL, 3 × 10⁴ cells/mL and 1 × 10⁵ cells/mL. For 18 days, cells were counted using the LionHeart FX automated microscope until they reached the stationary phase. The growth curve and the doubling time were determined, respectively, by the logistic growth equation and the DT formula: DT = (ln2/K) (K is a constant also calculated by the software), using GraphPad software.
2.5. Cell Viability Assay
MCF-7 cells were plated in a 48-well plate at 1 × 10⁵ cells per well and incubated overnight, then exposed to the drugs for 24 h or 48 h.
Using a LionHeart FX automated microscope, images were taken to evaluate cell viability.
For the sulforhodamine B (SRB) protocol, the culture medium was removed and the cells were washed with phosphate buffered saline (PBS). They were fixed by adding 200 µL of 10% cold trichloroacetic acid (TCA) to each well and incubated at 4 °C for 30 min. The fixation solution was aspirated and allowed to dry. Next, 200 µL of SRB solution was added and the cells were incubated at room temperature, protected from light, for 1 h. Then, the plate was washed four times with slow-running tap water and excess water was removed using paper towels. The plates air-dried at room temperature. To finish, 400 µL of Tris-NaOH 10 mM was added and the plate was shaken for 5 min to solubilize the protein-bound dye. In an automated microplate reader, absorbance was measured at 510 nm (Sinergy HT, Biotek Instruments Inc., Winooski, VT, USA). This protocol was not carried out under sterile conditions.
For the Neutral Red protocol, the medium was aspirated from the cells and 200 µL of neutral red medium was added to each well of the plate. The plate was incubated for 2 h in appropriate culture conditions. After that, the neutral red medium was removed and the cells were washed with 300 µL PBS per well (the washing solution was removed by gentle tapping). Then, 300 µL neutral red de-staining solution was added to each well. The plate was shaken for at least 10 min (until a homogeneous solution had formed). In an automated microplate reader, absorbance was measured at 540 nm (Sinergy HT, Biotek Instruments Inc., Winooski, VT, USA). This protocol was not carried out under sterile conditions.
For the MTT protocol, 200 µM of MTT was added to each well, and the plates were incubated for 3 h. To solubilize the formazan crystals, 200 µM DMSO was added to each well after the incubation period. In an automated microplate reader, absorbance was measured at 570 nm (Sinergy HT, Biotek Instruments Inc., Winooski, VT, USA). Primarily, MCF-7 cells were exposed to the drugs for 48 h, and only the drugs that proved to reduce cell viability in that time were tested at 24 h. Dose-response curves and the half-maximal inhibitory concentration (IC50) were calculated using GraphPad. Drug concentrations were plotted on a base-10 logarithmic scale to produce a sigmoidal dose-response.
2.6. Analysis of Drug Interactions
Using CompuSyn software (ComboSyn, Inc., New York, NY, USA), the combination index (CI) was calculated using unified theory to quantify the drug interactions between paclitaxel and repurposed drugs, as envisioned by Chou and Talalay [28]. We employed the mutually exclusive model based on the assumption that drugs have entirely different modes of action. The two drugs were combined in a non-constant ratio of doses corresponding to their IC50 and 100 µM. To assess the drug synergism between drug combinations, the CI was plotted on the y-axis as the effect level (Fa) function on the x-axis. The CI is a metric for quantifying pharmacological interactions. Synergism is indicated by a CI of less than one, additive interaction by a CI of one and antagonism by a CI of more than one. Experiments were carried out in triplicate (n = 3) with three replications per drug concentration.
2.7. Liquid Chromatography Coupled with Mass Spectrometry (LC-MS)
The cell supernatant was collected at the end of 24 h and 48 h; the metabolic analysis was performed using LC-MS at Center of Materials of University of Porto (CEMUP), where the protocol was validated. The cells treated with paclitaxel, benztropine and thioridazine at the IC50 concentration and the cells treated with the combination of the reference and repurposed drugs (both at the IC50 concentration and its highest concentration, 100 µM) were the ones from which more of a conclusion could be drawn. Unfortunately, it was impossible to collect the supernatant of all the cells tested, and it was only possible to analyze 24 h of treatment for thioridazine.
2.8. Immunofluorescence of MCF-7 Cells Treated with Pharmaceutical Compounds
MCF-7 cells were plated on 24-well plates with coverslips at a concentration of 1 × 10⁵ cells per well and incubated for 24 h. The next day, cells were treated with paclitaxel (reference drug), benztropine and thioridazine (repurposed drugs), either alone or in combinations of the reference and repurposed drugs. Paclitaxel was administered at a concentration of 8.51 M when administered alone or 17.51 M when combined with the repurposed drugs. Benztropine’s concentration was 15.84 µM alone and 31.64 µM when combined with the reference drug. Thioridazine was used at 6.87 µM alone or 13.74 µM in combination with paclitaxel. Cells were incubated with the drugs for 48 h. After the incubation period, cells were washed with PBS, fixed with 4% paraformaldehyde and frozen at −20 °C. For the immunofluorescence test, the slides were washed three times with PBS and for 10 min with 50 mM NH4Cl. The slides were permeabilized with 0.2% Triton X-100 in PBS for 5 min at room temperature and blocked with rabbit serum diluted 1:5 in 10% bovine serum albumin (BSA) in PBS for 30 min. At 4 °C, the slides were incubated overnight with a primary antibody (Vimentin V9 1:500, Dako, M0725 and E-cadherin 24E10 1:400, mAb #3195) diluted in 5% BSA in PBS. The slides were washed with PBS and incubated with a secondary antibody (488 goat anti-mouse, ab150113) for 30 min in 5% BSA in PBS. The nucleus was stained with DAPI 1:100 in PBS for 10 min at room temperature. At last, the slides were washed two times with PBS and mounted with VECTASHIELD® to preserve the fluorescent signal’s intensity.
2.9. Data Analysis
GraphPad Prism 8 (GraphPad Software Inc., San Diego, CA, USA) was used to generate nonlinear regression concentration-response curves. The viability of cells treated with each drug was normalized to the viability of control cells, and cell viability fractions were plotted vs drug concentrations on the logarithmic scale.
2.10. Statistical Analysis
GraphPad Prism 8 software was used to analyze all of the data. All trials were carried out at least three times independently (n = 3). The results are given as arithmetic mean and standard error of the mean (SEM). For multiple comparisons, a one-way ANOVA test was performed, considering p < 0.05 as statistically significant. For the IC50 calculation, we transformed the values of the x-axis, normalized that transformation and calculated the nonlinear fit of the normalized transformation. A two-way ANOVA test was used to compare the reduction of cell viability at 24 h and 48 h.
3. Results
3.1. Growth Curve: Ensuring Uniform Growth over Time
The determination of the growth curve for the MCF-7 cells was based on three different initial cell densities, as mentioned above. The curve obtained with the initial cell density of 3 × 10⁴ cells/mL was selected to assess the number of cells necessary to seed the plates (Figure 1). Plates were seeded with 1 × 10⁵ cells/mL to perform the assays.
The doubling time of MCF-7 cells is 30 to 40 h, and we obtained doubling times of 37 h, 33 h and 30 h for 1 × 10⁴ cells/mL, 3 × 10⁴ cells/mL and 1 × 10⁵ cells/mL, respectively. Therefore, the MCF-7 cells used in our study were within the typical doubling time values, according to ATCC specifications.
3.2. Evaluation of the Most Suitable Viability Assay for MCF-7 Cells
Imaging from LionHeart demonstrated reproducibility for the tested concentrations with paclitaxel in MCF-7 cells, either over 24 or 48 h. However, for the repurposed drug benztropine, at the highest concentration (100 µM), imaging from LionHeart exhibited a giant cluster of cells, especially at 24 h, which made it difficult for the correct counting of viable cells, which led us to discard this model (Figure 2). The cluster formed may be due to the mechanism of adaptation of the cell in the presence of benztropine.
The SRB assay had the lowest variability between experiments of all the assays tested in this study. However, the rise of protein synthesis at the lowest and middle concentrations compared with the control group disabled the assessment of the decrease of cell viability as the concentration of the tested drugs rose, as observed for benztropine and Paclitaxel (Figure 3). Perhaps these discrepancies are due to the adaptation mechanisms of cells to the drugs tested [29]. As a result, in our model, this method is not the best for determining cell viability.
Using the neutral red (NR) assay, there was no possibility of seeing a decrease in cell viability on MCF-7 cells, and different values were obtained in each assay (Figure 4), possibly due to compound interferences. It was not even possible to calculate the benztropine IC50 value. By comparing the results obtained from these different methods for the MCF-7 cells treated with paclitaxel and benztropine, the MTT assay proved to be the most suitable for evaluating paclitaxel; all the experiments were done using this method as shown from hereon.
3.3. Cytotoxicity Induced by Paclitaxel Administration
Paclitaxel was formulated in 0.1% DMSO, and the concentrations used in the assays with MCF-7 were: 1, 2.5, 5, 10 and 50 nM. Paclitaxel exposure for 24 h proved to be less effective in causing cytotoxicity than the effect on cell viability of MCF-7 observed after 48 h (Figure 5). A minimal concentration of 5 nM is needed to induce cytotoxicity by paclitaxel in MCF-7 at 48 h. All the MCF-7 cells exposed to paclitaxel over 24 h and 48 h exhibited dose-response curves, more pronounced at 48 h. Values for the IC50 of paclitaxel in MCF-7 cells over 24 h and 48 h can range between 2.5 and 7.5 nM, [30,31]. The IC50 values of 10.40 and 8.15 nM, obtained for 24 and 48 h, respectively, were considered within the acceptable range (Figure 6).
Additional analysis demonstrated that the cell viability of MCF-7 cells between 24 h and 48 h was significantly lower for the 5 nM (p < 0.05), 10 nM, and 50 nM concentrations (p < 0.0001). These data confirm that prolonged drug time exposures are more effective (Figure 7).
3.4. Screening of the Selected Repurposed Drugs
This study investigated whether commonly used drugs for neurodegenerative disorders that act on the dopamine and serotonin receptors could affect cancer cells more significantly than paclitaxel (the reference drug). All the repurposed drugs were tested at the following concentrations: 1, 5, 10, 50 and 100 µM for 48 h and 24 h in MCF-7 cells.
3.4.1. Quetiapine
MCF-7 treatment with quetiapine significantly reduced cell viability at the 50 and 100 µM concentrations (p < 0.05 and p < 0.01, respectively) (Figure 8).
At a 10 µM concentration, cell viability increased compared to the control, possibly due to drug interactions with the MTT. A dose-response curve was calculated, and the IC50 value for quetiapine was determined at 46.63 µM (Figure 9). However, the IC50 values found were deemed too high for our purposes, and this drug was ruled out of further research.
3.4.2. Selegiline, Rasagiline, 2-PCPA and m-CPBH
The cells were exposed to each of these drugs: selegiline, rasagiline, 2-PCPA and m-CPBH, separately, for 48 h. However, no significant effect on cell viability was noticed in MCF-7 cells with any of them (Figure 10). Consequently, these four drugs were excluded from further analysis.
3.4.3. Thioridazine
Thioridazine reduced cell viability at 24 h and 48 h (Figure 11). Only at 48 h did we have a significant reduction in MCF-7 cell viability for the 5 (p < 0.01), 10, 50 and 100 µM concentrations (p < 0.0001).
The dose-response curve was obtained for 48 h and the IC50 value calculated was 6.86 (Figure 12). Although prolonged exposure of MCF-7 cells to thioridazine seemed to be more effective, additional analysis demonstrated no significant differences between a 24 h and 48 h exposure for any of the concentrations used (Figure 13).
3.4.4. Benztropine Mesylate
MTT assay results demonstrated a significant decrease in cell viability at 24 h and 48 h, induced by benztropine administration (Figure 14). At 24 h, the decrease in cell viability was statistically significant for 1, 50 and 100 µM concentrations of benztropine (p < 0.01, p < 0.001, p < 0.0001, respectively). At 48 h, the decrease in cell viability was statistically significant (p < 0.0001) for the following concentrations: 5, 10, 50 and 100 µM. In the MCF-7 cells, the IC50 obtained for benztropine was 51.88 µM for 24 h and 15.84 µM for 48 h (Figure 15). The cytotoxicity effect of benztropine results from a dose-dependent reduction of cell viability percentage.
Comparison of the 24 h and 48 h exposures to benztropine (Figure 16) shows more effective prolonged exposure at 5, 10 (p < 0.001) and 50 µM (p < 0.0001); the cell viability is significantly lower at 48 h than at 24 h.
3.5. Combinations of the Reference and Repurposed Drugs
The repurposed drugs tested in MCF-7 cells with the most promising results for reducing cell viability were benztropine and thioridazine. Therefore, they were chosen to be used in combination with paclitaxel (the reference antineoplastic drug).
3.5.1. Paclitaxel and Benztropine Mesylate
The paclitaxel and benztropine concentrations used in this test were based on the IC50 values determined in the cell viability assays performed in Section 3.3 and Section 3.4.4; both drugs were tested individually and in combination.
The combination of these drugs proved to be highly effective with a more pronounced effect, below 50%, compared to the control. The IC50 values used for both drugs resulted in reduced cell viability down to the halfway point. The results showed that paclitaxel and benztropine are similar in reducing MCF-7 cell viability. Combining these two drugs at the highest concentration (100 µM) highlights the efficacy of benztropine, showing a consistent reduction of cell viability (Figure 17). The effects of the combined administration were significantly better than the effects of paclitaxel alone. All the results were statistically significant, showing a consistent reduction of MCF-7 cell viability.
3.5.2. Paclitaxel and Thioridazine
The IC50 values obtained in the cell viability assays performed in Section 3.3 and Section 3.4.3 were used to calculate paclitaxel and thioridazine concentrations for this assay. The cells seeded either with paclitaxel or thioridazine were expected to reduce at least 50% of the MCF-7 cell viability compared to the control. The reduction of cell viability was similar between the reference drug and the repurposed one. Furthermore, the combined administration effect was more pronounced than the use of the drugs individually, below 50% in comparison with the control (Figure 18). All the results were statistically significant, showing a consistent reduction of MCF-7 cell viability.
3.5.3. Synergistic Effect of Combination
Using the CompuSyn program, the synergistic effect was measured for the combined drugs. The combination index (CI) was calculated using the Chou-Talalay method [28]. The results of the effects of combinations are represented in Table 2. A combination of paclitaxel + benztropine demonstrated synergism (CI < 1) in both combinations tested (Figure 19). The lowest and highest doses of benztropine produced the following effects: 0.7434 and 0.915, respectively. The combination of paclitaxel and thioridazine resulted in a synergistic (CI < 1) and antagonistic effect (CI > 1). The combination with the lowest thioridazine concentration, corresponding to its IC50, resulted in a synergistic effect. Using thioridazine at a 100 µM concentration resulted in an antagonistic effect. By applying these different concentration values for thioridazine (6.87 and 100 µM), we generated similar effects, 0.7851 and 0.8681.
3.6. LC-MS Analysis
The supernatants of cells treated individually with paclitaxel, benztropine and thioridazine, at concentrations equivalent to their IC50 and their combinations, were analyzed to gather information on their action mechanism (Supplementary Materials—Figures S3–S11). At the IC50 concentration, paclitaxel enters the cell, either when used alone or in combination with the repurposed drugs (Supplementary Materials—Figure S5). Its base peak was challenging to observed, either for cells treated with the reference drug alone or in combination, suggesting that, at the concentration tested, paclitaxel was absorbed by the MCF-7 cells. MCF-7 cells also absorbed benztropine either at its IC50 concentration or with 100 µM. However, the combined administration of benztropine and paclitaxel resulted in the increased relative abundance of the benztropine peak, which may be due to the interaction of the cell receptors with the drug. Paclitaxel is more selective to MCF-7 cells than benztropine (Supplementary Materials—Figures S6–S8). In the MCF-7 cells treated with thioridazine individually (contrary to benztropine), it was already possible to see a higher peak. This drug does not fully enter the cells.
In combination, the peak of thioridazine increases, suggesting that there exists an excess of the drug that is not used to produce the reduction of viability (Supplementary Materials—Figures S9–S11). Also, by analyzing the metabolites produced in the cells treated with the combination, it was possible to find both molecules (reference drug and the repurposed drugs), with more repurposed drugs. The presence of metabolites and/or signs of the initial drugs on the chromatograms was observed, particularly with thioridazine, indicating that the drugs (or their metabolites) had entered the cells; their activity could have resulted from this. At their highest concentration (100 µM), comparing the cells treated with paclitaxel with the ones treated with paclitaxel and the repurposed drugs, the same metabolites were observed, suggesting that the effect of reduction on viability is due to the presence of benztropine and thioridazine. Unfortunately, we cannot draw more conclusions from this study due to the impossibility of performing quantitative analysis or identifying the metabolites.
3.7. Vimentin Expression Is Altered by Drug Administration in MCF-7 Cells
Vimentin expression was reduced after 48 h of MCF-7 cells’ exposure to paclitaxel compared to non-treated cells (Figure 20A,B). When cells were treated with the repurposed drugs alone, similar results were obtained, with almost no vimentin expression (Figure 20C,D). The cells treated with the combination of repurposed drugs with the reference drug presented decreased vimentin expression compared to the non-treated cells (Figure 20A,E,F). However, combined administration seemed to lead to a different expression pattern, with slightly more vimentin expression than was observed after single-drug treatments.
3.8. E-cadherin Expression Is Altered by Drug Administration in MCF-7 Cells
The MCF-7 cells expressed E-cadherin (Figure 21A); however, the expression levels were lower than expected. Treatment with the reference drug led to a slight reduction of E-cadherin compared to the control (Figure 21B). Compared to the control cells, the cells treated with the repurposed drugs showed reduced or almost no expression of E-cadherin (Figure 21C,D). However, when the cells were treated with the combinations of drugs—benztropine + paclitaxel or thioridazine + paclitaxel —there was only a slight reductive effect on E-cadherin expression (Figure 21E,F). This effect was more accentuated for thioridazine combined with paclitaxel.
4. Discussion
4.1. Study Design
The human breast cancer MCF-7 cell line has estrogen and progesterone receptors, belongs to the luminal A molecular subtype and is considered poorly aggressive and non-invasive with low metastatic potential. These cells also have an elevated level of genetic instability, containing a fraction of stem cells to generate clonal viability [32]. Experimentally, the MCF-7 cell line is easy to use and has the advantage of being a long-established breast cancer model, facilitating research and increasing in vitro assays’ reliability. However, it is crucial to understand its limitations and consider them while designing experiments and interpreting results. Since MCF-7 cells are broad, the outcomes of the results will be general. A study on a triple-negative cell line could highlight the efficacy of the drugs tested.
Growth curve optimization is always mandatory before drug screening to determine the innate cell’s characteristics, such as the exponential phase; therefore, plates were seeded with 1 × 10⁵ cells/mL to perform the assays.
The concentrations used to assay the efficacy of cell viability in MCF-7 cells were chosen after reviewing the available concentrations and IC50 values in the literature. Following that, a trial experiment was conducted to determine the approximate range of drug sensitivity for cell lines, and the following concentrations for the repurposed drugs: 1, 5, 10, 50 and 100 µM, were selected. Preferably, the two lowest doses should elicit little or no response, and the two highest doses should elicit a maximal response [33].
Then, the MCF-7 cells were tested for cell viability using a variety of methods; the MTT assay had the highest reproducibility for the MCF-7 cells.
LionHeart formed a cluster of MCF-7 cells exposed to the highest concentration of benztropine, which disabled the count. The SRB assay measured the total cellular protein content, not relying on cell function. However, the rise of protein synthesis at the lowest and middle concentrations compared with the control group disabled the assessment of the decrease of cell viability; perhaps these discrepancies were due to cell adaptation mechanisms to the drugs tested [29]. As a result, in our model, this method was not the best for determining cell viability. NR assay cell enumeration is independent of enzymatic conversion, and the assay is dependent on intracellular dye accumulation in cellular lysosomes [34]. The outcomes are expected to differ depending on the cell line used, the drugs and their mechanisms of action [34].
MTT assay is widely used to screen anticancer drugs due to its high reproducibility. The dye’s enzymatic conversion to formazan crystals, which occurs in numerous organelles including the mitochondria and endoplasmic reticulum, is used to assess cell viability (or cytotoxicity). Nevertheless, MTT has limitations since the conversion to formazan crystals depends on metabolic rate and mitochondria, resulting in many interferences [34]. Moreover, since it is an absorbance-based assay, it can be less sensitive to sense minor changes. Therefore, it is essential to validate results that directly measure cell apoptosis and necrosis, such as caspase activation, membrane alteration or DNA fragmentation [35].
4.2. Chemotherapeutic of Reference: Paclitaxel
Unlike other tubulin-targeting drugs that inhibit microtubule assembly, paclitaxel stabilizes the microtubule polymer and protects it from disassembly. Clinically, high resistance to this drug is observed as one of the significant causes of death associated with treatment failure. ABC transporters, microRNAs or mutations in other genes are examples of contributors to paclitaxel resistance. Paclitaxel side effects, such as hypersensitivity or peripheral sensory neuropathy (with significant neutropenia), limit this drug’s dose, resulting in lower response rates. Paclitaxel’s effects are time and dose-dependent. The concentrations used in this screening were chosen based on the literature [30,31], with concentrations above 50 nM not included. Increasing concentrations above that value would not result in additional cytotoxicity after 24 h of drug exposure.
The results we obtained were in accordance with the literature. We obtained a great response for paclitaxel using only 5 nM, and we could verify in our experiments that prolonged exposure of tumor cells to paclitaxel (for 48 h) is more effective than exposure for 24 h (Figure 7).
Paclitaxel’s efficacy is dependent on combination with other chemotherapeutic agents, and the sequence of chemotherapy administration is essential. However, these combinations are usually toxic and resistance is a significant problem. The combination of paclitaxel with repurposed drugs has the potential to mitigate these difficulties.
4.3. Screening of the Selected Repurposed Drugs
Since only benztropine and thioridazine demonstrated the capacity to reduce MCF-7 cell viability, we will proceed with the discussion focusing only on these two drugs. Quetiapine, selegiline, rasagiline, 2-PCPA and m-CPBH did not meet our criteria.
4.3.1. Thioridazine
Thioridazine is a dopamine receptor antagonist that displays antipsychotic activity, used to manage psychoses including schizophrenia and control severely disturbed or agitated behavior. It has been shown to arrest proliferation and induce apoptosis in a broad spectrum of cancer cell lines, including breast cancer. Thioridazine triggers apoptosis by targeting the PI3-K/Akt/mTOR/p70 S6K pathway and induces G1 cell cycle arrest. More recently, in an identification study of drugs that can selectively target cancer stem cells, it was demonstrated that thioridazine could target CSCs due to the inhibition of dopamine receptor 2 (DRD2). Besides, some studies demonstrate that the self-renewal of several, but not all, triple-negative breast cancer cell lines is also inhibited by thioridazine [36,37]. In our study, thioridazine proved to be efficient at reducing cell viability both at 24 h and 48 h (Figure 11). Cytotoxicity augmented with increasing concentrations, and the dose-response curve, was obtained over 48 h, with the IC50 value equal to 6.86 µM (Figure 12), demonstrating that with small doses, this drug already has a pronounced effect on MCF-7 cell viability. Despite the efficiency of this drug being better described for other cell lines, thioridazine makes an excellent candidate for repurposing and combination treatments on breast cancer.
4.3.2. Benztropine Mesylate
Benztropine’s main indication is for Parkinson’s disease, and the pharmacological effects come from its anticholinergic activity. It is a centrally acting antihistamine and dopamine reuptake inhibitor. To date, no studies on the MCF-7 cell line can be found. In 2017, extensive research regarding this drug’s efficacy on a triple-negative breast cancer cell line (MDA-MB-231) was performed. The inhibitor function of benztropine for CSCs in vivo and in vitro was described. This inhibitory effect was mediated by acetylcholine receptors, dopamine transporters/receptors and/or histamine receptors—CSCs, for example, cause increased acetylcholine receptor expression levels [24]. Recently, Sogawa et al. showed, by inhibiting the dopamine transporter SLC6A3 and reducing the signal transducer and activator of transcription, that benztropine suppresses tumor growth, circulating tumor cells and metastasis [38]. The study clarified that the antitumor effect does not involve dopamine or dopamine receptors and suggested the involvement of dopamine transporter SLC6A3. This transporter is usually genetically amplified in several types of cancers and involved in a poor prognosis, and therefore, is susceptible to active dopamine transporter (DAT) inhibitors such as benztropine [38].
Benztropine displayed a statistically significant decrease in cell viability at all the concentrations tested, both at 24 h and 48 h (Figure 14). Moreover, in comparison with the study published by Sogawa et al., the IC50 calculated for other cell lines was 16.5 µM (Figure 15), which is very close to the value obtained in our experiment (15.84 µM for 48 h). All of this makes this drug a strong candidate for repurposing and combination.
4.4. Combination
The repurposed drugs tested in MCF-7 cells with the most promising results for reducing cell viability were benztropine and thioridazine. Therefore, they were chosen to be used in combination with paclitaxel (the reference antineoplastic drug). Figure 22 illustrates the model of combination used to test the efficacy of the drugs when combined. The results demonstrate that their combination with paclitaxel is more effective than the single use of the repurposed or the reference drug. Furthermore, it is essential to keep in mind that since paclitaxel is the reference drug for this type of cancer, we expected that a low drug concentration (scale of nM) would be necessary to have pronounced effects on cell viability. Therefore, repurposed drugs need higher amounts to have similar effects, with their concentrations on a scale of µM.
4.4.1. Paclitaxel and Benztropine Mesylate
The combination of these drugs was revealed to be very effective. The IC50 values used for both drugs resulted in a reduction of cell viability down to the halfway point. Paclitaxel and benztropine are very similar in reducing MCF-7 cell viability (Figure 17).
Moreover, it is worth noting the difference in the scale of the concentrations used to test both drugs. For paclitaxel, the concentration is in nanomoles, and for benztropine, the concentration is in micromoles. Therefore, benztropine, to have the same effect as paclitaxel, needs to be used in higher concentrations. Nonetheless, these concentrations are not too high to cause toxicity. We tested the combination of paclitaxel with benztropine at the highest concentration (100 μM) to highlight the efficacy of benztropine.
Additionally, a study on the new use of old drugs tested the same combination in the MDA-MB-231 cell line and compared the combination treatment with benztropine alone; the combination was more efficient [24], which is in accordance with our results. Interestingly, another article reported the neuroprotective effect of benztropine, associated with lower expression of inflammatory cytokines [39]. On the contrary, as first-line conventional cancer chemotherapy, paclitaxel has limited efficacy due to peripheral neuropathy. However, this situation could be countered on the combined administration by protecting the peripheral neurons with benztropine, reversing paclitaxel’s side effect.
4.4.2. Paclitaxel and Thioridazine
Thioridazine has been explored as a substitute for antitumor drugs since it has been proposed that cancer chemotherapeutics often benefit from the combination of different anticancer drugs. Since discovering thioridazine’s efficacy in breast cancer cells, the efficacy in combination with other chemotherapeutics such as doxorubicin (in a codelivery study using nanoparticles) has been extensively researched [40]. Our research demonstrates the capacity of the combination of thioridazine and paclitaxel to reduce MCF-7 cell viability (Figure 18).
4.4.3. Synergistic Effect of Combination
A combination of paclitaxel + benztropine demonstrated synergism (CI < 1) in both combinations tested (Figure 19). These drugs work together to produce an effect more potent on MCF-7 cells. On the contrary, the combination of paclitaxel + thioridazine resulted in a synergistic (CI < 1) and antagonist effect (CI > 1). The combination with the lowest thioridazine concentration, corresponding to its IC50, resulted in a synergistic effect (Figure 19). Using thioridazine at 100 µM concentration resulted in an antagonist effect. It is interesting to see this duality with thioridazine since it indicates that at lower doses, the mechanism of paclitaxel is potentiated, without the need to overly increase thioridazine’s concentration.
This study suggests that the selected repurposed drugs have anticancer activity, by decreasing cell proliferation. Synergism was evaluated using the Chou–Talalay method based on the median-effect equation derived from the mass-action law principle [41]. This unified theory encompasses the Michaelis–Menten, Hill, Henderson–Hasselbalch and Scatchard equations in biochemistry and biophysics. It provides a quantitative definition for additive effect (CI = 1), synergism (CI < 1) and antagonism (CI > 1) in drug combinations. Our results demonstrated that benztropine and thioridazine as single agents can decrease cell viability in a concentration-dependent manner, and their combination can improve the anticancer activity of paclitaxel in MCF-7 cells. These results imply that these drugs may be a promising chemosensitizing compound for enhancing paclitaxel’s cytotoxic effects. Since benztropine and thioridazine are already on the market, they can be used in clinical practice for anticancer treatment. More research into other breast cancer cell lines is needed because different breast cancer cell lines have different metabolic profiles, phenotypic and genotypic characteristics and drug resistance patterns (such as MDA-MB-231). According to previous research, benztropine could inhibit CSC functions via acetylcholine receptors, dopamine transporters/receptors and/or histamine receptors, which in combination with the paclitaxel capacity of multipolar divisions can be a promising therapeutic option. In the case of thioridazine, it is known to interfere in critical oncogenic pathways, such as the PI3-K/Akt/mTOR pathway, and induce G1 cell cycle arrest, which sensitizes cancer cells by enhancing antineoplastic drugs’ activity. Nevertheless, to better understand the anticancer mechanisms underlying these combinations, more mechanistic research is needed. These combinations should also be investigated for other types of cancer, such as prostate cancer.
4.5. LC-MS Analysis
LC-MS analysis further confirms the effects of benztropine and thioridazine, alone and in combination with paclitaxel. Yet, the analysis was merely qualitative; it would be fascinating to proceed with quantitative analysis to facilitate the investigation of the mechanisms underlying this effect on cell viability. Future research could include a more detailed analysis of the combination’s metabolism and action mechanism, predicting the proposed combinations’ effectiveness and toxicity. Moreover, it was impossible to analyze all treatments since the drugs formulated with DMSO interfered with the column of LC, hindering the results.
4.6. Vimentin Expression Is Altered by Drug Administration in MCF-7 Cells
Vimentin is a major part of the cytoskeleton of mesenchymal cells usually used as a marker of mesenchymal-derived cells or cells undergoing an epithelial-to-mesenchymal transition, both normal and metastatic. Therefore, vimentin expression contributes to breast cancer malignancy [42]. Higher vimentin levels contribute to the poor survival rate in patients after taxane and anthracycline chemotherapeutic treatment, suggesting that vimentin has a possible role in cancer progression [43]. Drugs that can either block the formation of vimentin-tubulin complexes or keep the expression of vimentin (and other epithelial-mesenchymal transition (EMT= markers) at the basal level are an asset to cancer therapy.
The vimentin expression pattern varies in MCF-7 cells with different treatment exposures. Since the cell viability assays suggested that the combined administration is more effective in reducing MCF-7 viability than the drugs alone, we expected similar vimentin expression levels for both treatment schemes. However, this was not the case; further studies are needed to better understand the mechanisms responsible for cell viability. This observation complements what has been observed on the cell’s chromatogram treated with thioridazine and paclitaxel in combination (Figure 20).
4.7. E-cadherin Expression Is Altered by Drug Administration in MCF-7 Cells
MCF-7 cells express E-cadherin (Figure 21A); however, the expression levels are lower than expected. According to the literature, non-treated MCF-7 cells typically express high E-cadherin levels and express low levels of or even no vimentin. However, we observed a slightly different pattern in our experiment, with a similar expression of both markers in non-treated cells (Figure 20A and Figure 21A). Increased vimentin expression in MCF-7 is associated with an increase in the cell migration rate, increase in the EMT’s upregulation, and decrease in E-cadherin’s downregulation.
Treatment with the reference drug led to a slight reduction of E-cadherin compared to the control (Figure 21B). When compared to the control cells, for the cells treated with the repurposed drugs it is possible to see a reduction in or almost no expression of E-cadherin (Figure 21C,D). However, when the cells are treated with the combinations of drugs—benztropine plus paclitaxel or thioridazine plus paclitaxel—there is only a slight reductive effect on E-cadherin expression (Figure 21E,F). This effect is more accentuated for thioridazine combination with paclitaxel. Comparing this result with the cell viability assays shows that the treatment decreases cell viability due to alteration of E-cadherin expression with a slight effect on vimentin expression. Further analyses are necessary to understand the combination mechanism that reduces cell viability and explore possible effects on EMT transition induced by drug administration. Additionally, the cells treated with combined drugs have more vacuoles, which is a sign of stress, and the cell morphology is quite different (less rounded, Figure 22).
4.8. Study Considerations and Future Research
Benztropine and thioridazine had the desired effect on cell viability. However, we were not able to yet unveil what is happening at the cellular level. Further studies are needed to understand if the drugs used induce cell apoptosis, influence cell proliferation or restrict cell viability. Due to the complex molecular signaling pathway involved in cancer cells, it is crucial to search for drugs that can interfere with already specified mechanisms, especially in new ones. Resistance mechanisms to the available drugs are one of the major health problems nowadays.
Regarding cancer, changes in expression and adaptability can be one of the strategies adopted by the cells. It would be interesting to search for dopamine and serotonin’s detailed expression patterns to improve their inhibiting capacity, leading to more specific and targeted treatment. Additionally, isolating cancer stem cells and identifying therapies that specifically kill this cell population will improve patient treatment and survival. The mechanisms by which CSCs escape chemotherapy and cause chemoresistance are highly complex, and further analysis is necessary regarding the effects of the combination in the concentrations tested.
Recently, the focus on treatments that only result in temporary growth inhibition and tumor bulk reduction has been deviated from toward treatments that target the stem cell population, such as benztropine and thioridazine. To make this study more complete, it would be necessary to test the effects of the combination proposed on a non-tumorigenic cell line, MCF-10A. If the effects of the combination on cell viability were more significant than the effects of paclitaxel, the combined administration would be considered toxic. Therefore, further analysis is necessary for the viability of non-tumorigenic cell lines. This study aims to find alternatives to conventional chemotherapeutic agents. Preferably, these agents should have high efficacy and efficiency in killing breast cancer cells but with low toxicity for healthy cells. No drug is innocuous, but some are more aggressive, which interferes with patients’ wellbeing, reducing their quality of life during treatment. It would also be interesting to learn whether the combination tested in this study is effective in other subtypes of breast cancer, such as more aggressive ones, and compare the cytotoxicity of healthy cells treated with the combination with that of ones treated only with paclitaxel. Since the discovery of benztropine’s effects in breast cancer, there has been a race toward its characterization and our understanding of its utility to treat. When it comes to clinical treatments, the combination may cause problems. Patients may experience side effects due to their treatment, and determining which compound is to blame can be difficult. As a result, calculating dosages can be difficult. If the patient’s combination therapy is not carefully planned, it can lead to financial and health-related issues [44]. Drug interaction must be carefully considered in clinical practice because one drug’s metabolic activity can interfere with the secondary drug’s metabolic activity, for example, causing toxicity accumulation [18].
5. Conclusions
Breast cancer remains an incurable disease for most patients, despite significant pharmacological advances in its treatment. So, the search for new therapies must go on. Since many breast cancer chemotherapeutic agents have a slew of negative side effects, the development of potent compounds that are specific to tumor cells but do not have harmful side effects on normal mammalian cells is a major challenge. According to our results, the combination with a dopamine receptor-altering drug (benztropine or thioridazine) is synergistic (and antagonistic only for the combination of paclitaxel and thioridazine at its highest concentration). The combination reduces MCF-7 cells’ viability, and consequently, we can affirm that it inhibits cell growth. We also observed that the treatment of MCF-7 cells results in decreased expression of vimentin. As well as this, we observed a partial reduction of E-cadherin expression; however, more studies are needed to confirm this result. Considering the efficacy for long-term administration as an antipsychotic, it is possible to conclude that the described combinations of repurposed drugs with paclitaxel present promising candidates as less-cytotoxic chemotherapeutic agents for breast cancer treatment, potentially improving treatment options for this currently incurable disease. However, better knowledge of the mechanisms of action underlying these drug combinations is required to understand the role of dopamine and serotonin. Moreover, it would be interesting to perform more advanced work in vivo to get closer to possible future human applications.
Supplementary Materials
The following are available online at https://www.mdpi.com/article/10.3390/app11136082/s1. Figure S1: Growth curve of MCF-7 cell growth in culture. Initial cell density of 1 × 10⁴ cells/mL. Results are expressed as mean ± standard error of the mean (SEM) in three independent experiments (n = 3). Figure S2: Growth curve of MCF-7 cell growth in culture. Initial cell density of 1 × 10⁵ cells/mL. Results are expressed as mean ± standard error of the mean (SEM) in three independent experiments (n = 3). Figure S3: LC-MS chromatogram of the supernatant obtained from the MCF-7 cells without treatment. Figure S4: LC-MS chromatogram of the supernatant obtained from the MCF-7 cells treated only with paclitaxel, at the IC50 concentration, for 48 h. The base peak is vestigial; the m/z is 853. Figure S5: LC-MS chromatogram of the supernatant obtained from the MCF-7 cells treated with benztropine at the IC50 concentration for 48 h. The base peak is low; the m/z is 308.2. Figure S6: LC-MS chromatogram of the supernatant obtained from the MCF-7 cells treated with benztropine at the highest concentration, 100 µM, for 48 h. The base peak is low; the m/z is 308.2. Figure S7: LC-MS chromatogram of the supernatant obtained from the MCF-7 cells treated with a combination of benztropine and paclitaxel at the IC50 concentration. The m/z is 308.2 for benztropine (left) and 854.4 for paclitaxel (right). Figure S8: LC-MS chromatogram of the supernatant obtained from the MCF-7 cells treated with a combination of benztropine at the highest concentration, 100 µM, and paclitaxel at its IC50 concentration for 48 h. The base peak is low; the m/z is 308.2. Figure S9: LC-MS chromatogram of the supernatant obtained from the MCF-7 cells treated with thioridazine after 24 h of treatment at the IC50 concentration; the m/z is 371.16. Figure S10: LC-MS chromatogram of the supernatant obtained from the MCF-7 cells treated with thioridazine at the IC50 concentration; the m/z is 371.16. Figure S11: LC-MS chromatogram of the supernatant obtained from the MCF-7 cells treated with a combination of thioridazine and paclitaxel at the IC50 concentration for 48 h. The m/z is 371.11 for thioridazine (left) and 854.4 for paclitaxel (right).
Author Contributions
Conceptualization, N.V.; methodology, B.C. and R.M.; formal analysis, B.C., R.M., I.A., F.G. and N.V.; investigation, B.C.; resources, I.A.; F.G. and N.V.; writing—original draft preparation, B.C.; writing—review and editing, B.C., R.M., I.A., F.G. and N.V.; supervision, N.V.; project administration, N.V.; funding acquisition, N.V. All authors have read and agreed to the published version of the manuscript.
Funding
This work was supported by Fundação para a Ciência e Tecnologia (FCT, Portugal) and FEDER (Fundo Europeu de Desenvolvimento Regional) funds through the COMPETE 2020 Operational Programme for Competitiveness and Internationalisation (POCI), Portugal, in the framework of the project IF/00092/2014/CP1255/CT0004.
Institutional Review Board Statement
Not applicable.
Informed Consent Statement
Not applicable.
Data Availability Statement
In manuscript and the Supplementary Materials.
Acknowledgments
N.V. thanks Fundação para a Ciência e a Tecnologia (FCT, Portugal) for supporting these studies through nationally-funded projects within the CINTESIS R&D unit (reference UIDB/4255/2020). The contents of this report are solely the responsibility of the authors and do not necessarily represent the official view of the FCT.
Conflicts of Interest
The authors declare no conflict of interest.
References
- Martin, V. Overview of Paclitaxel (TAXOL®). Semin. Oncol. Nurs. 1993, 9, 2–5. [Google Scholar] [CrossRef]
- Harbeck, N.; Penault-Llorca, F.; Cortes, J.; Gnant, M.; Houssami, N.; Poortmans, P.; Ruddy, K.; Tsang, J.; Cardoso, F. Breast cancer. Nat. Rev. Dis. Prim. 2019, 5, 1–31. [Google Scholar] [CrossRef] [PubMed]
- Abu Samaan, T.M.; Samec, M.; Liskova, A.; Kubatka, P.; Büsselberg, D. Paclitaxel’s Mechanistic and Clinical Effects on Breast Cancer. Biomolecules 2019, 9, 789. [Google Scholar] [CrossRef] [PubMed] [Green Version]
- Marupudi, I.N.; Han, E.J.; Li, K.W.; Renard, V.M.; Tyler, B.M.; Brem, H. Paclitaxel: A review of adverse toxicities and novel delivery strategies. Expert Opin. Drug Saf. 2007, 6, 609–621. [Google Scholar] [CrossRef] [PubMed]
- Stage, T.B.; Bergmann, T.K.; Kroetz, D.L. Clinical Pharmacokinetics of Paclitaxel Monotherapy: An Updated Literature Review. Clin. Pharmacokinet. 2017, 57, 7–19. [Google Scholar] [CrossRef] [Green Version]
- Zaal, E.A.; Berkers, C.R. The Influence of Metabolism on Drug Response in Cancer. Front. Oncol. 2018, 8, 500. [Google Scholar] [CrossRef] [PubMed]
- Cree, I.A.; Charlton, P. Molecular chess? Hallmarks of anti-cancer drug resistance. BMC Cancer 2017, 17. [Google Scholar] [CrossRef] [Green Version]
- Palumbo, M.O.; Ekavan, P.; Miller, W.H.; Epanasci, L.; Eassouline, S.; Ejohnson, N.; Ecohen, V.; Epatenaude, F.; Epollak, M.; Jagoe, R.T.; et al. Systemic cancer therapy: Achievements and challenges that lie ahead. Front. Pharmacol. 2013, 4, 57. [Google Scholar] [CrossRef] [Green Version]
- Chakroborty, D.; Sarkar, C.; Basu, B.; Dasgupta, P.S.; Basu, S. Catecholamines Regulate Tumor Angiogenesis: Figure 1. Cancer Res. 2009, 69, 3727–3730. [Google Scholar] [CrossRef] [PubMed] [Green Version]
- Lu, M.; Li, J.; Luo, Z.; Zhang, S.; Xue, S.; Wang, K.; Shi, Y.; Zhang, C.; Chen, H.; Li, Z. Roles of dopamine receptors and their antagonist thioridazine in hepatoma metastasis. OncoTargets Ther. 2015, 8, 1543–1552. [Google Scholar] [CrossRef] [Green Version]
- Wang, S.; Mou, Z.; Ma, Y.; Li, J.; Li, J.; Ji, X.; Wu, K.; Li, L.; Lu, W.; Zhou, T. Dopamine enhances the response of sunitinib in the treatment of drug-resistant breast cancer: Involvement of eradicating cancer stem-like cells. Biochem. Pharmacol. 2015, 95, 98–109. [Google Scholar] [CrossRef] [PubMed]
- Sarkar, C.; Chakroborty, D.; Chowdhury, U.R.; Dasgupta, P.S.; Basu, S. Dopamine Increases the Efficacy of Anticancer Drugs in Breast and Colon Cancer Preclinical Models. Clin. Cancer Res. 2008, 14, 2502–2510. [Google Scholar] [CrossRef] [PubMed] [Green Version]
- Asada, M.; Ebihara, S.; Yamanda, S.; Niu, K.; Okazaki, T.; Sora, I.; Arai, H. Depletion of Serotonin and Selective Inhibition of 2B Receptor Suppressed Tumor Angiogenesis by Inhibiting Endothelial Nitric Oxide Synthase and Extracellular Signal-Regulated Kinase 1/2 Phosphorylation. Neoplasia 2009, 11, 408–410. [Google Scholar] [CrossRef] [Green Version]
- Ballou, Y.; Rivas, A.; Belmont, A.; Patel, L.; Amaya, C.N.; Lipson, S.; Khayou, T.; Dickerson, E.B.; Nahleh, Z.; Bryan, B.A. 5-HT serotonin receptors modulate mitogenic signaling and impact tumor cell viability. Mol. Clin. Oncol. 2018, 9, 243–254. [Google Scholar] [CrossRef] [Green Version]
- Arese, M.; Bussolino, F.; Pergolizzi, M.; Bizzozero, L.; Pascal, D. Tumor progression: The neuronal input. Ann. Transl. Med. 2018, 6, 89. [Google Scholar] [CrossRef] [PubMed] [Green Version]
- Peters, M.A.; Walenkamp, A.M.; Kema, I.P.; Meijer, C.; de Vries, E.; Oosting, S.F. Dopamine and serotonin regulate tumor behavior by affecting angiogenesis. Drug Resist. Updat. 2014, 17, 96–104. [Google Scholar] [CrossRef]
- Zimmermann, G.R.; Lehár, J.; Keith, C.T. Multi-target therapeutics: When the whole is greater than the sum of the parts. Drug Discov. Today 2007, 12, 34–42. [Google Scholar] [CrossRef]
- Mokhtari, R.B.; Homayouni, T.S.; Baluch, N.; Morgatskaya, E.; Kumar, S.; Das, B.; Yeger, H. Combination therapy in combating cancer. Oncotarget 2017, 8, 38022–38043. [Google Scholar] [CrossRef] [Green Version]
- Bahmad, H.F.; Elajami, M.K.; El Zarif, T.; Bou-Gharios, J.; Abou-Antoun, T.; Abou-Kheir, W. Drug repurposing towards targeting cancer stem cells in pediatric brain tumors. Cancer Metastasis Rev. 2020, 39, 127–148. [Google Scholar] [CrossRef]
- Tegowski, M.; Fan, C.; Baldwin, A.S. Selective Effects of Thioridazine on Self-Renewal of Basal-Like Breast Cancer Cells. Sci. Rep. 2019, 9, 1–12. [Google Scholar] [CrossRef]
- Borcherding, D.C.; Tong, W.; Hugo, E.R.; Barnard, D.F.; Fox, S.; LaSance, K.; Shaughnessy, E.; Ben-Jonathan, N. Expression and therapeutic targeting of dopamine receptor-1 (D1R) in breast cancer. Oncogene 2016, 35, 3103–3113. [Google Scholar] [CrossRef] [PubMed]
- Pottegård, A.; Lash, T.L.; Cronin-Fenton, D.; Ahern, T.P.; Damkier, P. Use of antipsychotics and risk of breast cancer: A Danish nationwide case–control study. Br. J. Clin. Pharmacol. 2018, 84, 2152–2161. [Google Scholar] [CrossRef] [PubMed] [Green Version]
- Fowler, J.S.; Logan, J.; Volkow, N.D.; Shumay, E.; McCall-Perez, F.; Jayne, M.; Wang, G.-J.; Alexoff, D.L.; Apelskog-Torres, K.; Hubbard, B.; et al. Evidence that formulations of the selective MAO-B inhibitor, selegiline, which bypass first-pass metabolism, also inhibit MAO-A in the human brain. Neuropsychopharmacology 2014, 40, 650–657. [Google Scholar] [CrossRef]
- Cui, J.; Hollmén, M.; Li, L.; Chen, Y.; Proulx, S.T.; Reker, D.; Schneider, G.; Detmar, M. New use of an old drug: Inhibition of breast cancer stem cells by benztropine mesylate. Oncotarget 2016, 8, 1007–1022. [Google Scholar] [CrossRef] [PubMed] [Green Version]
- Finberg, J.P. Pharmacology of Rasagiline, a New MAO-B Inhibitor Drug for the Treatment of Parkinson’s Disease with Neuroprotective Potential. Rambam Maimonides Med. J. 2010, 1, e0003. [Google Scholar] [CrossRef] [Green Version]
- Lee, H.T.; Choi, M.R.; Doh, M.S.; Jung, K.H.; Chai, Y.G. Effects of the monoamine oxidase inhibitors pargyline and tranylcypromine on cellular proliferation in human prostate cancer cells. Oncol. Rep. 2013, 30, 1587–1592. [Google Scholar] [CrossRef] [Green Version]
- Tuladhar, B.R.; Womack, M.D.; Naylor, R.J. Pharmacological characterization of the 5-HT receptor-mediated contraction in the mouse isolated ileum. Br. J. Pharmacol. 2000, 131, 1716–1722. [Google Scholar] [CrossRef]
- Chou, T.-C. Drug Combination Studies and Their Synergy Quantification Using the Chou-Talalay Method. Cancer Res. 2010, 70, 440–446. [Google Scholar] [CrossRef] [PubMed] [Green Version]
- Van Tonder, A.; Joubert, A.M.; Cromarty, A.D. Limitations of the 3-(4,5-dimethylthiazol-2-yl)-2,5-diphenyl-2H-tetrazolium bromide (MTT) assay when compared to three commonly used cell enumeration assays. BMC Res. Notes 2015, 8, 47. [Google Scholar] [CrossRef] [Green Version]
- Liebmann, J.; Cook, J.; Lipschultz, C.; Teague, D.; Fisher, J.; Mitchell, J. Cytotoxic studies of paclitaxel (Taxol®) in human tumour cell lines. Br. J. Cancer 1993, 68, 1104–1109. [Google Scholar] [CrossRef] [Green Version]
- Bai, Z.-G.; Zhang, Z.; Qu, X.; Han, W.; Ma, X. Sensitization of breast cancer cells to taxol by inhibition of taxol resistance gene 1. Oncol. Lett. 2011, 3, 135–140. [Google Scholar] [CrossRef] [Green Version]
- Comşa, Ş.; Cimpean, A.M.; Raica, M. The Story of MCF-7 Breast Cancer Cell Line: 40 years of Experience in Research. Anticancer Res. 2015, 35, 3147–3154. [Google Scholar]
- Niepel, M.; Hafner, M.; Chung, M.; Sorger, P.K. Measuring Cancer Drug Sensitivity and Resistance in Cultured Cells. Curr. Protoc. Chem. Biol. 2017, 9, 55–74. [Google Scholar] [CrossRef] [PubMed]
- Aslantürk, Ö.S. In Vitro Cytotoxicity and Cell Viability Assays: Principles, Advantages, and Disadvantages; IntechOpen: London, UK, 2018. [Google Scholar]
- Méry, B.; Guy, J.-B.; Vallard, A.; Espenel, S.; Ardail, D.; Rodriguez-Lafrasse, C.; Rancoule, C.; Magné, N. In Vitro Cell Death Determination for Drug Discovery: A Landscape Review of Real Issues. J. Cell Death 2017, 10. [Google Scholar] [CrossRef] [Green Version]
- Kuwano, M.; Akiyama, S.-I.; Shiraishi, N.; Kuratomi, Y.; Nakagawa, M. Circumvention of Multiple-Drug Resistance in Human Cancer Cells by Thioridazine, Trifluoperazine, and Chlorpromazine2. J. Natl. Cancer Inst. 1986, 76, 839–844. [Google Scholar] [CrossRef]
- Tegowski, M.; Fan, C.; Baldwin, A.S. Thioridazine inhibits self-renewal in breast cancer cells via DRD2-dependent STAT3 inhibition, but induces a G1 arrest independent of DRD2. J. Biol. Chem. 2018, 293, 15977–15990. [Google Scholar] [CrossRef] [Green Version]
- Sogawa, C.; Eguchi, T.; Tran, M.T.; Ishige, M.; Trin, K.; Okusha, Y.; Taha, E.A.; Lu, Y.; Kawai, H.; Sogawa, N.; et al. Antiparkinson Drug Benztropine Suppresses Tumor Growth, Circulating Tumor Cells, and Metastasis by Acting on SLC6A3/DAT and Reducing STAT3. Cancers 2020, 12, 523. [Google Scholar] [CrossRef] [PubMed] [Green Version]
- Cerles, O.; Gonçalves, T.C.; Chouzenoux, S.; Benoit, E.; Schmitt, A.; Saidu, N.E.B.; Kavian, N.; Chéreau, C.; Gobeaux, C.; Weill, B.; et al. Preventive action of benztropine on platinum-induced peripheral neuropathies and tumor growth. Acta Neuropathol. Commun. 2019, 7, 9. [Google Scholar] [CrossRef]
- Luo, L.; Jin, X.; Zou, B.; Zhong, C.; Zhang, P.; Cheng, H.; Guo, Y.; Gou, M. Codelivery of thioridazine and doxorubicin using nanoparticles for effective breast cancer therapy. Int. J. Nanomed. 2016, 11, 4545–4552. [Google Scholar] [CrossRef] [PubMed] [Green Version]
- Chou, T.-C. The mass-action law based algorithm for cost-effective approach for cancer drug discovery and development. Am. J. Cancer Res. 2011, 1, 925–954. [Google Scholar]
- Mendez, M.; Kojima, S.; Goldman, R.D. Vimentin induces changes in cell shape, motility, and adhesion during the epithelial to mesenchymal transition. FASEB J. 2010, 24, 1838–1851. [Google Scholar] [CrossRef] [PubMed] [Green Version]
- Sommers, C.L.; Heckford, S.E.; Skerker, J.M.; Worland, P.; Torri, J.A.; Thompson, E.W.; Byers, S.W.; Gelmann, E.P. Loss of epithelial markers and acquisition of vimentin expression in adri-amycin- and vinblastine-resistant human breast cancer cell lines. Cancer Res. 1992, 52, 5190–5197. [Google Scholar] [PubMed]
- Yap, T.A.; Omlin, A.; De Bono, J.S. Development of Therapeutic Combinations Targeting Major Cancer Signaling Pathways. J. Clin. Oncol. 2013, 31, 1592–1605. [Google Scholar] [CrossRef] [PubMed]
Figure 1.
Growth curve of MCF-7 cells grown in culture. Initial cell density is 3 × 10⁴ cells/mL. Results are expressed as mean ± standard error of the mean (SEM) of three independent experiments (n = 3).
Figure 1.
Growth curve of MCF-7 cells grown in culture. Initial cell density is 3 × 10⁴ cells/mL. Results are expressed as mean ± standard error of the mean (SEM) of three independent experiments (n = 3).

Figure 2.
Imaging by LionHeart equipment of MCF-7 cells. (A) Control MCF-7 cells at 24 h, (B) MCF-7 cells treated with paclitaxel at 50 nM with no visible clustering, (C) Control MCF-7 cells after 24 h for benztropine, (D) MCF-7 cells treated with 100 µM benztropine, showing the formation of clusters.

Figure 3.
Protein synthesis (% of control) obtained with SRB assay in MCF-7 cells treated for 24 h with paclitaxel (left graph) or benztropine (right graph). The red rectangle marks the increase of protein synthesis at the lowest and middle concentrations. Results are expressed as mean ± standard error of the mean (SEM). **** p < 0.0001.

Figure 4.
Results obtained with neutral red assay on cell viability (% of control) in MCF-7 cells treated with paclitaxel at 24 h and 48 h (upper charts) and those treated with benztropine at 24 h and 48 h (lower charts). * p < 0.05, *** p < 0.001., **** p < 0.0001.
Figure 4.
Results obtained with neutral red assay on cell viability (% of control) in MCF-7 cells treated with paclitaxel at 24 h and 48 h (upper charts) and those treated with benztropine at 24 h and 48 h (lower charts). * p < 0.05, *** p < 0.001., **** p < 0.0001.

Figure 5.
Effect of paclitaxel on the cell viability (% of control) of MCF-7 cells at (A) 24 h and (B) 48 h of exposure in independent experiments (n = 4). Results are expressed as mean ± standard error of the mean (SEM). ** p < 0.01, **** p < 0.0001.
Figure 5.
Effect of paclitaxel on the cell viability (% of control) of MCF-7 cells at (A) 24 h and (B) 48 h of exposure in independent experiments (n = 4). Results are expressed as mean ± standard error of the mean (SEM). ** p < 0.01, **** p < 0.0001.

Figure 6.
Representation of paclitaxel dose-response curve at 24 h (left graph) and 48 h (right graph). The curve represents a normalization between 0 and 100%, where 100% was defined as the concentration of the drug that least affected the cell viability, and 0% was considered the concentration that most affected the cell viability. Results are expressed as mean ± standard error of the mean (SEM). The IC50 value was calculated using the normalized data (between 0% and 100%).

Figure 7.
Comparison of the cell viability (% of control) between the 24 h and 48 h of exposure to paclitaxel. Results are expressed as mean ± standard error of the mean (SEM). * p < 0.05, **** p < 0.0001.
Figure 7.
Comparison of the cell viability (% of control) between the 24 h and 48 h of exposure to paclitaxel. Results are expressed as mean ± standard error of the mean (SEM). * p < 0.05, **** p < 0.0001.

Figure 8.
Effect of quetiapine exposure over 48 h on the cell viability (% of control) of MCF-7 cells, based on four independent experiments (n = 4). Results are expressed as mean ± standard error of the mean (SEM). * p < 0.05, ** p < 0.01 and *** p < 0.001.
Figure 8.
Effect of quetiapine exposure over 48 h on the cell viability (% of control) of MCF-7 cells, based on four independent experiments (n = 4). Results are expressed as mean ± standard error of the mean (SEM). * p < 0.05, ** p < 0.01 and *** p < 0.001.

Figure 9.
Representation of quetiapine dose-response curve at 48 h. The curve represents a normalization between 0 and 100%, where 100% was defined as the concentration of the drug that least affected the cell viability, and 0% was considered the concentration that most affected the cell viability. Results are expressed as mean ± standard error of the mean (SEM). The IC50 value was calculated using the normalized data (between 0% and 100%).

Figure 10.
There was no significant effect on cell viability (% of control) in MCF-7 cells treated with selegiline (A), rasagiline (B), 2-PCPA (C) and m-CPBH (D) at the chosen concentrations over 48 h. Three or more independent experiments were performed for each drug (n ≥ 3). Results are expressed as mean ± standard error of the mean (SEM).

Figure 11.
Effect of thioridazine exposure over (A) 24 h and (B) 48 h, on the cell viability (% of control) of MCF-7 cells, based on four independent experiments (n = 4). Results are expressed as mean ± standard error of the mean (SEM). ** p < 0.01, **** p < 0.0001.
Figure 11.
Effect of thioridazine exposure over (A) 24 h and (B) 48 h, on the cell viability (% of control) of MCF-7 cells, based on four independent experiments (n = 4). Results are expressed as mean ± standard error of the mean (SEM). ** p < 0.01, **** p < 0.0001.

Figure 12.
Representation of thioridazine dose-response curve at 48 h. The curve represents a normalization between 0 and 100%, where 100% was defined as the concentration of the drug that least affected the cell viability, and 0% was considered the concentration that most affected the cell viability. Results are expressed as mean ± standard error of the mean (SEM). The IC50 value was calculated using the normalized data (between 0% and 100%).

Figure 13.
Comparison of the cell viability (% of control) between 24 h and 48 h of exposure. Results are expressed as mean ± standard error of the mean (SEM).
Figure 13.
Comparison of the cell viability (% of control) between 24 h and 48 h of exposure. Results are expressed as mean ± standard error of the mean (SEM).

Figure 14.
Effect of benztropine over 24 h (A) and 48 h (B) on the cell viability (% of control) of MCF-7 cells, based on three independent experiments (n = 3). Results are expressed as mean ± standard error of the mean (SEM). ** p < 0.01, *** p < 0.001, **** p < 0.0001.
Figure 14.
Effect of benztropine over 24 h (A) and 48 h (B) on the cell viability (% of control) of MCF-7 cells, based on three independent experiments (n = 3). Results are expressed as mean ± standard error of the mean (SEM). ** p < 0.01, *** p < 0.001, **** p < 0.0001.

Figure 15.
Representation of benztropine dose-response curve at 24 h (left graph) and 48 h (right graph). The curve represents a normalization between 0 and 100%, where 100% was defined as the concentration of the drug that least affected the cell viability, and 0% was considered the concentration that most affected the cell viability. Results are expressed as mean ± standard error of the mean (SEM). The IC50 value was calculated using the normalized data (between 0% and 100%).

Figure 16.
Comparison of the cell viability (% of control) between 24 h and 48 h of exposure.

Figure 17.
The effects of paclitaxel and benztropine (alone and in combination) on the cell viability (% of control) of MCF-7 cells at 48 h. Results are expressed as mean ± standard error of the mean (SEM) and represent four independent experiments (n = 4). **** p < 0.0001.
Figure 17.
The effects of paclitaxel and benztropine (alone and in combination) on the cell viability (% of control) of MCF-7 cells at 48 h. Results are expressed as mean ± standard error of the mean (SEM) and represent four independent experiments (n = 4). **** p < 0.0001.

Figure 18.
Effect of the single use of paclitaxel or thioridazine, and the combinations of both drugs, on the cell viability (% of control) of MCF-7 cells at 48 h. Results are expressed as mean ± standard error of the mean (SEM) and represent four independent experiments (n = 4). **** p < 0.0001.
Figure 18.
Effect of the single use of paclitaxel or thioridazine, and the combinations of both drugs, on the cell viability (% of control) of MCF-7 cells at 48 h. Results are expressed as mean ± standard error of the mean (SEM) and represent four independent experiments (n = 4). **** p < 0.0001.

Figure 19.
Chou-Talalay method Fa-CI plot of (A) paclitaxel and benztropine and (B) paclitaxel and thioridazine. CI was plotted on the y-axis as a function of effect level (Fa) on the x-axis to assess drug synergism. CI < 1, CI = 1 and CI > 1 indicate synergism, additivity and antagonism, respectively.

Figure 20.
Immunofluorescence analysis of vimentin (green) in MCF-7 cells. (A) MCF-7 with no treatment; (B) Cells treated with the reference drug, paclitaxel; (C) Cells treated with benztropine; (D) Cells treated with thioridazine; (E) Cells treated with the combination of the IC50 of paclitaxel and benztropine; (F) Cells treated with the combination of the IC50 of paclitaxel and thioridazine. The cells were treated with the calculated IC50 concentration and were exposed to the drugs for 48 h. The images were taken at a 20× magnification. On the right top corner of each image is an insert at 40× magnification (20× 30 ms DAPai/ 2s FITC; 40× 4 ms DAPI/ 1 s FITC).

Figure 21.
Immunofluorescence analysis of E-cadherin clone 24E10 (green) in MCF-7 cells. (A) MCF-7 with no treatment; (B) Cells treated with the reference drug, paclitaxel; (C) Cells treated with benztropine; (D) Cells treated with thioridazine; (E) Cells treated with the combination of the IC50 of paclitaxel and benztropine; (F) Cells treated with the combination of the IC50 of paclitaxel and thioridazine. The images were taken at a 20× magnification. On the right top corner of each image is an insert at 40× magnification (20× 30 ms DAPI/ 2 s FITC; 40× 4 ms DAPI/ 1 s FITC).

Figure 22.
Schematic representation of the combination model used to assess the efficacies of paclitaxel (Drug A) and the repurposed drugs tested (Drug B).
Figure 22.
Schematic representation of the combination model used to assess the efficacies of paclitaxel (Drug A) and the repurposed drugs tested (Drug B).


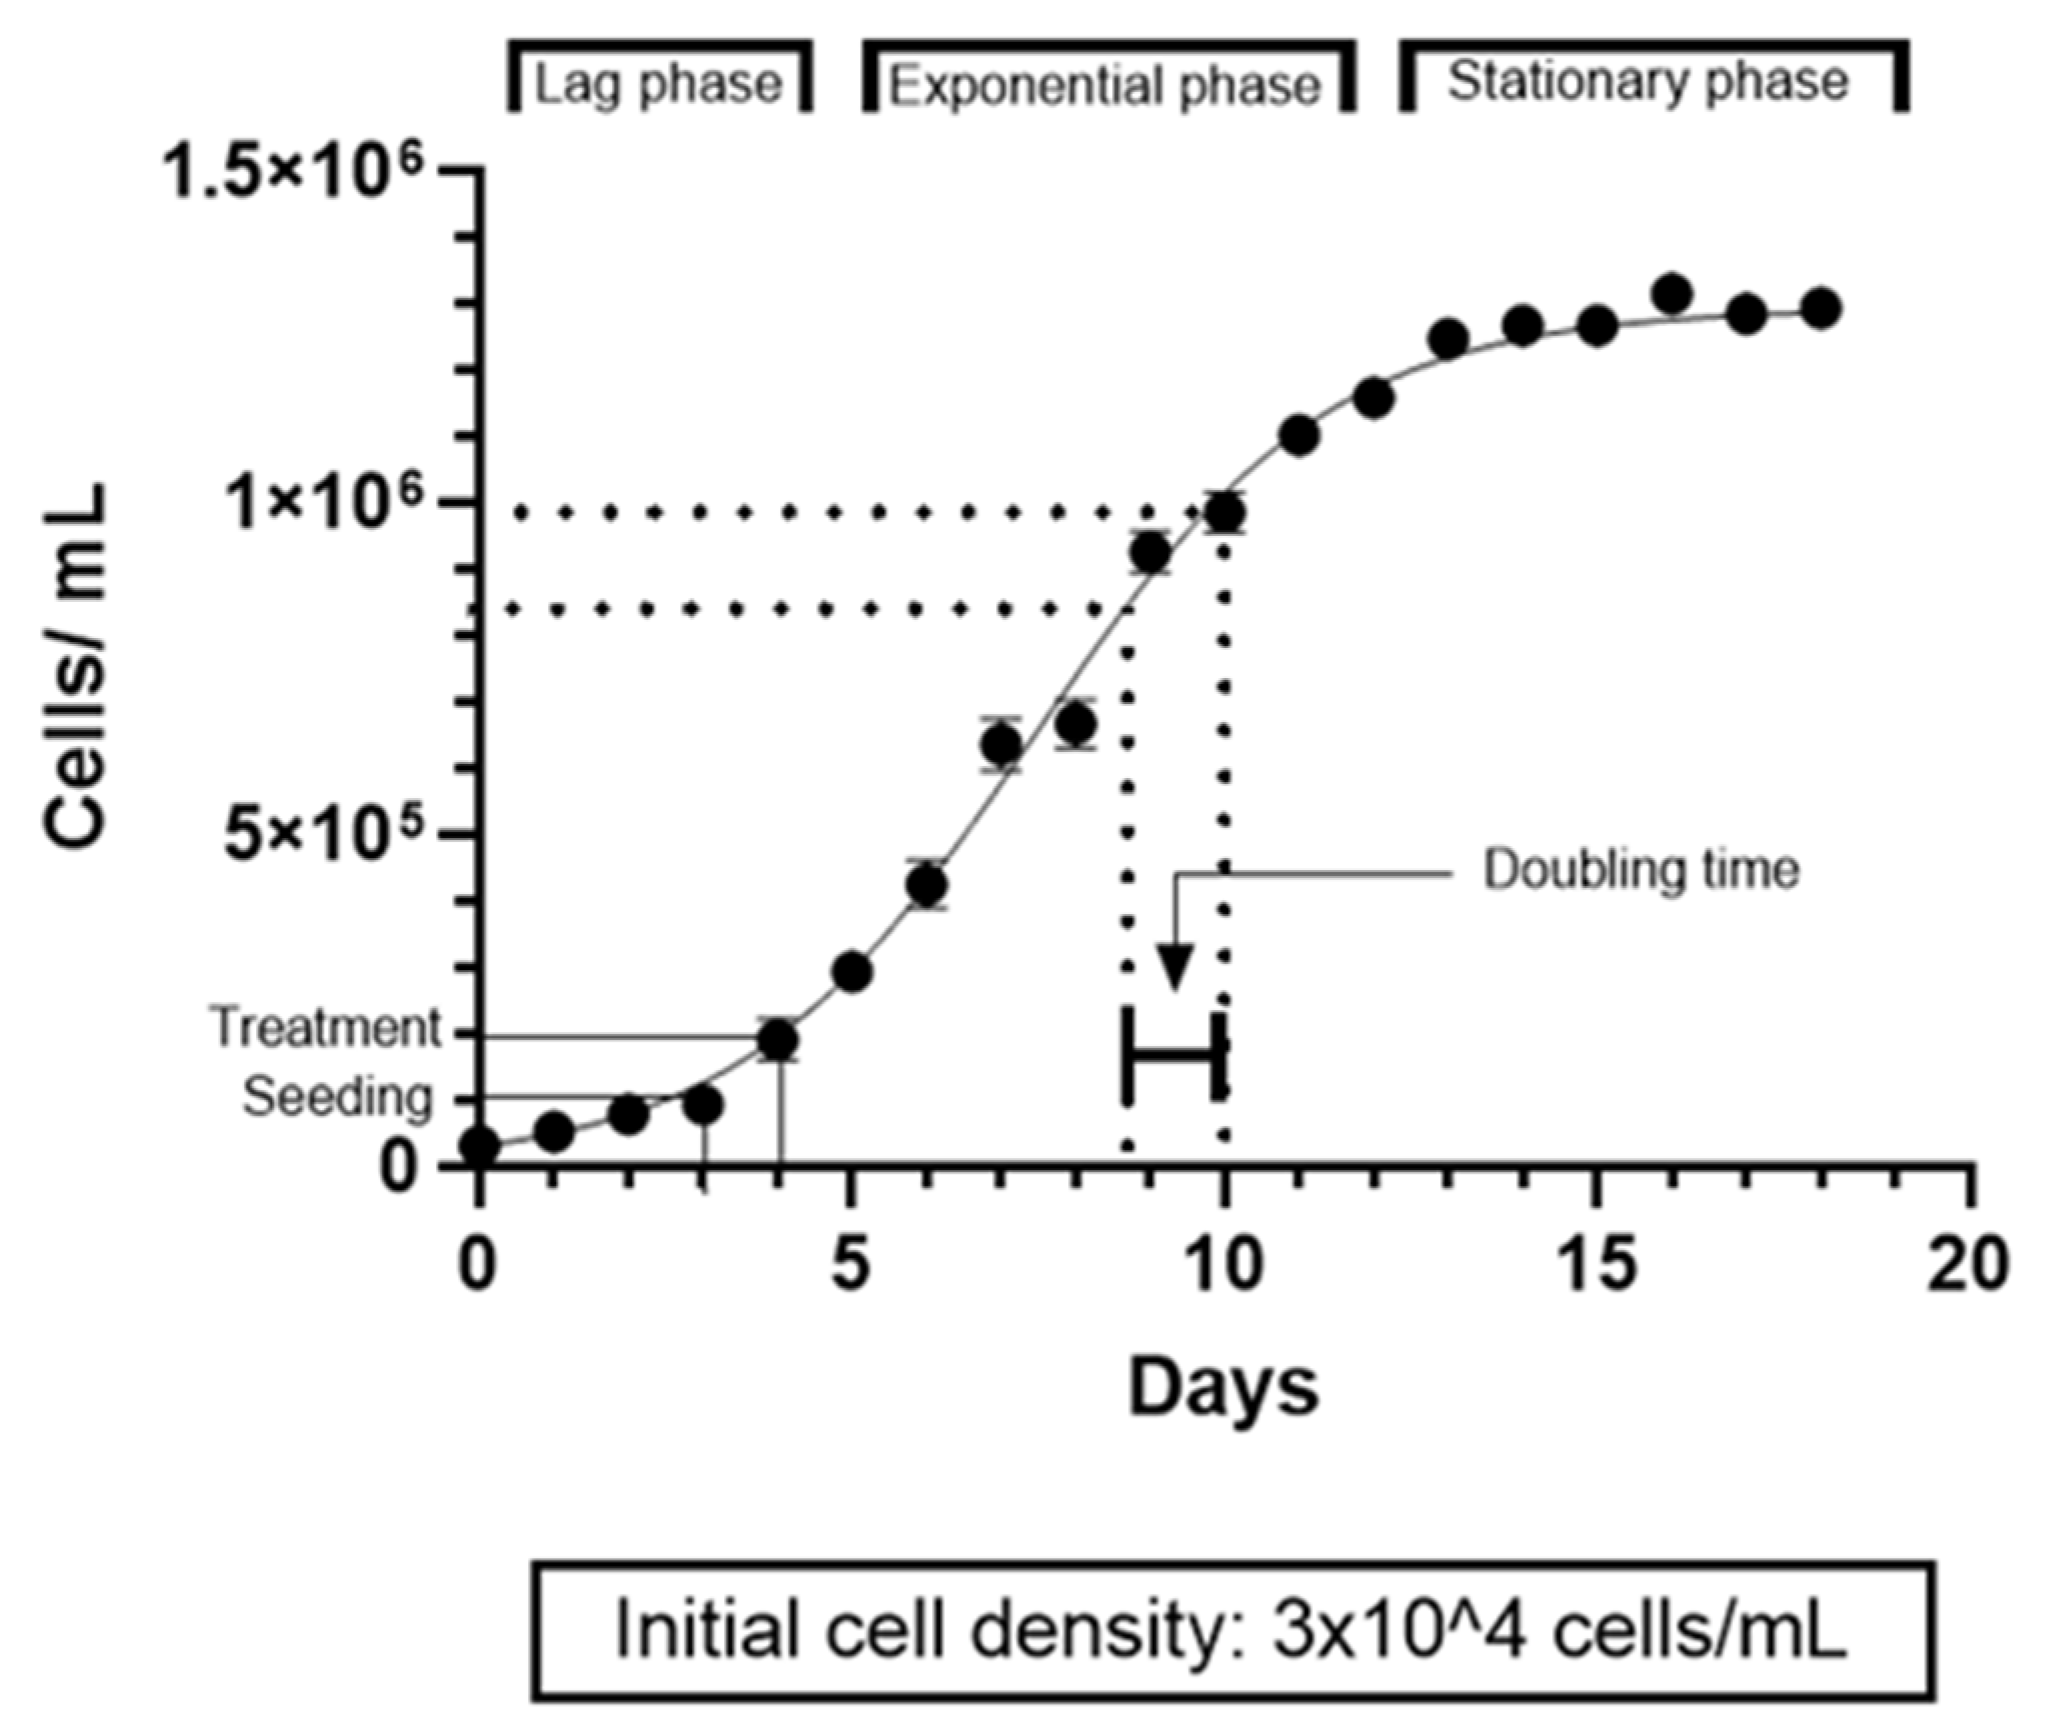
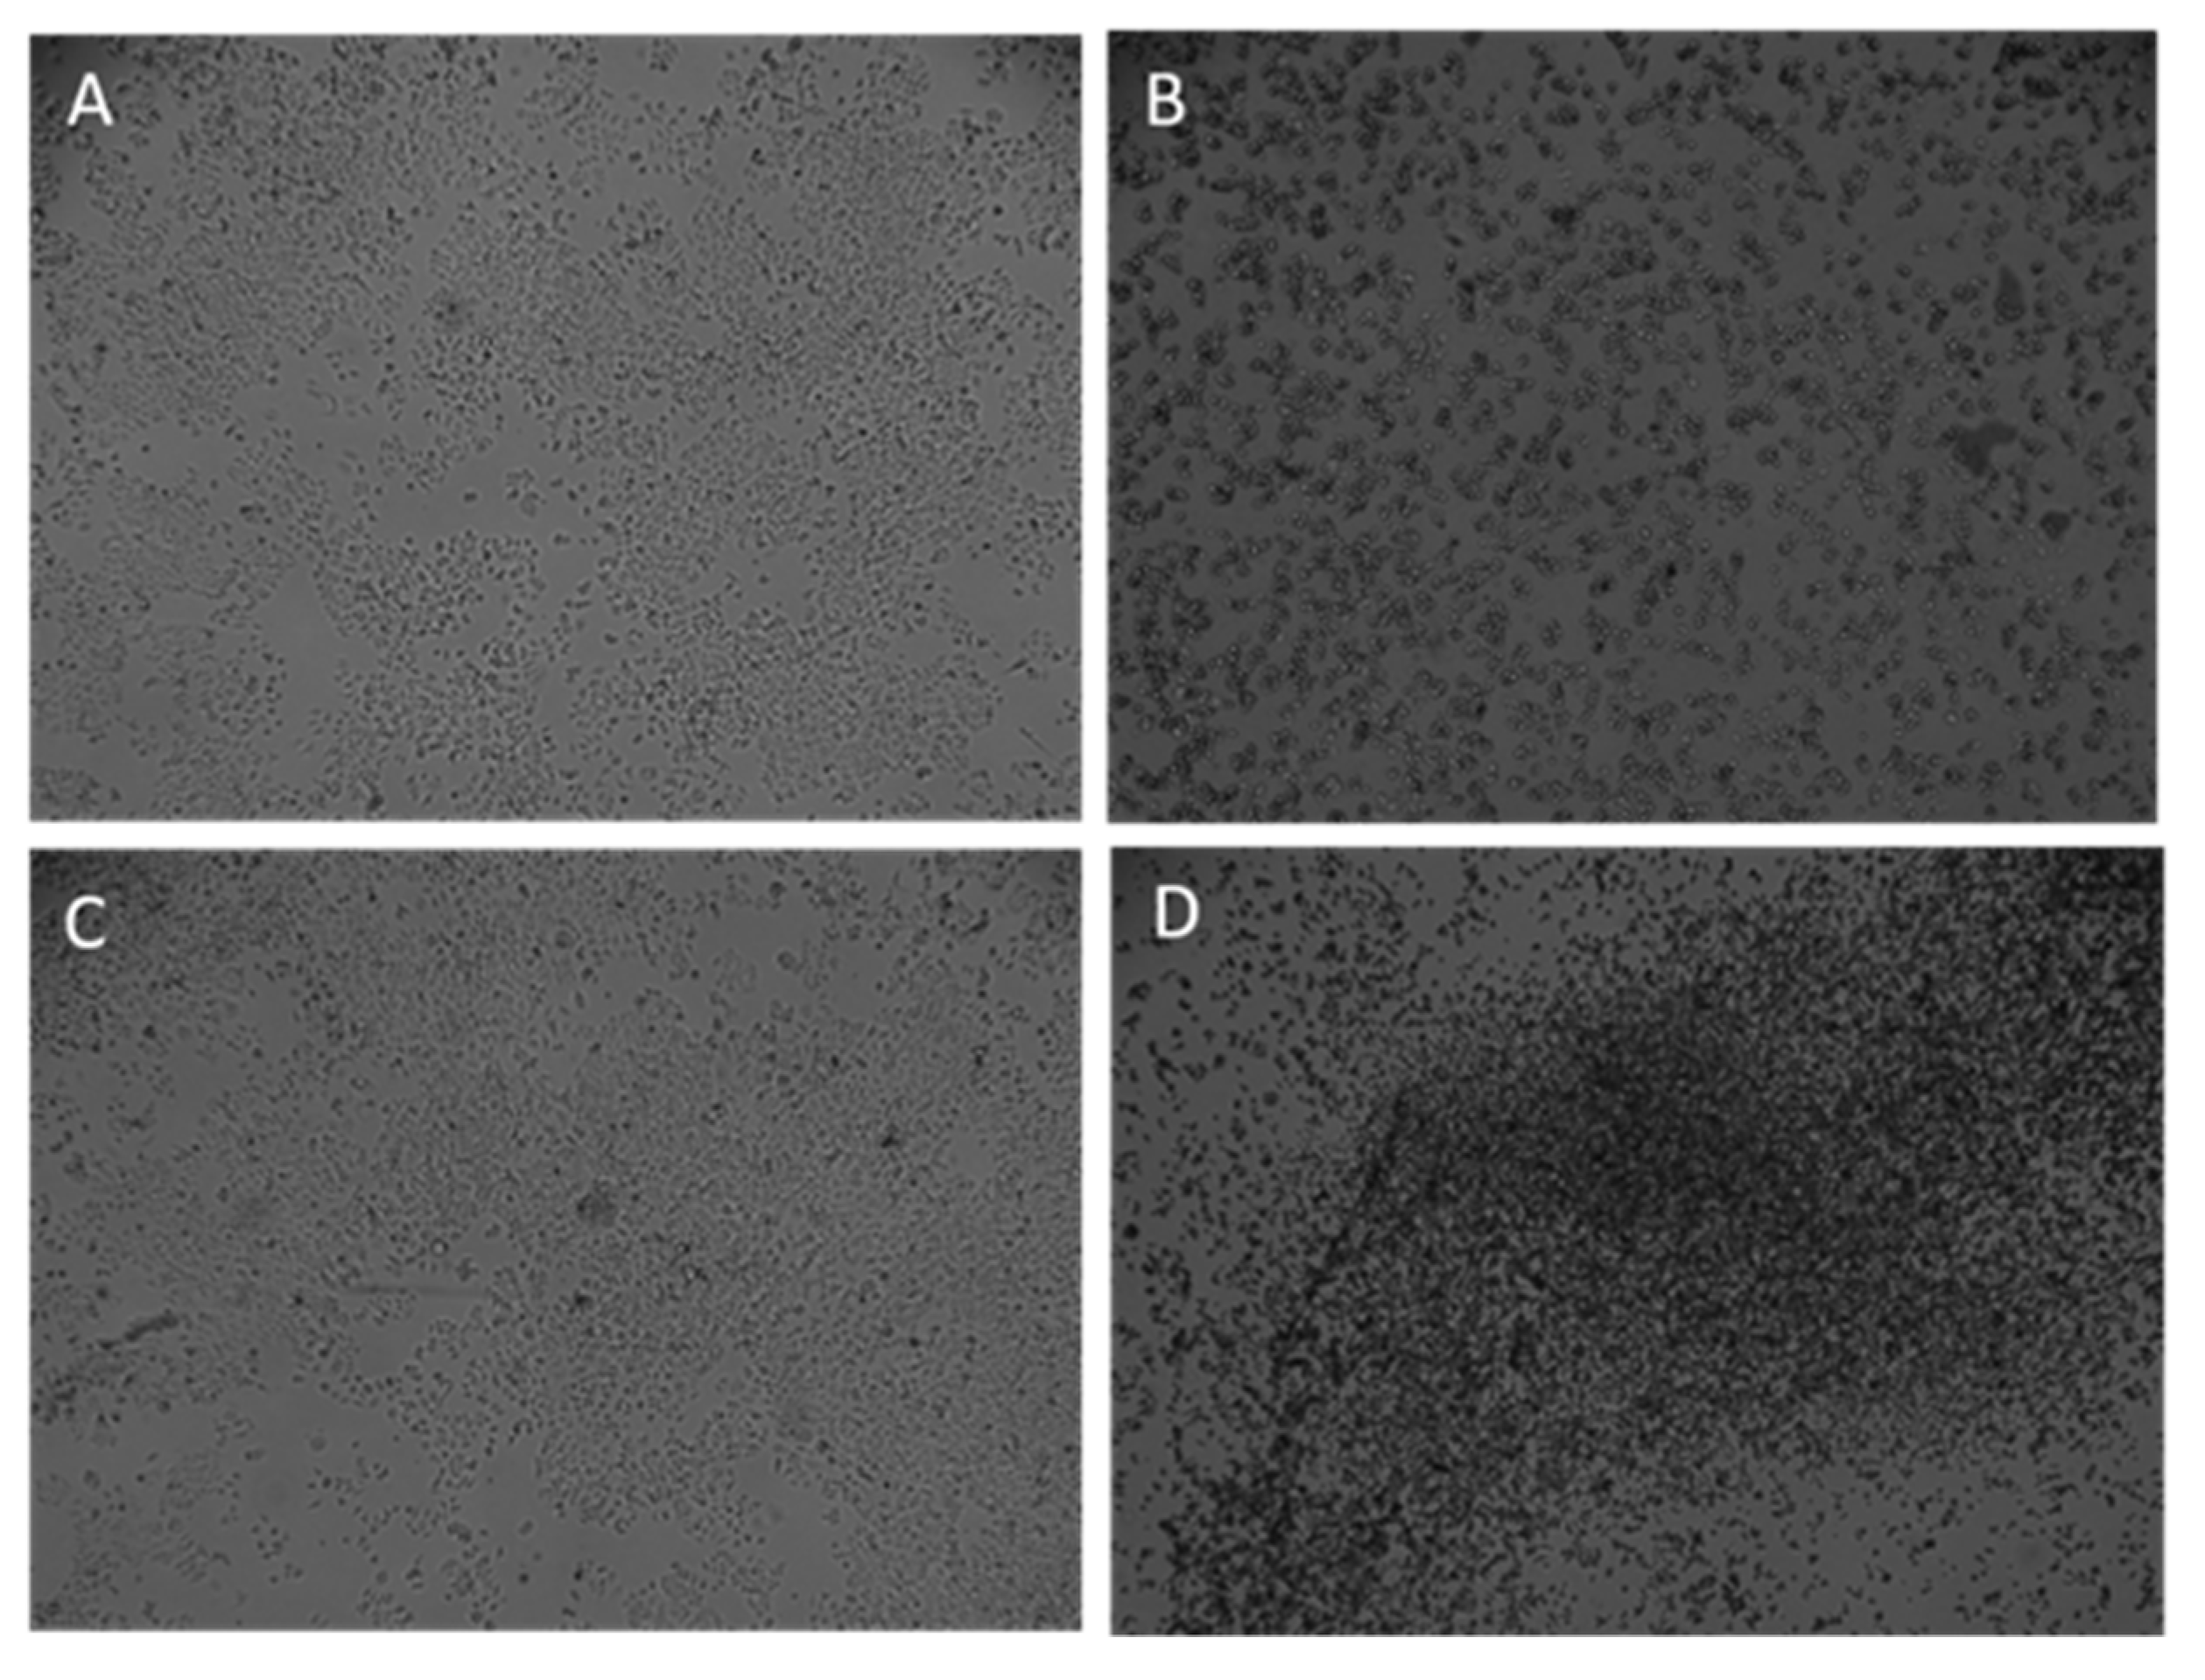
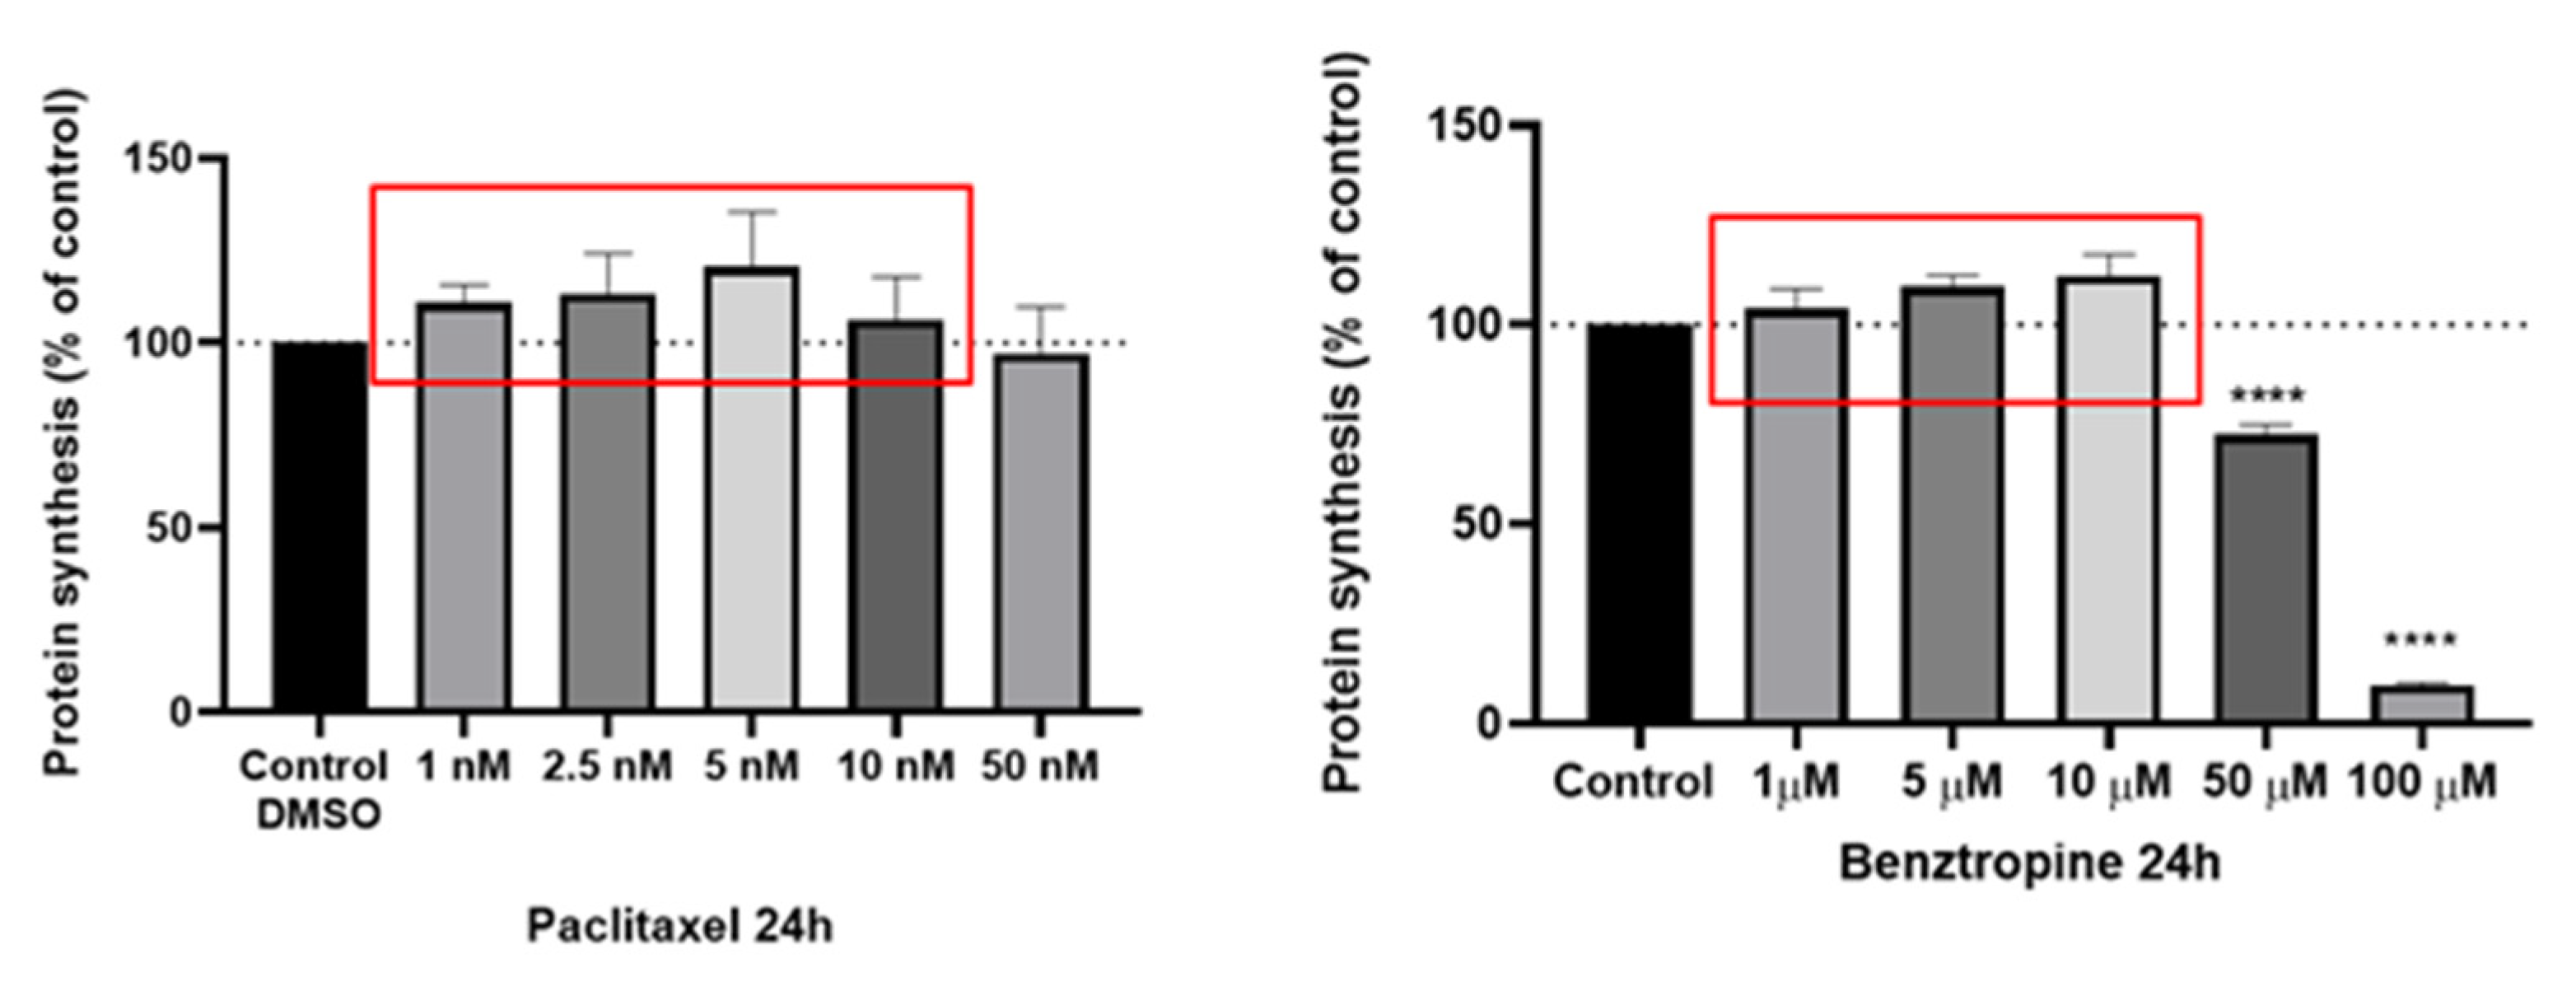
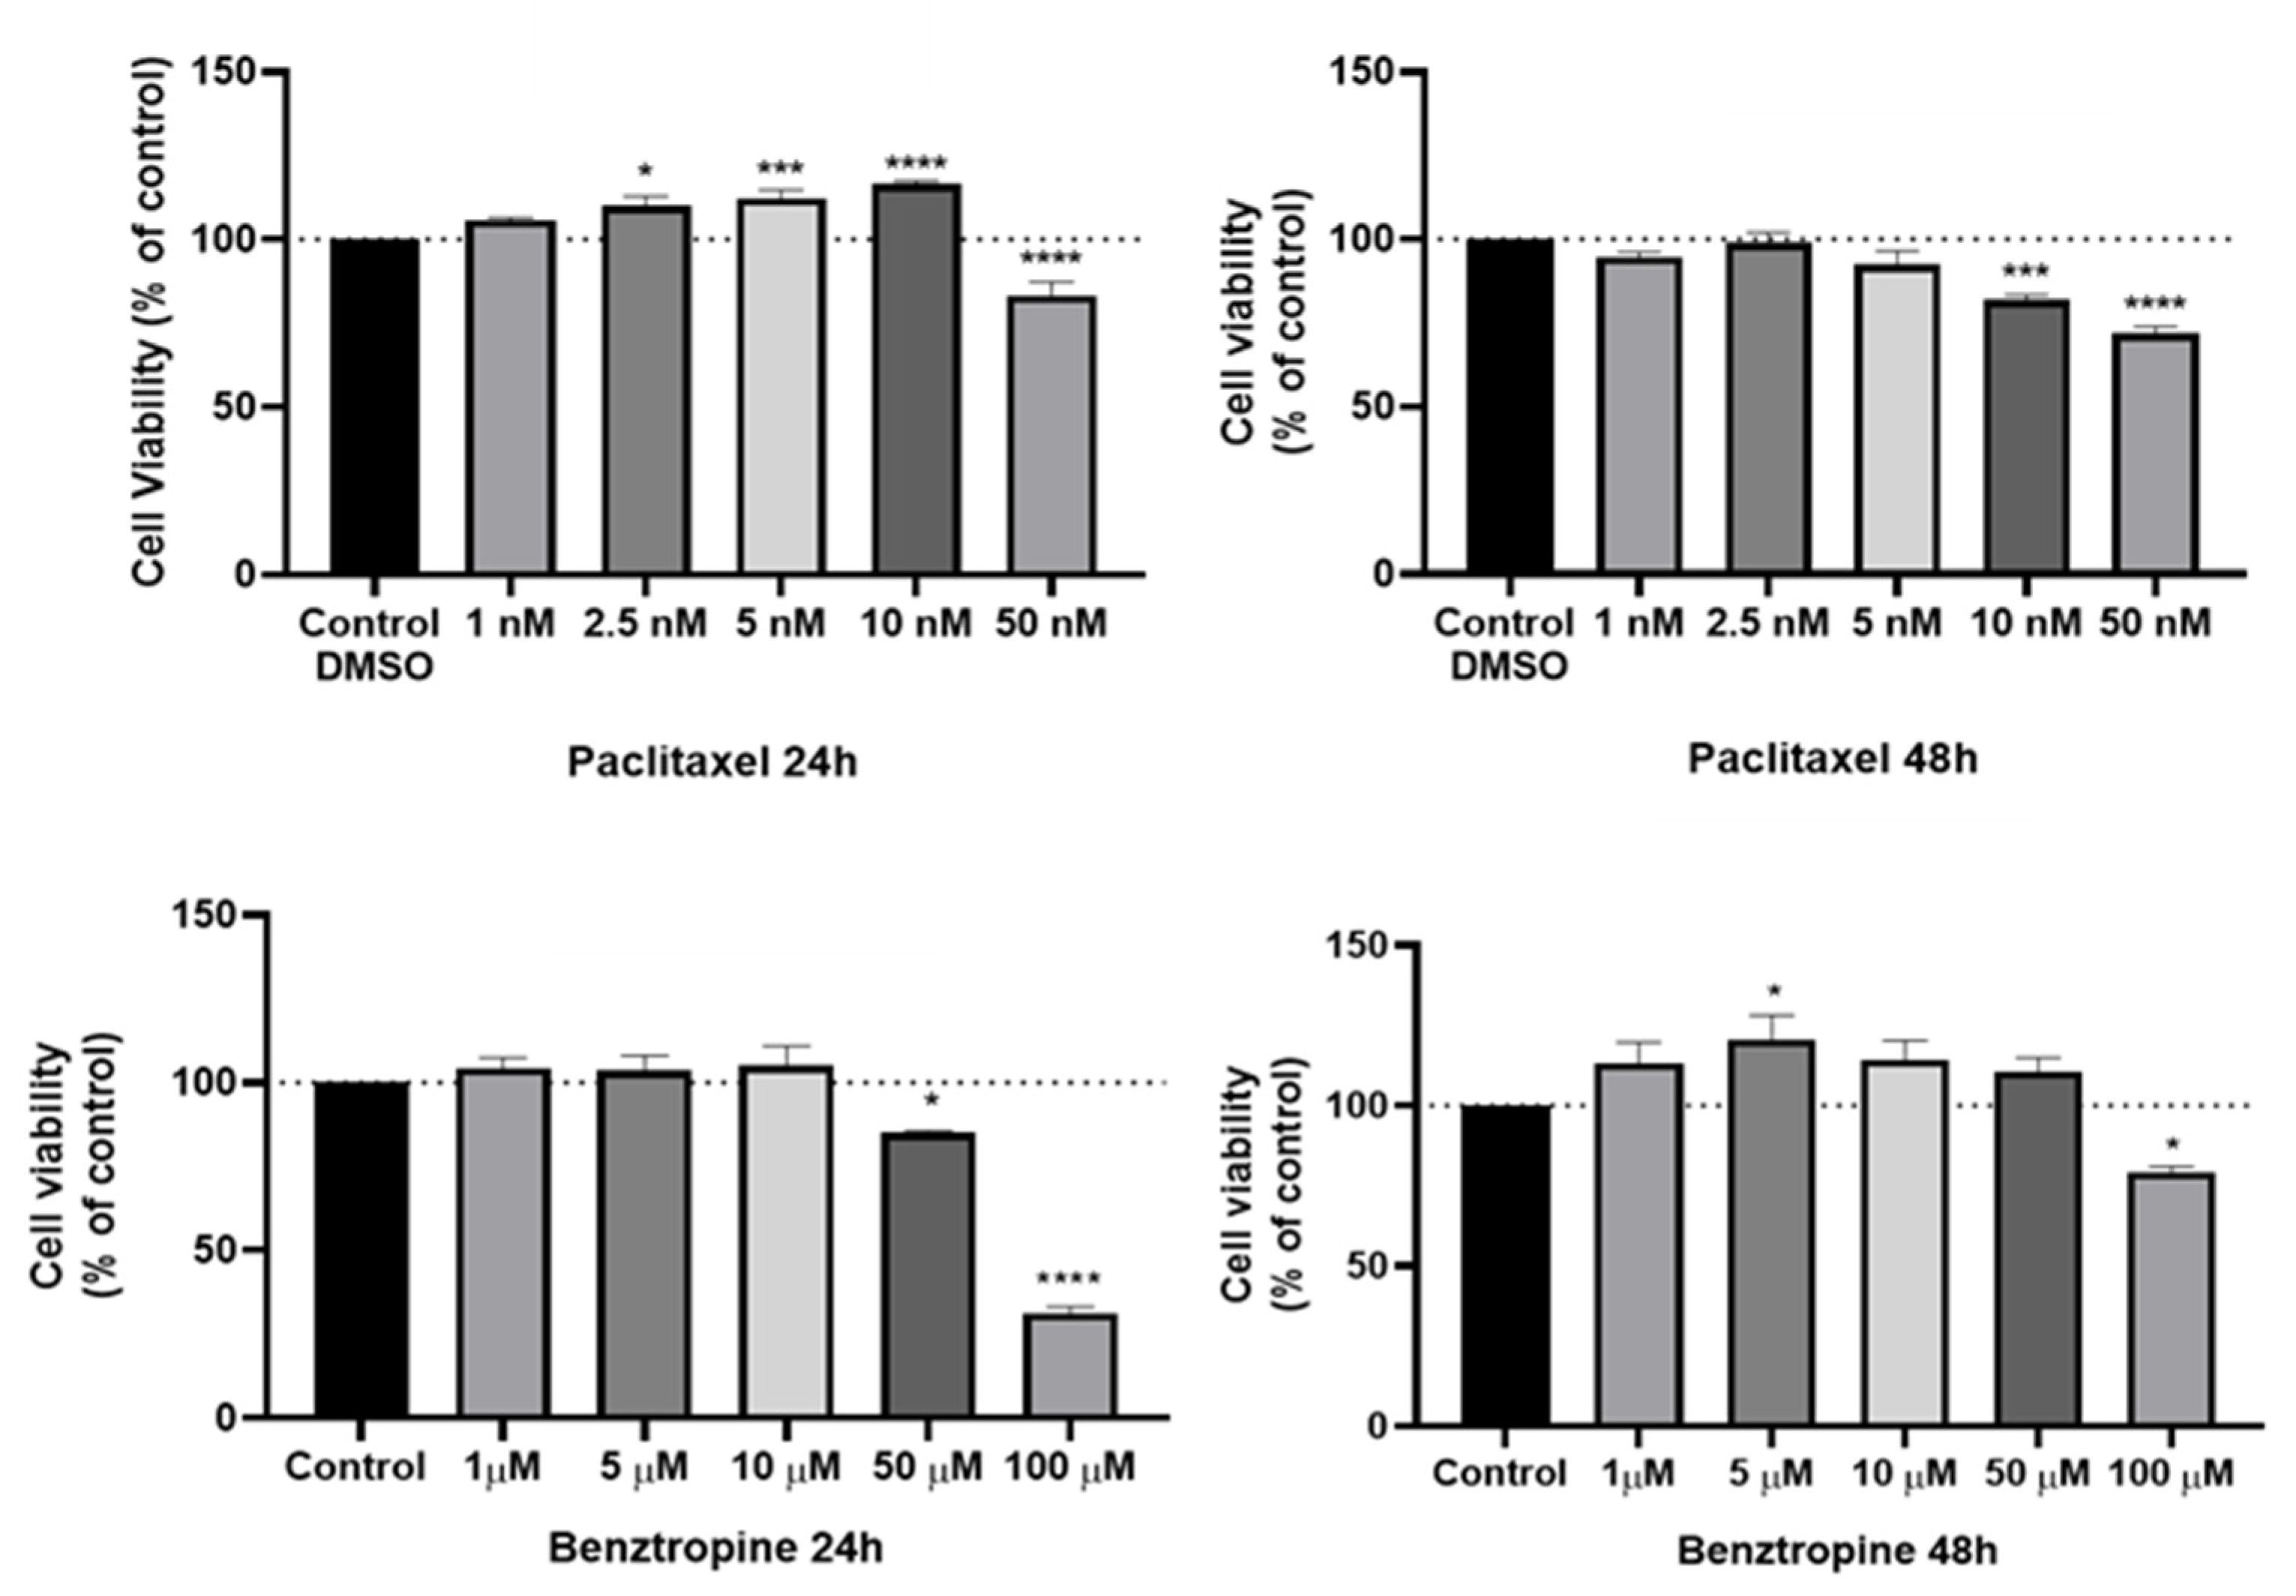
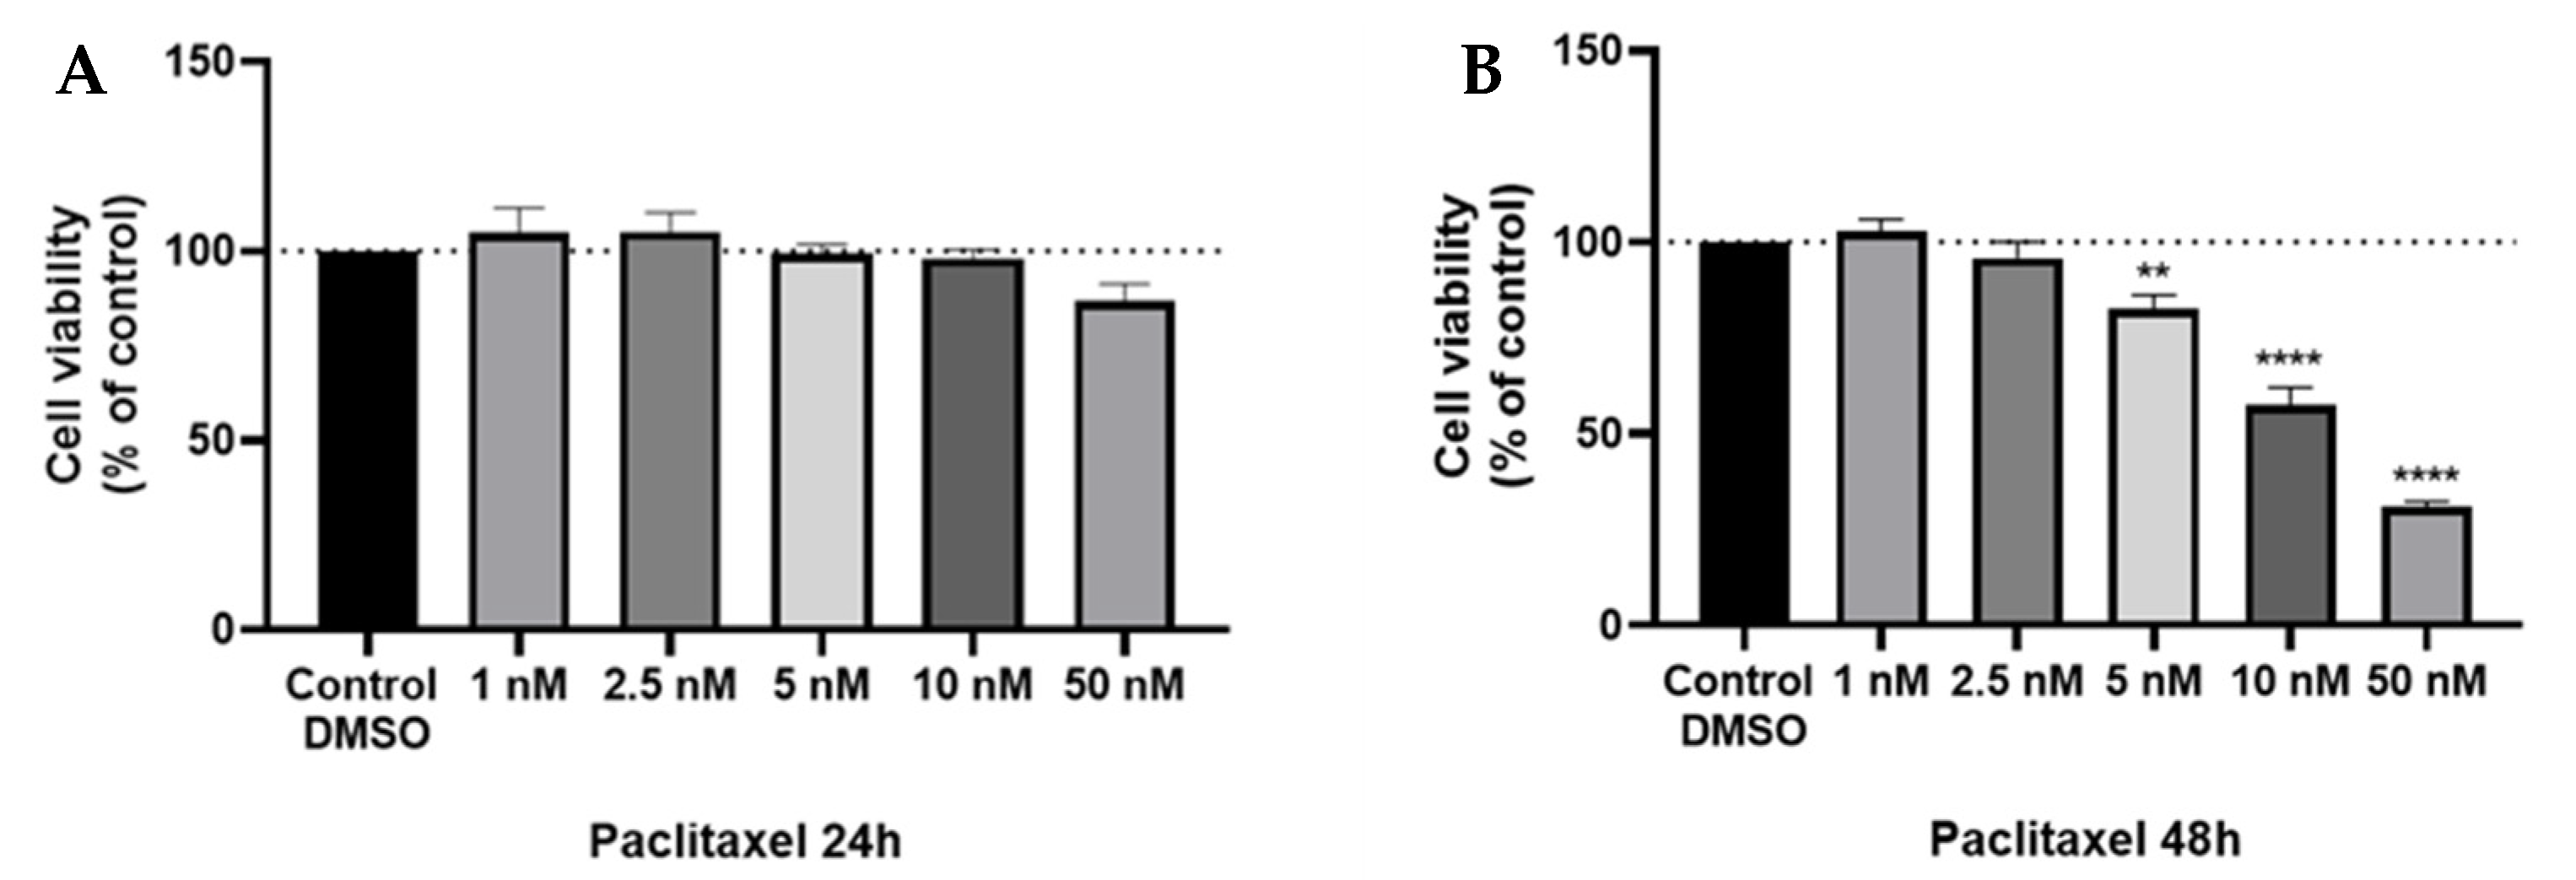
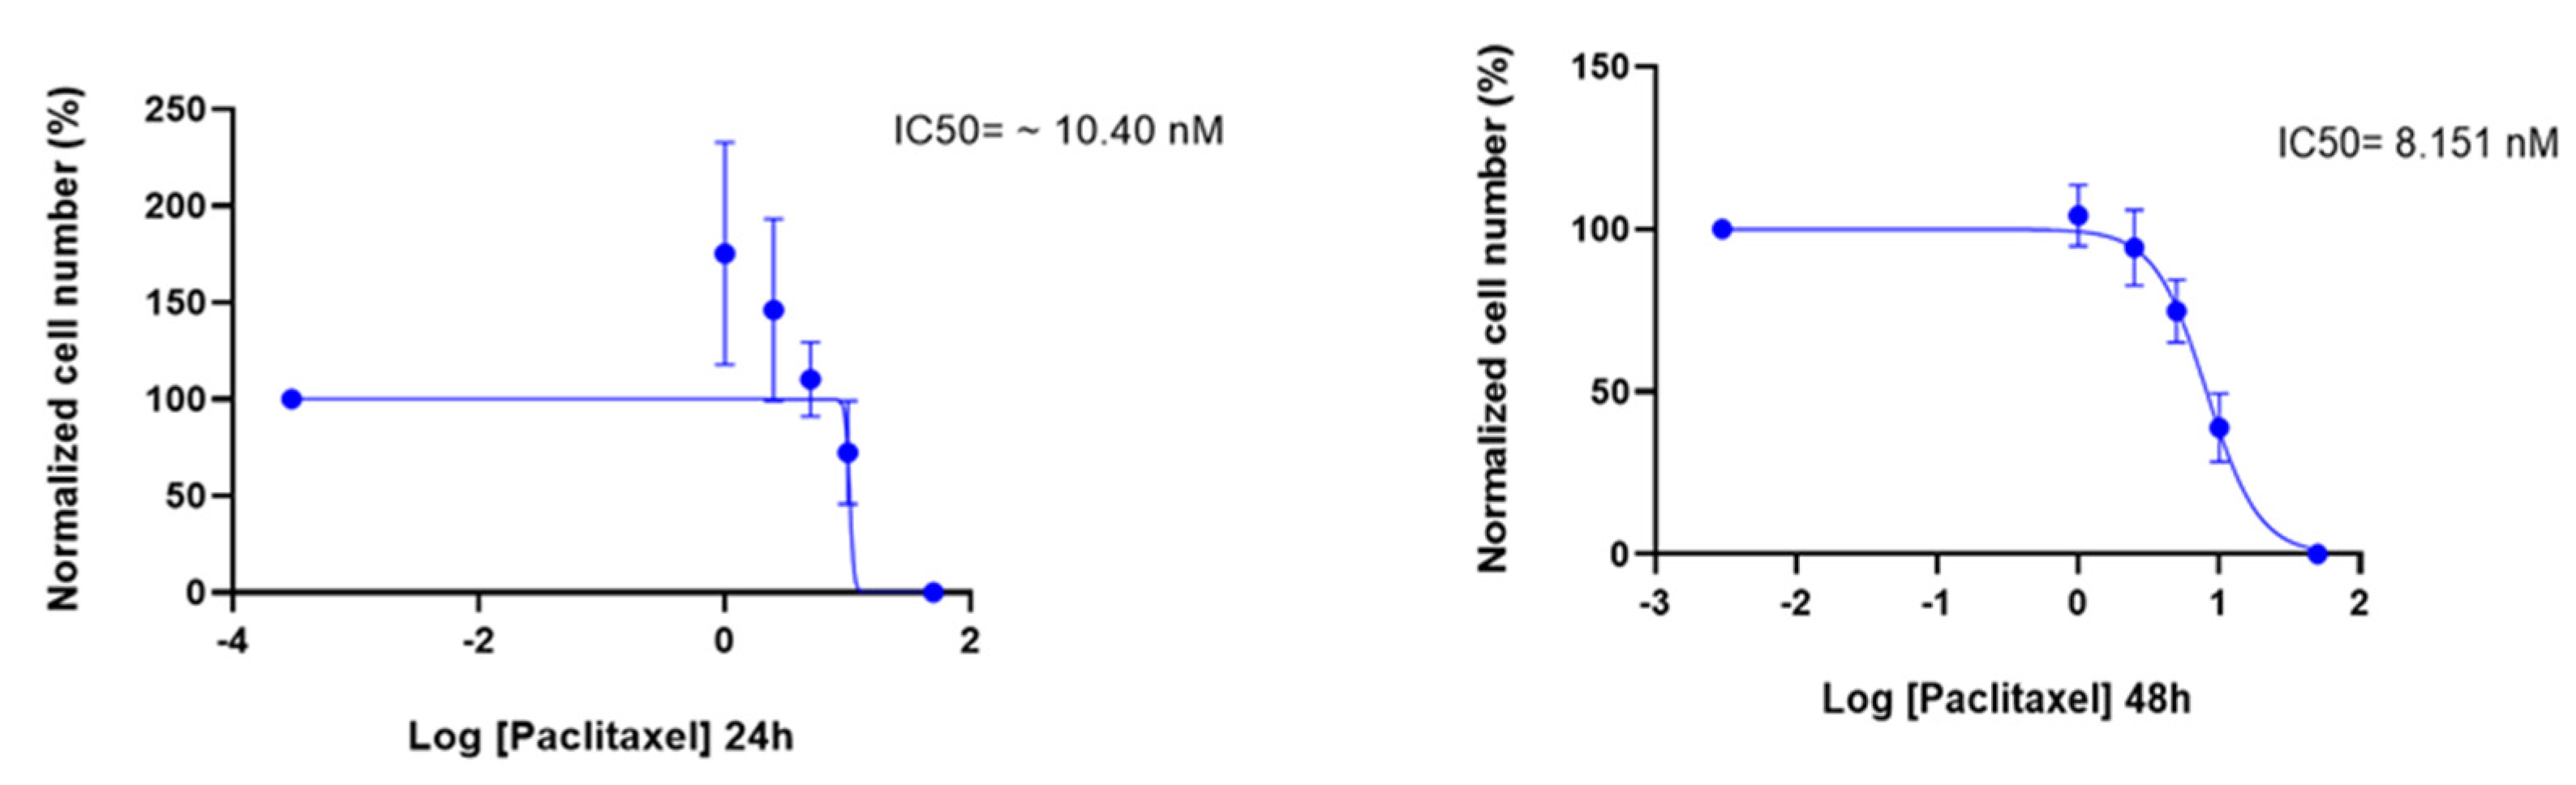
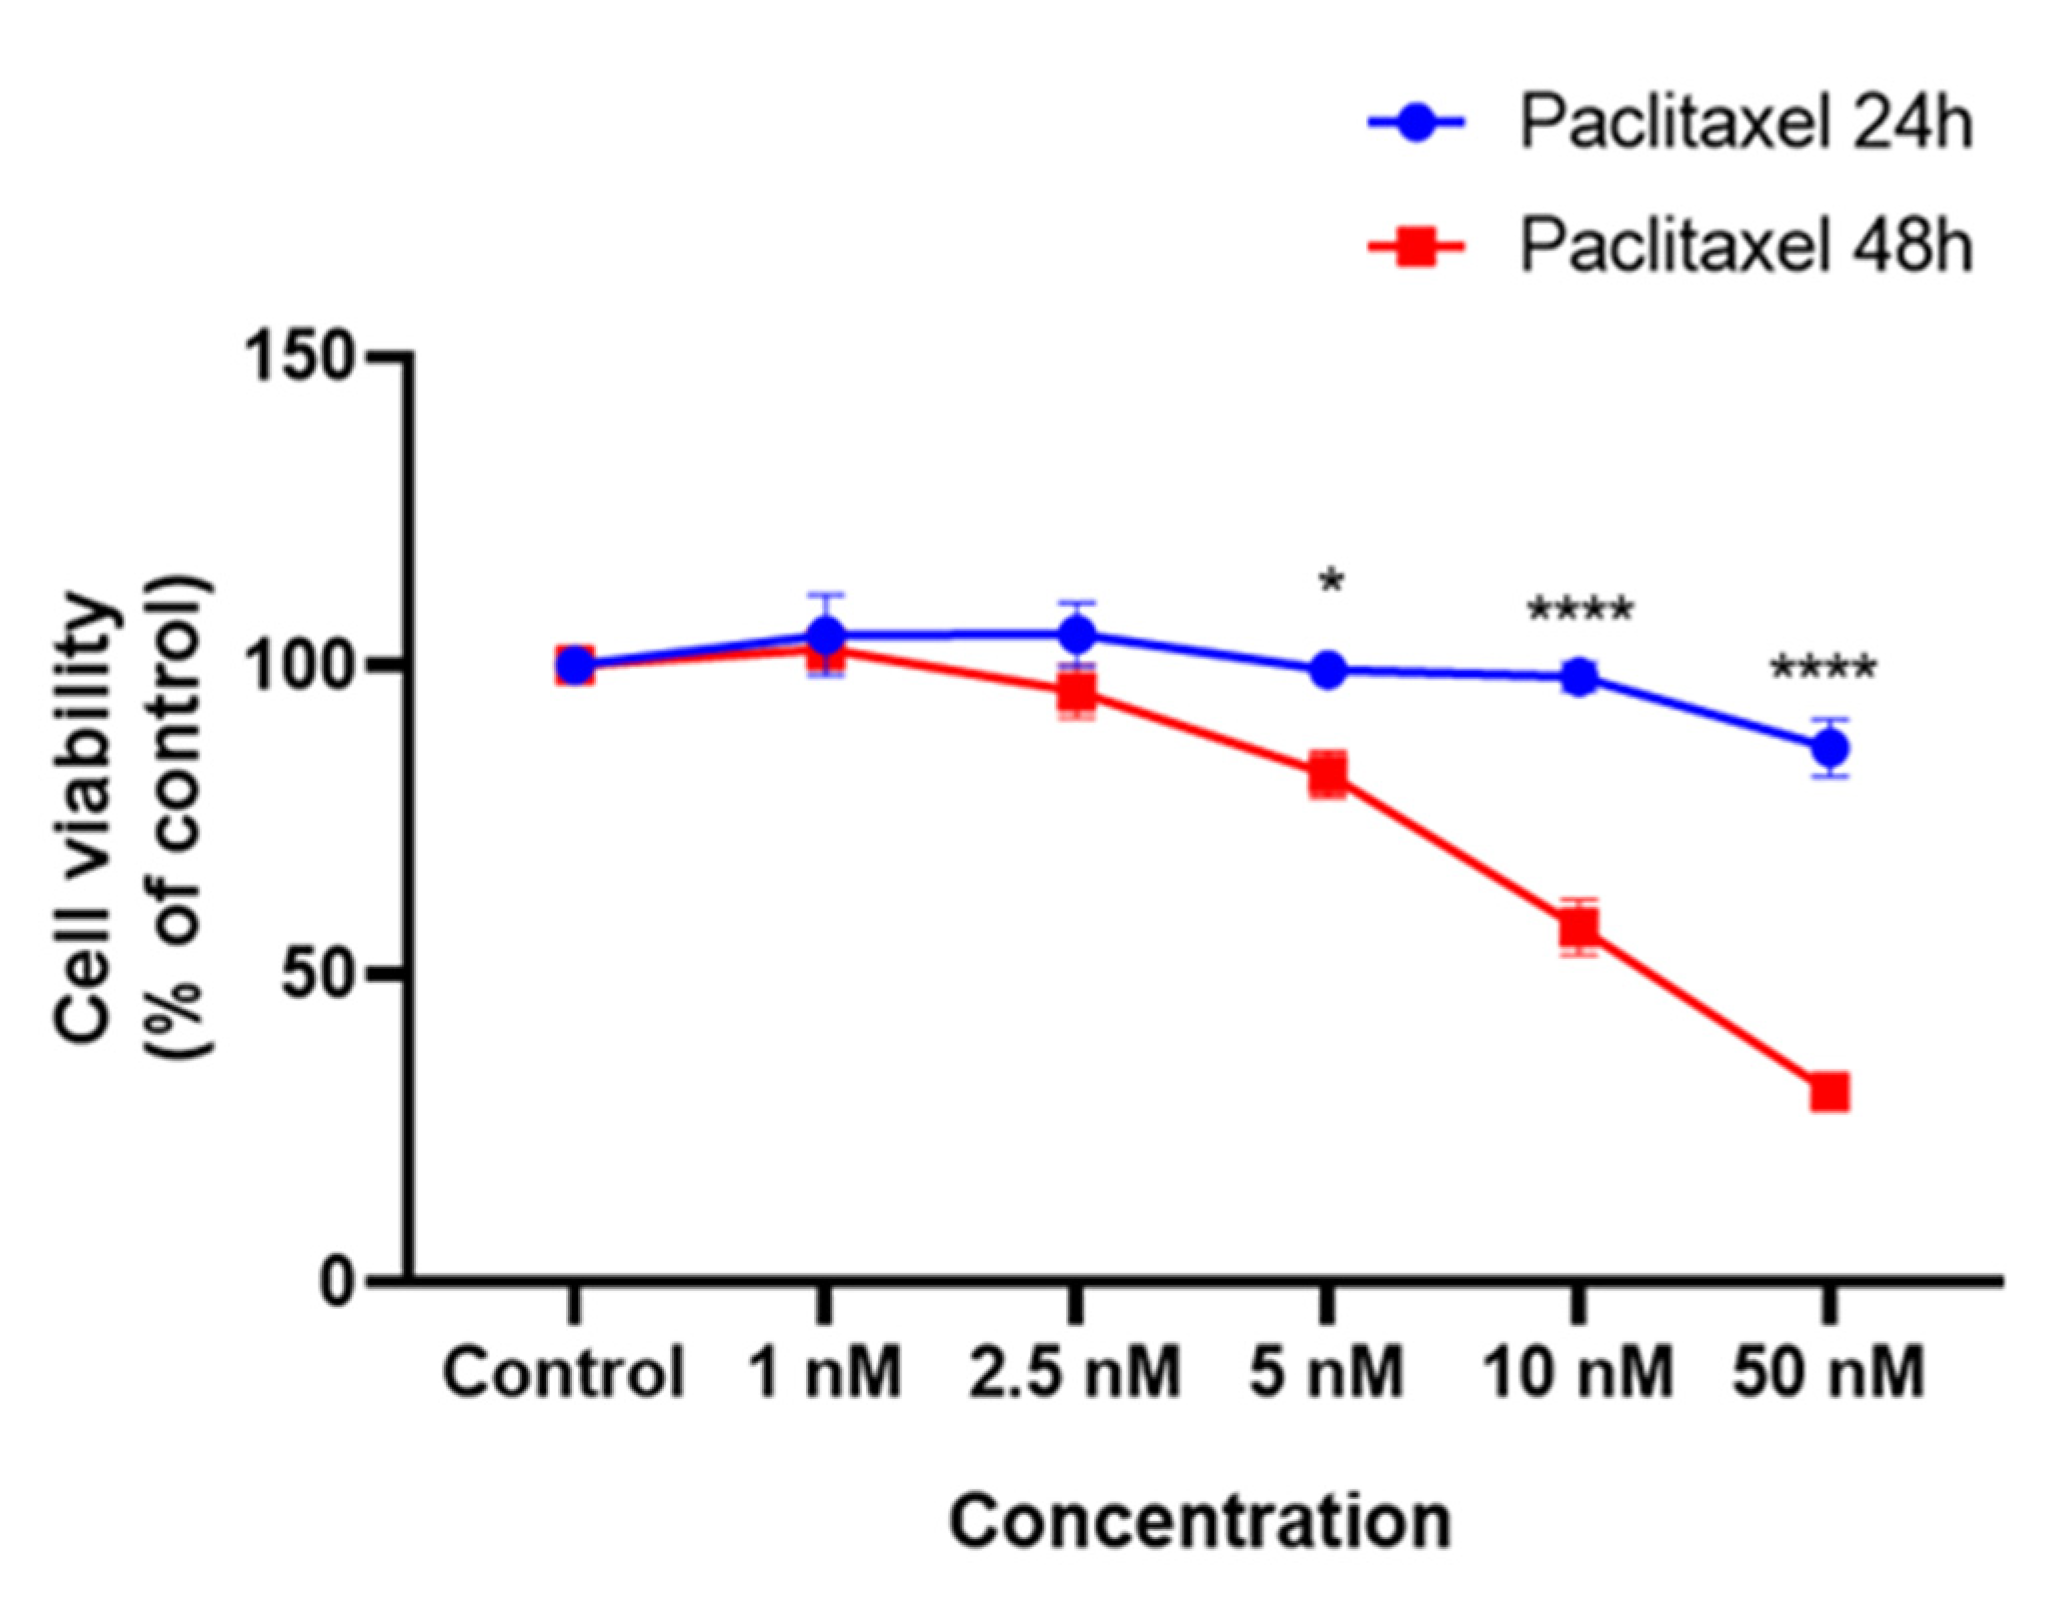
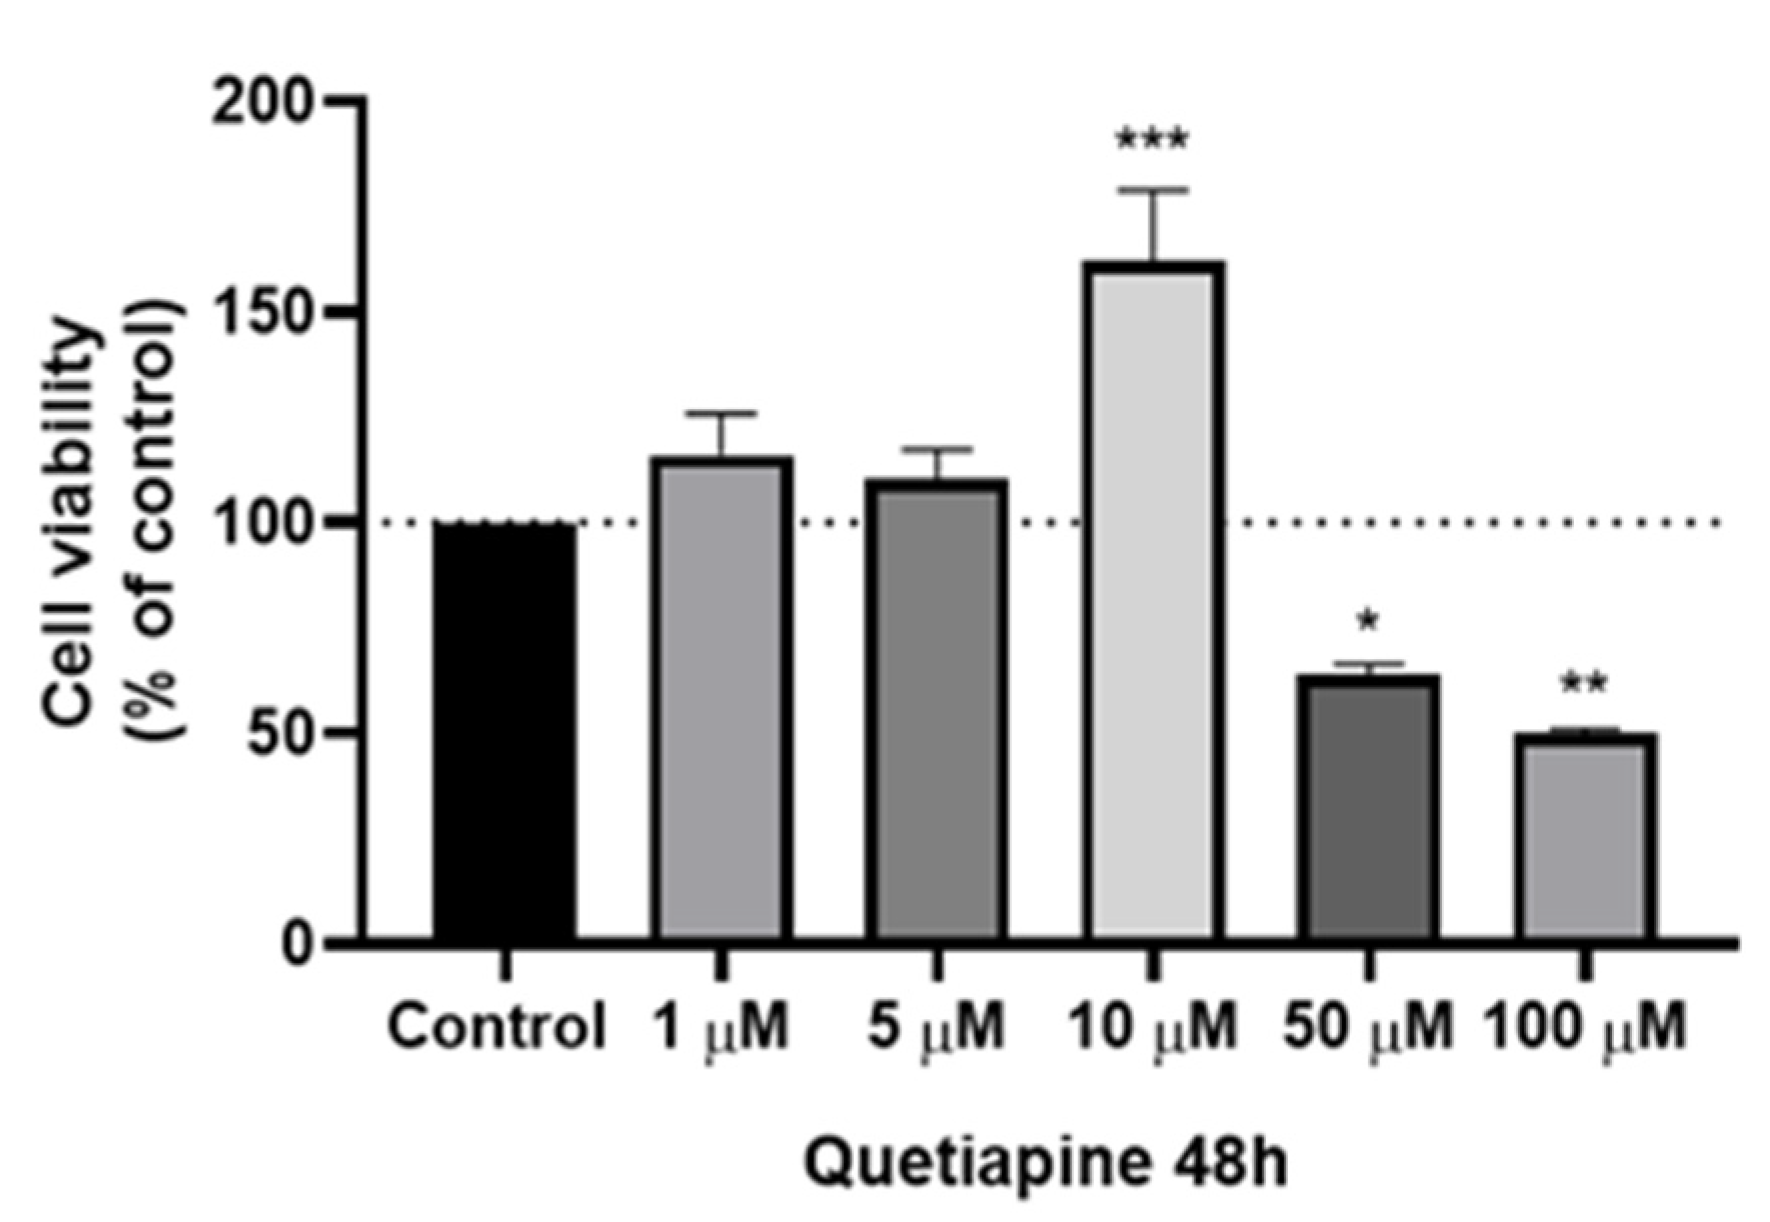
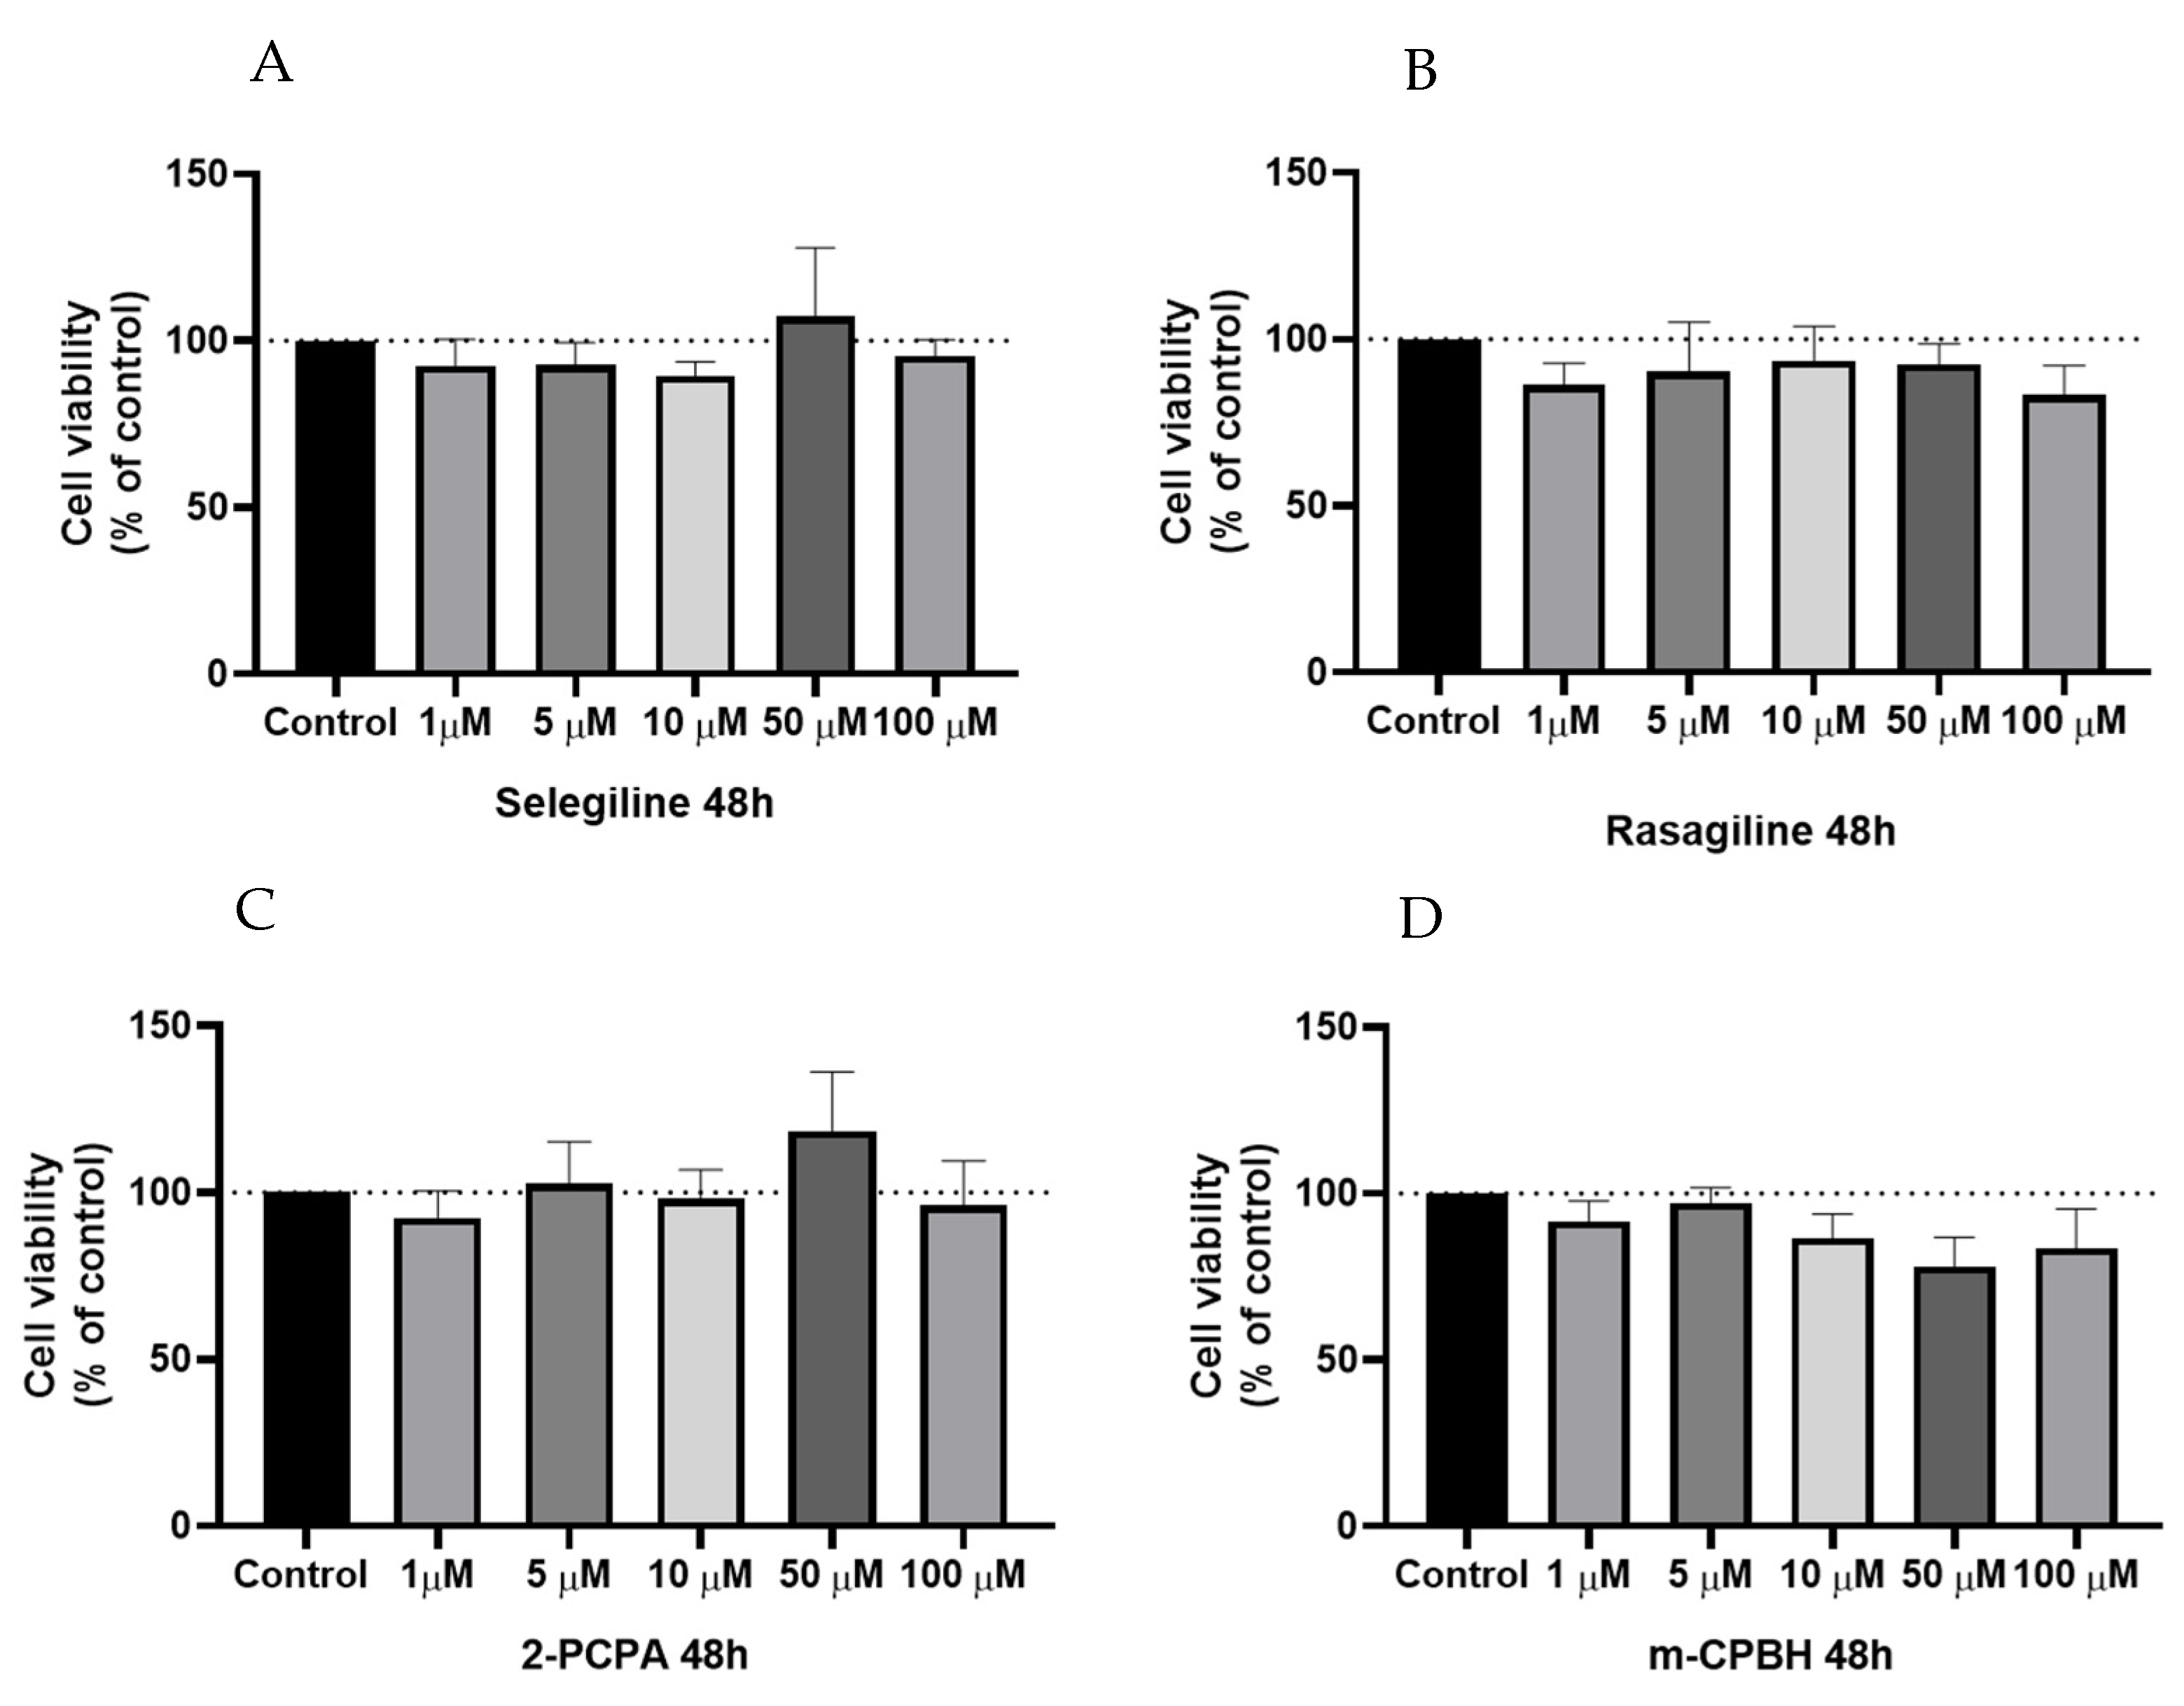
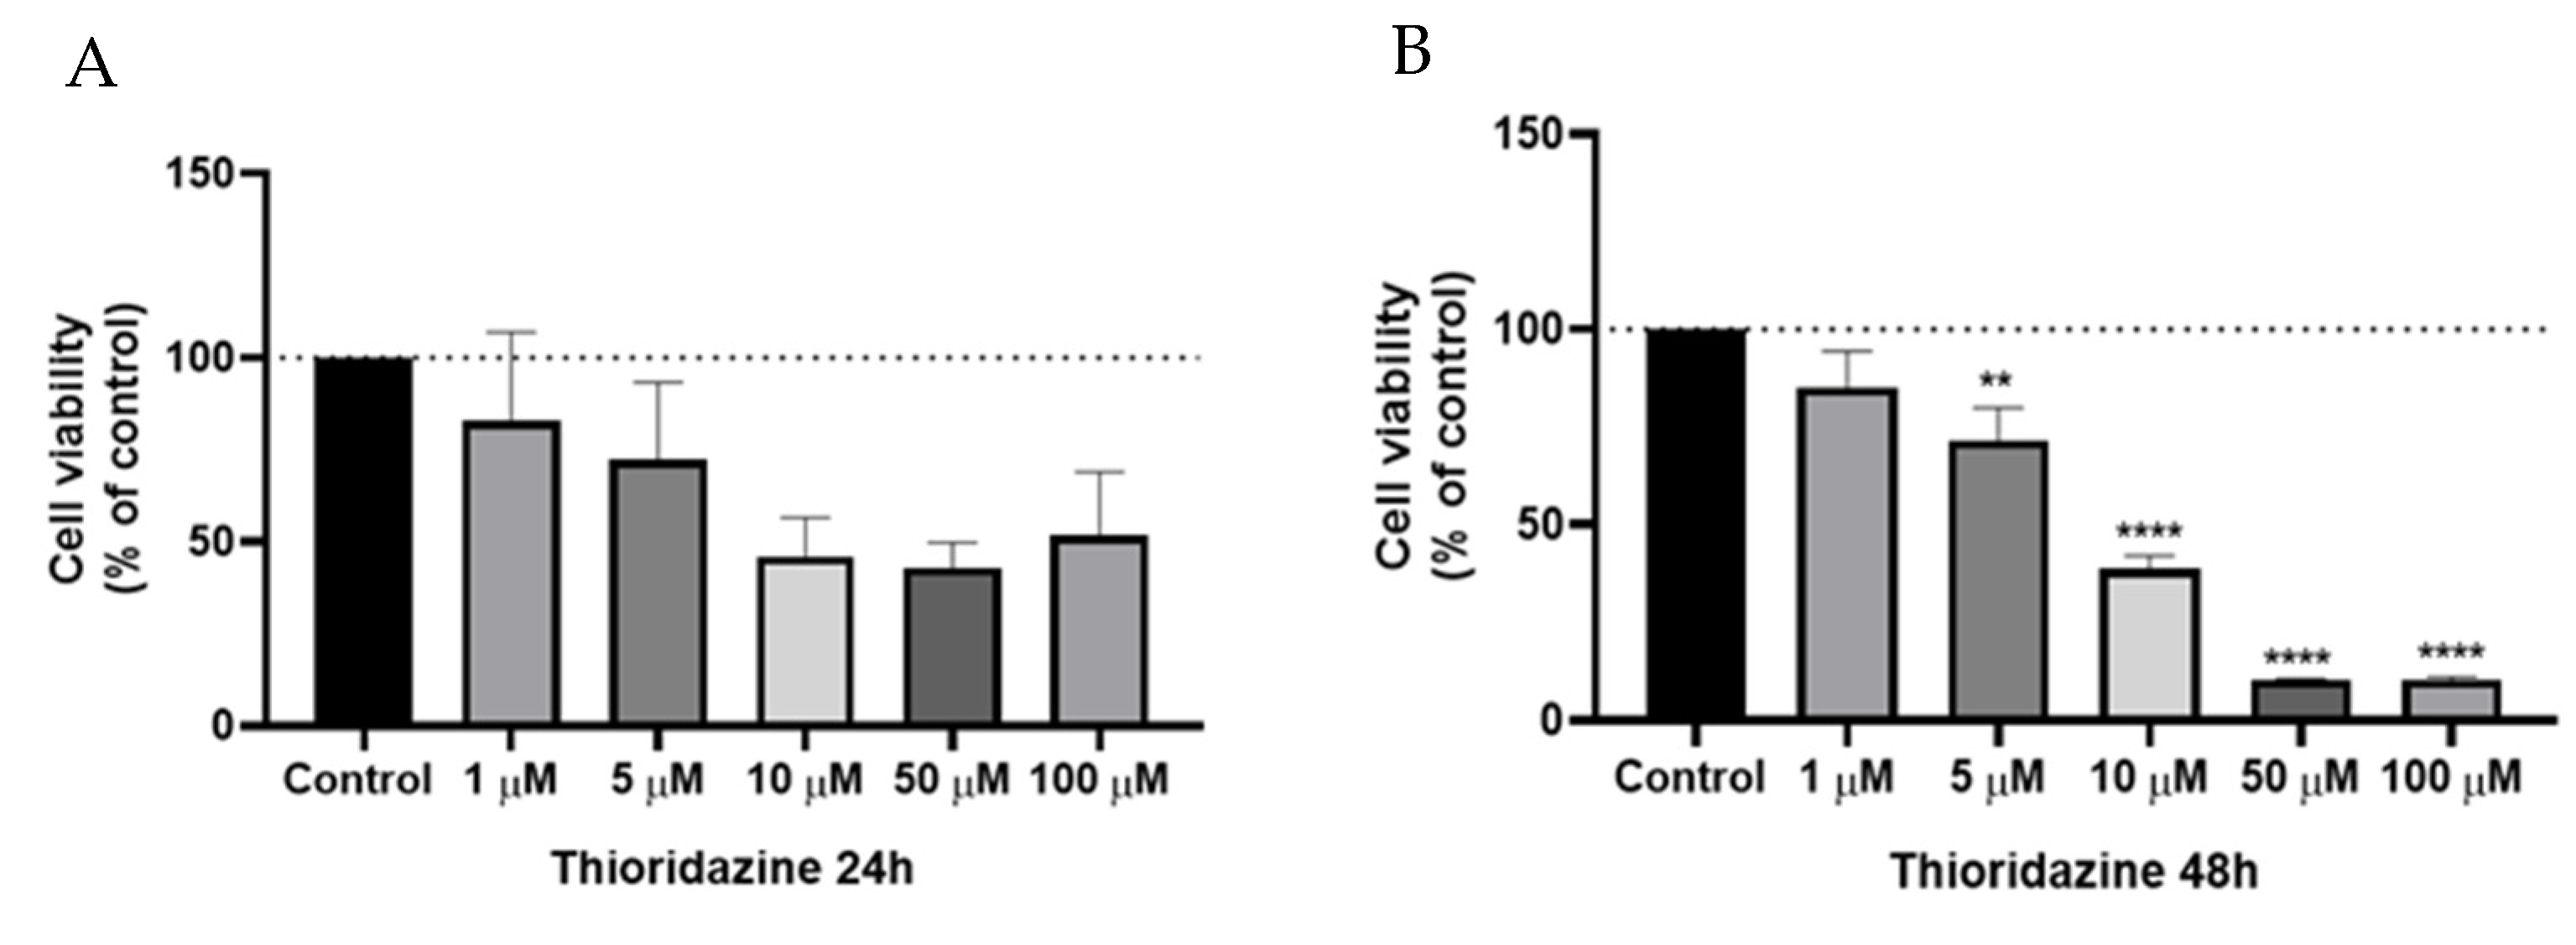
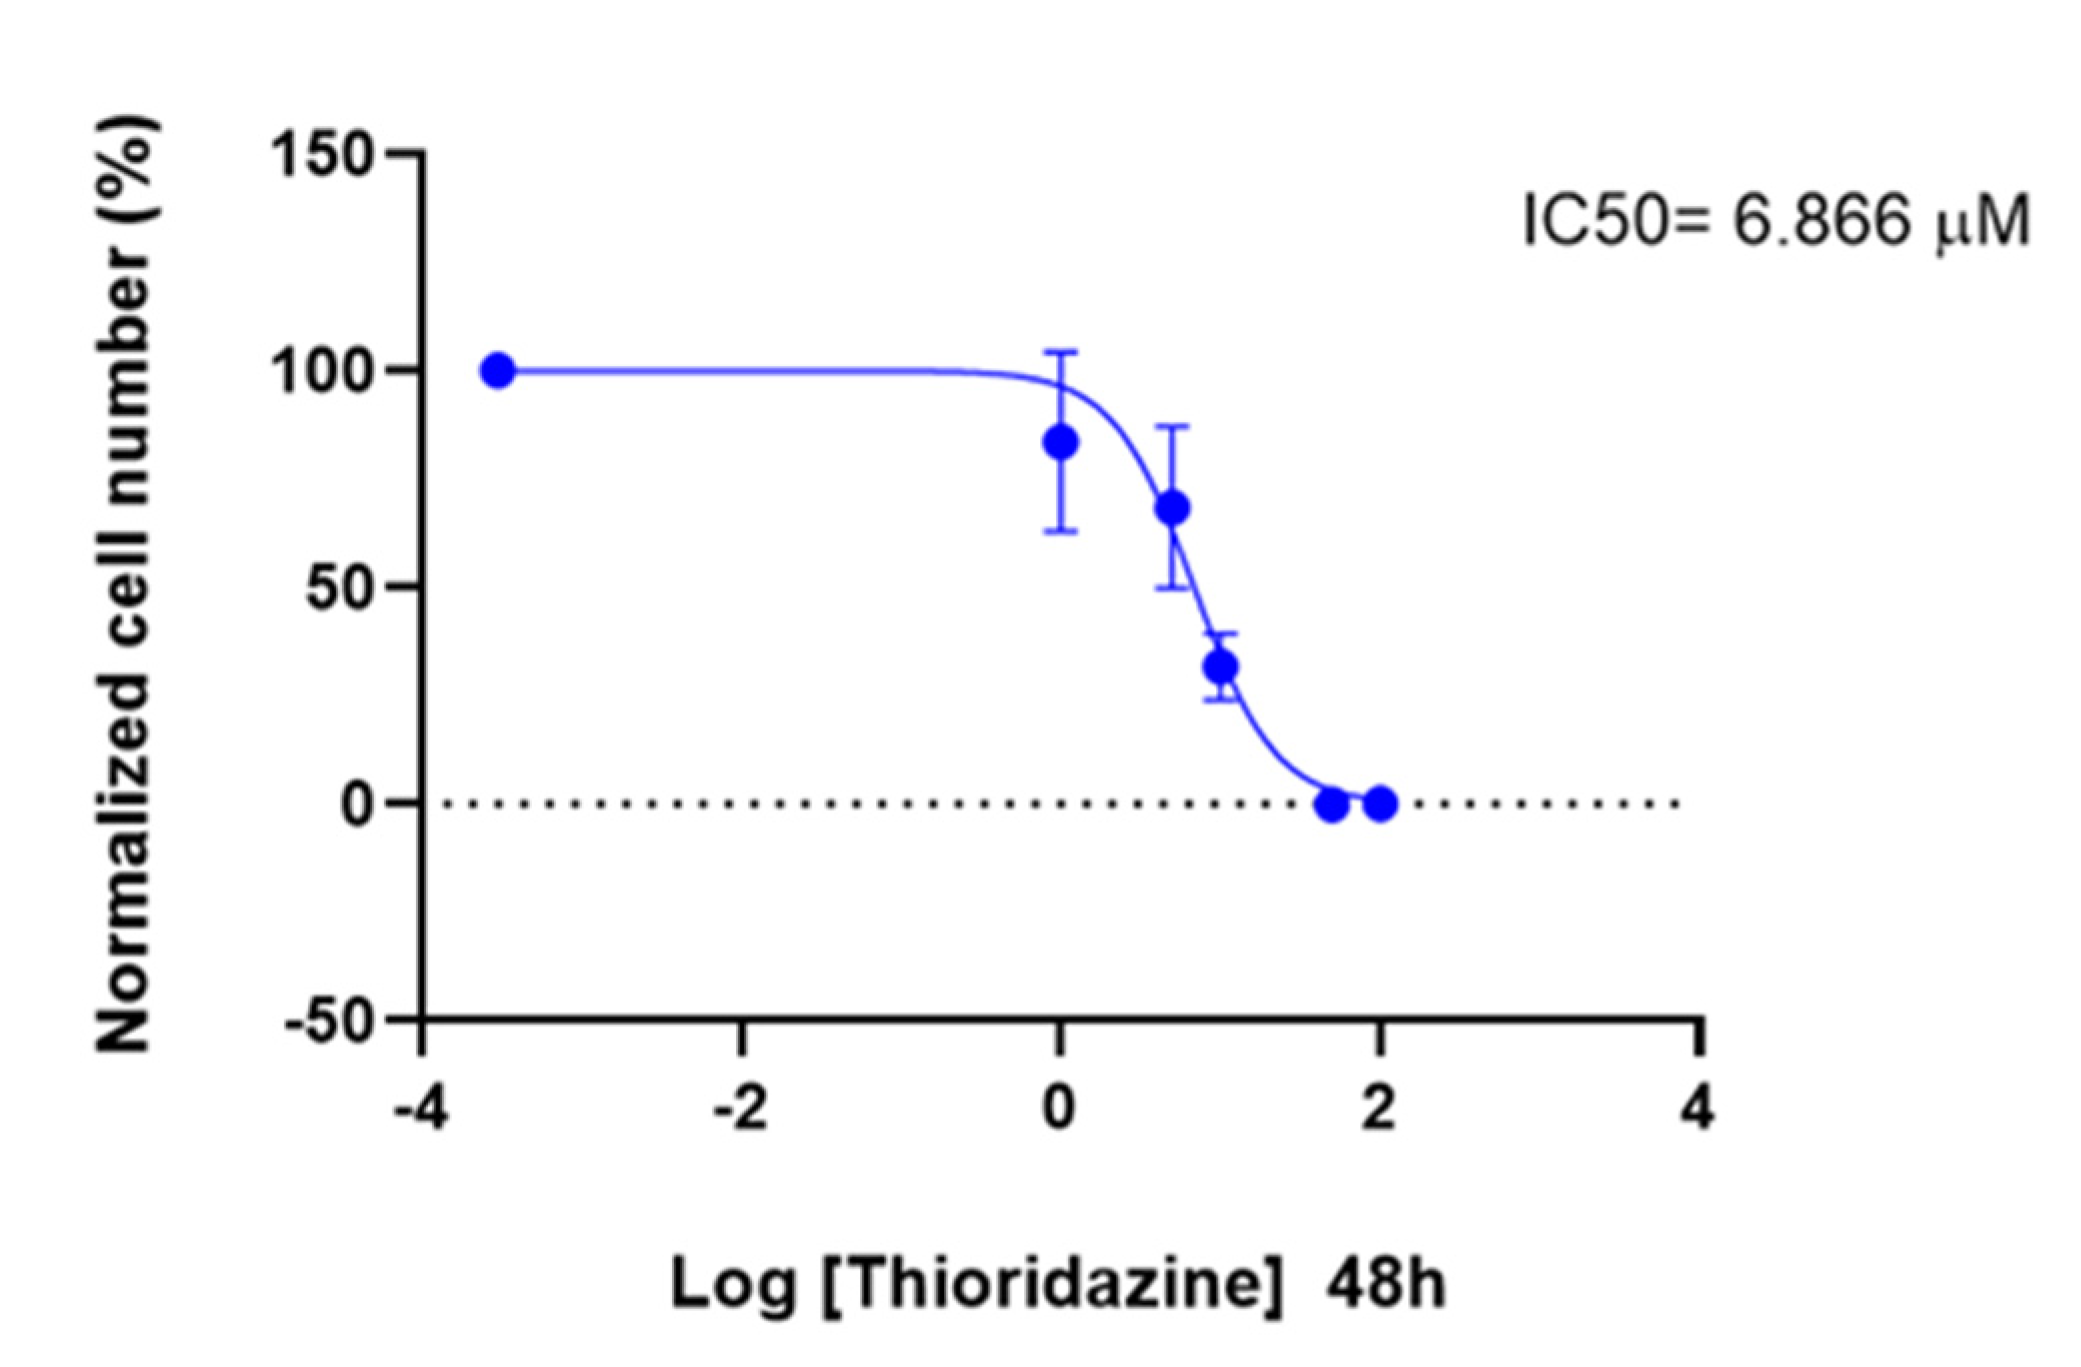
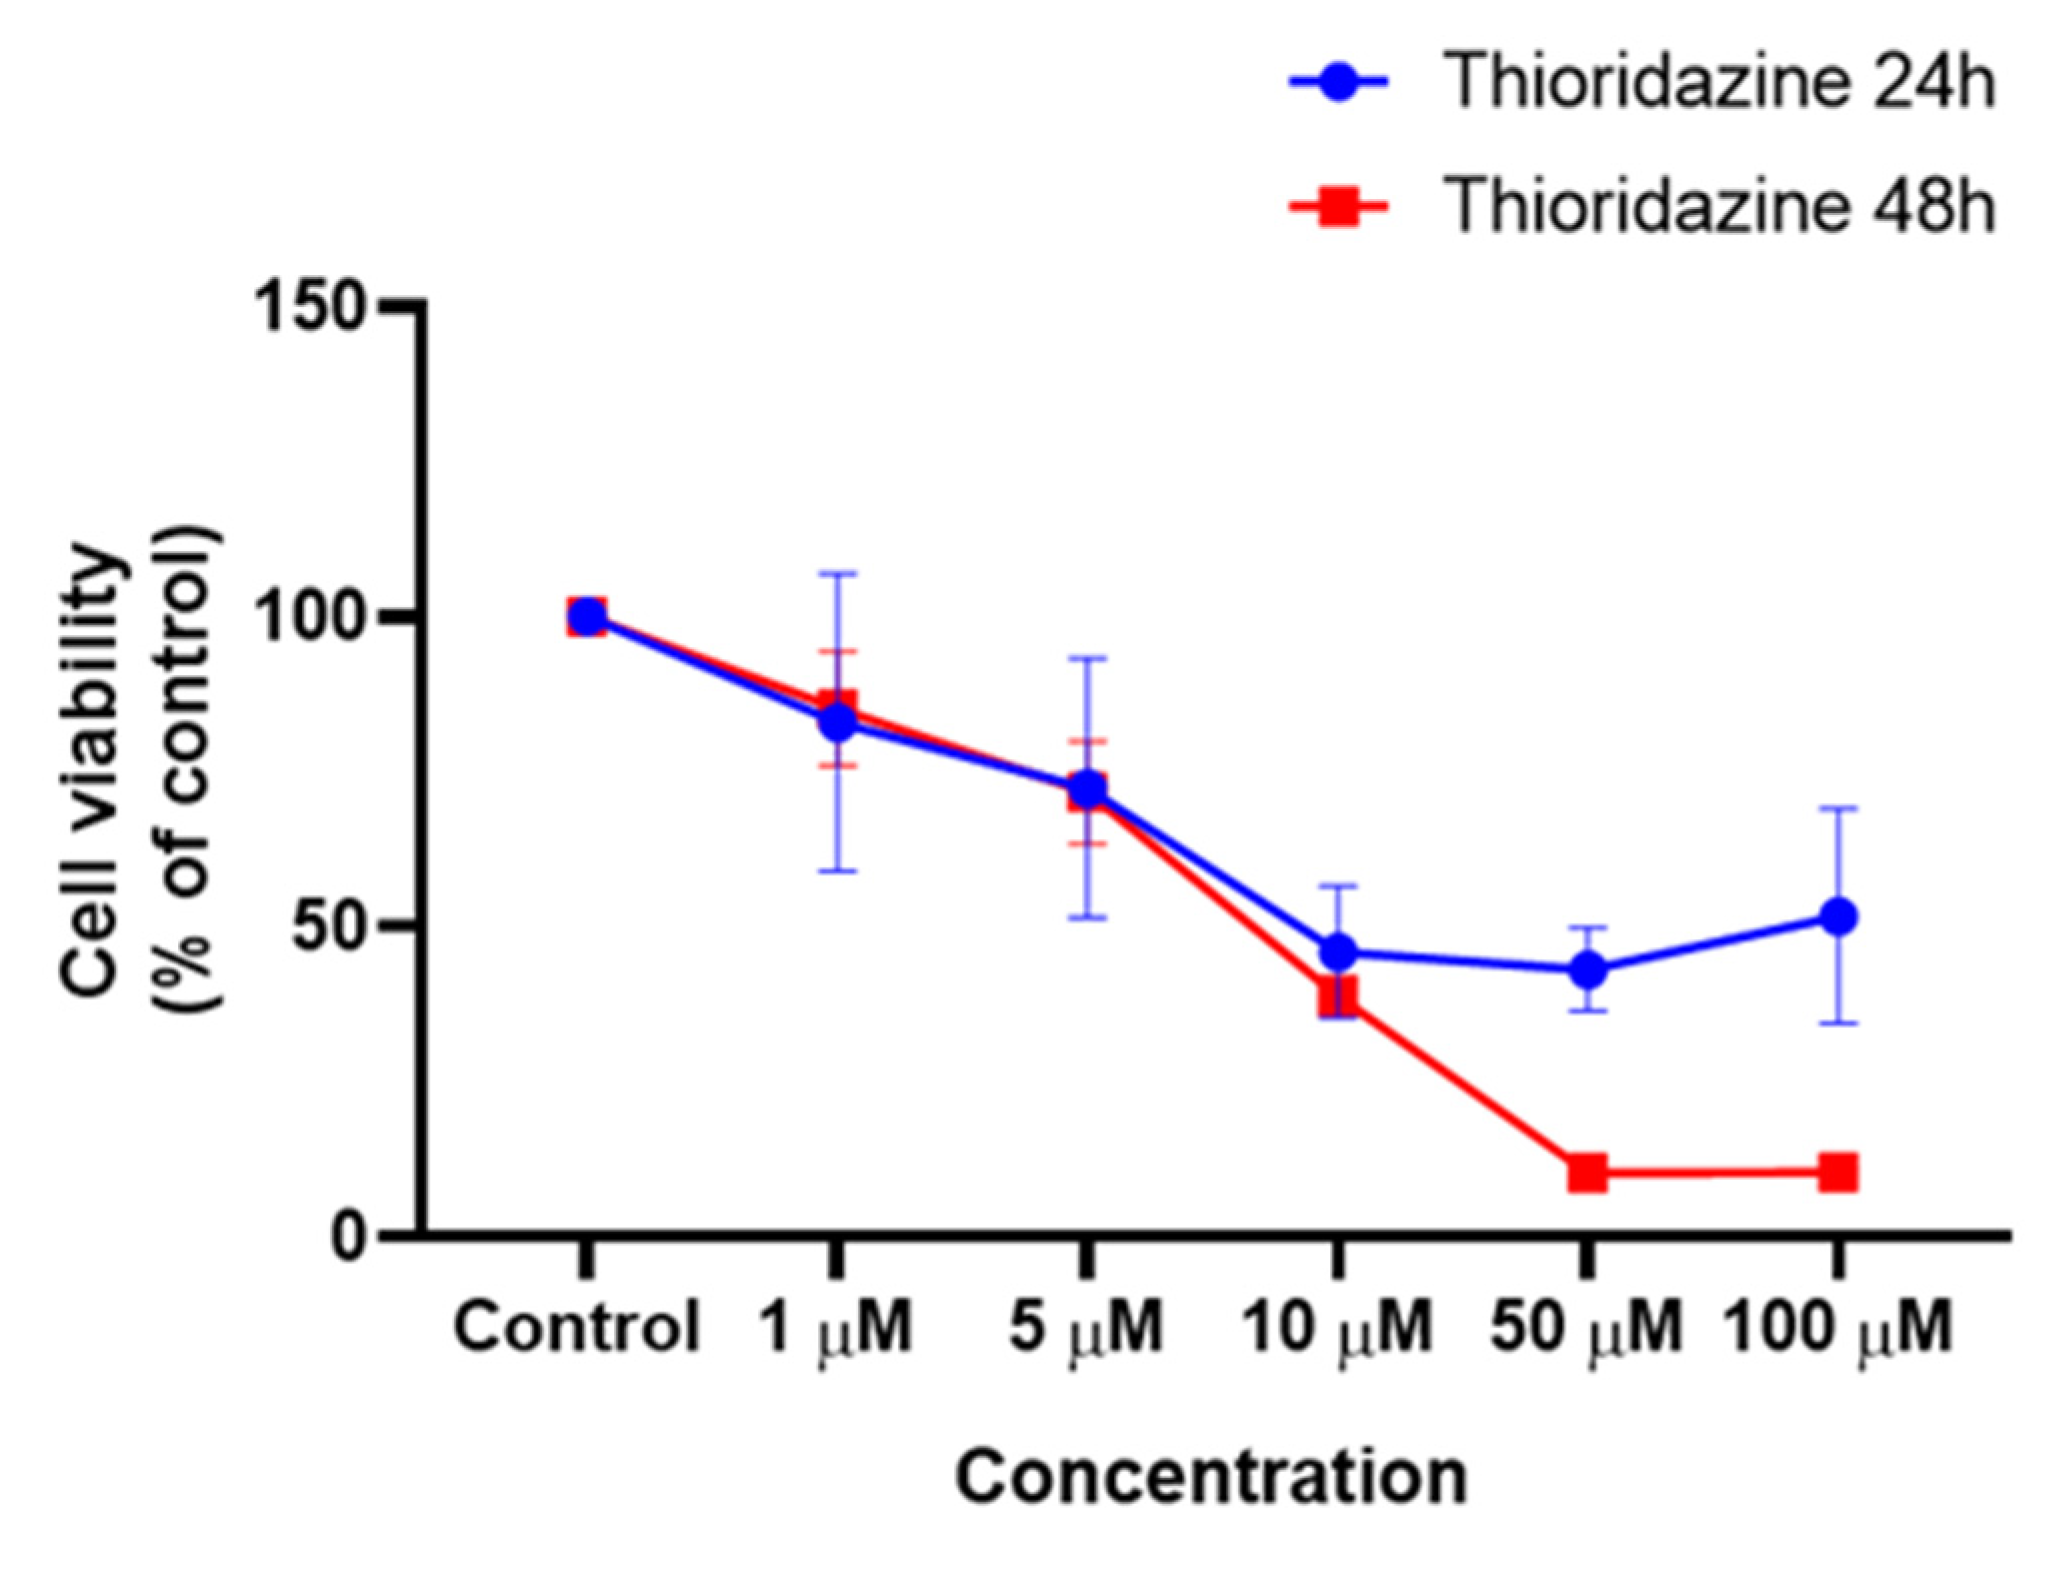
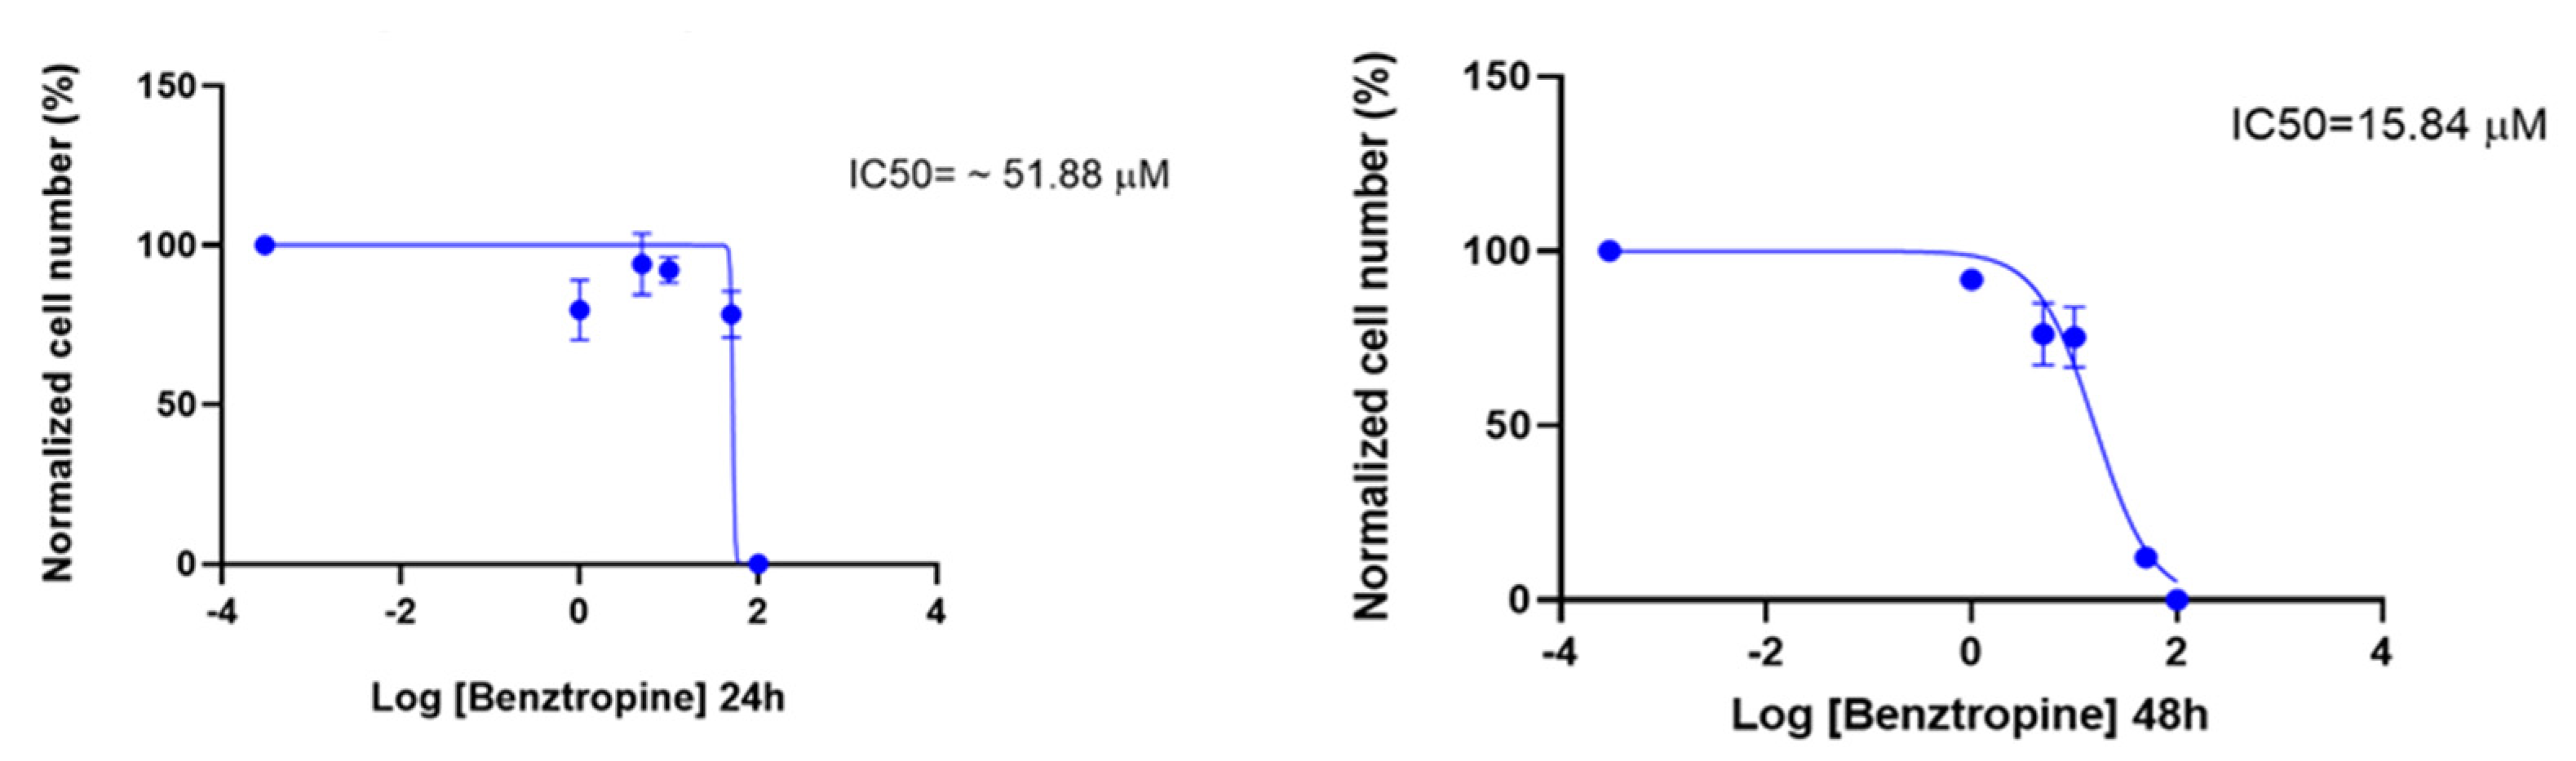
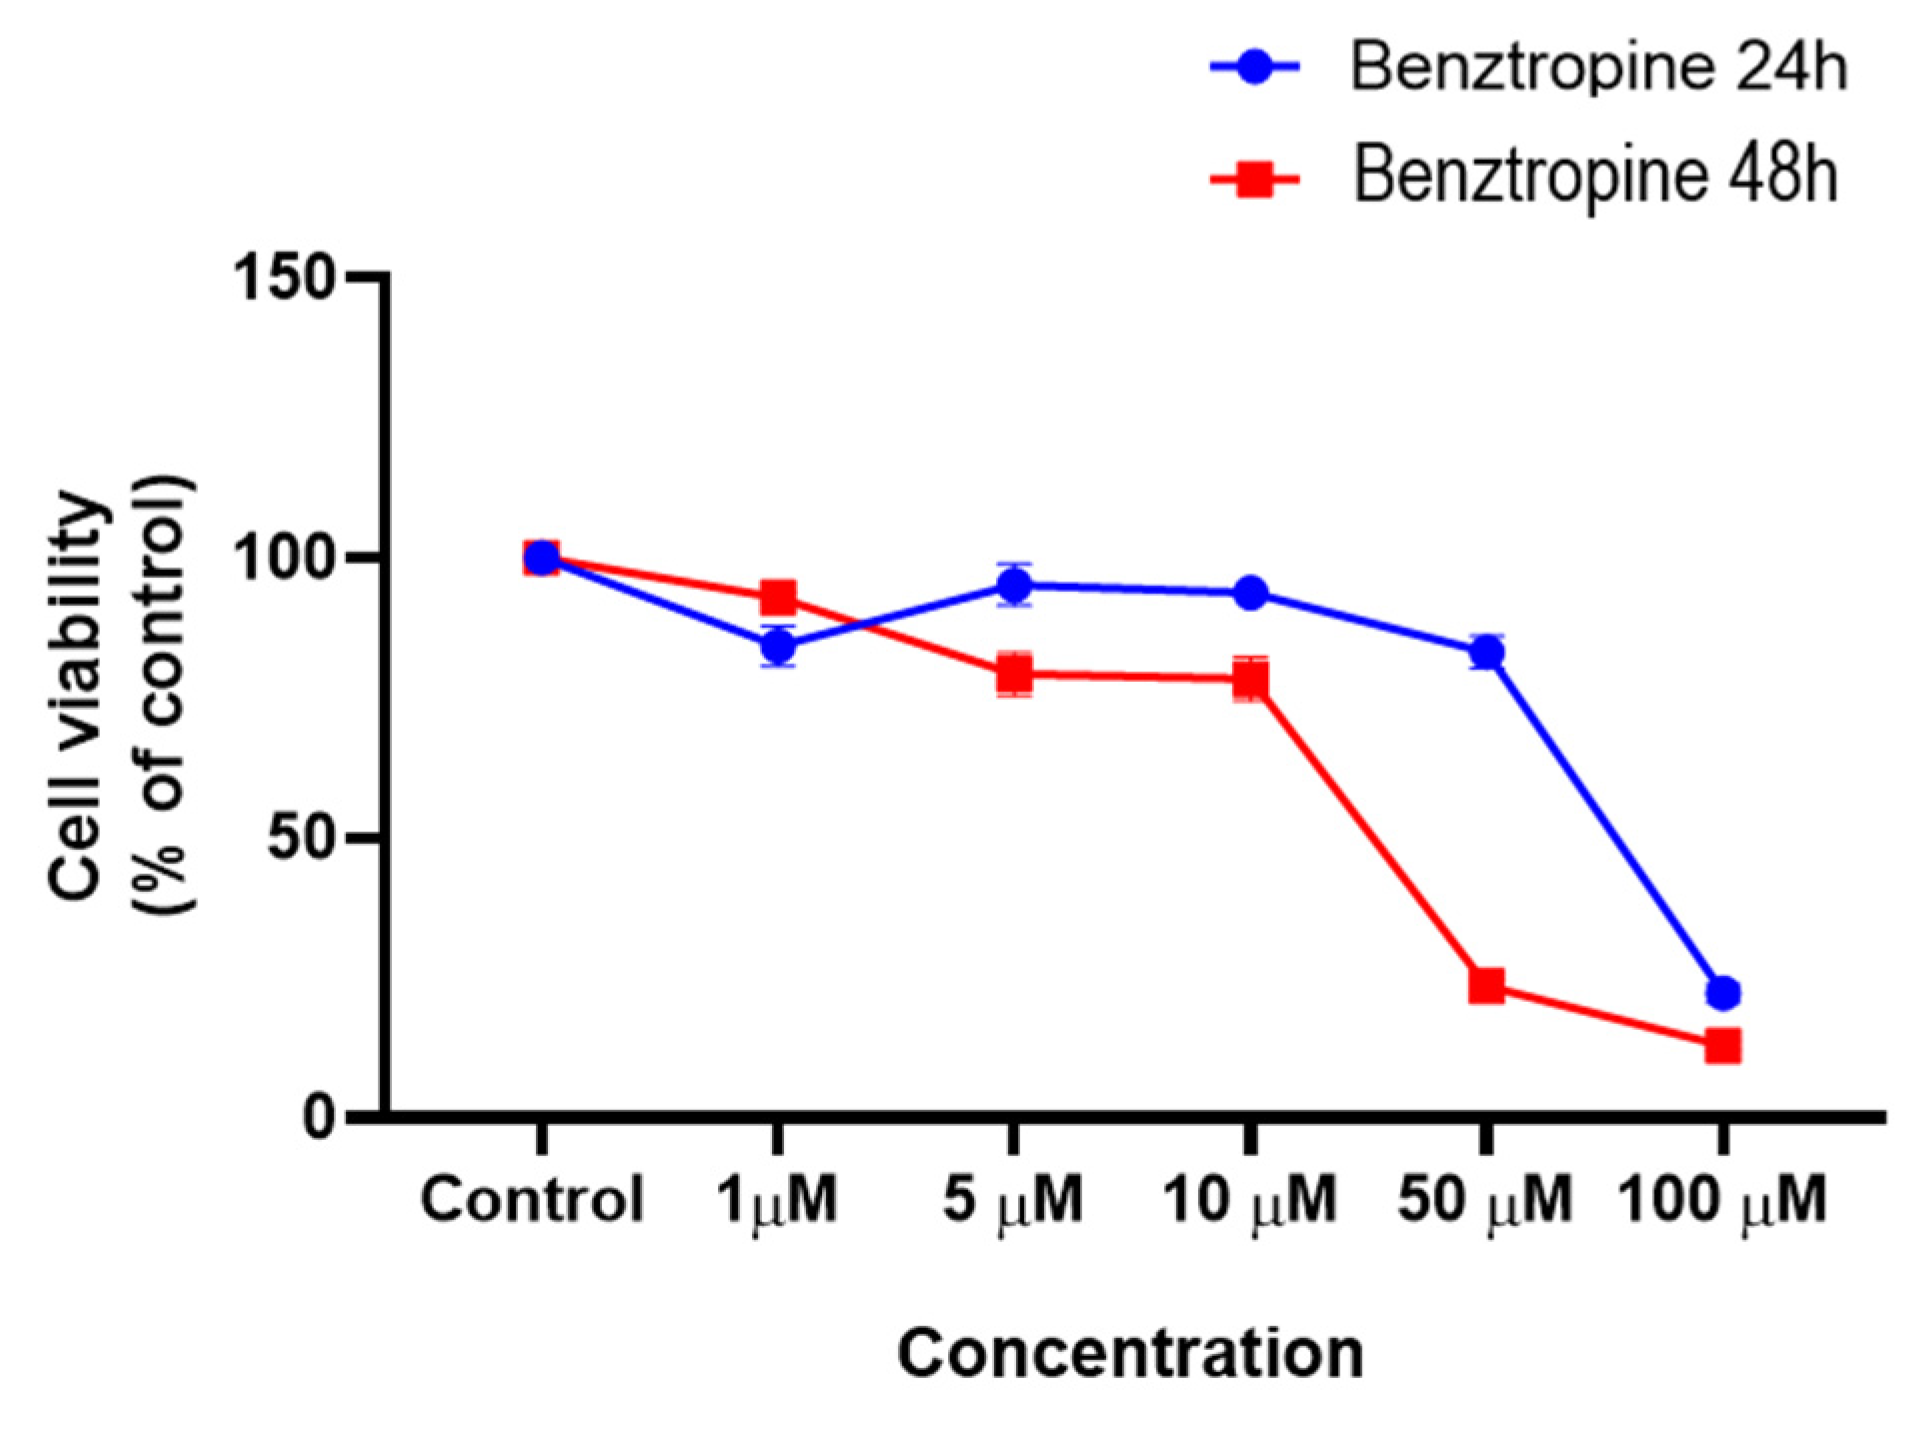
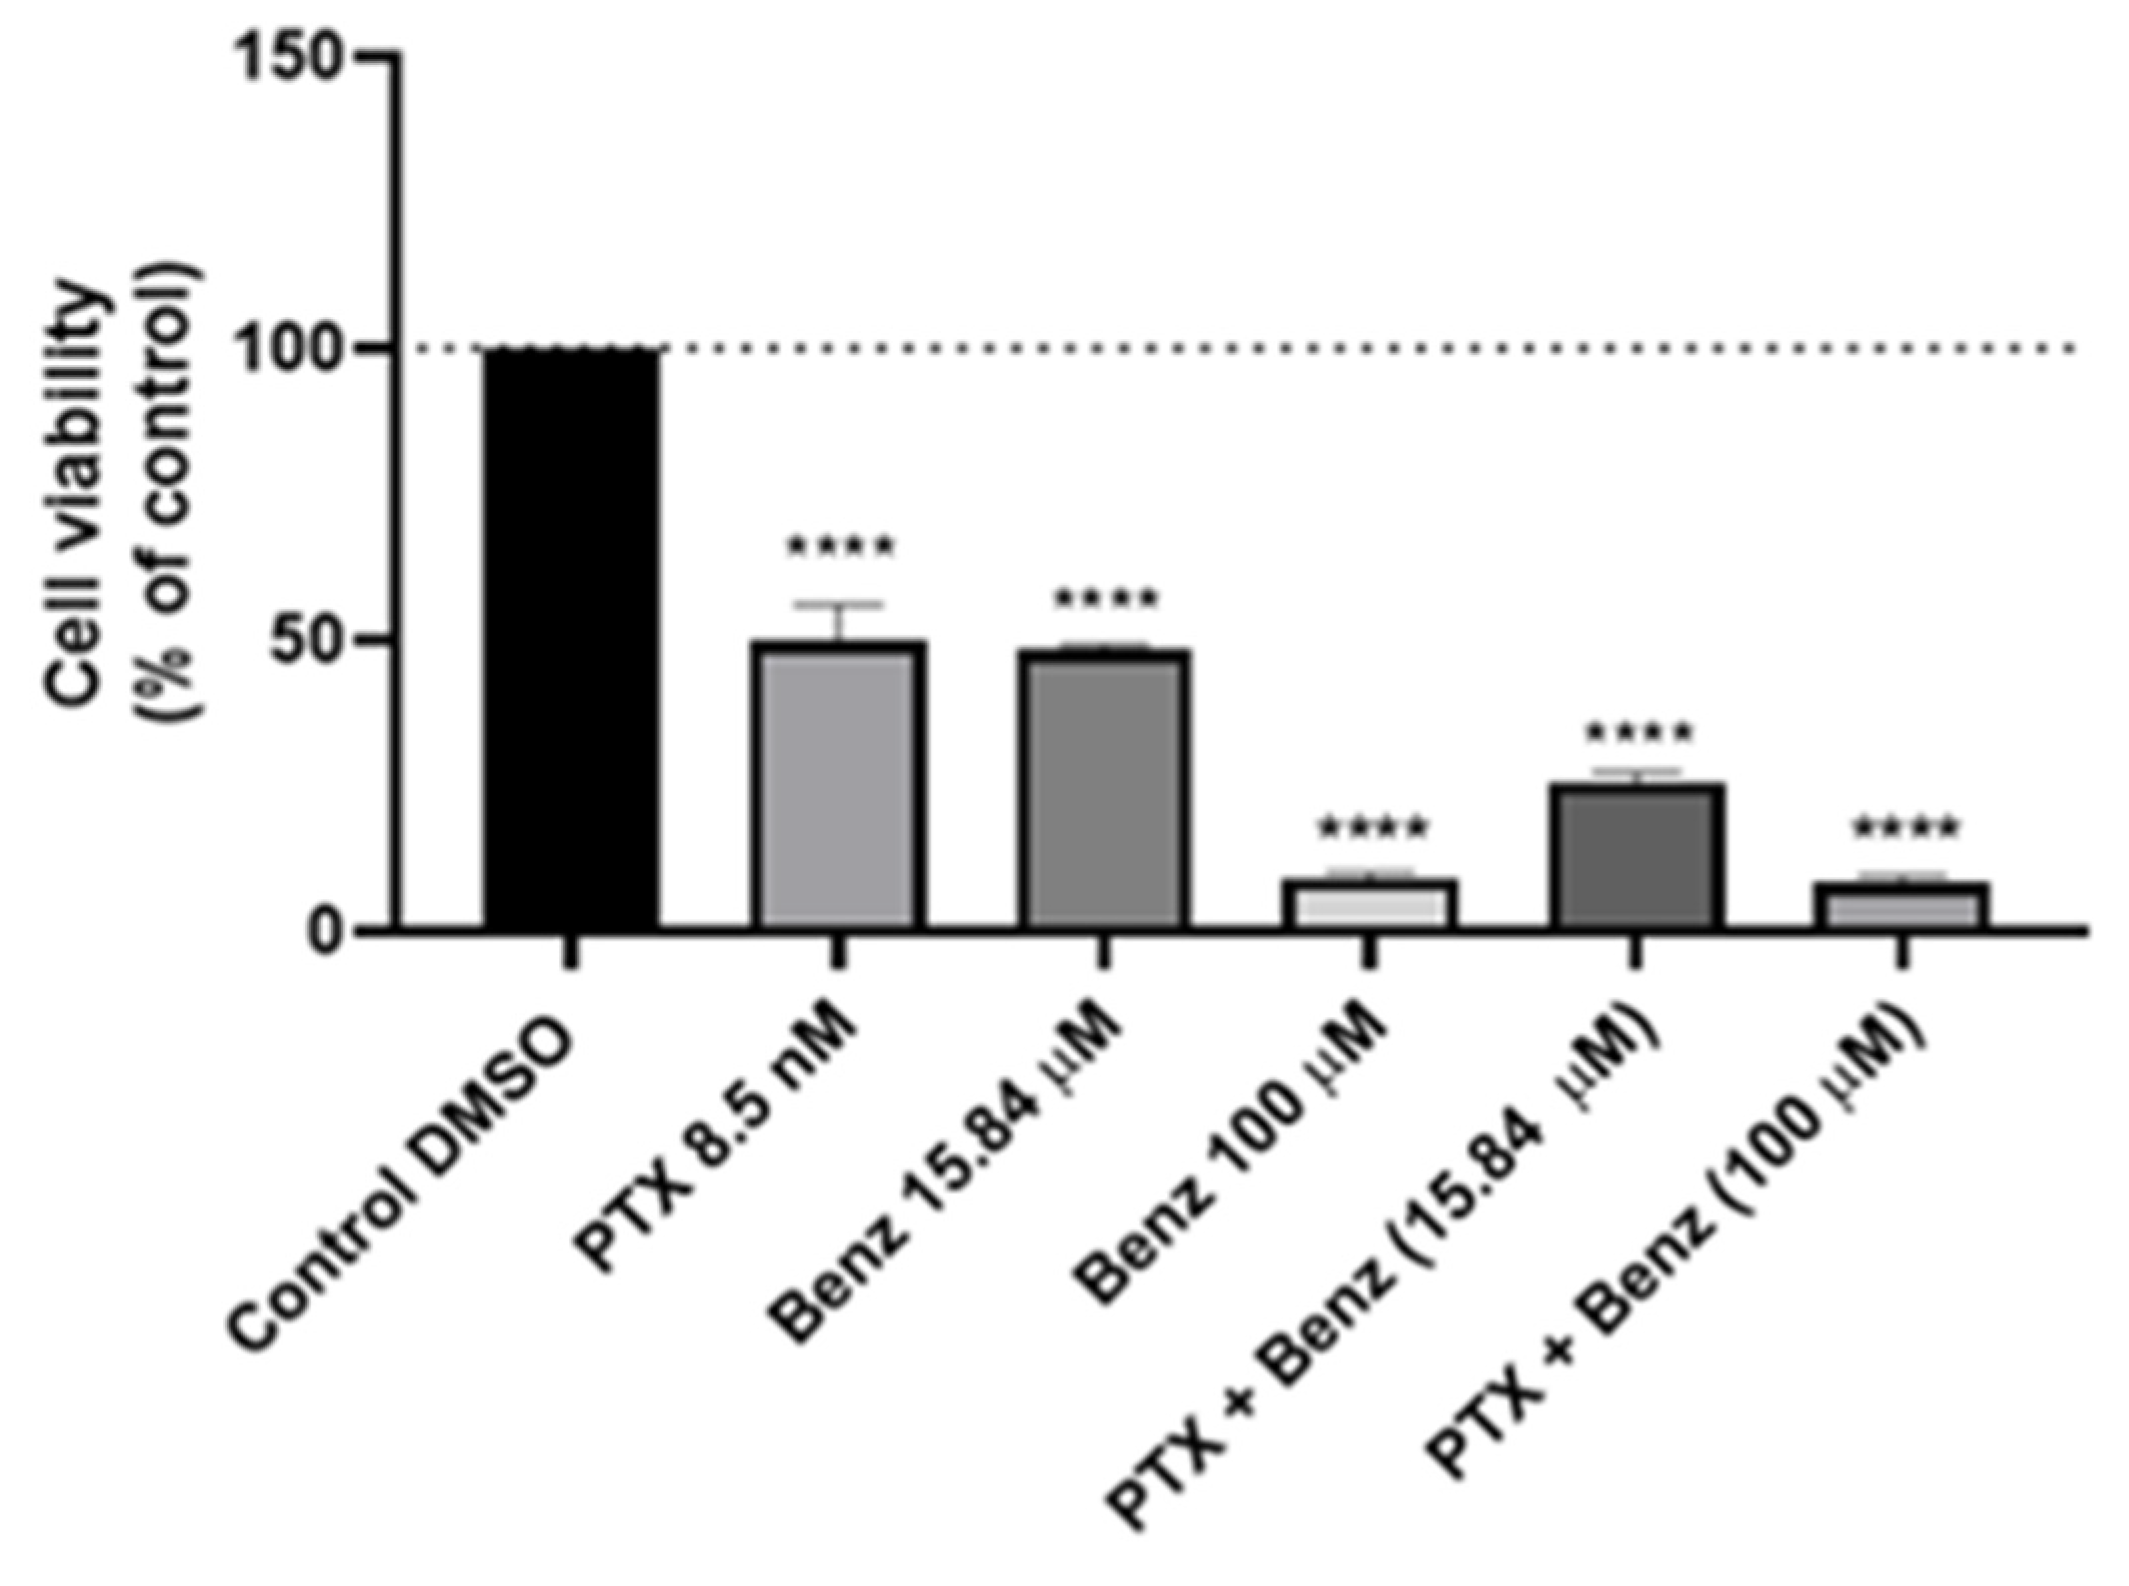
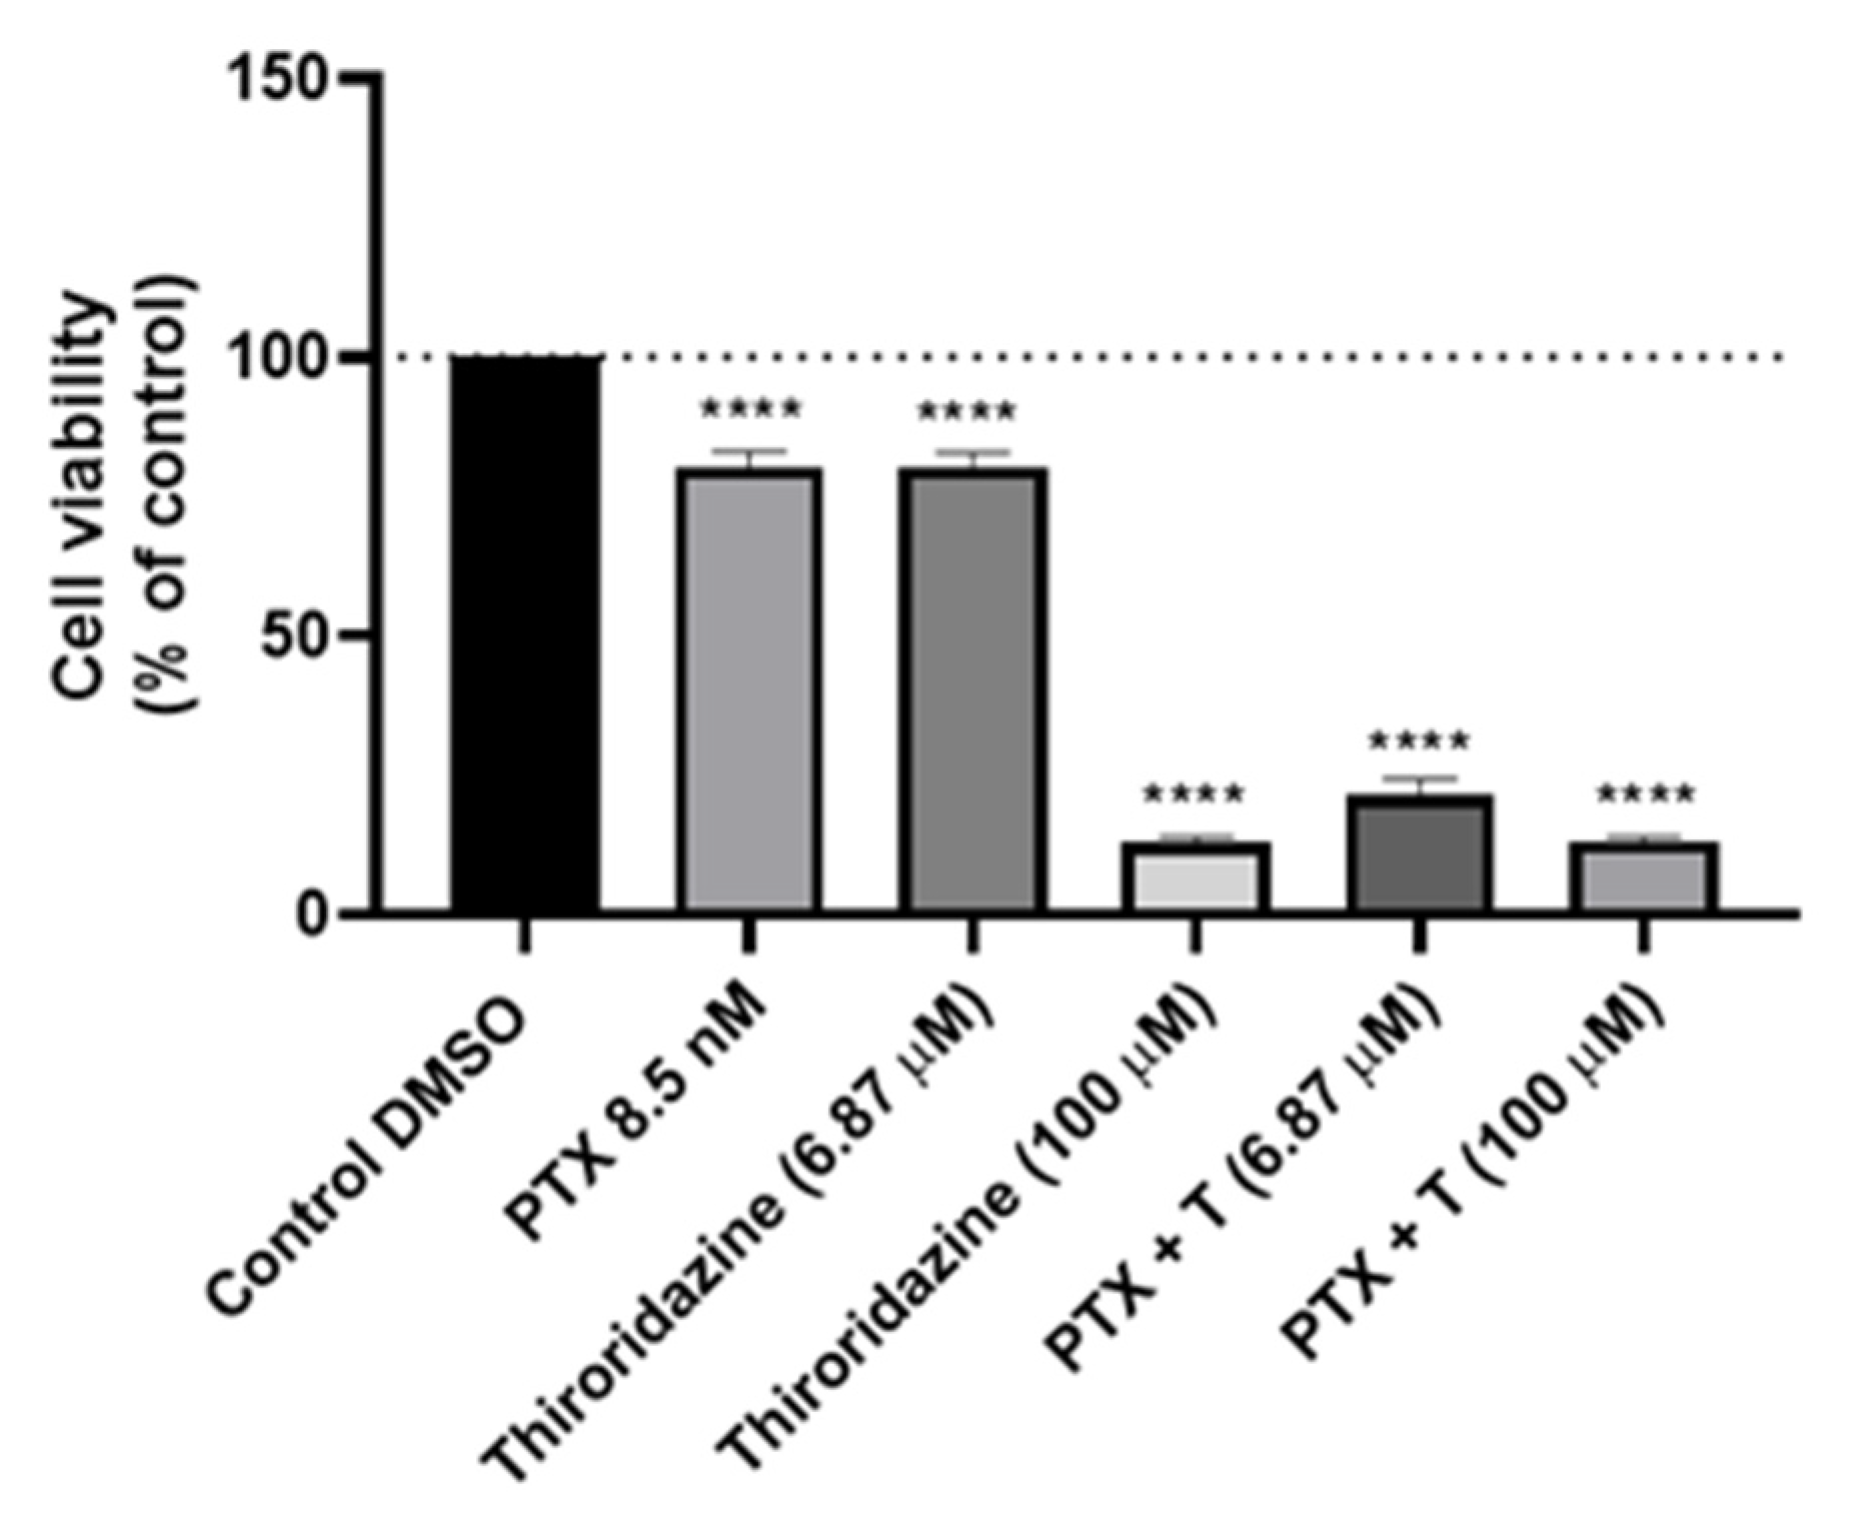
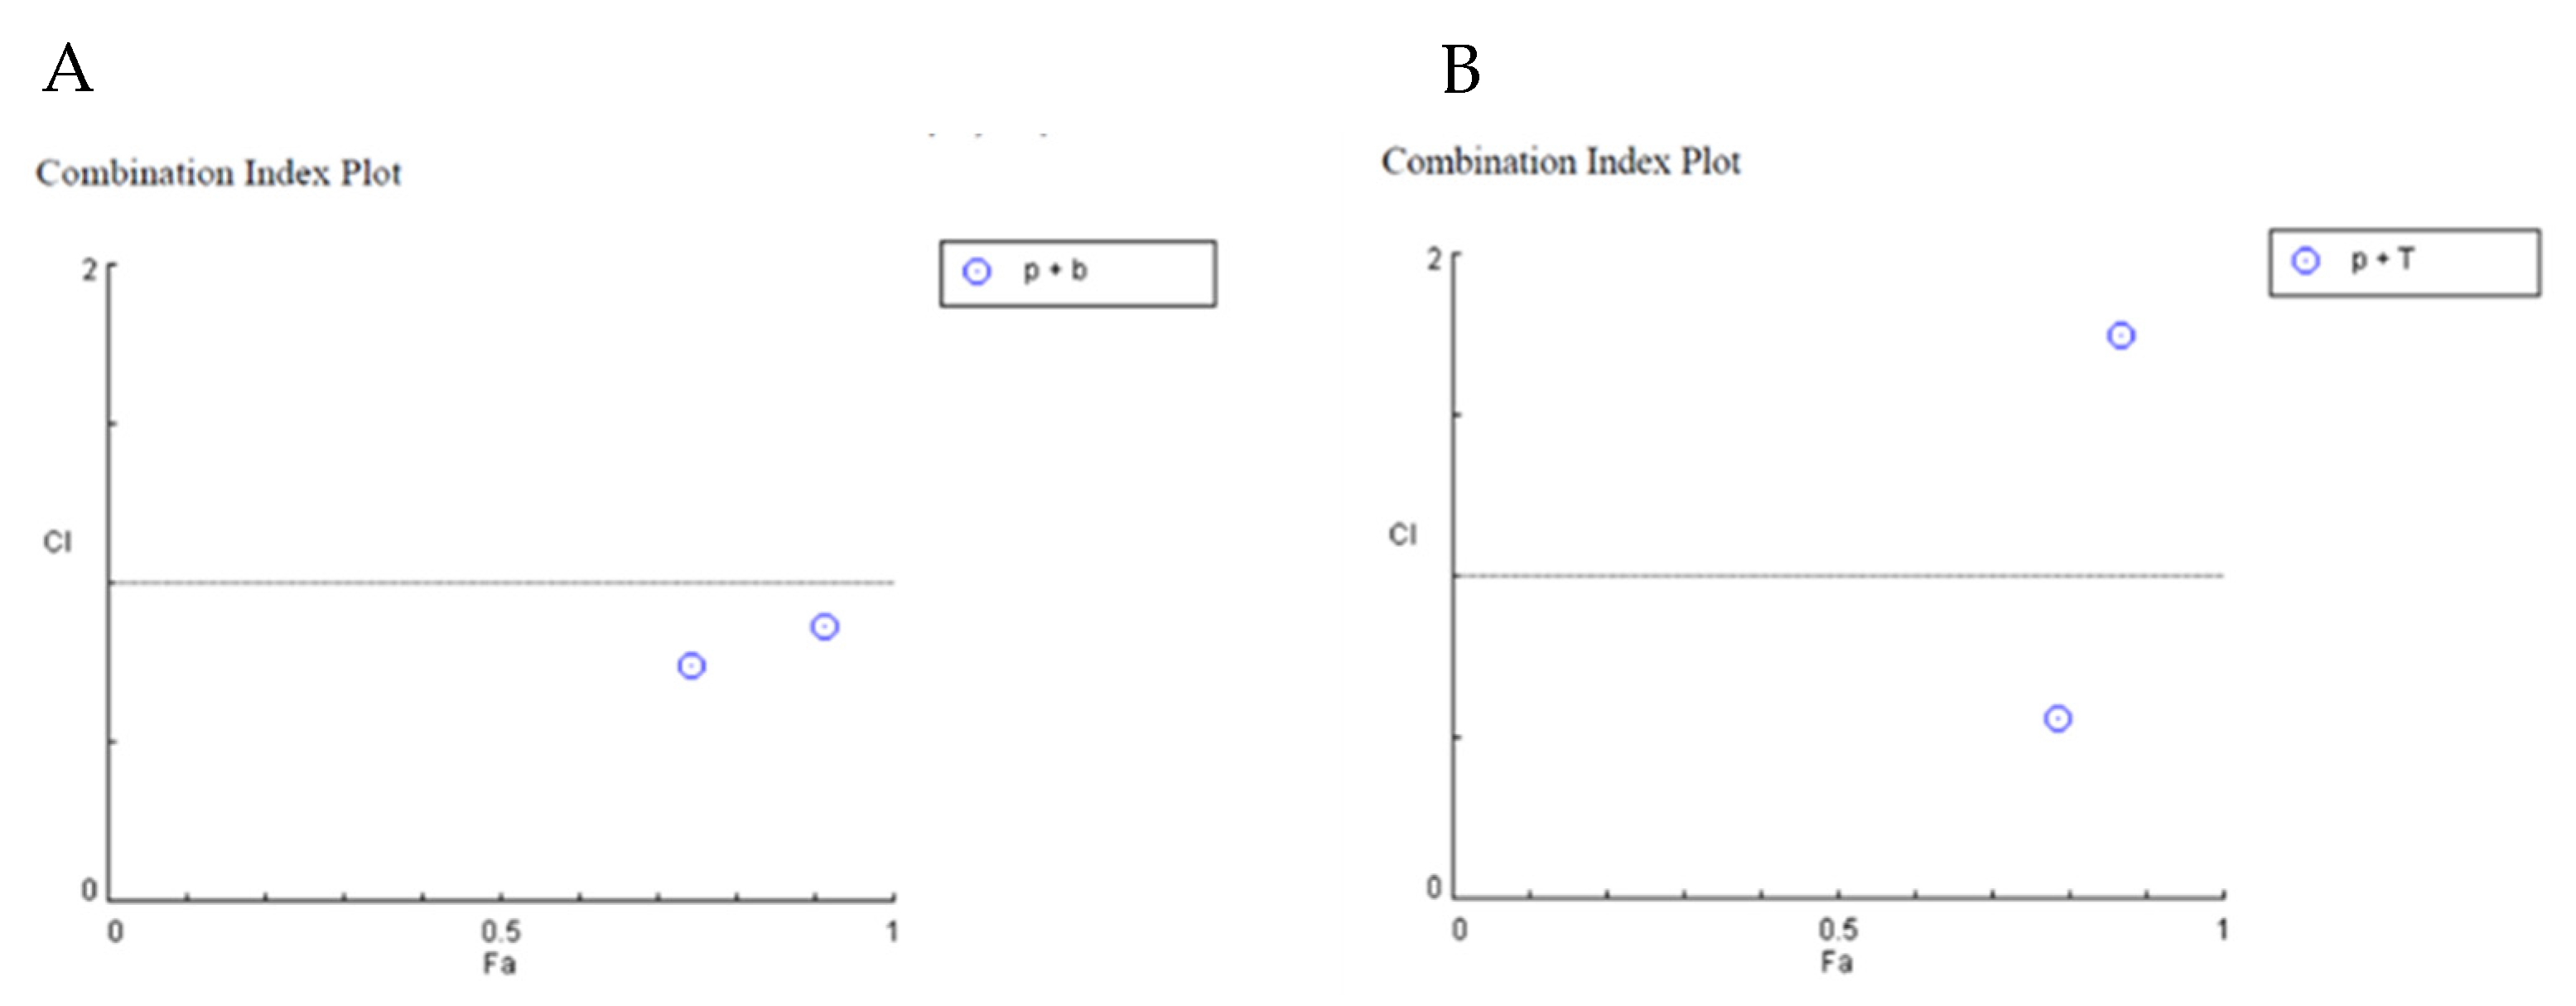
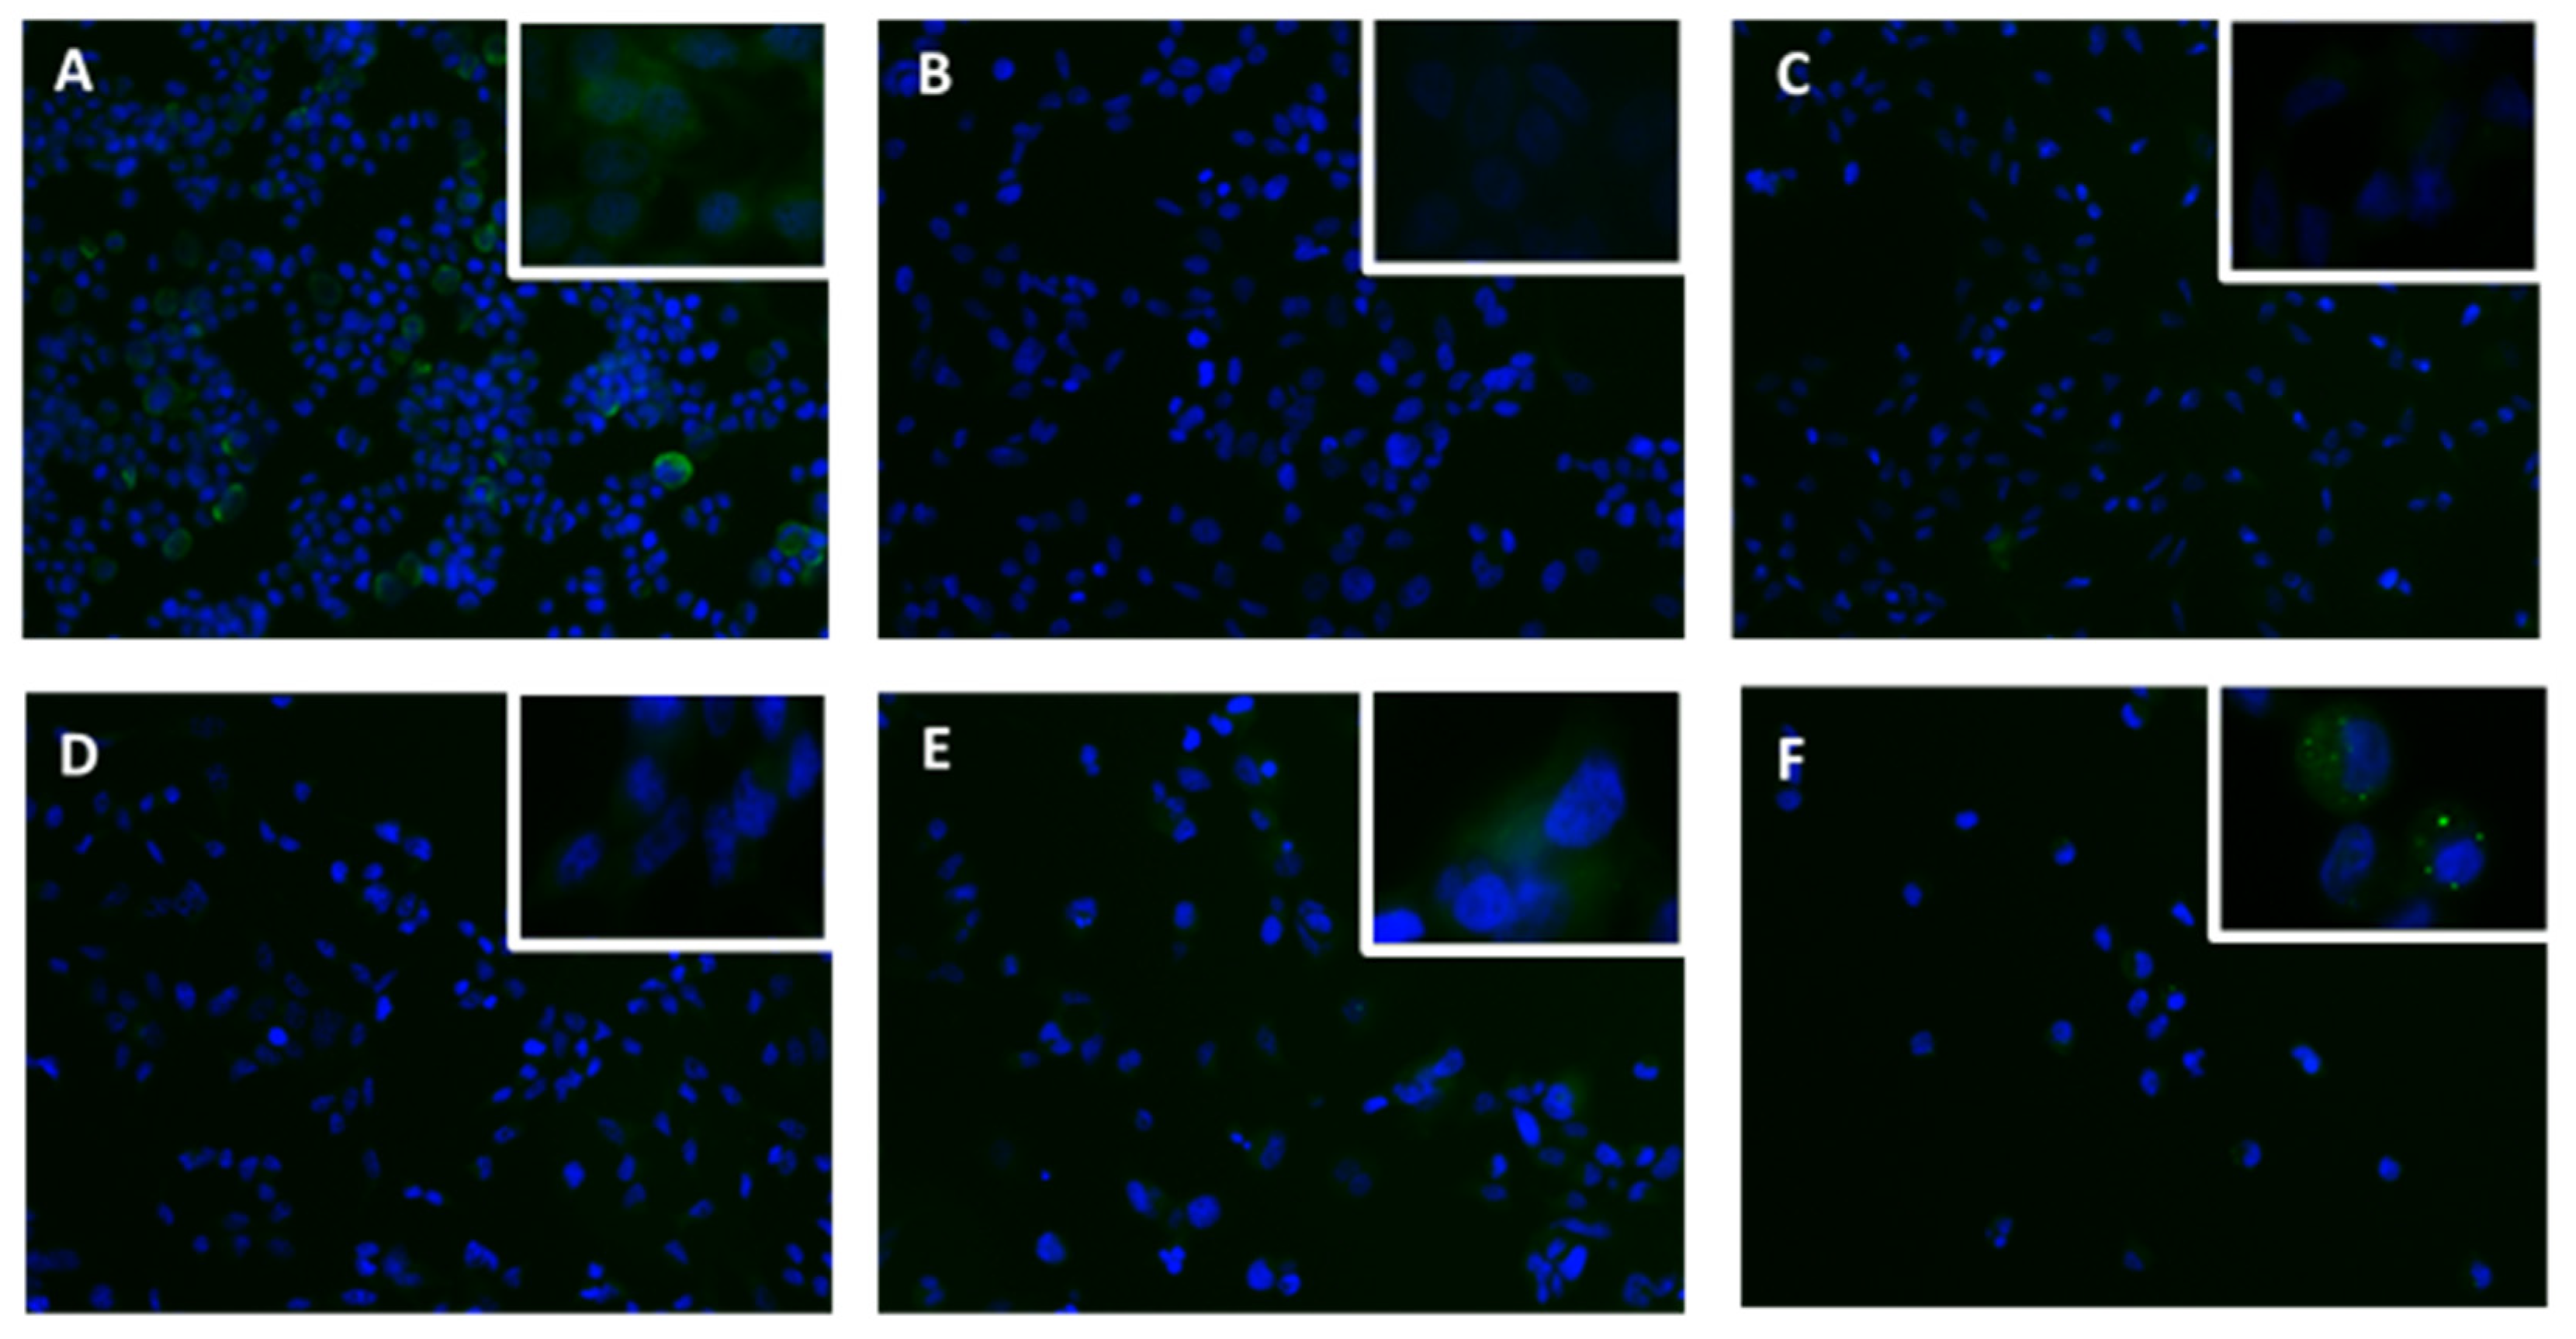
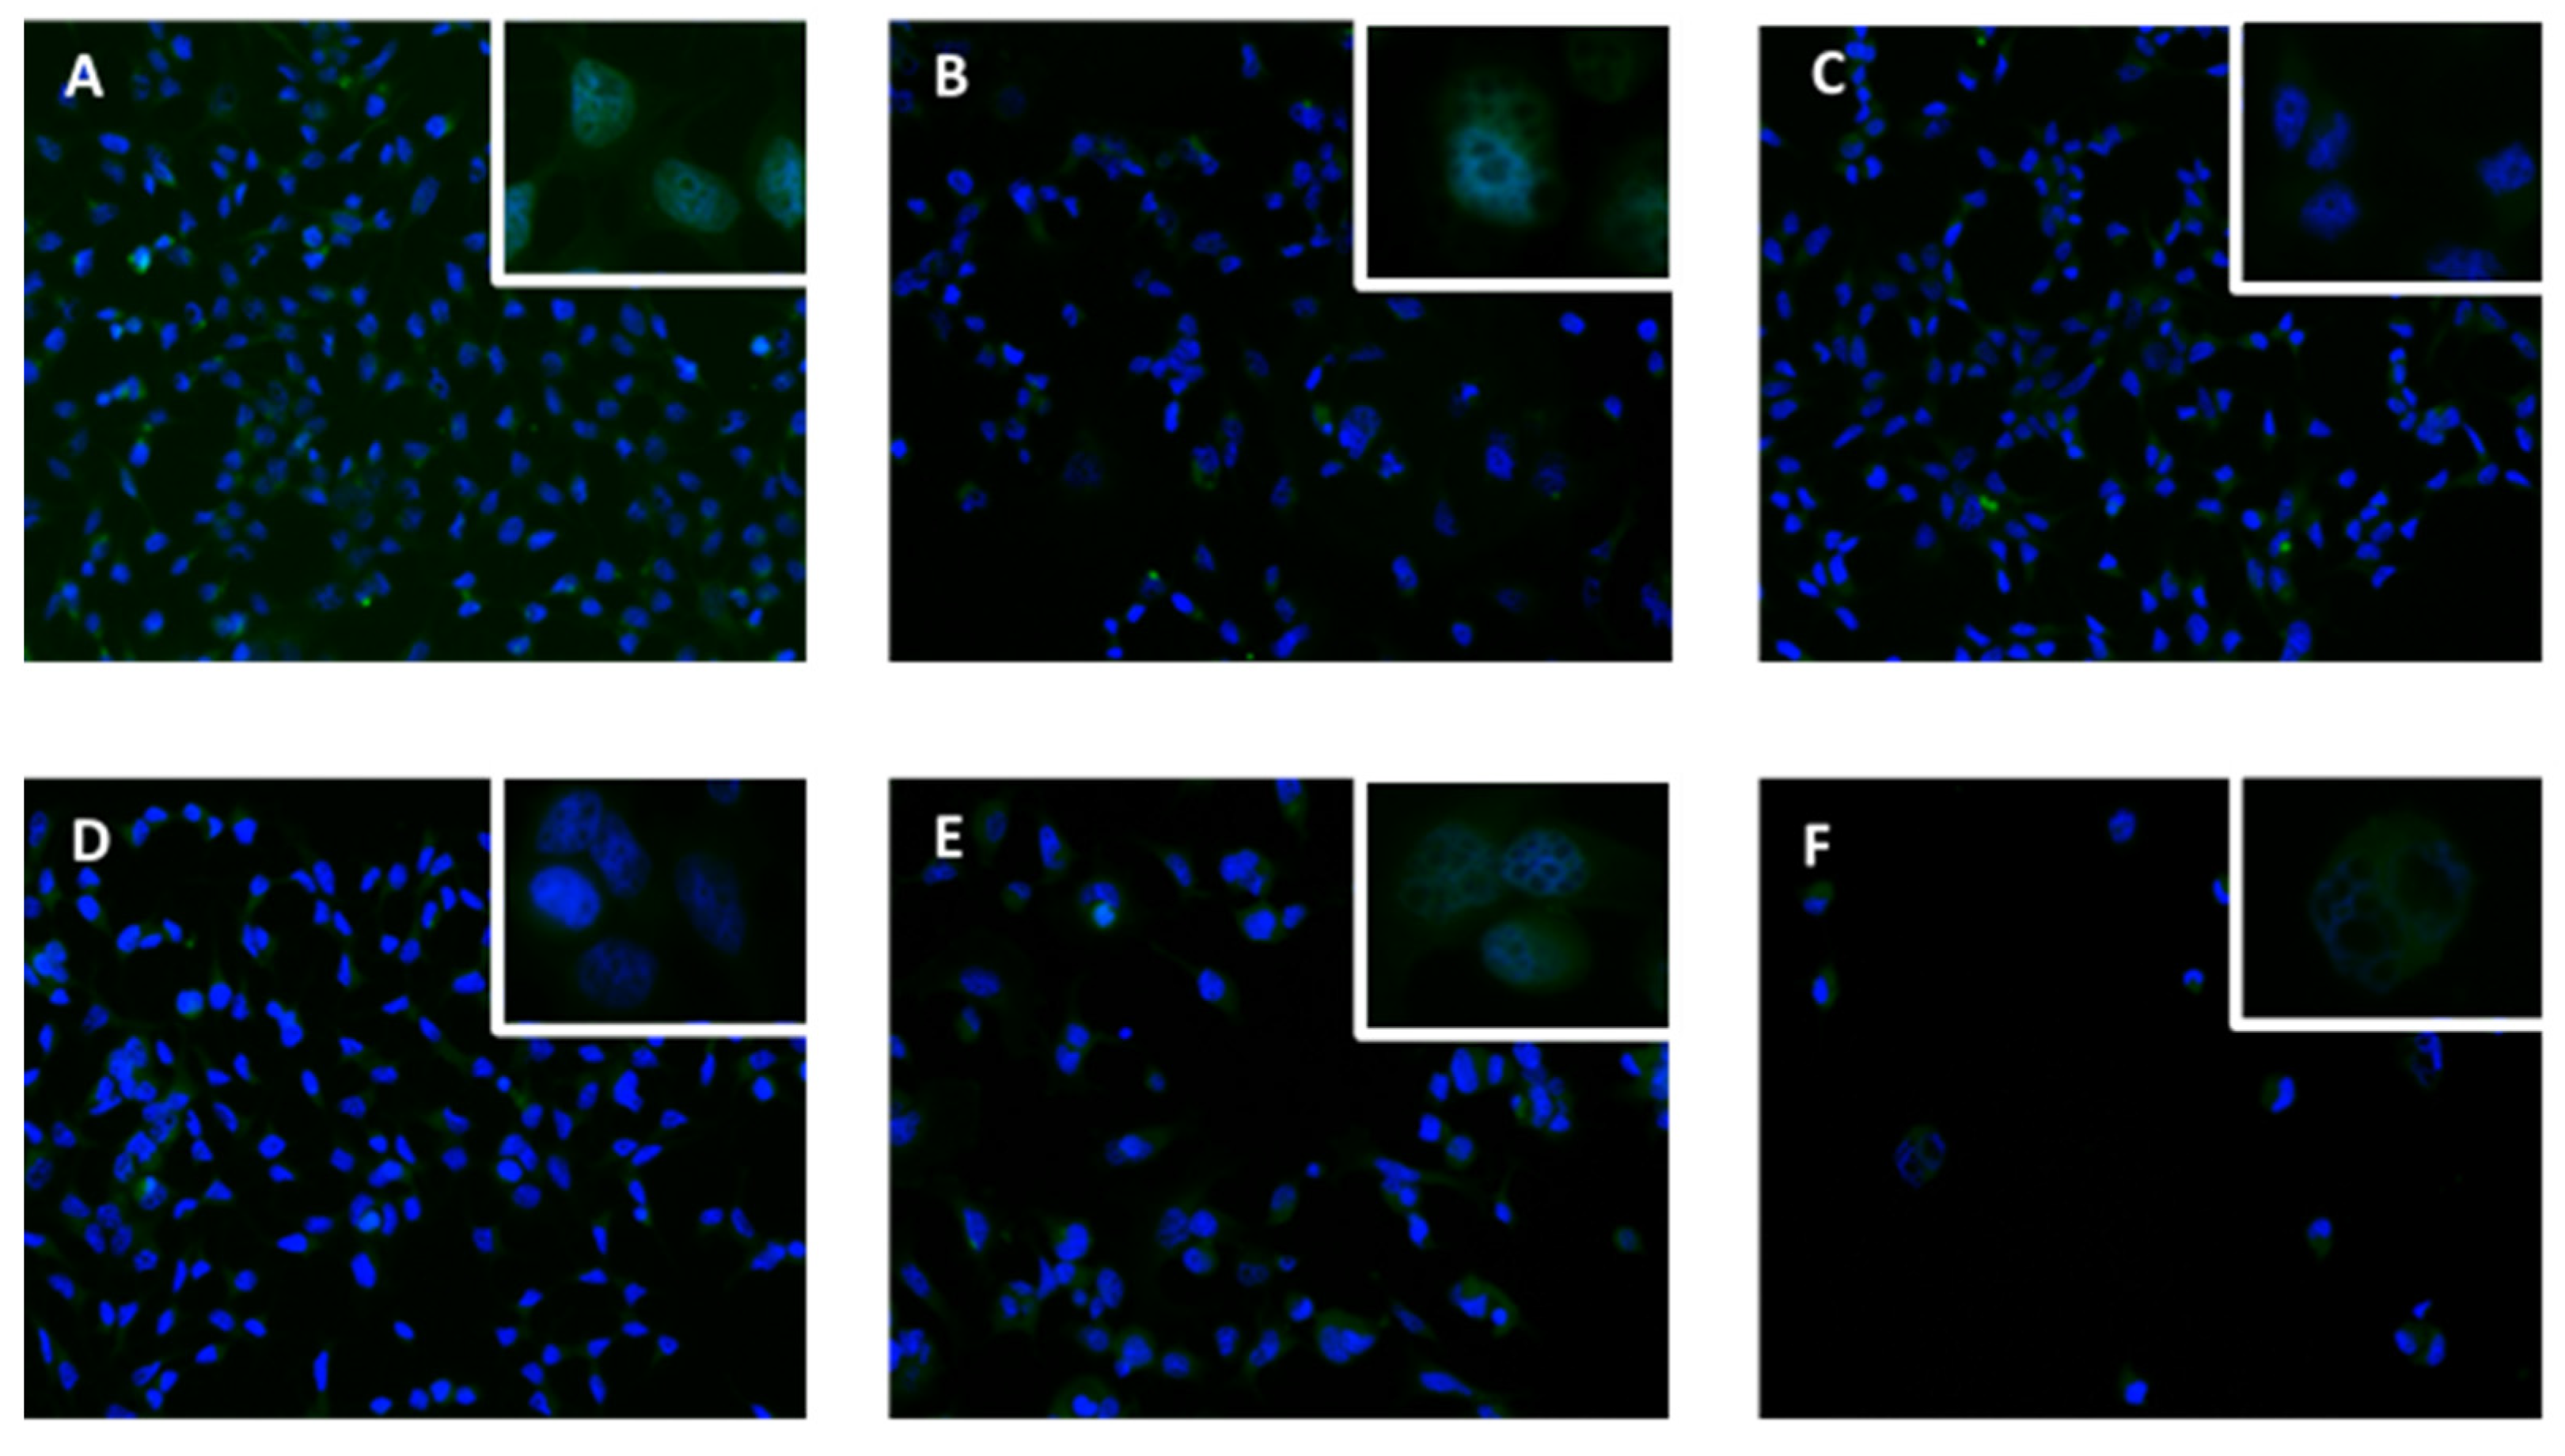
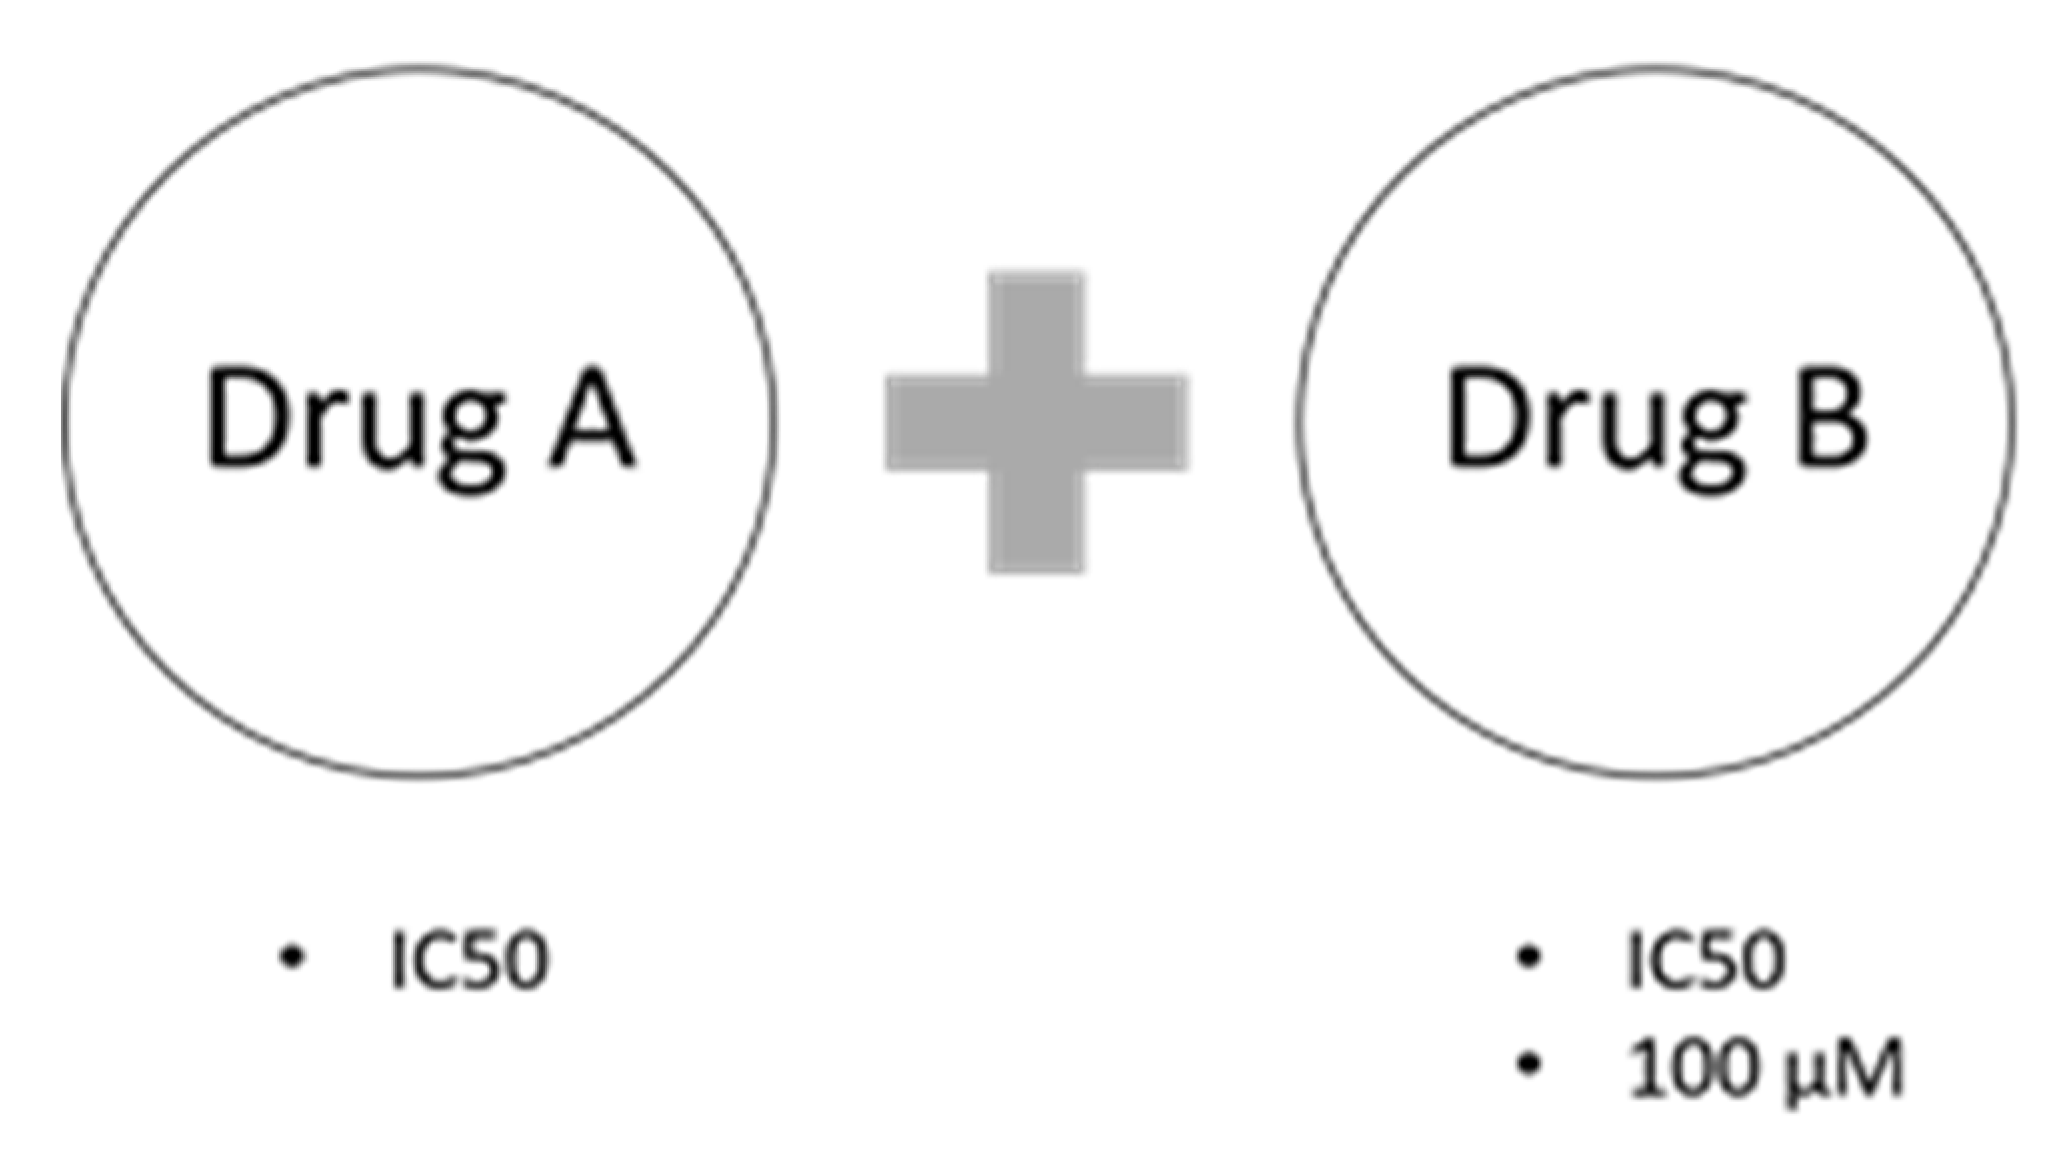
Table 1.
List of drugs selected for repurposing with their main indication and the neurotransmitter receptors of action.
Table 1.
List of drugs selected for repurposing with their main indication and the neurotransmitter receptors of action.
| Drug | Main Indication | Mode of Action (Dopamine Receptor) | Mode of Action (Serotonin Receptor) | References |
|---|---|---|---|---|
| Thioridazine | Schizophrenia | D1 and D2 receptors | [20] | |
| Quetiapine | Schizophrenia | D2 antagonist | 5-HT2 antagonist | [21,22] |
| Selegiline | Parkinson’s disease | An irreversible inhibitor of Monoamine Oxidase B (MAO-B) | [23] | |
| Benztropine | Parkinson’s disease | Dopamine reuptake inhibitor | [24] | |
| Rasagiline | Parkinson’s disease | Selective and irreversible MAO-B inhibitor | [25] | |
| 2-PCPA | Antidepressant | Monoamine oxidase inhibitor | [26] | |
| m-CPBH | Emetic effect | Potent and selective 5-HT3 agonist | [27] |
Table 2.
CI values and respective effect of the combination of paclitaxel with benztropine and thioridazine.
Table 2.
CI values and respective effect of the combination of paclitaxel with benztropine and thioridazine.
| Dose of Paclitaxel | Dose of Benztropine | Dose of Thioridazine | Effect | CI | |
|---|---|---|---|---|---|
| 8.5 nM | 15.84 µM | 0.7434 | 0.73380 | Synergistic (CI < 1) | |
| 8.5 nM | 100 µM | 0.915 | 0.86588 | ||
| 8.5 nM | 6.87 µM | 0.7851 | 0.56480 | ||
| 8.5 nM | 100 µM | 0.8681 | 1.75170 | Antagonistic (CI > 1) |
Publisher’s Note: MDPI stays neutral with regard to jurisdictional claims in published maps and institutional affiliations. |
© 2021 by the authors. Licensee MDPI, Basel, Switzerland. This article is an open access article distributed under the terms and conditions of the Creative Commons Attribution (CC BY) license (https://creativecommons.org/licenses/by/4.0/).
Share and Cite
MDPI and ACS Style
Costa, B.; Matos, R.; Amorim, I.; Gärtner, F.; Vale, N. New Insight into Breast Cancer Cells Involving Drug Combinations for Dopamine and Serotonin Receptors. Appl. Sci. 2021, 11, 6082. https://doi.org/10.3390/app11136082
AMA Style
Costa B, Matos R, Amorim I, Gärtner F, Vale N. New Insight into Breast Cancer Cells Involving Drug Combinations for Dopamine and Serotonin Receptors. Applied Sciences. 2021; 11(13):6082. https://doi.org/10.3390/app11136082
Chicago/Turabian StyleCosta, Bárbara, Rita Matos, Irina Amorim, Fátima Gärtner, and Nuno Vale. 2021. "New Insight into Breast Cancer Cells Involving Drug Combinations for Dopamine and Serotonin Receptors" Applied Sciences 11, no. 13: 6082. https://doi.org/10.3390/app11136082
Note that from the first issue of 2016, this journal uses article numbers instead of page numbers. See further details here.