Article

Extraction of Total Anthocyanins from Sicana odorifera Black Peel Fruits Growing in Paraguay for Food Applications

1
Departamento Bioquímica de Alimentos, Facultad de Ciencias Químicas, Universidad Nacional de Asunción, San Lorenzo 1055, Paraguay
2
Departamento de Fitoquímica, Facultad de Ciencias Químicas, Universidad Nacional de Asunción, San Lorenzo 1055, Paraguay
3
Departamento Ingeniería y Tecnología de Alimentos, Facultad de Ciencias Químicas, Universidad Nacional de Asunción, San Lorenzo 1055, Paraguay
*
Authors to whom correspondence should be addressed.
Appl. Sci. 2021, 11(13), 6026; https://doi.org/10.3390/app11136026
Submission received: 30 May 2021 / Revised: 23 June 2021 / Accepted: 24 June 2021 / Published: 29 June 2021
(This article belongs to the Section Chemical and Molecular Sciences)

Abstract

:

Featured Application

The scope of the work is the hydroalcoholic extraction of total anthocyanins from the S. odorifera peel for their purification and foods applications.

Abstract

Sicana odorifera is a native fruit of South America large in size. Its dark-colored skin constitutes a useful byproduct for obtaining bioactive molecules because it is rich in polyphenolic compounds, such as anthocyanins. Obtaining appropriate extracts for obtaining anthocyanins can be useful for multiple applications in the food industry or for obtaining phytopharmaceuticals. In this work, the fruit and its peel composition were evaluated, an anthocyanin extraction system was designed and optimized, and the extract obtained was characterized. The peel composition of S. odorifera ripe fruits from the black accession growing in Paraguay was rich in polyphenol compounds and anthocyanins. Ultrasound-assisted extractions of total anthocyanins were studied, and the extraction variables were optimized. First, a screening design was considered to analyze time, pH, liquid–solid ratio, solvent concentration, and temperature. From the screening design, the significant variables were considered in a Box–Behnken design, and a response surface methodology was applied. The resulting total anthocyanin extract was characterized by UPLC-DAD-MS / MS-ESI. The most efficient system for the extraction of anthocyanins from the peel was at 15 min, 20 °C, pH = 6, 60% ethanol, and 80 mL/g of liquid–solid ratio. The highest concentration obtained was 61.908 mg C3G/g peel extract. In the extract, 12 main compounds were tentatively identified, including five anthocyanin derivatives, five flavonol derivatives, and two flavonol aglycones. This study provides information for the obtention of an anthocyanin-based dye from black kurugua peel, possibly useful for future applications as a natural colorant in high-added-value foods due to its antioxidant characteristics.

Graphical Abstract

1. Introduction

The black kurugua fruit (Sicana odorifera Naudim Vell.) is considered an exotic fruit with a great flavor and aroma, exuberant and nutritious. The genus Sicana belongs to the botanical family Cucurbitaceae, spread throughout Central and South America. Among the species occurring in Paraguay is S. odorifera. The epicarp is rigid, and the color of the peel varies between different accessions, changing from orange-red, maroon, or dark purple to entirely jet black. The pulp is soft with numerous oval and flat seeds [1].
The consumption of native fruits such as kurugua by Paraguayan populations, as in other countries of South America, dates from the pre-Columbian era. The native population used the whole fruit or its parts for various purposes. Its pulp is used to make juices and desserts, while the seeds are employed empirically to treat liver diseases. Encouraging its use has been recognized as a strategy to promote its crop and to increase food security. The risk of slowly being lost as a traditional crop led to individual efforts toward the sustainable production of kurugua to keep this crop close to home with a minimum cost of production for self-consumption or nearby markets. The most produced and marketed variety is the atropurpurea (the dark one). The volume of harvest for each plant depends on various factors, such as the type of vine used, soil quality, sowing time, variety and quality of the seed, and the soil conditions of the place. In the black-shelled atropurpurea variety, the maximum production is 67 fruits/plant, with fruits of 2.5 kg/fruit in 1-year-old crops, for a single harvest with a reticulation system (wood and bamboo), loose soil rich in minerals, pH 6–7, and semiurban area. When the crop is developed by treetops and branches, the production volume can reach 112 fruits of equal weight in the same soil conditions. The fruits harvested without the required care tend to be lost due to out-of-time harvest and the long distance from markets, despite the competitive ease of preservation compared to other fruits. In dry places and good postharvest conditions, they can be preserved for up to 3 months. Although kurugua is not yet widely cultivated, its exotic aroma and color makes it promising for the food industry as a raw material for flavor and colorant producers [2,3]. The potential of the fruit peel of S. odorifera, a waste material, has also been highlighted as a novel source of antioxidant compounds such as flavonols and anthocyanins [4].
In Paraguay, the red and black varieties are traditionally cultivated in Curuguaty town, which in the guaraní language means “kurugua’s crop”. The lack of market development and the absence of deep knowledge on the cultivation of kurugua are influencing factors for crop expansion. Despite these limitations, it is estimated that the extension of its cultivation is around 50 hectares in Eastern Paraguay. In addition, local organizations are increasing efforts to promote its extensive cultivation seeking market assurance, the dissemination of crop care, and an increase in the investment in infrastructure for industrial processing. Studies on the red variety are more frequent than the black one. Most of the information available addresses the pulp, whereas some studies highlight the potential of the peel as a nutraceutical food and/or as a phytochemical source [5]. In fruits of the same genus Sicana from Amazonian forests, high pulp yields were reported, which were a good source of carbohydrates, vitamin A, and minerals such as zinc, Cu, Fe, and Mo [1].
In the compound profile responsible for the pulp flavor, 94.8% of total extract was identified as free volatiles in pulp extract. Aliphatic alcohols (61.1%) were the predominant compounds, and the free volatile profile was different from that reported for its close relative from the Cucurbitaceae family, the melon (Cucumis melo), suggesting the aroma spectrum of kurugua may be unique [6]. In the pulp of the red variety, the monosaccharide composition of crude polysaccharide fractions was described. The aqueous fractions were constituted by pectin, having mainly galactans as side chains; the citric acid fraction mainly had galactose; and the hemicellulosic fractions may be constituted by xyloglucans, xylans, and mannans [4]. When the fruits are processed fresh for seasonal consumption, the peel and seeds are important byproducts, and their antioxidant potential seems to be contributed by phenolic compounds [7]. Triterpenes, such as karounidiol dibenzoate and Cucurbita-5,23-diene-3h,25-diol; flavones; taxifolin; and quercetin were isolated from the seeds [8], while several anthocyanins, such as cyanidin, peonidin, and pelargonidin glycosides, and quercetin and kaempferol glycosides were reported in the epicarp of this fruit [2,5]. Low in vitro antioxidant activity has been reported for pulp extracts of Colombian varieties of red peel S. odorifera relative to other fruits [7]. On the other hand, the flavonoids described in the seeds and epicarp are known for their high antioxidant activity and could be useful for novel food product development [2,5,8].
Recently, fruits and vegetables have been studied as sources of antioxidants due to the growing interest in natural additives for food application [9,10,11,12]. In addition, most of them also present applications as a dye for the food industry, being an interesting source as a natural supplement. Among the most commonly employed extraction procedures, ultrasound-assisted extraction (UAE) is one of the most studied [9,13], and it is considered to be one of the most efficient for the extraction of the compound of interest [14]. Power ultrasound has also been proposed for many other applications in chemical and food manufacturing processes [15], alone or in combination with other technologies: for example, for biomass pretreatment [16].
The extraction process has many variables that could influence the efficiency of the process. Consequently, an appropriate design of experiments is essential to determine the best operational conditions. In this sense, some designs aim to find some significant factors from many potential ones. One of them is the screening design. Usually, after some factors are discarded, the significant ones are analyzed again either to find the best operational conditions or even the optimal ones. For this application, designs such as the Box–Behnken are proposed. This allows the development of a response surface that might help to find the optimal operational condition [17]. Box–Behnken allows running fewer experiments than others, such as central composite design, which results in a less expensive optimization methodology. Furthermore, the method for response monitoring should be carefully selected to complement an adequate design and to accomplish the optimization. In this sense, spectrophotometric methods have been successfully employed for this purpose due to their speed and reliability [18,19,20].
Despite the popular use of this fruit as a repellent, perfume for clothing, or fresh food or the infusion of its seeds for therapeutic purposes, there is not much scientific knowledge about the use of inedible parts such as the peel. Recent studies on the composition of S. odorifera epicarp showed that the hydroalcoholic extract has a high antimicrobial, antioxidant, antibacterial, and antifungal activity and a high concentration of anthocyanins and other phenolic compounds, organic acids, and tocopherols [5]. These reports contribute to the reduction of the knowledge gap for its integral use. This work’s aim is to provide data on the extraction of a group of bioactive molecules of high added value with potential applications in the food and pharmaceutical industry, as new ingredients in functional foods to replace critical ingredients such as artificial colors, or in pharmaceutical preparations in the prevention or treatment of diseases as alternative therapies.
In this work, the physicochemical characteristics and the composition of the peel of the ripe fruits of S. odorifera. black accession grown in Paraguay were described. The aim was to optimize the conditions for obtaining an epicarp ethanolic extract, with multiple potential applications as a functional food ingredient to add value to a native resource and promote its integral sustainable use. A screening design was proposed to determine the main variables involved in the ultrasound-assisted extraction of total monomeric anthocyanins. The Box–Behnken design and the response surface methodology were applied to optimize the process.

2. Materials and Methods

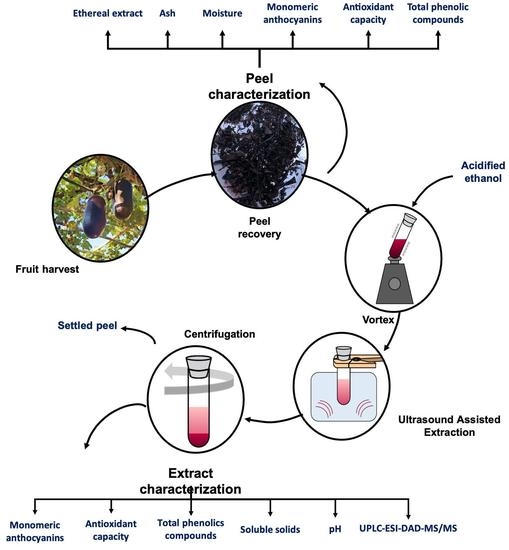
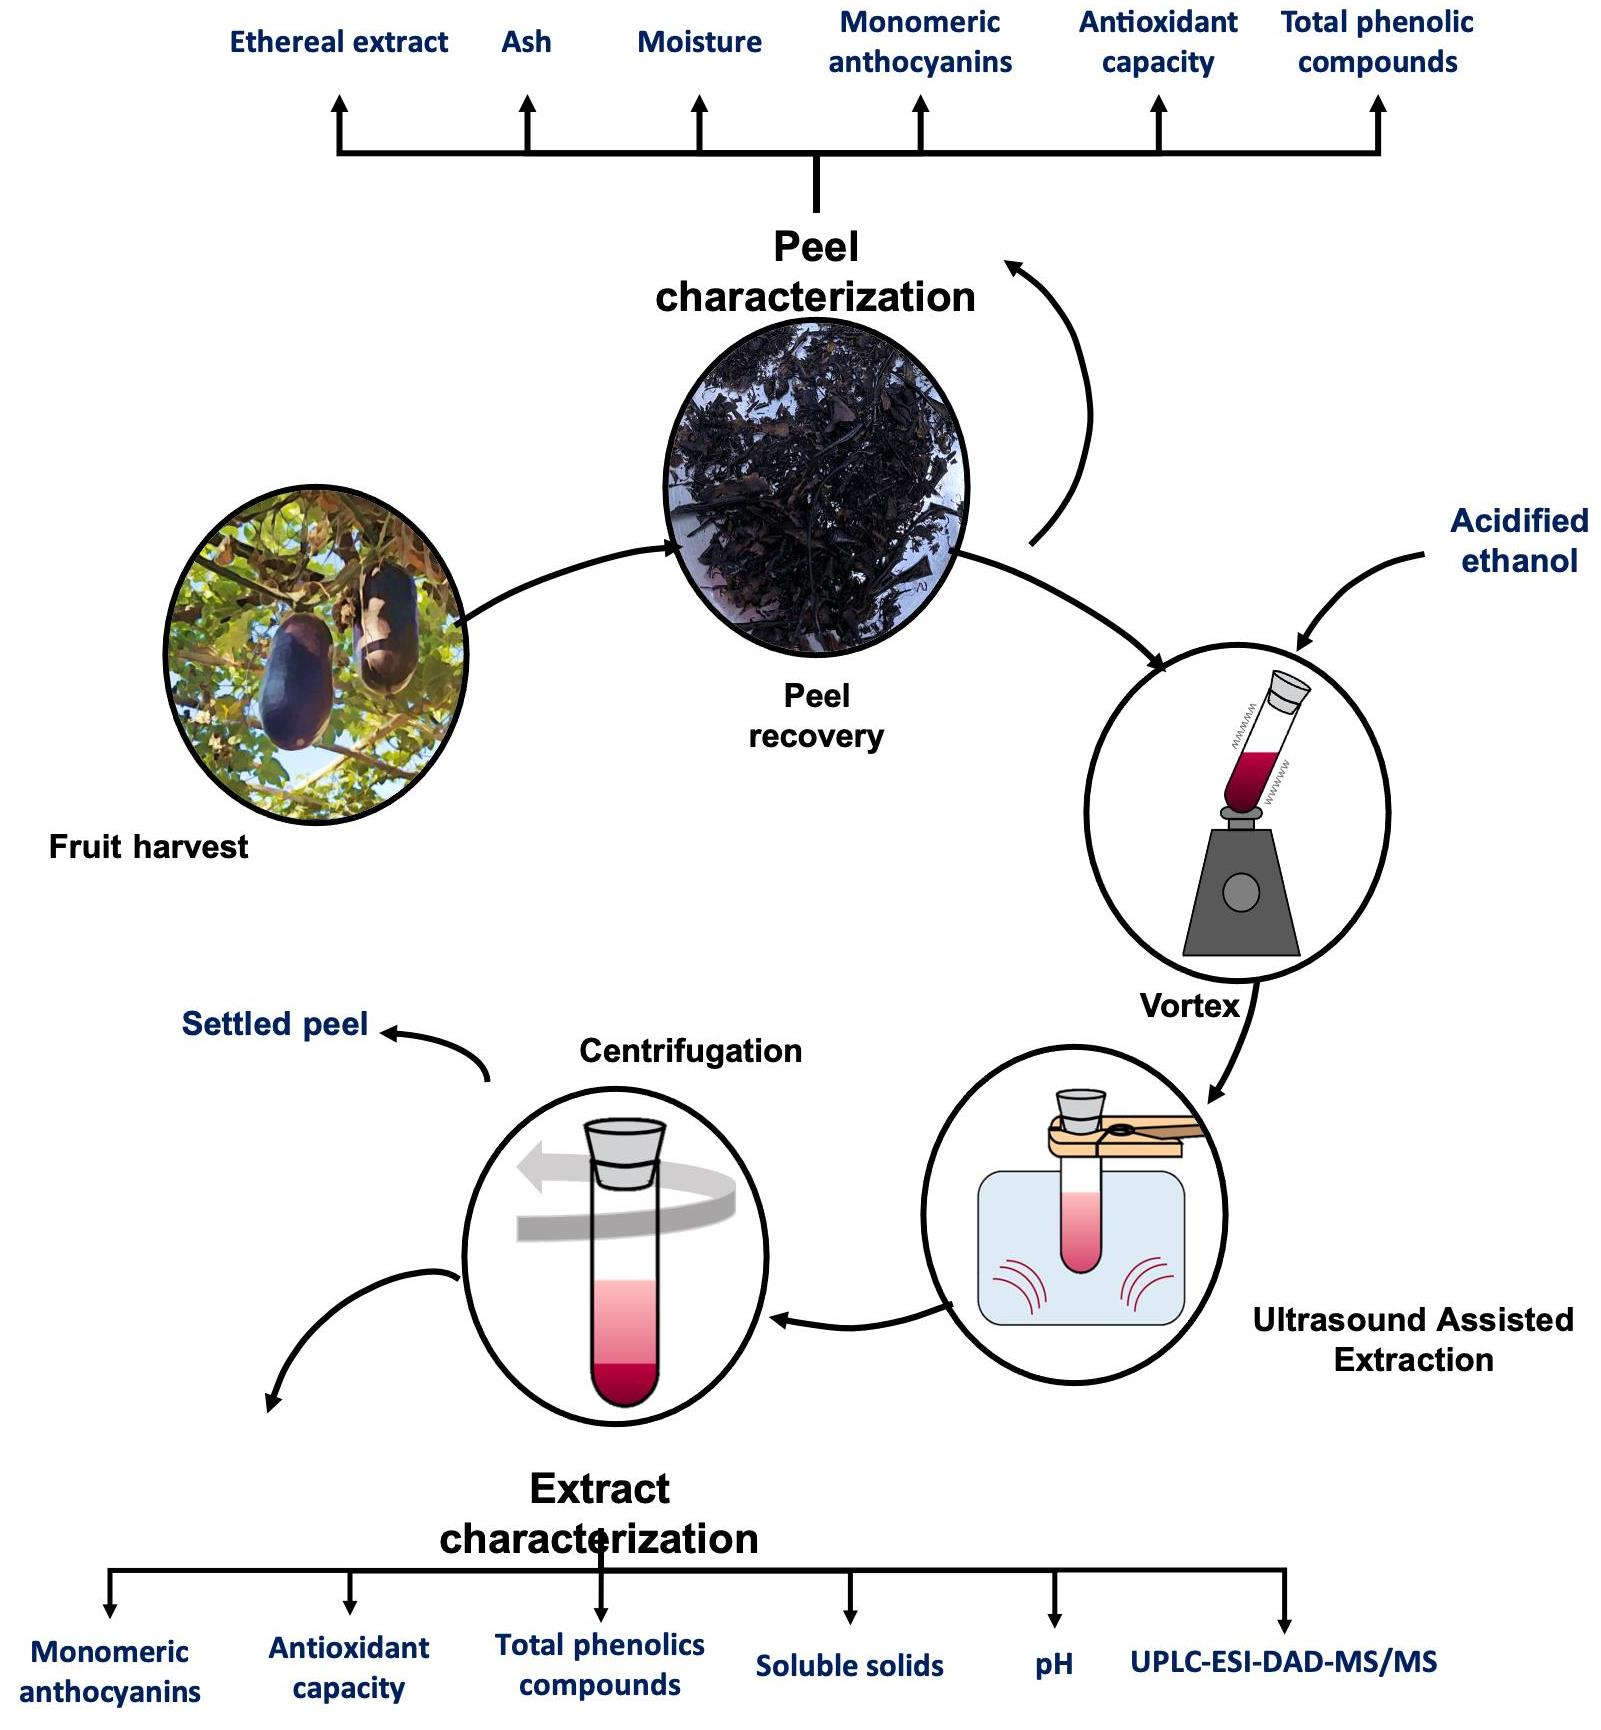
2.1. Collection and Samples Preparation

The S. odorifera ripe fruits were collected by random sampling in August 2018 from a seedbed orchard “Kurugua Poty” Foundations, San Lorenzo, Paraguay (GPS:−25.3266340 N,−57.4832020 E), which ensured the traceability of the variety analyzed. During the sampling, an herbarium material was taken for botanical identification deposited in Registry N° in the Index Herbarium of Facultad de Ciencias Químicas, UNA. After the fruits were collected, they were transported refrigerated from the site to the laboratory, where the seeds from some fruits were immediately carefully separated from the pulp, and both were lyophilized.
A random subsample was made, a part of the whole fruits was stored at −80 °C for later analysis, and antioxidants parameters analysis was carried out on fresh samples. The peel, a black thin layer (exocarp), was separated with a potato peeler from the inedible portion (mesocarp). The pulp and peel were homogenized using a BOSCH electric multiprocessor. The other determinations were performed with the lyophilized peel. The centesimal composition was determined in the edible fraction (pulp) of ripe fruit.

2.2. Morphological and Physicochemical Characteristics of Pulp

Morphological studies were performed on the ripe fruits without previous treatment, as previously described [21]. The pH, titratable acidity, and soluble solids were measured according to AOAC Methods [22]. A potentiometer (Accurate pH 900, Horiba, Kyoto, Japan) at 25 °C was employed. An analytical balance (AYD HR 120, Bradford, UK) was used for weight determinations and all measurements were in triplicate. All the reagents used were analytical grade.

2.3. Composition Analysis on Kurugua’s Pulp, Peel, and Extracts

AOAC methodologies were carried out for centesimal composition purposes [22]. All determinations were performed in triplicate. The total vitamin C content was determined using the spectrofluorometric method 967.22 of AOAC, with an external L-ascorbic acid calibration curve (2.5–20 μg/mL).
Total phenolic compounds (TPC), monomeric anthocyanins, and total antioxidant activity in vitro were evaluated in pulp and peel.
The spectrophotometric method of differential pH of anthocyanins, based on the color loss of the monomeric anthocyanins at pH 4.5 and presence of color at pH 1, measuring at 510 and 700 nm, was carried out [19,23,24]. The final concentration of anthocyanins (mg/100 g) was calculated based on the extract volume and sample fresh weight expressed as cyanidin-3-O-glucoside (C3G) (MW: 449.2 and ε: 26,900).
Total phenolic compounds (TPC) were determined by the Folin–Ciocalteau [25], using a gallic acid calibration curve (0–120 μg/mL aqueous solution). For the extraction, 2 g of lyophilized pulp with methanol:water (60:40) was performed in an ultrasonic bath (15 min) followed by centrifugation (15 min, 10,000 rpm, 4 °C) and filtration. A second extraction was carried out with acetone:water (70:30) following the parameters of the first one. Both extracts were mixed in a tube, and the mixture was stirred and kept for 30 min at room temperature in the dark. The absorbance was plotted at 765 nm in the UV-1800 spectrophotometer (Shimadzu, Kyoto, Japan). The results were expressed as mg of gallic acid equivalents (GAE) per 100 g of pulp (mg of GAE/100 g).

2.4. Antioxidant Activity

The TEAC assay was carried out with the cation ABTS+• stock solution (7 mM), which was used as an indicator of the sample extract antioxidant activity [26]. Ammonium persulphate (NH4)2S2O8 was the oxidant agent for ABTS+• cation preparation. Then, ABTS+• working solution was obtained by diluting the stock solution in ethanol to give an absorption of 0.70 ± 0.02 at λ = 734 nm. For measurements, a calibration curve with Trolox (0–500 μM aqueous solution) was registered at 730 nm. The results were expressed as micromoles of Trolox equivalents (TEAC) per gram of pulp fresh weight.

2.5. Efficiency of Anthocyanins Extraction from Peels

2.5.1. Effect of the Ultrasound-Assisted Extraction Process Variables

Anthocyanin recovery from the peel was performed in an alcoholic dissolution by ultrasound-assisted extraction. Firstly, the independent variables studied were solvent concentration, pH, temperature, time, and the liquid–solid ratio. A screening design was chosen to evaluate the influence of these variables on the total monomeric anthocyanin concentration as the response variable.
Anhydrous ethanol was diluted with distilled water to prepare solvents for extraction. To regulate the pH of the solvent, 1% citric acid and 0.01 N sodium hydroxide were used [27,28,29]. The extraction was carried out in a heated ultrasonic cleaning bath (Ultrasons-HD, JP Selecta-40 kHz). The temperature was maintained constant throughout the experiment; for this, ice cubes were added to the ultrasound bath.
Once the extraction was complete, the phases were separated in a refrigerated centrifuge (Neofuge 15R, Heal Force) at 5000 rpm, maintained at 5 °C for 10 min. Table 1 shows the independent variables evaluated in this work and the studied levels.

2.5.2. Characterization of the Anthocyanin Extract

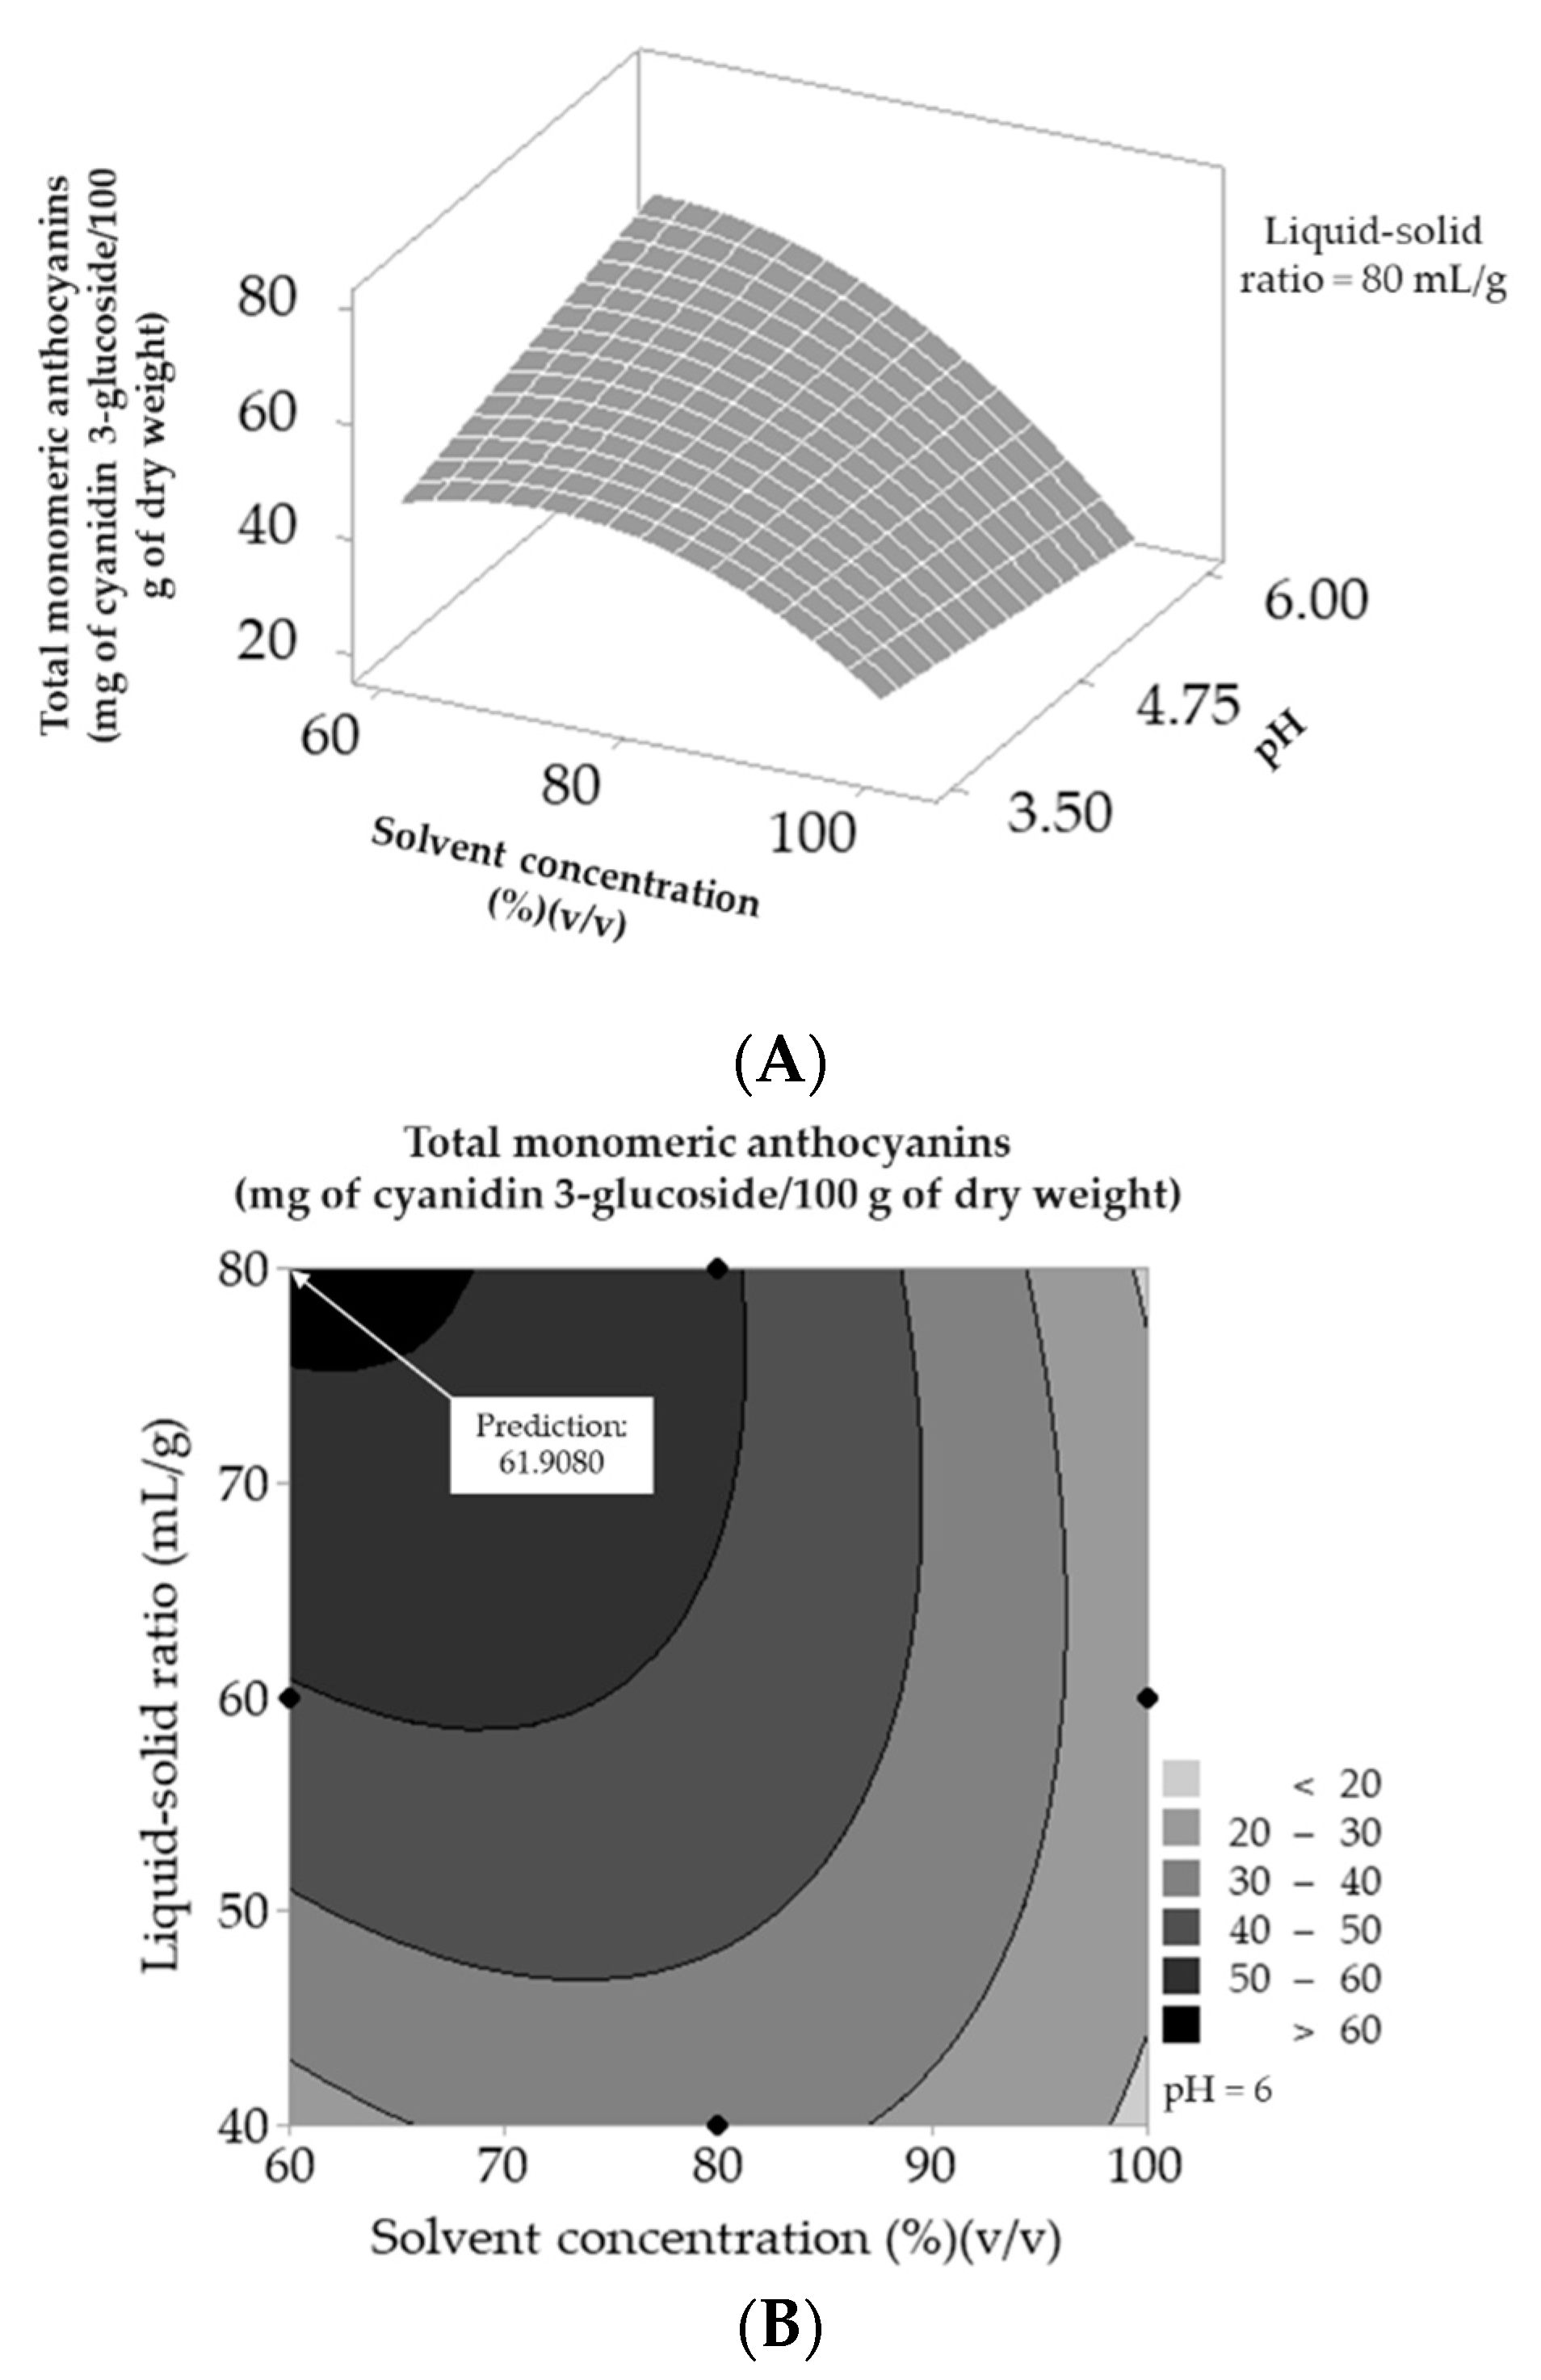
Based on the response of the optimizer and seeking to maximize the concentration of total monomeric anthocyanins, an ultrasound-assisted extraction was carried out with 60% ethanol as a solvent with pH adjusted to 6 and a ratio of 80 mL of solvent per gram of dried peels, at 20 °C for 15 min. These conditions were determined to be better according to the analysis of the response surface methodology. Once the extraction was complete, the phases were separated in a refrigerated centrifuge Heal Force (Shanghai, China) at 5000 rpm at 5 °C for 10 min. The residue was extracted two more times under identical conditions.
The pH and total soluble solids were measured according to the AOAC Methods. A pHmeter Accurate pH 900, Horiba, (Kyoto, Japan) and a digital refractometer ATAGO Pocket (Tokyo, Japan) were employed. The antioxidant activity was measured by the TEAC assay previously described [26]. The total phenolic content was determined by the Folin–Ciocalteau method described by [38], and the total monomeric concentration was determined by the differential pH method described by [39] using the UV-1800 spectrophotometer (Shimadzu, Kyoto, Japan). The total monomeric anthocyanins were expressed as mg of Cyanidin 3 glicósido (C3G) per 100 g dry weight (DW) of the dry epicarp or lyophilized peel. All measurements were carried out by triplicates.

2.6. UPLC-ESI-MS/MS Profiling of the Peel Fruits Extract from S. odorifera Naudim Vell. “kurugua”: UPLC-ESI-DAD-MS/MS Peel Extract Analyses

The analyses were carried out through a Waters (Milford, CT, USA) Acquity UPLC system coupled with an Acquity PDA eλ detector and a Xevo TQD QqQ-MS mass spectrometer with an electrospray ionization (ESI) source. Chromatographic separations were performed with a Phenomenex KINETEX core-shell EVO-C18 (2.1 × 100 mm, 1.7 μm) column at a flow rate of 0.3 mL/min. The column temperature was maintained at 40 °C, and the injection volume was 10 µL. The mobile phase was MeOH (phase A) and water (phase B), both containing 0.1% formic acid and 10 mM ammonium formate, with a gradient elution as follows: 0–0.7 min, 80–80% A; 0.7–3.2 min, 80–60% A; 3.2–7.6 min, 60–20% A; 7.6–8.3 min, 20–0% A; 8.3–10.4 min, 0–80% A, 10.4–12 min, 80–80% A. The extracts at 5 mg/mL were filtered through 0.22 µm nylon syringe filters for injection. The compounds were monitored at 280, 320, and 500 nm. Spectra from 200 to 500 nm were recorded for peak characterization. The MS spectra were acquired using MS scan mode (m/z 80–800) in negative and positive polarities. The mass of the major compounds was submitted to MS/MS analysis through daughter ion mode (scan time 0.1 s) for fragmentation data collection. The collision gas was argon. Nitrogen was employed as a nebulizer and drying gas. The MS conditions were as follows: electrospray capillary voltage was 2.5 kV, source temperature was 150 °C, desolvation temperature was 350 °C, cone gas flow was 80 L/h, and desolvation gas flow was 900 L/h. The cone voltage was set at 30 V, while the collision energy (CE) was 25 V for flavonoid derivatives and 30 V for aglycones. The system was controlled using Waters Masslynx V4.1 software.

2.7. Statistical Analysis

The statistical analysis for the samples was performed by analysis of variance (ANOVA) considering the value p 0.01 as statistically significant. Minitab 19 statistical software was used to create the final screening design and its analysis, while the Box–Behnken design, response surfaces, and contour graphs were developed using Design Expert 11 statistical software.

3. Results

3.1. Morphological and Physicochemical Characters of Ripe S. odorifera Peel

The samples of black S. odorifera fruits from Paraguay had an oblong shape; the ripe shell is deep black with a smooth texture, and the mesocarp is hard (Figure 1).
The physicochemical characteristics of the kurugua pulp and peel extract were determined. The results of the measurements are shown in Table 2. The peel, about 0.01 to 0.02 cm, showed low moisture compared to the pulp. The lipid content and TPC were significantly higher in peel than in the pulp.

3.2. Efficiency of Anthocyanins Extraction from Peels

3.2.1. Effect of the Ultrasound-Assisted Extraction Process Variables

The screening design considered in this work is shown in Table 3. Each condition was performed randomly by duplicate to minimize the influence of external factors. This design determines the variables with the greatest influence on the total monomeric anthocyanin extraction. Table 4 also details the results obtained in the experimental runs. The total monomeric anthocyanins were expressed as mg C3G on 100 g dry weight (DW) of the dry epicarp or lyophilized peel, which were among 5.843 and 45.785 mg C3G/100 g DW.
The results were processed using Minitab 19 statistical software. By analyzing the full quadratic screening design, which presented a model fit of R 2 = 92.25 % and a R a j 2 = 86.17 % , the resulting significant variables were liquid–solid ratio and its quadratic interaction, solvent concentration, and pH, as can be seen in Figure 2A. It is worth mentioning that the model is significant and the lack of fit not significant for the confidence interval considered in this work (99%), as shown in Table S1 of the Supplementary Material.
The behavior of the model variables is shown in Figure 2B, where the solvent concentration and the L–S ratio have a positive and quadratic effect. The pH displayed a negative quadratic behavior. Increasing the pH raises the concentration of monomeric anthocyanins only up to a pH close to 5, and then increasing the pH leads to a decrease in concentration. Time, a clearly nonsignificant factor, has a somewhat quadratic behavior, with a minimum point at the 10 min level. Finally, temperature showed a negative linear behavior. The concentration of total monomeric anthocyanins is favored at low extraction temperatures.
The main effects plot allowed the selection of new study intervals for the significant variables. These were a solvent concentration of 60 to 100%, pH of 3.5 to 6, L–S ratio of 40 to 80 mL/g, and, as constants, a time of 15 min extraction at 20 °C.

3.2.2. Development of the Response Surface Methodology

From the results obtained in Section 3.2.1, a Box–Behnken experimental design was applied to develop the response surface of the total monomeric anthocyanin concentration. In this design, the independent variables were the significant variables resulting from the analysis of the screening design: solvent concentration, pH, and liquid–solid ratio. Levels of the independent variables are given in Table 4 and were chosen based on the behavior of the significant variables in the screening design (Figure 2B).
A second-order polynomial equation was used to express the response surface:
Y = β 0 + i = 1 k β i x i + i = 1 k β i i x i 2 + i = 1   < j = 1   β i j x i x j + ε
where Y represents the total monomeric anthocyanin concentration of the kurugua peel extracts; x k are the independent variables; k is the number of independent variables; β 0 ,   β i ,   β i i , and β i j are the regression coefficients for intercept, linear, quadratic, and the interaction terms, respectively; and ε is the error [17].
Table 5 details the conditions and results obtained by the Box–Behnken design; the content of total monomeric anthocyanins was found to range from 18.929 to 56.019 mg C3G/100 g DW. The maximum content obtained was obtained under the following conditions: 60% ethanol concentration, pH 4.75, and the liquid–solid ratio of 80 mL/g.
The Pareto chart (Figure 3) and the ANOVA of this design (shown in Table S2 of the Supplementary Material) showed that the L–S ratio is the variable with the greatest significance on the extraction process, followed by the quadratic influence of the concentration and the interaction of the concentration. The model presented a coefficient of determination R 2 = 91.65 % of the variance in the anthocyanin concentration and R 2 = 83.29 % , which indicates that the model adequately fits the data obtained.
Equation (2) expresses the regression of the model for the concentration of total monomeric anthocyanins (TMA) expressed in mg C3G/100 g DW. This equation predicts the TMA concentration and allows the response surface to be obtained, as shown in Figure 4.
T M A = 394.883 + 6.646 S o l v e n t   c o n c e n t r a t i o n + 22.475 p H + 3.866 L S   r a t i o 0.262            S o l v e n t   c o n c e n t r a t i o n p H 0.022 S o l v e n t   c o n c e n t r a t i o n L S   r a t i o 0.027                 S o l v e n t   c o n c e n t r a t i o n 2 0.014 L S   r a t i o 2
Figure 4A shows the response surface for the interaction between the solvent concentration and pH. As depicted, the concentration of anthocyanins extracted is favored with the increase in pH and the decrease in the concentration of the solvent.
When running the response optimizer seeking to maximize the concentration of total monomeric anthocyanins, a predicted concentration of 61.9 mg C3G/100 g DW was obtained as a solution, under the conditions of solvent concentration equal to 60%, pH 6, and liquid–solid ratio equal to 80 mL/g. The contour plot is observed in Figure 4B. Therefore, ultrasound-assisted extraction was proposed under these conditions at 20 °C for 15 min for the characterization of the extract.

3.2.3. Characterization of the Anthocyanin Extract

Ultrasound-assisted extraction from kurugua peel was carried out at 20 °C for 15 min using 60% ethanol acidified to a pH equal to 6 and a liquid–solid ratio of 80 mL/g equivalent to 1.25 mg/mL. The determinations were carried out in triplicate, and the results are presented in Table 6.

3.3. UPLC-ESI-DAD-MS/MS Peel Extract Analyses

The UPLC-DAD and UPLC-ESI-MS profiles of S. odorifera fruits are depicted in Table 1. The UPLC-MS analyses allowed the detection of 14 main compounds; 12 of them were tentatively identified, including five anthocyanin derivatives, five flavonols derivatives, two flavonol aglycones, and two unidentified compounds.
The assignments were based on the fragmentation patterns, UVmax absorption, and retention time (Rt), making comparisons with the literature data when available. The tentative identification of polyphenols from S. odorifera through UPLC-ESI-MS/MS was performed.
The UPLC-MS analysis in positive ion mode allowed the detection of five anthocyanins. The compounds 1, 2, and 3 showed the same MS/MS base peak at m/z 287 and UV absorption around 500 nm, in agreement with a cyanidin core. Of them, two (1 and 3) exhibited the same [M+H]+ ion at m/z 595. Compound 1 displayed one neutral loss of one rutinose (308 amu), while the last one (3) lost one rhamnose (146 amu) and one hexose (162 amu). Finally, compound 2 lost a hexose moiety (162 amu) from its pseudo molecular ion at m/z 449. Therefore, compounds 1, 2, and 3 were tentatively assigned as cyanidin rutinoside, cyanidin hexoside, and cyanidin hexoside rhamnoside, respectively. Peak 4 displayed a [M+H]+ ion at m/z 579. Consecutive neutral losses consisting of one rhamnose (146 amu) and one hexose (162 amu) yielded the base peak at m/z 271 compatible with a pelargonidin core. Thus, compound 4 was tentatively identified as pelargonidin hexoside rhamnoside. Compound 5 was tentatively assigned as malvidin rhamnoside shikimate, based on the successive neutral losses of one rhamnose (146 amu) and one shikimoyl moiety (156 amu) leading to the MS2 fragment at m/z 331, suggesting a malvidin core [40].
In negative ion mode, five flavonol derivatives were detected. The peaks 6, 7, and 9 showed an intense fragment ion at m/z 301 as well as UV maxima around 350 nm, suggesting a quercetin core. Compound 6 displayed a [M−H] ion at m/z 609 with a neutral loss of a rutinose (308 amu). Both peaks 7 and 9 with [M−H] ions at m/z 463 and 563, respectively, showed a neutral loss of one hexose (162 amu). The last one (9) also lost a succinate moiety (100 amu). Therefore, compounds 6, 7, and 9 were tentatively identified as quercetin rutinoside (6), quercetin hexoside (7), and quercetin hexoside succinate (9), respectively. In addition, two kaempferol derivatives were tentatively assigned. Peak 8 and 10 showed a pseudomolecular ion at m/z 593 and 447, respectively. The first (8) showed a neutral loss of a rutinose (308 amu), while peak 10 lost a hexose moiety (162 amu), yielding an intense MS2 fragment at m/z 285 in both cases. This MS2 ion and the UV maxima around 345 nm suggest a kaempferol core. Thus, compound 8 was tentatively assigned as kaempferol rutinoside and compound 10 as kaempferol hexoside.
Finally, two flavonol aglycones were detected in the samples. Peak 11 showed an intense signal, with a pseudomolecular ion at m/z 301, leading to the MS2 fragments at m/z 255, 177, and 151, suggesting a quercetin core. Compound 13 also showed a [M−H] ion at m/z 285 with MS2 fragments at m/z 256, 239, and 229, indicating a kaempferol core [41]. Both peaks showed UV absorption around 365–369 nm supporting the assignments. Therefore, compounds 11 and 13 were tentatively identified as quercetin and kaempferol aglycones.
The “kurugua” fruit is a food resource with great potential. The cultivation of this fruit is undervalued, and its nutritional contribution can be better used to comply with daily nutritional recommendations. This native fruit adapted as a crop can contribute to sustainable development objectives in terms of poverty reduction and food security of the rural population, and the data can be used for regional food composition tables. With the application of technology, it is possible to achieve the development of colorants of the black accession peel in powder form, a new product from this low-priced fruit byproduct capable of meeting the current needs of consumers, who seek sources of natural additives, and with an added value of an antioxidant property. Today it is clear that dietary polyphenols, anthocyanins, and their metabolites contribute to the maintenance of intestinal health [1]. Future research should focus on the efficiency of the processing of these fruits on an industrial scale, considering their great potential.

4. Discussion

Considering the different possible accessions of kurugua in the region, Paula Filho et al. (2015) reported S. odorifera fruits with similar characteristics of weight (2510 g), longitudinal diameter (36.91), and latitudinal diameter (9.72 ± 0.88), although slightly more elongated. However, another species, S. sphaerica, reported by the same authors is lighter (1550 g) and of similar proportions (23.70 cm × 11.20 cm, respectively) [42].
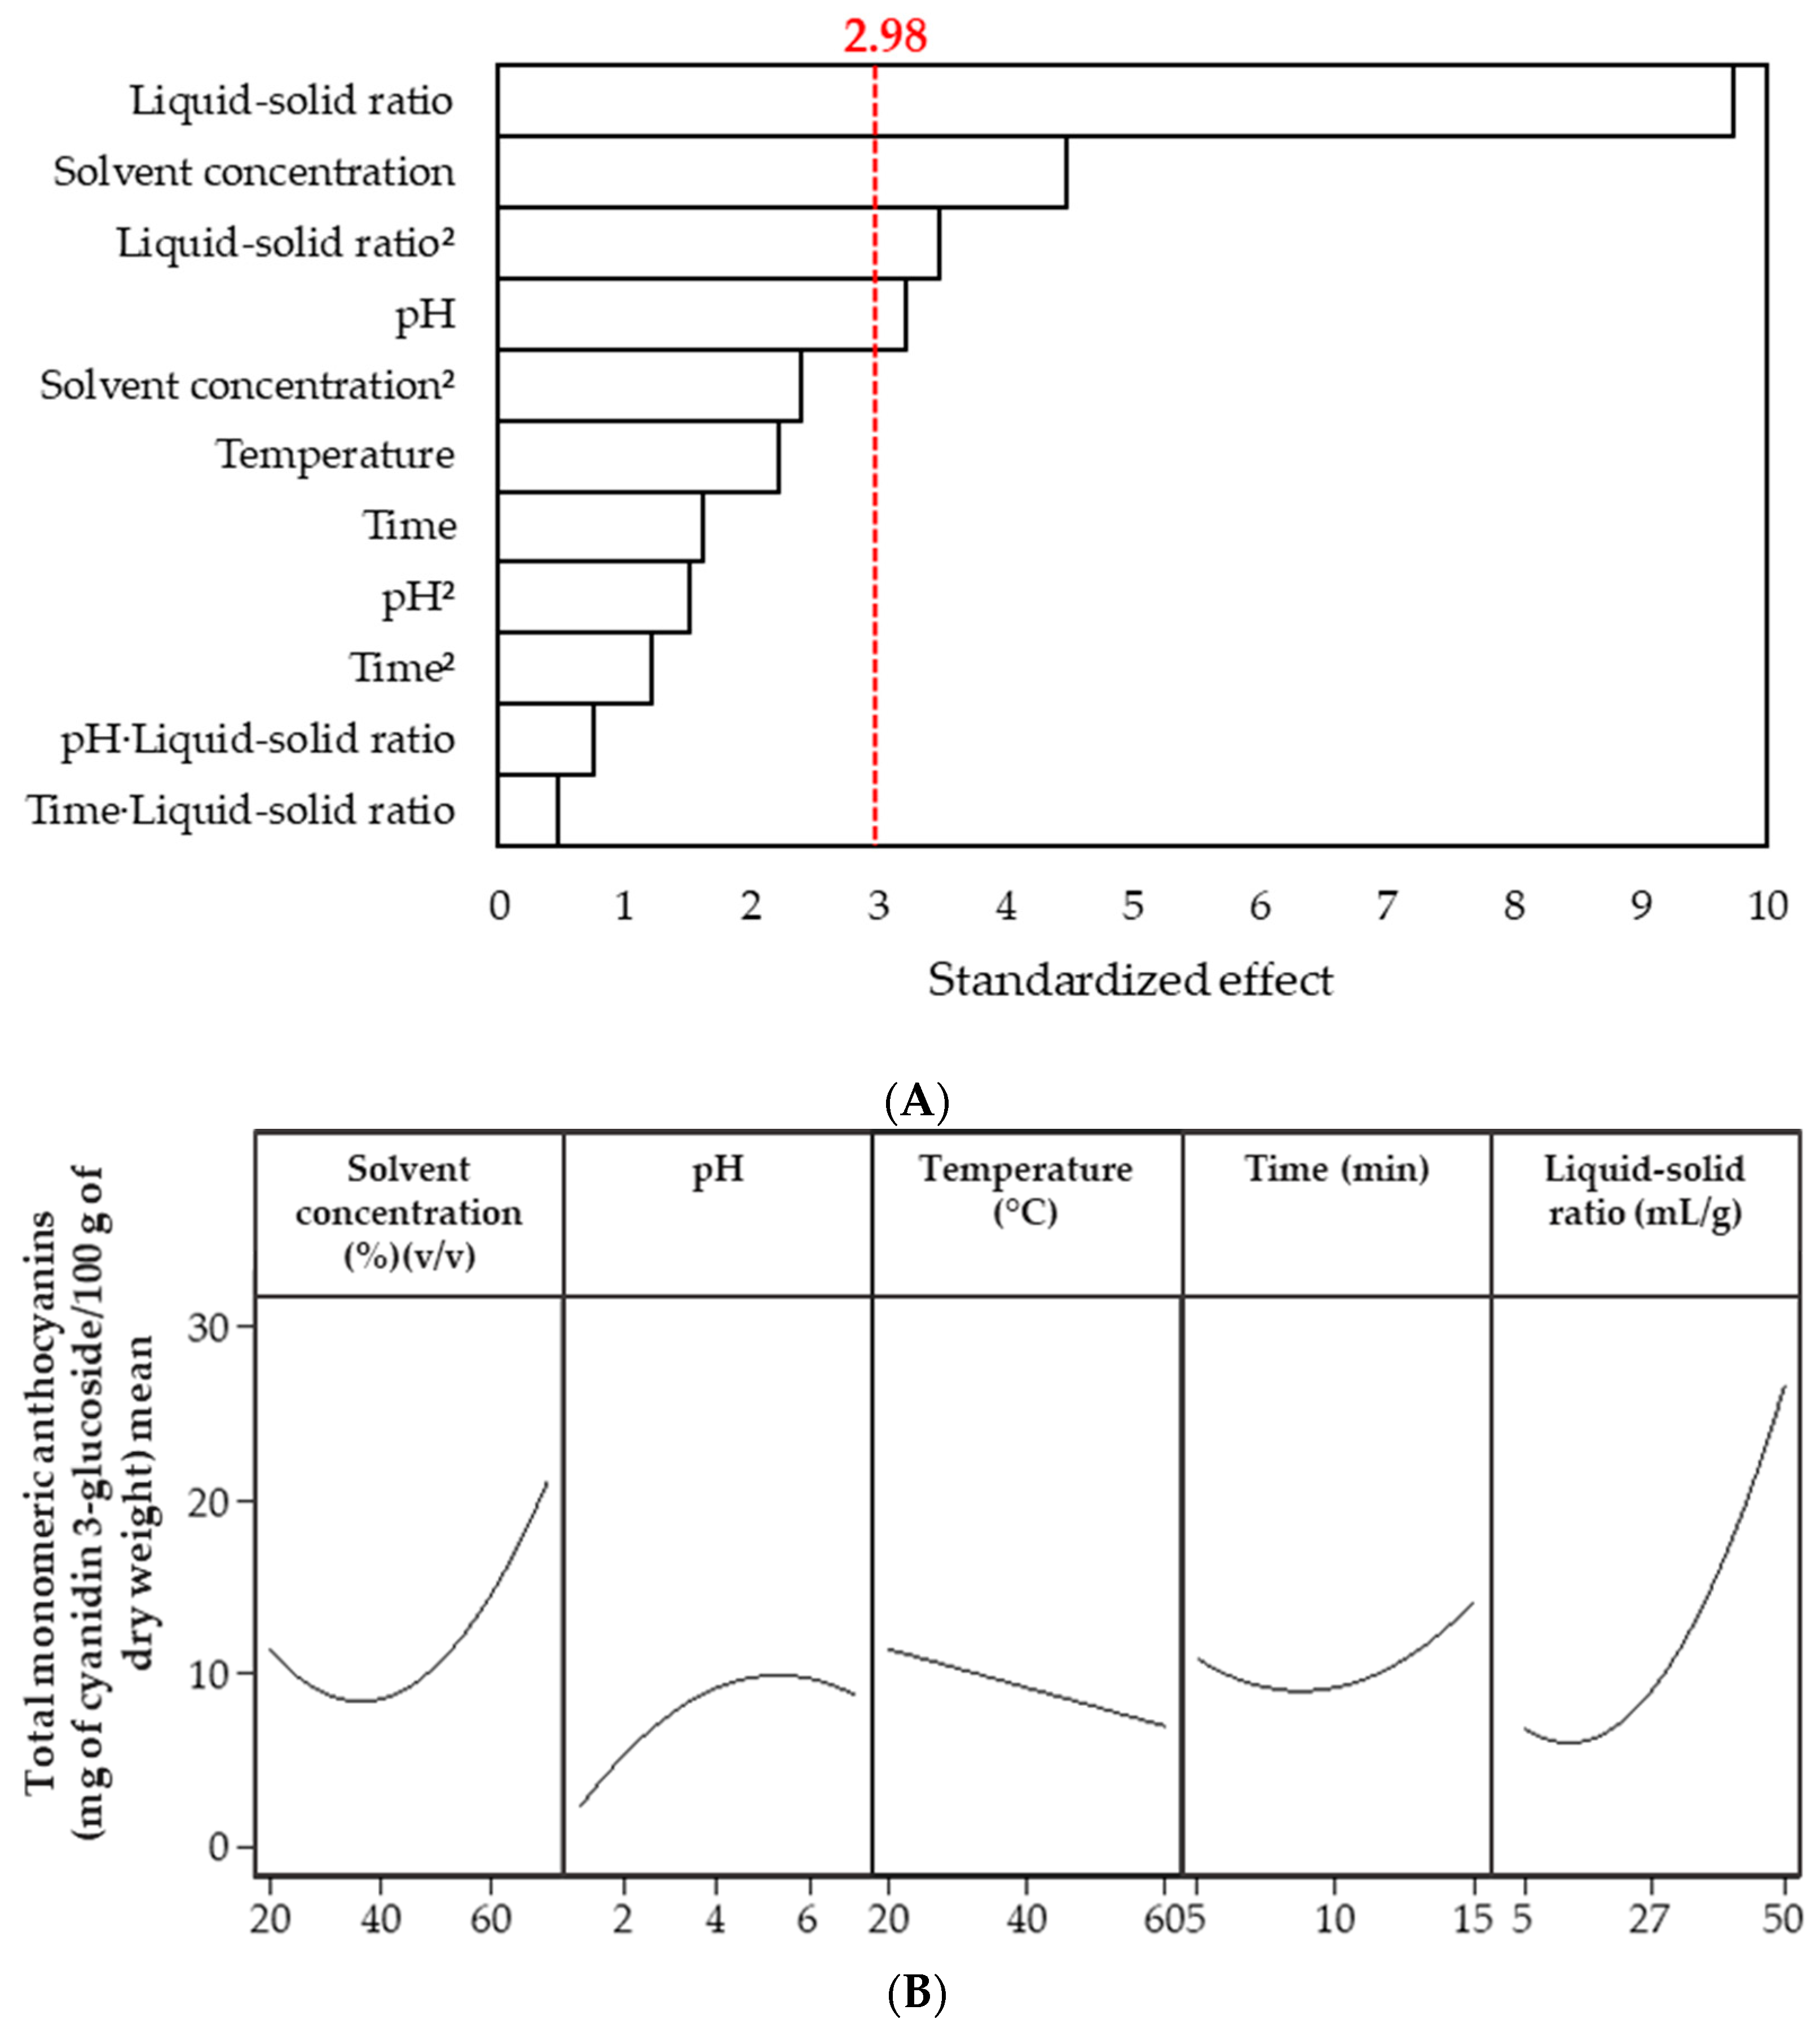
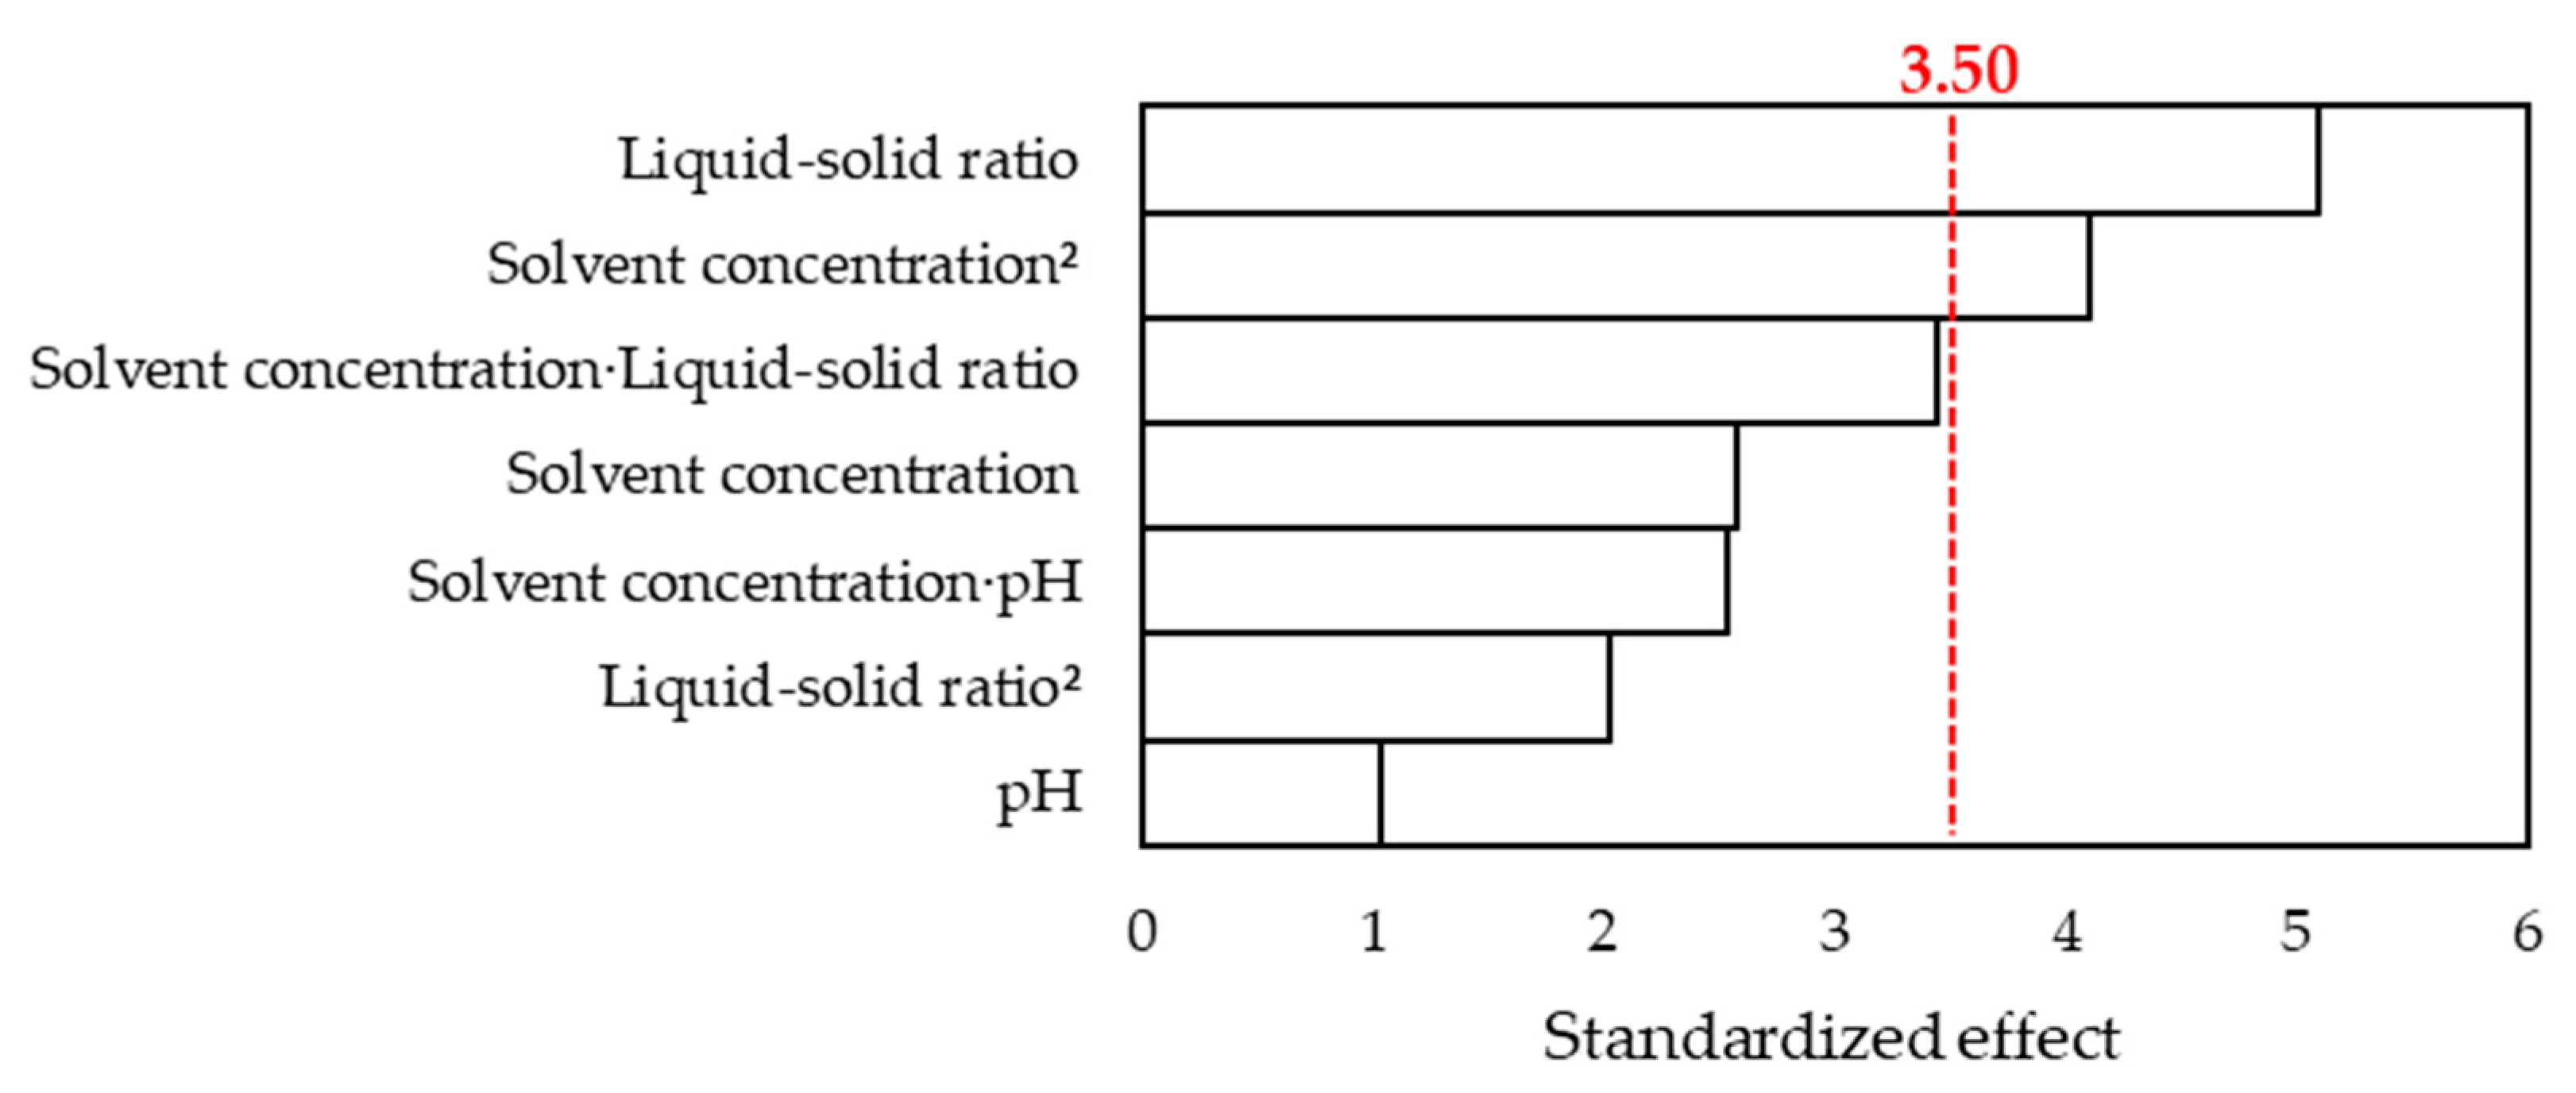
In this work, a hydroalcoholic extraction of anthocyanins from the peel of kurugua fruit was evaluated by UAE. This process is highly studied for the recovery of valuable compounds from different raw material sources, such as fruit and vegetables [13]. Among the variables chosen in this work to evaluate the performance of the process for anthocyanin extraction, the solvent concentration, the liquid–solid ratio (L–S), and the pH were significant, whereas the temperature and the time of extraction were not significant. For the Box–Behnken design, the temperature was set at 20 °C and the time at 15 min. As can be seen in Figure 2, lower temperatures are more efficient for anthocyanin removal. Regarding time, even though longer times imply a higher operational cost, in this work, this time was chosen to allow for enough exposure time of the solute to the solvent. In the literature, extraction times of phenolic compounds from 10 to 90 min are reported [13].
Ethanol was chosen in this work due to its categorization as GRAS (generally recognized as safe), allowing it to be used for food applications [26]. Moreover, this solvent could be considered ecofriendly [10]. Based on the screening design, higher concentrations of ethanol, as well as higher L–S, were tested using the Box–Behnken design. The pH was adjusted between 3.5 and 6. The increment in the concentration of ethanol allows for achieving a high TMA concentration until reaching a maximum concentration value, above which there is a negative effect. It has been reported that a very high concentration (near to the pure solvent) could cause plant tissue dehydration [13], which explains the low concentration of TMA obtained using the pure solvent as shown in Table 5. This was also observed by other authors using other raw materials [9,10]. Regarding the liquid–solid ratio, this also has a positive influence on anthocyanin extraction due to the principles of mass transfer, since the driving force during the mass transfer process is the concentration gradient between the peel and the solvent, which shifts into a higher mass transfer rate [42]. However, an indiscriminate increase in the liquid–solid ratio would lead to economic problems, since increasing this ratio would increase the amount of solvent required for extraction. Concerning the pH, this parameter is understudied in the literature despite its importance for the color stability of anthocyanins. It has been reported that a pH around 4–5 induces a change in the structure, decreasing the concentration of the red-colored flavylium cation and increasing the concentration of the colorless carbinol pseudo base. At pH 6, the extract color trends to be blue or violet due to the presence of hydroxyl groups and the increment of the concentration of the quinoidal base [32].
In this work, the best conditions for anthocyanin extraction were achieved at t = 15 min, T = 20 °C, pH = 6, S = 60% ethanol v/v, and L–S of 80 mg/L, obtaining a concentration of 61.908 mg C3G/100 g DW. It is important to mention that although the final anthocyanin concentration might be higher due to the inherent limitations of the pH differential method, correlation (R) values equal to 0.925 or higher among the results obtained by this method and HPLC measurements have been presented. Therefore, the optimal extraction conditions would remain the same regardless of the quantification method [18,26,43].
The total phenolic compounds were higher in peel extract obtained under the best conditions (9558 ± 522 mg GAE/100 g DW) compared to the peel characterization (100 ± 3.35 mg GAE/100 g DW). For the antioxidant capacity by ABTS assay and total monomeric anthocyanin level, higher values were also observed (0.246 ± 0.00 mmol TEs/g, 60.3 ± 0.3 mg C3G/100 g, respectively) on the extract than those obtained for the peel (0.203 ± 0.027 mmol TEs/g, 19.723 ± 2.689 mg C3G/100 g). This is expected for an extract obtained under the conditions mentioned above; however, here it is observed that the differences between the peel and the extract were not significant for the determination of antioxidant capacity (p = 0.107) and total phenols (p = 0.400), while for the concentration of total monomeric anthocyanins (p = 0.001), the difference was significant, considering the p ≤ 0.01 value as statistically significant. To determine if the differences between the results were significant, the Student’s t-test was performed.
Both peel and other fruit residues as seed were studied for anthocyanin extraction. For mangosteen seed and Nephelium lappaceum L. peel 23.5 mg C3G/100 g and 10.3 mg C3G/100 g, respectively, were found [44,45]. However, for other sources, such as jaboticaba, eggplant, or red araçá, the values were higher. In some cases, values are even four times greater [10,11,12,46,47,48]. In the epicarp of S. odorifera, a value of up to 24 mg per gram on DW higher has been reported [5] compared with our results (60.3 ± 0.3 mg C3G/100 g); however, these differences, in addition to the influence of the species, the section of the fruit used, the test conditions, or the anthocyanin quantification methods, can influence the results. In this work, a standardized technique has been used for the quantification of total monomeric anthocyanins for the characterization of native fruits [23]. Despite this, these results show the potential of “kurugua” peel as an important anthocyanin source for food applications, where otherwise it would be considered as waste, in addition to the contribution of flavonoids observed in the phytochemical profile of the extract (Table 7). It should be noted that this work addressed the optimization of the total phenol compounds and anthocyanin extraction system; however, future studies should prove its effectiveness for food applications as a dye additive and the technological implications that this would entail. It is important to promote a comprehensive use of S. odorifera fruits, which otherwise may be lost. From this data, a value chain could be generated for its industrial applications in foodstuffs and medicine. Studies addressing the phenolic profile of S. odorifera are still scarce; however, those available in the literature reported the occurrence of anthocyanins and flavonol glycosides, in agreement with our results [2,5]. Three anthocyanins were previously isolated and fully characterized in the peels of this fruit, including cyanidin-3-O-rutinoside, cyanidin-3-O-glucoside, and peonidin-coumaroyl-glucoside [2]. In addition, pelargonidin-O-deoxyhexosyl-hexoside was tentatively identified in the epicarp [5]. These compounds were also detected in our samples except for the peonidin derivative. We observed malvidin rhamnose shikimate and another cyanidin rutinoside isomer, as opposed to previous reports. This malvidin derivative was observed in Chilean native berries from the Ribes genus [49] and is reported for the first time in S. odorifera samples. The chromatographic profile of the peel extracts from the Paraguayan 
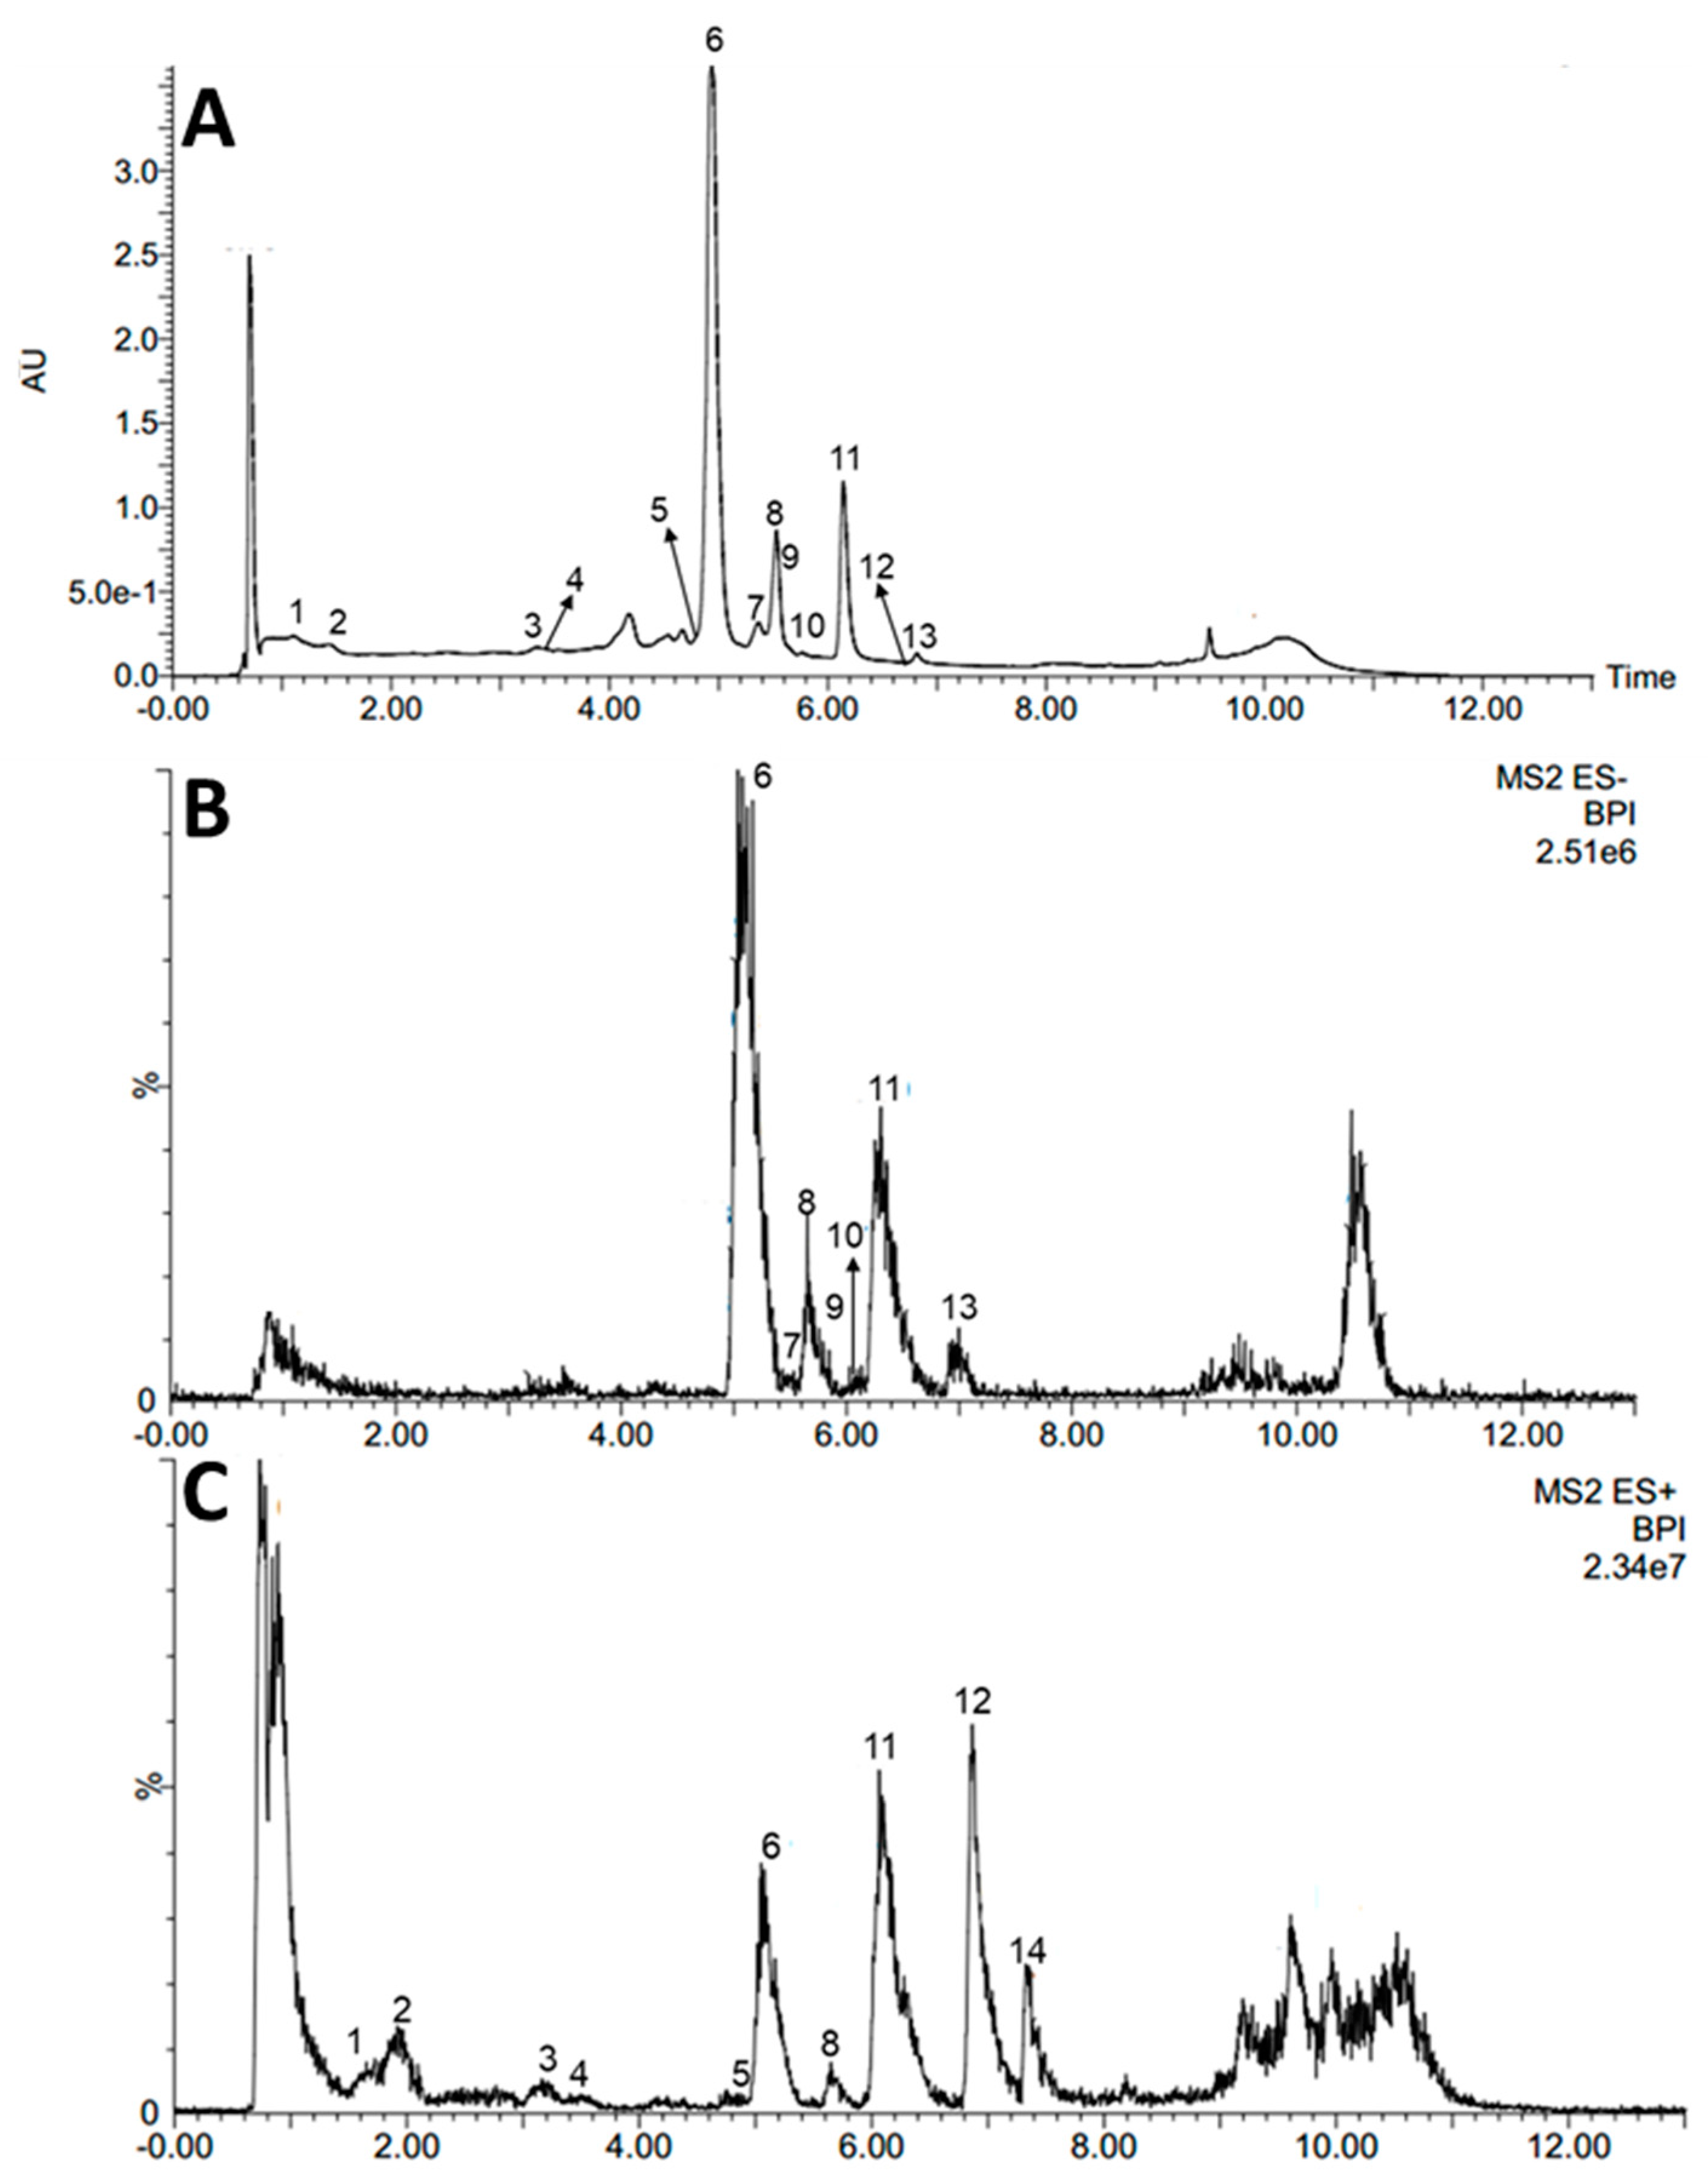
S. odorifera showed intense signals of flavonols, including quercetin and kaempferol derivatives (Figure 5). The most significant was quercetin rutinoside, also reported in this species for specimens from Colombia and Brazil [2,5]. Other flavonols informed in this work, such as quercetin hexoside succinate and kaempferol aglycon, to the best of our knowledge, are reported for the first time in this species. Similarly, a malonyl ester of quercetin-3-O-glycoside and kaempferol-O-deoxyhexosyl hexoside were previously observed in this fruit epicarp [2,5], while quercetin aglycon was isolated from the seeds [7]. The presence of quercetin hexoside, kaempferol hexoside, kaempferol rutinoside, and quercetin aglycon in S. odorifera peels is supported by previous work [2,5,7].
Although some differences with previous reports for S. odorifera were found, most of the observations are in agreement with the literature [2,5,7]. These variations might be due to the different origins of the samples, taking into account the influence of climatic, geographic, and edaphic factors on the production of plant metabolites [50]. In addition, we do not discount the different methodologies employed by the authors as a possible factor influencing compound detection [5].

5. Conclusions

The physicochemical characteristics and composition of the peel of ripe fruits of S. odorifera black accession grown in Paraguay were rich in polyphenol compounds and anthocyanins. After the statistical validation of the theoretical model, it was possible to predict the best extraction conditions for total anthocyanins. The optimal conditions for anthocyanin extraction from the peel by the response surface method were ultrasound-assisted extraction for 15 min at 20 °C, pH = 6 with 60% ethanol, and L–S of 80 mg/L, where a higher concentration of total anthocyanins was obtained: up to 60 mg C3G/100 g DW.
In the extract, 14 main compounds were detected; 12 were tentatively identified, including five anthocyanin derivatives, five flavonols derivatives, and two flavonol aglycones. We observed malvidin rhamnose shikimate and another cyanidin rutinoside isomer; this malvidin derivative is reported for the first time in S. odorifera samples. The chromatographic profile of the peel extracts from the Paraguayan S. odorifera showed intense signals of flavonols, including quercetin and kaempferol derivatives, the most significant being quercetin rutinoside. Other flavonols presented in this work, such as quercetin hexoside succinate and kaempferol aglycon, to the best of our knowledge, are reported for the first time in this species. This study provides important information for obtaining an anthocyanin- and flavonoid-based extract in optimized conditions by ultrasound-assisted extraction from black kurugua peel, an important byproduct of this autochthon fruit. This extract may be of interest for future applications as a natural ingredient in high-added-value foods.

Supplementary Materials

The following are available online at https://www.mdpi.com/article/10.3390/app11136026/s1, Table S1. Analysis of variance of the full quadratic screening design, Table S2. Analysis of variance of Box–Behnken design.

Author Contributions

Conceptualization, L.M. and O.F.; Data curation, O.F.; Formal analysis, L.M., S.C., M.B., D.F., E.C., A.B.-E. and O.F.; Funding acquisition, S.C.; Investigation, S.C., E.C. and O.F.; Methodology, L.M., A.B.-E. and O.F.; Project administration, L.M.; Software, M.B.; Validation, L.M., D.F., A.B.-E. and O.F.; Visualization, L.M.; Writing—original draft, L.M.; Writing—review and editing, A.B.-E. and O.F. All authors have read and agreed to the published version of the manuscript.

Funding

This research received no external funding.

Institutional Review Board Statement

Not applicable.

Informed Consent Statement

Not applicable.

Data Availability Statement

Data supporting reported results can be found in previous work on line https://doi.org/10.3390/proceedings2020053010.

Acknowledgments

The authors are especially grateful to the “Kurugua poty” Foundation and Blas Imas for providing cultivation knowledge and samples, and to Facultad de Ciencias Químicas de la Universidad Nacional de Asunción for providing their facilities. This work was supported by Ia ValSe-Food-CYTED (119RT0567).

Conflicts of Interest

The authors declare no conflict of interest.

References

  1. de Paula Filho, G.X.; Barreira, T.F.; Pinheiro, S.S.; de Morais Cardoso, L.; Duarte Martino, H.S.; Pinheiro-Sant’Ana, H.M. ‘Melão croá’ (Sicana sphaerica Vell.) and ‘maracujina’ (Sicana odorifera Naud.): Chemical composition, carotenoids, vitamins and minerals in native fruits from the Brazilian Atlantic forest. Fruits 2015, 70, 341–349. [Google Scholar] [CrossRef]
  2. Jaramillo, K.; Dawid, C.; Hofmann, T.; Fujimoto, Y.; Osorio, C. Identification of Antioxidative Flavonols and Anthocyanins inSicana odoriferaFruit Peel. J. Agric. Food Chem. 2011, 59, 975–983. [Google Scholar] [CrossRef] [PubMed]
  3. Secretaría Técnica de Planificación. República del Paraguay. Quieren Revalorizar Identidad Histórica a Través del Kurugua. Available online: https://www.stp.gov.py/v1/quieren-revalorizar-identidad-historica-a-traves-del-kurugua/ (accessed on 25 April 2021).
  4. Kienteka, S.S.; Corrêa-Ferreira, M.L.; Petkowicz, C. Characterization of cell wall polysaccharides from Sicana odorifera fruit and structural analysis of a galactan-rich fraction pectins as side chains. Carbohydr. Polym. 2018, 197, 395–402. [Google Scholar] [CrossRef] [PubMed]
  5. Albuquerque, B.R.; Dias, M.I.; Pereira, C.; Petrović, J.; Soković, M.; Calhelha, R.C.; Oliveira, M.B.P.P.; Ferreira, I.C.F.R.; Barros, L. Valorization of Sicanaodorifera (Vell.) Naudin Epicarp as a Source of Bioactive Compounds: Chemical Characterization and Evaluation of Its Bioactive Properties. Foods 2021, 10, 700. [Google Scholar] [CrossRef]
  6. Parada, F.; Duque, C.; Fujimoto, Y. Free and bound volatile composition and characterization of some glucoconjugates as aroma precursors in melón de olor fruit pulp (Sicana odorifera). J. Agric. Food Chem. 2000, 48, 6200–6204. [Google Scholar] [CrossRef]
  7. Nakano, S.; Fujimoto, Y.; Takaishi, Y. Cucurbita-5, 23-diene-3β, 25-diol from Sicana odorifera. Fitoterapia 2004, 75, 609–611. [Google Scholar] [CrossRef]
  8. Contreras-Calderón, J.; Calderón-Jaimes, L.; Guerra-Hernández, E.; García-Villanova, B. Antioxidant capacity, phenolic content and vitamin C in pulp, peel and seed from 24 exotic fruits from Colombia. Food Res. Int. 2011, 44, 2047–2053. [Google Scholar] [CrossRef]
  9. Albuquerque, B.R.; Pinela, J.; Barros, L.; Oliveira, M.B.P.; Ferreira, I.C. Anthocyanin-rich extract of jabuticaba epicarp as a natural colorant: Optimization of heat- and ultrasound-assisted extractions and application in a bakery product. Food Chem. 2020, 316, 126364. [Google Scholar] [CrossRef]
  10. Domínguez, R.; Zhang, L.; Rocchetti, G.; Lucini, L.; Pateiro, M.; Munekata, P.E.S.; Lorenzo, J.M. Elderberry (Sambucus nigra L.) as potential source of antioxidants. Characterization, optimization of extraction parameters and bioactive properties. Food Chem. 2020, 330, 127266. [Google Scholar] [CrossRef]
  11. Ghada, B.; Pereira, E.; Pinela, J.; Prieto, M.A.; Pereira, C.; Calhelha, R.C.; Stojković, D.; Sokóvić, M.; Zaghdoudi, K.; Barros, L.; et al. Recovery of Anthocyanins from Passion Fruit Epicarp for Food Colorants: Extraction Process Optimization and Evaluation of Bioactive Properties. Molecules 2020, 25, 3203. [Google Scholar] [CrossRef]
  12. Ochoa, S.; Durango-Zuleta, M.M.; Osorio-Tobón, J.F. Techno-economic evaluation of the extraction of anthocyanins from purple yam (Dioscorea alata) using ultrasound-assisted extraction and conventional extraction processes. Food Bioprod. Process. 2020, 122, 111–123. [Google Scholar] [CrossRef]
  13. Kumar, K.; Srivastav, S.; Sharanagat, V.S. Ultrasound assisted extraction (UAE) of bioactive compounds from fruit and vegetable processing by-products: A review. Ultrason. Sonochem. 2021, 70, 105325. [Google Scholar] [CrossRef] [PubMed]
  14. Farooq, S.; Shah, M.A.; Siddiqui, M.W.; Dar, B.N.; Mir, S.A.; Ali, A. Recent trends in extraction techniques of anthocyanins from plant materials. J. Food Meas. Charact. 2020, 14, 3508–3519. [Google Scholar] [CrossRef]
  15. Yao, Y.; Pan, Y.; Liu, S. Power ultrasound and its applications: A state-of-the-art review. Ultrason. Sonochem. 2020, 62, 104722. [Google Scholar] [CrossRef] [PubMed]
  16. Saratale, G.D.; Saratale, R.G.; Varjani, S.; Cho, S.-K.; Ghodake, G.S.; Kadam, A.; Mulla, S.I.; Bharagava, R.N.; Kim, D.-S.; Shin, H.S. Development of ultrasound aided chemical pretreatment methods to enrich saccharification of wheat waste biomass for polyhydroxybutyrate production and its characterization. Ind. Crop. Prod. 2020, 150, 112425. [Google Scholar] [CrossRef]
  17. Mongomery, D.C. Montgomery: Design and Analysis of Experiments; John Willy & Sons: Hoboken, NJ, USA, 2017; p. 78. [Google Scholar]
  18. Lee, J.; Rennaker, C.; Wrolstad, R.E. Correlation of two anthocyanin quantification methods: HPLC and spectrophotometric methods. Food Chem. 2008, 110, 782–786. [Google Scholar] [CrossRef]
  19. Jiang, H.-L.; Yang, J.-L.; Shi, Y.-P. Optimization of ultrasonic cell grinder extraction of anthocyanins from blueberry using response surface methodology. Ultrason. Sonochem. 2017, 34, 325–331. [Google Scholar] [CrossRef]
  20. Yin, Y.; Jia, J.; Wang, T.; Wang, C. Optimization of natural anthocyanin efficient extracting from purple sweet potato for silk fabric dyeing. J. Clean. Prod. 2017, 149, 673–679. [Google Scholar] [CrossRef]
  21. Mereles, L.; Ferro, E. Physical characteristics, composition and minerals content in Macadamia integrifolia Maiden & Betche nuts, harvested in Cordillera Department, Paraguay. Rojasiana 2015, 14, 55–68. [Google Scholar]
  22. Horwitz, W. (Ed.) Official Methods of Analysis of AOAC International, 17th ed.; AOAC International: Gaithersburg, MD, USA, 2000. [Google Scholar]
  23. IICA. Protocolos Estandarizados para la Valoración de Frutos Nativos Del Procisur Frente a la Creciente Demanda por Ingredientes y Aditivos Especializados (Carotenoides, Antocianinas y Polifenoles); Procisur: Montevideo, Uruguay, 2018. [Google Scholar]
  24. Singleton, V.L.; Rossi, J.A. Colorimetry of Total Phenolics with Phosphomolybdic-Phosphotungstic Acid Reagents. Am. J. Enol. Vitic. 1965, 16, 144–158. [Google Scholar]
  25. Re, R.; Pellegrini, N.; Proteggente, A.; Pannala, A.; Yang, M.; Rice-Evans, C. Antioxidant activity applying an improved ABTS radical cation decolorization assay. Free Radic. Biol. Med. 1999, 26, 1231–1237. [Google Scholar] [CrossRef]
  26. Lao, F.; Giusti, M.M. Extraction of purple corn (Zea mays L.) cob pigments and phenolic compounds using food-friendly solvents. J. Cereal Sci. 2018, 80, 87–93. [Google Scholar] [CrossRef]
  27. Zapata, L.M. Obtención de extracto de antocianinas a partir de arándanos para ser utilizado como antioxidante y colorante en la industria alimentaria [Unpublished doctoral thesis]. Universitat Politècnica de València. 2014. Available online: https://doi.org/10.4995/Thesis/10251/39105 (accessed on 25 April 2021).
  28. Assous, M.; Abdel-Hady, M.; Medany, G.M. Evaluation of red pigment extracted from purple carrots and its utilization as antioxidant and natural food colorants. Ann. Agric. Sci. 2014, 59, 1–7. [Google Scholar] [CrossRef] [Green Version]
  29. Arrazola, G.; Herazo, I.; Alvis, A. Microencapsulación de antocianinas de berenjena (Solanum melongena L.) mediante Secado por aspersión y evaluación de la estabilidad de su color y capacidad antioxidante. Inf. Tecnol. 2014, 25, 31–42. [Google Scholar] [CrossRef] [Green Version]
  30. Andersen, Ø.M.; Jordheim, M. Anthocyanins. In Encyclopedia of Life Sciences [Internet]; John Wiley & Sons, Ltd.: Chichester, UK, 2010. [Google Scholar] [CrossRef]
  31. Martínez Zambrano, J.J.; Rojas Sarmiento, H.A.; Borda Guerra, G.d.L.; Hastamorir Caro, A.N.; Medina Riaño, F.M. Revista Facultad Nacional de Agronomía-Medellín. Rev. Fac. Nac. Agron. 2011, 64, 6015–6022. Available online: http://www.redalyc.org/articulo.oa?id=179922364024 (accessed on 25 June 2021).
  32. Ngamwonglumlert, L.; Devahastin, S.; Chiewchan, N. Natural colorants: Pigment stability and extraction yield enhancement via utilization of appropriate pretreatment and extraction methods. Crit. Rev. Food Sci. Nutr. 2017, 57, 3243–3259. [Google Scholar] [CrossRef]
  33. Belwal, T.; Huang, H.; Li, L.; Duan, Z.; Zhang, X.; Aalim, H.; Luo, Z. Optimization model for ultrasonic-assisted and scale-up extraction of anthocyanins from Pyrus communis ‘Starkrimson’ fruit peel. Food Chem. 2019, 297, 124993. [Google Scholar] [CrossRef]
  34. Kumar, V.; Pathak, P.; Bhardwaj, N.K. Facile chemo-refining approach for production of micro-nanofibrillated cellulose from bleached mixed hardwood pulp to improve paper quality. Carbohydr. Polym. 2020, 238, 116186. [Google Scholar] [CrossRef]
  35. Fan, G.; Han, Y.; Gu, Z.; Chen, D. Optimizing conditions for anthocyanins extraction from purple sweet potato using response surface methodology (RSM). LWT 2008, 41, 155–160. [Google Scholar] [CrossRef]
  36. Paez-Cartaya, I.; Rodríguez-Sánchez, J.L.; Cruz-Viera, L. Optimización de la extracción de antocianinas de Hibiscus Sabdariffa L. y su caracterización cromática. Cienc. Tecnol. Aliment. 2018, 28, 17–21. [Google Scholar]
  37. Singleton, V.L.; Orthofer, R.; Lamuela-Raventós, R.M. Analysis of total phenols and other oxidation substrates and antioxidants by means of Folin-Ciocalteu reagent. In Methods in Enzymology; Academic Press: London, UK, 1998; Volume 299, pp. 152–178. [Google Scholar]
  38. Giusti, M.M.; Wrolstad, R.E. Characterization and measurement of anthocyanins by UV-visible spectroscopy. In Current Protocols in Food Analytical Chemistry; Wrolstad, R.E., Acree, T.E., An, H., Decker, E.A., Penner, M.H., Reid, D.S., Schwartz, S.J., Shoemaker, C.F., Sporns, P., Eds.; John Wiley & Sons: New York, NY, USA, 2001; pp. F1.2.1–F1.2.13. [Google Scholar] [CrossRef]
  39. Aspee, F.J.; Theoduloz, C.; Vieira, M.N.; Rodríguez-Werner, M.A.; Schmalfuss, E.; Winterhalter, P.; Schmeda-Hirschmann, G. Phenolics from the Patagonian currants Ribes spp.: Isolation, characterization and cytoprotective effect in human AGS cells. J. Funct. Foods 2016, 26, 11–26. [Google Scholar] [CrossRef]
  40. Chen, G.; Li, X.; Saleri, F.; Guo, M. Analysis of Flavonoids in Rhamnus davurica and Its Antiproliferative Activities. Molecules 2016, 21, 1275. [Google Scholar] [CrossRef] [PubMed]
  41. Cardona, F.; Andrés-Lacueva, C.; Tulipani, S.; Tinahones, F.J.; Queipo-Ortuño, M.I. Benefits of polyphenols on gut microbiota and implications in human health. J. Nutr. Biochem. 2013, 24, 1415–1422. [Google Scholar] [CrossRef] [Green Version]
  42. Cacace, J.; Mazza, G. Mass transfer process during extraction of phenolic compounds from milled berries. J. Food Eng. 2003, 59, 379–389. [Google Scholar] [CrossRef]
  43. Lao, F.; Giusti, M.M. Quantification of Purple Corn (Zea mays L.) Anthocyanins Using Spectrophotometric and HPLC Approaches: Method Comparison and Correlation. Food Anal. Methods 2016, 9, 1367–1380. [Google Scholar] [CrossRef]
  44. Maran, J.P.; Manikandan, S.; Nivetha, C.V.; Dinesh, R. Ultrasound assisted extraction of bioactive compounds from Nephelium lappaceum L. fruit peel using central composite face centered response surface design. Arab. J. Chem. 2017, 10, S1145–S1157. [Google Scholar] [CrossRef] [Green Version]
  45. Hiranrangsee, L.; Kumaree, K.K.; Sadiq, M.B.; Anal, A.K. Extraction of anthocyanins from pericarp and lipids from seeds of mangosteen (Garcinia mangostana L.) by Ultrasound-assisted extraction (UAE) and evaluation of pericarp extract enriched functional ice-cream. J. Food Sci. Technol. 2016, 53, 3806–3813. [Google Scholar] [CrossRef] [Green Version]
  46. Fernandes, F.A.N.; Fonteles, T.V.; Rodrigues, S.; de Brito, E.S.; Tiwari, B.K. Ultrasound-assisted extraction of anthocyanins and phenolics from jabuticaba (Myrciaria cauliflora) peel: Kinetics and mathematical modeling. J. Food Sci. Technol. 2020, 57, 2321–2328. [Google Scholar] [CrossRef] [PubMed]
  47. Dranca, F.; Oroian, M. Optimization of ultrasound-assisted extraction of total monomeric anthocyanin (TMA) and total phenolic content (TPC) from eggplant (Solanum melongena L.) peel. Ultrason. Sonochem. 2016, 31, 637–646. [Google Scholar] [CrossRef] [PubMed]
  48. Meregalli, M.M.; Puton, B.M.S.; Camera, F.D.; Amaral, A.U.; Zeni, J.; Cansian, R.L.; Mignoni, M.L.; Backes, G.T. Conventional and ultrasound-assisted methods for extraction of bioactive compounds from red araçá peel (Psidium cattleianum Sabine). Arab. J. Chem. 2020, 13, 5800–5809. [Google Scholar] [CrossRef]
  49. Burgos-Edwards, A.; Jiménez-Aspee, F.; Thomas-Valdés, S.; Schmeda-Hirschmann, G.; Theoduloz, C. Qualitative and quantitative changes in polyphenol composition and bioactivity of Ribes magellanicum and R. punctatum after in vitro gastrointestinal digestion. Food Chem. 2017, 237, 1073–1082. [Google Scholar] [CrossRef]
  50. Karimi, A.; Krähmer, A.; Herwig, N.; Schulz, H.; Hadian, J.; Meiners, T. Variation of Secondary Metabolite Profile of Zataria multiflora Boiss. Populations Linked to Geographic, Climatic, and Edaphic Factors. Front. Plant Sci. 2020, 11, 969. [Google Scholar] [CrossRef] [PubMed]
Figure 1. Morphological characters of the fruit of S. odorifera in ripe state.
Applsci 11 06026 g001
Figure 2. (A) Pareto Chart of standardized effects. (B) Behavior of the model variables.
Applsci 11 06026 g002
Figure 3. Pareto chart of standardized effects of Box–Behnken design.
Applsci 11 06026 g003
Figure 4. (A) Response surface of the model: solvent concentration and pH. (B) Optimization response: solvent concentration and liquid–solid ratio.
Applsci 11 06026 g004
Figure 5. (A) UPLC-PDA chromatogram of the EtOH extract from S. odorifera optimized peels at 280 nm. (B) UPLC-ESI-MS chromatograms in the negative (B) and positive (C) ion mode of the EtOH optimized peel extract of S. odorifera.
Applsci 11 06026 g005
Table 1. Levels of the independent variables considered in the anthocyanin extraction process.
Independent VariableLevelReferences
−101
Solvent concentration (%) (v/v)204570[10,27,30]
pH147[31]
Temperature (°C)204060[32,33]
Time (min)51015[34,35]
Liquid–solid ratio (mL/g)527.550[10,36,37]
Table 2. Morphological characters and composition of ripe S. odorifera fruits, pulp and peel.
External Characteristics of S. odorifera Ripe Fruits.
Weight (g)1970 ± 51
Longitudinal diameter (cm)26.9 ± 1.4
Transverse diameter (cm)10.4 ± 0.7
Mesocarp + exocarp (cm)0.31± 0.02
Physicochemical CharactersPulpPeel
Moisture (g/100 g)88.0 ± 0.18.84 ± 0.15
Ash (g/100 g)0.15 ± 0.003.95 ± 0.44
Total protein (g/100 g)1.07 ± 0.08-
Total carbohydrate (g/100 g)5.55 ± 0.31-
Total Lipids (g/100 g)Nd10.58 ± 1.28
Dietary fiber (g/100 g)2.92 ± 0.00-
pH6.69 ± 0.046.19 ± 0.01
Soluble solids (°Brix) *8.2 ± 0.218.4 ± 0.00
Phenolics Compounds, Anthocyanins, and Total Antioxidant CapacityPulpPeel
Total phenols compounds (mg GAE/100 g)37.2 ± 4.84 a100 ± 3.35 b
Monomeric anthocyanins (mg/g of cyanidin 3-glucoside)2.64 ± 0.10 a19.7 ± 2.69 b
Total antioxidant capacity ABTS (μM TEAC/g)4.39 ± 0.55 a0.201 ± 0.03 b
The values are means ± DS (n = 3). Nd: no detected. Different letters in the same row indicate statistically significant differences in the mean (t student test, p < 0.05).
Table 3. Screening design matrix and values of total monomeric anthocyanin concentration.
Solvent Concentration (%) (v/v)pHTemperature (°C)Time (min)Liquid–Solid Ratio (mL/g)Total Monomeric Anthocyanins (mg C3G/100 g DW)
2014055021.0
2014055020.0
201601556.3
201601557.2
20420155041.6
20420155033.3
207201059.1
207201055.5
20760527.513.6
20760527.511.9
45120555.8
45120557.6
454401027.58.4
454401027.510.0
45760155027.6
45760155026.1
701201527.519.6
701201527.518.0
70160105037.4
70160105023.1
704605516.7
704605513.2
7074015523.7
7074015526.2
7072055045.8
7072055041.2
Table 4. Levels of the independent variables considered in the Box–Behnken design.
Independent VariableLevel
−101
Solvent concentration (%) (v/v)6080100
pH3.504.756.00
Liquid–solid ratio (mL/g)406080
Table 5. Box–Behnken design and values of the total monomeric anthocyanin concentration.
Solvent Concentration (%) (v/v)pHLiquid–Solid Ratio (mL/g)TMA
(mg C3G/100 g DW)
603.56033.8
604.754019.2
604.758056.0
6066043.1
803.54025.3
803.58044.5
804.756045.2
804.756043.5
804.756045.8
8064037.7
8068054.8
1003.56040.1
1004.754018.9
1004.758020.3
10066023.2
Table 6. Anthocyanin optimized extract characterization.
CharacterizationValue
Total monomeric anthocyanins (mg C3G/100 g DW)60.3 ± 0.3
Antioxidant capacity (mmol TEs/g)0.246 ± 0.00
Total phenols (mg GAEs/100 g)9558 ± 522
pH6.19 ± 0.01
Total soluble solids (°Brix)18.4 ± 0.00
Table 7. Tentative identification of the main components occurring in the edible fruits kurugua (S. odorifera) through UPLC-ESI-MS/MS.
PeakRt (min)UVmax[M−H]/[M+H]+PolarityMS/MS FragmentsTentative Identification
11.91517, 275449.44positive287.42 (100)Cyanidin hexoside
21.91517, 276595.54positive287.29 (100)Cyanidin rutinoside
33.33515, 275595.58positive449.12 (10), 287.46 (100)Cyanidin hexoside rhamnoside
43.34 579.52positive433.82 (10), 271.33 (100)Pelargonidin hexoside rhamnoside
55.15 633.48positive633.48 (100), 487.02 (10), 331.39 (15)Malvidin rhamnoside shikimate
65.21349, 263609.55negative609.59 (100), 300.87 (35)Quercetin rutinoside
75.21349, 262463.52negative300.69 (100)Quercetin hexoside
85.76347, 264593.58negative593.33 (100), 285.53 (50)Kaempferol rutinoside
95.76347, 265563.55negative463.20 (70), 301.71 (100)Quercetin hexoside succinate
105.79347, 265447.55negative284.72 (100), 255.41 (40)Kaempferol hexoside
116.37369, 255301.34negative255.18 (10), 177.74 (50), 151.39 (85), 107.27 (100)Quercetin
126.89 453.81positive210.48 (100)Unknown
136.95–7.03365, 265285.29negative285.10 (70), 256.17 (30), 239.55 (100), 229.53 (7 0)Kaempferol
147.35 567.06positive453.76 (55), 381.64 (20), 210.77 (100)Unknown
Publisher’s Note: MDPI stays neutral with regard to jurisdictional claims in published maps and institutional affiliations.

