
A Comprehensive Review of Retinal Vascular and Optical Nerve Diseases Based on Optical Coherence Tomography Angiography

 , , , , , ,
Abstract
:1. Introduction
OCTA Versus FA and ICGA
2. Retinal Vascular Diseases
2.1. Diabetic Retinopathy (DR)
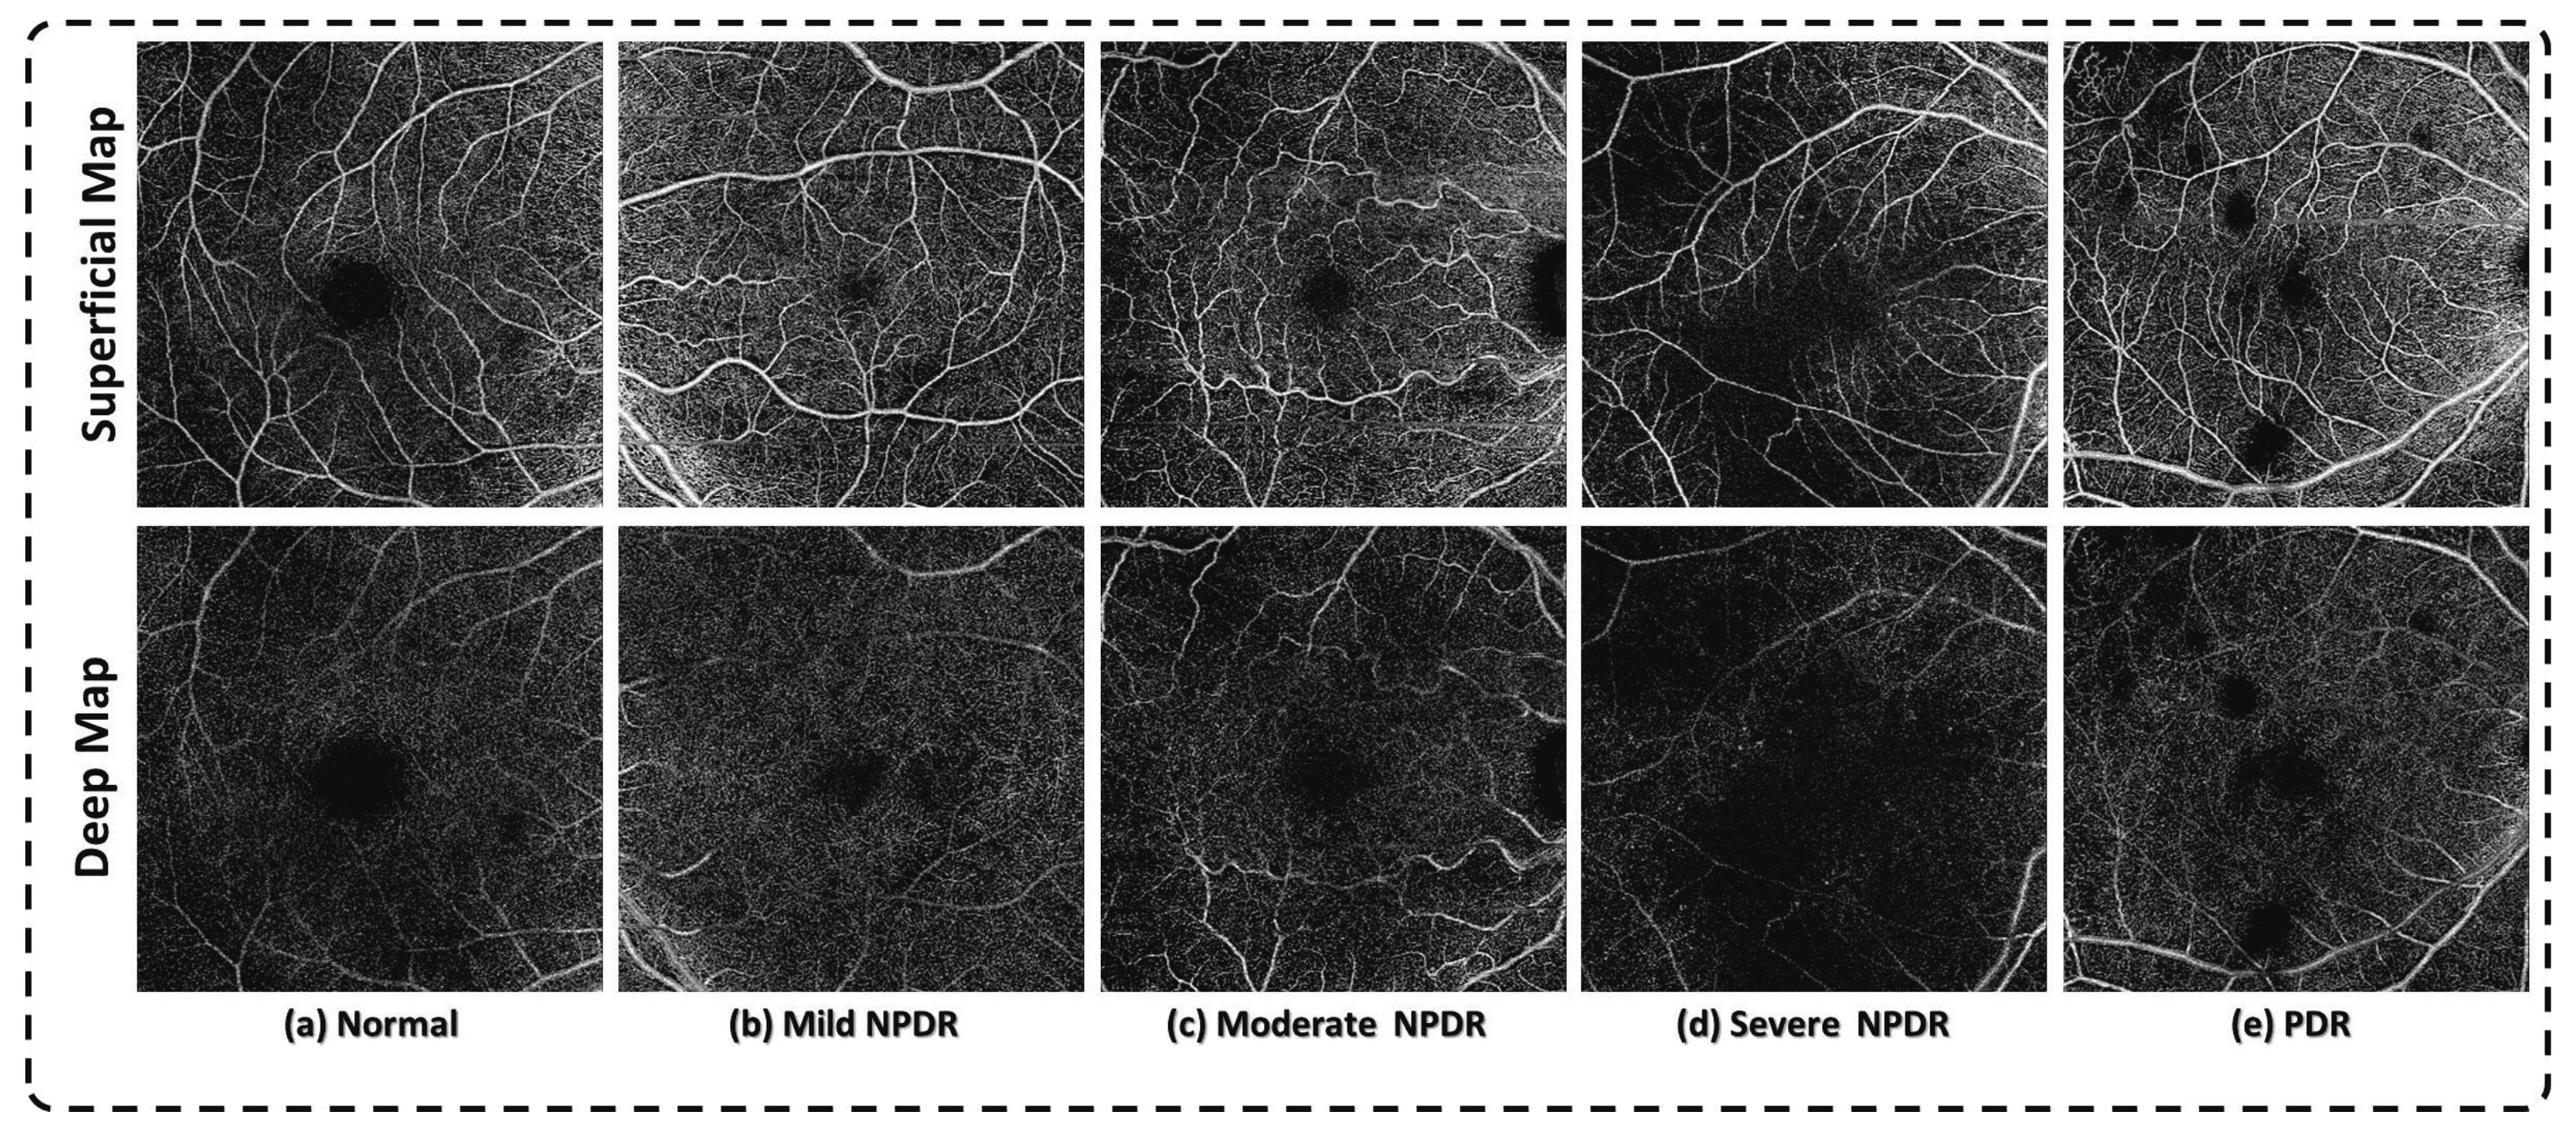
2.1.1. Detection of DR
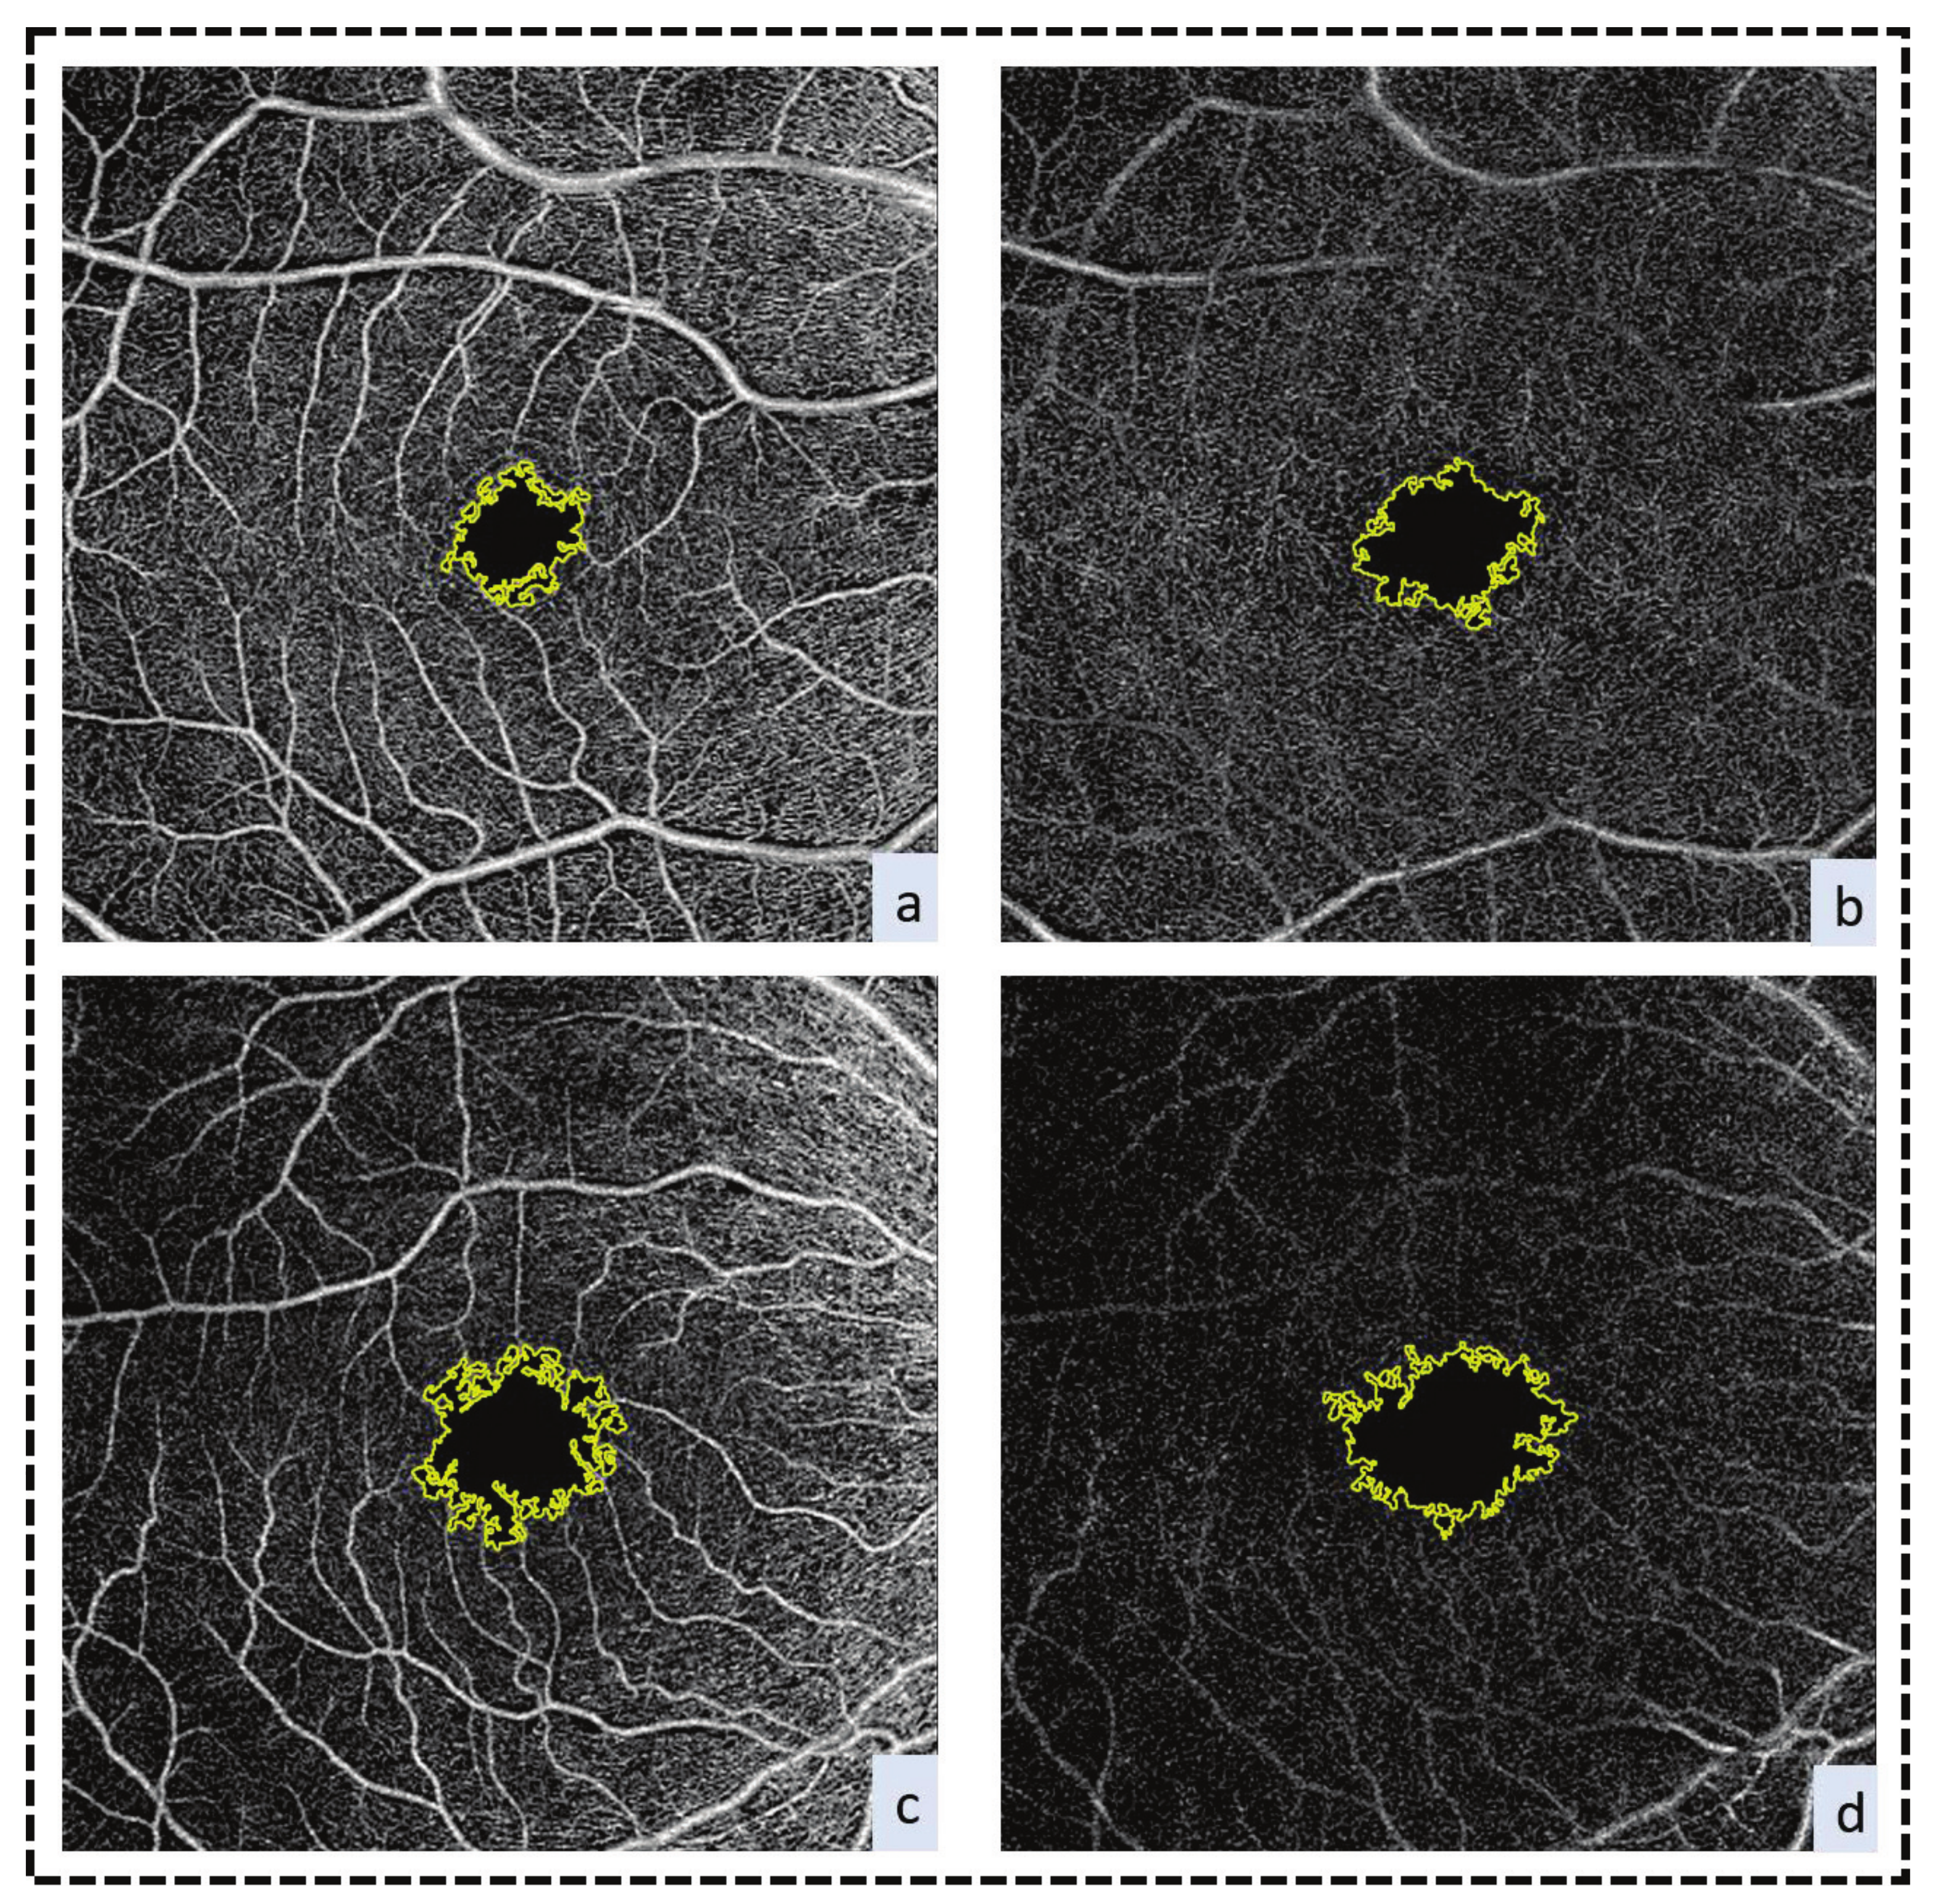
FAZ Enlargement
FAZ Morphology
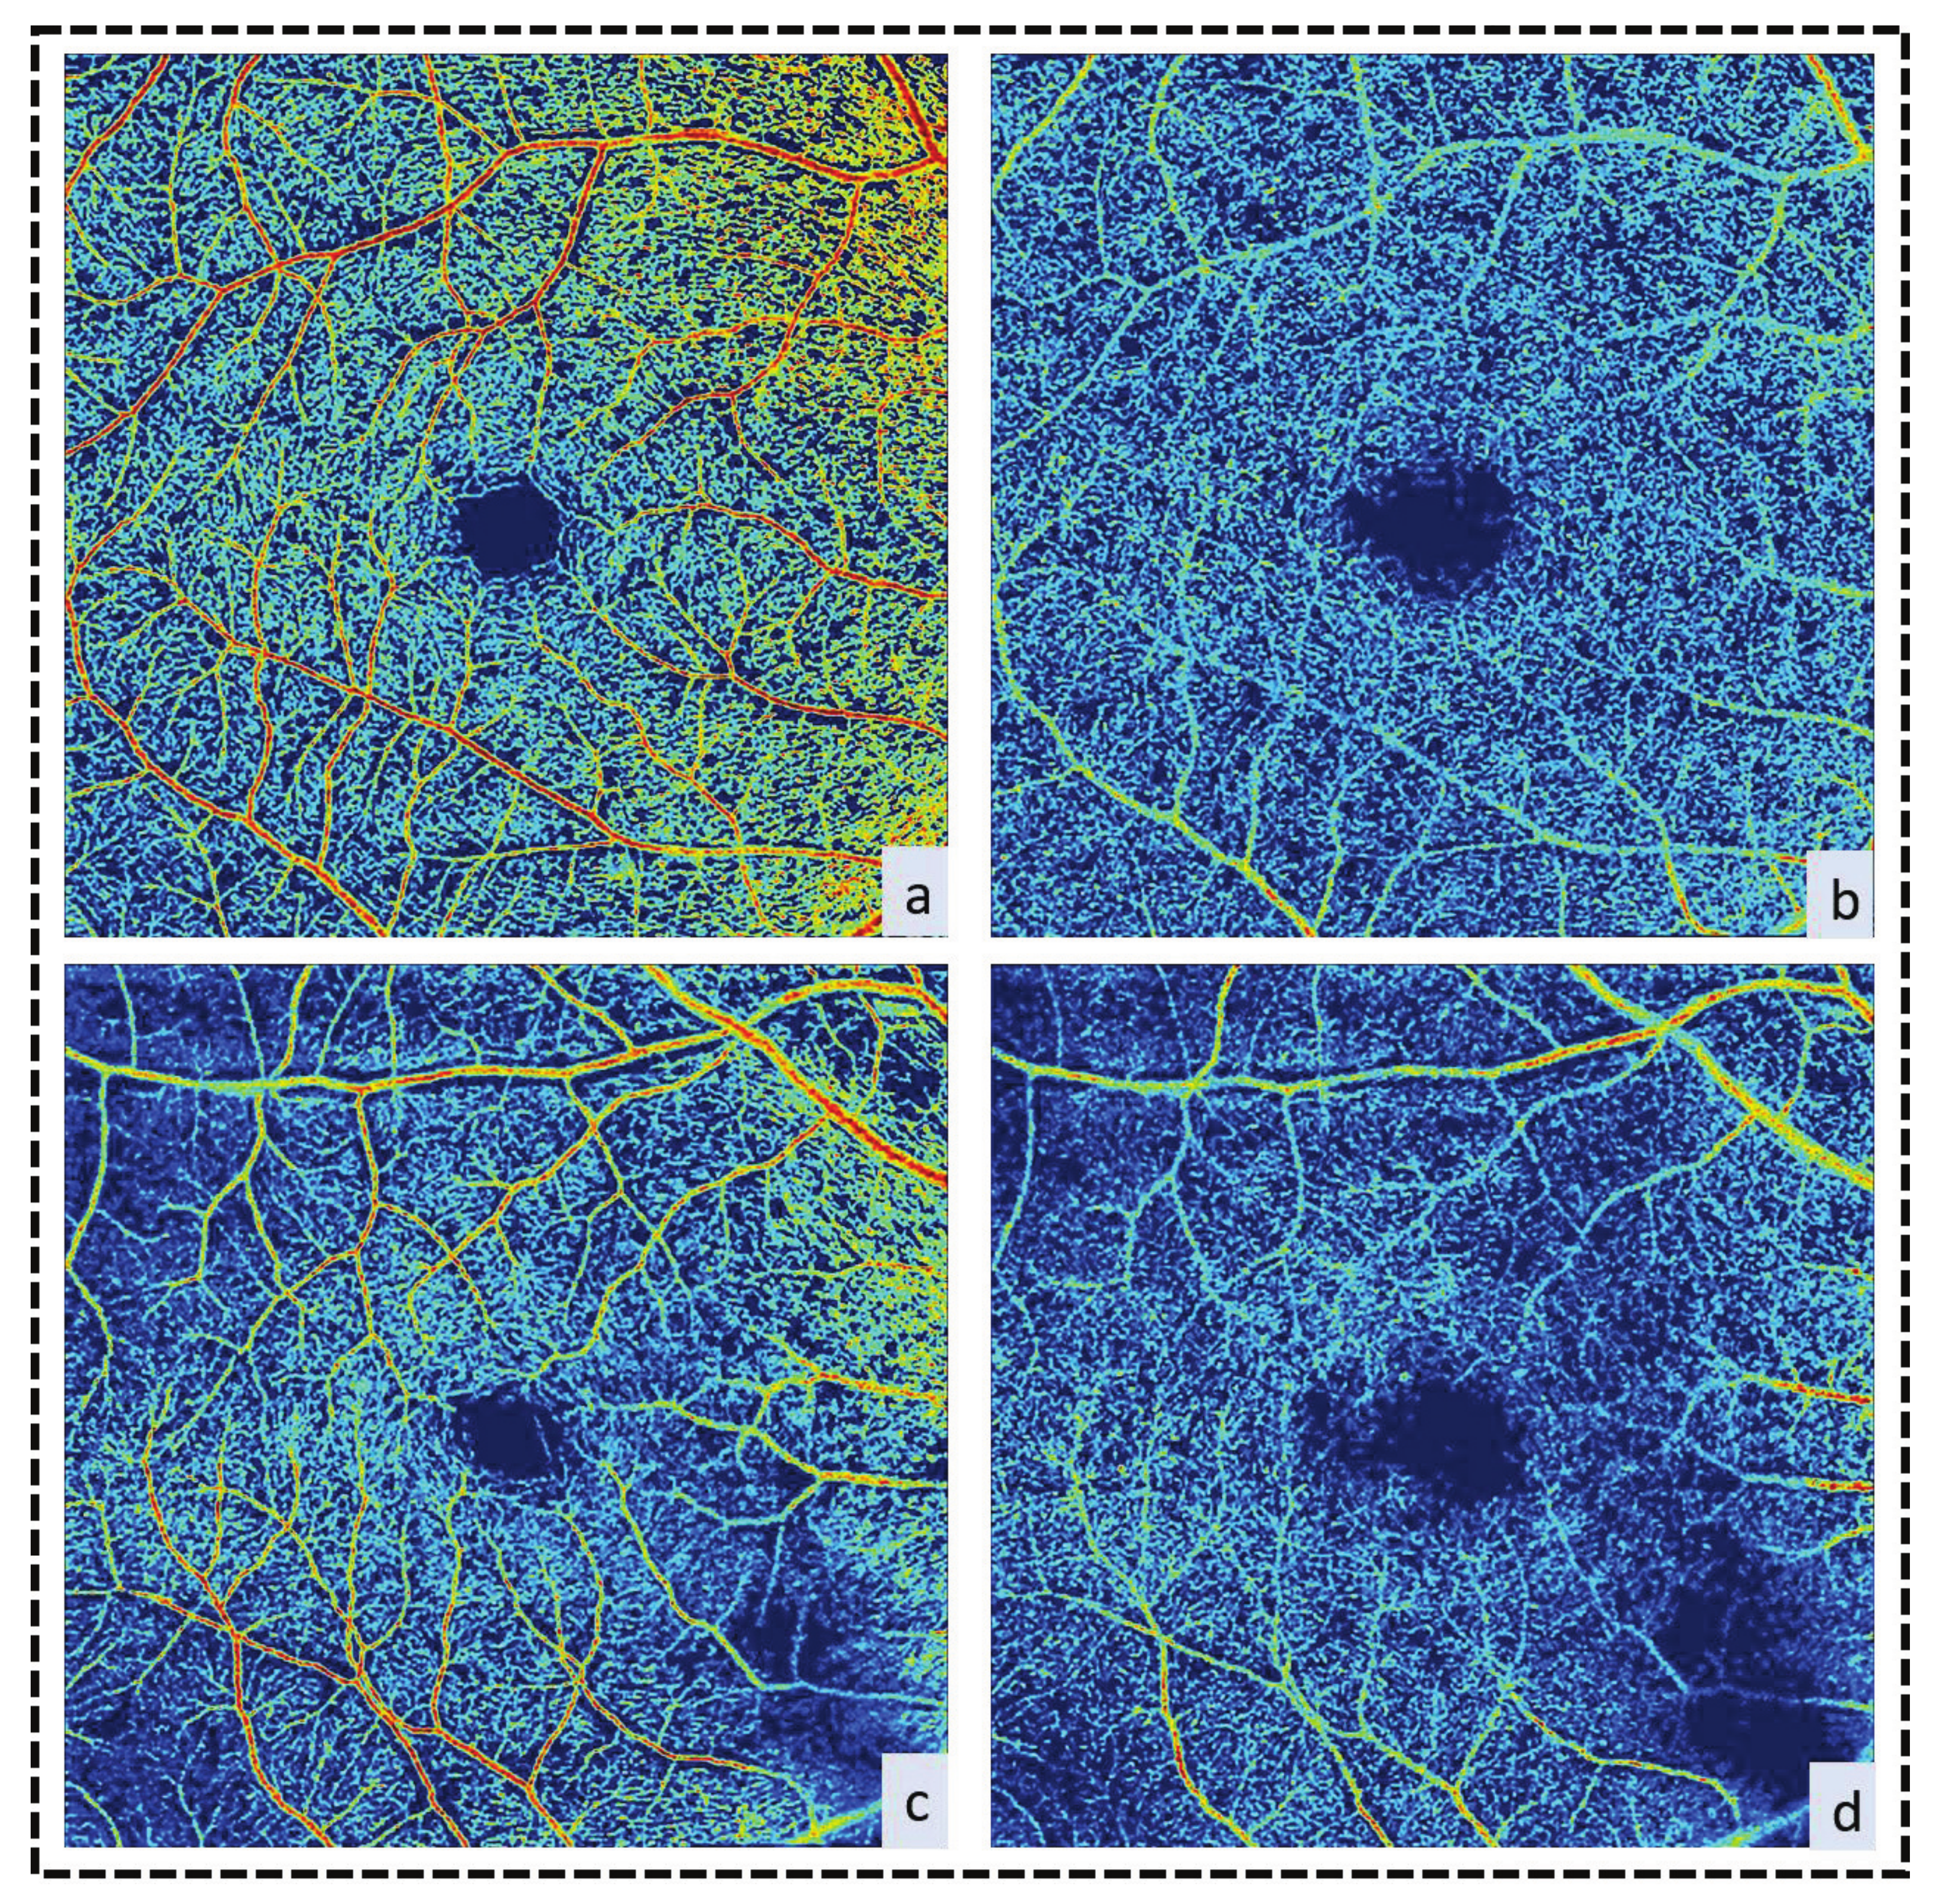
Vessel Density at the Macula
Microaneurysms
Cotton-Wool Spots
Intraretinal Microaneurysmal Abnormalities (IRMA)
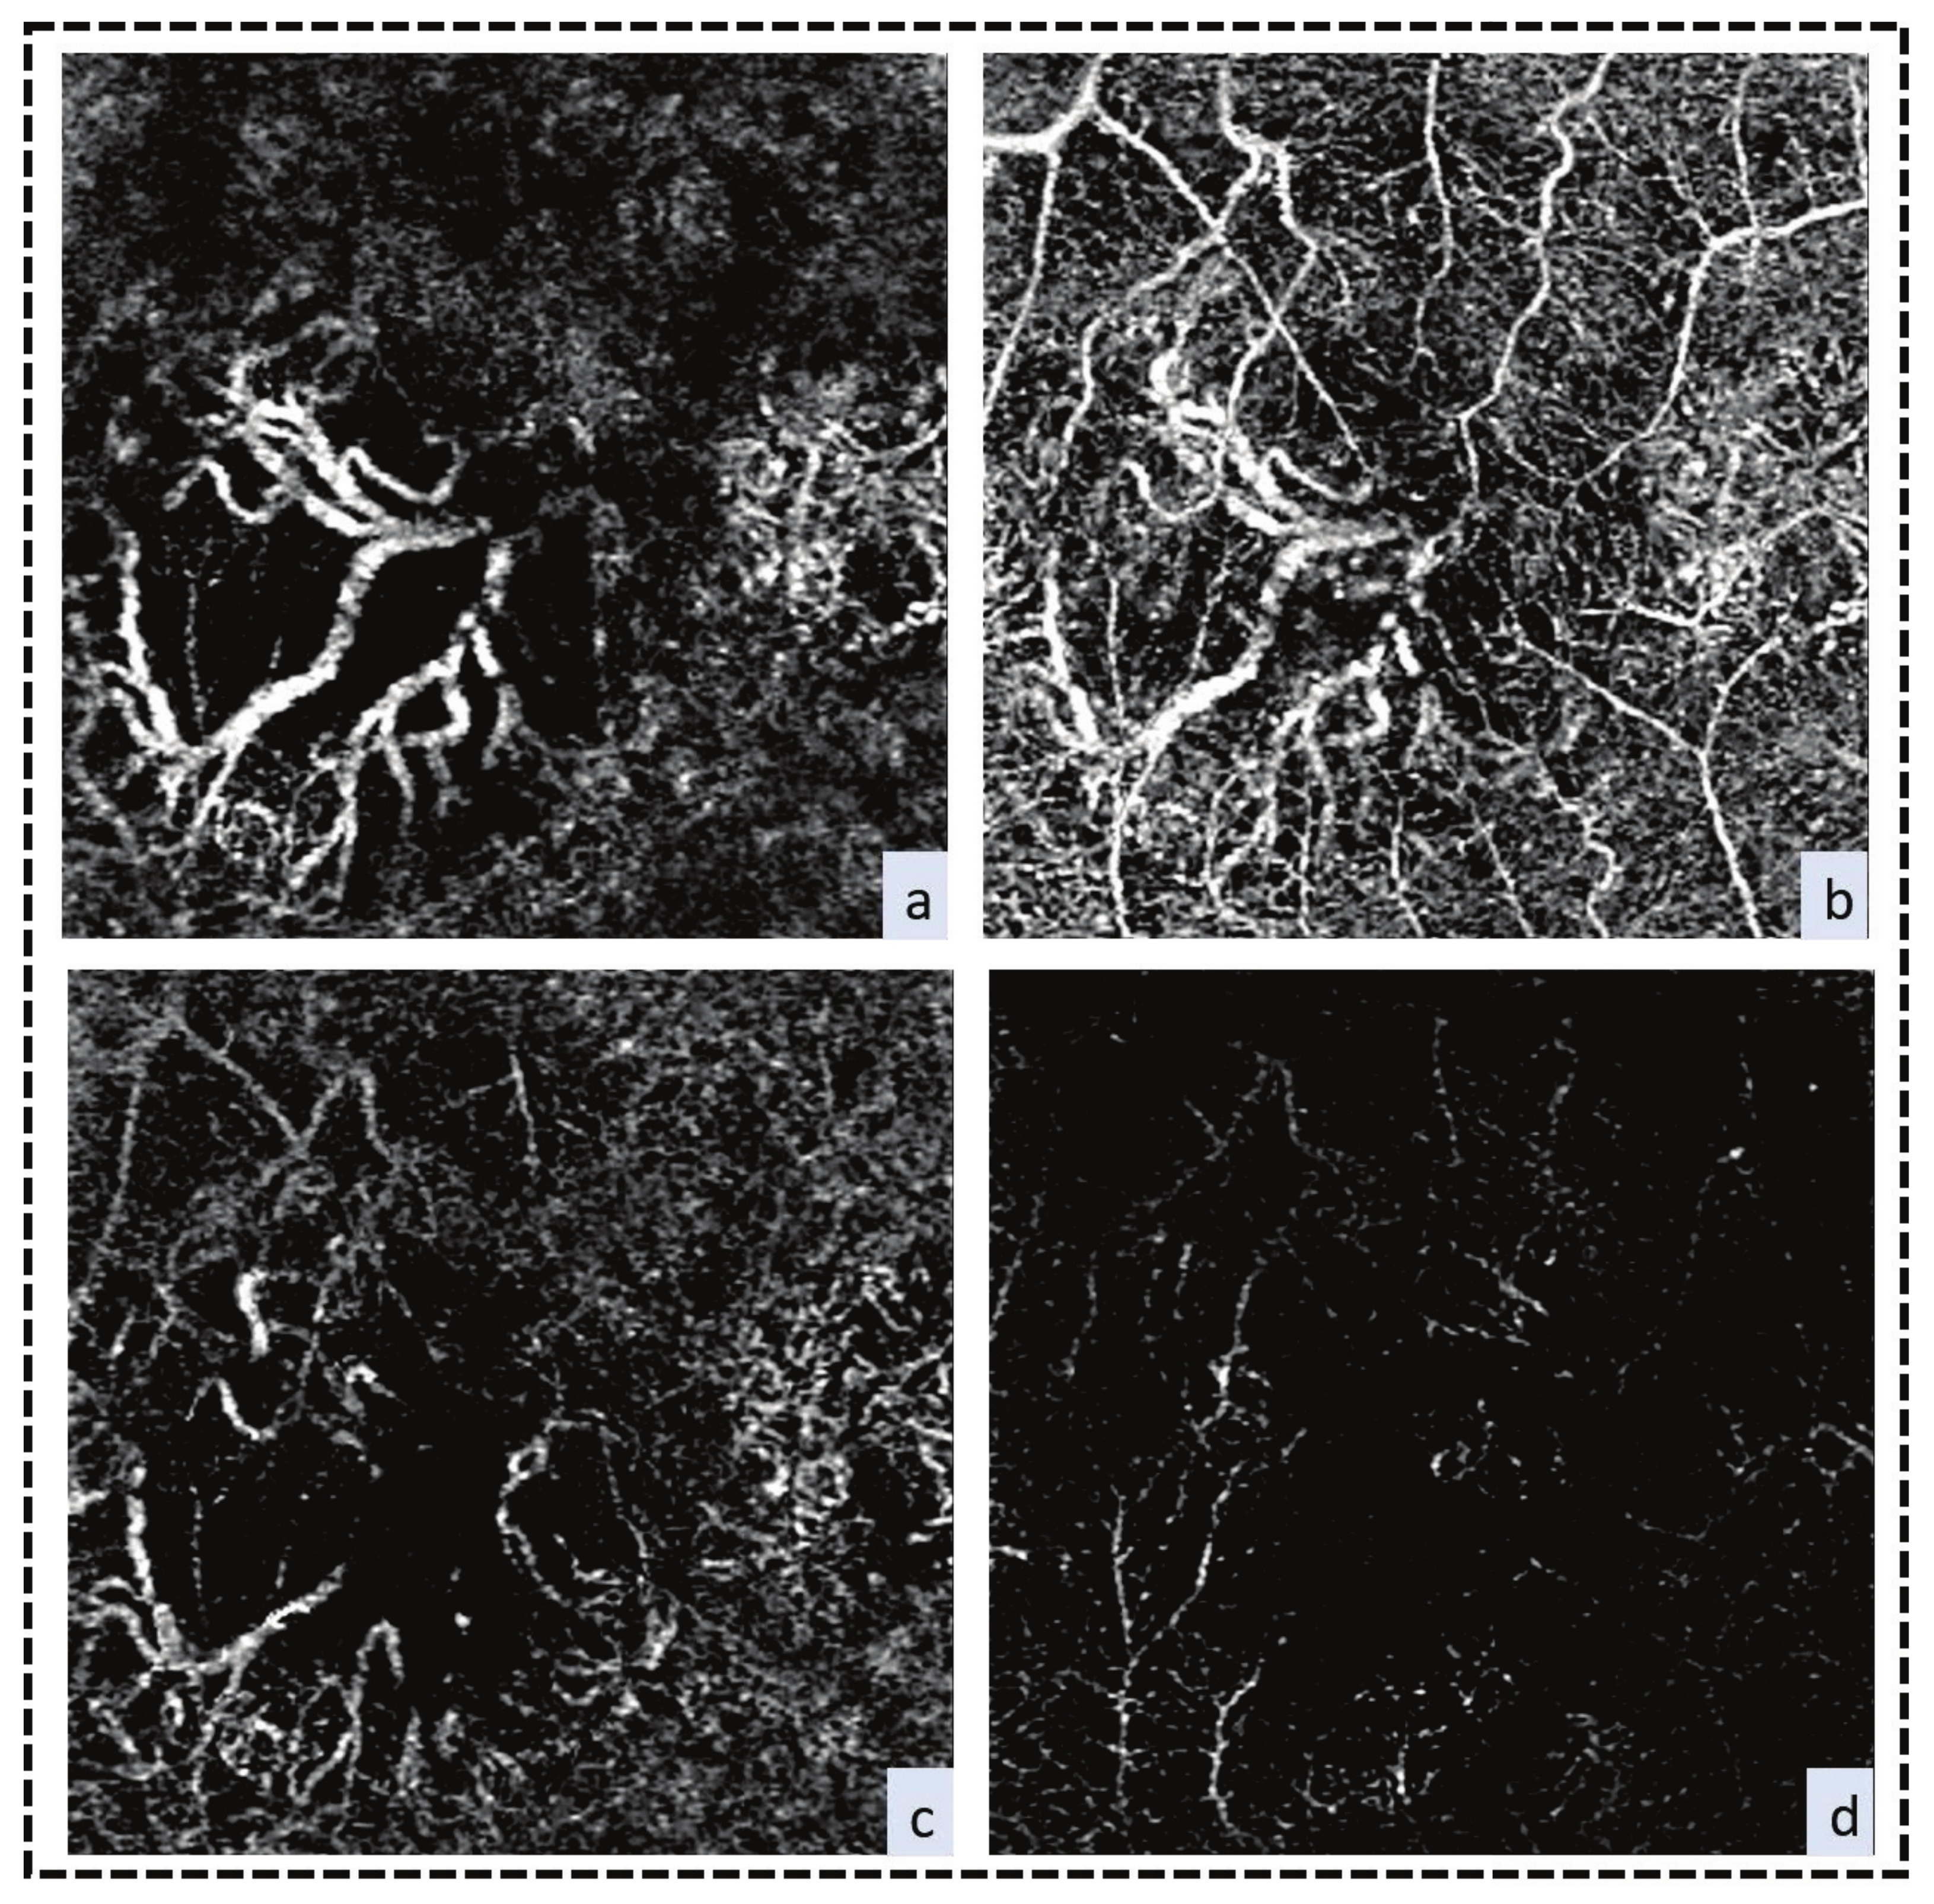
Preretinal Neovascularization
Diabetic Macular Edema (DME)
2.1.2. Detection of Progression of DR FAZ Area
Vessel Density at the Macula
2.1.3. Early Detection of DR
FAZ Area
Vessel Density at the Macula
2.2. Age-Related Macular Degeneration (AMD)
2.3. Retinal Vein Occlusion
2.4. Retinal Artery Occlusion (RAO)
3. Optical Nerve Diseases
3.1. Glaucoma
3.2. Optic Neuropathy
4. Limitations of OCTA
5. Conclusions
Author Contributions
Funding
Acknowledgments
Conflicts of Interest
References
- Savastano, M.C.; Lumbroso, B.; Rispoli, M. In vivo characterization of retinal vascularization morphology using optical coherence tomography angiography. Retina 2015, 35, 2196–2203. [Google Scholar] [CrossRef] [PubMed]
- Hwang, T.S.; Jia, Y.; Gao, S.S.; Bailey, S.T.; Lauer, A.K.; Flaxel, C.J.; Wilson, D.J.; Huang, D. Optical coherence tomography angiography features of diabetic retinopathy. Retina 2015, 35, 2371. [Google Scholar] [CrossRef] [PubMed] [Green Version]
- Mahmud, M.S.; Cadotte, D.W.; Vuong, B.; Sun, C.; Luk, T.W.; Mariampillai, A.; Yang, V.X. Review of speckle and phase variance optical coherence tomography to visualize microvascular networks. J. Biomed. Opt. 2013, 18, 050901. [Google Scholar] [CrossRef] [PubMed] [Green Version]
- Wei, E.; Jia, Y.; Tan, O.; Potsaid, B.; Liu, J.J.; Choi, W.; Fujimoto, J.G.; Huang, D. Parafoveal retinal vascular response to pattern visual stimulation assessed with OCT angiography. PLoS ONE 2013, 8, e81343. [Google Scholar] [CrossRef]
- Chen, C.L.; Wang, R.K. Optical coherence tomography based angiography. Biomed. Opt. Express 2017, 8, 1056–1082. [Google Scholar] [CrossRef] [Green Version]
- Spaide, R.F.; Klancnik, J.M.; Cooney, M.J. Retinal vascular layers imaged by fluorescein angiography and optical coherence tomography angiography. JAMA Ophthalmol. 2015, 133, 45–50. [Google Scholar] [CrossRef] [PubMed]
- Jia, Y.; Bailey, S.T.; Wilson, D.J.; Tan, O.; Klein, M.L.; Flaxel, C.J.; Potsaid, B.; Liu, J.J.; Lu, C.D.; Kraus, M.F. Quantitative optical coherence tomography angiography of choroidal neovascularization in age-related macular degeneration. Ophthalmology 2014, 121, 1435–1444. [Google Scholar] [CrossRef] [PubMed] [Green Version]
- Jia, Y.; Bailey, S.T.; Hwang, T.S.; McClintic, S.M.; Gao, S.S.; Pennesi, M.E.; Flaxel, C.J.; Lauer, A.K.; Wilson, D.J.; Hornegger, J. Quantitative optical coherence tomography angiography of vascular abnormalities in the living human eye. Proc. Natl. Acad. Sci. USA 2015, 112, E2395–E2402. [Google Scholar] [CrossRef] [Green Version]
- Lindner, M.; Fang, P.P.; Steinberg, J.S.; Domdei, N.; Pfau, M.; Krohne, T.U.; Schmitz-Valckenberg, S.; Holz, F.G.; Fleckenstein, M. OCT Angiography–Based Detection and Quantification of the Neovascular Network in Exudative AMD. Investig. Ophthalmol. Vis. Sci. 2016, 57, 6342–6348. [Google Scholar] [CrossRef]
- Conrath, J.; Giorgi, R.; Raccah, D.; Ridings, B. Foveal avascular zone in diabetic retinopathy: Quantitative vs qualitative assessment. Eye 2005, 19, 322. [Google Scholar] [CrossRef] [Green Version]
- Arend, O.; Wolf, S.; Harris, A.; Reim, M. The relationship of macular microcirculation to visual acuity in diabetic patients. Arch. Ophthalmol. 1995, 113, 610–614. [Google Scholar] [CrossRef] [PubMed]
- Couturier, A.; Mané, V.; Bonnin, S.; Erginay, A.; Massin, P.; Gaudric, A.; Tadayoni, R. Capillary plexus anomalies in diabetic retinopathy on optical coherence tomography angiography. Retina 2015, 35, 2384–2391. [Google Scholar] [CrossRef] [PubMed]
- Staurenghi, G.; Bottoni, F.; Giani, A. Clinical applications of diagnostic indocyanine green angiography. In Retina; Elsevier: Amsterdam, The Netherlands, 2013; pp. 51–81. [Google Scholar]
- Johnson, R.N.; Fu, A.D.; McDonald, H.R.; Jumper, J.M.; Ai, E.; Cunningham, E.T.; Lujan, B.J. Fluorescein angiography: Basic principles and interpretation. In Retina, 5th ed.; Elsevier Inc.: Amsterdam, The Netherlands, 2012. [Google Scholar]
- Manivannan, A.; Kirkpatrick, J.; Sharp, P.; Forrester, J. Novel approach towards colour imaging using a scanning laser ophthalmoscope. Br. J. Ophthalmol. 1998, 82, 342–345. [Google Scholar] [CrossRef] [Green Version]
- Zawadzki, R.J.; Jones, S.M.; Pilli, S.; Balderas-Mata, S.; Kim, D.Y.; Olivier, S.S.; Werner, J.S. Integrated adaptive optics optical coherence tomography and adaptive optics scanning laser ophthalmoscope system for simultaneous cellular resolution retinal imaging. Biomed. Opt. Express 2011, 2, 1674–1686. [Google Scholar] [CrossRef] [Green Version]
- Witmer, M.T.; Parlitsis, G.; Patel, S.; Kiss, S. Comparison of ultra-widefield fluorescein angiography with the Heidelberg Spectralis® noncontact ultra-widefield module versus the Optos® Optomap®. Clin. Ophthalmol. 2013, 7, 389. [Google Scholar] [CrossRef] [Green Version]
- De Carlo, T.E.; Romano, A.; Waheed, N.K.; Duker, J.S. A review of optical coherence tomography angiography (OCTA). Int. J. Retin. Vitr. 2015, 1, 5. [Google Scholar] [CrossRef] [Green Version]
- Kadomoto, S.; Muraoka, Y.; Ooto, S.; Miwa, Y.; Iida, Y.; Suzuma, K.; Murakami, T.; Ghashut, R.; Tsujikawa, A.; Yoshimura, N. Evaluation of macular ischemia in eyes with branch retinal vein occlusion: An optical coherence tomography angiography study. Retina 2018, 38, 272–282. [Google Scholar] [CrossRef]
- Salz, D.A.; Talisa, E.; Adhi, M.; Moult, E.; Choi, W.; Baumal, C.R.; Witkin, A.J.; Duker, J.S.; Fujimoto, J.G.; Waheed, N.K. Select features of diabetic retinopathy on swept-source optical coherence tomographic angiography compared with fluorescein angiography and normal eyes. JAMA Ophthalmol. 2016, 134, 644–650. [Google Scholar] [CrossRef]
- Sogawa, K.; Nagaoka, T.; Ishibazawa, A.; Takahashi, A.; Tani, T.; Yoshida, A. En-face optical coherence tomography angiography of neovascularization elsewhere in hemicentral retinal vein occlusion. Int. Med Case Rep. J. 2015, 8, 263. [Google Scholar] [CrossRef] [Green Version]
- Ogurtsova, K.; da Rocha Fernandes, J.; Huang, Y.; Linnenkamp, U.; Guariguata, L.; Cho, N.; Cavan, D.; Shaw, J.; Makaroff, L. IDF Diabetes Atlas: Global estimates for the prevalence of diabetes for 2015 and 2040. Diabetes Res. Clin. Pract. 2017, 128, 40–50. [Google Scholar] [CrossRef] [Green Version]
- Terry, T.; Raravikar, K.; Chokrungvaranon, N.; Reaven, P.D. Does aggressive glycemic control benefit macrovascular and microvascular disease in type 2 diabetes?: Insights from ACCORD, ADVANCE, and VADT. Curr. Cardiol. Rep. 2012, 14, 79–88. [Google Scholar] [CrossRef]
- Yau, J.W.; Rogers, S.L.; Kawasaki, R.; Lamoureux, E.L.; Kowalski, J.W.; Bek, T.; Chen, S.J.; Dekker, J.M.; Fletcher, A.; Grauslund, J. Global prevalence and major risk factors of diabetic retinopathy. Diabetes Care 2012, 35, 556–564. [Google Scholar] [CrossRef] [PubMed] [Green Version]
- Zhang, K.; Ferreyra, H.A.; Grob, S.; Bedell, M.; Zhang, J.J. Diabetic retinopathy: Genetics and etiologic mechanisms. In Retina; Elsevier: Amsterdam, The Netherlands, 2013; pp. 925–939. [Google Scholar]
- Cheung, C.Y.; Ikram, M.K.; Klein, R.; Wong, T.Y. The clinical implications of recent studies on the structure and function of the retinal microvasculature in diabetes. Diabetologia 2015, 58, 871–885. [Google Scholar] [CrossRef] [PubMed]
- Durham, J.T.; Herman, I.M. Microvascular modifications in diabetic retinopathy. Curr. Diabetes Rep. 2011, 11, 253–264. [Google Scholar] [CrossRef]
- Hwang, T.S.; Gao, S.S.; Liu, L.; Lauer, A.K.; Bailey, S.T.; Flaxel, C.J.; Wilson, D.J.; Huang, D.; Jia, Y. Automated quantification of capillary nonperfusion using optical coherence tomography angiography in diabetic retinopathy. JAMA Ophthalmol. 2016, 134, 367–373. [Google Scholar] [CrossRef]
- Mendis, K.R.; Balaratnasingam, C.; Yu, P.; Barry, C.J.; McAllister, I.L.; Cringle, S.J.; Yu, D.Y.J.I. Correlation of histologic and clinical images to determine the diagnostic value of fluorescein angiography for studying retinal capillary detail. Investig. Ophthalmol. Vis. Sci. 2010, 51, 5864–5869. [Google Scholar] [CrossRef] [Green Version]
- Schwartz, D.M.; Fingler, J.; Kim, D.Y.; Zawadzki, R.J.; Morse, L.S.; Park, S.S.; Fraser, S.E.; Werner, J.S. Phase-variance optical coherence tomography: A technique for noninvasive angiography. Ophthalmology 2014, 121, 180–187. [Google Scholar] [CrossRef] [Green Version]
- Simonett, J.M.; Scarinci, F.; Picconi, F.; Giorno, P.; De Geronimo, D.; Di Renzo, A.; Varano, M.; Frontoni, S.; Parravano, M. Early microvascular retinal changes in optical coherence tomography angiography in patients with type 1 diabetes mellitus. Acta Ophthalmol. 2017, 95, e751–e755. [Google Scholar] [CrossRef] [Green Version]
- Bandello, F.; Corbelli, E.; Carnevali, A.; Pierro, L.; Querques, G. Optical coherence tomography angiography of diabetic retinopathy. In OCT Angiography in Retinal and Macular Diseases; Karger Publishers: Berlin, Germany, 2016; Volume 56, pp. 107–112. [Google Scholar]
- Kim, D.Y.; Fingler, J.; Zawadzki, R.J.; Park, S.S.; Morse, L.S.; Schwartz, D.M.; Fraser, S.E.; Werner, J.S. Noninvasive imaging of the foveal avascular zone with high-speed, phase-variance optical coherence tomography. Investig. Ophthalmol. Vis. Sci. 2012, 53, 85–92. [Google Scholar] [CrossRef] [Green Version]
- Takase, N.; Nozaki, M.; Kato, A.; Ozeki, H.; Yoshida, M.; Ogura, Y. Enlargement of foveal avascular zone in diabetic eyes evaluated by en face optical coherence tomography angiography. Retina 2015, 35, 2377–2383. [Google Scholar] [CrossRef]
- Suzuki, K.; Nozaki, M.; Takase, N.; Kato, A.; Morita, H.; Ozeki, H.; Yoshida, M.; Ogura, Y. Association of Foveal Avascular Zone Enlargement and Diabetic Retinopathy Progression Using Optical Coherence Tomography Angiography. J. Vitr. Dis. 2018, 2, 343–350. [Google Scholar] [CrossRef]
- Dupas, B.; Minvielle, W.; Bonnin, S.; Couturier, A.; Erginay, A.; Massin, P.; Gaudric, A.; Tadayoni, R. Association between vessel density and visual acuity in patients with diabetic retinopathy and poorly controlled type 1 diabetes. JAMA Ophthalmol. 2018, 136, 721–728. [Google Scholar] [CrossRef] [PubMed]
- Freiberg, F.J.; Pfau, M.; Wons, J.; Wirth, M.A.; Becker, M.D.; Michels, S. Optical coherence tomography angiography of the foveal avascular zone in diabetic retinopathy. Graefe’s Arch. Clin. Exp. Ophthalmol. 2016, 254, 1051–1058. [Google Scholar] [CrossRef] [Green Version]
- Eladawi, N.; Elmogy, M.; Khalifa, F.; Ghazal, M.; Ghazi, N.; Aboelfetouh, A.; Riad, A.; Sandhu, H.; Schaal, S.; El-Baz, A. Early diabetic retinopathy diagnosis based on local retinal blood vessels analysis in optical coherence tomography angiography (OCTA) images. Med. Phys. 2018, 45, 4582–4599. [Google Scholar] [CrossRef]
- Sandhu, H.S.; Eladawi, N.; Elmogy, M.; Keynton, R.; Helmy, O.; Schaal, S.; El-Baz, A. Automated diabetic retinopathy detection using optical coherence tomography angiography: A pilot study. Br. J. Ophthalmol. 2018, 102, 1564–1569. [Google Scholar] [CrossRef]
- Balaratnasingam, C.; Inoue, M.; Ahn, S.; McCann, J.; Dhrami-Gavazi, E.; Yannuzzi, L.A.; Freund, K.B. Visual acuity is correlated with the area of the foveal avascular zone in diabetic retinopathy and retinal vein occlusion. Ophthalmology 2016, 123, 2352–2367. [Google Scholar] [CrossRef]
- Chui, T.Y.; VanNasdale, D.A.; Elsner, A.E.; Burns, S.A. The association between the foveal avascular zone and retinal thickness. Investig. Ophthalmol. Vis. Sci. 2014, 55, 6870–6877. [Google Scholar] [CrossRef] [Green Version]
- Zheng, Y.; Gandhi, J.S.; Stangos, A.N.; Campa, C.; Broadbent, D.M.; Harding, S.P. Automated segmentation of foveal avascular zone in fundus fluorescein angiography. Investig. Ophthalmol. Vis. Sci. 2010, 51, 3653–3659. [Google Scholar] [CrossRef]
- Hilmantel, G.; Applegate, R.A.; Stowers, S.; Bradley, A.; Lee, B. Entoptic foveal avascular zone measurement and diabetic retinopathy. Optom. Vis. Sci. Off. Publ. Am. Acad. Optom. 1999, 76, 826–831. [Google Scholar] [CrossRef]
- Krawitz, B.D.; Mo, S.; Geyman, L.S.; Agemy, S.A.; Scripsema, N.K.; Garcia, P.M.; Chui, T.Y.; Rosen, R.B. Acircularity index and axis ratio of the foveal avascular zone in diabetic eyes and healthy controls measured by optical coherence tomography angiography. Vis. Res. 2017, 139, 177–186. [Google Scholar] [CrossRef]
- Samara, W.A.; Shahlaee, A.; Adam, M.K.; Khan, M.A.; Chiang, A.; Maguire, J.I.; Hsu, J.; Ho, A.C. Quantification of diabetic macular ischemia using optical coherence tomography angiography and its relationship with visual acuity. Ophthalmology 2017, 124, 235–244. [Google Scholar] [CrossRef] [PubMed]
- Carnevali, A.; Sacconi, R.; Corbelli, E.; Tomasso, L.; Querques, L.; Zerbini, G.; Scorcia, V.; Bandello, F.; Querques, G. Optical coherence tomography angiography analysis of retinal vascular plexuses and choriocapillaris in patients with type 1 diabetes without diabetic retinopathy. Acta Diabetologica 2017, 54, 695–702. [Google Scholar] [CrossRef] [PubMed]
- Zahid, S.; Dolz-Marco, R.; Freund, K.B.; Balaratnasingam, C.; Dansingani, K.; Gilani, F.; Mehta, N.; Young, E.; Klifto, M.R.; Chae, B. Fractal dimensional analysis of optical coherence tomography angiography in eyes with diabetic retinopathy. Investig. Ophthalmol. Vis. Sci. 2016, 57, 4940–4947. [Google Scholar] [CrossRef] [PubMed]
- Shen, C.; Yan, S.; Du, M.; Zhao, H.; Shao, L.; Hu, Y. Assessment of capillary dropout in the superficial retinal capillary plexus by optical coherence tomography angiography in the early stage of diabetic retinopathy. BMC Ophthalmol. 2018, 18, 113. [Google Scholar] [CrossRef] [PubMed]
- Ishibazawa, A.; Nagaoka, T.; Takahashi, A.; Omae, T.; Tani, T.; Sogawa, K.; Yokota, H.; Yoshida, A. Optical coherence tomography angiography in diabetic retinopathy: A prospective pilot study. Am. J. Ophthalmol. 2015, 160, 35–44.e1. [Google Scholar] [CrossRef] [PubMed] [Green Version]
- Matsunaga, D.R.; Jack, J.Y.; De Koo, L.O.; Ameri, H.; Puliafito, C.A.; Kashani, A.H. Optical coherence tomography angiography of diabetic retinopathy in human subjects. Ophthalmic Surg. Lasers Imaging Retin. 2015, 46, 796–805. [Google Scholar] [CrossRef] [PubMed]
- Miwa, Y.; Murakami, T.; Suzuma, K.; Uji, A.; Yoshitake, S.; Fujimoto, M.; Yoshitake, T.; Tamura, Y.; Yoshimura, N. Relationship between functional and structural changes in diabetic vessels in optical coherence tomography angiography. Sci. Rep. 2016, 6, 29064. [Google Scholar] [CrossRef] [PubMed]
- Muqit, M.M.; Stanga, P.E. Fourier-domain optical coherence tomography evaluation of retinal and optic nerve head neovascularisation in proliferative diabetic retinopathy. Br. J. Ophthalmol. 2014, 98, 65–72. [Google Scholar] [CrossRef] [PubMed]
- Akiyama, H.; Li, D.; Shimoda, Y.; Matsumoto, H.; Kishi, S. Observation of neovascularization of the disc associated with proliferative diabetic retinopathy using OCT angiography. Jpn. J. Ophthalmol. 2018, 62, 286–291. [Google Scholar] [CrossRef] [PubMed]
- De Carlo, T.E.; Bonini Filho, M.A.; Baumal, C.R.; Reichel, E.; Rogers, A.; Witkin, A.J.; Duker, J.S.; Waheed, N.K. Evaluation of preretinal neovascularization in proliferative diabetic retinopathy using optical coherence tomography angiography. Ophthalmic Surg. Lasers Imaging Retin. 2016, 47, 115–119. [Google Scholar] [CrossRef] [PubMed]
- Nguyen, Q.D.; Brown, D.M.; Marcus, D.M.; Boyer, D.S.; Patel, S.; Feiner, L.; Gibson, A.; Sy, J.; Rundle, A.C.; Hopkins, J.J. Ranibizumab for diabetic macular edema: Results from 2 phase III randomized trials: RISE and RIDE. Ophthalmology 2012, 119, 789–801. [Google Scholar] [CrossRef]
- Haritoglou, C.; Kernt, M.; Neubauer, A.; Gerss, J.; Oliveira, C.M.; Kampik, A.; Ulbig, M. Microaneurysm formation rate as a predictive marker for progression to clinically significant macular edema in nonproliferative diabetic retinopathy. Retina 2014, 34, 157–164. [Google Scholar] [CrossRef]
- Hasegawa, N.; Nozaki, M.; Takase, N.; Yoshida, M.; Ogura, Y. New insights into microaneurysms in the deep capillary plexus detected by optical coherence tomography angiography in diabetic macular edema. Investig. Ophthalmol. Vis. Sci. 2016, 57, OCT348–OCT355. [Google Scholar] [CrossRef] [Green Version]
- Mané, V.; Dupas, B.; Gaudric, A.; Bonnin, S.; Pedinielli, A.; Bousquet, E.; Erginay, A.; Tadayoni, R.; Couturier, A. Correlation between cystoid spaces in chronic diabetic macular edema and capillary nonperfusion detected by optical coherence tomography angiography. Retina 2016, 36, S102–S110. [Google Scholar] [CrossRef]
- Bhanushali, D.; Anegondi, N.; Gadde, S.G.; Srinivasan, P.; Chidambara, L.; Yadav, N.K.; Roy, A.S. Linking retinal microvasculature features with severity of diabetic retinopathy using optical coherence tomography angiography. Investig. Ophthalmol. Vis. Sci. 2016, 57, OCT519–OCT525. [Google Scholar] [CrossRef]
- Kim, A.Y.; Chu, Z.; Shahidzadeh, A.; Wang, R.K.; Puliafito, C.A.; Kashani, A.H. Quantifying microvascular density and morphology in diabetic retinopathy using spectral-domain optical coherence tomography angiography. Investig. Ophthalmol. Vis. Sci. 2016, 57, OCT362–OCT370. [Google Scholar] [CrossRef]
- Barot, M.; Gokulgandhi, M.R.; Patel, S.; Mitra, A.K. Microvascular complications and diabetic retinopathy: Recent advances and future implications. Future Med. Chem. 2013, 5, 301–314. [Google Scholar] [CrossRef] [Green Version]
- Stitt, A.W.; Curtis, T.M.; Chen, M.; Medina, R.J.; McKay, G.J.; Jenkins, A.; Gardiner, T.A.; Lyons, T.J.; Hammes, H.P.; Simo, R. The progress in understanding and treatment of diabetic retinopathy. Prog. Retin. Eye Res. 2016, 51, 156–186. [Google Scholar] [CrossRef]
- Kawasaki, R.; Akune, Y.; Hiratsuka, Y.; Fukuhara, S.; Yamada, M. Cost-utility analysis of screening for diabetic retinopathy in Japan: A probabilistic Markov modeling study. Ophthalmic Epidemiol. 2015, 22, 4–12. [Google Scholar] [CrossRef]
- Cao, D.; Yang, D.; Huang, Z.; Zeng, Y.; Wang, J.; Hu, Y.; Zhang, L. Optical coherence tomography angiography discerns preclinical diabetic retinopathy in eyes of patients with type 2 diabetes without clinical diabetic retinopathy. Acta Diabetol. 2018, 55, 469–477. [Google Scholar] [CrossRef]
- Talisa, E.; Chin, A.T.; Bonini Filho, M.A.; Adhi, M.; Branchini, L.; Salz, D.A.; Baumal, C.R.; Crawford, C.; Reichel, E.; Witkin, A.J.J.R. Detection of microvascular changes in eyes of patients with diabetes but not clinical diabetic retinopathy using optical coherence tomography angiography. Retina 2015, 35, 2364–2370. [Google Scholar]
- Dimitrova, G.; Chihara, E.; Takahashi, H.; Amano, H.; Okazaki, K. Quantitative retinal optical coherence tomography angiography in patients with diabetes without diabetic retinopathy. Investig. Ophthalmol. Vis. Sci. 2017, 58, 190–196. [Google Scholar] [CrossRef] [PubMed]
- Vujosevic, S.; Muraca, A.; Alkabes, M.; Villani, E.; Cavarzeran, F.; Rossetti, L.; De Cilla, S. Early microvascular and neural changes in patients with type 1 and type 2 diabetes mellitus without clinical signs of diabetic retinopathy. Retina 2019, 39, 435–445. [Google Scholar] [CrossRef] [PubMed]
- Scarinci, F.; Nesper, P.L.; Fawzi, A.A. Deep retinal capillary nonperfusion is associated with photoreceptor disruption in diabetic macular ischemia. Am. J. Ophthalmol. 2016, 168, 129–138. [Google Scholar] [CrossRef] [PubMed] [Green Version]
- Abcouwer, S.F.; Gardner, T.W. Diabetic retinopathy: Loss of neuroretinal adaptation to the diabetic metabolic environment. Ann. N. Y. Acad. Sci. 2014, 1311, 174–190. [Google Scholar] [CrossRef] [PubMed] [Green Version]
- Zeng, Y.; Cao, D.; Yu, H.; Yang, D.; Zhuang, X.; Hu, Y.; Li, J.; Yang, J.; Wu, Q.; Liu, B. Early retinal neurovascular impairment in patients with diabetes without clinically detectable retinopathy. Br. J. Ophthalmol. 2019, 103, 1747–1752. [Google Scholar] [PubMed]
- Rosen, R.B.; Romo, J.S.A.; Krawitz, B.D.; Mo, S.; Fawzi, A.A.; Linderman, R.; Carroll, J.; Pinhas, A.; Chui, T.Y.J. Earliest Evidence of Preclinical Diabetic Retinopathy Revealed using OCT Angiography (OCTA) Perfused Capillary Density. Am. J. Ophthalmol. 2019, 203, 103–115. [Google Scholar] [CrossRef] [PubMed]
- Chen, Q.; Ma, Q.; Wu, C.; Tan, F.; Chen, F.; Wu, Q.; Zhou, R.; Zhuang, X.; Lu, F.; Qu, J. Macular vascular fractal dimension in the deep capillary layer as an early indicator of microvascular loss for retinopathy in type 2 diabetic patients. Investig. Ophthalmol. Vis. Sci. 2017, 58, 3785–3794. [Google Scholar] [CrossRef] [PubMed]
- Bressler, N.M. Age-related macular degeneration is the leading cause of blindness. JAMA 2004, 291, 1900–1901. [Google Scholar] [CrossRef] [PubMed]
- Age-Related Eye Disease Study Research Group. Risk factors associated with age-related macular degeneration: A case-control study in the age-related eye disease study: Age-related eye disease study report number 3. Ophthalmology 2000, 107, 2224–2232. [Google Scholar]
- Spaide, R.F.; Jaffe, G.J.; Sarraf, D.; Freund, K.B.; Sadda, S.R.; Staurenghi, G.; Waheed, N.K.; Chakravarthy, U.; Rosenfeld, P.J.; Holz, F.G.; et al. Consensus nomenclature for reporting neovascular age-related macular degeneration data: Consensus on neovascular age-related macular degeneration nomenclature study group. Ophthalmology 2020, 127, 616–636. [Google Scholar] [CrossRef]
- Freund, K.B.; Zweifel, S.A.; Engelbert, M. Do we need a new classification for choroidal neovascularization in age-related macular degeneration? Retina 2010, 30, 1333–1349. [Google Scholar] [CrossRef]
- Gess, A.J.; Fung, A.E.; Rodriguez, J.G. Imaging in neovascular age-related macular degeneration. In Seminars in Ophthalmology; Taylor & Francis: Hoboken, NJ, USA, 2011; Volume 26, pp. 225–233. [Google Scholar]
- Rosenfeld, P.J. Optical coherence tomography and the development of antiangiogenic therapies in neovascular age-related macular degeneration. Investig. Ophthalmol. Vis. Sci. 2016, 57, OCT14–OCT26. [Google Scholar] [CrossRef]
- Palejwala, N.V.; Jia, Y.; Gao, S.S.; Liu, L.; Flaxel, C.J.; Hwang, T.S.; Lauer, A.K.; Wilson, D.J.; Huang, D.; Bailey, S.T. Detection of non-exudative choroidal neovascularization in age-related macular degeneration with optical coherence tomography angiography. Retina 2015, 35, 2204. [Google Scholar] [CrossRef] [Green Version]
- Inoue, M.; Jung, J.J.; Balaratnasingam, C.; Dansingani, K.K.; Dhrami-Gavazi, E.; Suzuki, M.; Talisa, E.; Shahlaee, A.; Klufas, M.A.; El Maftouhi, A. A comparison between optical coherence tomography angiography and fluorescein angiography for the imaging of type 1 neovascularization. Investig. Ophthalmol. Vis. Sci. 2016, 57, OCT314–OCT323. [Google Scholar] [CrossRef] [Green Version]
- Souied, E.H.; El Ameen, A.; Semoun, O.; Miere, A.; Querques, G.; Cohen, S.Y. Optical coherence tomography angiography of type 2 neovascularization in age-related macular degeneration. In OCT Angiography in Retinal and Macular Diseases; Karger Publishers: Berlin, Germany, 2016; Volume 56, pp. 52–56. [Google Scholar]
- Kuehlewein, L.; Sadda, S.; Sarraf, D. OCT angiography and sequential quantitative analysis of type 2 neovascularization after ranibizumab therapy. Eye 2015, 29, 932. [Google Scholar] [CrossRef] [Green Version]
- Coscas, G.J.; Lupidi, M.; Coscas, F.; Cagini, C.; Souied, E.H. Optical coherence tomography angiography versus traditional multimodal imaging in assessing the activity of exudative age-related macular degeneration: A new diagnostic challenge. Retina 2015, 35, 2219–2228. [Google Scholar] [CrossRef]
- Malihi, M.; Jia, Y.; Gao, S.S.; Flaxel, C.; Lauer, A.K.; Hwang, T.; Wilson, D.J.; Huang, D.; Bailey, S.T. Optical coherence tomographic angiography of choroidal neovascularization ill-defined with fluorescein angiography. Br. J. Ophthalmol. 2017, 101, 45–50. [Google Scholar] [CrossRef] [Green Version]
- Veronese, C.; Maiolo, C.; Morara, M.; Armstrong, G.W.; Ciardella, A.P. Optical coherence tomography angiography to assess pigment epithelial detachment. Retina 2016, 36, 645–650. [Google Scholar] [CrossRef]
- Novais, E.A.; Adhi, M.; Moult, E.M.; Louzada, R.N.; Cole, E.D.; Husvogt, L.; Lee, B.; Dang, S.; Regatieri, C.V.; Witkin, A.J. Choroidal neovascularization analyzed on ultrahigh-speed swept-source optical coherence tomography angiography compared to spectral-domain optical coherence tomography angiography. Am. J. Ophthalmol. 2016, 164, 80–88. [Google Scholar] [CrossRef] [Green Version]
- Tan, A.C.; Simhaee, D.; Balaratnasingam, C.; Dansingani, K.K.; Yannuzzi, L.A. A perspective on the nature and frequency of pigment epithelial detachments. Am. J. Ophthalmol. 2016, 172, 13–27. [Google Scholar] [CrossRef] [PubMed]
- El Ameen, A.; Cohen, S.Y.; Semoun, O.; Miere, A.; Srour, M.; Quaranta-El Maftouhi, M.; Oubraham, H.; Blanco-Garavito, R.; Querques, G.; Souied, E.H. Type 2 neovascularization secondary to age-related macular degeneration imaged by optical coherence tomography angiography. Retina 2015, 35, 2212–2218. [Google Scholar] [CrossRef] [PubMed]
- Coscas, G.; Lupidi, M.; Coscas, F.; Français, C.; Cagini, C.; Souied, E.H. Optical coherence tomography angiography during follow-up: Qualitative and quantitative analysis of mixed type I and II choroidal neovascularization after vascular endothelial growth factor trap therapy. Ophthalmic Res. 2015, 54, 57–63. [Google Scholar] [CrossRef] [PubMed]
- Farecki, M.L.; Gutfleisch, M.; Faatz, H.; Rothaus, K.; Heimes, B.; Spital, G.; Lommatzsch, A.; Pauleikhoff, D. Characteristics of type 1 and 2 CNV in exudative AMD in OCT-Angiography. Graefe’s Arch. Clin. Exp. Ophthalmol. 2017, 255, 913–921. [Google Scholar] [CrossRef] [PubMed]
- Schmidt-Erfurth, U.; Chong, V.; Loewenstein, A.; Larsen, M.; Souied, E.; Schlingemann, R.; Eldem, B.; Monés, J.; Richard, G.; Bandello, F. Guidelines for the management of neovascular age-related macular degeneration by the European Society of Retina Specialists (EURETINA). Br. J. Ophthalmol. 2014, 98, 1144–1167. [Google Scholar] [CrossRef] [PubMed]
- Costanzo, E.; Miere, A.; Querques, G.; Capuano, V.; Jung, C.; Souied, E.H. Type 1 choroidal neovascularization lesion size: Indocyanine green angiography versus optical coherence tomography angiography. Investig. Ophthalmol. Vis. Sci. 2016, 57, OCT307–OCT313. [Google Scholar] [CrossRef] [PubMed]
- Amoroso, F.; Miere, A.; Semoun, O.; Jung, C.; Capuano, V.; Souied, E.H. Optical coherence tomography angiography reproducibility of lesion size measurements in neovascular age-related macular degeneration (AMD). Br. J. Ophthalmol. 2018, 102, 821–826. [Google Scholar] [CrossRef]
- Yanagi, Y.; Mohla, A.; Lee, W.K.; Lee, S.Y.; Mathur, R.; Chan, C.M.; Yeo, I.; Wong, T.Y.; Cheung, C.M.G. Prevalence and risk factors for nonexudative neovascularization in fellow eyes of patients with unilateral age-related macular degeneration and polypoidal choroidal vasculopathy. Investig. Ophthalmol. Vis. Sci. 2017, 58, 3488–3495. [Google Scholar] [CrossRef] [Green Version]
- Roisman, L.; Zhang, Q.; Wang, R.K.; Gregori, G.; Zhang, A.; Chen, C.L.; Durbin, M.K.; An, L.; Stetson, P.F.; Robbins, G. Optical coherence tomography angiography of asymptomatic neovascularization in intermediate age-related macular degeneration. Ophthalmology 2016, 123, 1309–1319. [Google Scholar] [CrossRef] [Green Version]
- De Oliveira Dias, J.R.; Zhang, Q.; Garcia, J.M.; Zheng, F.; Motulsky, E.H.; Roisman, L.; Miller, A.; Chen, C.L.; Kubach, S.; de Sisternes, L. Natural history of subclinical neovascularization in nonexudative age-related macular degeneration using swept-source OCT angiography. Ophthalmology 2018, 125, 255–266. [Google Scholar] [CrossRef]
- Treister, A.D.; Nesper, P.L.; Fayed, A.E.; Gill, M.K.; Mirza, R.G.; Fawzi, A.A. Prevalence of Subclinical CNV and Choriocapillaris Nonperfusion in Fellow Eyes of Unilateral Exudative AMD on OCT Angiography. Transl. Vis. Sci. Technol. 2018, 7, 19. [Google Scholar] [CrossRef] [PubMed] [Green Version]
- Maguire, M.G.; Daniel, E.; Shah, A.R.; Grunwald, J.E.; Hagstrom, S.A.; Avery, R.L.; Huang, J.; Martin, R.W.; Roth, D.B.; Castellarin, A.A. Incidence of choroidal neovascularization in the fellow eye in the comparison of age-related macular degeneration treatments trials. Ophthalmology 2013, 120, 2035–2041. [Google Scholar] [CrossRef] [PubMed] [Green Version]
- Pilotto, E.; Frizziero, L.; Daniele, A.R.; Convento, E.; Longhin, E.; Guidolin, F.; Parrozzani, R.; Cavarzeran, F.; Midena, E. Early OCT angiography changes of type 1 CNV in exudative AMD treated with anti-VEGF. Br. J. Ophthalmol. 2019, 103, 67–71. [Google Scholar] [CrossRef] [PubMed]
- Bellou, S.; Pentheroudakis, G.; Murphy, C.; Fotsis, T. Anti-angiogenesis in cancer therapy: Hercules and hydra. Cancer Lett. 2013, 338, 219–228. [Google Scholar] [CrossRef] [PubMed]
- Muakkassa, N.W.; Chin, A.T.; de Carlo, T.; Klein, K.A.; Baumal, C.R.; Witkin, A.J.; Duker, J.S.; Waheed, N.K. Characterizing the effect of anti-vascular endothelial growth factor therapy on treatment-naive choroidal neovascularization using optical coherence tomography angiography. Retina 2015, 35, 2252–2259. [Google Scholar] [CrossRef] [PubMed]
- Zhang, Q.; Zhang, A.; Lee, C.S.; Lee, A.Y.; Rezaei, K.A.; Roisman, L.; Miller, A.; Zheng, F.; Gregori, G.; Durbin, M.K. Projection artifact removal improves visualization and quantitation of macular neovascularization imaged by optical coherence tomography angiography. Ophthalmol. Retin. 2017, 1, 124–136. [Google Scholar] [CrossRef] [Green Version]
- Spaide, R.F. Optical coherence tomography angiography signs of vascular abnormalization with antiangiogenic therapy for choroidal neovascularization. Am. J. Ophthalmol. 2015, 160, 6–16. [Google Scholar] [CrossRef]
- Xu, J.; Song, S.; Wei, W.; Wang, R.K. Wide field and highly sensitive angiography based on optical coherence tomography with akinetic swept source. Biomed. Opt. Express 2017, 8, 420–435. [Google Scholar] [CrossRef] [Green Version]
- Zhou, J.Q.; Xu, L.; Wang, S.; Wang, Y.X.; You, Q.S.; Tu, Y.; Yang, H.; Jonas, J.B. The 10-year incidence and risk factors of retinal vein occlusion: The Beijing eye study. Ophthalmology 2013, 120, 803–808. [Google Scholar] [CrossRef]
- Tultseva, S.N.; Astakhov, Y.S.; Nechiporenko, P.A.; Ovnanyan, A.Y.; Khatina, V.A. Ranibizumab and retinal photocoagulation in the treatment of ischemic retinal vein occlusion. Ophthalmol. J. 2015, 8, 11–27. [Google Scholar] [CrossRef] [Green Version]
- Vein, T. Natural history and clinical management of central retinal vein occlusion. Arch. Ophthalmol. 1997, 115, 486–491. [Google Scholar]
- Novais, E.A.; Waheed, N.K. Optical coherence tomography angiography of retinal vein occlusion. In OCT Angiography in Retinal and Macular Diseases; Karger Publishers: Berlin, Germany, 2016; Volume 56, pp. 132–138. [Google Scholar]
- Kashani, A.H.; Lee, S.Y.; Moshfeghi, A.; Durbin, M.K.; Puliafito, C.A. Optical coherence tomography angiography of retinal venous occlusion. Retina 2015, 35, 2323–2331. [Google Scholar] [CrossRef]
- Chung, C.Y.; Tang, H.H.Y.; Li, S.H.; Li, K.K.W. Differential microvascular assessment of retinal vein occlusion with coherence tomography angiography and fluorescein angiography: A blinded comparative study. Int. Ophthalmol. 2018, 38, 1119–1128. [Google Scholar] [CrossRef]
- Sophie, R.; Hafiz, G.; Scott, A.W.; Zimmer-Galler, I.; Nguyen, Q.D.; Ying, H.; Do, D.V.; Solomon, S.; Sodhi, A.; Gehlbach, P. Long-term outcomes in ranibizumab-treated patients with retinal vein occlusion; the role of progression of retinal nonperfusion. Am. J. Ophthalmol. 2013, 156, 693–705.e11. [Google Scholar] [CrossRef] [Green Version]
- Heier, J.S.; Campochiaro, P.A.; Yau, L.; Li, Z.; Saroj, N.; Rubio, R.G.; Lai, P. Ranibizumab for macular edema due to retinal vein occlusions: Long-term follow-up in the HORIZON trial. Ophthalmology 2012, 119, 802–809. [Google Scholar] [CrossRef]
- Kurashige, Y.; Tsujikawa, A.; Murakami, T.; Miyamoto, K.; Ogino, K.; Muraoka, Y.; Yoshimura, N. Changes in visual acuity and foveal photoreceptor integrity in eyes with chronic cystoid macular edema associated with retinal vein occlusion. Retina 2012, 32, 792–798. [Google Scholar] [CrossRef] [Green Version]
- Murakami, T.; Tsujikawa, A.; Miyamoto, K.; Sakamoto, A.; Ogino, K.; Muraoka, Y.; Kurashige, Y.; Yoshimura, N. Disrupted foveal photoreceptors after combined cystoid spaces and retinal detachment in branch vein occlusion treated with bevacizumab. Retina 2012, 32, 1853–1861. [Google Scholar] [CrossRef]
- Wakabayashi, T.; Sato, T.; Hara-Ueno, C.; Fukushima, Y.; Sayanagi, K.; Shiraki, N.; Sawa, M.; Ikuno, Y.; Sakaguchi, H.; Nishida, K. Retinal microvasculature and visual acuity in eyes with branch retinal vein occlusion: Imaging analysis by optical coherence tomography angiography. Investig. Ophthalmol. Vis. Sci. 2017, 58, 2087–2094. [Google Scholar] [CrossRef]
- Adhi, M.; Bonini Filho, M.A.; Louzada, R.N.; Kuehlewein, L.; Talisa, E.; Baumal, C.R.; Witkin, A.J.; Sadda, S.R.; Sarraf, D.; Reichel, E. Retinal capillary network and foveal avascular zone in eyes with vein occlusion and fellow eyes analyzed with optical coherence tomography angiography. Investig. Ophthalmol. Vis. Sci. 2016, 57, OCT486–OCT494. [Google Scholar] [CrossRef]
- Coscas, F.; Glacet-Bernard, A.; Miere, A.; Caillaux, V.; Uzzan, J.; Lupidi, M.; Coscas, G.; Souied, E.H. Optical coherence tomography angiography in retinal vein occlusion: Evaluation of superficial and deep capillary plexa. Am. J. Ophthalmol. 2016, 161, 160–171.e2. [Google Scholar] [CrossRef]
- Suzuki, N.; Hirano, Y.; Yoshida, M.; Tomiyasu, T.; Uemura, A.; Yasukawa, T.; Ogura, Y. Microvascular abnormalities on optical coherence tomography angiography in macular edema associated with branch retinal vein occlusion. Am. J. Ophthalmol. 2016, 161, 126–132.e1. [Google Scholar] [CrossRef] [PubMed]
- Kang, J.W.; Yoo, R.; Jo, Y.H.; Kim, H.C. Correlation of microvascular structures on optical coherence tomography angiography with visual acuity in retinal vein occlusion. Retina 2017, 37, 1700–1709. [Google Scholar] [CrossRef] [PubMed]
- Wang, Q.; Chan, S.Y.; Yan, Y.; Yang, J.; Zhou, W.; Jonas, J.B.; Wei, W.B. Optical coherence tomography angiography in retinal vein occlusions. Graefe’s Arch. Clin. Exp. Ophthalmol. 2018, 256, 1615–1622. [Google Scholar] [CrossRef] [PubMed]
- Suzuki, N.; Hirano, Y.; Tomiyasu, T.; Esaki, Y.; Uemura, A.; Yasukawa, T.; Yoshida, M.; Ogura, Y. Retinal hemodynamics seen on optical coherence tomography angiography before and after treatment of retinal vein occlusion. Investig. Ophthalmol. Vis. Sci. 2016, 57, 5681–5687. [Google Scholar] [CrossRef] [Green Version]
- Kimura, M.; Nozaki, M.; Yoshida, M.; Ogura, Y. Wide-field optical coherence tomography angiography using extended field imaging technique to evaluate the nonperfusion area in retinal vein occlusion. Clin. Ophthalmol. 2016, 10, 1291. [Google Scholar] [CrossRef] [Green Version]
- Cardoso, J.N.; Keane, P.A.; Sim, D.A.; Bradley, P.; Agrawal, R.; Addison, P.K.; Egan, C.; Tufail, A. Systematic evaluation of optical coherence tomography angiography in retinal vein occlusion. Am. J. Ophthalmol. 2016, 163, 93–107.e6. [Google Scholar] [CrossRef]
- Spaide, R.F.; Klancnik, J.M., Jr.; Cooney, M.J.; Yannuzzi, L.A.; Balaratnasingam, C.; Dansingani, K.K.; Suzuki, M. Volume-rendering optical coherence tomography angiography of macular telangiectasia type 2. Ophthalmology 2015, 122, 2261–2269. [Google Scholar] [CrossRef]
- Salles, M.C.; Kvanta, A.; Amrén, U.; Epstein, D. Optical coherence tomography angiography in central retinal vein occlusion: Correlation between the foveal avascular zone and visual acuity. Investig. Ophthalmol. Vis. Sci. 2016, 57, OCT242–OCT246. [Google Scholar] [CrossRef] [Green Version]
- Samara, W.A.; Shahlaee, A.; Sridhar, J.; Khan, M.A.; Ho, A.C.; Hsu, J. Quantitative optical coherence tomography angiography features and visual function in eyes with branch retinal vein occlusion. Am. J. Ophthalmol. 2016, 166, 76–83. [Google Scholar] [CrossRef]
- Winegarner, A.; Wakabayashi, T.; Fukushima, Y.; Sato, T.; Hara-Ueno, C.; Busch, C.; Nishiyama, I.; Shiraki, N.; Sayanagi, K.; Nishida, K. Changes in retinal microvasculature and visual acuity after antivascular endothelial growth factor therapy in retinal vein occlusion. Investig. Ophthalmol. Vis. Sci. 2018, 59, 2708–2716. [Google Scholar] [CrossRef]
- Ghashut, R.; Muraoka, Y.; Ooto, S.; Iida, Y.; Miwa, Y.; Suzuma, K.; Murakami, T.; Kadomoto, S.; Tsujikawa, A.; Yoshimura, N. Evaluation of macular ischemia in eyes with central retinal vein occlusion: An optical coherence tomography angiography study. Retina 2018, 38, 1571–1580. [Google Scholar] [CrossRef]
- Shiihara, H.; Terasaki, H.; Sonoda, S.; Kakiuchi, N.; Sakamoto, T. Evaluation of Shape of Foveal Avascular Zone by Optical Coherence Tomography Angiography in Eyes With Branch Retinal Vein Occlusion. J. Vitr. Dis. 2018, 2, 138–145. [Google Scholar] [CrossRef]
- Weinberg, D.V.; Wahle, A.E.; Ip, M.S.; Scott, I.U.; VanVeldhuisen, P.C.; Blodi, B.A.; Group, S.S.I. Score Study Report 12: Development of venous collaterals in the Score Study. Retina 2013, 33, 287. [Google Scholar] [CrossRef] [Green Version]
- Falavarjani, K.G.; Phasukkijwatana, N.; Freund, K.B.; Cunningham, E.T., Jr.; Kalevar, A.; McDonald, H.R.; Dolz-Marco, R.; Roberts, P.K.; Tsui, I.; Rosen, R. En face optical coherence tomography analysis to assess the spectrum of perivenular ischemia and paracentral acute middle maculopathy in retinal vein occlusion. Am. J. Ophthalmol. 2017, 177, 131–138. [Google Scholar] [CrossRef]
- Freund, K.B.; Sarraf, D.; Leong, B.C.; Garrity, S.T.; Vupparaboina, K.K.; Dansingani, K.K. Association of Optical Coherence Tomography Angiography of Collaterals in Retinal Vein Occlusion With Major Venous Outflow Through the Deep Vascular Complex. Jama Ophthalmol. 2018, 136, 1262–1270. [Google Scholar] [CrossRef]
- Arrigo, A.; Carnevali, A.; Sacconi, R.; Querques, L.; Querques, G.; Bandello, F. Spontaneous retinal-choroidal anastomosis in a case of branch retinal vein occlusion. Am. J. Ophthalmol. Case Rep. 2018, 11, 92–94. [Google Scholar] [CrossRef]
- Suzuki, N.; Hirano, Y.; Tomiyasu, T.; Kurobe, R.; Yasuda, Y.; Esaki, Y.; Yasukawa, T.; Yoshida, M.; Ogura, Y. Collateral vessels on optical coherence tomography angiography in eyes with branch retinal vein occlusion. Br. J. Ophthalmol. 2018, 103, 1373–1379. [Google Scholar] [CrossRef]
- Campochiaro, P.A.; Brown, D.M.; Awh, C.C.; Lee, S.Y.; Gray, S.; Saroj, N.; Murahashi, W.Y.; Rubio, R.G. Sustained benefits from ranibizumab for macular edema following central retinal vein occlusion: Twelve-month outcomes of a phase III study. Ophthalmology 2011, 118, 2041–2049. [Google Scholar] [CrossRef]
- Spaide, R.F. Volume-rendered optical coherence tomography of retinal vein occlusion pilot study. Am. J. Ophthalmol. 2016, 165, 133–144. [Google Scholar] [CrossRef]
- Falavarjani, K.G.; Iafe, N.A.; Hubschman, J.P.; Tsui, I.; Sadda, S.R.; Sarraf, D. Optical coherence tomography angiography analysis of the foveal avascular zone and macular vessel density after anti-VEGF therapy in eyes with diabetic macular edema and retinal vein occlusion. Investig. Ophthalmol. Vis. Sci. 2017, 58, 30–34. [Google Scholar] [CrossRef]
- Winegarner, A.; Wakabayashi, T.; Hara-Ueno, C.; Sato, T.; Busch, C.; Fukushima, Y.; Sayanagi, K.; Nishida, K.; Sakaguchi, H.; Nishida, K. Retinal microvasculature and visual acuity after intravitreal aflibercept in eyes with central retinal vein occlusion: An optical coherence tomography angiography study. Retina 2018, 38, 2067–2072. [Google Scholar] [CrossRef]
- Hayreh, S.S. Acute retinal arterial occlusive disorders. Prog. Retin. Eye Res. 2011, 30, 359–394. [Google Scholar] [CrossRef] [Green Version]
- Yu, S.; Pang, C.E.; Gong, Y.; Freund, K.B.; Yannuzzi, L.A.; Rahimy, E.; Lujan, B.J.; Tabandeh, H.; Cooney, M.J.; Sarraf, D.J. The spectrum of superficial and deep capillary ischemia in retinal artery occlusion. Am. J. Ophthalmol. 2015, 159, 53–63.e2. [Google Scholar] [CrossRef]
- De Castro-Abeger, A.H.; de Carlo, T.E.; Duker, J.S.; Baumal, C.R. Optical coherence tomography angiography compared to fluorescein angiography in branch retinal artery occlusion. Ophthalmic Surg. Lasers Imaging Retin. 2015, 46, 1052–1054. [Google Scholar] [CrossRef]
- Bonini Filho, M.A.; Adhi, M.; Talisa, E.; Ferrara, D.; Baumal, C.R.; Witkin, A.J.; Reichel, E.; Kuehlewein, L.; Sadda, S.R.; Sarraf, D.J.R. Optical coherence tomography angiography in retinal artery occlusion. Retina 2015, 35, 2339–2346. [Google Scholar] [CrossRef]
- Mason, J.O., III; Patel, S.A.; Feist, R.M.; Albert, M.A., Jr.; Huisingh, C.; McGwin, G., Jr.; Thomley, M.L. Ocular neovascularization in eyes with a central retinal artery occlusion or a branch retinal artery occlusion. Clin. Ophthalmol. 2015, 9, 995. [Google Scholar] [CrossRef] [Green Version]
- Bourne, R.R.; Stevens, G.A.; White, R.A.; Smith, J.L.; Flaxman, S.R.; Price, H.; Jonas, J.B.; Keeffe, J.; Leasher, J.; Naidoo, K. Causes of vision loss worldwide, 1990–2010: A systematic analysis. Lancet Glob. Health 2013, 1, e339–e349. [Google Scholar] [CrossRef] [Green Version]
- Weinreb, R.N.; Khaw, P.T. Primary open-angle glaucoma. Lancet 2004, 363, 1711–1720. [Google Scholar] [CrossRef]
- Leske, M.C.; Heijl, A.; Hyman, L.; Bengtsson, B.; Dong, L.; Yang, Z.; Group, E. Predictors of long-term progression in the early manifest glaucoma trial. Ophthalmology 2007, 114, 1965–1972. [Google Scholar] [CrossRef] [PubMed]
- Flammer, J.; Orgül, S.; Costa, V.P.; Orzalesi, N.; Krieglstein, G.K.; Serra, L.M.; Renard, J.P.; Stefánsson, E. The impact of ocular blood flow in glaucoma. Prog. Retin. Eye Res. 2002, 21, 359–393. [Google Scholar] [CrossRef]
- Liu, L.; Jia, Y.; Takusagawa, H.L.; Pechauer, A.D.; Edmunds, B.; Lombardi, L.; Davis, E.; Morrison, J.C.; Huang, D. Optical coherence tomography angiography of the peripapillary retina in glaucoma. JAMA Ophthalmol. 2015, 133, 1045–1052. [Google Scholar] [CrossRef] [PubMed]
- Jia, Y.; Wei, E.; Wang, X.; Zhang, X.; Morrison, J.C.; Parikh, M.; Lombardi, L.H.; Gattey, D.M.; Armour, R.L.; Edmunds, B. Optical coherence tomography angiography of optic disc perfusion in glaucoma. Ophthalmology 2014, 121, 1322–1332. [Google Scholar] [CrossRef] [PubMed] [Green Version]
- Yarmohammadi, A.; Zangwill, L.M.; Diniz-Filho, A.; Suh, M.H.; Manalastas, P.I.; Fatehee, N.; Yousefi, S.; Belghith, A.; Saunders, L.J.; Medeiros, F.A. Optical coherence tomography angiography vessel density in healthy, glaucoma suspect, and glaucoma eyes. Investig. Ophthalmol. Vis. Sci. 2016, 57, OCT451–OCT459. [Google Scholar] [CrossRef]
- Wang, X.; Jiang, C.; Ko, T.; Kong, X.; Yu, X.; Min, W.; Shi, G.; Sun, X. Correlation between optic disc perfusion and glaucomatous severity in patients with open-angle glaucoma: An optical coherence tomography angiography study. Graefe’s Arch. Clin. Exp. Ophthalmol. 2015, 253, 1557–1564. [Google Scholar] [CrossRef] [PubMed]
- Yip, V.C.; Wong, H.T.; Yong, V.K.; Lim, B.A.; Hee, O.K.; Cheng, J.; Fu, H.; Lim, C.; Tay, E.L.; Loo-Valdez, R.G. Optical Coherence Tomography Angiography of Optic Disc and Macula Vessel Density in Glaucoma and Healthy Eyes. J. Glaucoma 2019, 28, 80–87. [Google Scholar] [CrossRef] [PubMed]
- Moghimi, S.; Zangwill, L.M.; Penteado, R.C.; Hasenstab, K.; Ghahari, E.; Hou, H.; Christopher, M.; Yarmohammadi, A.; Manalastas, P.I.C.; Shoji, T. Macular and optic nerve head vessel density and progressive retinal nerve fiber layer loss in glaucoma. Ophthalmology 2018, 125, 1720–1728. [Google Scholar] [CrossRef] [PubMed] [Green Version]
- Yarmohammadi, A.; Zangwill, L.M.; Diniz-Filho, A.; Suh, M.H.; Yousefi, S.; Saunders, L.J.; Belghith, A.; Manalastas, P.I.C.; Medeiros, F.A.; Weinreb, R.N. Relationship between optical coherence tomography angiography vessel density and severity of visual field loss in glaucoma. Ophthalmology 2016, 123, 2498–2508. [Google Scholar] [CrossRef] [Green Version]
- Mammo, Z.; Heisler, M.; Balaratnasingam, C.; Lee, S.; Yu, D.Y.; Mackenzie, P.; Schendel, S.; Merkur, A.; Kirker, A.; Albiani, D. Quantitative optical coherence tomography angiography of radial peripapillary capillaries in glaucoma, glaucoma suspect, and normal eyes. Am. J. Ophthalmol. 2016, 170, 41–49. [Google Scholar] [CrossRef] [Green Version]
- Akagi, T.; Iida, Y.; Nakanishi, H.; Terada, N.; Morooka, S.; Yamada, H.; Hasegawa, T.; Yokota, S.; Yoshikawa, M.; Yoshimura, N. Microvascular density in glaucomatous eyes with hemifield visual field defects: An optical coherence tomography angiography study. Am. J. Ophthalmol. 2016, 168, 237–249. [Google Scholar] [CrossRef]
- Suwan, Y.; Geyman, L.S.; Fard, M.A.; Tantraworasin, A.; Chui, T.Y.; Rosen, R.B.; Ritch, R. Peripapillary Perfused Capillary Density in Exfoliation Syndrome and Exfoliation Glaucoma versus POAG and Healthy Controls: An OCTA Study. Asia Pac. J. Ophthalmol. 2018, 7, 84–89. [Google Scholar]
- Scripsema, N.K.; Garcia, P.M.; Bavier, R.D.; Chui, T.Y.; Krawitz, B.D.; Mo, S.; Agemy, S.A.; Xu, L.; Lin, Y.B.; Panarelli, J.F. Optical coherence tomography angiography analysis of perfused peripapillary capillaries in primary open-angle glaucoma and normal-tension glaucoma. Investig. Ophthalmol. Vis. Sci. 2016, 57, OCT611–OCT620. [Google Scholar] [CrossRef]
- Suh, M.H.; Zangwill, L.M.; Manalastas, P.I.C.; Belghith, A.; Yarmohammadi, A.; Medeiros, F.A.; Diniz-Filho, A.; Saunders, L.J.; Yousefi, S.; Weinreb, R.N. Optical coherence tomography angiography vessel density in glaucomatous eyes with focal lamina cribrosa defects. Ophthalmology 2016, 123, 2309–2317. [Google Scholar] [CrossRef] [Green Version]
- Yarmohammadi, A.; Zangwill, L.M.; Diniz-Filho, A.; Saunders, L.J.; Suh, M.H.; Wu, Z.; Manalastas, P.I.C.; Akagi, T.; Medeiros, F.A.; Weinreb, R.N. Peripapillary and macular vessel density in patients with glaucoma and single-hemifield visual field defect. Ophthalmology 2017, 124, 709–719. [Google Scholar] [CrossRef] [Green Version]
- Shoji, T.; Zangwill, L.M.; Akagi, T.; Saunders, L.J.; Yarmohammadi, A.; Manalastas, P.I.C.; Penteado, R.C.; Weinreb, R.N. Progressive macula vessel density loss in primary open-angle glaucoma: A longitudinal study. Am. J. Ophthalmol. 2017, 182, 107–117. [Google Scholar] [CrossRef]
- Takusagawa, H.L.; Liu, L.; Ma, K.N.; Jia, Y.; Gao, S.S.; Zhang, M.; Edmunds, B.; Parikh, M.; Tehrani, S.; Morrison, J.C. Projection-resolved optical coherence tomography angiography of macular retinal circulation in glaucoma. Ophthalmology 2017, 124, 1589–1599. [Google Scholar] [CrossRef]
- Akil, H.; Huang, A.S.; Francis, B.A.; Sadda, S.R.; Chopra, V. Retinal vessel density from optical coherence tomography angiography to differentiate early glaucoma, pre-perimetric glaucoma and normal eyes. PLoS ONE 2017, 12, e0170476. [Google Scholar] [CrossRef]
- Rao, H.L.; Pradhan, Z.S.; Weinreb, R.N.; Reddy, H.B.; Riyazuddin, M.; Dasari, S.; Palakurthy, M.; Puttaiah, N.K.; Rao, D.A.; Webers, C.A. Regional comparisons of optical coherence tomography angiography vessel density in primary open-angle glaucoma. Am. J. Ophthalmol. 2016, 171, 75–83. [Google Scholar] [CrossRef]
- Venugopal, J.P.; Rao, H.L.; Weinreb, R.N.; Pradhan, Z.S.; Dasari, S.; Riyazuddin, M.; Puttiah, N.K.; Rao, D.A.; Devi, S.; Mansouri, K. Repeatability of vessel density measurements of optical coherence tomography angiography in normal and glaucoma eyes. Br. J. Ophthalmol. 2018, 102, 352–357. [Google Scholar] [CrossRef]
- Rao, H.L.; Sreenivasaiah, S.; Dixit, S.; Riyazuddin, M.; Dasari, S.; Venugopal, J.P.; Pradhan, Z.S.; Puttaiah, N.K.; Devi, S.; Mansouri, K. Choroidal Microvascular Dropout in Primary Open-angle Glaucoma Eyes with Disc Hemorrhage. J. Glaucoma 2018, 28, 181–187. [Google Scholar] [CrossRef]
- Jung, J.H.; Park, J.H.; Yoo, C.; Kim, Y.Y. Localized retinal nerve Fiber layer defects in red-free photographs versus en face structural optical coherence tomography images. J. Glaucoma 2018, 27, 269–274. [Google Scholar] [CrossRef]
- Hayreh, S. Ischaemic optic neuropathy. Indian J. Ophthalmol. 2000, 48, 171. [Google Scholar] [PubMed]
- Arnold, A.C. The 14th Hoyt Lecture: Ischemic Optic Neuropathy The Evolving Profile, 1966–2015. J. Neuro Ophthalmol. 2016, 36, 208–215. [Google Scholar] [CrossRef] [PubMed]
- Hayreh, S.S. Management of ischemic optic neuropathies. Indian J. Ophthalmol. 2011, 59, 123. [Google Scholar] [CrossRef] [PubMed]
- Cestari, D.M.; Gaier, E.D.; Bouzika, P.; Blachley, T.S.; De Lott, L.B.; Rizzo, J.F.; Wiggs, J.L.; Kang, J.H.; Pasquale, L.R.; Stein, J.D. Demographic, systemic, and ocular factors associated with nonarteritic anterior ischemic optic neuropathy. Ophthalmology 2016, 123, 2446–2455. [Google Scholar] [CrossRef]
- Balducci, N.; Morara, M.; Veronese, C.; Barboni, P.; Casadei, N.L.; Savini, G.; Parisi, V.; Sadun, A.A.; Ciardella, A. Optical coherence tomography angiography in acute arteritic and non-arteritic anterior ischemic optic neuropathy. Graefe’s Arch. Clin. Exp. Ophthalmol. 2017, 255, 2255–2261. [Google Scholar] [CrossRef]
- Ling, J.W.; Yin, X.; Lu, Q.Y.; Chen, Y.Y.; Lu, P.R. Optical coherence tomography angiography of optic disc perfusion in non-arteritic anterior ischemic optic neuropathy. Int. J. Ophthalmol. 2017, 10, 1402. [Google Scholar]
- Song, Y.; Min, J.; Mao, L.; Gong, Y. Microvasculature dropout detected by the optical coherence tomography angiography in nonarteritic anterior ischemic optic neuropathy. Lasers Surg. Med. 2018, 50, 194–201. [Google Scholar] [CrossRef]
- Mayes, E.W.; Cole, E.D.; Dang, S.; Novais, E.A.; Vuong, L.; Mendoza-Santiesteban, C.; Duker, J.S.; Hedges, T.R., III. Optical coherence tomography angiography in nonarteritic anterior ischemic optic neuropathy. J. Neuro Ophthalmol. 2017, 37, 358–364. [Google Scholar] [CrossRef]
- Augstburger, E.; Zéboulon, P.; Keilani, C.; Baudouin, C.; Labbé, A. Retinal and choroidal microvasculature in nonarteritic anterior ischemic optic neuropathy: An optical coherence tomography angiography study. Investig. Ophthalmol. Vis. Sci. 2018, 59, 870–877. [Google Scholar] [CrossRef]
- Sharma, S.; Ang, M.; Najjar, R.P.; Sng, C.; Cheung, C.Y.; Rukmini, A.V.; Schmetterer, L.; Milea, D. Optical coherence tomography angiography in acute non-arteritic anterior ischaemic optic neuropathy. Br. J. Ophthalmol. 2017, 101, 1045–1051. [Google Scholar] [CrossRef]
- Mase, T.; Ishibazawa, A.; Nagaoka, T.; Yokota, H.; Yoshida, A. Radial peripapillary capillary network visualized using wide-field montage optical coherence tomography angiography. Investig. Ophthalmol. Vis. Sci. 2016, 57, OCT504–OCT510. [Google Scholar] [CrossRef] [Green Version]
- You, Q.S.; Guo, Y.; Wang, J.; Wei, X.; Camino, A.; Zang, P.; Flaxel, C.J.; Bailey, S.T.; Huang, D.; Jia, Y.; et al. Detection of clinically unsuspected retinal neovascularization with wide-field optical coherence tomography angiography. Retina 2019, 40, 891–897. [Google Scholar] [CrossRef]
- Zhang, Q.; Lee, C.S.; Chao, J.; Chen, C.L.; Zhang, T.; Sharma, U.; Zhang, A.; Liu, J.; Rezaei, K.; Pepple, K.L. Wide-field optical coherence tomography based microangiography for retinal imaging. Sci. Rep. 2016, 6, 22017. [Google Scholar] [CrossRef]
- Hirano, T.; Kakihara, S.; Toriyama, Y.; Nittala, M.G.; Murata, T.; Sadda, S. Wide-field en face swept-source optical coherence tomography angiography using extended field imaging in diabetic retinopathy. Br. J. Ophthalmol. 2018, 102, 1199–1203. [Google Scholar] [CrossRef]
- Jia, Y.; Tan, O.; Tokayer, J.; Potsaid, B.; Wang, Y.; Liu, J.J.; Kraus, M.F.; Subhash, H.; Fujimoto, J.G.; Hornegger, J. Split-spectrum amplitude-decorrelation angiography with optical coherence tomography. Opt. Express 2012, 20, 4710–4725. [Google Scholar] [CrossRef] [Green Version]
- Falavarjani, K.G.; Al-Sheikh, M.; Akil, H.; Sadda, S.R. Image artefacts in swept-source optical coherence tomography angiography. Br. J. Ophthalmol. 2017, 101, 564–568. [Google Scholar] [CrossRef]
- Spaide, R.F.; Fujimoto, J.G.; Waheed, N.K. Image artifacts in optical coherence angiography. Retina 2015, 35, 2163. [Google Scholar] [CrossRef]
- Camino, A.; Zhang, M.; Gao, S.S.; Hwang, T.S.; Sharma, U.; Wilson, D.J.; Huang, D.; Jia, Y. Evaluation of artifact reduction in optical coherence tomography angiography with real-time tracking and motion correction technology. Biomed. Opt. Express 2016, 7, 3905–3915. [Google Scholar] [CrossRef]
- Akil, H.; Falavarjani, K.G.; Sadda, S.R.; Sadun, A.A. Optical coherence tomography angiography of the optic disc: An overview. J. Ophthalmic Vis. Res. 2017, 12, 98. [Google Scholar]


| Study | No. of Patients | Age | SCP-FAZ | SCP-FAZ | DCP-FAZ | DCP-FAZ |
|---|---|---|---|---|---|---|
| (Control) () | (DR) () | (Control) () | (DR) () | |||
| Takase et al. [34] | 20 | |||||
| Salz et al. [20] | 11 | |||||
| Suzuki et al. [35] | 13 | |||||
| Dupas et al. [36] | 22 |
| Study | No. of Patients | Age | SCP-VD | SCP-VD | DCP-VD | DCP-VD |
|---|---|---|---|---|---|---|
| (Control) () | (DR) () | (Control) () | (DR) () | |||
| Zahid et al. [47] | 13 | |||||
| Dupas et al. [36] | 22 | |||||
| Shen et al. [48] | 49 |
Publisher’s Note: MDPI stays neutral with regard to jurisdictional claims in published maps and institutional affiliations. |
© 2021 by the authors. Licensee MDPI, Basel, Switzerland. This article is an open access article distributed under the terms and conditions of the Creative Commons Attribution (CC BY) license (https://creativecommons.org/licenses/by/4.0/).
Share and Cite
Taher, F.; Kandil, H.; Mahmoud, H.; Mahmoud, A.; Shalaby, A.; Ghazal, M.; Alhalabi, M.T.; Sandhu, H.S.; El-Baz, A. A Comprehensive Review of Retinal Vascular and Optical Nerve Diseases Based on Optical Coherence Tomography Angiography. Appl. Sci. 2021, 11, 4158. https://doi.org/10.3390/app11094158
Taher F, Kandil H, Mahmoud H, Mahmoud A, Shalaby A, Ghazal M, Alhalabi MT, Sandhu HS, El-Baz A. A Comprehensive Review of Retinal Vascular and Optical Nerve Diseases Based on Optical Coherence Tomography Angiography. Applied Sciences. 2021; 11(9):4158. https://doi.org/10.3390/app11094158
Chicago/Turabian StyleTaher, Fatma, Heba Kandil, Hatem Mahmoud, Ali Mahmoud, Ahmed Shalaby, Mohammed Ghazal, Marah Talal Alhalabi, Harpal Singh Sandhu, and Ayman El-Baz. 2021. "A Comprehensive Review of Retinal Vascular and Optical Nerve Diseases Based on Optical Coherence Tomography Angiography" Applied Sciences 11, no. 9: 4158. https://doi.org/10.3390/app11094158