
Intra-System Reliability Assessment of 2-Dimensional Shear Wave Elastography
by
 , , and
Christopher Edwards
1,2,3 ,
,
Erika Cavanagh
1,2,3,
Sailesh Kumar
2,4,
Vicki Clifton
2,4 and
Davide Fontanarosa
1,3,* 1
Faculty of Health, School of Clinical Sciences, Queensland University of Technology, Brisbane, QLD 4000, Australia
2
Mater Research Institute-University of Queensland, Level 3 Aubigny Place, Raymond Terrace, South Brisbane, QLD 4000, Australia
3
Centre for Biomedical Technologies, Queensland University of Technology, Brisbane, QLD 4000, Australia
4
Faculty of Medicine, The University of Queensland, Herston, QLD 4006, Australia
*
Author to whom correspondence should be addressed.
Appl. Sci. 2021, 11(7), 2992; https://doi.org/10.3390/app11072992
Submission received: 1 March 2021
/
Revised: 22 March 2021
/
Accepted: 24 March 2021
/
Published: 26 March 2021
(This article belongs to the Special Issue Innovations in Ultrasound Imaging for Medical Diagnosis)
Abstract
:The availability of 2-Dimensional Shear Wave Elastography (2D-SWE) technology on modern medical ultrasound systems is becoming increasingly common. The technology is now being used to investigate a range of soft tissues and related pathological conditions. This work investigated the reliability of a single commercial 2D-SWE system using a tissue-mimicking elastography phantom to understand the major causes of intra-system variability. Sources of shear wave velocity (SWV) measurement variability relates to imaging depth, target stiffness, sampling technique and the operator. Higher SWV measurement variability was evident with increasing depth and stiffness of the phantom targets. The influence of the operator was minimal, and variations in sampling technique had little impact on the SWV.
1. Introduction
Ultrasound based elastography techniques can be applied to investigate a range of clinical scenarios, with several different technologies currently available on various commercial ultrasound systems. Shear Wave Elastography (SWE) involves the generation of shear waves propagating perpendicularly from the main axis of the ultrasound beam, the speed of which is linked to the tissue’s elastic modulus [1]. One technique [2-Dimensional Shear Wave Elastography (2D-SWE)], generates these shear waves by applying multiple transducer-generated acoustic force pulses to create a two-dimensional parametric colour map of tissue stiffness. The operator is then able to “sample” areas within this colour map using proprietary software to obtain quantitative measurements of tissue elasticity by measuring the shear wave velocity (SWV). An advantage of 2D-SWE is that the elasticity profile of a larger section of tissue can be evaluated with a single acquisition [2]. By measuring the velocity of these lateral shear waves and comparing measurements from normal and pathological tissue, researchers can detect or monitor disease progression [3,4,5,6,7,8].
Like other ultrasound-based quantitative techniques such as Doppler flow analysis, 2D-SWE is susceptible to measurement variability which is unrelated to intrinsic physiological conditions. SWV measurements can be influenced by variations in imaging conditions such as sampling depth [9], presence of acoustic artifacts [10] or operator relevant errors in technique [11]. In addition, the use of different elastography sono-platforms has also been shown to introduce considerable variability in measurements [12,13,14,15]. A reliable measurement is one in which the variability between repeated measurements remains within a clinically acceptable limit [16]. Such a limit provides confidence that measurements can differentiate between normal and pathological conditions. Although several studies have investigated the reliability of ultrasound derived elastography measurements [9,12,13,14,15,17,18,19], there is limited published data for 2D-SWE systems and a lack of universally agreed-upon reliability criteria for this system [20].
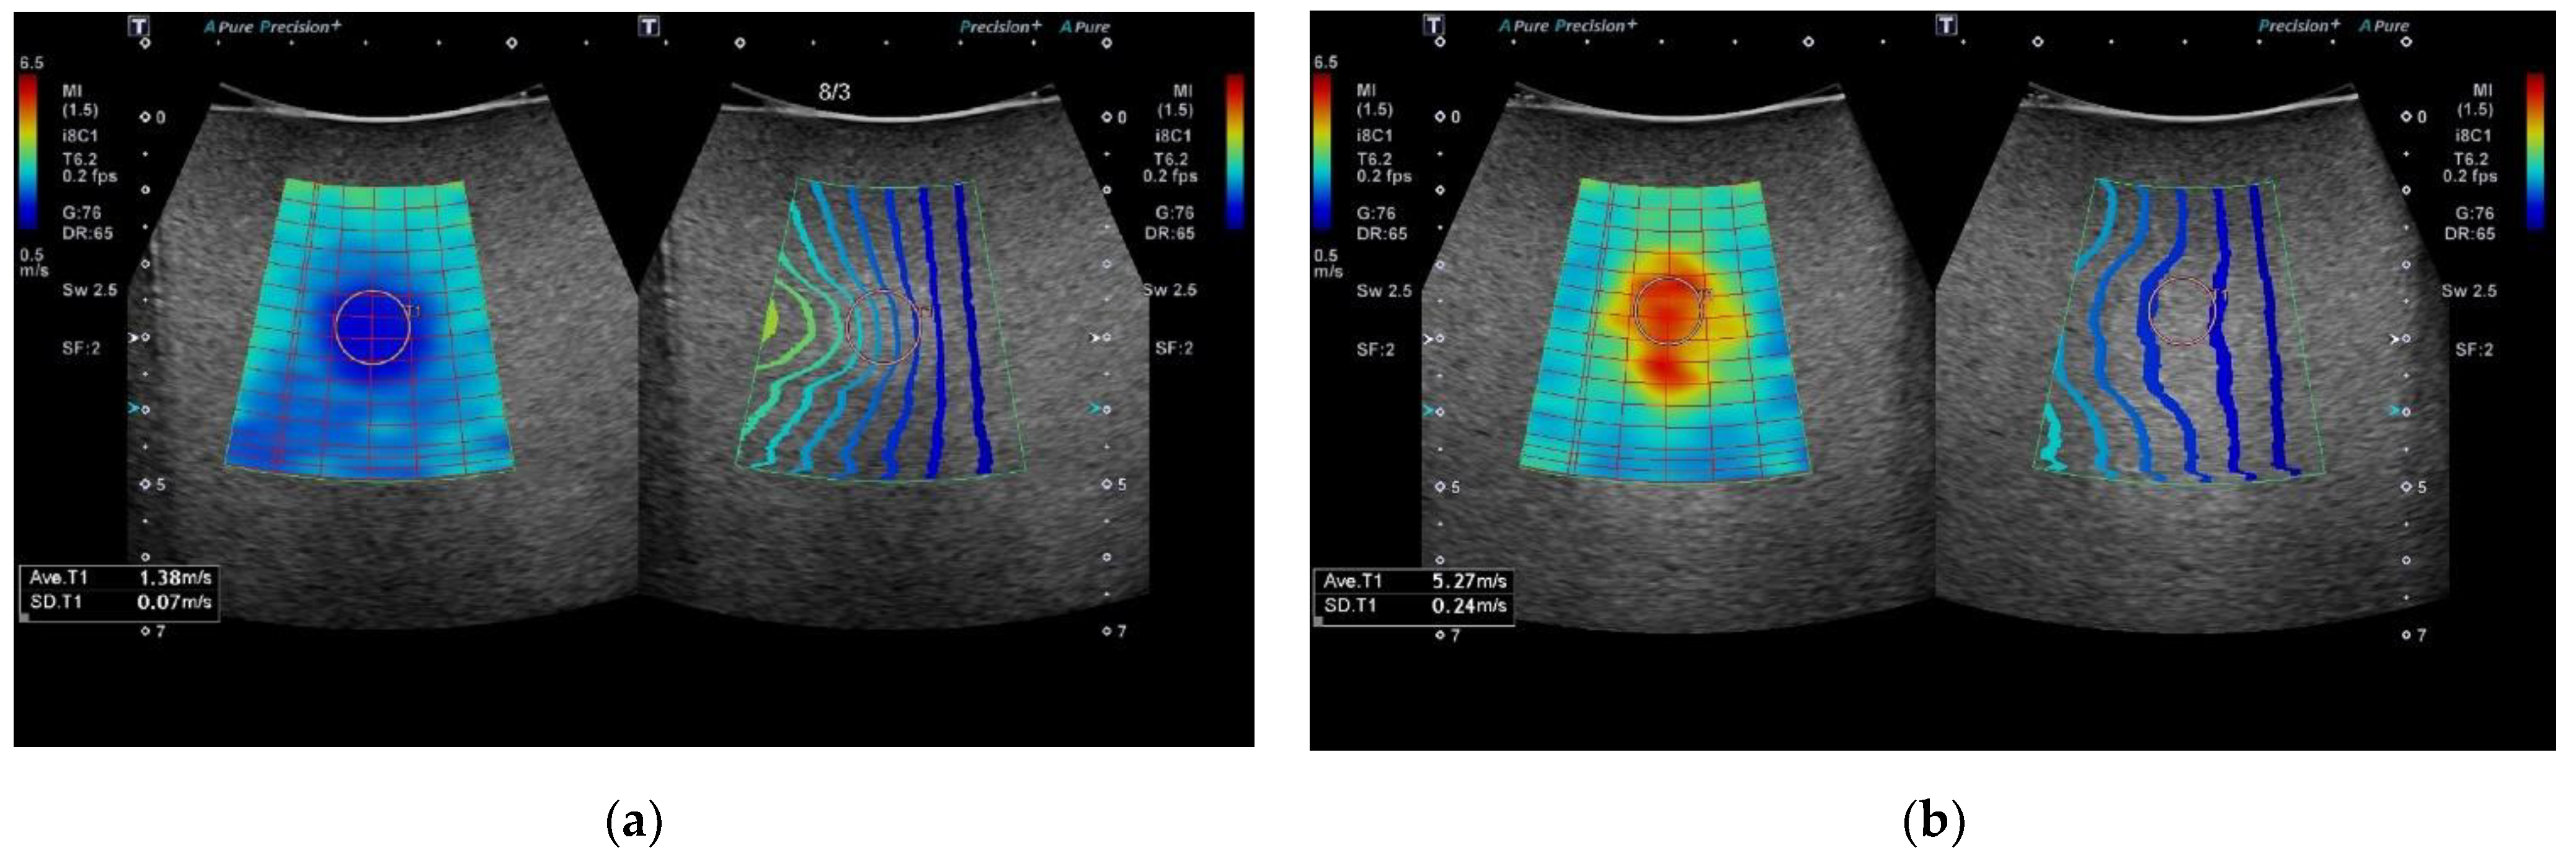
Modern 2D-SWE systems now incorporate software tools to assist operators to visually assess the stability of the acquired SWV and to inform them of the ideal placement of the sampling region of interest (ROI) box [21]. Alongside a 2D colour-coded map of tissue stiffness, a novel approach provided by some manufacturers is the addition of a “propagation contour map” (Figure 1), which uses a series of contour lines to depict shear wave arrival times at different anatomical points in the tissue being assessed [22,23]. Regions in the image displaying parallel contour lines indicate shear waves are propagating smoothly with minimum variability [21]. These two images provide complementary information designed to produce a visual indicator of the best acquisitions to select for quantitative analysis and to optimise the placement of the ROI sampling box in an area free of significant artefacts. Operators utilising 2D-SWE technology need to have confidence that any derived measurements are a true representation of the tissue being sampled and have a good understanding of the factors that can introduce variability. Thus allowing them to take steps to minimise these at the time of imaging.
This study aimed to investigate the reliability of a modern 2D-SWE system using a tissue-mimicking elastography phantom to identify the major causes of intra-system variability. The evaluation includes an analysis of the sources of SWV measurement variability, as they relate to imaging depth, target stiffness, sampling technique and the operator.
2. Materials and Methods
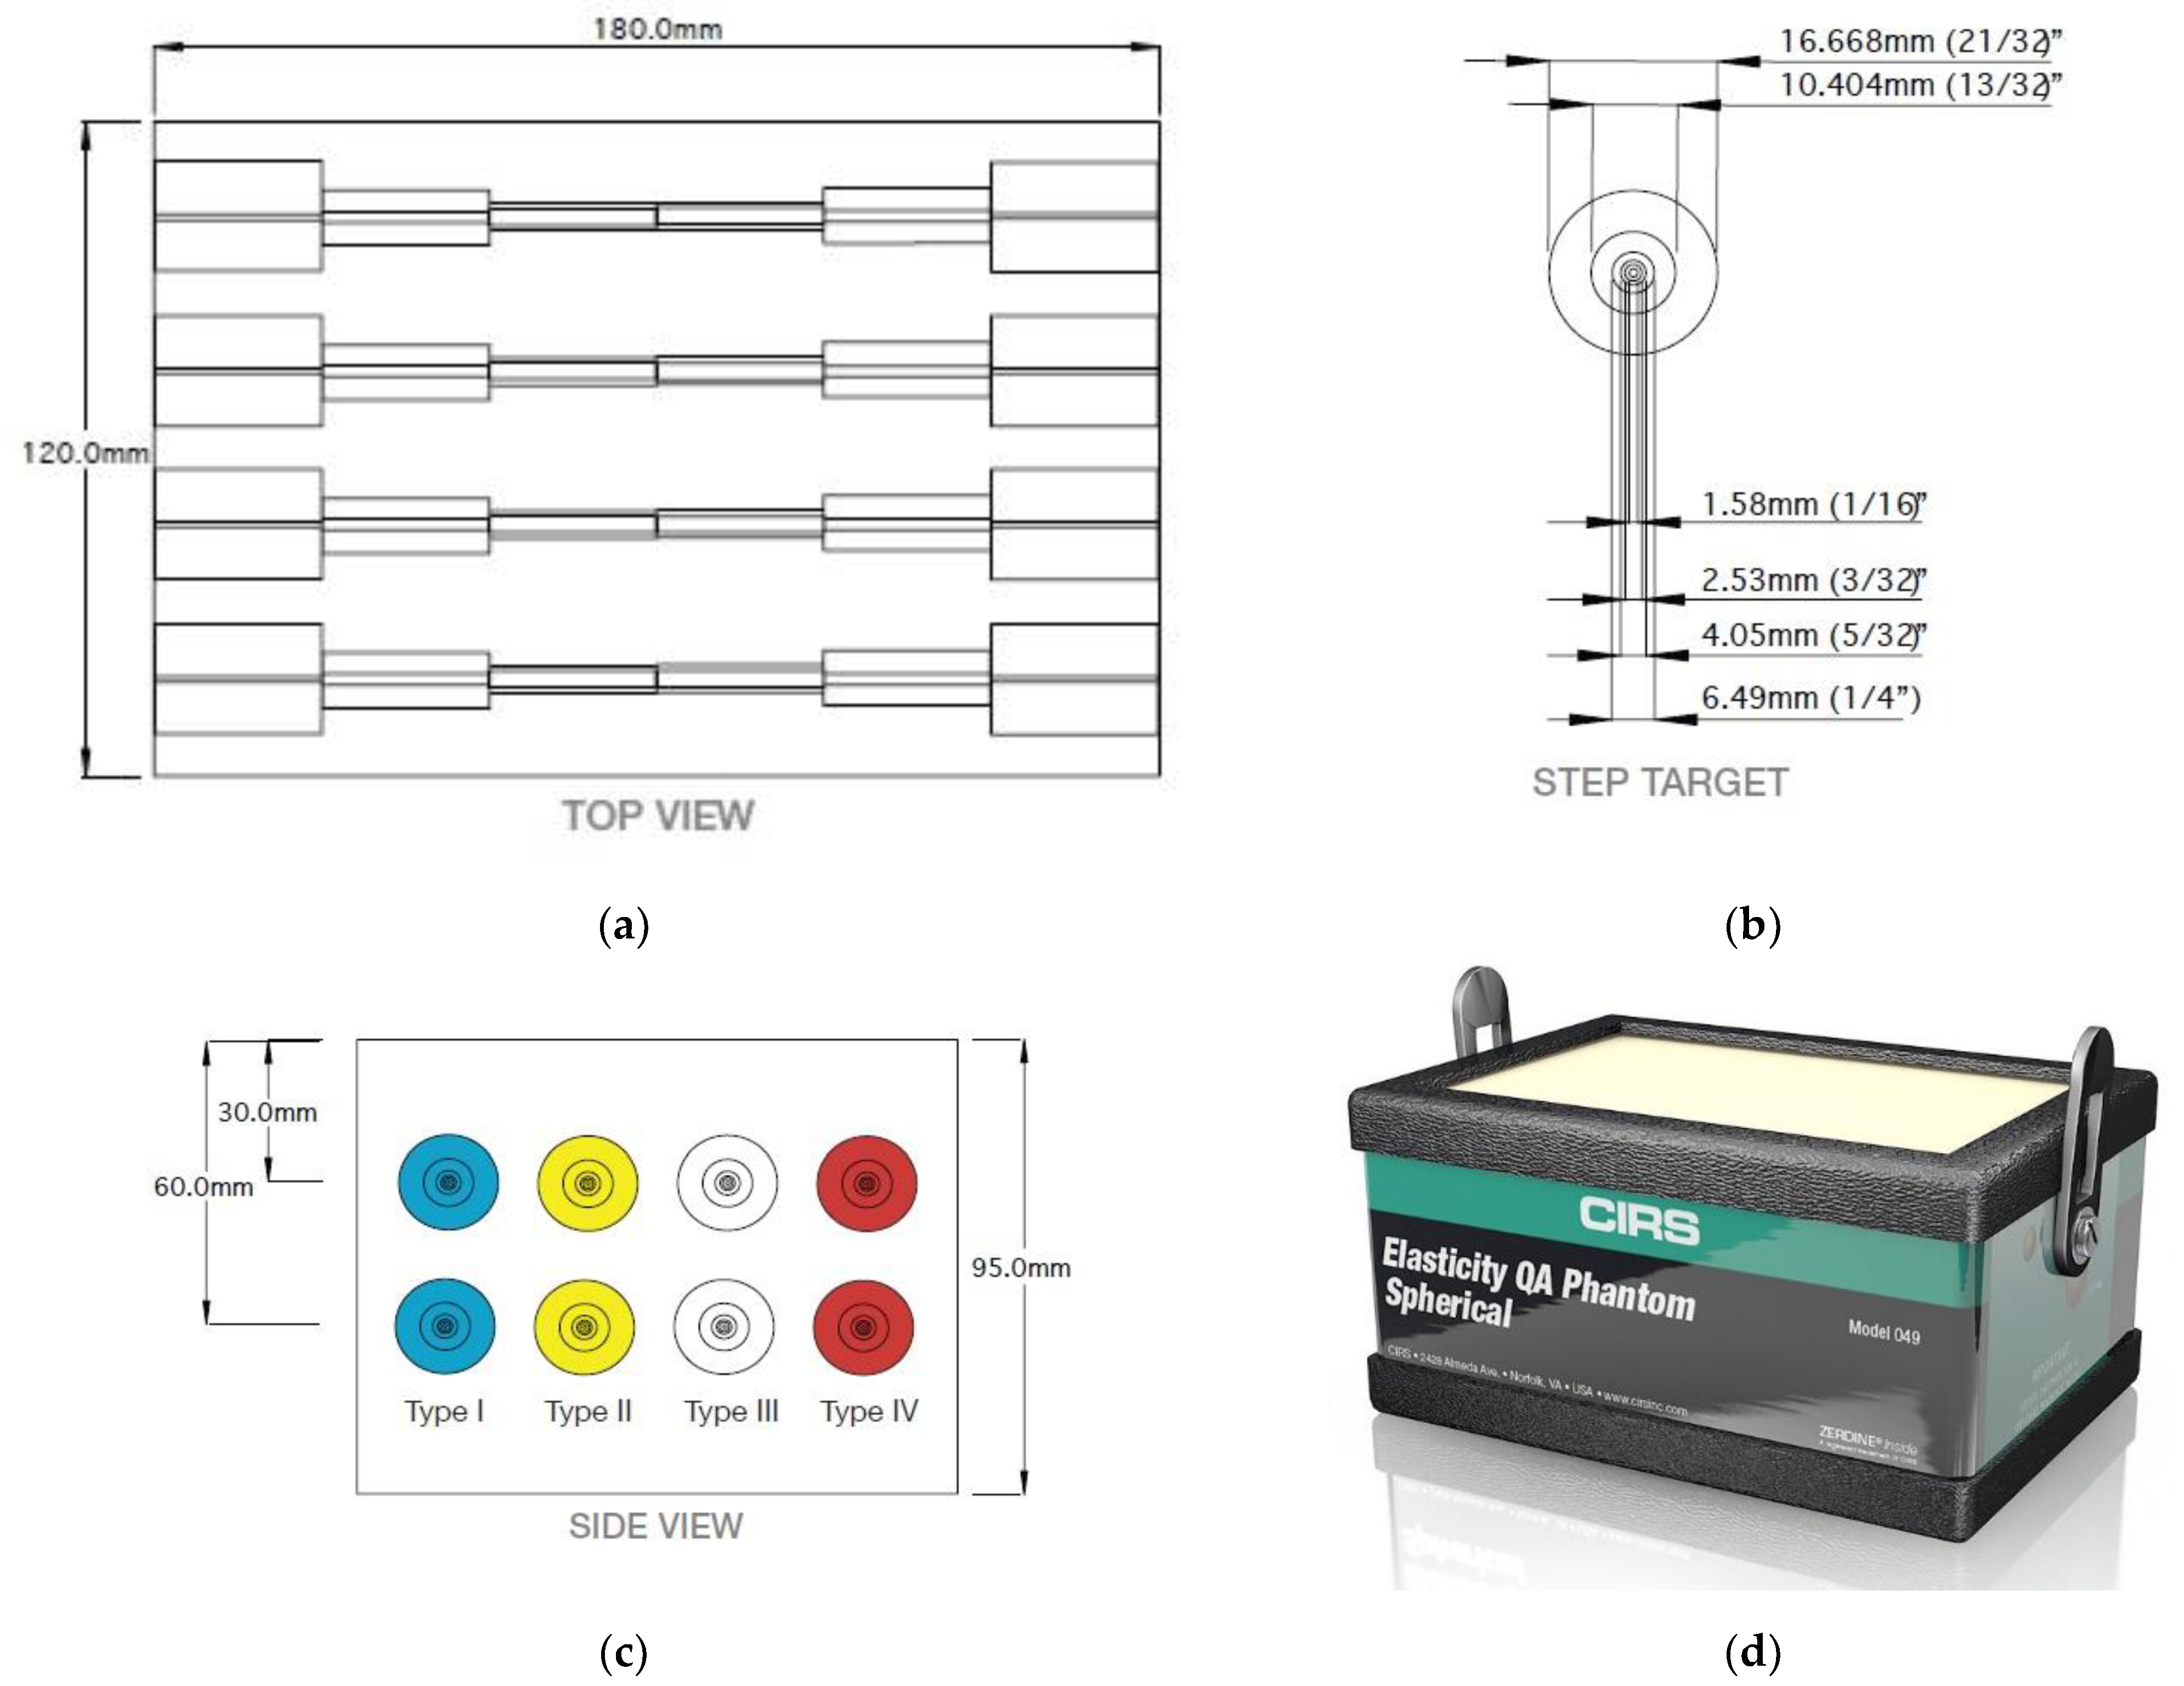
This study utilised a model 049A human tissue mimicking quality assurance elastography phantom produced by Computerized Imaging Reference Systems, Inc., Norfolk, VA, USA (CIRS) made from Zerdine®, a poly-acrylamide polymer [24] (Figure 2). This phantom has acoustic properties comparable to human tissue, with a reported acoustic velocity of 1540 m/s ± 10 m/s and an attenuation coefficient of 0.5 dB·cm−1·MHz−1 [25]. Zerdine® phantoms from CIRS have been validated and have demonstrated adequate homogeneity and low viscosity levels [9,18,26]. Other investigations using tissues mimicking phantoms have shown that ultrasound frequencies used in the MHz range can be translated in vivo [27,28].
The phantom contains a series of eight cylindrical tubes which taper from 16.7 mm to 1.6 mm at set intervals from one end of the phantom to the other. Each tube provides an imaging target containing one of four known elasticity values, Type 1 (10 kPa), Type II (17 kPa) Type III (47 kPa) and Type IV (85 kPa). These targets offer a range of elasticity values dependent on the clinical area of interest. Current machine dependent reference ranges for the liver, report values <7 kPa for normal tissue and >17 kPa for advanced fibrosis [2]. Elastography studies of the breast have demonstrated values between 30 and 50 kPa for normal parenchymal tissue and much higher values in malignant breast lesions [29]. The four targets are located at 3 cm and repeated at 6 cm depth. The background medium surrounding the targets can be sampled and has a known elasticity of 25 kPa. The largest diameter (16.7 mm) was chosen to limit the potential for shear wave refraction at the target boundary [30] and to accommodate the sampling ROI.
SWV measurements were performed using a Canon Aplio i-series 600 machine (Canon Medical, Otawara-shi, Japan) with a curved 8C1 probe. The system can make the conversion of SWV to Young’s modulus E (kPa) using the equation E = 3ρ(SWV)2. This equation assumes the tissue density is equal to water (ρ = 1 g/cm−3), and that the relationship between Young’s modulus and shear modulus (G) is E ≈ 3 G, which occurs for incompressible materials having a Poisson’s ratio of 0.5. Soft tissue is often regarded as incompressible [30]. In this study, we chose not to convert the machine measured values of SWV to kPa to focus on the sources of intra-system variability as they applied to SWV. Elastography guidelines recommend reporting values in SWV, as this is the quantity measured by the machine and the conversion to kPa relies on a range of assumptions, which can introduce additional errors [21,31].
Elastography samples were acquired using the system’s single-shot method, which activates a 2.5 MHz acoustic radiation force pulse over a single frame. SWV measurements were independently performed by 2 experienced Sonographers (CE and EC), each with over 15 years of ultrasound experience, and 1 less experienced practitioner (AJ) to evaluate the potential of a training effect.
To ensure the distribution of the sample means from each operator were approximately normally distributed and to conduct parametric tests, 30 consecutive SWV measurements were obtained from each phantom target and background [32]. SWV measurements were repeated at two available depths 3 cm and 6 cm. To remain consistent with published guidelines, a single circular ROI was utilised for sampling [33]. The mean SWV (metres/sec) was recorded using a ROI sampling size of 10 mm and repeated using a ROI size of 5 mm. Each operator utilised the on-system SWE measurement software and placed the ROI within each target. Using the wavefront visual propagation map, each operator then placed the sampling ROI in an area of the highest reliability.
The intervals between the contours on the visual propagation map are wider in regions where the shear waves travel faster and closer together when travelling slower (Figure 1). Areas of parallel contour lines represent areas in which shear waves propagate smoothly and indicate that the reliability of data acquisition in these areas is highest [8].
Statistical analysis was performed using IBM SPSS Statistics for Windows Version 26.0 (IBM Corp. Armonk, NY, USA, 2019). The independent samples t-test was used to compare means of SWV from the same target at the two different depths (3 cm and 6 cm) and the two sampling methods (ROI size; 5 mm and 10 mm) [34]. Homogeneity of variances was tested using Levene’s variance test [35]. Inter-operator agreement was calculated using an analysis of the Intraclass Correlation Coefficient (ICC) [35]. The ICC utilised a two-way random effects model and selection of absolute agreement between the operators [36]. The ICC values were classified according to the common criteria [37]: excellent (ICC > 0.75), fair to good (ICC 0.40–0.75) and poor (ICC < 0.40). The repeatability coefficient (RC) and coefficient of variation (CV) were used to assess, test and retest reliability [16]. The RC and CV were calculated independently for each operator to ensure the conditions between repeated measurements were the same [16]. The RC is the value below which the absolute differences between two measurements would lie with 0.95 probability [38] and can be calculated by the formula:
The CV is calculated as the ratio of the standard deviation (SD) to the mean, with a smaller percentage indicating less variability. The significance level was set at p ≤ 0.05.
3. Results
3.1. Imaging Depth
The single-shot method on the machine provided a reliable colour filling of the 2D colour map from all the targets at both depths. Figure 3, displays the influence of depth on repeated measurements of SWV (metres/sec), collected from all 3 operators.
The mean SWV recorded from the 10 kPa target between 3 cm and 6 cm was not significantly different (Welch’s unequal variances t-test t238 = 0.742, p = 0.459). Levene’s test revealed variances between 3 cm and 6 cm were unequal (F = 9.259, p <0.01). The mean SWV at 17 kPa between 3 cm and 6 cm was also not significantly different (Welch’s unequal variances t-test t238 = 0.808, p = 0.438) and variances between 3 cm and 6 cm were unequal (F = 9.162, p <0.01). All other targets demonstrated a significant difference in mean SWV at the two imaging depths. Beyond 25 kPa, the measured SWV was underestimated with increasing target stiffness. The percentage difference in mean SWV between 3 cm and 6 cm was 6.1%, 15.2% and 18.7% for the 25 kPa, 47 kPa and 85 kPa targets, respectively.
3.2. Inter-Operator Reliability
Overall inter-observer reliability was calculated after the SWV measurements for both depths for all targets were pooled. Inter-observer reliability was 0.976 (95% CI 0.971–0.986) and 0.918 (95% CI 0.878–0.945) at 3 cm and 6 cm, respectively. Interobserver reliability stratified according to operative experience showed comparable ICC for 3 cm depth but poorer ICC for 6 cm, although still within the excellent range Table 1.
3.3. Measurement Repeatability
Repeatability ranges using calculations of RC and CV from all operators are summarised in Table 2. Both depth and target type influenced the ability of the system to provide consistent repeated measures. The smallest variation in repeated measurements resulted from the 10 kPa and 17 kPa targets. The RC and CV ranged from 0.06–0.24 m/s and 1.3–5.7% for both these targets at 3 cm and 6 cm. The greatest variability in repeated measurements resulted from the 45 kPa and 85 kPa target. The largest variability in repeat measurements resulted from the 85 kPa target at 3 cm depth.
3.4. ROI Sampling Size
The mean SWV from the two sampling methods (ROI 10 mm vs. 5 mm) were compared and there was no significant difference between these sampling methods except for the 85 kPa target. The 85 kPa target demonstrated a significant difference (p < 0.0001). Levene’s test revealed variances between 3 cm and 6 cm were equal (F = 0.326, p = 0.569). Results from the two sampling methods are summarised in Table 3.
4. Discussion
Inter-system variability is a known issue in ultrasound elastography research and may preclude the meaningful comparison of measurements performed on different systems, even when the same phantom [9,18] or patient [19,39] is imaged. As a result, many investigators would agree that standardisation of imaging protocols on a single system must first be done before it is applied clinically [8,10,21,33,40]. This work provides an important analysis of the sources of intra-system variability on a modern 2D-SWE commercial system. To the author’s knowledge, this is the first work to investigate these factors on the popular Canon Aplio i-series (Canon Medical, Otawara-shi, Japan), and provides clinically relevant SWV ranges where the system performs reliably and highlights factors that can introduce variability.
The influence of sample depth on elastography measurements has previously been reported [12,15,17,18] suggesting a trend towards lower SWV values with increasing acquisition depth [15,17]. As a result, recommendations have been made to include the depth of the target organ or lesion into any standardized protocol for SWE [2]. The results in this study concur with previous data and support this recommendation, with many of the phantom targets displaying lower mean SWV at 6 cm compared to 3 cm. However, it is important to recognise that there is a greater underestimation of SWV with increasing target stiffness. Further, our study was able to demonstrate good agreement between the two softer targets (10 kPa and 17 kPa) reporting no significant difference between the mean SWV derived from the two depths. Imaging depth results in a systematic bias and a subsequent underestimate of SWVs with increasing depth, and the literature provides several explanations for this discrepancy. SWV is viscosity and frequency dependant [41], and measurement errors may be related to tissue viscoelasticity. In our study, using a phantom with low viscosity the cause of depth dependant bias is not likely due to viscosity dispersion. SWV is calculated via a time-of-flight (TOF) estimation using several tracking beams to measure the arrival time of the shear wave at locations away from the central axis of excitation [42]. Geometric errors resulting from focusing the acoustic force pulse at different depths and a bias caused by the lateral range of the tracking beams have been elegantly described in more technical papers [43]. Transducer shape also may contribute to this bias, with a larger bias detected using curvilinear shaped probes, like the one used in this study, compared to a linear shaped transducer [43]. Random errors reducing measurement precision caused by the attenuation of the shear wave tracking pulses have also been implicated in these variations [9]. Increasing depth results in increased signal jitter and noise causing an underestimation of the measured SWV due to averaging [44]. These types of random errors have also been reported to be more prevalent when imaging stiffer targets, with experiments showing that TOF uncertainty increases with increasing stiffness, resulting in less precise repeated measurements [42]. Our experiment confirms this is still applicable to a commercial scanner, demonstrating greater variability of repeated measurements of stiffer versus softer targets. Therefore, we recommend guidelines involving 2D-SWE should also consider the relative stiffness of the structure being assessed, and not simply its depth, and indicate higher reliability of SWV measurements can be achieved when imaging softer structures in the range of 1.0–2.0 m/s. This range would be most relevant to clinical investigations involving the liver [2] and placenta [8].
As observed in similar studies, the inter-observer agreement was high between all operators in the study [11,12,45,46]. This result is consistent with other studies demonstrating high inter-observer agreement of 2D-SWE on phantom studies [12] and clinical studies [11]. The experience of the operator is likely to play a greater role in the clinical setting. In practical terms, the elastography phantom provides a convenient platform to scan and it proved relatively easy to identify each target and acquire repeated measurements even for someone new to the technique. In the clinical environment, however, achieving standardised imaging planes due to the variability of human anatomy is likely to be more difficult.
Measurement repeatability is an important consideration for any quantitative measurement system [16]. Repeated measurement calculations in this study were comparable to reports in other studies albeit on different systems [12,13,39]. This study achieved very low RC and CV values when imaging the 10 kPa and 17 kPa targets, indicating excellent repeatability. However, increasing target stiffness is a significant source of measurement variability, as discussed above. Such a range of values would likely make it difficult to interpret the results and to detect differences between normal and abnormal tissues when imaging tissues that produce high SWV values.
An analysis of the mean SWV between the sample ROI size of 5 mm and 10 mm demonstrated overall good reliability, with only the 85 kPa target demonstrating a significant difference between means. Greater variability and subsequent averaging of a larger ROI explains why there are lower values for the 10 mm ROI compared to the 5 mm ROI. Published guidelines relating to liver elastography promote the use of a 10 mm or larger ROI [2,21], however, this may not be practical for smaller structures or organs in which there is a larger variability in the B-mode characteristics. One example could be the placenta, which is a large organ, but often develops in various configurations, such as variable thickness and may display areas of grey-scale heterogeneity such as placental lakes [47,48,49]. Therefore, to evaluate such an organ with ultrasound elastography a larger number of smaller ROIs may be required to provide a better assessment of its overall elastic properties.
There are several limitations to this study. It is important to recognise that this study aimed to investigate which factors contribute most to intra-system variability. This is most easily controlled via measurements obtained from a homogeneous elastography phantom and therefore may not be fully transferrable to the clinical setting. The study phantom material has a low value of viscosity [50]. Human tissue typically has greater viscosity which can result in variations in the attenuation and speed of the generated shear wave [6]. Measurements were only acquired at two depths—3 cm and 6 cm. Increasing depth is a cause of SWV discrepancy when imaging the same target due to shear wave attenuation [13,15]. Thus, it is likely that the intermediate and harder targets may demonstrate less variability at depths between 3 cm and 6 cm, however, this work did not address this. In this study, the greatest intra-system variability occurred because of phantom target depth and stiffness—these factors are likely to be exacerbated in human tissue.
5. Conclusions
This study demonstrated good reliability of 2D-SWE SWV measurements when imaging soft (10 kPa and 17 kPa) elastography phantom material. Higher SWV measurement variability was evident with increasing depth and stiffness of the phantom targets. The influence of the operator was minimal, and variations in sampling technique had little impact on the SWV for most targets. The reliability achieved in this study of the soft targets is encouraging and may assist the development of reliable imaging protocols for clinical practice when acquiring 2D-SWE measurements.
Author Contributions
C.E. conceptualization, investigation, methodology, visualization, data curation, software, original draft preparation, E.C.: investigation, methodology, visualization, data curation, review S.K. supervision, review and editing. V.C.: resources, project administration, funding acquisition, D.F.: resources, project administration, funding acquisition, supervision, review and editing. All authors have read and agreed to the published version of the manuscript.
Funding
The 1st and 2nd authors are recipients of Mater Hospital–QUT research scholarship that assisted in the completion of this work.
Institutional Review Board Statement
Not applicable.
Informed Consent Statement
Not applicable.
Data Availability Statement
Not applicable.
Acknowledgments
The authors acknowledge the support during data collection by Ayaka Johnson.
Conflicts of Interest
The authors declare no conflict of interest.
References
- Salvatore, V.; Piscaglia, F. Ultrasound Elastography: General and Technical Overview. In Diagnostic Methods for Cirrhosis and Portal Hypertension; Berzigotti, A., Bosch, J., Eds.; Springer International Publishing: Cham, Switzerland, 2018; pp. 83–94. ISBN 978-3-319-72628-1. [Google Scholar]
- Barr, R.G.; Ferraioli, G.; Palmeri, M.L.; Goodman, Z.D.; Garcia-Tsao, G.; Rubin, J.; Garra, B.; Myers, R.P.; Wilson, S.R.; Rubens, D.; et al. Elastography assessment of liver fibrosis: Society of radiologists in ultrasound consensus conference statement. Radiology 2015, 276, 845–861. [Google Scholar] [CrossRef] [Green Version]
- Barr, R.G.; Nakashima, K.; Amy, D.; Cosgrove, D.; Farrokh, A.; Schafer, F.; Bamber, J.C.; Castera, L.; Choi, B.I.; Chou, Y.-H.; et al. WFUMB guidelines and recommendations for clinical use of ultrasound elastography: Part 2: Breast. Ultrasound Med. Biol. 2015, 41, 1148–1160. [Google Scholar] [CrossRef] [Green Version]
- Ferraioli, G.; Filice, C.; Castera, L.; Choi, B.I.; Sporea, I.; Wilson, S.R.; Cosgrove, D.; Dietrich, C.F.; Amy, D.; Bamber, J.C.; et al. WFUMB guidelines and recommendations for clinical use of ultrasound elastography: Part 3: Liver. Ultrasound Med. Biol. 2015, 41, 1161–1179. [Google Scholar] [CrossRef] [Green Version]
- Cosgrove, D.; Barr, R.; Bojunga, J.; Cantisani, V.; Chammas, M.C.; Dighe, M.; Vinayak, S.; Xu, J.-M.; Dietrich, C.F. WFUMB guidelines and recommendations on the clinical use of ultrasound elastography: Part 4. Thyroid. Ultrasound Med. Biol. 2017, 43, 4–26. [Google Scholar] [CrossRef]
- Sugimoto, K.; Moriyasu, F.; Oshiro, H.; Takeuchi, H.; Yoshimasu, Y.; Kasai, Y.; Itoi, T. Clinical utilization of shear wave dispersion imaging in diffuse liver disease. Ultrasonography 2020, 39, 3–10. [Google Scholar] [CrossRef] [PubMed] [Green Version]
- Ohmaru, T.; Fujita, Y.; Sugitani, M.; Shimokawa, M.; Fukushima, K.; Kato, K. Placental elasticity evaluation using virtual touch tissue quantification during pregnancy. Placenta 2015, 36, 915–920. [Google Scholar] [CrossRef] [PubMed]
- Edwards, C.; Cavanagh, E.; Kumar, S.; Clifton, V.; Fontanarosa, D. The use of elastography in placental research—A literature review. Placenta 2020, 99, 78–88. [Google Scholar] [CrossRef]
- Palmeri, M.; Nightingale, K.; Fielding, S.; Rouze, N.; Deng, Y.; Lynch, T.; Chen, S.; Song, P.; Urban, M.; Xie, H.; et al. RSNA QIBA ultrasound shear wave speed phase II phantom study in viscoelastic media. In Proceedings of the 2015 IEEE International Ultrasonics Symposium (IUS), Taipei, Taiwan, 16 November 2015; Volume 3, pp. 1–4. [Google Scholar]
- Shiina, T.; Nightingale, K.R.; Palmeri, M.L.; Hall, T.J.; Bamber, J.C.; Barr, R.G.; Castera, L.; Choi, B.I.; Chou, Y.-H.; Cosgrove, D.; et al. WFUMB guidelines and recommendations for clinical use of ultrasound elastography: Part 1: Basic principles and terminology. Ultrasound Med. Biol. 2015, 41, 1126–1147. [Google Scholar] [CrossRef] [PubMed] [Green Version]
- Hudson, J.M.; Milot, L.; Parry, C.; Williams, R.; Burns, P.N. Inter- and intra-operator reliability and repeatability of shear wave elastography in the liver: A study in healthy volunteers. Ultrasound Med. Biol. 2013, 39, 950–955. [Google Scholar] [CrossRef]
- Hwang, J.; Yoon, H.M.; Jung, A.Y.; Lee, J.S.; Cho, Y.A. Comparison of 2-dimensional shear wave elastographic measurements using elastq imaging and supersonic shear imaging: Phantom study and clinical pilot study. J. Ultrasound Med. 2020, 39, 311–321. [Google Scholar] [CrossRef]
- Franchi-Abella, S.; Elie, C.; Correas, J.-M. Performances and limitations of several ultrasound-based elastography techniques: A phantom study. Ultrasound Med. Biol. 2017, 43, 2402–2415. [Google Scholar] [CrossRef] [PubMed]
- Ferraioli, G.; De Silvestri, A.; Lissandrin, R.; Maiocchi, L.; Tinelli, C.; Filice, C.; Barr, R.G. Evaluation of inter-system variability in liver stiffness measurements. Ultraschall Med. Eur. J. Ultrasound 2018, 40, 64–75. [Google Scholar] [CrossRef] [Green Version]
- Shin, H.J.; Kim, M.-J.; Kim, H.Y.; Roh, Y.H.; Lee, M.-J. Comparison of shear wave velocities on ultrasound elastography between different machines, transducers, and acquisition depths: A phantom study. Eur. Radiol. 2016, 26, 3361–3367. [Google Scholar] [CrossRef] [PubMed]
- Bunting, K.V.; Steeds, R.P.; Slater, L.T.; Rogers, J.K.; Gkoutos, G.V.; Kotecha, D. A Practical guide to assess the reproducibility of echocardiographic measurements. J. Am. Soc. Echocardiogr. 2019, 32, 1505–1515. [Google Scholar] [CrossRef] [Green Version]
- Carlsen, J.F.; Pedersen, M.R.; Ewertsen, C.; Saftoiu, A.; Lönn, L.; Rafaelsen, S.R.; Nielsen, M.B. A comparative study of strain and shear-wave elastography in an elasticity phantom. Am. J. Roentgenol. 2015, 204, W236–W242. [Google Scholar] [CrossRef]
- Hall, T.J.; Milkowski, A.; Garra, B.; Carson, P.; Palmeri, M.; Nightingale, K.; Lynch, T.; Alturki, A.; Andre, M.; Audière, S.; et al. RSNA/QIBA: Shear wave speed as a biomarker for liver fibrosis staging. In Proceedings of the 2013 IEEE International Ultrasonics Symposium (IUS), Prague, Czech Republic, 21–25 July 2013; pp. 397–400. [Google Scholar] [CrossRef]
- Chang, S.; Kim, M.-J.; Kim, J.; Lee, M.-J. Variability of shear wave velocity using different frequencies in Acoustic Radiation Force Impulse (ARFI) elastography: A phantom and normal liver study. Ultraschall Med. Eur. J. Ultrasound 2012, 34, 260–265. [Google Scholar] [CrossRef]
- Thiele, M.; Madsen, B.S.; Procopet, B.; Hansen, J.F.; Møller, L.M.S.; Detlefsen, S.; Berzigotti, A.; Krag, A. Reliability criteria for liver stiffness measurements with real-time 2D shear wave elastography in different clinical scenarios of chronic liver disease. Ultraschall Med. Eur. J. Ultrasound 2017, 38, 648–654. [Google Scholar] [CrossRef] [Green Version]
- Dietrich, C.F.; Bamber, J.; Berzigotti, A.; Bota, S.; Cantisani, V.; Castera, L.; Cosgrove, D.; Ferraioli, G.; Friedrich-Rust, M.; Gilja, O.H.; et al. EFSUMB guidelines and recommendations on the clinical use of liver ultrasound elastography, update 2017 (long version). Ultraschall Med. Eur. J. Ultrasound 2017, 38, e16–e47. [Google Scholar] [CrossRef] [Green Version]
- Nadebaum, D.P.; Nicoll, A.J.; Sood, S.; Gorelik, A.; Gibson, R.N. Variability of liver shear wave measurements using a new ultrasound elastographic technique. J. Ultrasound Med. 2018, 37, 647–656. [Google Scholar] [CrossRef] [Green Version]
- Jeon, S.K.; Lee, J.M.; Joo, I.; Yoon, J.H.; Lee, D.H.; Han, J.K. Two-dimensional shear wave elastography with propagation maps for the assessment of liver fibrosis and clinically significant portal hypertension in patients with chronic liver disease: A prospective study. Acad. Radiol. 2020, 27, 798–806. [Google Scholar] [CrossRef] [PubMed]
- Elasticity, Q.A. Phantom—CIRS. Available online: https://www.cirsinc.com/products/ultrasound/zerdine-hydrogel/elasticity-qa-phantom/ (accessed on 7 January 2020).
- Cournane, S.; Fagan, A.J.; E Browne, J. Review of ultrasound elastography quality control and training test phantoms. Ultrasound 2011, 20, 16–23. [Google Scholar] [CrossRef] [Green Version]
- Mulabecirovic, A.; Gilja, O.; Mjelle, A.B.; Havre, R.F. In vitro quantification of tissue elasticity using three shear wave elastography platforms on liver fibrosis phantoms. Ultraschall Med. Eur. J. Ultrasound 2016, 37, E9_05. [Google Scholar] [CrossRef]
- Fernandes, D.A.; Kolios, M.C. Near-infrared absorbing nanoemulsions as nonlinear ultrasound contrast agents for cancer theranostics. J. Mol. Liq. 2019, 287, 110848. [Google Scholar] [CrossRef]
- Fernandes, D.A.; Fernandes, D.D.; Li, Y.; Wang, Y.; Zhang, Z.; Rousseau, D.; Gradinaru, C.C.; Kolios, M.C. Synthesis of stable multifunctional perfluorocarbon nanoemulsions for cancer therapy and imaging. Langmuir 2016, 32, 10870–10880. [Google Scholar] [CrossRef] [PubMed]
- Youk, J.H.; Gweon, H.M.; Son, E.J. Shear-wave elastography in breast ultrasonography: The state of the art. Ultrasonography 2017, 36, 300–309. [Google Scholar] [CrossRef] [PubMed] [Green Version]
- Bamber, J.; Cosgrove, D.; Dietrich, C.F.; Fromageau, J.; Bojunga, J.; Calliada, F.; Cantisani, V.; Correas, J.-M.; D’Onofrio, M.; Drakonaki, E.E.; et al. EFSUMB guidelines and recommendations on the clinical use of ultrasound elastography. Part 1: Basic principles and technology. Ultraschall Med. Eur. J. Ultrasound 2013, 34, 169–184. [Google Scholar] [CrossRef] [PubMed] [Green Version]
- O’Hara, S.; Zelesco, M.; Rocke, K.; Stevenson, G.; Sun, Z. Reliability Indicators for 2-Dimensional Shear Wave Elastography. J. Ultrasound Med. 2019, 38, 3065–3071. [Google Scholar] [CrossRef]
- Kwak, S.G.; Kim, J.H. Central limit theorem: The cornerstone of modern statistics. Korean J. Anesthesiol. 2017, 70, 144–156. [Google Scholar] [CrossRef]
- Ferraioli, G.; Wong, V.W.-S.; Castera, L.; Berzigotti, A.; Sporea, I.; Dietrich, C.F.; Choi, B.I.; Wilson, S.R.; Kudo, M.; Barr, R.G. Liver ultrasound elastography: An update to the world federation for ultrasound in medicine and biology guidelines and recommendations. Ultrasound Med. Biol. 2018, 44, 2419–2440. [Google Scholar] [CrossRef] [Green Version]
- Altman, D.G. Practical Statistics for Medical Research; Chapman & Hall/CRC: Boca Raton, FL, USA, 1999; ISBN 9780412276309. [Google Scholar]
- Fleiss, J.L. Reliability of Measurement. Des. Anal. Clin. Exp. 2011, 1–32. [Google Scholar] [CrossRef]
- Koo, T.K.; Li, M.Y. A guideline of selecting and reporting intraclass correlation coefficients for reliability research. J. Chiropr. Med. 2016, 15, 155–163. [Google Scholar] [CrossRef] [PubMed] [Green Version]
- Hills, M.; Fleiss, J.L. The design and analysis of clinical experiments. J. R. Stat. Soc. Ser. A (Gen.) 1987, 150, 400. [Google Scholar] [CrossRef]
- Vaz, S.; Falkmer, T.; Passmore, A.E.; Parsons, R.; Andreou, P. The case for using the repeatability coefficient when calculating test-retest reliability. PLoS ONE 2013, 8, e73990. [Google Scholar] [CrossRef]
- Huang, Z.; Zheng, J.; Zeng, J.; Wang, X.; Wu, T.; Zheng, R. Normal liver stiffness in healthy adults assessed by real-time shear wave elastography and factors that influence this method. Ultrasound Med. Biol. 2014, 40, 2549–2555. [Google Scholar] [CrossRef] [PubMed]
- Cosgrove, D.; Piscaglia, F.; Bamber, J.; Bojunga, J.; Correas, J.-M.; Gilja, O.H.; Klauser, A.S.; Sporea, I.; Calliada, F.; Cantisani, V.; et al. EFSUMB guidelines and recommendations on the clinical use of ultrasound elastography. Part 2: Clinical applications. Ultraschall Med. Eur. J. Ultrasound 2013, 34, 238–253. [Google Scholar] [CrossRef] [Green Version]
- Chen, S.; Urban, M.W.; Pislaru, C.; Kinnick, R.; Zheng, Y.; Yao, A.; Greenleaf, J.F. Shearwave dispersion ultrasound vibrometry (SDUV) for measuring tissue elasticity and viscosity. IEEE Trans. Ultrason. Ferroelectr. Freq. Control 2009, 56, 55–62. [Google Scholar] [CrossRef] [Green Version]
- Wang, M.; Byram, B.; Palmeri, M.; Rouze, N.; Nightingale, K. On the precision of time-of-flight shear wave speed estimation in homogeneous soft solids: Initial results using a matrix array transducer. IEEE Trans. Ultrason. Ferroelectr. Freq. Control 2013, 60, 758–770. [Google Scholar] [CrossRef]
- Zhao, H.; Song, P.; Urban, M.W.; Kinnick, R.R.; Yin, M.; Greenleaf, J.F.; Chen, S. Bias observed in time-of-flight shear wave speed measurements using radiation force of a focused ultrasound beam. Ultrasound Med. Biol. 2011, 37, 1884–1892. [Google Scholar] [CrossRef] [Green Version]
- Palmeri, M.L.; McAleavey, S.A.; Trahey, G.E.; Nightingale, K.R. Ultrasonic tracking of acoustic radiation force-induced displacements in homogeneous media. IEEE Trans. Ultrason. Ferroelectr. Freq. Control 2006, 53, 1300–1313. [Google Scholar] [CrossRef]
- Ferraioli, G.; Tinelli, C.; Zicchetti, M.; Above, E.; Poma, G.; Di Gregorio, M.; Filice, C. Reproducibility of real-time shear wave elastography in the evaluation of liver elasticity. Eur. J. Radiol. 2012, 81, 3102–3106. [Google Scholar] [CrossRef]
- Mun, H.S.; Choi, S.H.; Kook, S.H.; Choi, Y.; Jeong, W.K.; Kim, Y. Validation of intra- and interobserver reproducibility of shearwave elastography: Phantom study. Ultrasonics 2013, 53, 1039–1043. [Google Scholar] [CrossRef] [PubMed]
- Fadl, S.; Moshiri, M.; Fligner, C.L.; Katz, D.S.; Dighe, M. Placental imaging: Normal appearance with review of pathologic findings. Radiographics 2017, 37, 979–998. [Google Scholar] [CrossRef] [PubMed]
- Abramowicz, J.; Sheiner, E. Ultrasound of the placenta: A systematic approach. Part I: Imaging. Placenta 2008, 29, 225–240. [Google Scholar] [CrossRef]
- Rheinboldt, M.; DelProposto, Z. Sonography of placental abnormalities: A pictorial review. Emerg. Radiol. 2015, 22, 401–408. [Google Scholar] [CrossRef] [PubMed]
- Oudry, J.; Lynch, T.; Vappou, J.; Sandrin, L.; Miette, V. Comparison of four different techniques to evaluate the elastic properties of phantom in elastography: Is there a gold standard? Phys. Med. Biol. 2014, 59, 5775–5793. [Google Scholar] [CrossRef]
Figure 1.
2D-SWE Ultrasound elastography display of two phantom targets using circular ROI (a) Type IV (85 kPa) and (b) Type I (10 kPa). Each image display is split into the parametric colour map on the left, (higher SWV coded as red/orange and slower SWV as blue/green) and reliability propagation map on the right (parallel lines indicating increased reliability).

Figure 2.
Characteristics of the Model 049A elastography phantom (CIRS, Inc., Norfolk, VA, USA) (a) Top view showing the position of the phantom target cylinders (b) Dimensions of stepped target cylinders (c) Side View—Target types and depth. (d) Phantom enclosure. Used with permission from CIRS, Ltd.

Figure 3.
Box and whisker plot of shear wave velocities (n = 900) plotted against target stiffness (kPa), using 10 mm ROI. The coloured region represents the 25th to 75th percentile range.
Figure 3.
Box and whisker plot of shear wave velocities (n = 900) plotted against target stiffness (kPa), using 10 mm ROI. The coloured region represents the 25th to 75th percentile range.


Table 1.
Intraclass correlation coefficient (ICC) of the measured values of elasticity according to operator experience at two different depths.
Table 1.
Intraclass correlation coefficient (ICC) of the measured values of elasticity according to operator experience at two different depths.
| Operator Type | ICC at 3 cm (95% CI) | ICC at 6 cm (95% CI) |
|---|---|---|
| 3 Operators | 0.976 (0.971–0.986) | 0.918(0.878–0.945) |
| 2 Operators (experienced + less experienced) | 0.978 (0.967–0.985) | 0.88 (0.823–0.919) |
Table 2.
Summary table of calculated repeatability coefficient (RC) and coefficient of variation (CV) of the different elasticity targets at two different depths. The RC and CV are displayed as min-max range.
Table 2.
Summary table of calculated repeatability coefficient (RC) and coefficient of variation (CV) of the different elasticity targets at two different depths. The RC and CV are displayed as min-max range.
| Target | Depth | Repeatability Coefficient | Coefficient of Variation |
|---|---|---|---|
| Type I (10 kPa) | 3 cm | 0.06–0.07 m/s | 1.5–1.8% |
| 6 cm | 0.21–0.24 m/s | 5.5–5.7% | |
| Type II (17 kPa) | 3 cm | 0.07–0.08 m/s | 1.3–1.4% |
| 6 cm | 0.21–0.22 m/s | 3.9–4.0% | |
| Background (25 kPa) | 3 cm | 0.31–0.55 m/s | 4.1–6.5% |
| 6 cm | 0.67–0.81 m/s | 5.5–10.4% | |
| Type III (47 kPa) | 3 cm | 0.53–0.68 m/s | 5.3–7.3% |
| 6 cm | 0.80–0.86 m/s | 9.2–11.0% | |
| Type IV (85 kPa) | 3 cm | 1.23–1.93 m/s | 10.2–15.2% |
| 6 cm | 0.82–1.13 m/s | 7.8–11.7% |
Table 3.
Mean SWV and SD of each target combining both depths (3 cm and 6 cm) comparing two different sampling sizes 5 mm vs. 10 mm round ROI.
Table 3.
Mean SWV and SD of each target combining both depths (3 cm and 6 cm) comparing two different sampling sizes 5 mm vs. 10 mm round ROI.
| Target | 5 mm ROI | 10 mm ROI | Significance |
|---|---|---|---|
| Type I (10 kPa) | 1.41 ± 0.04 m/s | 1.41 ± 0.04 m/s | p = 0.266 |
| Type II (17 kPa) | 1.96 ± 0.06 m/s | 1.95 ± 0.04 m/s | p = 0.396 |
| Background (25 kPa) | 2.37 ± 0.08 m/s | 2.3 ± 0.2 m/s | p = 0.105 |
| Type III (47 kPa) | 3.2 ± 0.4 m/s | 3.2 ± 0.4 m/s | p = 0.776 |
| Type IV (85 kPa) | 4.3 ± 0.5 m/s | 3.9 ± 0.6 m/s | p < 0.0001 |
Publisher’s Note: MDPI stays neutral with regard to jurisdictional claims in published maps and institutional affiliations. |
© 2021 by the authors. Licensee MDPI, Basel, Switzerland. This article is an open access article distributed under the terms and conditions of the Creative Commons Attribution (CC BY) license (http://creativecommons.org/licenses/by/4.0/).
Share and Cite
MDPI and ACS Style
Edwards, C.; Cavanagh, E.; Kumar, S.; Clifton, V.; Fontanarosa, D. Intra-System Reliability Assessment of 2-Dimensional Shear Wave Elastography. Appl. Sci. 2021, 11, 2992. https://doi.org/10.3390/app11072992
AMA Style
Edwards C, Cavanagh E, Kumar S, Clifton V, Fontanarosa D. Intra-System Reliability Assessment of 2-Dimensional Shear Wave Elastography. Applied Sciences. 2021; 11(7):2992. https://doi.org/10.3390/app11072992
Chicago/Turabian StyleEdwards, Christopher, Erika Cavanagh, Sailesh Kumar, Vicki Clifton, and Davide Fontanarosa. 2021. "Intra-System Reliability Assessment of 2-Dimensional Shear Wave Elastography" Applied Sciences 11, no. 7: 2992. https://doi.org/10.3390/app11072992
Note that from the first issue of 2016, this journal uses article numbers instead of page numbers. See further details here.