Article

Monitoring of Student Learning in Learning Management Systems: An Application of Educational Data Mining Techniques

by
María Consuelo Sáiz-Manzanares
1,*,
Juan José Rodríguez-Díez
2,
José Francisco Díez-Pastor
2,
Sandra Rodríguez-Arribas
2,
Raúl Marticorena-Sánchez
2,* and
Yi Peng Ji
2
1
Departamento de Ciencias de la Salud, Facultad de Ciencias de la Salud, Universidad de Burgos, Research Group DATAHES, P° Comendadores s/n, 09001 Burgos, Spain
2
Departamento de Ingeniería Informática, Escuela Politécnica Superior, Universidad de Burgos, Research Group ADMIRABLE, Escuela Politécnica Superior, Avda. de Cantabria s/n, 09006 Burgos, Spain
*
Authors to whom correspondence should be addressed.
Appl. Sci. 2021, 11(6), 2677; https://doi.org/10.3390/app11062677
Submission received: 16 February 2021 / Revised: 7 March 2021 / Accepted: 13 March 2021 / Published: 17 March 2021
(This article belongs to the Special Issue Application of Technologies in E-learning Assessment)

Abstract

:

Featured Application

This work has an important direct application for teachers or educational institutions working with Moodle, because it provides an open access software application, UBUMonitor, which facilitates the detection of students at risk.

Abstract

In this study, we used a module for monitoring and detecting students at risk of dropping out. We worked with a sample of 49 third-year students in a Health Science degree during a lockdown caused by COVID-19. Three follow-ups were carried out over a semester: an initial one, an intermediate one and a final one with the UBUMonitor tool. This tool is a desktop application executed on the client, implemented with Java, and with a graphic interface developed in JavaFX. The application connects to the selected Moodle server, through the web services and the REST API provided by the server. UBUMonitor includes, among others, modules for log visualisation, risk of dropping out, and clustering. The visualisation techniques of boxplots and heat maps and the cluster analysis module (k-means ++, fuzzy k-means and Density-based spatial clustering of applications with noise (DBSCAN) were used to monitor the students. A teaching methodology based on project-based learning (PBL), self-regulated learning (SRL) and continuous assessment was also used. The results indicate that the use of this methodology together with early detection and personalised intervention in the initial follow-up of students achieved a drop-out rate of less than 7% and an overall level of student satisfaction with the teaching and learning process of 4.56 out of 5.

1. Introduction

The contemporary teaching–learning process is increasingly carried out in e-learning or blended learning environments, and rarely face to face (F2F) only. This situation has been intensified by the COVID-19 crisis [1]. However, e-learning teaching has a series of challenges, among which the following stand out: interaction between teachers and students and between students themselves, customisation of the teaching–learning process, detection of students at risk, and the use of technological resources in learning management systems (LMSs) carried out from a good pedagogical setting. Although this type of teaching has several advantages over F2F teaching, LMSs allow all the interactions (collaborative between participants and between participants and learning objects) that take place during the teaching–learning process to be recorded [2]. However, one of the greatest risks is the early drop-out. In order to avoid this, monitoring systems of the student’s learning process must be included in LMSs in order to carry out early detection and to make proposals for personalised tutoring. This is an essential factor in achieving effective learning [3,4]. Nevertheless, the monitoring systems must be carried out with the use of technological resources and artificial intelligence techniques that facilitate the interpretation of the students’ learning behaviours. Supervised learning such as predictive methods, and unsupervised learning such as clustering techniques have been shown to be very useful [5,6]. However, current LMSs, such as Moodle, do not have enough detection tools incorporated, because the learning analytics (LA) of the logs they offer is very simple and does not give the teacher sufficient information about these processes [7]. In particular, student drop-out at university is one of the major concerns of teachers and university rectors worldwide. Some studies [8] have analysed the possible causes and have specified that the factors can be related to students, teachers, the university system, or be an interaction of all of them. Among the causes specific to students, motivation stands out; amidst those specific to teachers, the quality of teaching and the enhancement of student motivation towards learning are the most common issues; and with respect to the institution, the quality of university management is the main aspect. The factors that may be influencing the lack of students’ motivation which can be detected by technological systems included in the LMS are the frequency of access to the platform to different resources and activities. This frequency is obtained from the analysis of logs. The knowledge of these data throughout the learning process will be a very useful tool for a teacher in the prevention of school dropout [2].
Therefore, it is important to detect students at risk early, for which educational data mining (EDM) techniques can be applied [5,9]. These will allow the prediction of the profile of the student at risk [9,10]. It has been proven that with these techniques, the prediction percentage is in the range of 79–83% [11]. Additionally, it has been found that the use of teaching methodology in virtual environments based on self-regulated learning (SRL) [12] together with project-based learning (PBL) [13,14] and the use of continuous assessment methodology [15] are predictors of the achievement of effective learning (60.4%) [16] and decrease the dropout rate [15,17]. In summary, these studies indicate that one of the ways to decrease the percentage of students who drop out of university is to have systems in the LMS that facilitate the detection of the student at risk throughout the teaching–learning process [18,19]. The functionalities of the LA and EDM will be analysed below. The most important contribution of this work is the use of a personalised tool, which connects directly to Moodle and facilitates the monitoring of the behaviour of each student throughout the teaching–learning process in each subject and enables the analysis of logs in a simple way through EDM techniques and visualisation within the tool itself. In previous studies for the detection of students at risk, the process was slower and more laborious because EDM techniques had to be applied in statistical analysis software outside the LMS or not directly connected to it [20].

1.1. Learning Analytics Procedures

LMSs include simple procedures for analysing logs produced during the teaching–learning process which can be consulted in various reports. These reports use techniques of frequency analysis and descriptive statistics (mean and standard deviation of observations), and the most advanced ones include an analysis of minimum and maximum ranges and distribution asymmetry and kurtosis. All this information is offered from visualisation tools and can provide the teacher with information about how the learning process is developing in their students [21]. However, these reports do not allow a visual and fast detection of the student at risk [22] and require the teacher to have knowledge of data processing and analysis from the use of EDM techniques. This is obviously a problem for the early prevention of the at-risk student. A further step in the analysis of logs has been taken with the incorporation of plugins that are inserted in LMSs [2,23,24,25,26,27,28,29,30,31] and facilitate the analysis and interpretation of the logs. The use of these tools provides a series of advances in the organisation and interpretation of the data and in the detection of the student at risk in the different learning objects (activities and resources), because it allows the teacher to choose the standard deviation (SD) that they consider to be an indicator of the detection of at-risk students (1, 2, 3, etc., SD) in their subject. Although these resources have a number of disadvantages, because they require the teacher to have some knowledge of Moodle management and data analysis, the results which they provide are very simple and do not normally include EDM techniques. Previous studies have applied supervised learning EDM techniques; particularly, prediction for the detection of at-risk students. Specifically, in the 2019 study by Sáiz-Manzanares et al. [11], it was found that the use of a personalised learning methodology in Moodle predicted 42.3% of the learning outcomes and 74.2% of the learning behaviours of students in the Moodle platform. Likewise, in the study by Sáiz-Manzanares et al. in 2020 [2], progress was made in the analysis of the logs using data visualisation tools on the prediction variables, in this case the type of degree and the assignment clusters with respect to the learning outcomes. However, these analyses were not carried out in the Moodle platform, and it was necessary to extract the logs and enter them in the Orange data mining tool. Therefore, the present work proposes to use a Moodle connection tool that allows the automatic application of these visualisation techniques.

1.2. Educational Data Mining (EDM) Procedures

As already indicated, the analysis and interpretation of the logs generated in LMSs has certain difficulties and requires the teacher to have skills in the use of data extraction and interpretation techniques [32]. If LMSs included EDM and data visualisation techniques [21,33], this would make it easier to detect the student at risk. EDM procedures include different techniques, one of the simplest being frequency analysis with heat maps [34]. This is a visualisation technique that allows users to see the frequencies of the accesses to the different resources of the LMS in different colours, creating a heat map. The variation of the colours is made by tone and intensity, offering the teacher quick visual information of the results. Additionally, it allows the detection of outliers (both above and below the average frequency) in different learning objects (resources and activities) on the platform. An example of a heat map visualisation is shown in Figure 1; in this case, the dark red colour indicates the students at maximum risk, i.e., with zero participation values, the light red colour indicates the students in the first quartile, the dark ochre colour represents the students in the second quartile, the light ochre colour is the students in the third quartile, the light green colour shows the students in the fourth quartile, and the dark green colour indicates the students with the highest participation value in Moodle.
Besides, more complex EDM techniques such as supervised learning can be used [36,37]. These guide the prediction of the student at risk according to different variables or attributes. For this purpose, classification techniques (e.g., support vector machine, discriminant analysis, Bayesian networks and nearest neighbour, decision trees, neuronal networks, ensemble methods) and prediction techniques (linear regression, regression trees, support vector machine, etc.) can be used [38]. Similarly, within the unsupervised learning techniques, clustering techniques are included [33], in which the k-means, k-means ++, fuzzy k-means, and DBSCAN (density-based spatial clustering of applications with noise) algorithms [39] stand out. In this article, we will look more closely at the use of clustering techniques, because they facilitate the analysis of student learning behaviour in LMSs [33]. Moreover, they facilitate the detection of groups of students according to the different behaviours in the different learning objects (resources and activities). One of the most widely used algorithms is k-means [33]. With an X-set and a distance measure d: X × X → ℝ. The output of the k-means algorithm is a set of centres C = {c1, c2, …, ck} which implicitly define a set of clusters in which each point belongs to the cluster represented by the nearest centroid, Φ = c(x) = argmincC, d(x, c); the aim is to find the C-set that minimises the sum of the squared distances (see Equation (1)).
ΣxX dC (x), x)2
The problem that k-means is trying to solve is to find the groupings that minimise the distance within each group, although this is an NP-hard problem. In practice, k-means is very fast, but it often gets stuck in local minima, so it may be useful to repeat the execution several times. A variant is the k-means ++ algorithm, which intelligently initialises the centroids to accelerate the convergence of the algorithm [40]. Other clustering algorithms are fuzzy k-means [22] and density-based spatial clustering of applications with noise (DBSCAN). Fuzzy k-means also tries to minimise the same objective function described on Equation (1), but in this case, the membership of an instance to a cluster is not strict, but rather it is fuzzy; the membership of an instance to a cluster is a function that can take values between 0 and 1. Both k-means ++ and fuzzy k-means require setting the number of clusters a priori, which is admissible if there is good intuition about how many clusters are present in the dataset, but otherwise it can be a problem. Furthermore, these methods also assume that the clusters are globular, because the methods compute centroids and assign each and every one of these instances to the nearest centroid, there being the possibility of considering some instances which do not belong to a cluster. Density-based spatial clustering of applications with noise (DBSCAN) is a data clustering algorithm proposed by Ester et al. [39]. The algorithm assumes that the clusters are regions with a high density of points. Unlike the previous algorithms, it does not assume that every point in the dataset must necessarily belong to a cluster, and some examples can be classified as noise. In DBSCAN, clusters do not need to be globular; although it is not necessary to establish a correct number of clusters, it is needed to set an Epsilon parameter used to determine which instances belong to a grouping or are on the contrary noise. Other advantages are its stability—DBSCAN is stable across different runs—and its scalability, with it being an algorithm capable of working with very large datasets.
Based on the above-mentioned research, the objectives of this study were:
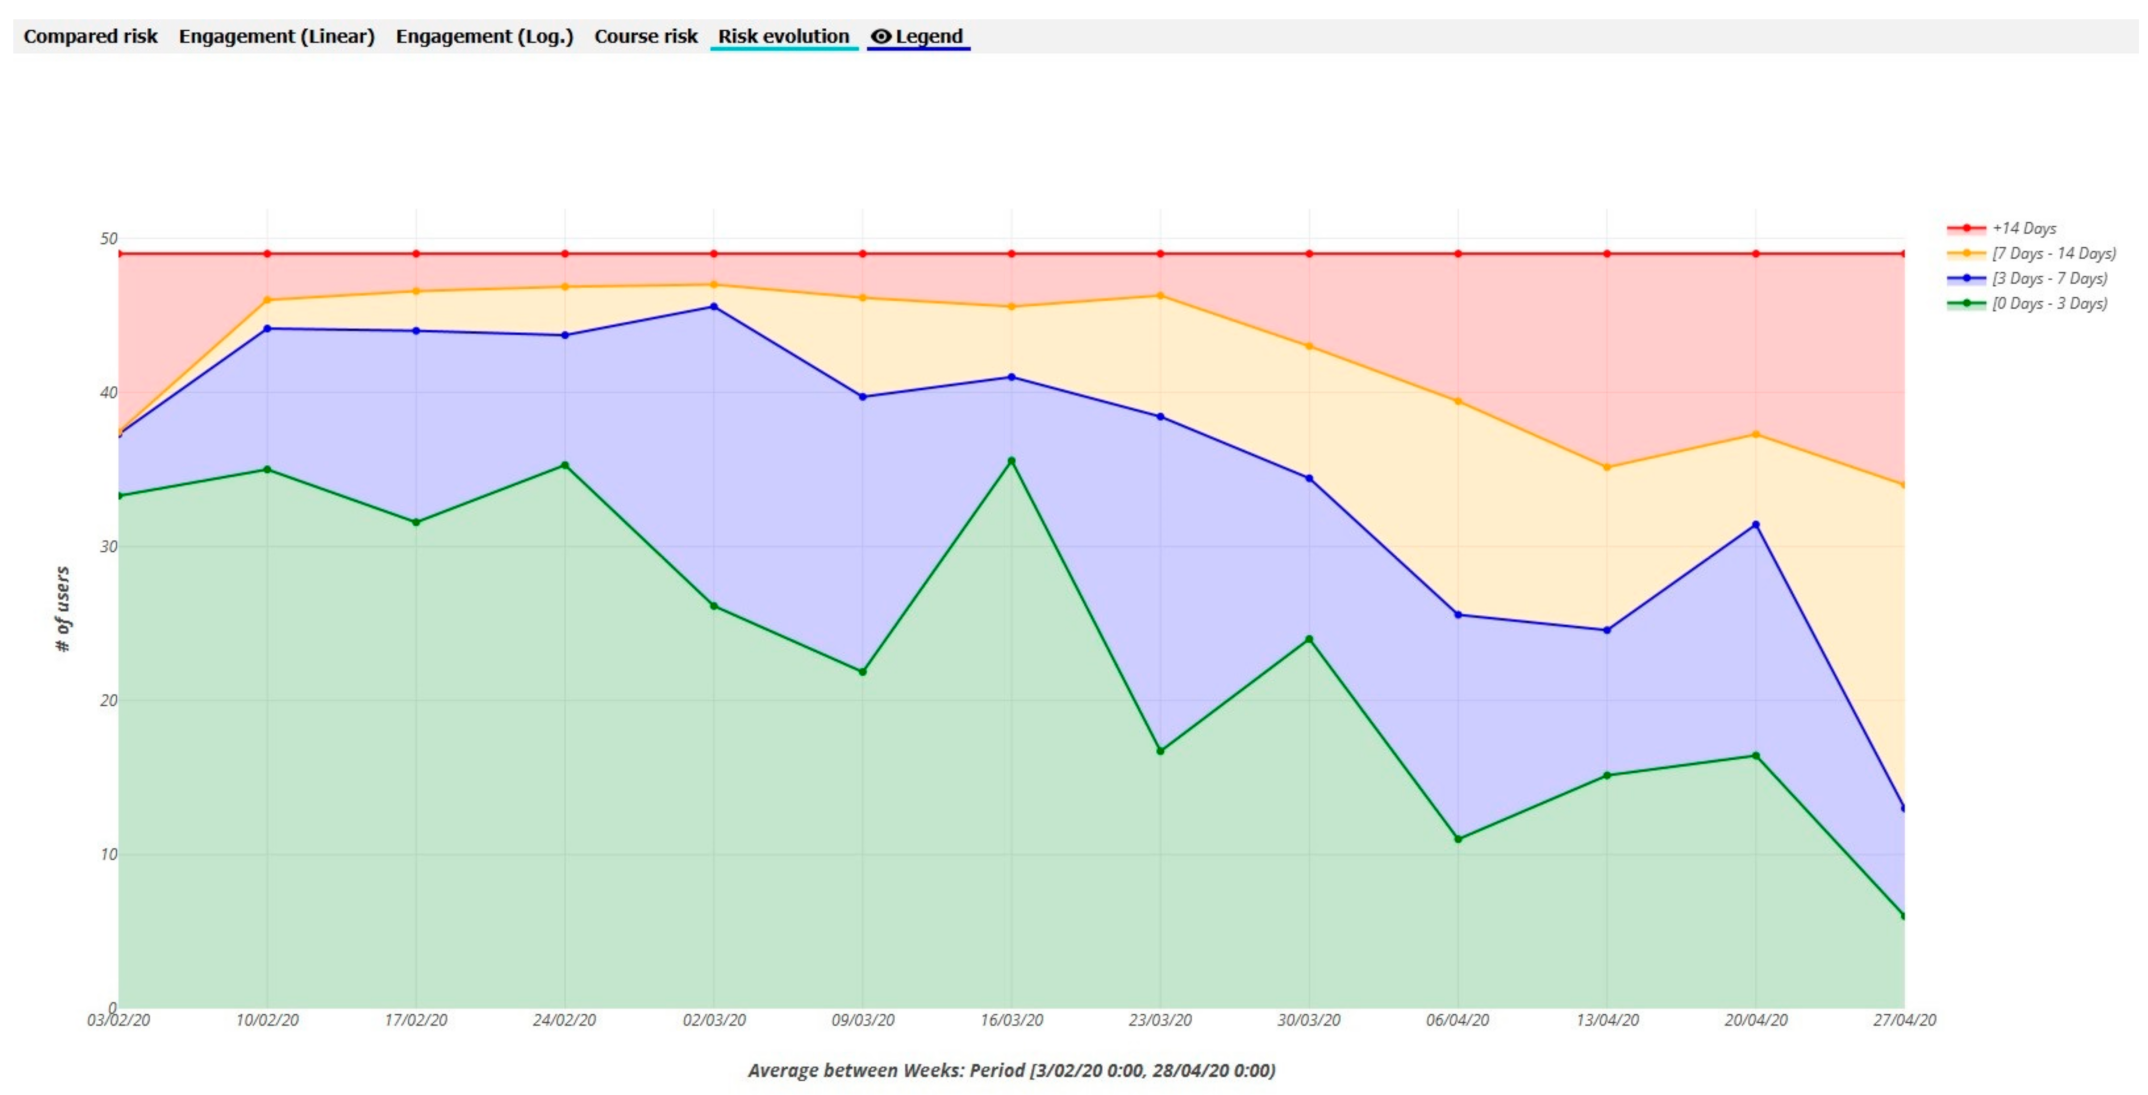
  • Apply an external logs analysis tool in Moodle to detect students at risk over the course of a semester in different phases (initial, intermediate, and final);
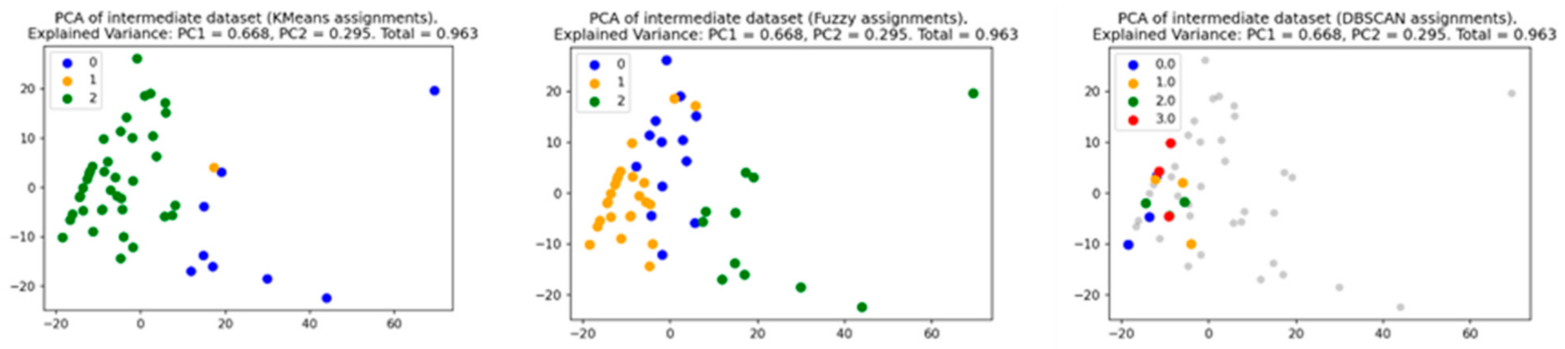
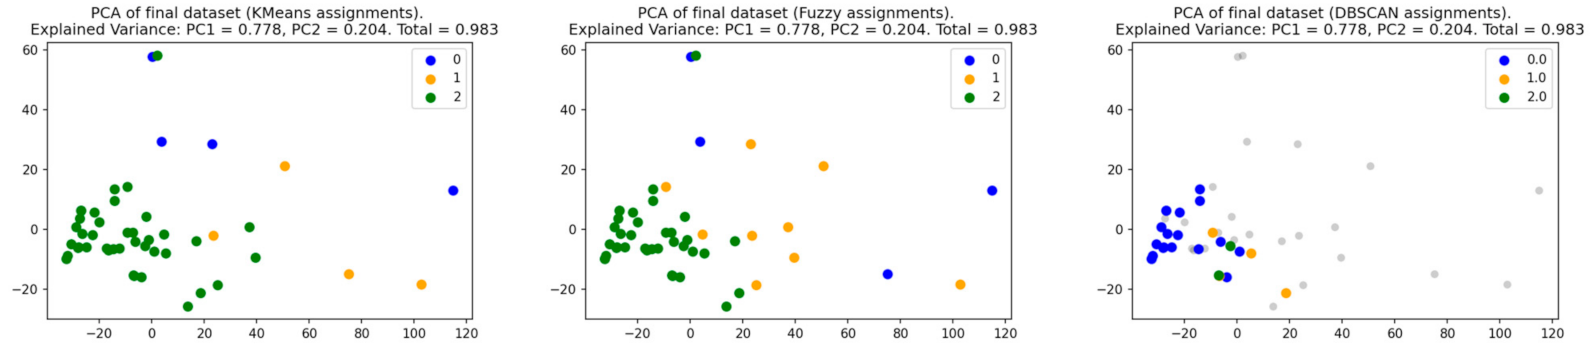
  • Detect in the sample, with an external log analysis tool in Moodle, the clusters in different phases (initial, intermediate, and final) differentiating by type of algorithm (k-means ++, fuzzy k-means, DBSCAN);
  • Check if there were differences in the clusters found depending on the type of algorithm (k-means ++, fuzzy k-means, DBSCAN);
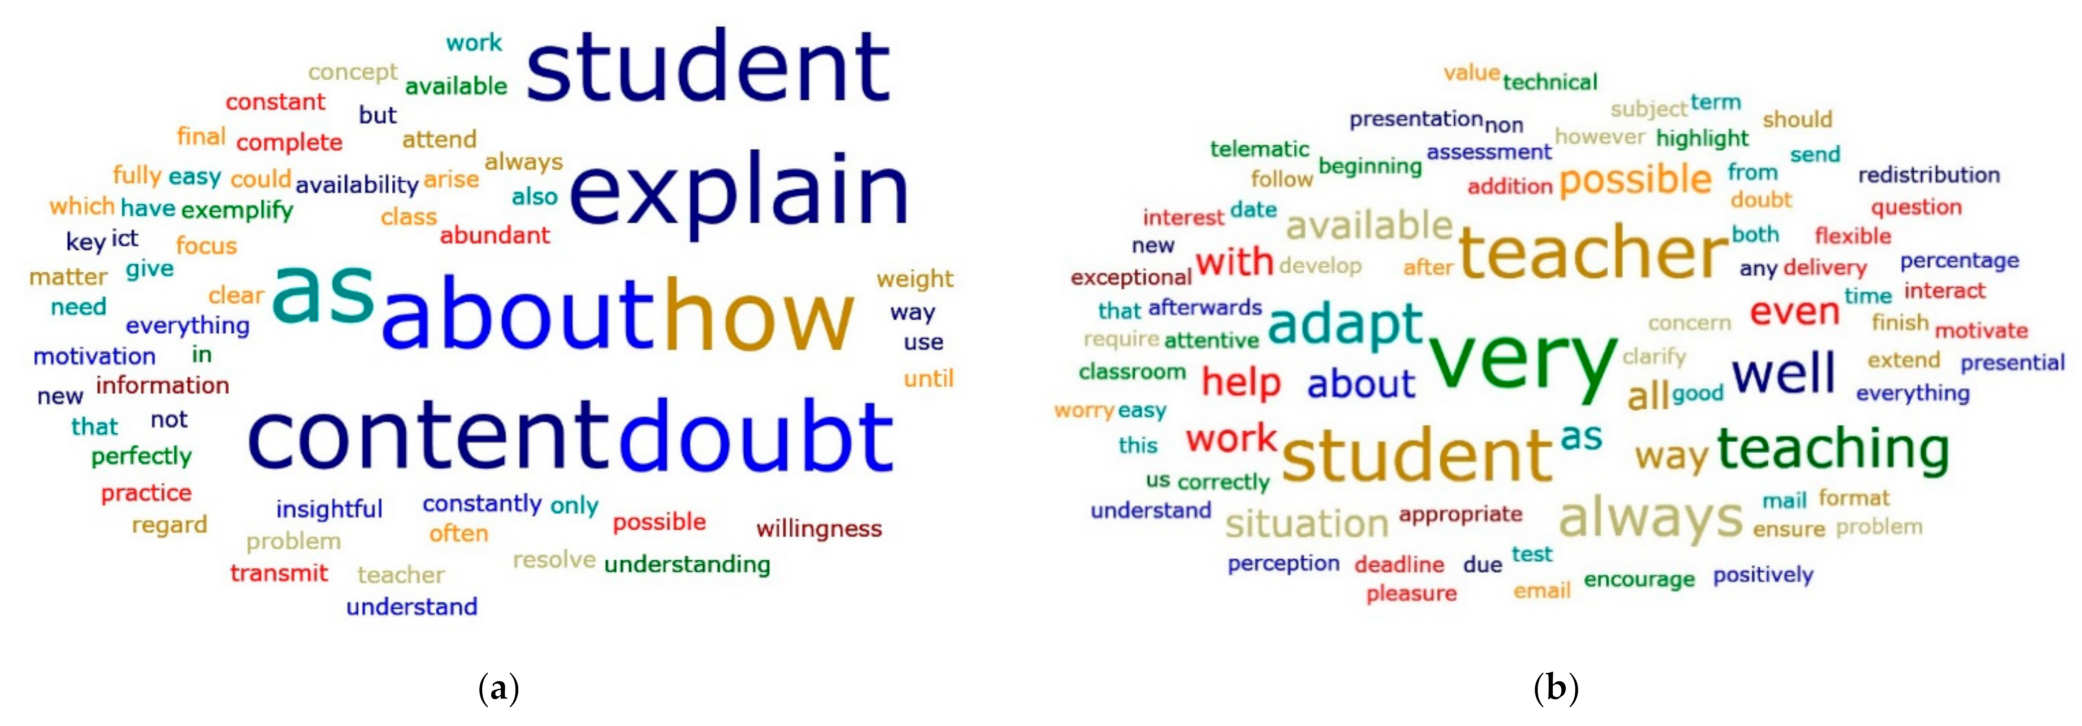
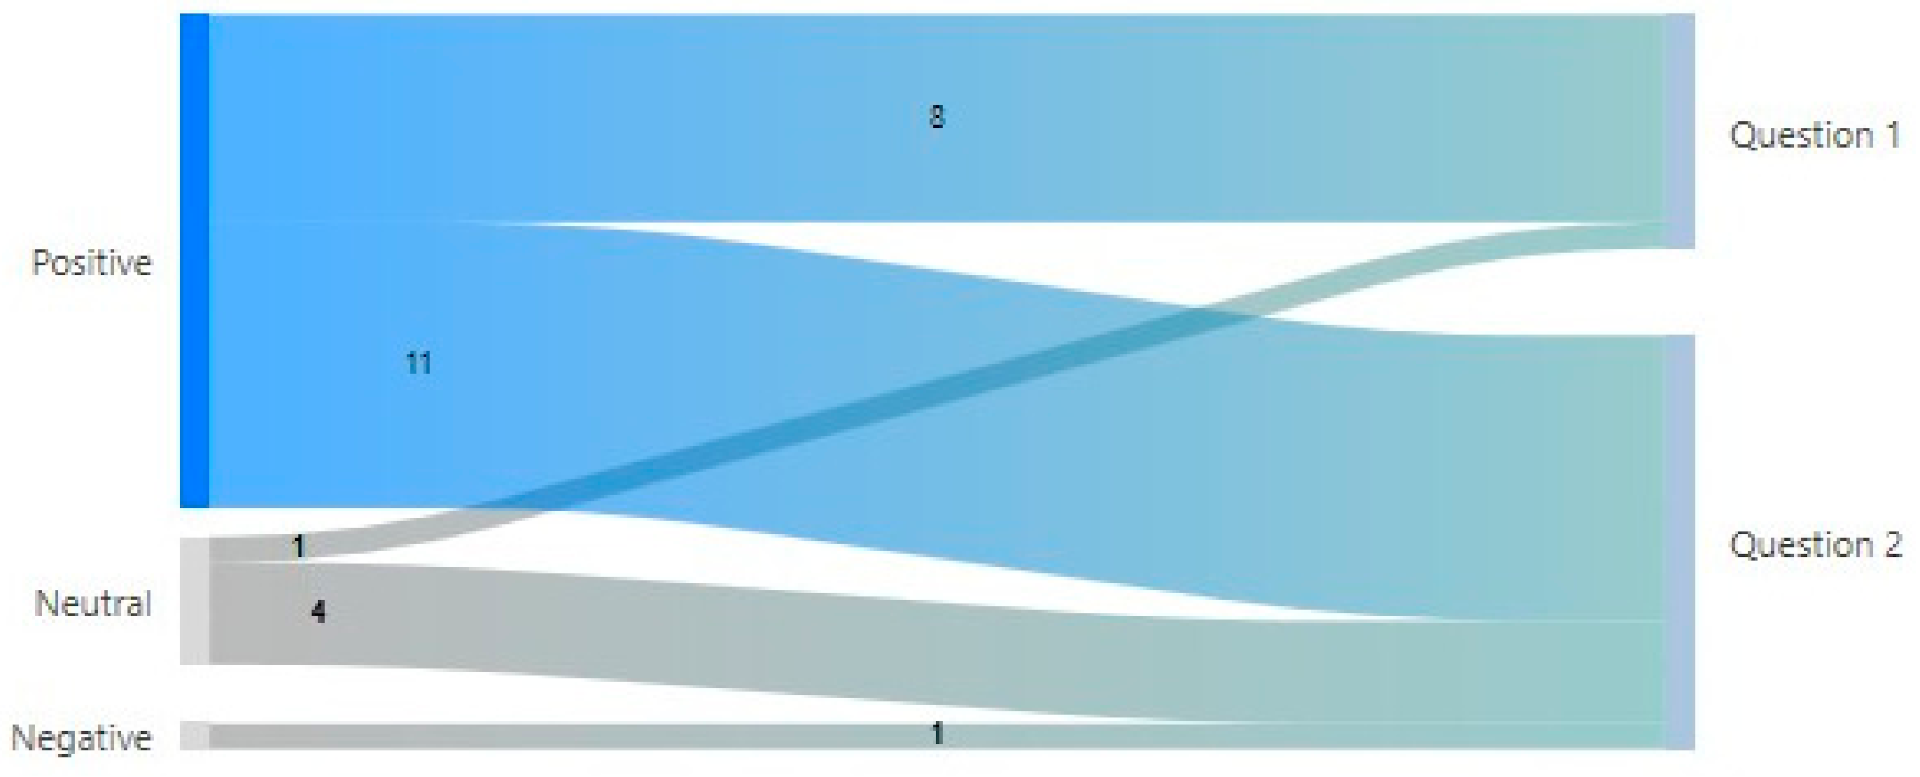
  • To check students’ satisfaction with the teaching process and the monitoring of learning.
The research questions (RQ) related to the objectives are:
RQ1:
There will be different activity clusters in the Moodle platform depending on the log collection phases (initial, intermediate, and final);
RQ2:
There will be differences in the groupings obtained in the clusters in the log collection phases (initial, intermediate, and final) depending on the algorithm applied (k-means ++, fuzzy k-means, DBSCAN);
RQ3:
There will be differences in the clustering obtained in the log collection phases (initial, intermediate, and final) depending on the applied algorithm (k-means ++, fuzzy k-means, DBSCAN) providing a better fit in the DBSCAN algorithm;
RQ4:
Students will perceive the monitoring of their learning performed with the UBUMonitor application as reflected in high levels of satisfaction in the Questionnaire of Student Opinion on Quality of Teaching (QSOQT).

2. Materials and Methods

2.1. Participants

Convenience sampling was used, which previously found the estimated sample size over the total student population (n = 64) at a 90% confidence level, with a 3% precision and a 5% ratio of 44, with an expected 10% loss ratio, with an adjusted sample of 49 students [40]. In this study, a sample of 49 students (41 females and 8 males) was used. Table 1 presents the descriptive statistics of the sample with respect to the age variable and the gender disaggregation.

2.2. Instruments

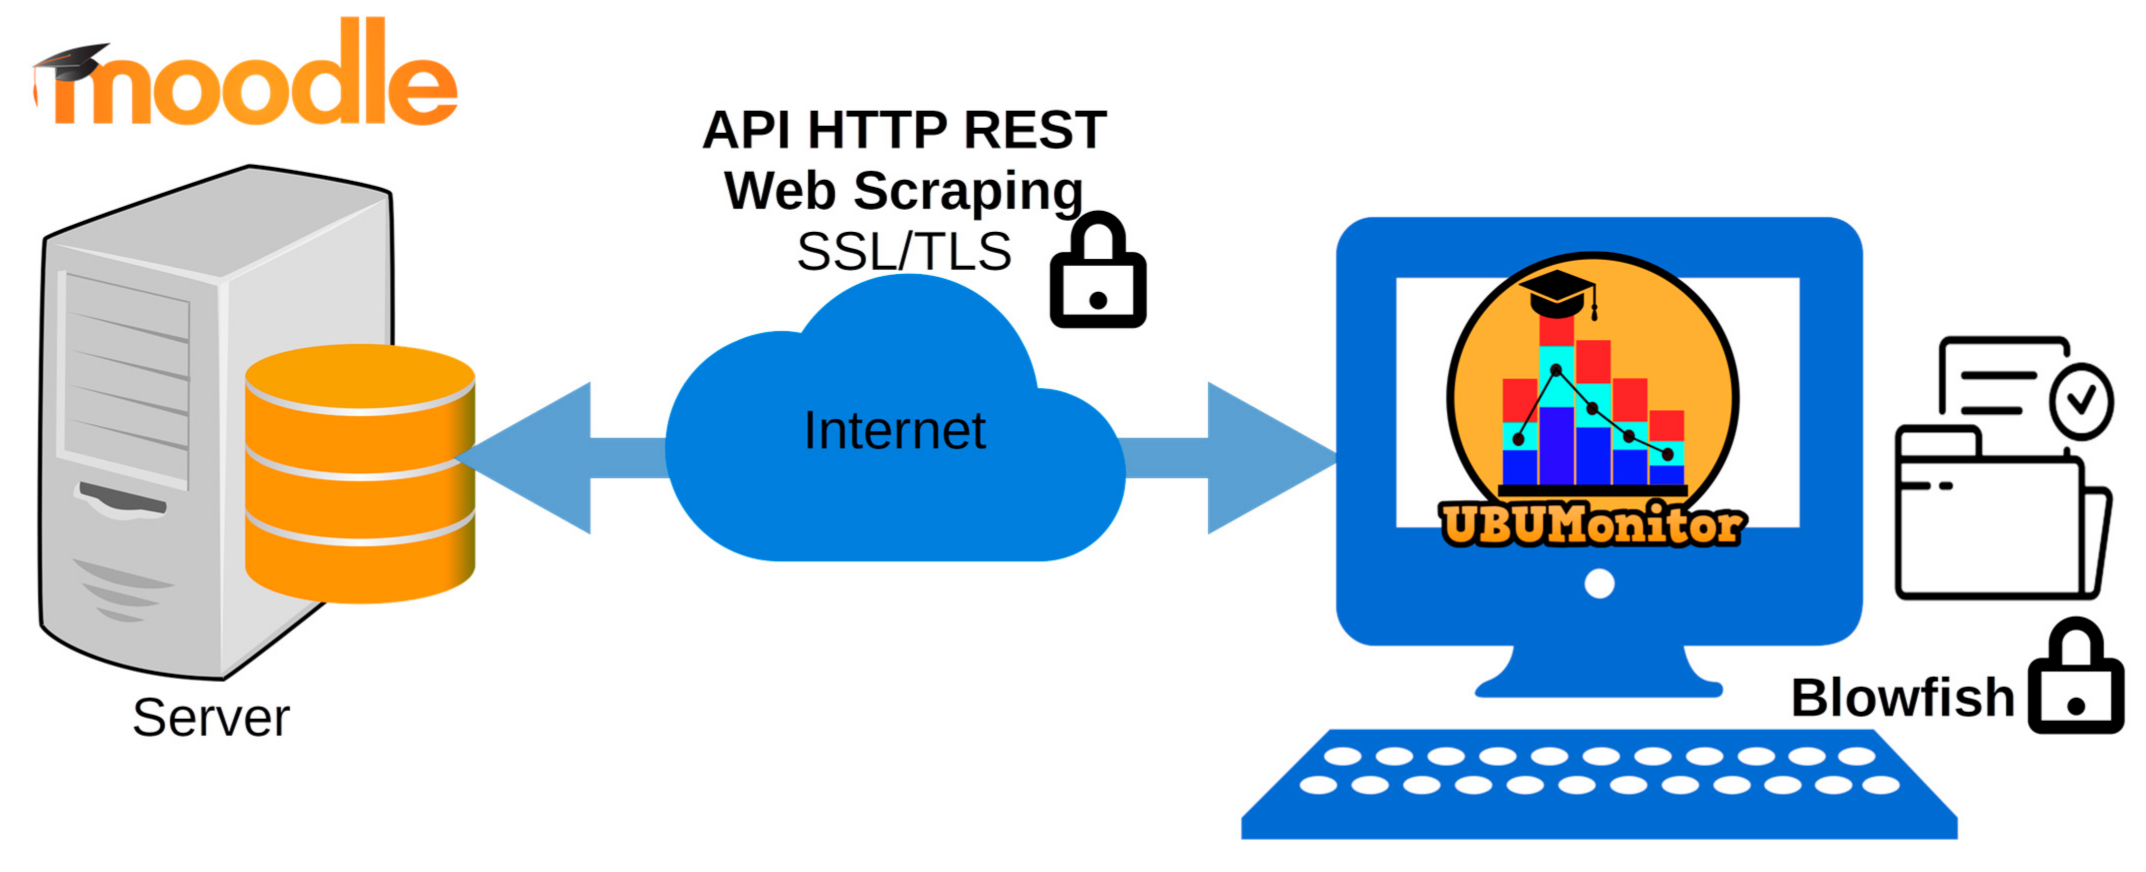
2.2.1. UBUMonitor Tool

UBUMonitor [35] is a desktop application executed on the client, implemented with Java, and with a graphic interface developed in JavaFX. The application connects to the selected Moodle server, through web services and the REST API provided by the server. In the absence of web services to some specific data recovery, web scraping techniques are additionally used. All communication between the Moodle server and the UBUMonitor client is encrypted by HTTPS protocol for security reasons. As a result of these queries, the data are obtained in JSON and CSV format and are processed and transformed in the client into Java objects. For the visualisation of the collected data, the hybrid solution of applying Java and embedding web pages with different graphic JavaScript libraries, within the desktop application, is used. The data can be saved on the client to optimise access times in subsequent queries and offline access to the data, using the serialisation mechanism available in Java. The serialised files with the subject data are stored encrypted with the Blowfish algorithm [41]. A diagram of the operation of the tool can be found in Figure 2. This application is open source and free of charge and includes four modules: (1) visualisation module (allows an analysis of the access frequencies in components, events, sections, or course seen in Moodle) with options to analyse logs in different graphics (boxplot, etc.). All the visualisation options allow the export in graphic format and in .csv format, for the elaboration of reports and their subsequent analysis with other tools; (2) the comparison module analyses the student logs in the components, events, sections or course seen in Moodle, grades and completion of activities, giving information about the frequencies from a visual comparison in ranking and in evolution analysis of the selected students); (3) risk of dropping out module (gives information by intervals (0–3 days, 3–7 days, 7–14 and more than 7 days) about students’ access to the subject and about access to the Moodle platform; (4) clustering module allows finding the clusters from different algorithms (k-means ++, fuzzy k-means, DBSCAN, MutiMeans++, etc.) and from different distances (Euclidean, Manhattan, etc.) that are processed from two Java libraries [42,43].

2.2.2. Teaching Methodology

A methodology based on SRL and PBL was used [44], and a continuous assessment system that included 5 assessment procedures were implemented in the Moodle platform (UBUVirtual). Teaching was carried out in the second half of the 2019–2020 academic year, coinciding with the lockdown due to the state of alarm caused by COVID-19 decreed in Spain on 14 March 2020.

2.2.3. Questionnaire of Student Opinion on Quality of Teaching—QSOQT—by Bol, Sáiz and Pérez-Mateos (2012)

QSOQT [45] it is a survey based on the Student Evaluation of Educational Quality (SEEQ)—Short version by Herbert Marsh [46]. This is an opinion survey that contains 11 closed questions measured on a Likert-type scale from 1 to 5 (total reliability of the scale α = 0.92) distributed in the following clusters: student motivation (1 item) (α = 0.75), subject materials (3 items) (α = 0.80), continuous assessment (2 items) (α = 0.80), student perception of teacher motivation (3 items) (α = 0.77), student perception of coursework (1 item) (α = 0.97), and overall satisfaction with teaching (1 item) (α = 0.92). This survey is available in open access [47] and has been validated by obtaining an overall reliability index of α = 0.92 and by the components student motivation α = 0.91, subject materials α = 0.91, continuous assessment α = 0.91, student perception of teacher motivation α = 0.91, student perception of coursework α = 0.93, and overall satisfaction with teaching α = 0.92. It also includes two open questions: “Which of this teacher’s characteristics has been the most important for your learning?” and “How do you consider that the teaching and assessment has been adapted during the special situation period by the COVID-19?”

2.3. Procedure

Authorisation was obtained from the Bioethics Committee of the University of Burgos (No. IR 30/2019). Student participation was voluntary and without financial compensation. Written informed consent was obtained from all participants. Work was carried out during the second semester of the academic year 2019–2020. The methodology applied was PBL and SRL [44] on a Moodle platform (UBUVirtual) with a continuous assessment procedure throughout the development of the course [2]. The semester concentrated on a nine-week duration and three follow-up measurements were carried out: an initial measurement (after two weeks), an intermediate measurement (after four weeks), and a final measurement (after eight weeks). The initial measurement was carried out after two weeks, because during this period, the students were able to see resources and carry out activities. This gives the teacher an indicator of whether there are any students who have not done so as often as expected. A measurement was also taken in the fourth week, because this would be the halfway point in the subject course and the teacher can check the evolution of their students and whether the measures they have implemented in the case of students in which problems were detected in the initial measurement have been useful and have prevented non-participation. If not, other actions can be employed to achieve this aim. Finally, the last measurement was carried out in the penultimate week of the course to check the development of all the students in the LMS and to see whether the measures or actions implemented in the initial and intermediate measurement have made it possible for the students at risk to be incorporated at a satisfactory pace of interaction and achievement of the academic competences. The UBUMonitor tool [35] was then used to monitor the students in Moodle. The analyses described in Section 2.4 were then applied.

2.4. Statistical Analysis

A descriptive-correlational design was applied. In order to contrast the objectives, frequency analysis (heat maps) and unsupervised learning techniques were applied (the aim was to find out the groupings of students at three points in the teaching–learning process (initial, intermediate, and final), in particular cluster analysis (k-means ++, fuzzy k-means, DBSCAN); unsupervised learning techniques were applied because the aim was to find out the groupings of students at three points in the teaching–learning process, initial, intermediate, and final. Additionally, we have applied the Manhattan distance. This is the distance between two points p and q as the sum of the absolute differences between each dimension; this measure is less affected by outliers and is sturdier than the Euclidean distance because it does not square the differences. Strictly speaking, k-means using the Manhattan distance is not k-means because the centroids are no longer means. Nevertheless, we still use that name. Several implementations of the k-means method allow to use different distances and they do not change its name. Also, the Friedman Test for k-dependent samples is applied to check whether the allocation differences between the three clusters and goodness-of-fit indices to analyse the adjusted between different clustering algorithms. In addition, we have included the adjusted Rand Index. The SPSS v.24 [48] statistical package, AMOS v.24 [49], and the UBUMonitor monitoring tool (35) that includes two Java clustering libraries [42,43] were used to perform the analyses. The qualitative analysis of the QSOQT open-ended questions was performed using word cloud and sentiment analysis with ATLAS.ti v.9 [50].

3. Results

To check the first objective, the UBUMonitor [35] tool was used to analyse the logs of Moodle v.3.8 (UBUVirtual platform of the University of Burgos). The description of the tool can be found in Section 2.2.1. The semester started on (3 February 2020) and the initial measurement was made after two weeks (17 February 2020), the intermediate measurement after four weeks (2 March 2020) and the final measurement after eight weeks (30 March 2020). The components Assignment, Feedback, File, File submissions, Folder, Glossary, Quiz and URL were analysed. The formats chosen were boxplots (see Figure 3) and heat maps (see Figure 4). In all the visual analyses, if the teacher was positioned at the top or at the bottom, they could see the name of the student and detect the student at risk (outliers at the bottom) or the student with high performance (outliers at the top). Additionally, a frequency analysis could be performed on the heat hap to visually detect those students where the interaction had been marked in red. This tool allows, besides the visualisation of the data, the export of them to a .csv file.
In order to check the second and third objectives and RQ2 and RQ3, firstly, the clusters were found with the three algorithms used (k-means ++, fuzzy k-means and DBSCAN) in the three periods of initial measurement (see Figure 5), intermediate measurement (see Figure 6), and final measurement (see Figure 7). These figures are the result of applying a principal component analysis (PCA). DBSCAN’s plots show some grey points because they are not assigned to any cluster. Only two components were used because the third component only explained 0.04 more of the variance in the initial measurement, 0.02 in the intermediate measurement, and 0.01 in the final measurement. It was also found that the initial assessment explained 94.4% of the variance, the intermediate measurement 96.3%, and the final measurement 98.3%. Moreover, it should also be noted that graphs with three components are more difficult to visualise.
The adjusted Rand Index was applied; the result is a measure of how similar two clusterings for the same data are. An adjusted Rand index has a value between −1 and 1, with 1 indicating that the two data clusterings agree exactly on every pair of points, and 0 is the expected value for randomly created clusters. DBSCAN does not always assign a cluster to an instance; therefore, for this calculation, it has been considered that all the instances labelled as noise are assigned to an additional cluster. The most similar clusters according to the metric are k-means ++ (with the final dataset) and fuzzy k-means (also with the final data set). Usually, adjusted Rand index is used when the correct clusters are known, comparing them with the clusters obtained by some method. In our case, we are in a truly unsupervised setting, and the correct clusters are unknown. Hence, the adjusted Rand index has been used to compare the clustering obtained with different methods and/or moments. In Table 2 is presented the matrix of adjusted Rand index, the colours indicating the degree of relationship; blue represents a low relationship (interval 0–>0.20), orange represents an intermediate relationship (interval 0.20–>0.50), and green represents a high relationship (interval < 0.50–1).
In addition, a goodness-of-fit index was then applied [51]. No perfect fit was found in any of the algorithms, although the DBSCAN algorithm was the best fit in the Akaike information criterion (AIC) and parsimony index (ECVI) indicators (see Table 3). In order to check whether the allocation differences between the three clusters were significant, the Friedman test for k-dependent samples was applied. No significant differences were observed between the three algorithms in the three measurements (see Table 4).
In summary, the behaviour of the students on the platform depending on the analysis period (initial, intermediate, and final) was different and a higher activity was detected in the initial period and in the intermediate period, falling in the final measurement period (see Figure 8).
This evaluation is sensible because the course uses the PBL methodology, and the initial and medium period is where students should have a greater interaction with the resources of the LMS; in the final period, the students are preparing the presentation of the project and the interaction in the platform is less.
Regarding the fourth objective and RQ4, it was found in QSOQT [45] that there was an average general satisfaction of 4.56 out of 5 (SD = 0.63), and disaggregated by components it was 4.38 out of 5 (SD = 0.62); 4.58 out of 5 (SD = 0.58) in subject materials; 4.38 out of 5 (SD = 0.72) in continuous assessment; 4.77 out of 5 (SD = 0.40) in student perception of teacher motivation; and 3.76 out of 5 (SD = 0.75) in the student perception of coursework. Student satisfaction with the subject was higher by an interval of 0.5–1.5 points above the average for the other subjects. On the other hand, the comments to the first and second open question were analysed with the qualitative analysis tool ATLAS.ti 9, for which a word cloud analysis (see Figure 9) and a sentiment analysis on a categorisation of positive negative and neutral feelings in each of the statements (see Figure 10) were carried out. These were found to have 25 frequencies (1 in negative categorisation, 5 in neutral categorisation, and 19 in positive categorisation).

4. Discussion

The society of the 21st century is constantly developing, with technological advances occurring continuously and at great speed. The educational environment is one of the areas in which these technological advances have a great applicability, for which it is necessary to make changes in the methodology and teaching resources. An essential point, especially in Higher Education, is the way in which the teaching–learning process takes place. This process is increasingly taking place within LMSs, be it F2F teaching, blended learning, or e-learning. Therefore, teachers need tools to help them in their educational work, which must go beyond the transmission of knowledge, and in the monitoring of their students’ learning processes. This monitoring, which in the past could be done through classroom observation, now requires the use of technological tools. This situation has become even more relevant and pressing due to the COVID-19 health crisis. Consequently, it can be concluded that it is important for LMSs to incorporate simple and easy-to-use student learning process monitoring systems for teachers in LMS teaching environments. In addition, these systems need to provide enough information for the early detection of students at risk. Such detection is the only possibility to prevent academic failure because it allows the teacher to offer personalised learning to the student. To this end, LMSs need to incorporate EDM and artificial intelligence techniques that facilitate accurate analysis and the visualisation of results. This will ensure that teachers can use these systems and interpret the results in order to make better decisions. Furthermore, it should not be forgotten that in addition to the need to incorporate simple, accurate and highly usable monitoring systems in the LMS, it is also important to ensure that the results of the LMS can be used by the teacher to make better decisions. Specifically, in this study, we have applied the UBUMonitor tool, which proved to be a very useful instrument for the detection of students at risk in the marked analysis periods (initial, intermediate, and final). The visualisation of the students’ behaviours in the chosen components with the boxplot item and heat map graphics allowed the visualisation of the students that were at the extremes (above and below) in the different components used in the Moodle platform. This made it easier for the teacher to provide personalised tutoring to avoid early dropouts. Additionally, the clustering module of UBUMonitor made it possible to obtain the clusters with different algorithms. In this study the algorithms k-means ++, fuzzy k-means, and DBSCAN were used in the three analysis periods (initial, intermediate, and final). This functionality allowed the teacher to quickly analyse the grouping of students in different monitoring periods. In this work, different assignments were found between the three algorithms; these were not significant, although the best fit values were found with the DBSCAN algorithm [39].

5. Conclusions

In short, teaching in Higher Education is increasingly being done in blended learning or e-learning modes in LMSs (e.g., Moodle). This fact has been accelerated in the current health crisis caused by COVID-19, and LMSs are a way that enable the continuity of teaching in safe environments. For this reason, teachers need easy-to-use tools that help them to monitor the learning process and detect students at risk from an early stage. This detection enables teachers to offer personalised teaching through the aids that each student needs at each moment of the semester. In this study, the monitoring of students and personalised intervention has led to low drop-out rates (7%) and high student satisfaction with the teaching–learning process (4.56 out of 5). However, this research has the limitations of being a case study (application of the UBUMonitor tool to teaching in a specific subject). Nevertheless, its objective was to demonstrate a free access tool for the detection of students at risk and the prevention of early drop-out.
On the other hand, in this study, no significant differences in the fit between the three algorithms applied were found, although DBSCAN presented parameters closer to the correct fit, as pointed out in the studies by Ilieva and Yankova [22] and Arthur and Vassilvitskii [39]. However, when applying an unsupervised method, clustering, we do not know the perfect cluster. However, this aspect will be tested in further research with larger and more heterogeneous samples of students. These are the challenges that educational leaders and teachers at university level face in 21st century society, and to address them more research and funding is needed both in the improvement of LMS tools from the incorporation of student tracking modules that include artificial intelligence and data mining and the improvement of teacher training in active methodologies, SRL and continuous assessment systems within the LMS. In summary, it can be concluded that effective teaching in the 21st century society requires different technological and training resources that must go hand in hand in order to achieve a successful teaching–learning process.

6. Patents

Marticorena Sánchez, R., Peng Ji, Y., y Pardo Aguilar, C. (2019). UBUMonitor-Monitorización de alumnos en la plataforma Moodle (UBUMonitor-Monitoring of students on the Moodle platform). Intellectual Property Registry. Software. Ministry of Culture (Spain). N BU-107-19.

Author Contributions

Conceptualization, M.C.S.-M., J.J.R.-D., R.M.-S. and J.F.D.-P.; methodology, M.C.S.-M., J.J.R.-D. and J.F.D.-P.; software, R.M.-S. and Y.P.J.; validation, M.C.S.-M., J.J.R.-D. and J.F.D.-P.; formal analysis, M.C.S.-M., J.J.R.-D. and J.F.D.-P.; investigation, M.C.S.-M. and S.R.-A.; resources, M.C.S.-M., J.J.R.-D. and J.F.D.-P.; data curation, M.C.S.-M.; writing—original draft preparation, M.C.S.-M., J.J.R.-D. and R.M.-S.; writing—review and editing, M.C.S.-M., J.J.R.-D., R.M.-S., J.F.D.-P. and S.R.-A.; visualization, M.C.S.-M., J.J.R.-D., R.M.-S. and J.F.D.-P.; supervision, M.C.S.-M., J.J.R.-D., R.M.-S., J.F.D.-P. and S.R.-A.; project administration, M.C.S.-M.; funding acquisition, M.C.S.-M. and S.R.-A. All authors have read and agreed to the published version of the manuscript.

Funding

This research was funded by CONSEJERÍA DE EDUCACIÓN DE LA JUNTA DE CASTILLA Y LEÓN (Spain), grant number BU032G19.

Institutional Review Board Statement

The ETHICS COMMITTEE OF THE UNIVERSITY OF BURGOS approved this study, N IR 30/2019. In each case, written informed consent was requested from the students who participated in this research. They all gave their written informed consent in accordance with the Declaration of Helsinki.

Informed Consent Statement

Written informed consent was obtained from all subjects involved in the study.

Acknowledgments

To the third-year students of the Degree in Occupational Therapy of the University of Burgos in the academic year 2019–2020 for participating in this study. To the Vice-rectorate of Academic Policy and the Virtual Teaching Centre of the University of Burgos for promoting the development of the UBUMonitor tool through the aid granted by the Junta de Castilla y Léon to the Project (BU-2018-01) to support the development of on-line training co-financed by the European Regional Development Fund.

Conflicts of Interest

The authors declare no conflict of interest.

References

  1. Sáiz-Manzanares, M.C.; Marticorena-Sánchez, R.; Ochoa-Orihuel, J. Effectiveness of using voice assistants in learning: A study at the time of covid-19. Int. J. Environ. Res. Public Health 2020, 17, 5618. [Google Scholar] [CrossRef] [PubMed]
  2. Sáiz-Manzanares, M.C.; Marticorena-Sánchez, R.; García-Osorio, C.I. Monitoring students at the university: Design and application of a moodle plugin. Appl. Sci. 2020, 10, 3469. [Google Scholar] [CrossRef]
  3. Carbonero, M.Á.; Martín-Antón, L.J.; Flores, V.; Freitas, A.R. Estudio comparado de los estilos de enseñanza del profesorado universitario de ciencias sociales en España y Brasil [Comparative study of the teaching styles of university social science teachers in Spain and Brazil]. Rev. Complut. Educ. 2017, 28, 631–647. [Google Scholar] [CrossRef] [Green Version]
  4. Cantabella, M.; Martínez-España, R.; Ayuso, B.; Yáñez, J.A.; Muñoz, A. Analysis of student behavior in learning management systems through a Big Data framework. Futur. Gener. Comput. Syst. 2019, 90, 262–272. [Google Scholar] [CrossRef]
  5. Slater, S.; Joksimović, S.; Kovanovic, V.; Baker, R.S.; Gasevic, D. Tools for Educational Data Mining: A Review. J. Educ. Behav. Stat. 2017, 42, 85–106. [Google Scholar] [CrossRef]
  6. Luna, J.M.; Castro, C.; Romero, C. MDM tool: A data mining framework integrated into Moodle. Comput. Appl. Eng. Educ. 2017, 25, 90–102. [Google Scholar] [CrossRef]
  7. Ventura, S.; Luna, J.M. Supervised Descriptive Pattern Mining. Supervised Descriptive Pattern Mining, 1st ed.; Springer: Cham, Switzerland, 2018. [Google Scholar] [CrossRef]
  8. Ahmed, S.A.; Khan, S.I. A Machine Learning Approach to Predict the Engineering Students at Risk of Dropout and Factors Behind: Bangladesh Perspective. In Proceedings of the 10th International Conference on Computing, Communication and Networking Technologies (ICCCNT), Kanpur, India, 6–8 July 2019; pp. 1–6. [Google Scholar] [CrossRef]
  9. Romero, C.; Ventura, S. Educational data mining: A review of the state of the art. IEEE Trans. Syst. Man Cybern. Part C Appl. Rev. 2010, 40, 601–618. [Google Scholar] [CrossRef]
  10. Angeli, C.; Howard, S.K.; Ma, J.; Yang, J.; Kirschner, P.A. Data mining in educational technology classroom research: Can it make a contribution? Comput. Educ. 2017, 113, 226–242. [Google Scholar] [CrossRef] [Green Version]
  11. Sáiz-Manzanares, M.C.; Osorio, C.I.G.; Díez-Pastor, J.F.; Antón, L.J.M. Will personalized e-Learning increase deep learning in higher education? Inf. Discov. Deliv. 2019, 47, 53–63. [Google Scholar] [CrossRef]
  12. Jommanop, T.; Mekruksavanich, S. e-Learning Recommendation Model Based on Multiple Intelligence. In Proceedings of the 14th International Joint Symposium on Artificial Intelligence and Natural Language Processing iSAI-NLP, Chiang Mai, Thailand, 30 October–1 November 2019; pp. 1–6. [Google Scholar] [CrossRef]
  13. Benner, J.; McArthur, J.J. Data-driven design as a vehicle for BIM and sustainability education. Buildings 2019, 9, 103. [Google Scholar] [CrossRef] [Green Version]
  14. Li, X.; Jiang, Z.; Guan, Y.; Li, G.; Wang, F. Fostering the transfer of empirical engineering knowledge under technological paradigm shift: An experimental study in conceptual design. Adv. Eng. Inform. 2019, 41, 100927. [Google Scholar] [CrossRef]
  15. Sáiz-Manzanares, M.C.; Báez Sánchez, M.Á.; Ortega-López, V.; Manso-Villalaín, J.M. Self-Regulation and Rubrics Assessment in Structural Engineering Subjects. Educ. Res. Int. 2015, 2015, 340521. [Google Scholar] [CrossRef] [Green Version]
  16. Sáiz-Manzanares, M.C.; García-Osorio, C.I.; Díez-Pastor, J.F. Differential efficacy of the resources used in B-learning environments. Psicothema 2019, 31, 170–178. [Google Scholar] [CrossRef] [PubMed]
  17. Sáiz-Manzanares, M.C.; Marticorena-Sánchez, R.; García-Osorio, C.I.; Díez-Pastor, J.F. How do B-learning and learning patterns influence learning outcomes? Front. Psychol. 2017, 8, 1–13. [Google Scholar] [CrossRef] [PubMed] [Green Version]
  18. Schneider, K.; Berens, J.; Burghoff, J. Early detection of student dropout: What is relevant information? J. Educ. 2019, 22, 1121–1146. [Google Scholar] [CrossRef]
  19. Kosheleva, O.; Villaverde, K. Studies in Computational Intelligence 750 How Interval and Fuzzy Techniques Can Improve Teaching Processing Educational Data: From Traditional Statistical Techniques to an Appropriate Combination of Probabilistic, Interval, and Fuzzy Approaches, 1st ed.; Springer: El Paso, TX, USA, 2018. [Google Scholar] [CrossRef]
  20. Cerezo, R.; Sánchez-Santillán, M.; Paule-Ruiz, M.P.; Núñez, J.C. Students’ LMS interaction patterns and their relationship with achievement: A case study in higher education. Comput. Educ. 2016, 96, 42–54. [Google Scholar] [CrossRef]
  21. Dimić, G.; Rančić, D.; Pronić-Rančić, O.; Spalević, P. Descriptive Statistical Analysis in the Process of Educational Data Mining. In Proceedings of the 14th International Conference on Advanced Technologies, Systems and Services in Telecommunications TELSIKS, Nis, Serbia, 23–25 October 2019; pp. 388–391. [Google Scholar] [CrossRef]
  22. Ilieva, G.; Yankova, T. Early multi-criteria detection of students at risk of failure. TEM J. 2020, 9, 344–350. [Google Scholar] [CrossRef]
  23. Fakhrusy, M.R.; Widyani, Y. Moodle Plugins for Quiz Generation Using Genetic Algorithm. In Proceedings of the International Conference on Data and Software Engineering (ICoDSE), Palembang, Indonesia, 1–2 November 2017; pp. 1–6. [Google Scholar] [CrossRef]
  24. Brito, M.; Medeiros, F.; Bezerra, E. A Report-Type Plugin to Indicate Dropout Risk in the Virtual Learning Environment Moodle. In Proceedings of the 19th International Conference on Advanced Learning Technologies (ICALT), Macei, Brazil, 15–18 July 2019; pp. 127–128. [Google Scholar] [CrossRef]
  25. Peramunugamage, A.; Usoof, H.; Hapuarachchi, J. Moodle mobile plugin for problem-based learning (PBL) in engineering education. In Proceedings of the 2019 IEEE Global Engineering Education Conference (EDUCON), Dubai, United Arab Emirates, 8–11 April 2019; IEEE: Dubai, United Arab Emirates, 2019; pp. 827–835. [Google Scholar] [CrossRef]
  26. Kadoić, N.; Oreški, O. Analysis of Student Behavior and Success Based on Logs in Moodle. In Proceedings of the 2018 41st International Convention on Information and Communication Technology, Electronics and Microelectronics (MIPRO), Opatija, Croacia, 21–25 May 2018; pp. 654–659. [Google Scholar] [CrossRef]
  27. Badea, G.; Popescu, E.; Sterbini, A.; Temperini, M. Integrating Enhanced Peer Assessment Features in Moodle Learning Management System. In Foundations and Trends in Smart Learning, Proceedings of the International Conference on Smart Learning Environments; Lecture Notes in Educational, Technology; Denton, TX, USA, 18–20 March 2019, Chang, M., Popescu, E., Kinshuk, C.N., Jemni, M., Huang, R., Spector, J.M., Sampson, D.G., Eds.; Springer: Singapore, 2019; pp. 135–144. [Google Scholar] [CrossRef]
  28. Reynaldo, V.; Wicaksana, A.; Hansun, S. Brotli data compression on moodle-based E-learning server. ICIC Int. Express Lett. Part B Appl. 2019, 10. [Google Scholar] [CrossRef]
  29. Gueye, A.D.; Faye, P.M.D.; Gueye, B.; Lishou, C. Scheduling Synchronous Tutoring Sessions in Learning Activities. In The Challenges of the Digital Transformation in Education. ICL 2018. Advances in Intelligent Systems and Computing; Auer, M., Tsiatsos, T., Eds.; Springer: Cham, Switzerland, 2018; Volume 916, pp. 344–352. [Google Scholar] [CrossRef]
  30. Badea, G.; Popescu, E.; Sterbini, A.; Temperini, M. Exploring the Peer Assessment Process Supported by the Enhanced Moodle Workshop in a Computer Programming Course. In Proceedings of the 9th International Conference, Workshops (MIS4TEL 2019), Advances in Intelligent Systems and Computing, L’Aquila, Italy, 17–19 June 2019; Popescu, E., Gil, A.B., Lancia, L., Sica, L.S., Mavroudi, A., Eds.; Springer: Cham, Switzerland; pp. 124–131. [Google Scholar] [CrossRef]
  31. Dobudko, T.V.; Ochepovsky, A.V.; Gorbatov, S.V.; Hashim, W.; Maseleno, A. Functional monitoring and control in electronic information and educational environment. Int. J. Recent Technol. Eng. 2019, 8, 1383–1386. [Google Scholar] [CrossRef]
  32. Romero, C.; Ventura, S.; García, E. Data mining in course management systems: Moodle case study and tutorial. Comput. Educ. 2018, 51, 368–384. [Google Scholar] [CrossRef]
  33. Hooshyar, D.; Yang, Y.; Pedaste, M.; Huang, Y.M. Clustering Algorithms in an Educational Context: An Automatic Comparative Approach. IEEE Access 2020, 8, 146994–147014. [Google Scholar] [CrossRef]
  34. Dobashi, K.; Ho, C.P.; Fulford, C.P.; Lin, M.F.G. A Heat Map Generation to Visualize Engagement in Classes Using Moodle Learning Logs. In Proceedings of the Name of the 2019 4th International Conference on Information Technology (InCIT), Bangkok, Thailand, 24–25 October 2019; pp. 138–143. [Google Scholar] [CrossRef]
  35. Ji, Y.P.; Marticorena-Sánchez, R.; Pardo-Aguilar, C. UBU Monitor: Monitoring of Students on the Moodle Platform. 2018. Available online: https://github.com/yjx0003/UBUMonitor (accessed on 24 December 2020).
  36. Félix, I.M.; Ambrósio, A.P.; Neves, P.S.; Siqueira, J.; Brancher, J.D. Moodle Predicta: A Data Mining Tool for Student Follow Up. In Proceedings of the 9th International Conference on Computer Supported Education (CSEDU), Porto, Portugal, 21–23 April 2017; pp. 339–346. [Google Scholar] [CrossRef]
  37. Saqr, M.; Fors, U.; Tedre, M. How learning analytics can early predict under-achieving students in a blended medical education course. Med. Teach. 2017, 39, 757–767. [Google Scholar] [CrossRef] [PubMed]
  38. García, S.; Luengo, J.; Herrera, J. Data Preprocessing in Data Mining. In Intelligent Systems Reference Library; Springer: New York, NY, USA, 2015; Volume 72. [Google Scholar] [CrossRef]
  39. Arthur, D.; Vassilvitskii, S. k-means ++: The Advantages of Careful Seeding. In Proceedings of the Eighteenth annual ACM-SIAM Symposium on Discrete Algorithms 2006, Miami, FL, USA, 22–26 January 2006; pp. 1027–1035. [Google Scholar]
  40. Fernández, S.P. Unidad de Epidemiología Clínica y Bioestadística. Complexo Hospitalario Universitario de A Coruña [Clinical Epidemiology and Biostatistics Unit University Hospital Complex of A Coruña]. Cad. Aten. Primaria 1993, 3, 138–141. Available online: https://www.fisterra.com/formacion/metodologia-investigacion/determinacion-tamano-muestral (accessed on 5 January 2021).
  41. Schneier, B. Description of a New Variable-Length Key, 64-bit Block Cipher (Blowfish). In Fast Software Encryption; Anderson, R., Ed.; Springer: Berlin/Heidelberg, Germany, 1993; Volume 809, pp. 191–204. [Google Scholar] [CrossRef] [Green Version]
  42. The Apache Software Foundation. No TitlMath-Commons Math: The Apache Commons Mathematics Librarye. 2016. Available online: https://commons.apache.org/proper/commons-math/ (accessed on 15 March 2021).
  43. Li, H. Smile Statistical Machine Intelligence and Learning Engine. 2020. Available online: https://haifengl.github.io/ (accessed on 27 December 2020).
  44. Sáiz-Manzanares, M.C. E-Project Based Learning en Terapia Ocupacional: Una Aplicación en la Asignatura “Estimulación Temprana” [E-Project Based Learning in Occupational Therapy: An Application in the Subject “Early Stimulation”], 1st ed.; Servicio de Publicaciones de la Universidad de Burgos: Burgos, Spain, 2018. [Google Scholar]
  45. Bol-Arreba, A.; Sáiz-Manzanares, M.C.; Pérez-Mateos, M. Validation of Test Teaching Activity in Higher Education Open Classroom. Open Classr. 2013, 41, 45–54. Available online: https://cutt.ly/zjiSwLN (accessed on 2 January 2021).
  46. Marsh, H.W. Students’ Evaluations of University Teaching: Dimensionality, Reliability, Validity, Potential Biases and Usefulness. In The Scholarship of Teaching and Learning in Higher Education: An Evidence-Based Perspective; Perry, R.P., Smart, J.C., Eds.; Springer: Dordrecht, The Netherlands, 2007; pp. 319–384. [Google Scholar] [CrossRef]
  47. University of Burgos. Student Opinion Survey on the Quality of Teaching (QSOQT). 2012. Available online: https://www.ubu.es/sites/default/files/portal_page/files/encuesta_revisada_v2014.pdf (accessed on 29 December 2020).
  48. IBM Corporation. SPSS Statistical Package for the Social Sciences (SPSS); Version 24; IBM: Madrid, Spain, 2016. [Google Scholar]
  49. IBM Corporation. AMOS SPSS Statistical Package for the Social Sciences (SPSS); Version 24; IBM: Madrid, Spain, 2016. [Google Scholar]
  50. Atlas.ti. Software Package Qualitative Data Analysis; Version 8; Atlas.ti Scientific Software Development; GmbH: Berlin, Germany, 2020; Available online: https://atlasti.com/es/ (accessed on 31 December 2020).
  51. Bandalos, D.L.; Finney, S.J. Item parceling issues in structural equation modeling. In New Development and Techniques in Structural Equation Modeling; Marcoulides, G.A., Schumacker, R.E., Eds.; Lawrence Erlbaum Associates: Mahwah, NJ, USA, 2001; pp. 269–296. [Google Scholar]
Figure 1. Heat map of weekly student monitoring in Moodle using UBUMonitor [35].
Applsci 11 02677 g001
Figure 2. Diagram of the operation of the UBUMonitor [35].
Applsci 11 02677 g002
Figure 3. Boxplot of the weekly monitoring of students and detection of outliers in Moodle carried out with UBUMonitor [35].
Applsci 11 02677 g003
Figure 4. Heat map of the weekly monitoring of students and detection of outliers in Moodle carried out with UBUMonitor [35].
Applsci 11 02677 g004
Figure 5. Cluster analysis in the initial measurement (two weeks after the beginning of the semester) with the k-means ++, fuzzy k-means, density-based spatial clustering of applications with noise (DBSCAN) algorithms.
Applsci 11 02677 g005
Figure 6. Cluster analysis in the intermediate measurement (four weeks after the beginning of the semester) with the k-means ++, fuzzy k-means, DBSCAN algorithms.
Applsci 11 02677 g006
Figure 7. Cluster analysis in the final measurement (eight weeks after the beginning of the semester) with the k-means ++, fuzzy k-means, DBSCAN algorithms.
Applsci 11 02677 g007
Figure 8. Graph of the evolution of the risk of abandonment (not access to the LMS) over the semester and analysed by week using the UBUMonitor tool [35].
Applsci 11 02677 g008
Figure 9. Word clouds on the answers to questions 1 (a) and 2 (b) in the QSOQT [45].
Applsci 11 02677 g009
Figure 10. Sentimental analysis of answers to questions 1 and 2 in the QSOQT [45].
Applsci 11 02677 g010
Table 1. Characteristics of the sample.
n
(Students)
Students Gender
WomenMen
n%MageSDagen%MageSDage
494183.6722.372.19816.3221.631.77
Note. Mage, mean age; SDage, standard deviation age; n, number of participants in each group; n (students), total number of participants.
Table 2. Adjusted Rand index matrix.
123456789
110.140.300.450.140.220.008−0.13−0.02
20.1410.170.090.340.12−0.05−0.180.02
30.300.1710.090.030.62−0.04−0.12−0.03
40.450.090.0910.140.130.28−0.09−0.03
50.140.340.030.1410.090.02−0.060.02
60.220.120.620.130.091−0.04−0.110.05
70.008−0.05−0.040.280.02−0.041−0.030.11
8−0.13−0.18−0.12−0.09−0.06−0.11−0.0310.04
9−0.020.02−0.03−0.030.020.050.110.041
Note. 1 = k-means ++ Initial; 2 = k-means ++ Intermediate; 3 = k-means ++ Final; 4 = fuzzy k-means Initial; 5 = fuzzy k-means Intermediate; 6 = fuzzy k-means Final; 7 = DBSCAN Initial; 8 =DBSCAN Intermediate; 9 = DBSCAN Final.
Table 3. Goodness-of-fit indexes of the k-means ++, fuzzy k-means and DBSCAN algorithms.
Goodness-of-Fit Indexk-Means ++Fuzzy k-MeansDBSCANAccepted Value
df242424
χ2102.47 *96.750 *91.588 ** p > 0.05 α = 0.05
RMSEA0.2610.2510.242>0.05–0.08
RMSEA Interval (90%)0.210–0.3410.200–0.3050.191–0.296
SRMR0.1960.2050.00>0.05–0.08
TLI0.7040.6280.7040.85–0.90<
IFC0.8030.7520.8030.95–0.97<
AIC162.47156.750151.588The lowest value
ECVI3.3853.2663.158The lowest value
ECVI interval (90%)2.810–4.1172.712–3.9772.624–3.850The lowest value
Note. * p < 0.05; df, degrees of freedom; χ2, Chi-squared; RMSEA, root-mean-square error of approximation; SRMR, standardised root-mean-square residual; TLI, Tucker–Lewis index; CFI, comparative fit index; AIC, Akaike information criterion; ECVI, parsimony index.
Table 4. Analysis of the differences with the Friedman test for k-dependent samples between the results of grouping students in the three clusters in the initial, intermediate, and final measurements.
ClusterMeasurementMeanSDMaxMinMRangeχ2glp
Initial
k-means ++ 13.0013.462281.830.5520.76
Fuzzy k-means 9.459272.33
DBSCAN 12.6717.622331.83
Intermediate
k-means ++ 16.3317.214362.170.5520.76
Fuzzy k-means 16.3315.704342.17
DBSCAN 14.6721.082391.67
Final
k-means ++ 16.3323.181432.332.0020.37
Fuzzy k-means 16.3311.066282.33
DBSCAN 13.3321.390381.33
Note. p < 0.05; Initial measurement (after two weeks); Intermediate measurement (after four weeks), Final measurement (after eight weeks); SD, standard deviation; χ2, Chi-squared; Max, maximum; Min, minimum; MRange, mean range.
Publisher’s Note: MDPI stays neutral with regard to jurisdictional claims in published maps and institutional affiliations.

