
Dynamic Segmentation for Physical Activity Recognition Using a Single Wearable Sensor


College of Computer and Information Sciences, King Saud University, Riyadh 11584, Saudi Arabia
*
Author to whom correspondence should be addressed.
Appl. Sci. 2021, 11(6), 2633; https://doi.org/10.3390/app11062633
Submission received: 24 February 2021
/
Revised: 10 March 2021
/
Accepted: 12 March 2021
/
Published: 16 March 2021
(This article belongs to the Special Issue Applied Machine Learning Ⅱ)
Abstract
:Featured Application
This article presents an application of dynamic segmentation for physical activity recognition using machine learning techniques.
Abstract
Data segmentation is an essential process in activity recognition when using machine learning techniques. Previous studies on physical activity recognition have mostly relied on the sliding window approach for segmentation. However, choosing a fixed window size for multiple activities with different durations may affect recognition accuracy, especially when the activities belong to the same category (i.e., dynamic or static). This paper presents and verifies a new method for dynamic segmentation of physical activities performed during the rehabilitation of individuals with spinal cord injuries. To adaptively segment the raw data, signal characteristics are analyzed to determine the suitable type of boundaries. Then, the algorithm identifies the time boundaries to represent the start- and endpoints of each activity. To verify the method and build a predictive model, an experiment was conducted in which data were collected using a single wrist-worn accelerometer sensor. The experimental results were compared with the sliding window approach, indicating that the proposed method outperformed the sliding window approach in terms of overall accuracy, which exceeded 5%, as well as model robustness. The results also demonstrated efficient physical activity segmentation using the proposed method, resulting in high classification performance for all activities considered.
1. Introduction
Individuals with spinal cord injuries (SCI) who rely on wheelchairs typically experience associated symptoms such as obesity and low muscular strength. These symptoms may eventually lead to secondary complications, including diabetes and cardiovascular diseases [1,2]. Rehabilitation processes, such as in-home strength exercises, play an essential role in avoiding such symptoms and redeveloping the motor skills that are needed to perform daily activities and promote quality of life [3,4]. Currently, therapists rely on patient surveys to measure their adherence to these activities. However, studies indicate wide variability between self-reported and actually performed physical activity, which can undermine rehabilitation progress [5]. Nevertheless, with rapid technological innovation, physical activity recognition systems are emerging as a more reliable way to detect these activities [6,7,8,9].
Based on the approach used to collect data, activity recognition can be broadly classified into two approaches: the vision-based and sensor-based approaches. Although the vision-based approach is information-rich, it often suffers from ethical and privacy concerns, especially in healthcare applications when dealing with patients. By contrast, the devices used in the sensor-based approach, including wearable sensors, can operate with limited cost and power, and they have no restrictions in terms of the surrounding environment or the location where activities must be performed. As a result, activity recognition systems commonly adopt the sensor-based approach [10].
Several studies have been undertaken to investigate the impact of different sensor positions on overall recognition accuracy. These studies indicate that sensor position should be determined mainly based on the type of activity under study. Forms of locomotion, including walking and running, as well as static activities, such as standing and sitting, can be recognized with an accuracy of between 83% to 95% using lower-limb segments (hip, thigh, and ankle) as the sensor positions. To improve accuracy when recognizing upper-limb activities, sensors are placed on the wrist and upper arm [11]. Within this context, the study in [12] considered different positions, such as hip, belt, wrist, upper arm, ankle, and thigh, to recognize 20 types of activities, including both upper- and lower-limb activities. The results showed high accuracy when combining different positions. However, the study also demonstrated a slight performance decrease when using only the thighs and wrists. In addition to the impact of sensor placement on accuracy, user preferences should be considered to gain acceptance. To address this problem in the design of wearables, a meta-analysis was undertaken in [13]. The study concluded that people prefer wearing sensors on their wrist, followed by the trunk, belt, ankle, and, finally, armpit.
Activity recognition systems have a wide variety of applications, including rehabilitation and physical therapy. These systems allow monitoring of patients and the identification of exercises being performed [14]. In this regard, Pernek et al. [15] proposed a monitoring system consisting of a network of wearable accelerometers and a smartphone to recognize the intensity of specific physical activities (e.g., strength exercises). The system used two Support Vector Machine (SVM) layers to detect the type of activity being performed and determine its intensity. The study demonstrated that the hierarchical algorithm achieved an accuracy of approximately 85% in recognizing a set of upper-body activities. The study in [16] presented a methodology to recognize three fundamental arm movements using two different classifiers: Linear Discriminant Analysis (LDA) and SVM. The overall average accuracy was 88% using data collected from accelerometers and 83% using gyroscope data. With the same objective, Panwar et al. [10] designed a model to recognize three physical activities of the human forearm, relying on data collected from a single wrist-worn accelerometer. Lin et al. [17] proposed a model for recognizing the physical activities performed to rehabilitate frozen shoulder. Based on wireless sensor networks (WSN), the model could recognize six physical activities with an accuracy ranging from 85 to 95%. The study showed the applicability of using these types of models to recognize the rehabilitation exercises that are ubiquitous in healthcare self-management. In [18], Cai et al. developed an upper-limb robotic device to rehabilitate stroke patients. The system works by initially recognizing the activity performed by the healthy side of the patient and then provides mirror therapy to the affected side. The method used surface electromyography (sEMG) signals to train and test the model, and SVM was applied to classify the activities. To provide stroke survivors with feedback to maintain a correct posture during rehabilitation, Zambrana et al. [7] proposed a hierarchical approach using interrail sensors to monitor arm movements. This approach consisted of two levels: the first level distinguishes between movements and non-movements of the arm, while the second level determines whether the movement was purposeful.
Similar to other pattern recognition problems, continuous raw data should be divided into smaller fragments before proceeding to feature extraction and other following operations. The selection and application of an efficient segmentation method substantially influence the classification process, which directly results in accurate activity recognition [19]. The sliding window is the most widely used approach and, to date, it is still considered the best available approach [19,20,21]. In this method, continuous data obtained from sensors are segmented into windows of either static or dynamic sizes based on time intervals. For the former, two different algorithms are available: fixed-size non-overlapping sliding window and fixed-size overlapping sliding window. The first algorithm is considered a simple segmentation process, where the number of windows can be calculated exactly since no overlap exists. The second algorithm includes data overlap between two consecutive windows, where the percentage overlap can be referred to as the window shift. Since different activities have different periods of motion, the size of the window depends on the type of activity that is evaluated [22]. However, determining the effective window size is considered a critical issue. A short window size may split an activity’s signal into two or more consecutive windows, whereas a long window size may combine signals for more than one activity. Ultimately, these cases may affect the accuracy of activity classification because information is lost or noise is introduced into the signal, respectively [23,24].
In dynamic sliding windows, data are segmented into different window sizes according to specific features. One of the challenges is to optimize different window sizes while considering activities with both short and long duration. Numerous studies have sought to resolve the limitation of the sliding window approach. Feda et al. [22] investigated the impact of using different window sizes on the accuracy of recognizing activities with different durations, reporting that a 1.5-second window size may represent the best trade-off. Other researchers have proposed adaptive window size techniques. In this context, Santos et al. [25] used entropy feedback to adjust the window size and time continuously, thereby increasing classification accuracy. Nevertheless, the algorithm is computationally complex since shorter time shifts increase the rate of classifications per second. In [24], Noor et al. presented a segmentation technique based on adjusting the window size according to the probability of the signal. Initially, the approach specifies a small window size suitable for splitting static and dynamic activities. In turn, this size expands dynamically when a transitional activity is encountered, which stems from its longer duration. Similarly, using cluster analysis for period extraction, [21] proposed a technique to differentiate between basic and transitional activities during segmentation. Sheng et al. [26] designed an adaptive time window by using pitch extraction algorithms to divide the data into periodic and non-periodic activities. The study in [27] designed and implemented a segmentation method based on the sliding window autocorrelation technique and the Gaussian model. Using a dataset consisting of readings from an accelerometer embedded in a smartphone, the method successfully divided the data into distinct subsets of activities. Based on a change detection algorithm, an activity segmentation method was presented in [19]. To identify stationary, dynamic, and transitional activities, starting window positions were dynamically detected.
The objective of this research is to propose a novel signal segmentation method for physical activity recognition that can enhance classification performance. Unlike previous studies, this method is concerned with the segmentation of physical activities that belong to the same category (i.e., dynamic activities). To achieve this objective, an experiment was conducted to verify and compare the proposed method with the sliding window approach. The comparison demonstrates the effectiveness of our method, particularly in terms of enhancing recognition accuracy.
The remainder of this paper is organized as follows: Section 2 presents the set of physical activities applied during the rehabilitation of SCI patients; Section 3 offers an overview of the system; Section 4 describes the proposed segmentation method; Section 5 demonstrates the experimental setup; Section 6 and Section 7 present and discuss the results, respectively; and finally, Section 8 concludes the paper.
2. Physical Activity
Unlike stroke and other neurological conditions, SCI affects patients’ lower limbs. In rare cases, SCI patients may suffer from complete paralysis based on the degree and location of their injury. The focus of this work is on the former type of SCI, where individuals need rehabilitation to avoid having associated symptoms, such as low muscular strength. Rehabilitation through physical activity is also essential for developing upper-limb motor skills, which enable patients to perform daily activities and promote quality of life [3,4].
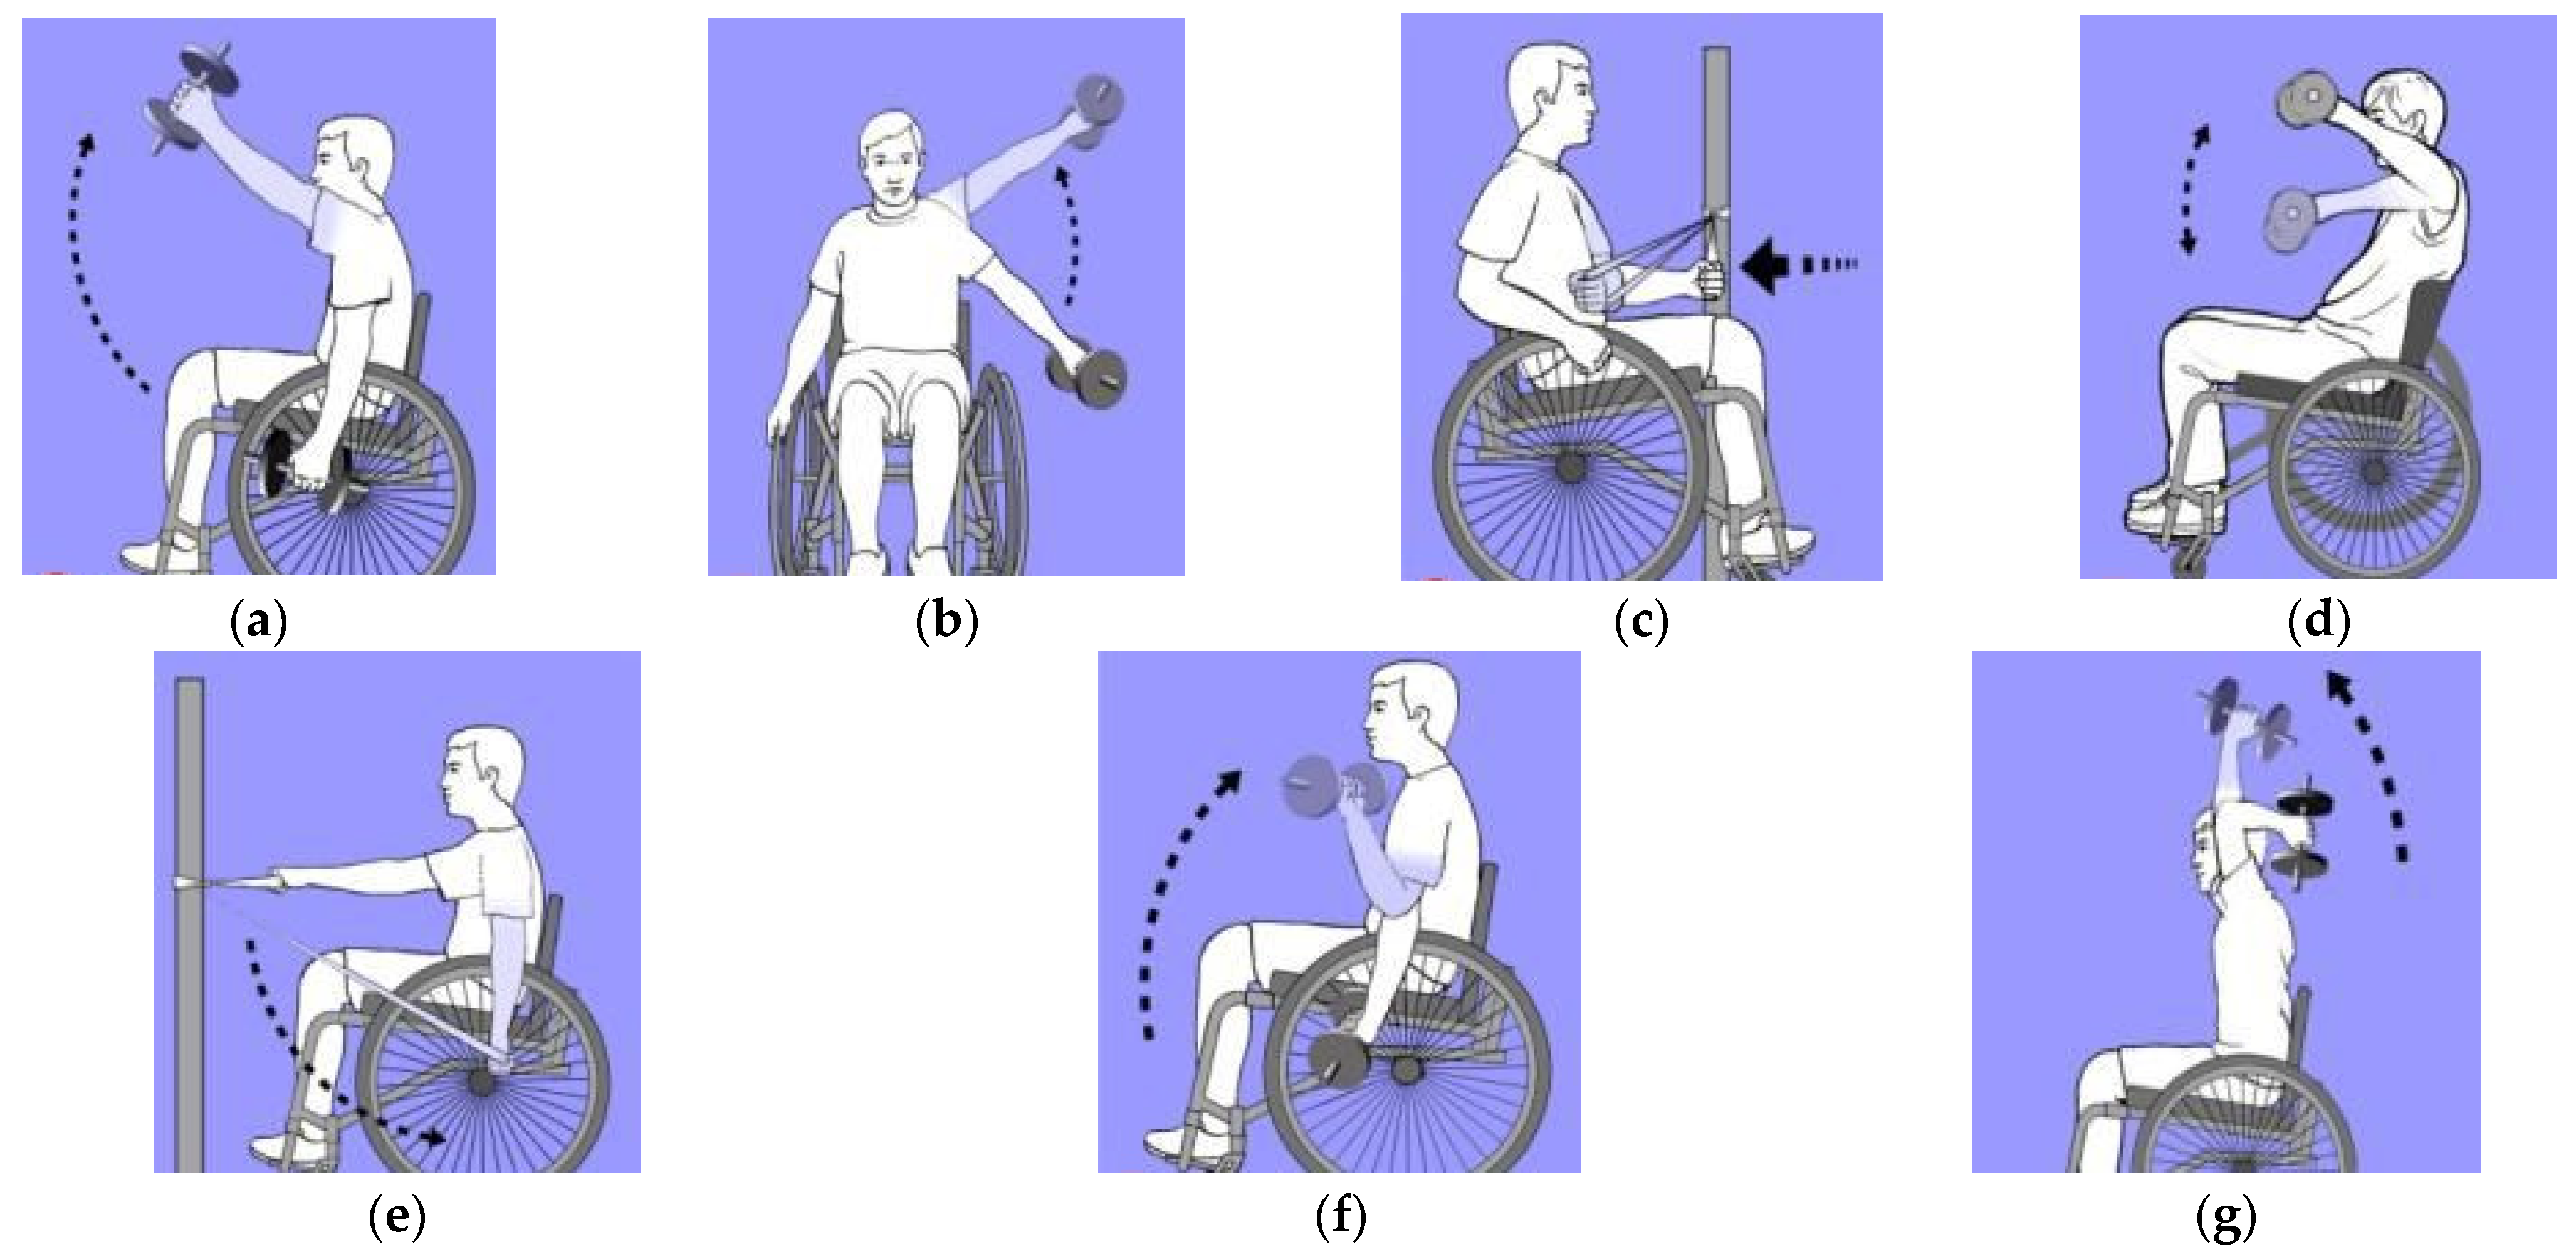
Whenever the aim is to strengthen the upper limbs, the body parts of focus are the elbows and shoulders [28,29,30]. The main activities required to strengthen the shoulder muscles are flexion, abduction, extension, internal rotation (IR), and external rotation (ER). In addition, the main activities applied to strengthen the elbow’s major muscles are elbow flexion (EF) and elbow extension (EE) [28]. An illustration of these activities is given in Figure 1.
3. System Overview
A wireless sensor was used (Shimmer Research, Dublin, Ireland), each consisting of a tri-axial accelerometer, a tri-axial gyroscope, and a tri-axial magnetometer. Due to the efficiency of accelerometers in activity recognition, the dataset used in this research was collected using a single tri-axial accelerometer [31,32,33]. It is a sensing device used to measure acceleration in three orthogonal directions simultaneously. However, gyroscope and magnetometer were excluded since prior studies indicate that accelerometers provide higher overall accuracy [16]. In addition, the ferromagnetic materials that are commonly available in domestic environments can affect magnetometers. The sensor was configured to collect acceleration data with a sampling frequency of 30 Hz (range ± 2 g), which has been shown to be sufficient for recognizing similar activities [30,31]. In addition, a previous study demonstrated that the type and intensity of human activities can be recognized using signals with a sampling rate equal to 10 Hz [34].
Sensors are placed on the wrist and upper arm when recognizing upper-limb activities, both of which were examined in this research. However, due to the type of motion being recognized, certain activities, such as EE, EF, and IR, lack upper-arm movements. This meant that the sensor placed on the upper arm could not detect any motion. Accordingly, the wrist was chosen as the sensor position.
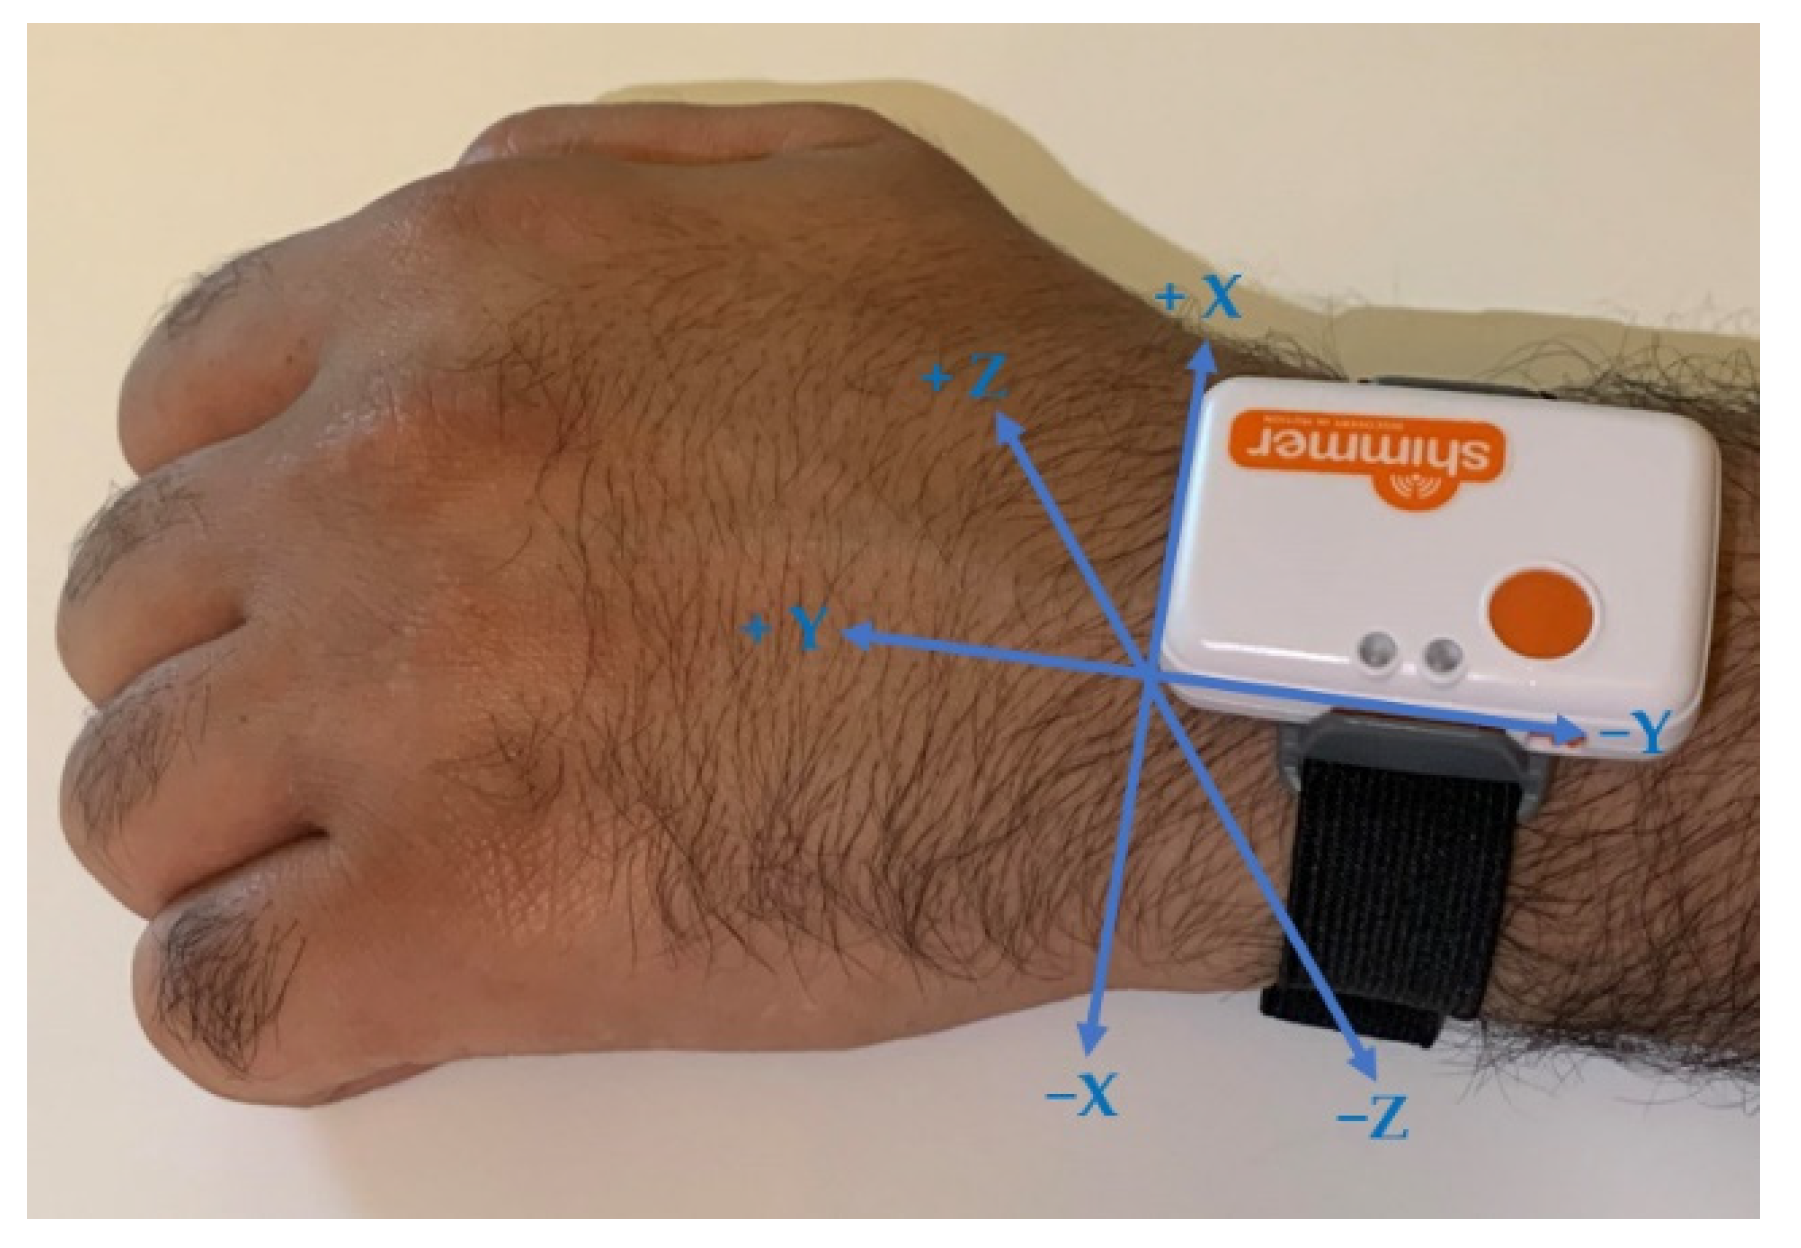
In terms of axis orientation, the Y-axis was in parallel with the wrist, pointing toward the fingers and across the X-axis. In addition, the Z-axis pointed away from the backside of the wrist, as shown in Figure 2.
4. Proposed Method
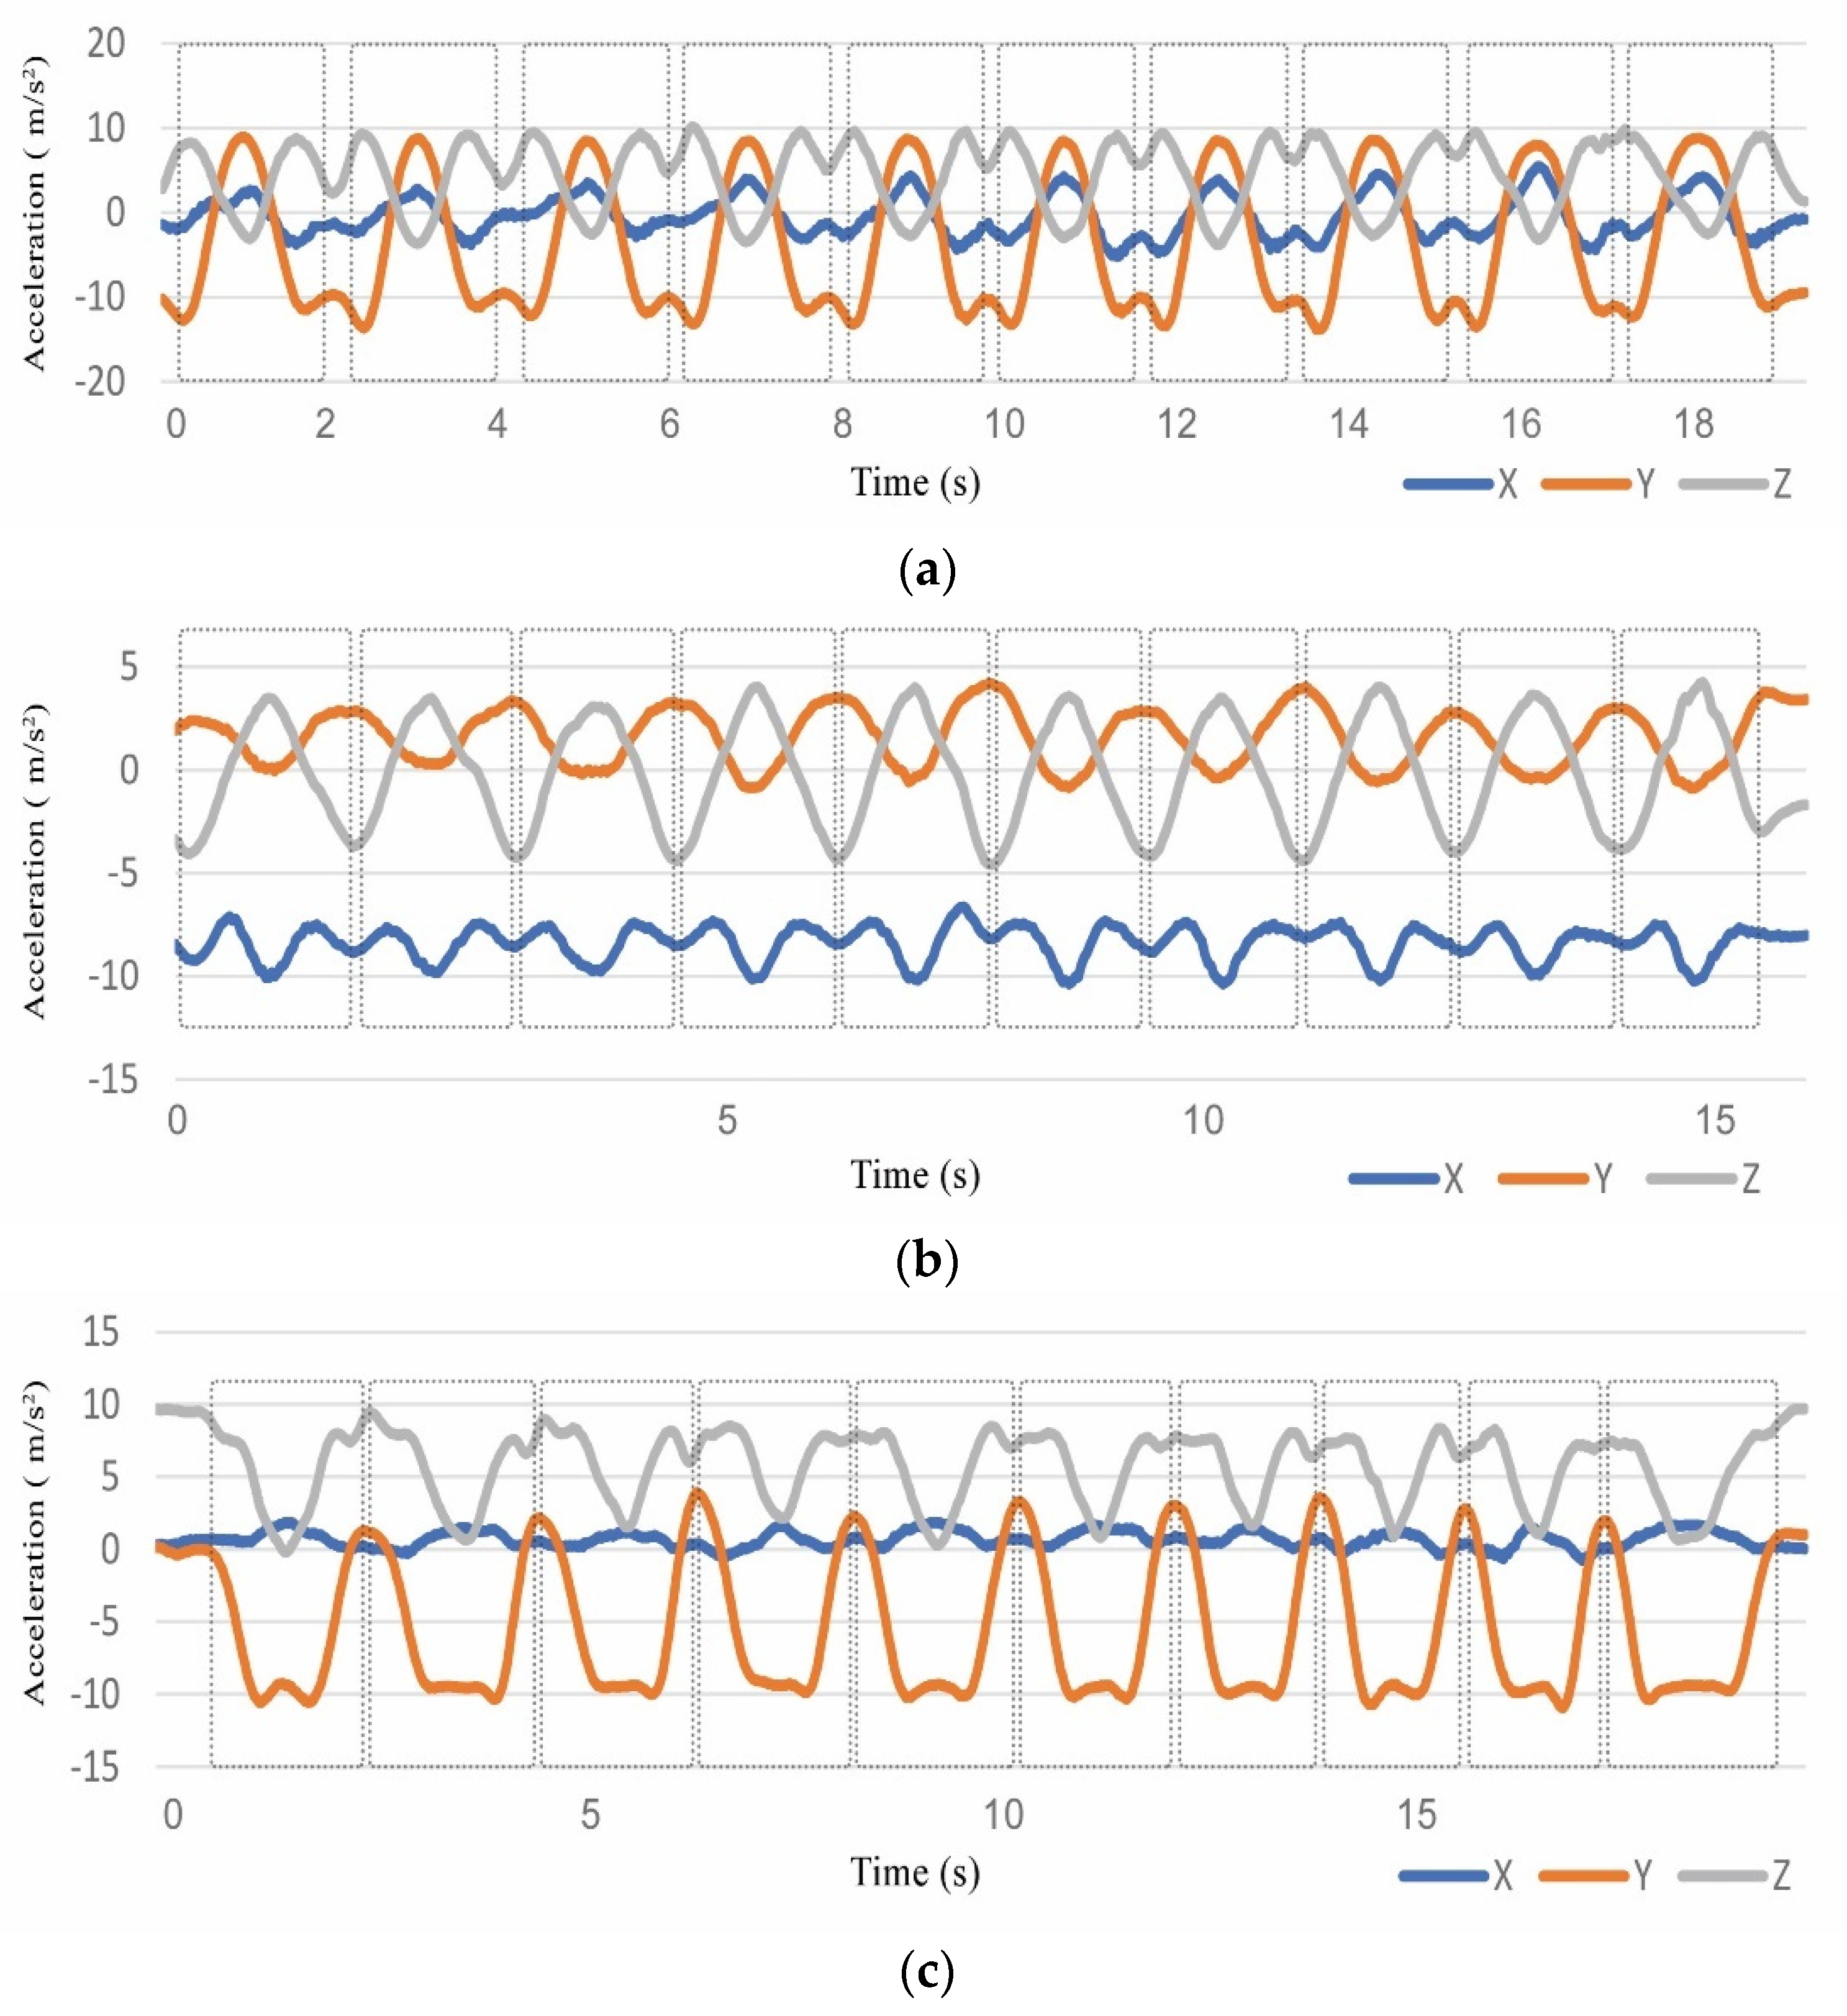
Since physical activities are performed sequentially rather than concurrently, a clear activity pattern can be identified by observing the acceleration signal. Figure 3a shows the raw data collected from a tri-axial accelerometer during 10 repetitions of abduction, where each part enclosed within the dotted rectangle represents a single repetition.
For all seven activities, each peak along the Y-axis corresponds to a single activity, except for IR and extension, where two consecutive peaks represent the starting and ending points of the activity. Figure 3b,c shows 10 repetitions of IR and extension, respectively, where all data points enclosed within the dotted rectangles belong to a single repetition. The underlying reason for this difference is the movement direction of the activity and the hand position while moving.
The proposed segmentation method consisted of three main steps. The first step involved the selection of peaks in the Y-axis acceleration signal since it best represents the start and end of all types of activities under study when applying the algorithm. Peaks were selected based on a threshold and a distance, which represent the minimum value of a peak and the minimum distance between peaks, respectively. The second step was to select valleys using a second threshold that represented the highest value of a valley. Finally, the signal’s characteristics were analyzed for each peak to identify suitable segmentation boundaries. The method is explained in more detail in the rest of this section.
4.1. Selection of Peaks
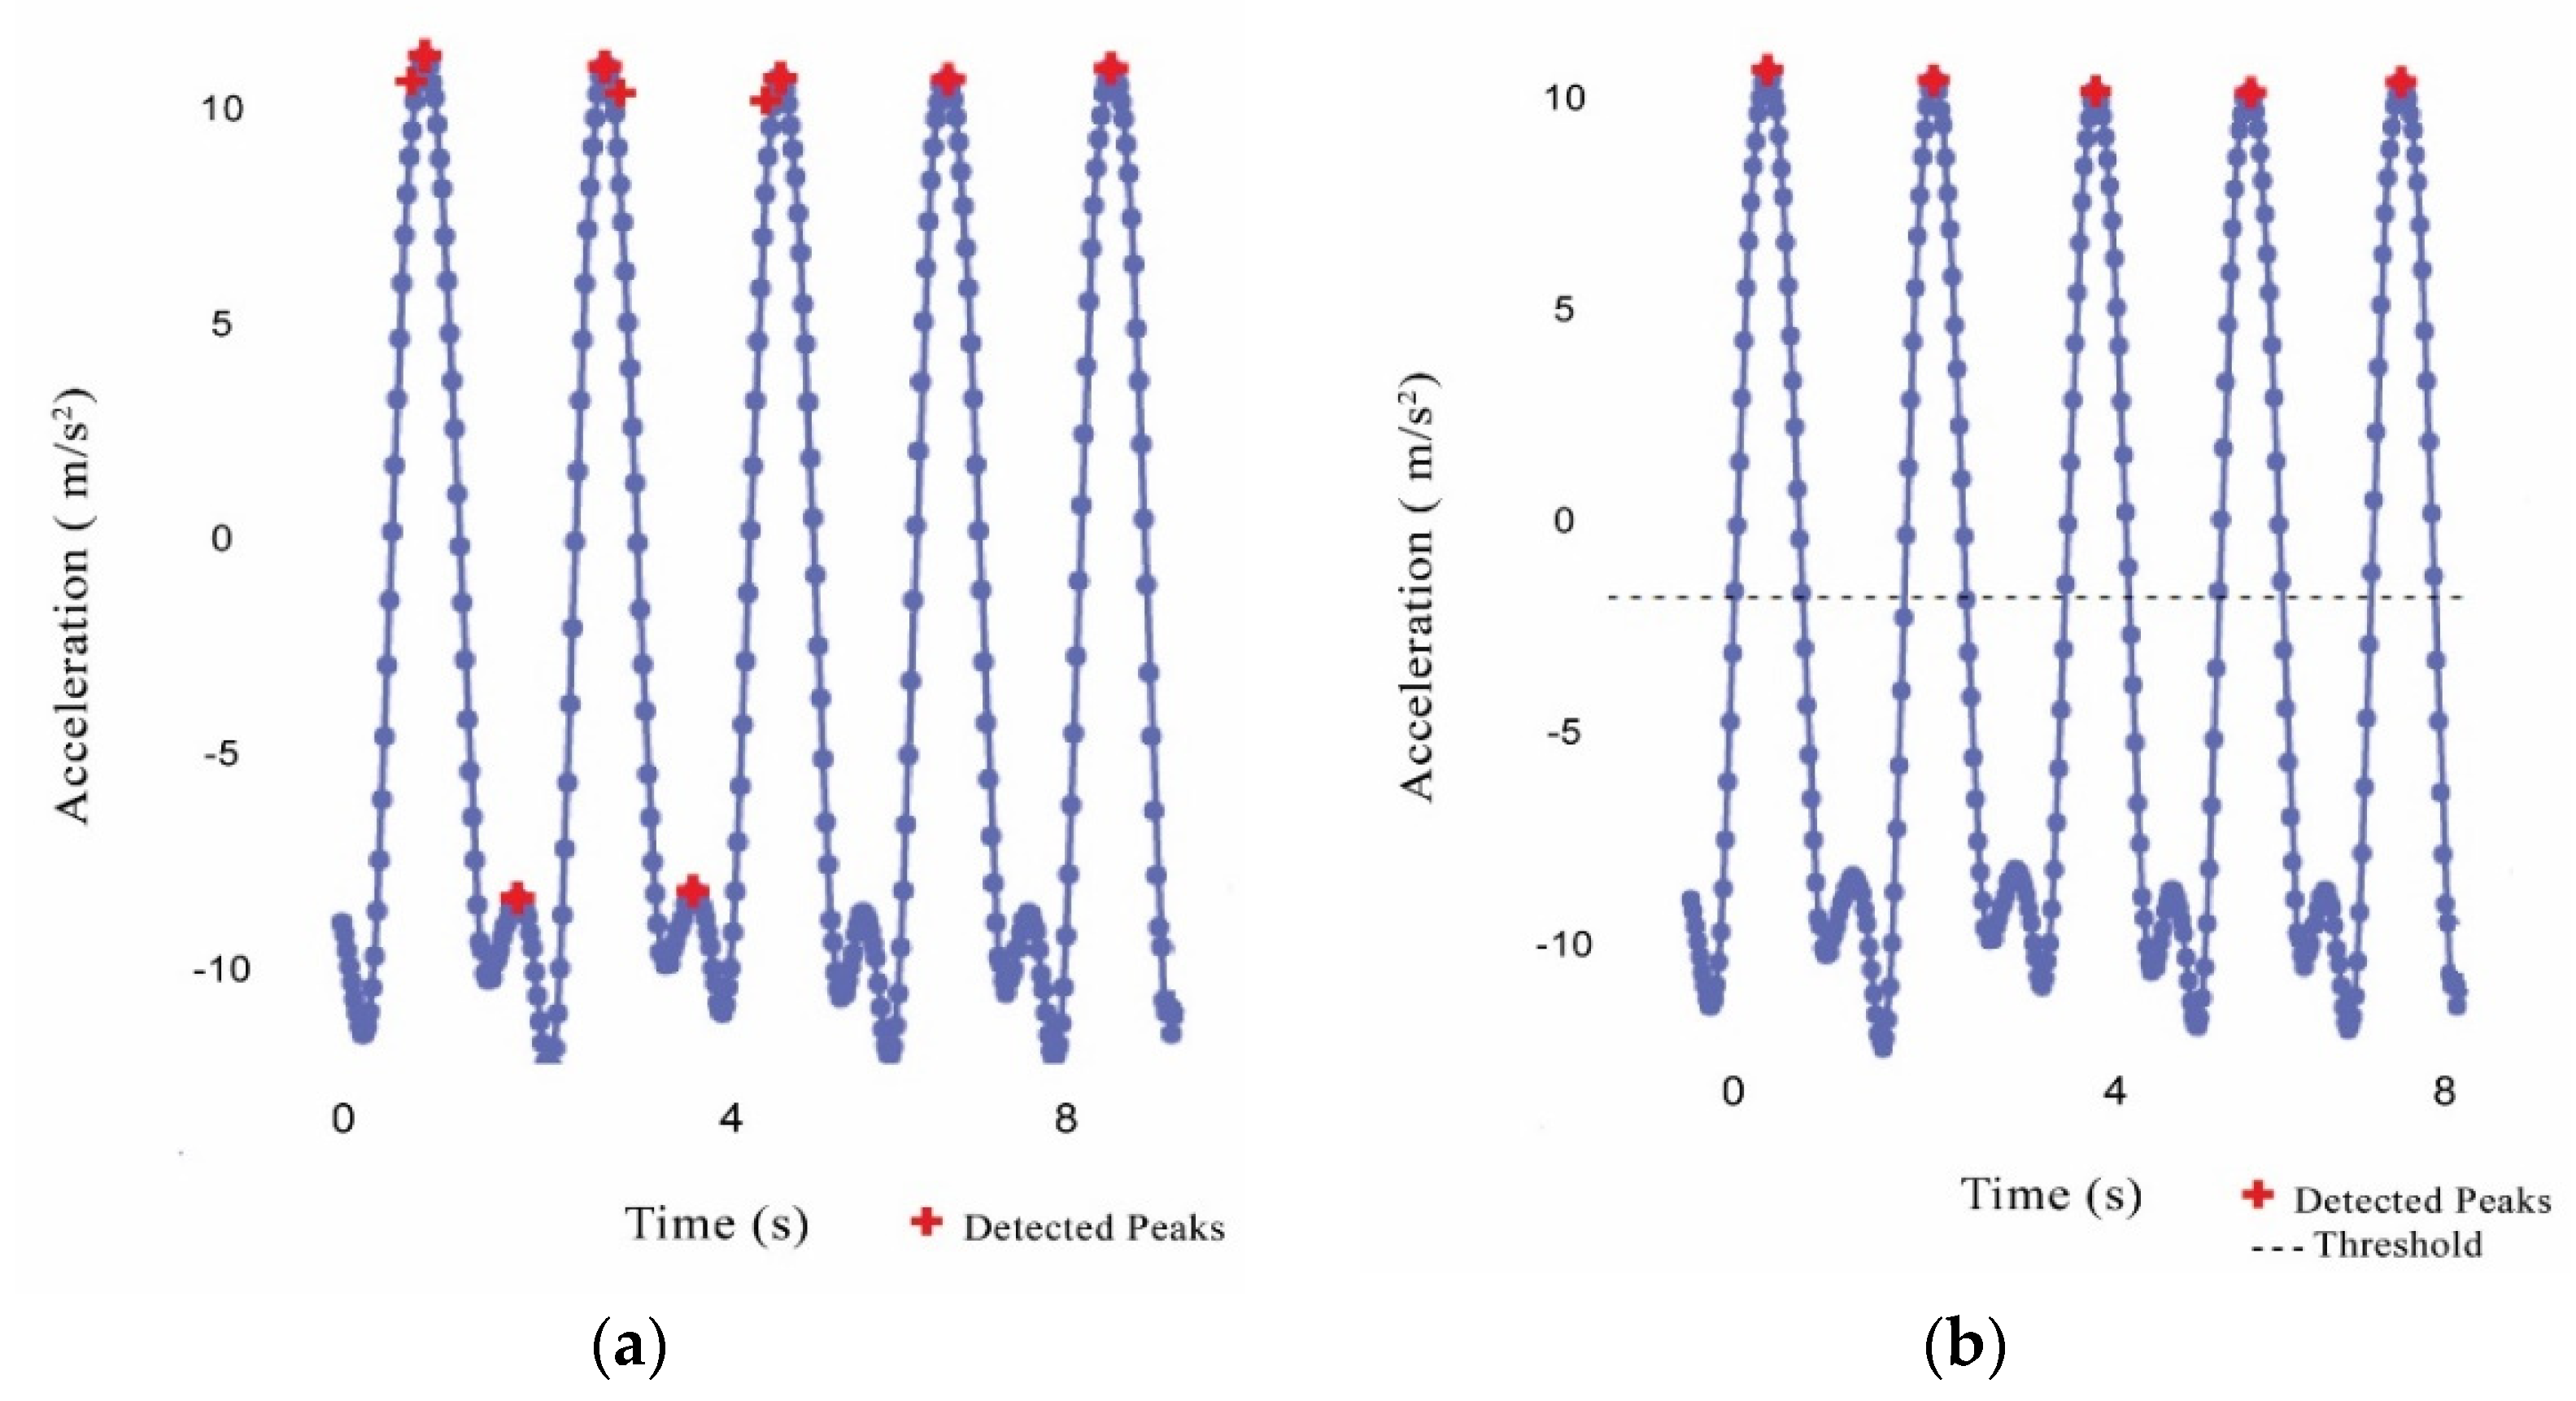
Peaks, which represent the local maximum values in the Y-axis acceleration signal, were first discerned. To avoid including false-positive peaks, as illustrated in Figure 4a, a threshold value was used. To be detected, a peak must be equal to or greater than Threshold 1. This can be calculated by separately averaging the peaks in the learning dataset of each of the seven physical activities and, in turn, choosing the minimum value among them as follows:
where avg denotes the average, max is the local maximum in the processed axis (i.e., Y-axis), PA denotes physical activity, and n refers to the number of physical activities to be classified. The identified peaks after applying the threshold are shown in Figure 4b.
Threshold 1 = min (avgmax (PA1), avgmax (PA2), …., avgmax (PAn))
Moreover, to avoid detecting more than one peak within the data points that represent a single activity, as shown in Figure 4a, a minimum distance between peaks was assigned. This value can be obtained by calculating the average duration needed to perform the shortest activity as follows:
Distance = min (avgduration (PA1), avgduration (PA2), …., avgduration (PAn))
4.2. Selection of Valleys
In addition to the peaks obtained from the first step, the method required the identification of valleys (i.e., local minimum values) in the Y-axis acceleration signal. In this process, a second threshold was used to avoid detecting false-positive valleys. A valley was chosen when it was less than or equal to Threshold 2. It can be obtained by averaging the values of true-positive valleys in the learning dataset and, in turn, repeating the process for each type of activity that consists of a single peak (i.e., in this research, abduction, flexion, EE, EF, and ER). The maximum average was assigned as the threshold using the following equation:
where min denotes the local maximum in the processed axis (i.e., Y-axis) and m is the number of physical activities consisting of a single peak in each repetition.
Threshold 2 = maximum (avgmin (PA1), avgmin (PA2), …., avgmin (PAm))
4.3. Determining Segment Boundaries
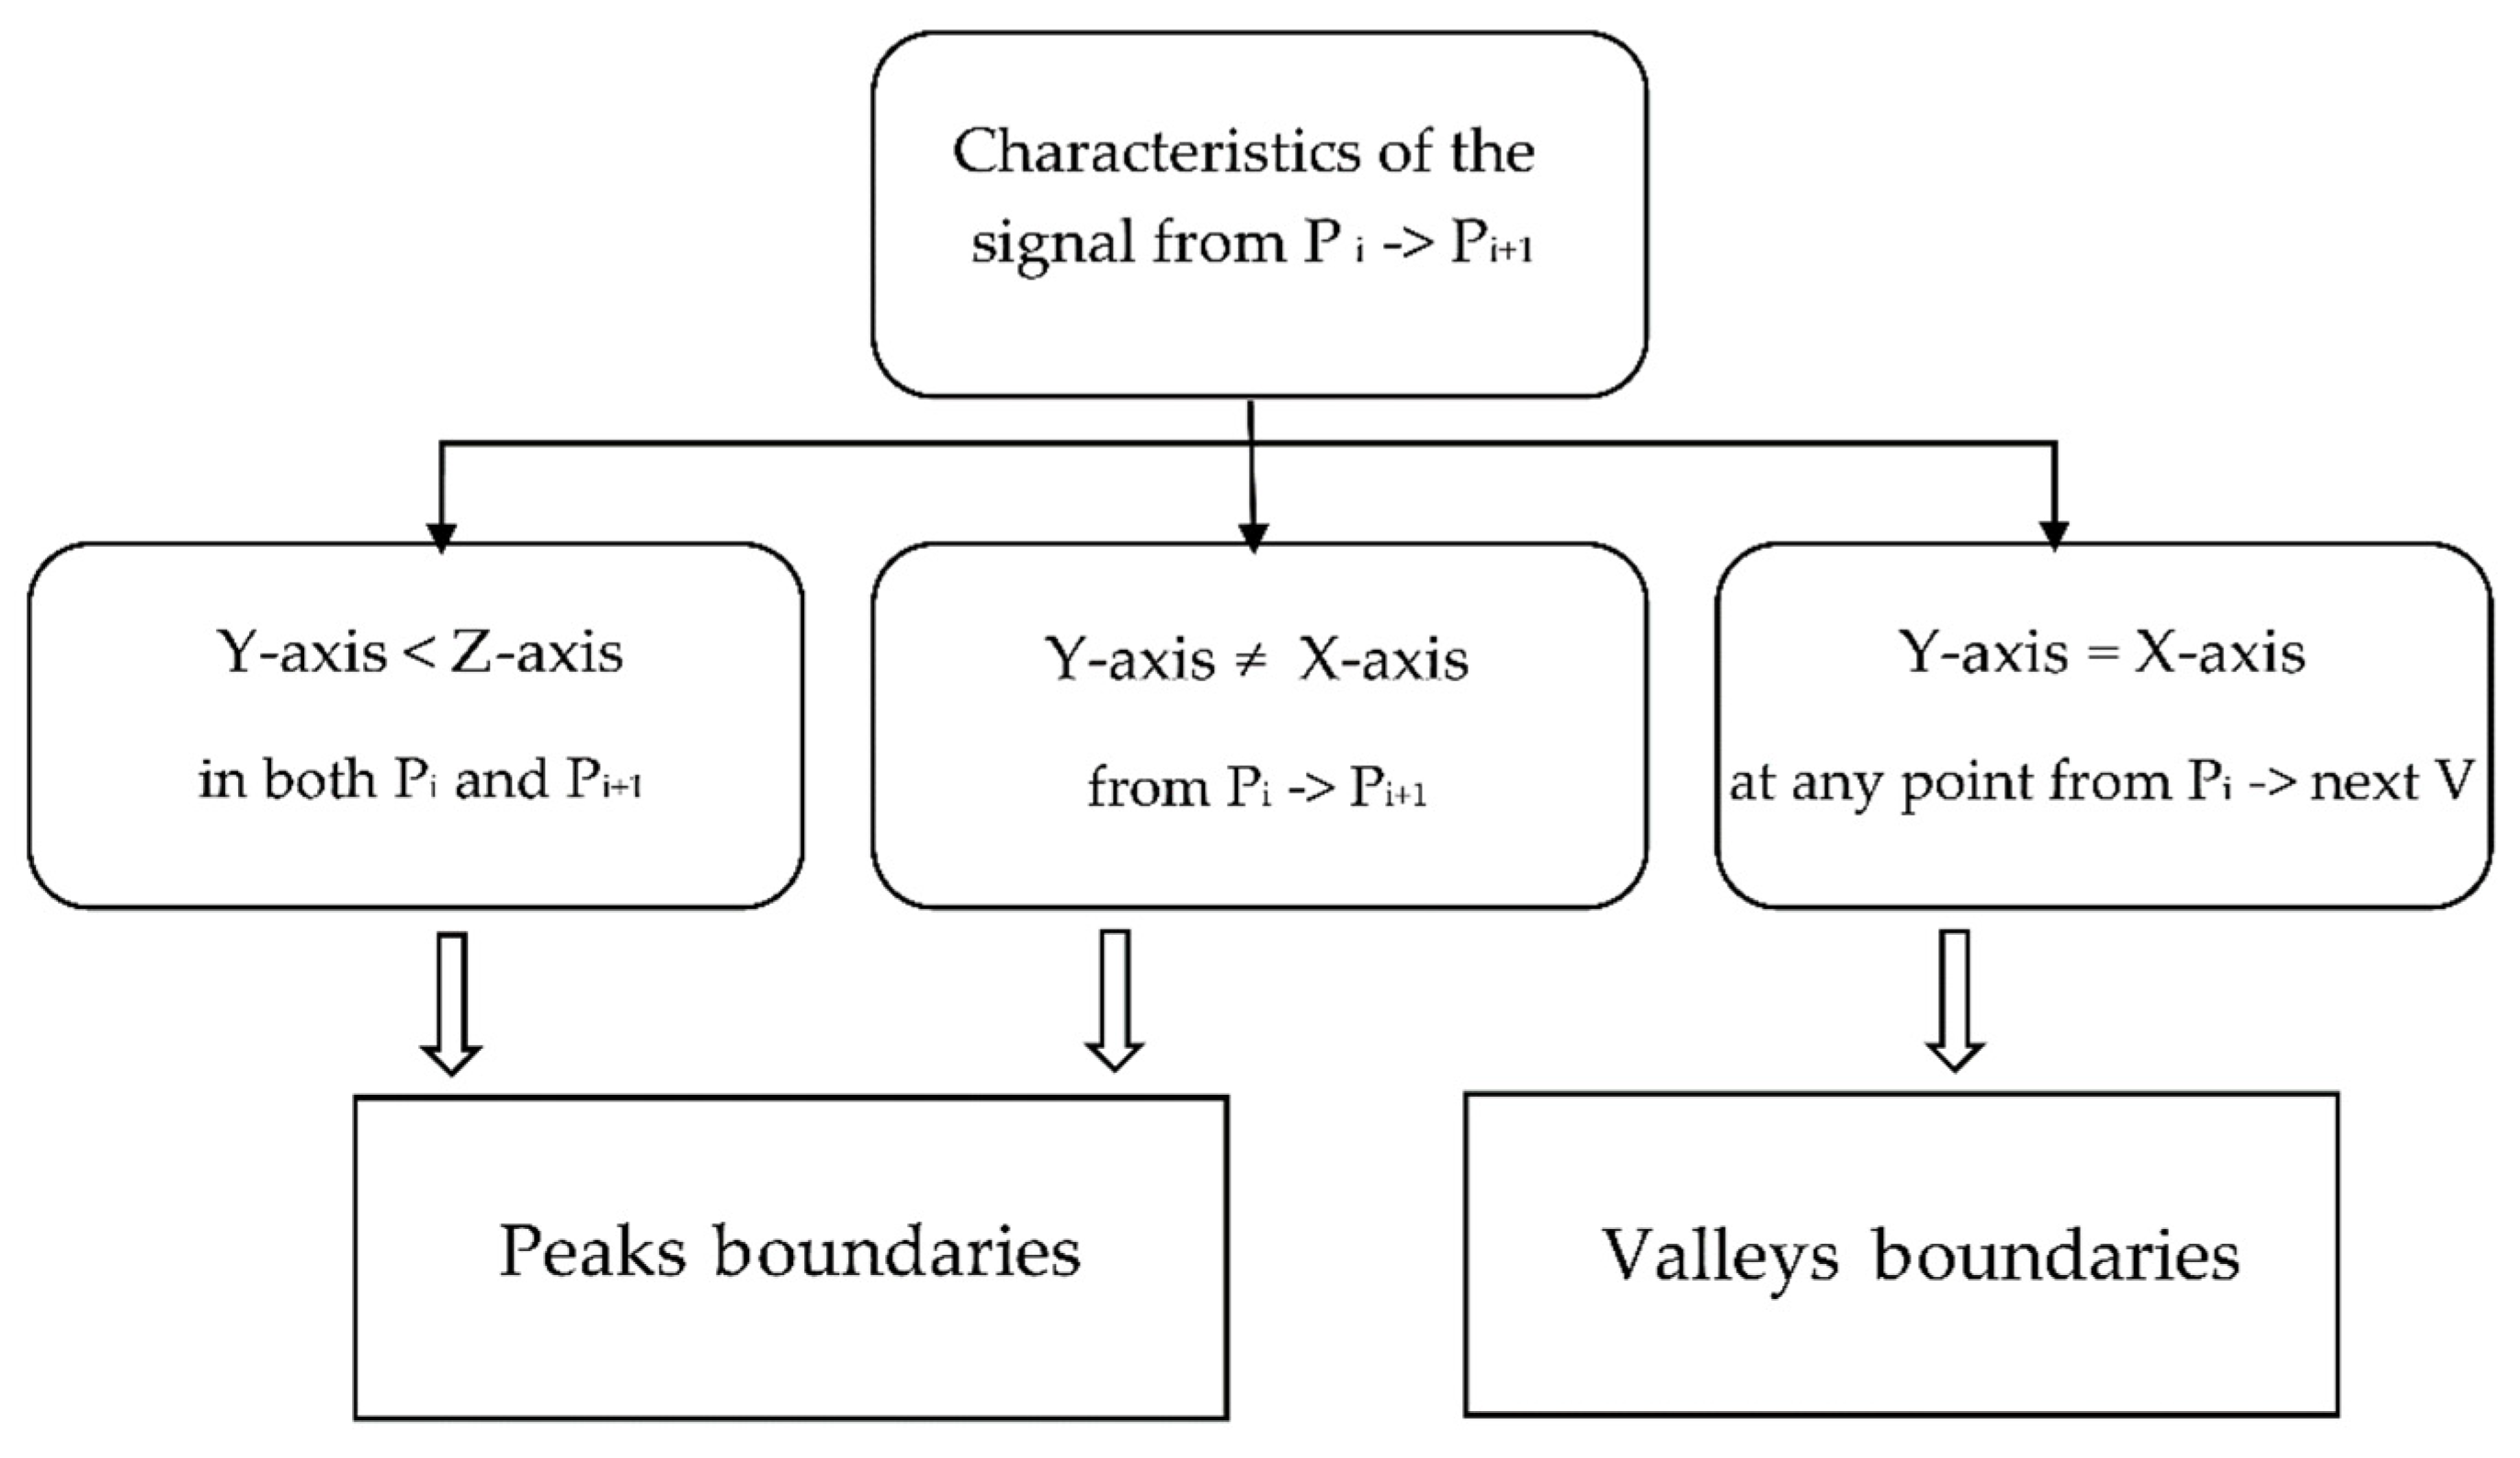
In dynamic activity segmentation, it was necessary to determine the segment time boundaries to obtain a successful partition among different activities [27]. In the proposed algorithm, there were two types of boundaries for the activities based on the number of peaks in each activity. The first type was the peak boundaries, which was used when a single activity contained two peaks (as in the case of IR and extension). In this type, as the name suggests, these peaks were regarded as the boundaries of the segment. The second type was the valley boundaries, which was applied when an activity consisted of only one peak. In this type, the two valleys that directly preceded and followed each peak were identified to represent the start- and endpoints of the segment, respectively. Therefore, the length of a segment changed dynamically according to the duration of the corresponding activity. To determine the suitable type of boundaries for the segmentation, the algorithm checked the signal characteristics of each identified peak, as illustrated in Figure 5.
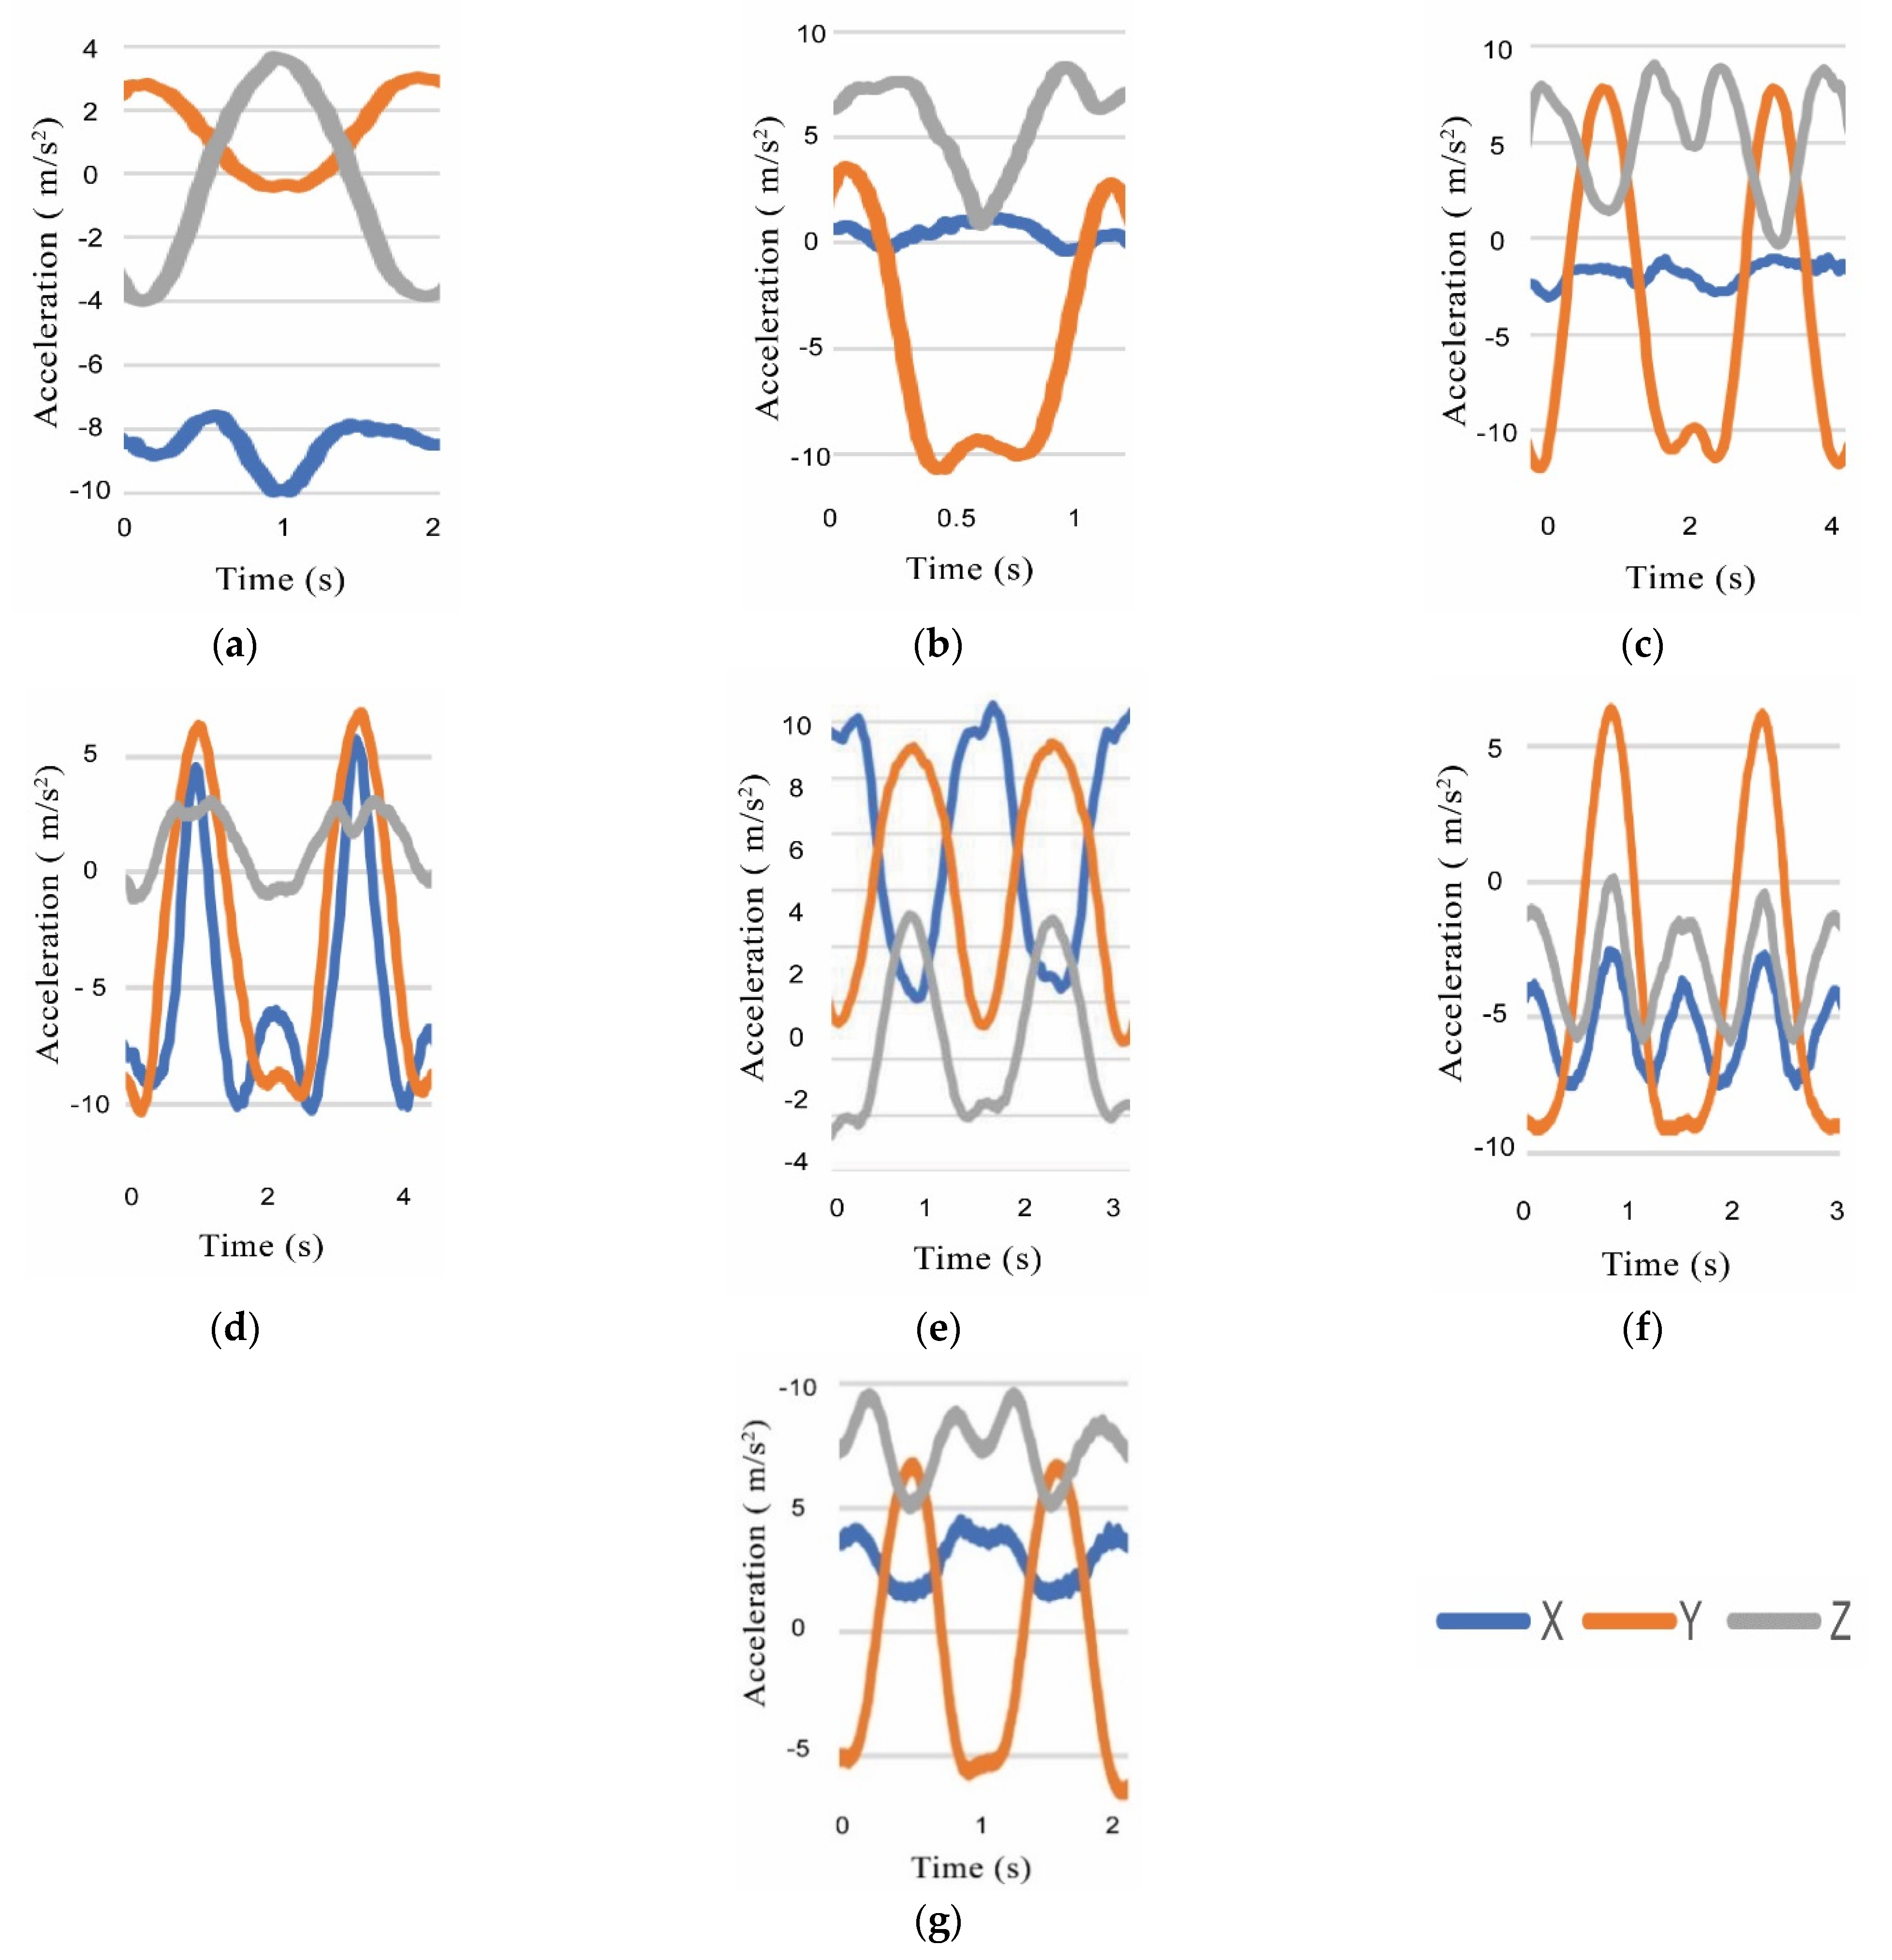
Peak boundaries were chosen if the value of Y-axis was smaller than the value of Z-axis at peaki and peaki+1, as shown in Figure 6a. Moreover, the algorithm checked the signal’s characteristics between every two consecutive peaks. If there was no intersection between Y-axis and X-axis along these peaks, as illustrated in Figure 6b, peak boundaries were also applied. Otherwise, if an intersection existed at any point between the peak and the valley that directly follows the peak, as shown in Figure 6c–g, valley boundaries were used. The pseudocode that describes how to segment the acceleration signal of physical activities adaptively is shown in Algorithm 1. The input values to Dynamic Segmentation are represented in line 2, and the output value is represented in line 5. The input of the algorithm is a set of tri-axial accelerometer data S, which is divided into multiple segments. The “for” loop in lines 9–28 represents the process of determining the type of boundaries in all peaks except the last one. The “if” and “else if” statements in lines 10–14 and 15–23, respectively, examine the signal’s characteristics in each peak and divide the signal using peak or valley boundaries. Lines 28–36 repeat the process for the last peak using only valley boundaries.
| Algorithm 1 Dynamic Segmentation |
| 1: Input: |
| 2: S: a set of tri-axial accelerometer data |
| 3: Output: |
| 4: A set of segments: Seg = {seg1, seg2, …., segn} |
| 5: peaks = indices of all peaks in Y-axis using Threshold1 and Distance |
| 6: valleys = indices of all valleys in Y-axis using Threshold2 |
| 7: p = total number of peaks |
| 8: v = total number of valleys |
| 9: for i = 0 to p-2 do |
| 10: if Y-axis value is smaller than Z-axis value at peak(i) and peak(i+1) |
| 11: OR no intersection between X-axis and Y-axis from peak(i) to peak(i+1) then |
| 12: for h = peaks (i) to peaks (i+1) do |
| 13: Add S(h) to Segi |
| 14: end for |
| 15: else if intersection exists between X-axis and Y-axis at any point from peak(i) to next valley then |
| 16: for k = 1 to v-1 do |
| 17: if valleys (k) is the valley that directly follows peaks (i) |
| 18: AND valleys (k-1) is the valley that directly precedes peaks (i) then |
| 19: For h = valleys (k-1) to valleys (k) do |
| 20: Add S(h) to Segi |
| 21: end for |
| 22: end if |
| 23: end for |
| 24: else |
| 25: i = i+1 |
| 26: end if |
| 27: end for |
| 28: for k = 1 to v-1 do |
| 29: if valleys (k) is the valley that directly follows peaks (p-1) |
| 30: AND valleys (k-1) is the valley that directly precedes peaks (p-1) |
| 31: AND intersection exists between X-axis and Y-axis from peaks(p-1) to valleys (k) then |
| 32: for h = valleys (k-1) to valleys (k) do |
| 33: Add S(h) to Segp-1 |
| 34: end for |
| 35: end if |
| 36: end for |
5. Experimental Setup
An experiment was performed to evaluate and compare the results of the proposed method. This section describes the overall process and experimental details.
5.1. Data Acquisition
This section describes the demographics of the participants. It also offers an overview of the protocol used to collect data and perform the physical activities.
5.1.1. Participants
In the experiment, 10 healthy individuals (3 male, 7 female) aged between 25 and 50 years were recruited to perform the activities. Before the experiment, all participants signed an informed consent form that explained the protocol and procedure.
5.1.2. Activity Session
Before starting the session, participants were given practical advice and instructions for the correct execution of the exercises. Finally, before each activity, a short demonstration video was shown as a reminder for more optimal performance.
Each participant was asked to execute 10 repetitions of all activities, resulting in a total of 700 repetitions. Furthermore, they were asked to separate each group of the same activity with approximately 10 s, thereby marking the start of each new group of repetitions.
5.2. Data Preprocessing
The raw data acquired from wearable sensors, such as accelerometers, are prone to noise and error. Hence, preprocessing is an essential step to obtain the most representative format of physical activities that is suitable for predictive modeling [35,36]. In this research, preprocessing was implemented in two steps:
- Smoothing
A moving average filter (MAF) was applied to smoothen the data and remove high-frequency noise introduced due to physical effects [24]. This process, which is equivalent to lowpass filtering, is important to ensure that small perturbations are insignificant to the model.
An important aspect of the MAF relates to the problem of how to choose the optimal length. This is a key consideration because different values can affect recognition performance. In this research, different values were tested, which led to the discovery that a length of 10 produced smoother data without losing key information.
- Removal of Undesired Data (Cleaning)
Since the participants were asked to separate each group of activity repetitions with approximately 10 s, this meant that part of the collected data corresponded to a time when no activity was undertaken. These parts were removed manually. It is worth noting that this step was done only for the learning dataset, whereas patients in the real-world were not given such directions. In addition, since the proposed method is based on detecting the peaks and valleys, even the existence of such data will not affect the performance of the algorithm.
5.3. Segmentation
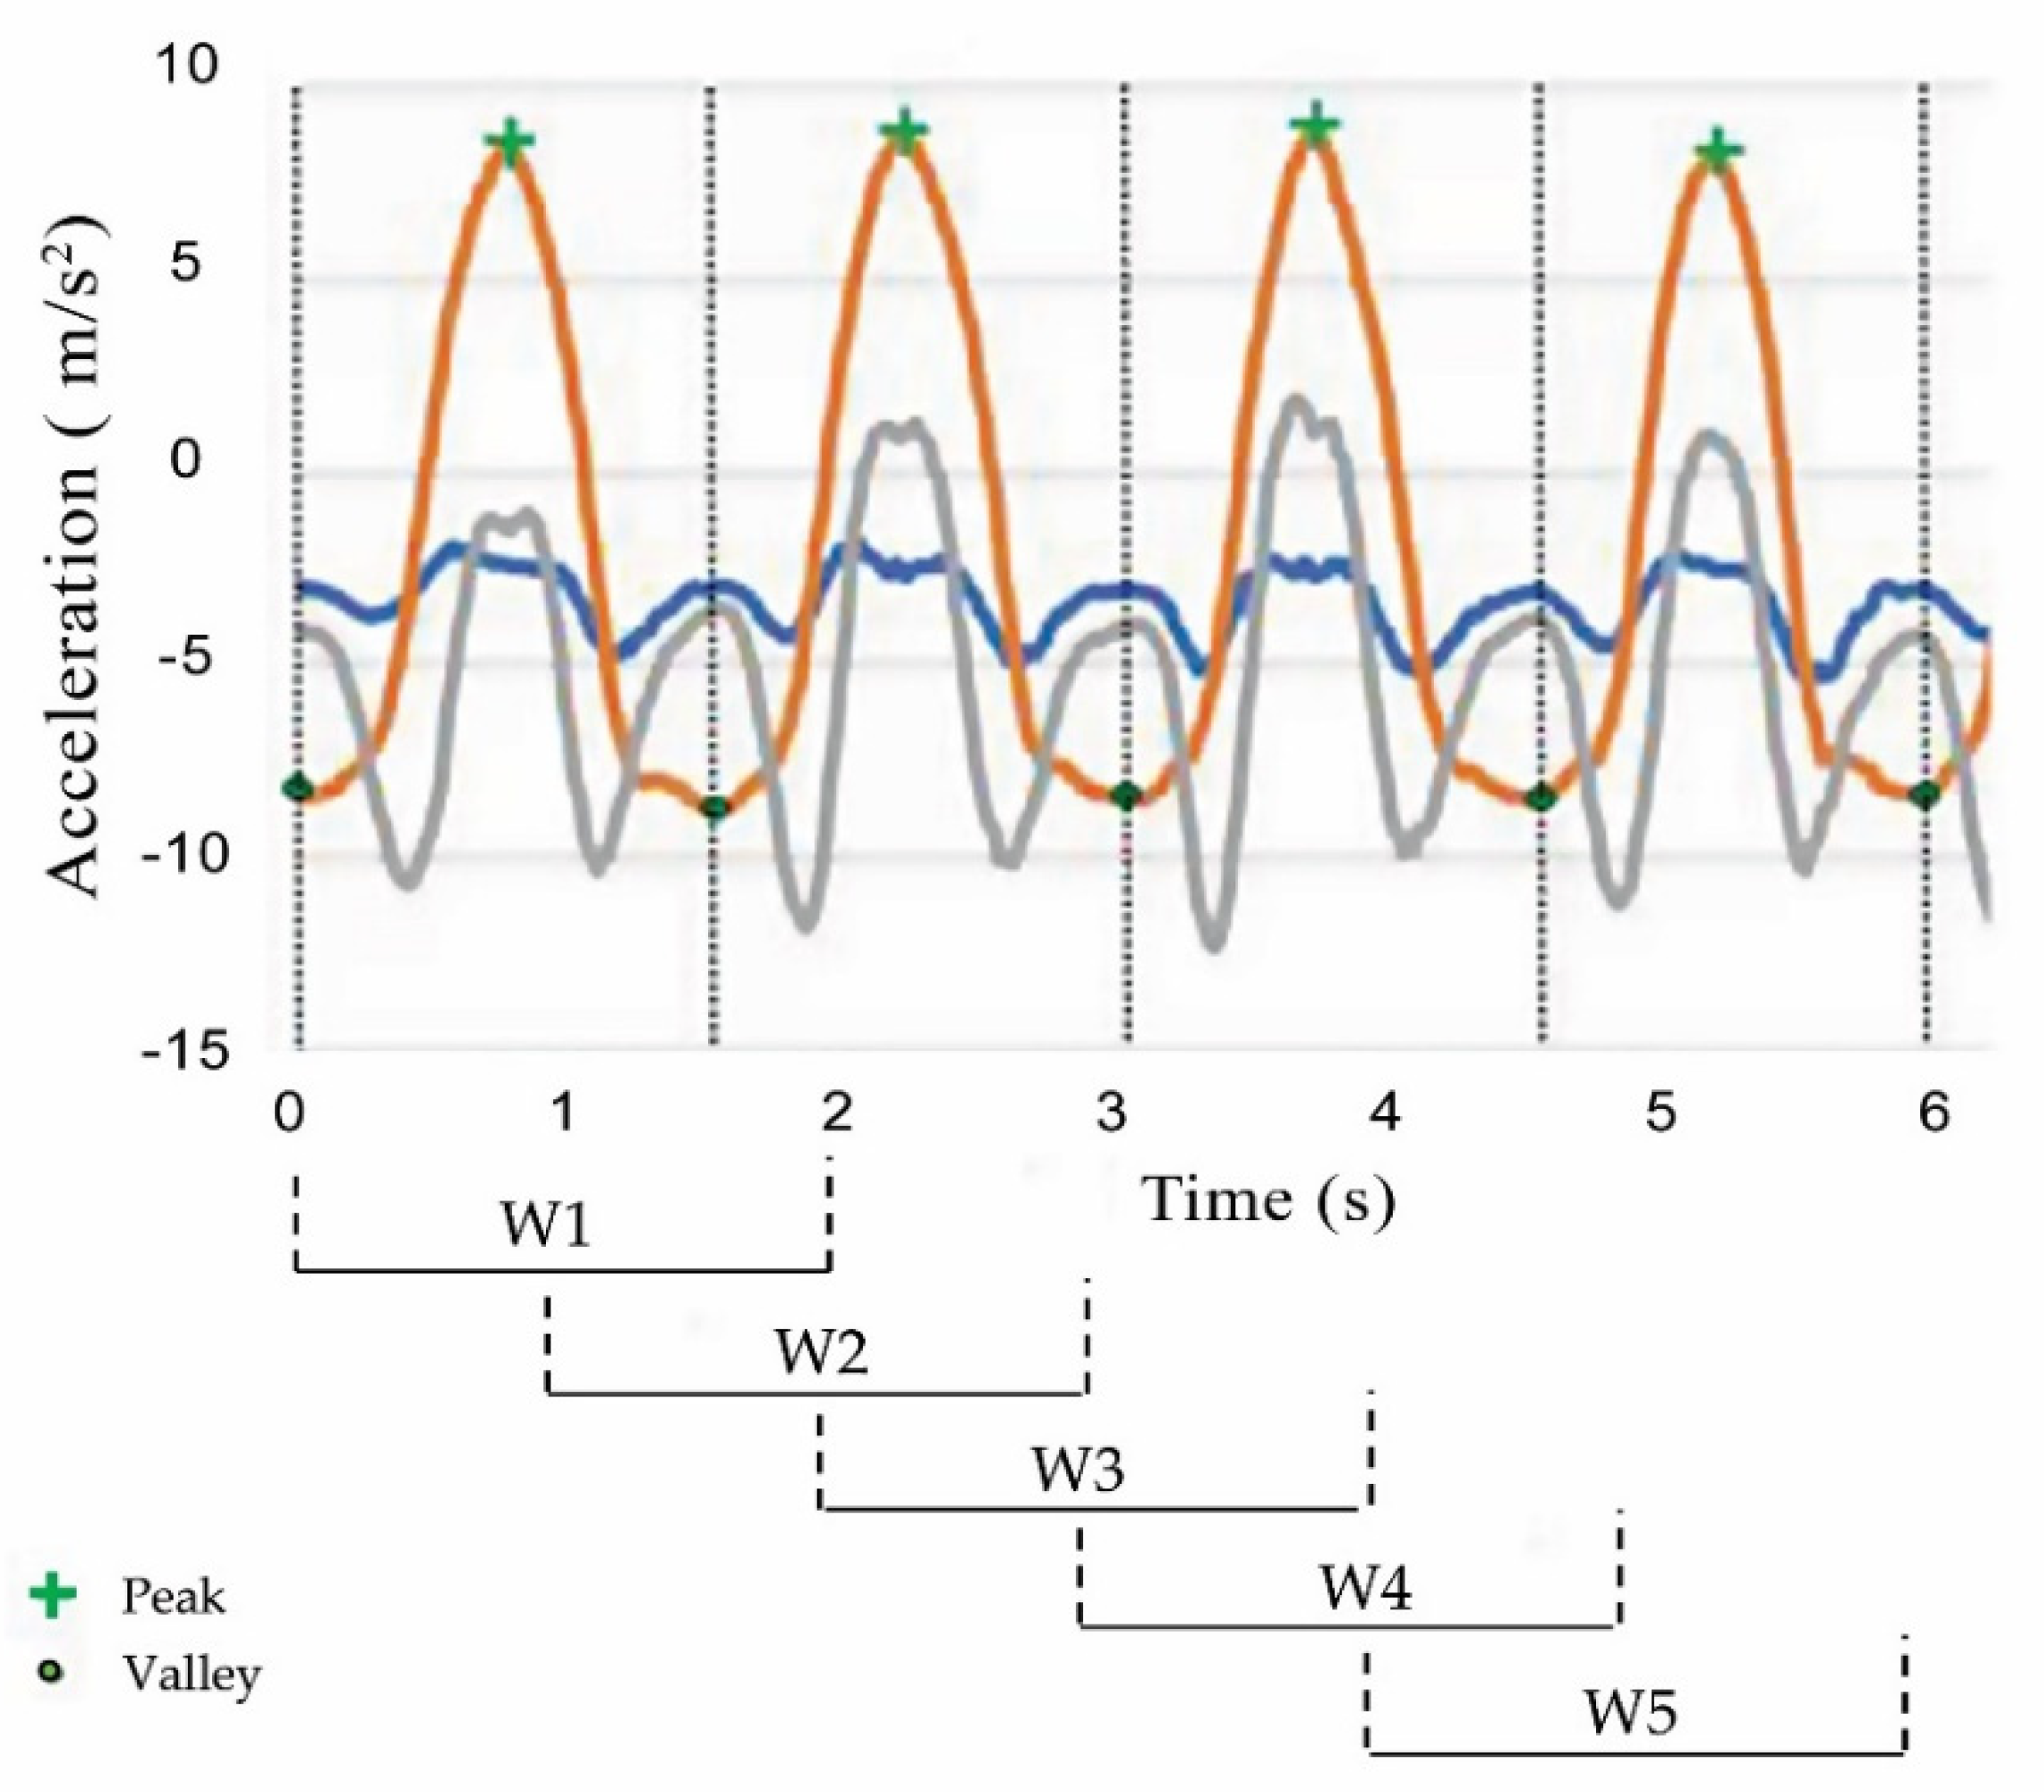
To demonstrate the performance improvement of the proposed method on activity recognition, two different segmentation methods were used for comparison purposes. The first method was the commonly used fixed-size sliding window of length 2 s and 50% overlap, which provided the highest recognition accuracy in [15]. This method was chosen because their work involved some activities that were also considered in this research. The second method was the proposed segmentation method. Figure 7 illustrates the result of using both methods for segmenting the acceleration signal of EF.
5.4. Feature Extraction
To generate data that could be suitably fed into a machine learning algorithm, multiple features were calculated from all the segments obtained using both methods. A diverse set of features is available, including time/frequency-domain features as well as heuristic features. For sensor-based human activity recognition, it is common to adopt time-domain features due to their simplicity and effectiveness for activity recognition [15,37]. In this work, only time-domain features were used since frequency-domain features have high computation and memory requirements, which may be not applicable in low-power real-time applications [38]. First, a magnitude (m) value was calculated using the signals (x, y, and z) from the accelerometer (). Furthermore, six time-domain features were considered and extracted from raw data of the three axes (x, y, and z), as well as (m). A list of the features used along with their definitions is presented in Table 1.
5.5. Model Training and Validation Strategies
Support vector machine (SVM) was used to train and test the classification model due to its frequent use in previous physical activity studies [16,29,30]. Ten-fold cross-validation was used to train the model, which means that data from nine subjects were randomly divided into training and testing sets using 90 and 10% of the data, respectively. The Waikato Environment for Knowledge Analysis (WEKA) toolkit was used in this work. Using a personal computer with an Intel Core i5-2430M CPU (Toshiba International Corporation, Texas, USA), the total time taken to build the model was 0.43 s.
Ten-fold cross-validation and leave-one-user-out (LOUO) were the evaluation protocols intensively used in the literature. Although 10-fold cross-validation is the most accurate approach for model selection, LOUO performs better in terms of model robustness, and it is recommended for human activity recognition [20]. In the latter protocol, instead of randomly splitting data into evaluation and training sets, it selects data from some subjects for training and data from the remaining for evaluation. As a result, the protocol is considered robust to the overfitting problem since training, and testing data never share samples belonging to the same subject [15]. Algorithm accuracy in this work was evaluated using LOUO, which means that the algorithm was trained using data from nine subjects and then evaluated on the remaining one. This process was repeated until data from each subject were evaluated exactly once, and an average of performance was obtained.
6. Results
Various performance metrics have been used in prior works, including accuracy, which refers to the ratio of correctly predicted observations to the total observations; recall, which refers to the ratio of correctly predicted positive observations to all observations in the actual class; precision, which is the ratio of correctly predicted positive observations to the total predicted positive observations; and F-measure, which is a combination of the precision and recall measures that are used to represent the detection result.
To evaluate the performance improvement of the proposed method, the experiment was conducted in two phases. First, the abovementioned performance metrics were used to determine the recognition performance using both segmentation methods: sliding window and the proposed method. For comparison purposes, only values of similar activities, as in [15], were presented. This study was chosen because it has the greatest number of shared activities with the ones provided in this work (i.e., the shared activities are abduction, flexion, and EF). In addition, it used the fixed-size sliding window protocol for segmentation. In the second phase, for the purpose of determining the effectiveness of the proposed method using the SVM classifier, other common classifiers, including J48, K-Nearest Neighbors (KNN), and Naïve Bayes (NB), were used for comparison.
Table 2 reports the classification performance of the proposed method in comparison to the fixed-size sliding window approach. It indicates that not only a performance improvement in accuracy measures was obtained when using the proposed method but also the values for precision, recall, and F-measure showed statistically significant improvements.
Additionally, an evaluation of activity type recognition accuracy and prediction error was undertaken for each of the three physical activities. As shown in Table 3, the algorithm had the greatest difficulties when recognizing abduction and flexion. This was expected because these two activities are similar, especially with regard to the starting and ending points of the movement, as well as the range of motion. However, the algorithm still achieved a recognition accuracy of 96% for these physical activities.
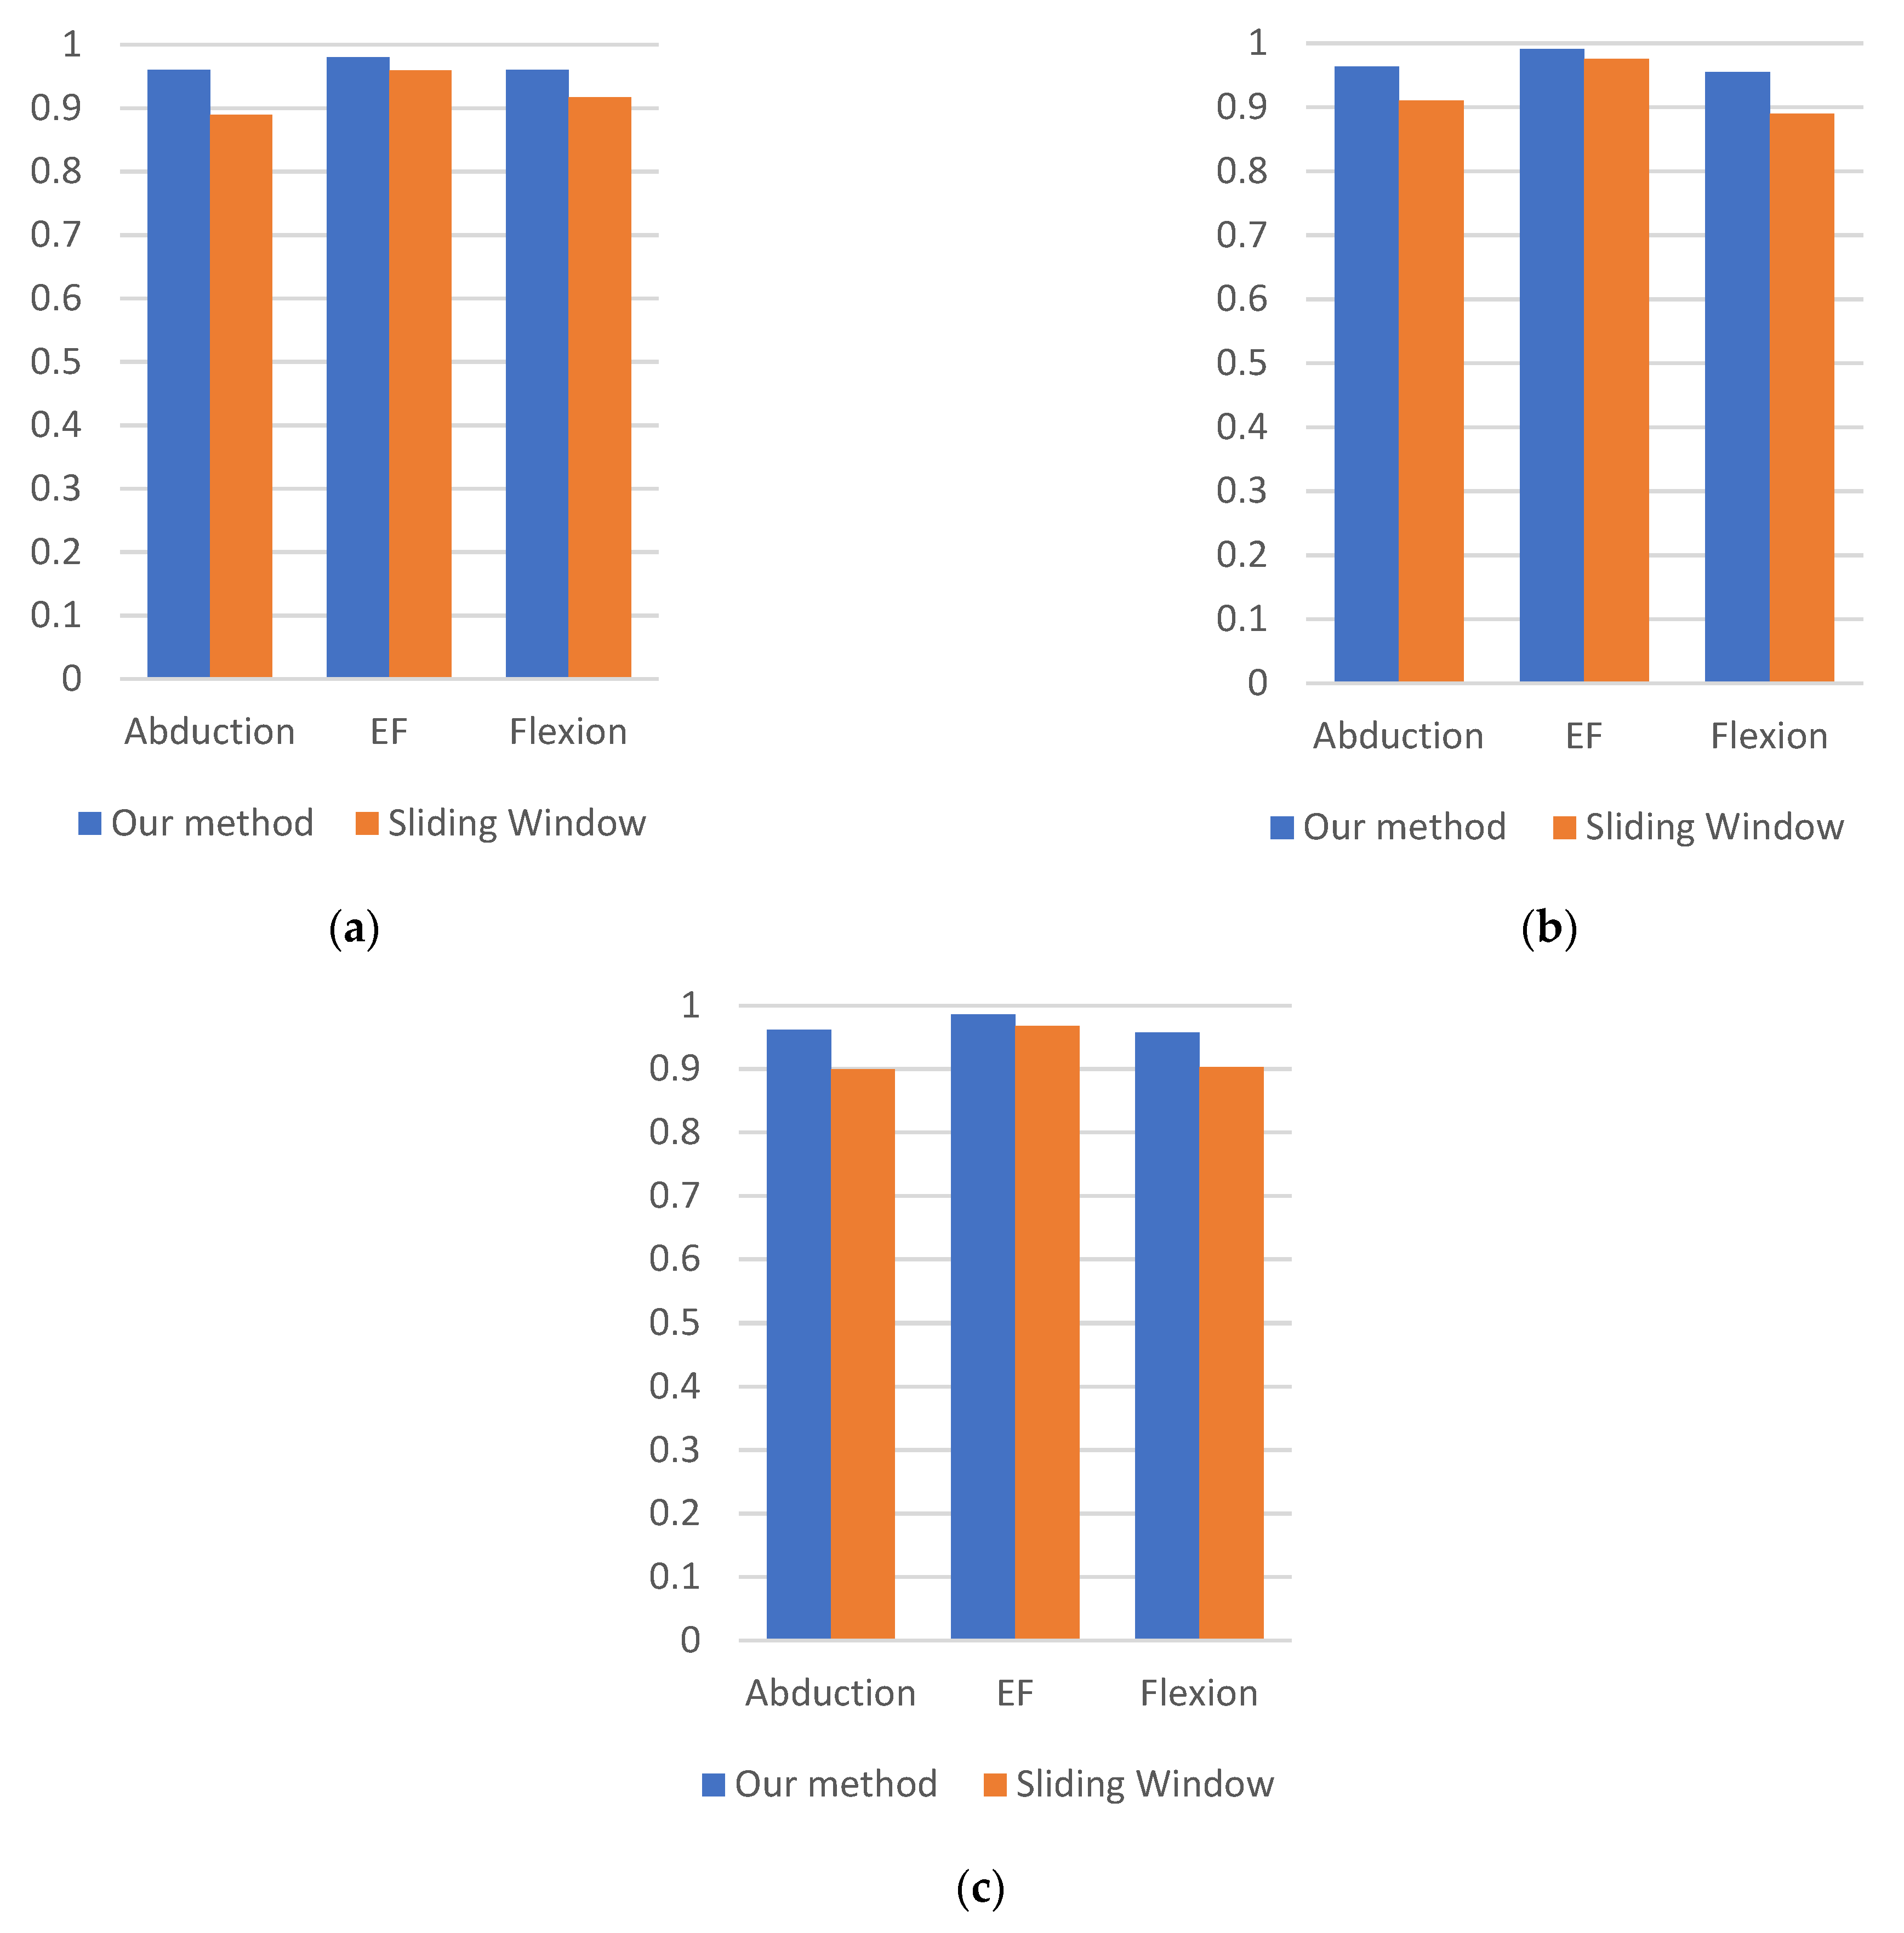
Figure 8 depicts the recall, precision, and F-measure values for each activity obtained by the model using the SVM classifier. Both segmentation methods achieved high classification performance in recognizing EF, and the enhancement achieved by the proposed method was small. However, the enhancement became increasingly large when recognizing more similar activities: abduction and flexion. The increase in recall when using the proposed method was 5% in abduction and approximately 4% in flexion, while precision increased by 5% and 7% in recognizing abduction and flexion, respectively. In addition, our method increased the F-measure of abduction by 7% and flexion by 5%. These results show that the proposed method not only enhanced performance but also increased model robustness.
To investigate the effectiveness of the proposed method using the SVM classifier, three common machine learning algorithms were further used for the comparison. Table 4 shows the performance of the proposed method and sliding window using NB, J48, and KNN classifiers.
7. Discussion
In this study, we proposed and verified a machine learning-based method for physical activity segmentation using wearable sensors. Our method enabled the algorithm to classify specific types of physical activity with an accuracy reaching up to 96%. Overall classification performance improved by approximately 5% compared to a commonly used approach, namely the sliding window. Furthermore, the results in Table 2 clearly indicate that the statistically significant improvement occurred not only in terms of accuracy but also in all performance measures used in this work. This enhancement reflects the effectiveness and applicability of the method on continuous data collected from a single accelerometer.
The algorithm enabled the accurate classification of similar activities, such as abduction and flexion. In contrast, when using sliding window segmentation, the algorithm frequently confused these activities and experienced difficulties in recognizing them. This demonstrates that the impact of the correct segmentation of raw data is not only on performance but also on model robustness.
Table 4 shows that the new segmentation method achieved a recognition rate of more than 91% using four different ML classifiers, and SVM outperformed the others. This is consistent with expectations because SVM is highly regularized and works effectively with small datasets and few classes. Moreover, the results of this table emphasize the effectiveness of the proposed method, which outperformed the sliding window method across all four classifiers with an average of 5.5%.
The results clearly show that wearable sensors are a promising technology for monitoring and performing automated rehabilitation assessments. Despite the performance enhancement obtained using specific sensor types, affordability and usability are also important factors for determining their applicability. The study in [18] used sEMG electrodes to recognize different activities performed by stroke patients. Although the results suggested that sEMG signals provide good accuracy in upper-limb activities, attaching these electrodes is a sensitive process that requires an expert. This type of sensor is impractical for use in certain applications, including monitoring in-home rehabilitation, especially if the set of activities must be repeated daily or multiple times during the day. Contrastingly, the accelerometers used in this research are low-cost and easy-to-use sensors.
This work can be considered as a systematic approach to dynamic signal segmentation, which could be applied to other types of physical activity. However, slight modifications should be taken into account when needed. For the segmentation of a wider range of activities, more signal characteristics might be needed. One possible solution is to exploit statistical and time series analysis to detect the signal variation.
The new method presented in this paper overcomes the limitation of the sliding window approach through the adaptive segmentation of physical activities. However, we acknowledge that certain limitations are evident in our work. First, only an accelerometer was used for physical activity recognition. Although studies have proven the effectiveness and efficiency of accelerometers, additional types of sensors, such as gyroscopes and magnetometers, may improve recognition performance. Second, this work focused on the segmentation of physical activities applied during the rehabilitation of SCI patients. Further research should be undertaken to study the effect of this method on other physical activities. Third, the data were collected in a controlled environment. Future work might consider collecting data from real scenarios in which participants perform activities at home. Finally, the selection of a threshold value depends on the training data. In future work, the threshold could be chosen with the ability to update periodically according to the incoming signal.
In addition to the abovementioned future work, the impact of the method on the rest of the activities will be investigated. In addition, frequency-domain features and additional time-domain features will be identified to facilitate performance enhancement. Finally, the method will be introduced into hospital-based rehabilitation sessions to examine the performance on SCI individuals.
8. Conclusions
In physical activity recognition using machine learning algorithms, data segmentation is an essential step that may influence accuracy. Nevertheless, studies mostly adopt the sliding window technique and rely on the window size used in previous works. Although this approach is considered simple, it might be ineffective, especially for activities with different durations.
This study proposed a novel segmentation method that can be applied to enhance the recognition of physical activities performed in a rehabilitative context. To adaptively segment the raw data, the algorithm identifies the time boundaries to represent the start- and endpoints of each activity. Peak boundaries and valley boundaries are used depending on the signal characteristics.
The proposed algorithm was also verified in this paper. The results, which were generated using data from a single accelerometer located on the wrist, approved the effectiveness and applicability of the method on continuous raw data. Moreover, adopting the proposed method generally improved recognition performance, and the improvement was more substantial for similar activities.
Author Contributions
Conceptualization, N.A.; methodology, N.A.; software, N.A.; validation, N.A.; formal analysis, N.A.; investigation, N.A.; resources, N.A.; data curation, N.A.; writing—original draft preparation, N.A.; writing—review and editing, N.A. and H.A.-D.; visualization, N.A.; supervision, H.A.-D.; project administration, H.A.-D. All authors have read and agreed to the published version of the manuscript.
Funding
The authors would like to thank the Deanship of scientific research in King Saud University for funding and supporting this research through the initiative of the DSR Graduate Students Research Support (GSR).
Conflicts of Interest
The authors declare no conflict of interest.
References
- Ding, D.; Ayubi, S.; Hiremath, S.; Parmanto, B. Physical activity monitoring and sharing platform for manual wheelchair users. In Proceedings of the 2012 Annual International Conference of the IEEE Engineering in Medicine and Biology Society, San Diego, CA, USA, 28 August 2012–1 September 2012; Volume 2012, pp. 5833–5836. [Google Scholar] [CrossRef]
- Harvey, L.A. Physiotherapy rehabilitation for people with spinal cord injuries. J. Physiother. 2016, 62, 4–11. [Google Scholar] [CrossRef] [PubMed] [Green Version]
- O’Sullivan, S.B.; Schmitz, T.J.; Fulk, G. Physical Rehabilitation, 7th ed.; F.A. Davis Co.: Philadelphia, PA, USA, 2019. [Google Scholar]
- Burns, A.S.; Marino, R.J.; Kalsi-Ryan, S.; Middleton, J.W.; Tetreault, L.A.; Dettori, J.R.; Mihalovich, K.E.; Fehlings, M.G. Type and Timing of Rehabilitation Following Acute and Subacute Spinal Cord Injury: A Systematic Review. Glob. Spine J. 2017, 7, 175S–194S. [Google Scholar] [CrossRef] [PubMed] [Green Version]
- Warms, C.A.; Whitney, J.D.; Belza, B. Measurement and description of physical activity in adult manual wheelchair users. Disabil. Health J. 2008, 1, 236–244. [Google Scholar] [CrossRef] [PubMed] [Green Version]
- Voicu, R.-A.; Dobre, C.; Bajenaru, L.; Ciobanu, R.-I. Human Physical Activity Recognition Using Smartphone Sensors. Sensors 2019, 19, 458. [Google Scholar] [CrossRef] [PubMed] [Green Version]
- Zambrana, C.; Idelsohn-Zielonka, S.; Claramunt-Molet, M.; Almenara-Masbernat, M.; Opisso, E.; Tormos, J.M.; Miralles, F.; Vargiu, E. Monitoring of upper-limb movements through inertial sensors—Preliminary results. Smart Health. 2019, 13, 100059. [Google Scholar] [CrossRef]
- Leving, M.T.; Horemans, H.L.D.; Vegter, R.J.K.; De Groot, S.; Bussmann, J.B.J.; Van Der Woude, L.H.V. Validity of consumer-grade activity monitor to identify manual wheelchair propulsion in standardized activities of daily living. PLoS ONE 2018, 13, e0194864. [Google Scholar] [CrossRef] [Green Version]
- Bisio, I.; Delfino, A.; Lavagetto, F.; Sciarrone, A. Enabling IoT for In-Home Rehabilitation: Accelerometer Signals Classification Methods for Activity and Movement Recognition. IEEE Internet Things J. 2016, 4, 135–146. [Google Scholar] [CrossRef]
- Panwar, M.; Prakash, C.; Piswas, D.; Asharyya, A. CNN based approach for activity recognition using a wrist-worn accelerometer. In Proceedings of the Annual International Conference of the IEEE Engineering in Medicine and Biology Society, EMBS, Jeju Island, Korea, 11–15 July 2017; pp. 2438–2441. [Google Scholar]
- Twomey, N.; Diethe, T.; Fafoutis, X.; Elsts, A.; McConville, R.; Flach, P.; Craddock, I. A Comprehensive Study of Activity Recognition Using Accelerometers. Informatics 2018, 5, 27. [Google Scholar] [CrossRef] [Green Version]
- Bao, L.; Intille, S.S. Activity Recognition from User-Annotated Acceleration Data. Pervasive 2004, 3001, 1–17. [Google Scholar]
- Bergmann, J.H.M.; McGregor, A.H. Body-Worn Sensor Design: What Do Patients and Clinicians Want? Ann. Biomed. Eng. 2011, 39, 2299–2312. [Google Scholar] [CrossRef]
- Dostál, O.; Procházka, A.; Vyšata, O.; Ťupa, O.; Cejnar, P.; Vališ, M. Recognition of motion patterns using accelerometers for ataxic gait assessment. Neural Comput. Appl. 2020, 2, 1–9. [Google Scholar] [CrossRef]
- Pernek, I.; Kurillo, G.; Stiglic, G.; Bajcsy, R. Recognizing the intensity of strength training exercises with wearable sensors. J. Biomed. Inform. 2015, 58, 145–155. [Google Scholar] [CrossRef] [Green Version]
- Biswas, D.; Cranny, A.; Gupta, N.; Maharatna, K.; Achner, J.; Klemke, J.; Jobges, M.; Ortmann, S. Recognizing upper limb movements with wrist worn inertial sensors using k-means clustering classification. Hum. Mov. Sci. 2015, 40, 59–76. [Google Scholar] [CrossRef] [Green Version]
- Lin, H.-C.; Chiang, S.-Y.; Lee, K.; Kan, Y.-C. An Activity Recognition Model Using Inertial Sensor Nodes in a Wireless Sensor Network for Frozen Shoulder Rehabilitation Exercises. Sensors 2015, 15, 2181–2204. [Google Scholar] [CrossRef] [Green Version]
- Cai, S.; Chen, Y.; Huang, S.; Wu, Y.; Zheng, H.; Li, X.; Xie, L. SVM-based classification of sEMG signals for upper-limb self-rehabilitation training. Front. Neurorobot. 2019, 13, 1–10. [Google Scholar] [CrossRef] [Green Version]
- Ni, Q.; Patterson, T.; Cleland, I.; Nugent, C. Dynamic detection of window starting positions and its implementation within an activity recognition framework. J. Biomed. Inform. 2016, 62, 171–180. [Google Scholar] [CrossRef] [PubMed]
- Wang, G.; Li, Q.; Wang, L.; Wang, W.; Wu, M.; Liu, T. Impact of Sliding Window Length in Indoor Human Motion Modes and Pose Pattern Recognition Based on Smartphone Sensors. Sensors 2018, 18, 1965. [Google Scholar] [CrossRef] [PubMed] [Green Version]
- Li, J.-H.; Tian, L.; Wang, H.; An, Y.; Wang, K.; Yu, L. Segmentation and Recognition of Basic and Transitional Activities for Continuous Physical Human Activity. IEEE Access 2019, 7, 42565–42576. [Google Scholar] [CrossRef]
- Fida, B.; Bernabucci, I.; Bibbo, D.; Conforto, S.; Schmid, M. Varying behavior of different window sizes on the classification of static and dynamic physical activities from a single accelerometer. Med. Eng. Phys. 2015, 37, 705–711. [Google Scholar] [CrossRef]
- Ni, Q.; Zhang, L.; Li, L. A Heterogeneous Ensemble Approach for Activity Recognition with Integration of Change Point-Based Data Segmentation. Appl. Sci. 2018, 8, 1695. [Google Scholar] [CrossRef] [Green Version]
- Noor, M.H.M.; Salcic, Z.; Wang, K.I.-K. Adaptive sliding window segmentation for physical activity recognition using a single tri-axial accelerometer. Pervasive Mob. Comput. 2017, 38, 41–59. [Google Scholar] [CrossRef]
- Santos, L.; Khoshhal, K.; Dias, J. Trajectory-based human action segmentation. Pattern Recognit. 2015, 48, 568–579. [Google Scholar] [CrossRef]
- Zhang, S.; Chen, H.; Jiang, C.; Zhang, S. An adaptive time window method for human activity recognition. In Proceedings of the 2015 IEEE 28th Canadian Conference on Electrical and Computer Engineering, Halifax, NS, Canada, 3–6 May 2015; pp. 1188–1192. [Google Scholar] [CrossRef]
- Ling, Y. Automatic human daily activity segmentation applying smart sensing technology. Int. J. Smart Sens. Intell. Syst. 2015, 8, 1624–1640. [Google Scholar] [CrossRef] [Green Version]
- Physio Therapy Exercises. Available online: https://www.physiotherapyexercises.com (accessed on 3 October 2019).
- Nas, K.; Yazmalar, L.; Şah, V.; Aydin, A.; Öneş, K. Rehabilitation of spinal cord injuries. World J. Orthop. 2015, 6, 8–16. [Google Scholar] [CrossRef] [PubMed]
- Côté, M.-P.; Murray, M.; Lemay, M.A. Rehabilitation Strategies after Spinal Cord Injury: Inquiry into the Mechanisms of Success and Failure. J. Neurotrauma 2017, 34, 1841–1857. [Google Scholar] [CrossRef] [PubMed] [Green Version]
- Janidarmian, M.; Fekr, A.R.; Radecka, K.; Zilic, Z. A Comprehensive Analysis on Wearable Acceleration Sensors in Human Activity Recognition. Sensors 2017, 17, 529. [Google Scholar] [CrossRef] [PubMed]
- Ignatov, A. Real-time human activity recognition from accelerometer data using Convolutional Neural Networks. Appl. Soft Comput. 2018, 62, 915–922. [Google Scholar] [CrossRef]
- Garciamasso, X.; Serra-Añó, P.; Gonzalez, L.M.; Ye-Lin, Y.; Prats-Boluda, G.; Garcia-Casado, J. Identifying physical activity type in manual wheelchair users with spinal cord injury by means of accelerometers. Spinal Cord 2015, 53, 772–777. [Google Scholar] [CrossRef]
- Siirtola, P.; Laurinen, P.; Roning, J.; Kinnunen, H. Efficient accelerometer-based swimming exercise tracking. In Proceedings of the 2011 IEEE Symposium on Computational Intelligence and Data Mining (CIDM), Paris, France, 11–15 April 2011; IEEE: New York, NY, USA, 2011; pp. 156–161. [Google Scholar]
- Han, S.; Meng, Z.; Omisore, O.; Akinyemi, T.; Yan, Y. Random Error Reduction Algorithms for MEMS Inertial Sensor Accuracy Improvement—A Review. Micromachines 2020, 11, 1021. [Google Scholar] [CrossRef]
- Erdaş, B.; Atasoy, I.; Açici, K.; Oǧul, H. Integrating Features for Accelerometer-based Activity Recognition. Procedia Comput. Sci. 2016, 58, 522–527. [Google Scholar] [CrossRef] [Green Version]
- Hiremath, S.V.; Intille, S.S.; Kelleher, A.; Cooper, R.A.; Ding, D. Detection of physical activities using a physical activity monitor system for wheelchair users. Med. Eng. Phys. 2015, 37, 68–76. [Google Scholar] [CrossRef] [PubMed]
- Elhoushi, M.; Georgy, J.; Noureldin, A.; Korenberg, M.J. A Survey on Approaches of Motion Mode Recognition Using Sensors. IEEE Trans. Intell. Transp. Syst. 2017, 18, 1662–1686. [Google Scholar] [CrossRef]
Figure 1.
Physical activities used to rehabilitate spinal cord injuries (SCI) patients: (a) Shoulder flexion; (b) Shoulder abduction; (c) Internal rotation; (d) External rotation; (e) Extension; (f) Elbow flexion; (g) Elbow extension [28].
Figure 1.
Physical activities used to rehabilitate spinal cord injuries (SCI) patients: (a) Shoulder flexion; (b) Shoulder abduction; (c) Internal rotation; (d) External rotation; (e) Extension; (f) Elbow flexion; (g) Elbow extension [28].

Figure 2.
Axis orientation.

Figure 3.
Acceleration signal for 10 repetitions of (a) Abduction, (b) Internal rotation (IR), and (c) Extension.
Figure 3.
Acceleration signal for 10 repetitions of (a) Abduction, (b) Internal rotation (IR), and (c) Extension.

Figure 4.
Detected peaks in acceleration signal: (a) Initial selection of peaks; (b) After applying threshold and minimum distance.
Figure 4.
Detected peaks in acceleration signal: (a) Initial selection of peaks; (b) After applying threshold and minimum distance.

Figure 5.
Determining boundary type based on signal characteristics (P: Peak; V: Valley).

Figure 6.
Acceleration signal of two consecutive peaks corresponding to: (a) Single extension; (b) Single IR; (c) Two abductions; (d) Two flexions; (e) Two elbow extensions (EEs); (f) Two elbow flexions (EFs); and (g) Two external rotations (ERs).
Figure 6.
Acceleration signal of two consecutive peaks corresponding to: (a) Single extension; (b) Single IR; (c) Two abductions; (d) Two flexions; (e) Two elbow extensions (EEs); (f) Two elbow flexions (EFs); and (g) Two external rotations (ERs).

Figure 7.
Acceleration signal of four repetitions of EF segmented using sliding window (lower part) and the proposed method (dotted lines).
Figure 7.
Acceleration signal of four repetitions of EF segmented using sliding window (lower part) and the proposed method (dotted lines).

Figure 8.
Performance comparison of each activity using: (a) Recall; (b) Precision; (c) F-measure.


Table 1.
List of features used (notation: ; N is the number of data points; i is the index).
| Name | Definition |
|---|---|
| Minimum | min(d) = lowest di, i = 1, 2, …, N |
| Maximum | max(d) = highest di, i = 1, 2, …, N |
| Range | range(d) = max(d) − min(d) |
| Mean | mean(d) = |
| Standard Deviation | SD(d) = |
| Root Mean Square | RMS(d) = |
Table 2.
Performance comparison using accuracy, recall, and precision measures (mean ± standard deviation) between segmentation using the proposed method and fixed-size sliding window.
Table 2.
Performance comparison using accuracy, recall, and precision measures (mean ± standard deviation) between segmentation using the proposed method and fixed-size sliding window.
| Accuracy | Recall | Precision | F-Measure | |
|---|---|---|---|---|
| Our method | 96.67 ± 2.7% | 96.67 ± 1.2% | 96.97 ± 1.9% | 96.82 ± 1.5% |
| Sliding Window | 91.44 ± 5.9% | 91.90 ± 3.9% | 92.51 ± 4.5 % | 92.21 ± 3.8% |
Table 3.
Confusion matrix of activity recognition (in %). Rows represent actual exercise, whereas columns show algorithm predictions (cells with value 0 are left blank).
Table 3.
Confusion matrix of activity recognition (in %). Rows represent actual exercise, whereas columns show algorithm predictions (cells with value 0 are left blank).
| Abduction | EF | Flexion | |
|---|---|---|---|
| Abduction | 96 | 1 | 3 |
| EF | 98 | 2 | |
| Flexion | 4 | 96 |
EF: Elbow Flexion.
Table 4.
Recognition accuracy of both segmentation methods using different classification algorithms.
Table 4.
Recognition accuracy of both segmentation methods using different classification algorithms.
| SVM | NB | J48 | KNN | |
|---|---|---|---|---|
| Our method | 96.67 ± 2.7% | 91 ± 3.4% | 95 ± 5.1% | 95.65 ± 1.9% |
| Sliding Window | 91.44 ± 5.9% | 84.49 ± 3.9% | 89.78 ± 5.4% | 90.28 ± 5.4% |
Publisher’s Note: MDPI stays neutral with regard to jurisdictional claims in published maps and institutional affiliations. |
© 2021 by the authors. Licensee MDPI, Basel, Switzerland. This article is an open access article distributed under the terms and conditions of the Creative Commons Attribution (CC BY) license (http://creativecommons.org/licenses/by/4.0/).
Share and Cite
MDPI and ACS Style
Alhammad, N.; Al-Dossari, H. Dynamic Segmentation for Physical Activity Recognition Using a Single Wearable Sensor. Appl. Sci. 2021, 11, 2633. https://doi.org/10.3390/app11062633
AMA Style
Alhammad N, Al-Dossari H. Dynamic Segmentation for Physical Activity Recognition Using a Single Wearable Sensor. Applied Sciences. 2021; 11(6):2633. https://doi.org/10.3390/app11062633
Chicago/Turabian StyleAlhammad, Nora, and Hmood Al-Dossari. 2021. "Dynamic Segmentation for Physical Activity Recognition Using a Single Wearable Sensor" Applied Sciences 11, no. 6: 2633. https://doi.org/10.3390/app11062633
Note that from the first issue of 2016, this journal uses article numbers instead of page numbers. See further details here.