Article

Effects of Increased Extracellular Potassium Concentration Induced by Ischemia on the Vulnerability of Ventricular Arrhythmias and the Regularity of Related Ventricular Tachycardia

1
Academy for Engineering & Technology, Fudan University, Shanghai 200433, China
2
Department of Electronic Engineering, Fudan University, Shanghai 200433, China
3
Key Laboratory of Medical Imaging, Electrical Computing and Computer Assisted Intervention (MICCAI) of Shanghai, Fudan University, Shanghai 200433, China
4
Research Center of Assistive Devices, Engineering Department and Academy for Engineering & Technology, Fudan University, Shanghai 200433, China
*
Author to whom correspondence should be addressed.
Appl. Sci. 2021, 11(5), 2189; https://doi.org/10.3390/app11052189
Submission received: 2 February 2021 / Revised: 24 February 2021 / Accepted: 25 February 2021 / Published: 2 March 2021
(This article belongs to the Section Applied Biosciences and Bioengineering)

Abstract

:
Myocardial ischemia could induce arrhythmias such as ventricular tachycardia and ventricular fibrillation, leading to sudden death and other serious consequences. This manuscript adopted the cardiac modeling and simulation method to study the activity pattern of myocardial ischemia-related ventricular tachycardia and the effect of increased extracellular potassium concentration on arrhythmia vulnerability. A whole ventricular electrophysiological model of endocardial ischemia caused by distal occlusion of left anterior descending coronary artery was established. The simulation results suggested that the relationship between the vulnerability of ventricular arrhythmias and extracellular potassium concentration was bell shaped with a peak in susceptibility at 12 mM. This result was caused by the effect of extracellular potassium concentration on the dispersion of repolarization and the effective refractory period of cardiomyocytes. The extension of the effective refractory period was due to the electrical remodeling of the ventricle. Specifically, it was because of the delayed recovery of the INa current. In addition, the regularity of endocardial/epicardial reentrant pattern during non-transmural ischemia was also analyzed. The endocardium formed micro-reentrant, while the epicardium established macro-reentrant rotating around the ischemic regions provided a new idea for the determination of clinical ablation targets.

1. Introduction

Ischemic heart disease is a leading cause of sudden arrhythmic death, causing 7 million deaths worldwide every year [1]. Clinical studies have shown that the incidence of arrhythmias increases significantly when cardiomyocytes are ischemic [2]. However, the specific mechanism of arrhythmia and the activity law of depolarizing wave induced by myocardial ischemia is not completely clear. Therefore, it is of great clinical significance to study the relationship between myocardial ischemia and arrhythmia.
Myocardial ischemia is usually caused by coronary artery occlusion [3]. Ischemia could lead to three main ischemic effects in cardiomyocytes: reduced oxygen supply (hypoxia), increased extracellular potassium concentration (hyperkalemia) and tissue acidification (acidosis). These metabolic changes make the amplitude and duration of action potential decrease, the conduction velocity slow down and the effective refractory period increase [4]. According to previous research, the elevation of resting membrane potential and the change of cellular excitability caused by the increase of extracellular potassium concentration may provide substrate conditions for the occurrence and maintenance of arrhythmia [5]. Although the relationship between extracellular potassium concentration and arrhythmia has been studied in animal experiments, the mechanism has not been analyzed and confirmed from micro to macro scale; therefore, further study is needed.
Because the mechanism of arrhythmia caused by myocardial ischemia involves many factors from microscopic (cellular and molecular level) to macroscopic (tissue and organ level), it is difficult to understand its internal mechanism through animal experiments or clinical studies. Therefore, computer modeling and simulation has become an effective supplementary tool for experimental and clinical research [6,7].
Many researchers have explored the relationship between ischemic heart disease and arrhythmia from different perspectives. Tice et al. used a 2D model to study the importance of transmural heterogeneity in arrhythmias. The results showed that the transmural gradient of IK(ATP) significantly increased the susceptibility to arrhythmias [8]. Rodrigue et al. simulated global ventricular ischemia on a 3D rabbit ventricular model and studied the effect of global ventricular ischemia on the upper limit of the vulnerability period of defibrillation [9]. McDowel et al. studied the effect of fibroblast density on arrhythmia susceptibility and found that arrhythmia susceptibility increases with the increase of fibroblast density, but higher fibroblast density led to a decrease in arrhythmia susceptibility [10]. Deng et al. assessed the risk of arrhythmia by building a personalized virtual heart model [11]. Fallahia et al. simulated ECG signals during ischemia [12]. The current studies are almost aimed at transmural ischemia and there is a lack of computer simulation study on the relationship between the increase of extracellular potassium concentration caused by ischemia and arrhythmia vulnerability.
Therefore, this manuscript adopted the cardiac modeling and simulation method to study the propagation pattern of reentry during non-transmural ischemia and the relationship between extracellular potassium concentration ([K+]o) and arrhythmia vulnerability in the case of hyperkalemia.

2. Materials and Methods

This manuscript constructed a multi-scale ventricular electrophysiological model from cell level to tissue level then to organ level. On the basis of this model, the whole ventricular electrophysiological model of endocardial ischemia caused by distal occlusion of left anterior descending coronary artery was established. Figure 1 shows the construction process of the ventricular model. The reentry forms of endocardium and epicardium with non-transmural ischemia were analyzed by applying S1–S2 stimulation to induce tachycardia. The arrhythmia vulnerability was evaluated when the extracellular potassium concentration was different in the ischemic regions by measuring the vulnerability window. The research was carried out on the simulation software CARP (Cardiac Arrhythmia Research Package).

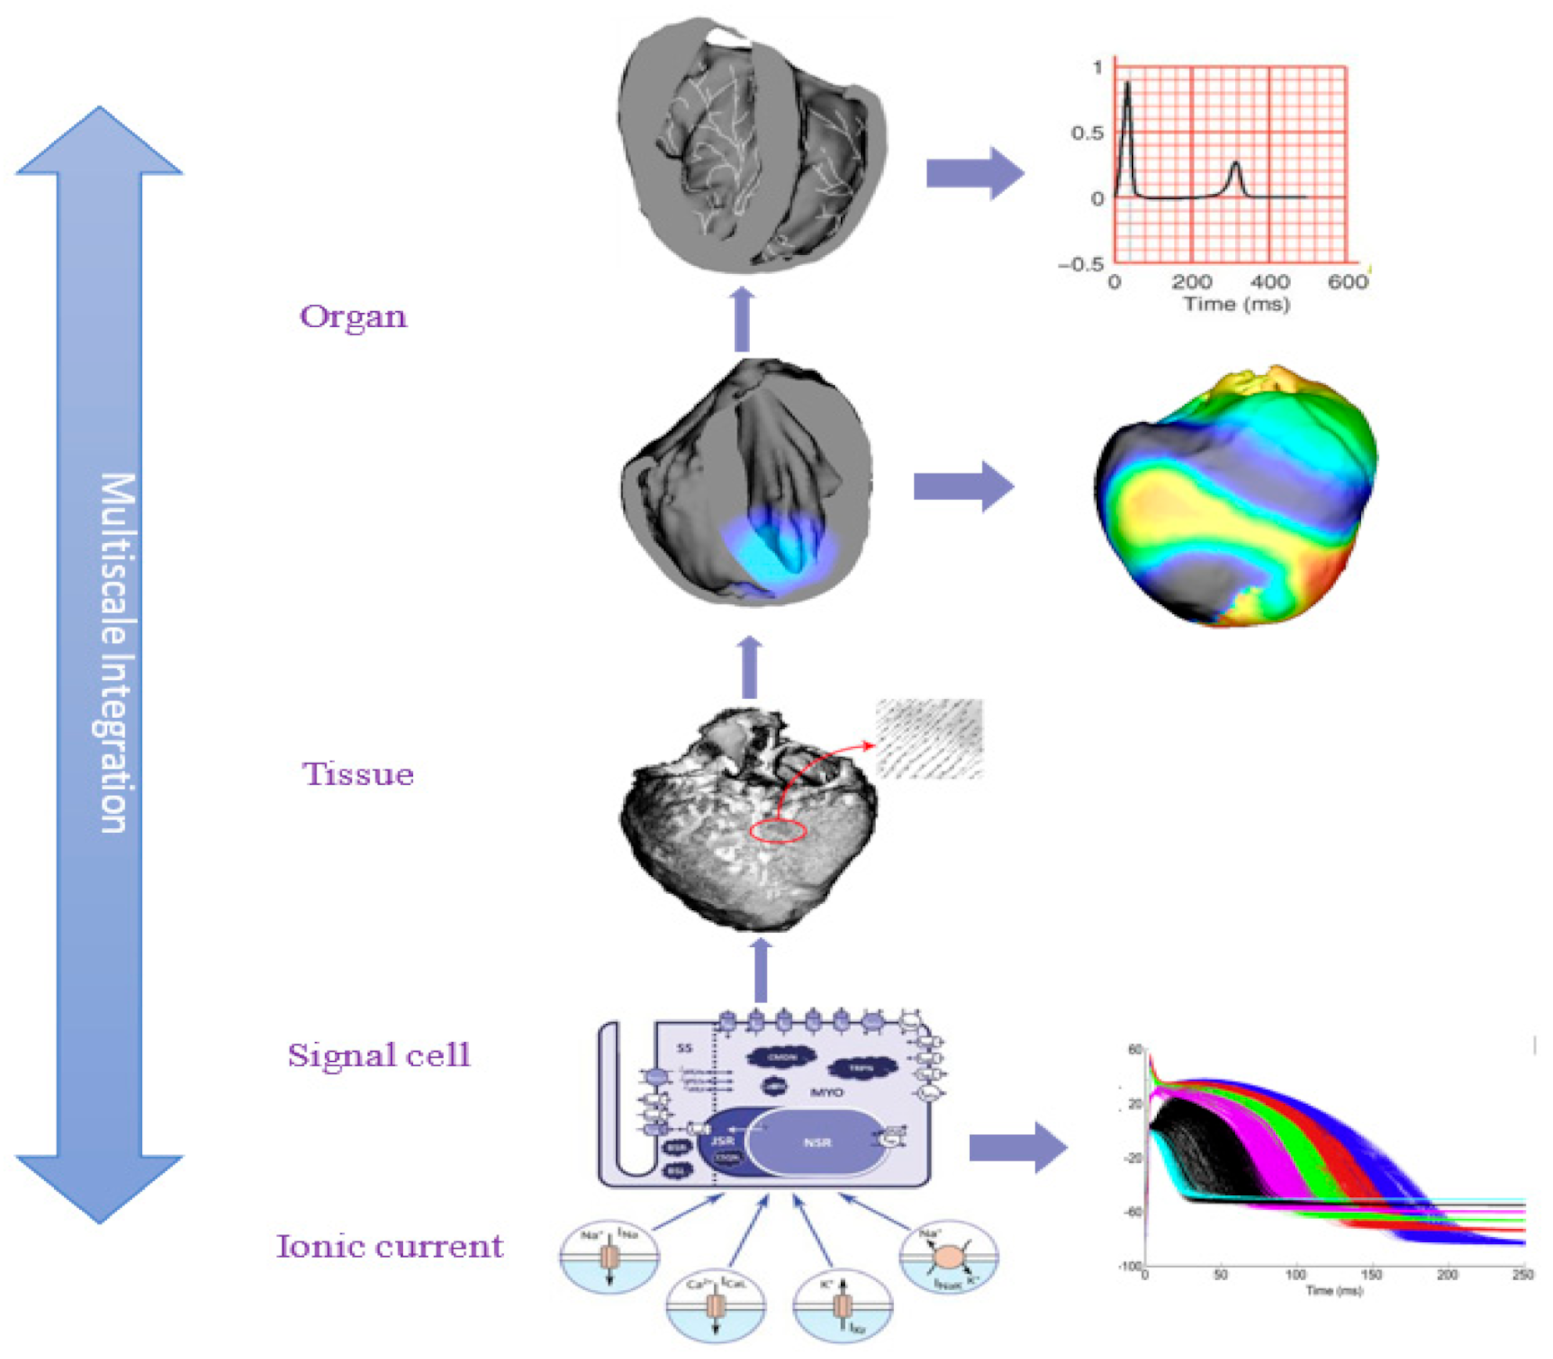
2.1. Construction of Whole Ventricular Electrophysiological Model

The heart anatomical model was a rabbit ventricular finite element model based on magnetic resonance images, which contained 82,619 nodes and 431,990 elements [13]. The resolution of the model was 410 um, which can guarantee the efficiency and accuracy of simulation at the same time [14]. We adopted the bidomain model and the effect of the direction of myocardial fibers were considered. The conductivity, along the fiber direction, was set to 0.62 S/m and the conductivity in the vertical fiber direction was set to 0.24 S/m in the extracellular space, while the corresponding conductivities in the intracellular space were set to 0.174 S/m and 0.019 S/m, respectively [15]. All these values were multiplied by 0.3 times to be consistent with the conduction velocity of the real rabbit ventricular myocardium [16]. The main input parameters of the model were shown in Table 1.
The myocardium was equally divided into three layers according to the transmural distance: endocardium, midmyocardium and epicardium. The Mahajan cell models [17] were adopted and the three-layer cardiomyocyte models were obtained by modifying the ionic currents parameters [18]. In our study, the Mahajan rabbit ventricular cell model without modified parameters was used as the epicardial cell model; the endocardial cell model was obtained by multiplying the slow inactivating transient outward K+ current (Ito,s) by 25%; the myocardial middle cell model was obtained by multiplying slow delayed rectifier K+ current(IKs) by 25%.

2.2. Ventricular Electrophysiological Heterogeneity during Ischemia

Different ischemic degrees and sites could lead to different spatiotemporal manifestations of ischemic effects. Ischemia first occurs in the endocardium, which is called subendocardial ischemia. If arterial occlusion lasts for a long time, the ischemia will spread to the epicardium, forming transmural ischemia [19]. This manuscript simulated endocardial ischemia during distal occlusion of the left anterior descending branch of the coronary artery. The ischemic area included the ischemic central zone (ICZ) and the border zone (BZ), while the rest of the ventricular area was the normal zone (NZ). The edema of cardiomyocytes and the increase of anaerobic glycolysis in myocardium led to acidosis in the cells and high potassium outside the cells, which affect the depolarization and repolarization of the ventricle. In this study, different cell electrophysiological parameters were set in the ischemic central zone: on the basis of the extracellular potassium concentration of 5.4 mM in normal myocardium, the extracellular potassium concentration was set to 9 mM, 12 mM, 15 mM, respectively, to simulate hyperkalemia [20]; hypoxia was mimicked by partially activating the ATP-sensitive K+ current (IK(ATP)) [21]; acidosis was taken into account by reducing peak sodium current (INa),peak L-type calcium current (ICa-L), slow delayed rectifier potassium current (IKs)and rapid delayed rectifier potassium current (IKr), to 38%, 31%, 20% and 30% of the normal value, respectively. In order to model cellular uncoupling, the conductivity was reduced to 10% of the normal value [11]. The above parameters of the BZ were set as gradient changes to simulate the linear transition from the ICZ to the NZ.

2.3. Simulation and Method
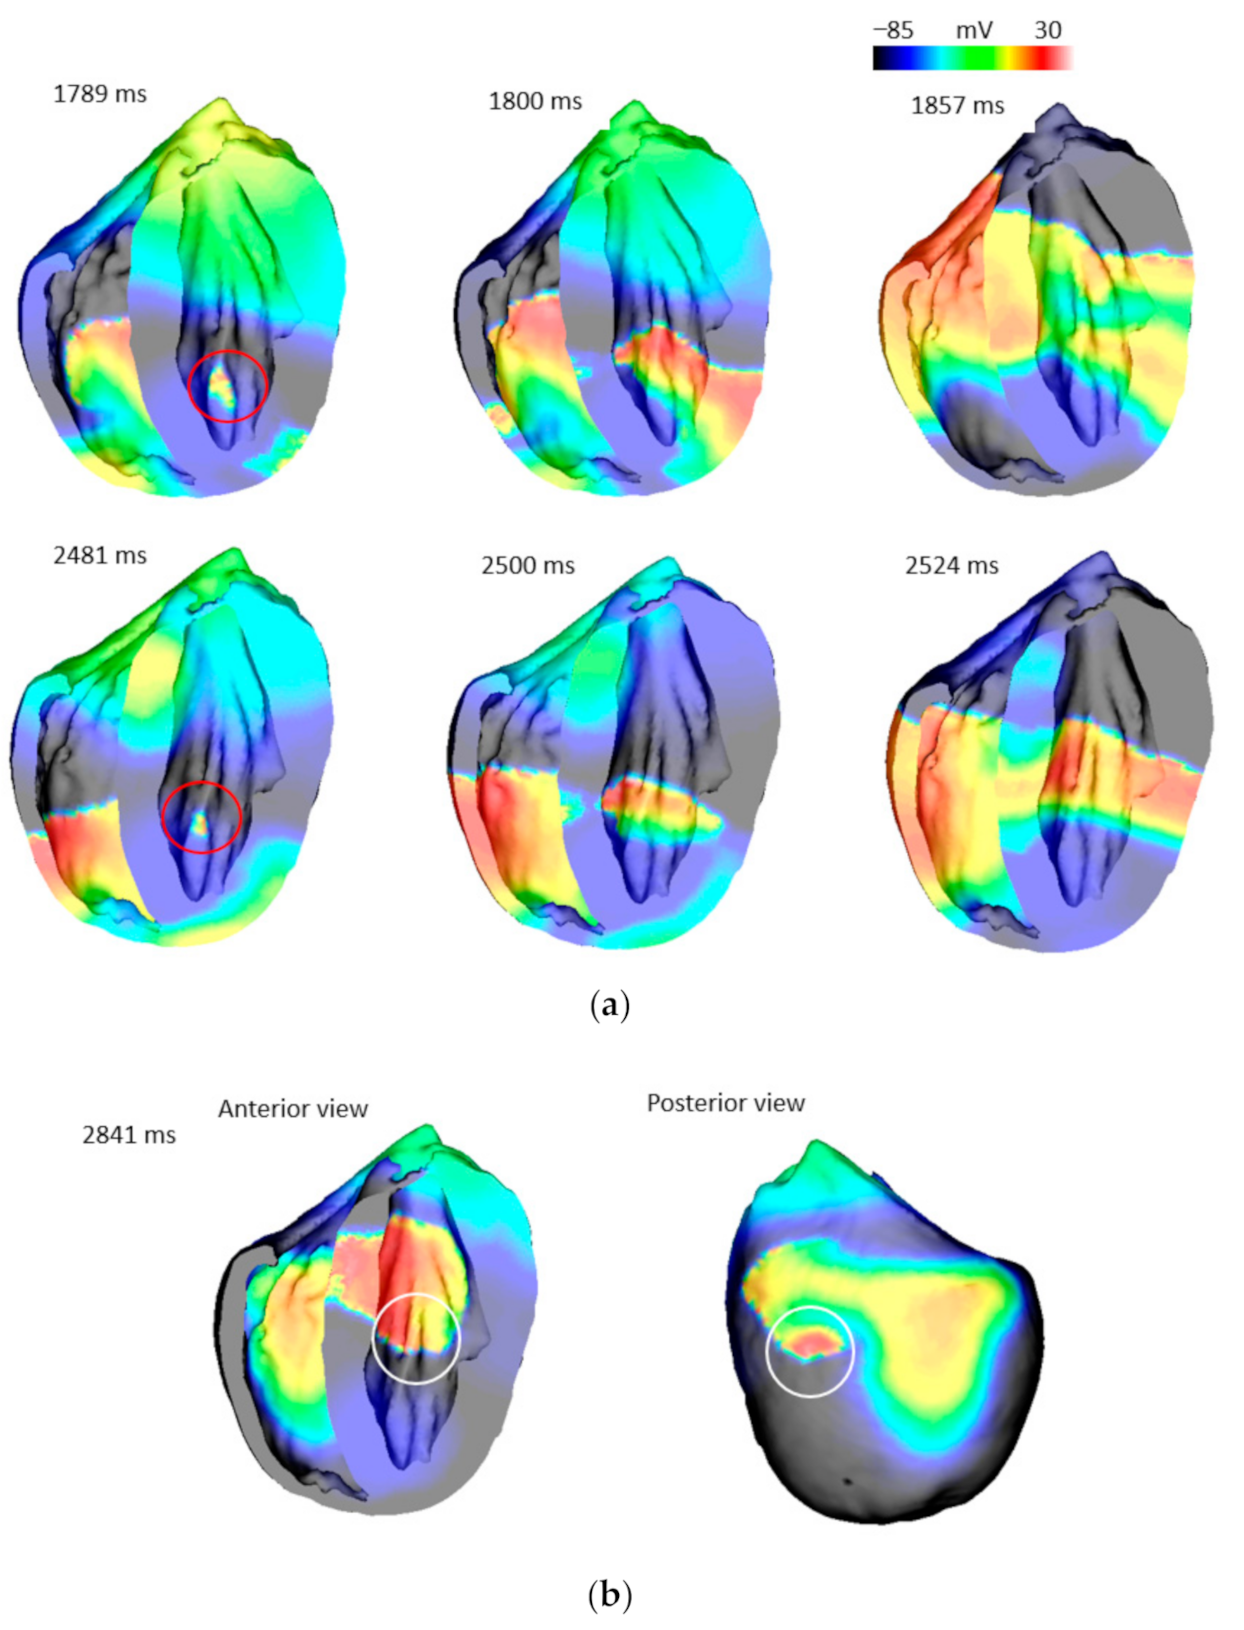
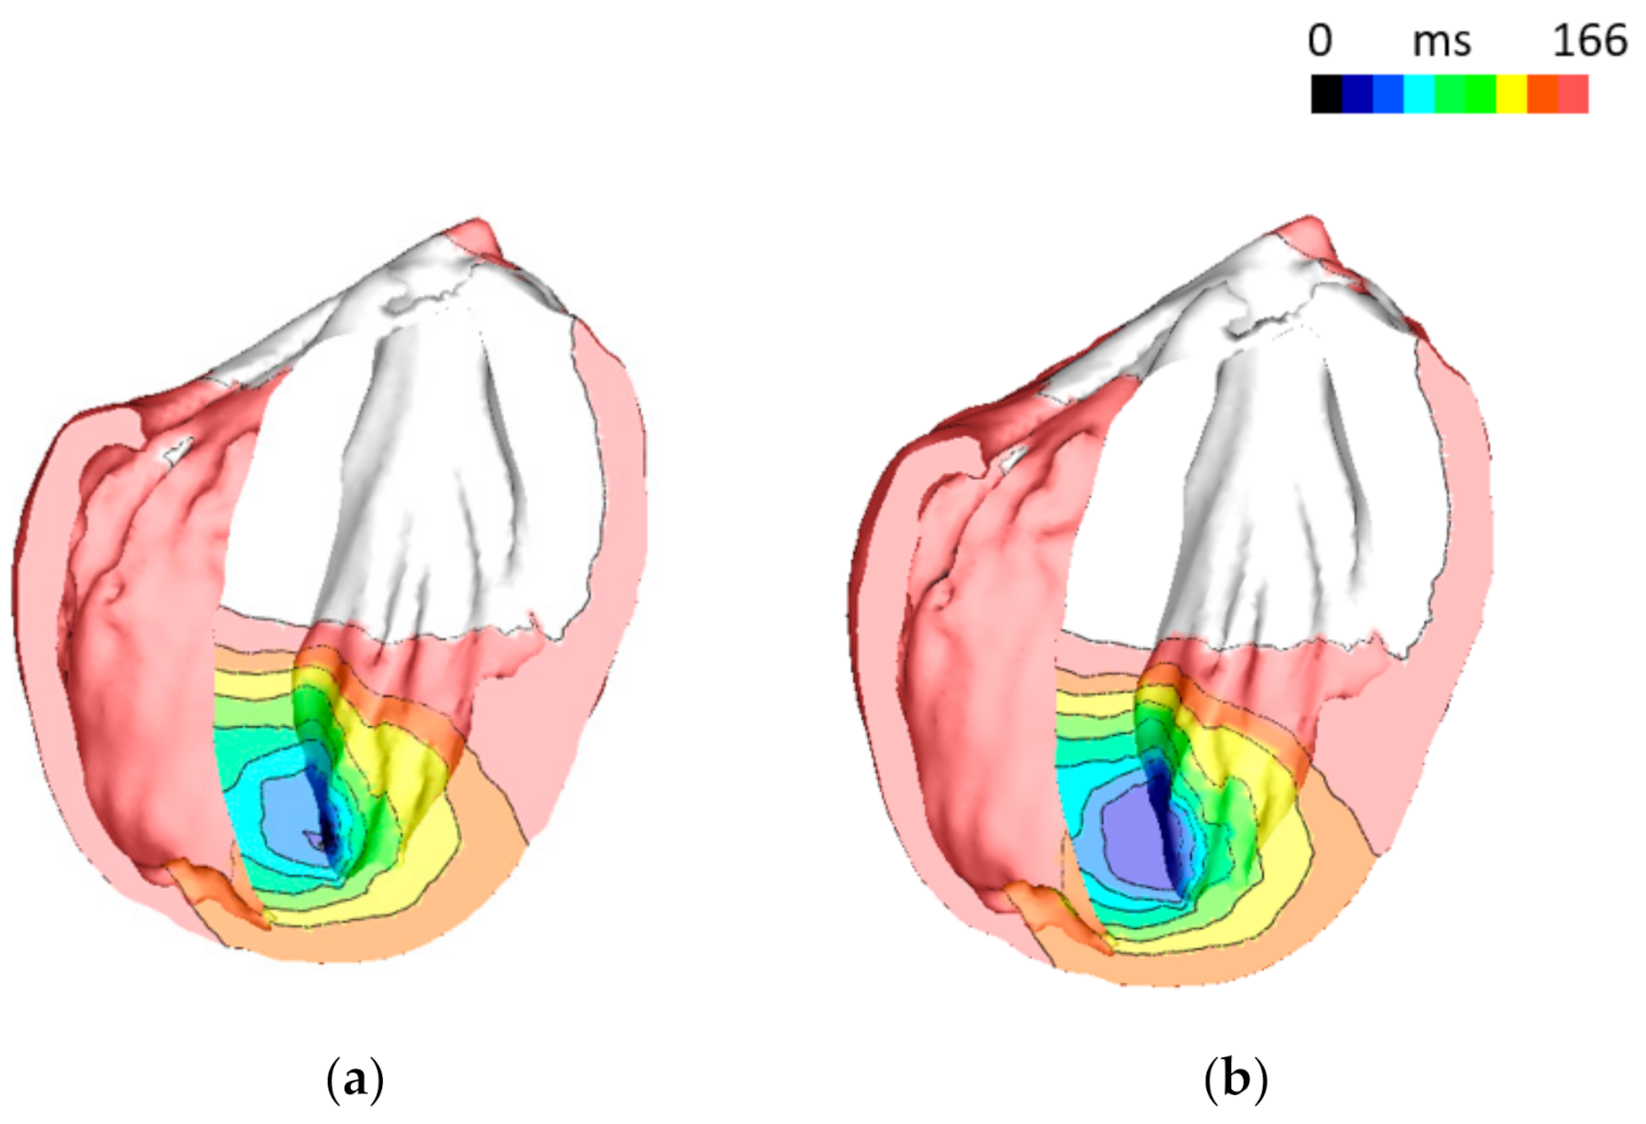
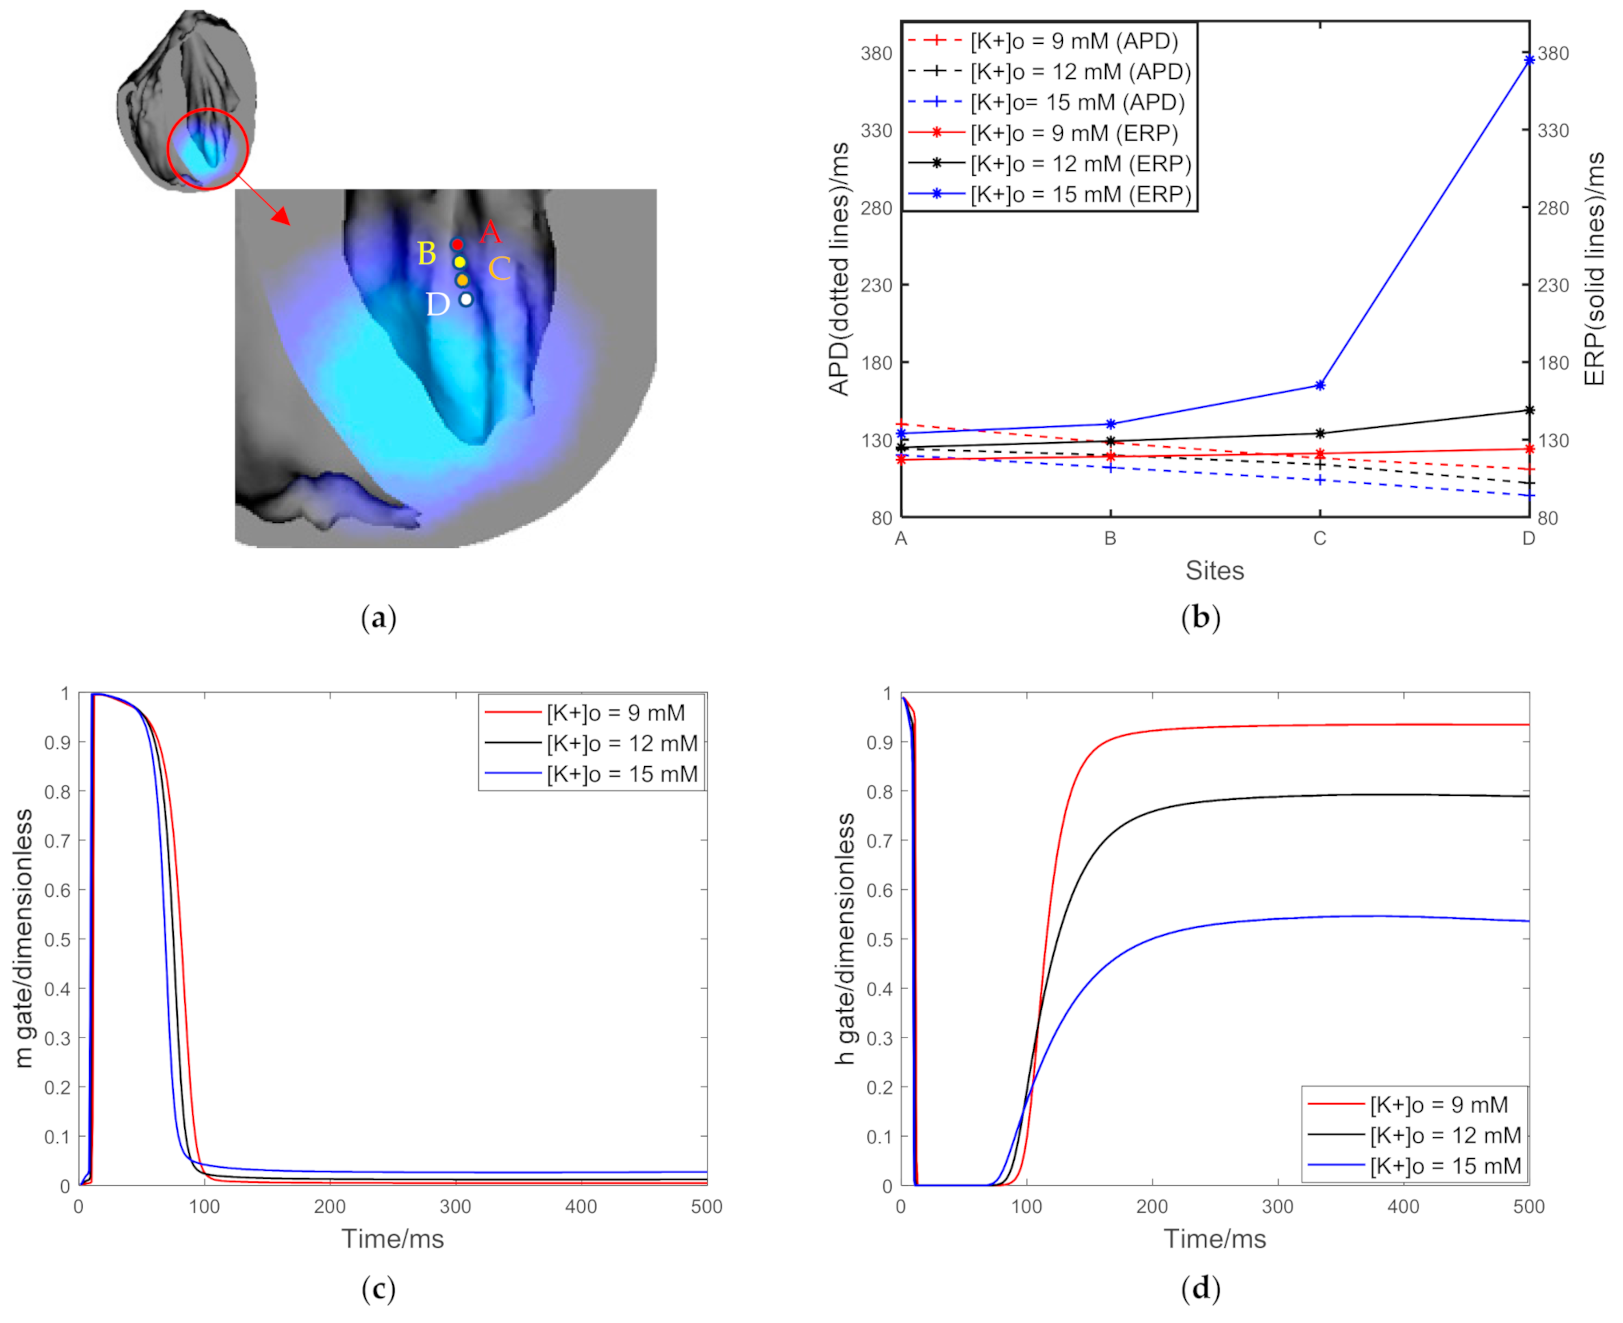
In this manuscript, single-cell simulations were conducted on epicardial cells, midmyocardial cells, endocardial cells and myocardial ischemic cells under different levels of extracellular potassium concentration. The correctness of the cell model was verified by comparing the parameters such as the duration of action potential (APD) and resting potential.
A detailed His-Purkinje system was integrated in the ventricular model and the virtual electrocardiograms of lead II under normal and myocardial ischemia were calculated respectively.
Stimulation was applied at the starting point of His-bundle to simulate the excitement of the atrium transmitted to the ventricle through His-bundle. The virtual electrocardiograms of lead II verified the accuracy of normal/myocardial ischemic ventricular electrophysiological model.
In order to evaluate the effect of extracellular potassium concentration on the vulnerability window (VW), three suprathreshold electrical stimulation S1 was applied at the apical part of the ventricular model of myocardial ischemia with different extracellular potassium concentration. The interval of stimulation is 600 ms to simulate normal ventricular rhythm. Then, premature stimulation S2 was applied to the lateral wall of left ventricle to induce ventricular tachycardia. The position where the stimuli were applied was shown in Figure 2a. The interval between the last S1 stimulation and premature stimulation S2 was the coupling interval (CI). Different coupling intervals determined whether ventricular tachycardia could be successfully induced. The time between the maximum and minimum coupling intervals that could induce ventricular tachycardia was defined as the vulnerability window (VW) [22].

3. Results

Figure 2b shows the action potentials (AP) of endocardial cells, epicardial cells and midmyocardial cells which were simulated in the steady-state conditions. The APD of midmyocardial cells was the longest, the APD of epicardial cells was slightly shorter than that of endocardial cells [23]. Figure 2b also shows the APs of ischemic cardiomyocytes in the ICZ at different values of extracellular potassium concentrations. The APD of ischemic cardiomyocytes was significantly shortened and the resting potential increased. When the extracellular potassium concentration was 9 mm, 12 mm and 15 mm, respectively, APD shortened 49%, 55% and 66% and resting potential increased 15%, 23% and 32%, respectively [24]. Figure 3a shows the location of the ischemic tissue and the ventricular resting potential. The light blue area was ICZ, the dark blue area was BZ and the dark gray area was NZ. The ischemic tissue showed a high resting potential, which was caused by the increase of extracellular potassium concentration.
Figure 3b shows the virtual electrocardiogram (ECG) results. The black curve and the red curve represented the lead II ECG under the normal ventricle and the ischemic ventricle, respectively. The red curve exhibited the ST depression and the T-wave elevation, which was consistent with the clinical ECG of subendocardial ischemia caused by distal occlusion of left anterior descending branch [25,26]. In addition, the red curve also showed a wide QRS-wave, which was consistent with the clinical ECG of hyperkalemia [27].
So as to determine the effect of extracellular potassium concentration on arrhythmia vulnerability, this manuscript studied the relationship between extracellular potassium concentration and the size of vulnerability window of reentry. As presented in Figure 4, extracellular potassium concentration was found to have a significant effect on the size of the vulnerability window. For [K+]o = 9 mM, the vulnerability window was found to be 7 ms, with CIs originating reentry between 187 and 194 ms and the reentrant activation maintained 1900 ms. With the increase of extracellular potassium concentration, the vulnerability window also increased. For [K+]o = 12 mM, the vulnerability window increased to a maximum of 12 ms (CIs between 181 and 193 ms). In this case, the reentry activity lasted for the longest time and ended spontaneously after 2100 ms. However, when the extracellular potassium concentration was further increased, the vulnerability window decreases. For [K+]o = 15 mM, the vulnerability window reduced to 6 ms (CIs between 191 ms and 197 ms) and the duration of reentrant activation was also reduced to 1100 ms. That is, in the range from 9 mM to 12 mM, the vulnerability window changed in the shape of a bell with the increase of extracellular potassium concentration, which was consistent with the results of animal experiments [20].
On the basis of the above work, this manuscript further analyzed the relationship between the mode of ventricular depolarization wave conduction and the location of the ischemic regions. After premature stimulation S2 was applied during the vulnerability window, the epicardium formed the macro-reentrant near the ischemic regions and the reentrant wavefront rotated around the ischemic regions. This phenomenon could be observed under three levels of extracellular potassium concentration. Figure 5 shows the propagation mode of epicardial reentrant wavefront, for the case of [K+]o = 9 mM and CI = 187 ms. The black arrow pointed to the propagation direction of the reentrant wavefront. As it can be observed in Figure 5, the reentrant wavefront rotated around the ischemic regions once during 1756–1791 ms and then continued to propagate in other direction. Another reentrant wavefront rotating around the ischemic regions was formed during 1971–2009 ms.
Unlike the epicardium, the reentrant activation of the endocardium was more broken and the transmural micro-reentrant was observed around the ischemic regions [28]. Figure 6 shows the propagation mode of endocardial reentrant wavefront, for the case of [K+]o = 12 mM and CI = 192 ms. The depolarization wavefront in the red circle was the observed transmural micro-reentrant. As illustrated in Figure 6, the transmural micro-reentrant appeared at 1789 ms and then returned to the surrounding normal regions. At the time of 2481 ms, the new transmural micro-reentrant reappeared in the BZ and then spread to the normal regions above. That was because the cardiomyocytes in the regions below were in the refractory period, which hindered the wavefront propagation. In addition, reentrant activation can also spread from the endocardium to the epicardium, as shown in Figure 6b. At the time of 2841 ms, endocardium and epicardium showed different reentrant activation distributions. In the white circle, the reentrant activation transmitted from endocardium through the ventricular wall to epicardium.

4. Discussion

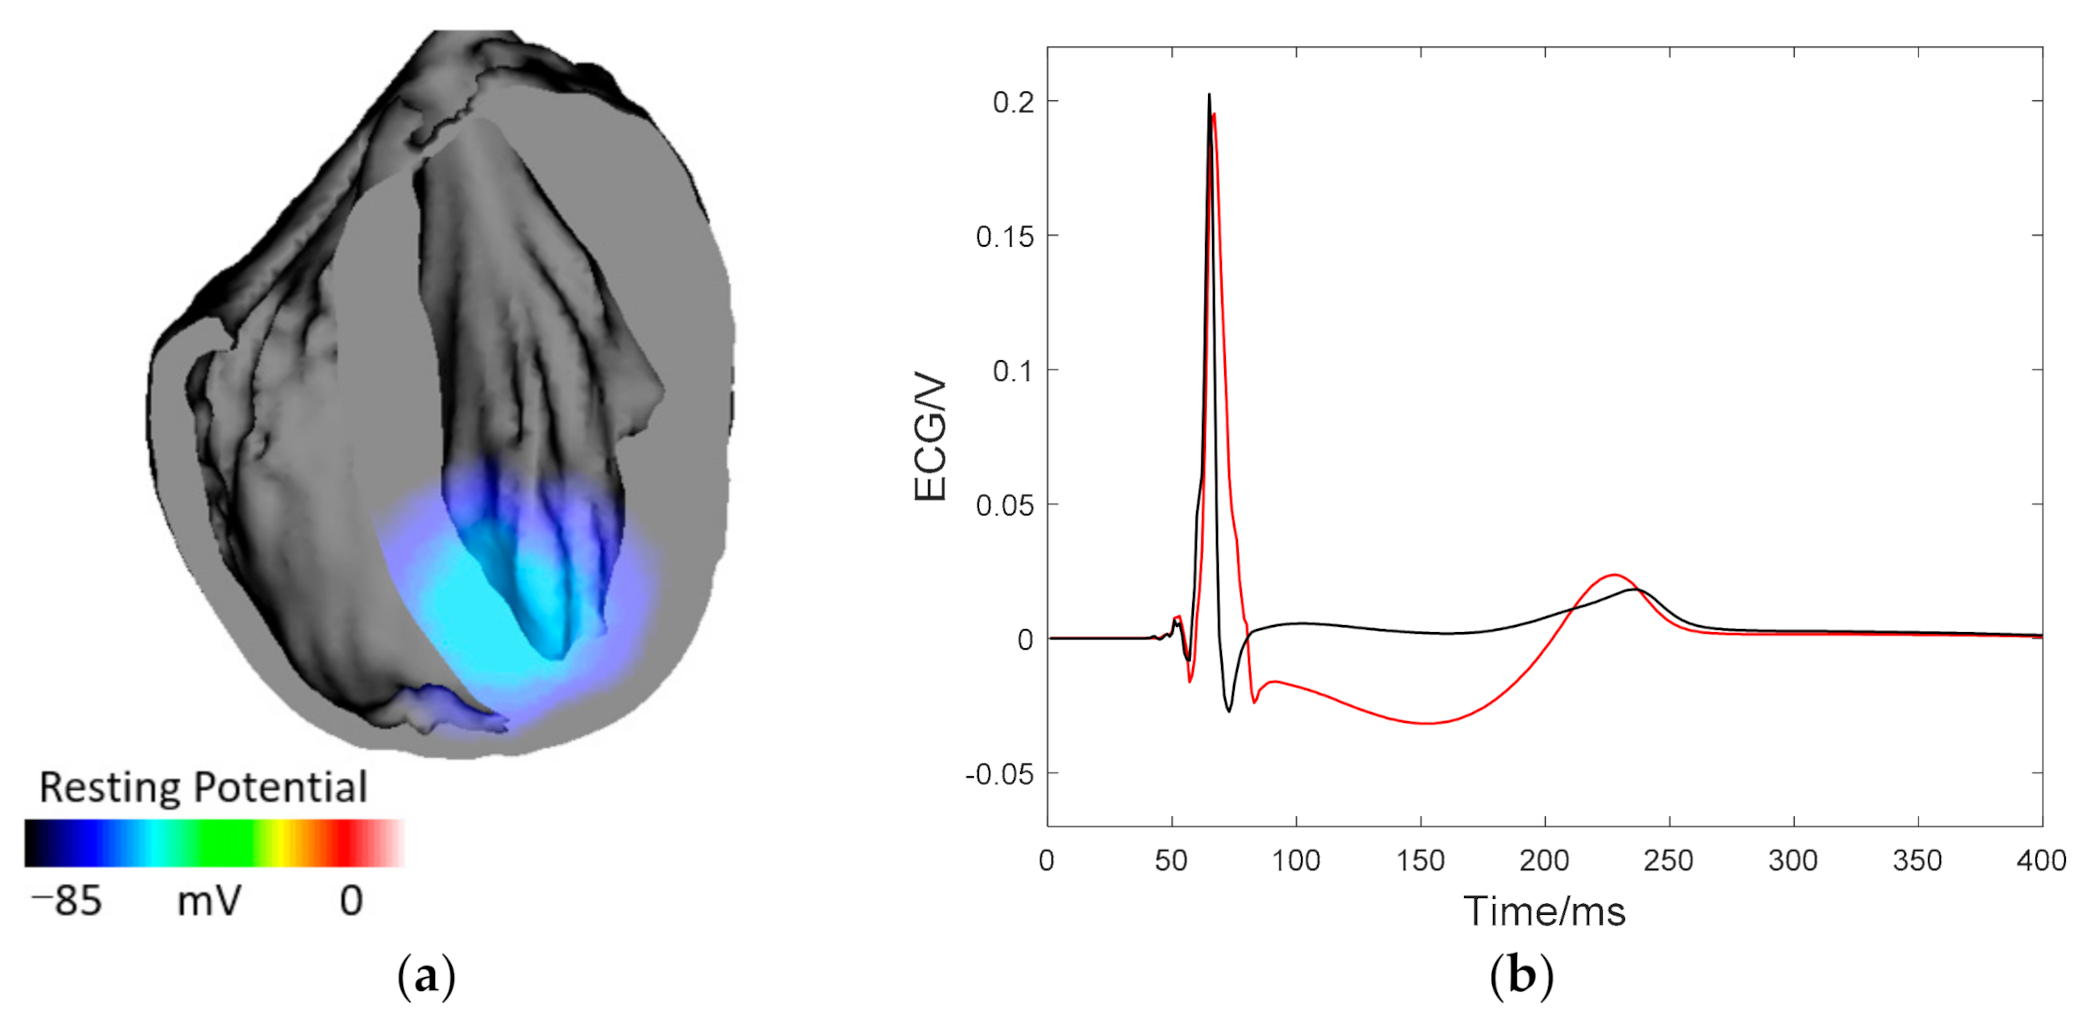
4.1. Verification of Electrophysiological Models of Cardiomyocytes and Ventricles

For this study, on the basis of constructing a rabbit ventricular model with transmural heterogeneity, a ventricular model of endocardial ischemia caused by left anterior descending branch occlusion was established. The effects of different extracellular potassium concentrations on arrhythmia vulnerability were studied by giving cardiomyocytes different extracellular potassium concentrations and inducing arrhythmias. By simulating the action potentials of various cardiomyocytes and calculating virtual electrocardiograms under normal and ischemic conditions, the correctness of cardiomyocyte models and ventricular models were verified. This manuscript performed sensitivity analyses of some important input parameters when the extracellular potassium concentration was 12 mM. When the conductivity was increased by 1.5 times, the vulnerable window was reduced by 1 ms and the sensitivity was 8.33%. When the time step was reduced to 45 ms, the size of the vulnerable window did not change.

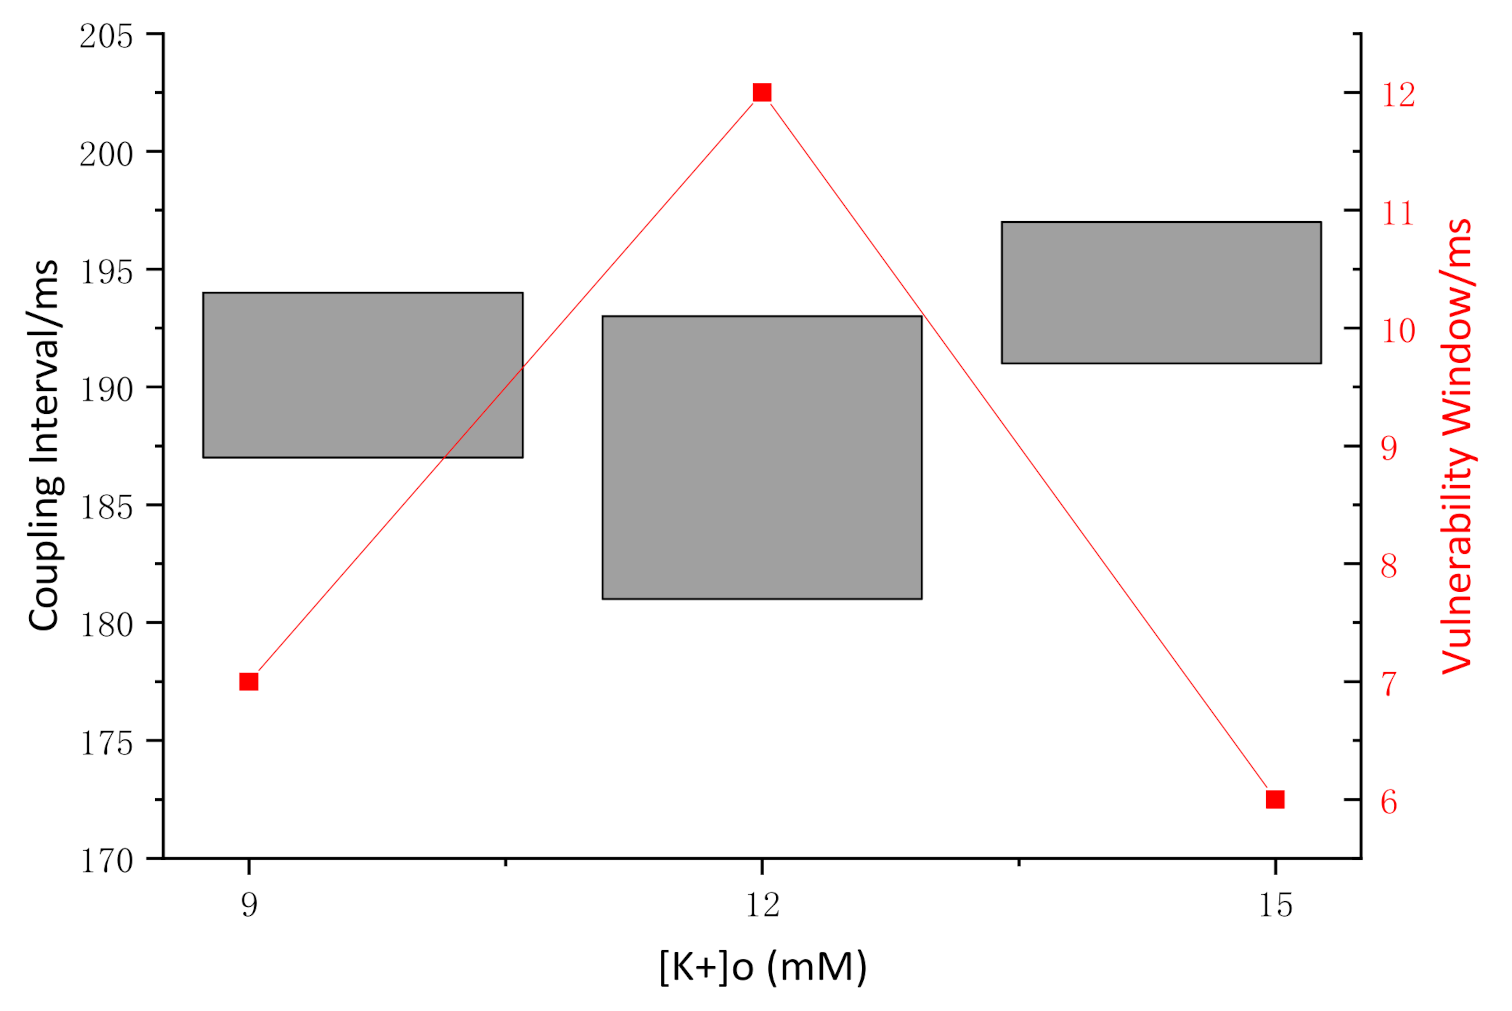
4.2. Effect of Extracellular Potassium Concentration on Arrhythmia Vulnerability

The simulation results suggested that the relationship between the vulnerability of ventricular arrhythmias and extracellular potassium concentration was bell shaped with a peak in susceptibility at 12 mM. When the extracellular potassium concentration increased from 9 mM to 12 mM, the vulnerability window increased significantly and the duration of reentrant activation also increased. This phenomenon was due to the increase of repolarization dispersion caused by the increase of extracellular potassium concentration, which was beneficial to the formation and maintenance of reentry. The dispersion of repolarization could be measured by the APD distribution [29]. Figure 7 shows the APD distribution at different extracellular potassium concentrations after the S1 stimulation. When the extracellular potassium concentration was increased to 12 mM, the isochron density of APD increased, that is, the dispersion of repolarization increased, resulting in an increase in the vulnerability of ventricular arrhythmias.
When the extracellular potassium concentration increased from 12 mM to 15 mM, both of the vulnerability window and the duration of reentrant activation decreased. The main reason was that with the further increase of extracellular potassium concentration, the effective refractory period of cardiomyocytes increased significantly, which hindered the propagation of reentrant wavefront. Extracellular potassium concentration is the most important influencing factor of the effective refractive period (ERP) in single cell kinetics [30]. As shown in Figure 8a, four points of ABCD were selected in different locations of the ICZ and BZ. This manuscript compared the action potential duration and the effective refractory period of the four points and further explored the mechanism of the change of the effective refractory period. Figure 8b illustrated the steady state values of action potential period and effective refractory period of ABCD at different extracellular potassium concentrations when the length of S1 stimulation cycle was 600 ms. With the increase of extracellular potassium concentration, the action potential duration of each point was shortened, while the effective refractory period was prolonged. For the case of [K+]o = 9 mM, the effective refractory period of point D was 149 ms. However, when [K+]o =15 mM, the effective refractory period of point D increased significantly, reaching 375 ms. The extension of the effective refractory period was due to the electrical remodeling of the ventricle, that is, abnormal activity of ion channels in cardiomyocytes led to electrical abnormalities. This manuscript studied the change of gated channels of INa which mainly affected the Phase 0 depolarization. The activation gates and the fast inactivation gates of INa under different extracellular potassium concentration were showed in Figure 8c,d, respectively. When the extracellular potassium concentration increases from 12 mM to 15 mM, the activation gate recovered earlier, while the inactivation gate recovered later and reached a lower steady state. The delayed recovery of the INa current led to prolonged refractory period. Prevention and elimination of abnormal activities of ion channels could be the target of clinical treatment.

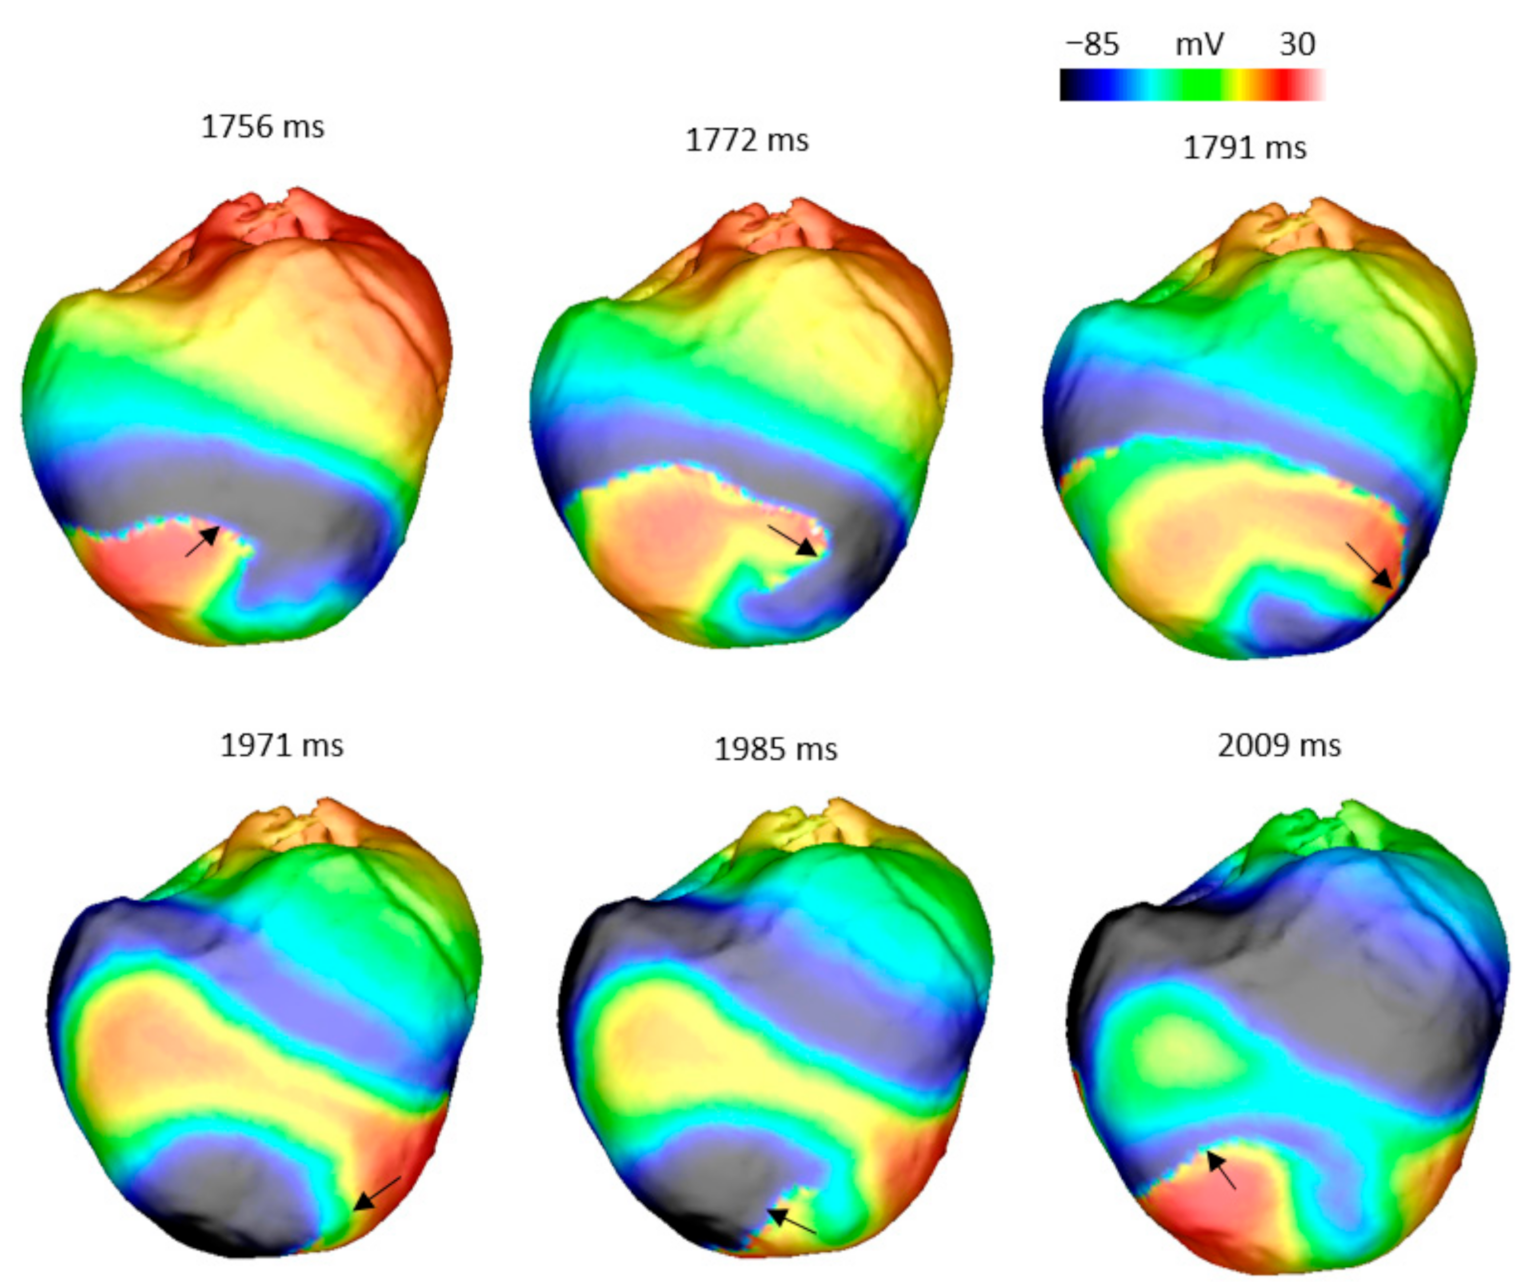
4.3. Ventricular Depolarization Wave Conduction under the Condition of Myocardial Ischemia

The reentrant activation of endocardium and epicardium showed a great difference under three levels of extracellular potassium concentration. The epicardial reentrant activation formed the macro-reentrant, which rotated around the ischemic regions. The endocardial reentrant activation was more broken and the micro-reentrant was observed in the BZ. The micro-reentrant was caused by heterogeneity between epicardium and ischemic cardiomyocytes. The conduction velocity of the ischemic cardiomyocytes in the BZ was slow, while the conduction velocity of the epicardial cardiomyocytes was normal. Therefore, when the reentrant wavefront reached the BZ, the epicardium was excited rapidly, while the endocardium formed a conduction block, which led to the conduction of the wavefront from the epicardium to the endocardium and then the micro-reentrant was formed. The reentrant wavefront can also be transmitted from the endocardium to the epicardium. The heterogeneity between ischemic cardiomyocytes and epicardium provided a new transmission pathway for reentrant activation, resulting in more chaotic transmission, which was conducive to the maintenance of arrhythmias.

5. Conclusions

This study shows that myocardial ischemia had an important effect on the occurrence of arrhythmia. With the gradual increase of extracellular potassium concentration caused by myocardial ischemia, the vulnerability of arrhythmia was bell-shaped and arrhythmia was most likely to occur when the extracellular potassium concentration was 12 mM. That was because the extracellular potassium concentration affected the dispersion of repolarization and the effective refractory period of cardiomyocytes. In addition, in the case of non-transmural ischemia, the micro- reentrant of endocardium and the macro-reentrant rotating around the ischemic regions of epicardium were also observed in this manuscript. It provided a new idea for the determination of clinical ablation targets [31].

6. Limitations

There are still some limitations in this study: first, of all, the ischemic regions are generally not a regular pattern in clinic. The influence of the complex boundary shape of the ischemic regions was not considered in this manuscript. Secondly, under the condition of myocardial ischemia, the His-Purkinje system also had a certain influence on the generation and maintenance of arrhythmias, which was not considered in this manuscript. Thirdly, the ventricle was simulated as a rigid body without considering the mechanical activity of the heart. Finally, excessive activation of the sympathetic nerve leads to abnormal excitability, automaticity and conductivity of cardiomyocytes, thus, increasing the vulnerability of arrhythmias. Due to the limited simulation conditions, this study did not consider the influence of the nervous system. In a subsequent study, we will further improve these aspects.

Author Contributions

Conceptualization, Z.G., L.J. and H.Z.; methodology, Z.G.; software, Z.G. and L.J.; validation, Z.G. and X.W.; investigation, J.W.; resources, Z.G.; writing—original draft preparation, Z.G.; writing—review and editing, Z.G.; visualization, Z.G.; project administration, X.W.; funding acquisition, X.W. All authors have read and agreed to the published version of the manuscript.

Funding

Conceptualization This research was funded by the Shanghai Municipal Science and Economic and Informatization Commission Project, grant No. GYQJ-2018-2-05, National Natural Science Foundation of China, grant Nos. 1171009 and 61801123, the China Postdoctoral Science Foundation, grant No. 2019M651367, the Shanghai Municipal Science and Technology Major Project, grant Nos. 2017SHZDZX01 and 16441907900.

Institutional Review Board Statement

Not applicable.

Informed Consent Statement

Not applicable.

Data Availability Statement

Data sharing not applicable.

Conflicts of Interest

The authors declare no conflict of interest.

References

  1. Roger, V.L.; Berry, J.D. Heart disease and stroke statistics—2012 update: A report from the American Heart Association. Circulation 2012, 125, 97–188. [Google Scholar] [CrossRef]
  2. Kharche, S.R.; Desai, K.; Mcintyre, C.W. Elucidating the relationship between arrhythmia and ischemic heterogeneity: An in silico study. In Proceedings of the 2020 42nd Annual International Conference of the IEEE Engineering in Medicine and Biology Society (EMBC), Montreal, QC, Canada, 20–24 July 2020. [Google Scholar] [CrossRef]
  3. Sasaki, T.; Shimazawa, M.; Kanamori, H.; Yamada, Y.; Nishinaka, A.; Kuse, Y.; Suzuki, G.; Masuda, T.; Nakamura, S.; Hosokawa, M.; et al. Effects of progranulin on the pathological conditions in experimental myocardial infarction model. Sci. Rep. 2020, 10, 11842. [Google Scholar] [CrossRef]
  4. Janse, M.J.; Kleber, A.G. Electrophysiological changes and ventricular arrhythmias in the early phase of regional myocardial ischemia. Circ. Res. 1981, 49, 1069–1081. [Google Scholar] [CrossRef] [Green Version]
  5. Wagoner, D.R.; Lamorgese, M. Ischemia Potentiates the Mechanosensitive Modulation of Atrial ATP-Sensitive Potassium Channels. Ann. N. Y. Acad. Sci. 2010, 723, 392–395. [Google Scholar] [CrossRef]
  6. Bozkurt, S. Computational Simulation of Cardiac Function and Blood Flow in the Circulatory System under Continuous Flow Left Ventricular Assist Device Support during Atrial Fibrillation. Appl. Sci. 2020, 10, 876. [Google Scholar] [CrossRef] [Green Version]
  7. Loewe, A.; Wülfers, E.M.; Seemann, G. Cardiac ischemia-insights from computational models. Herzschrittmacherther. Elektrophysiol. 2018, 29, 48–56. [Google Scholar] [CrossRef] [PubMed]
  8. Tice, B.M.; Rodríguez, B.; Eason, J.; Trayanova, N. Mechanistic investigation into the arrhythmogenic role of transmural heterogeneities in regional ischaemia phase 1A. Europace 2007, 12, 46–58. [Google Scholar] [CrossRef]
  9. Rodriguez, B.; Tice, B.M.; Eason, J.C.; Aguel, F.; Trayanova, N. Cardiac vulnerability to electric shocks during phase 1A of acute global ischemia. Heart Rhythm Off. J. Heart Rhythm Soc. 2004, 1, 695–703. [Google Scholar] [CrossRef] [PubMed]
  10. McDowell, K.S.; Arevalo, H.J.; Maleckar, M.M.; Trayanova, N.A. Susceptibility to Arrhythmia in the Infarcted Heart Depends on Myofibroblast Density. Biophys. J. 2011, 101, 1307–1315. [Google Scholar] [CrossRef] [Green Version]
  11. Deng, D.; Arevalo, H.J.; Prakosa, A.; Callans, D.J.; Trayanova, N.A. A feasibility study of arrhythmia risk prediction in patients with myocardial infarction and preserved ejection fraction. Europace 2016, 18, 60–66. [Google Scholar] [CrossRef]
  12. Fallahi, A.; Khorram, H.G.; Kokabi, A. Electrocardiogram signal generation using electrical model of cardiac cell: Application in cardiac ischemia. J. Med. Eng. Technol. 2019, 43, 207–216. [Google Scholar] [CrossRef]
  13. Bishop, M.J.; Plank, G.; Burton, R.A.B.; Schneider, J.E.; Gavaghan, D.J.; Grau, V.; Kohl, P. Development of an anatomically detailed MRI-derived rabbit ventricular model and assessment of its impact on simulations of electrophysiological function. Am. J. Physiol. Heart Circ. Physiol. 2010, 298, H699–H718. [Google Scholar] [CrossRef] [Green Version]
  14. Jin, L.; Wang, J.; Song, B.; Wu, X.; Fang, Z. Low-energy defibrillation with multi-electrodes stimulation: A simulation study. In Proceedings of the 2015 37th Annual International Conference of the IEEE Engineering in Medicine and Biology Society (EMBC), Milan, Italy, 25–29 August 2015. [Google Scholar] [CrossRef]
  15. Clerc, L. Directional differences of impulse spread in trabecular muscle from mammalian heart. J. Physiol. 1976, 255, 335–346. [Google Scholar] [CrossRef]
  16. Zhu, H.; Jin, L.; Huang, Y.; Wu, X. A Computer Simulation Research of Two Types of Cardiac Physiological Pacing. Appl. Sci. 2021, 11, 449. [Google Scholar] [CrossRef]
  17. Mahajan, A.; Shiferaw, Y.; Sato, D.; Baher, A.; Olcese, R.; Xie, L.-H.; Yang, M.-J.; Chen, P.-S.; Restrepo, J.G.; Karma, A.; et al. A Rabbit Ventricular Action Potential Model Replicating Cardiac Dynamics at Rapid Heart Rates. Biophys. J. 2008, 94, 392–410. [Google Scholar] [CrossRef] [Green Version]
  18. Song, B.; Jin, L.; Wang, J.; Qian, L.; Wu, X. Effects of Electrophysiological Heterogeneity on Vulnerability to Re-Entry in Human Ventricular Tissue: A Simulation Study. In Proceedings of the 2017 39th Annual International Conference of the IEEE Engineering in Medicine and Biology Society (EMBC), Jeju, Korea, 11–15 July 2017; pp. 1274–1277. [Google Scholar] [CrossRef]
  19. Colonna, P.; Cadeddu, C.; Montisci, R.; Chen, L.; Meloni, L.; Iliceto, S. Transmural heterogeneity of myocardial contraction and ischemia. Diagnosis and clinical implications. Ital. Heart J. Off. J. Ital. Fed. Cardiol. 2000, 1, 174–183. [Google Scholar]
  20. Curtis, M.J. The rabbit dual coronary perfusion model: A new method for assessing the pathological relevance of individual products of the ischaemic milieu: Role of potassium in arrhythmogenesis. Cardiovasc. Res. 1991, 25, 1010–1022. [Google Scholar] [CrossRef]
  21. Romero, L.; Trénor, B.; Alonso, J.M.; Tobón, C.; Saiz, J.; Ferrero, J.M., Jr. The Relative Role of Refractoriness and Source-Sink Relationship in Reentry Generation during Simulated Acute Ischemia. Ann. Biomed. Eng. 2009, 37, 1560–1571. [Google Scholar] [CrossRef]
  22. Dutta, S.; Mincholé, A.; Zacur, E.; Quinn, T.A.; Taggart, P.; Rodríguez, B. Early afterdepolarizations promote transmural reentry in ischemic human ventricles with reduced repolarization reserve. Prog. Biophys. Mol. Biol. 2016, 120, 236–248. [Google Scholar] [CrossRef] [Green Version]
  23. Glukhov, A.V.; Fedorov, V.V.; Lou, Q.; Ravikumar, V.K.; Kalish, P.W.; Schuessler, R.B.; Moazami, N.; Efimov, I.R. Transmural dispersion of repolarization in failing and nonfailing human ventricle. Circ. Res. 2010, 106, 981–991. [Google Scholar] [CrossRef] [Green Version]
  24. Wilhelms, M.; Seemann, G. Comparing Simulated Electrocardiograms of Different Stages of Acute Cardiac Ischemia. In Functional Imaging and Modeling of the Heart; Springer: Berlin/Heidelberg, Germany, 2011. [Google Scholar]
  25. Li, S.; Li, Z.; Sheng, J.; Li, S.; Liu, R. Lecture Series 7 on Electrocardiography-Myocardial Ischemia, Injury and Infarction. Chin. Gen. Pract. 2014, 17, 846–848. [Google Scholar]
  26. Bertella, M.; Nanna, M.; Vanoli, E.; Scalise, F. Assessing the pattern of ST-segment depression during subendocardial ischemia using a computer simulation of the ventricular electrogram. J. Electrocardiol. 2009, 42, 12–18. [Google Scholar] [CrossRef]
  27. Rivera-Juárez, A.; Hernández-Romero, I.; Puertas, C.; Zhang-Wang, S.; Sánchez-Álamo, B.; Martins, R.; Figuera, C.; Guillem, M.S.; Climent, A.M.; Fernández-Avilés, F.; et al. Clinical Characteristics and Electrophysiological Mechanisms Underlying Brugada ECG in Patients With Severe Hyperkalemia. J. Am. Heart Assoc. 2019, 8, e010115. [Google Scholar] [CrossRef] [Green Version]
  28. Janse, M.J.; Van Capelle, F.J.; Morsink, H.; Kléber, A.G.; Wilmsschopman, F.J.G.; Cardinal, R.; D’Alnoncourt, C.N.; Durrer, D. Flow of “injury” current and patterns of excitation during early ventricular arrhythmias in acute regional myocardial ischemia in isolated porcine and canine hearts. Evidence for two different arrhythmogenic mechanisms. Circ. Res. 1980, 47, 151–165. [Google Scholar] [CrossRef] [Green Version]
  29. Gillis, A.M.; Mathison, H.J.; Kulisz, E.; Lester, W.M. Dispersion of Ventricular Repolarization in Left Ventricular Hypertrophy: Influence of Afterload and Dofetilide. J. Cardiovasc. Electrophysiol. 2010, 9, 988–997. [Google Scholar] [CrossRef]
  30. Ferrero, J.M., Jr.; Saiz, J.; Ferrero, J.M.; Thakor, N.V. Simulation of action potentials from metabolically impaired cardiac myocytes: Role of ATP-sensitive K+ current. Circ. Res. 1996, 79, 208–221. [Google Scholar] [CrossRef]
  31. Ghannam, M.; Yokokawa, M.; Liang, J.J.; Cochet, H.; Jais, P.; Dabagh, G.S.; Latchamsetty, R.; Jongnarangsin, K.; Morady, F.; Bogun, F. Clinical Significance of Myocardial Scar in Patients with Frequent Premature Ventricular Complexes Undergoing Catheter Ablation. Heart Rhythm 2020, 18, 20–26. [Google Scholar] [CrossRef]
Figure 1. Schematic representation of the pipeline to build the whole ventricular electrophysiological model of myocardial ischemia caused by distal occlusion of left anterior descending branch.
Applsci 11 02189 g001
Figure 2. (a) The position where S1 and S2 stimulation are applied; (b). Simulated action potentials under steady state for the endocardium cells, epicardium cells, midmyocardium cells and ischemic cardiomyocytes in the ICZ at three extracellular potassium concentrations.
Applsci 11 02189 g002
Figure 3. (a) The location of the ischemic tissue and the ventricular resting potential; (b) Virtual electrocardiogram of normal ventricle (black) and virtual electrocardiogram of endocardial ischemia ventricle caused by left anterior descending branch occlusion (red).
Applsci 11 02189 g003
Figure 4. Coupling interval and vulnerability window size that could cause arrhythmia under different extracellular potassium concentration.
Applsci 11 02189 g004
Figure 5. Macro-reentrant pattern of propagation in the ischemic ventricles around the ischemic regions ([K+]o = 9 mM and CI = 187 ms).
Applsci 11 02189 g005
Figure 6. (a) The mode of the endocardial transmural micro-reentrant (inside the red circle) propagation; (b) Reentrant activation transmitted from endocardium to epicardium (inside the white circle).
Applsci 11 02189 g006
Figure 7. The APD distribution at different extracellular potassium concentrations after S1 stimulation. The extracellular potassium concentrations of were (a) 9 mM and (b) 12 mM, respectively.
Applsci 11 02189 g007
Figure 8. (a) The measurement sites of effective refractory period and action potential duration; (b) Effective refractory period and action potential duration of ABCD at different extracellular potassium concentrations; (c) Activation gates (m gate) of INa of D under different extracellular potassium concentration; (d) Fast inactivation gates (h gate) of INa of D under different extracellular potassium concentration (0 time is the time when the action potential occurs).
Applsci 11 02189 g008
Table 1. The main input parameters of the whole ventricular electrophysiological model.
Main Input ParametersValuesUnits
Intracellular conductivity (along the fibers)0.0522S/m
Intracellular conductivity (transverse to the fibers)0.0057S/m
Intracellular conductivity (in sheet normal direction)0.0057S/m
Extracellular conductivity (along the fibers)0.186S/m
Extracellular conductivity (transverse to the fibers)0.072S/m
Extracellular conductivity (in sheet normal direction)0.072S/m
Time step50ms
Cell membrane surface area to volume ratio14001/cm
Cell membrane capacitance per unit area1μF/cm2
Publisher’s Note: MDPI stays neutral with regard to jurisdictional claims in published maps and institutional affiliations.

