Article

Fluoride Ion Release Characteristics of Fluoride-Containing Varnishes—An In Vitro Study

by
Sachin Chhatwani
1,*,
Jennifer Hoppe
2,
Ella A. Naumova
3,
Wolfgang H. Arnold
3,
Stephan C. Möhlhenrich
1,
Mozhgan Bizhang
4 and
Gholamreza Danesh
1
1
Department of Orthodontics, School of Dentistry, Faculty of Health, Witten/Herdecke University, 58455 Witten, Germany
2
Department of Orthodontics and Dentofacial Orthopedics, Friedrich-Schiller-University Jena, 07743 Jena, Germany
3
Department of Biological and Material Sciences in Dentistry, School of Dentistry, Faculty of Health, Witten/Herdecke University, 58455 Witten, Germany
4
Department of Operative and Preventive Dentistry, School of Dentistry, Faculty of Health, Witten/Herdecke University, 58455 Witten, Germany
*
Author to whom correspondence should be addressed.
Appl. Sci. 2021, 11(4), 1452; https://doi.org/10.3390/app11041452
Submission received: 24 December 2020 / Revised: 30 January 2021 / Accepted: 1 February 2021 / Published: 5 February 2021
(This article belongs to the Section Applied Dentistry and Oral Sciences)

Abstract

:
Despite the latest advances in orthodontic treatment, white spot lesions remain a common side effect of fixed appliance therapy. An effective treatment for the prevention of white spot lesions is the use of fluoride-containing products. The aim of the present in vitro study was to check the durability of the tested products for their fluoride release into the surrounding solution. Three varnishes (Protecto CaF2 Nano one-step seal, Bifluorid 12 single dose, and Fluor Protector S) were applied to hydroxyapatite discs and kept in diluted Total Ionic Strength Adjustment Buffer III (TISAB III) solution for fluoride ion release measurement. A group of clear hydroxyapatite discs served as the control group. The carrier discs (N = 40) underwent three thermal cycling runs for 20 days. Before the first run and after each run, the fluoride ion concentration in the solution was measured at appointed times (T) T0, T1, T2, and T3. Fluoride ion release was highest at T1 for all products (median values for Protecto CaF2 Nano one-step seal: 0.09 ppm, Bifluorid 12 single dose: 37.67 ppm, and Fluor Protector S: 3.36 ppm) except for the control group, showing its peak at T0 (0.04 ppm). There was a significant difference between the tested fluoride varnishes at all measurement times. Bifluorid 12 achieved significantly higher fluoride release values than the other products (p < 0.05 at all measurement times). A solitary product application of only once or twice per year, as stated by the manufacturers, cannot be supported.

1. Introduction

Despite the latest advances in orthodontic treatment, white spot lesions—described as demineralized areas of dental enamel with high subsurface porosity and increased risk of caries—remain common side effects of fixed appliance therapy [1,2,3].
It has been found that the duration of orthodontic treatment has a significant impact on the development of white spot lesions [4]. The incidence of white spot lesions during fixed appliance therapy has been described as 45.8% and the prevalence as 68.4% [5]. In comparison, the incidence of white spot lesions in non-orthodontically treated patients is 25% [6]. The significantly higher incidence of demineralization in orthodontically treated patients demonstrates the need for adjuvant treatment against white spot lesions during fixed appliance therapy. An effective treatment for the prevention of white spot lesions is the use of fluoride-containing products [7].
In particular, toothpastes, mouthwashes, gels, varnishes, and fluoridated elastics may be used as carriers of fluoride [2].
In addition to the daily low-dose application of fluoride in the form of toothpastes and mouthwashes, the use of high-dose fluoride products on the tooth in proximity to orthodontic brackets is another treatment option. To avoid the need for patient compliance, a noncompliant approach could be advantageous. Given that the average orthodontic treatment time is around 28.6 months [8], this time should be seen as the benchmark for the durability of fluoride products.
Investigations of fluoride release kinetics have shown that fluoride ions are released by an initial surface elution followed by a continuous diffusion of fluoride ions from the tested dental material [9]. These kinetics and the bioavailability of fluoride are influenced by the composition and buffer capacity of the fluoride-containing product; the pH value of saliva and its content of antimicrobial substances, calcium, fluoride, and inorganic phosphate; and the temperature [10,11,12].
Many manufacturers promise long-term fluoride release and effective caries protection throughout the period of orthodontic therapy when using their dental care products. According to the manufacturers, Bifluorid12 (VOCO GmbH, Mannheim, Germany) applied twice a year and Protecto CaF2 nano one-step seal (Bonadent GmbH, Frankfurt am Main, Germany) applied once a year should be effective against acid attacks.
In contrast, data from in vitro and in vivo studies suggest a reapplication of fluoride-releasing products every 3 to 3.5 months to prevent the advent of white spot lesions during orthodontic treatment [13,14].
The aim of the present in vitro study was to evaluate the fluoride release characteristics of the three tested fluoride-containing varnishes by investigating the fluoride concentration dynamics in the surrounding solution for a period of 60 days.

2. Materials and Methods

2.1. Test Materials

Three fluoride-containing varnishes were investigated on fluoride-free hydroxyapatite carrier discs (Himed Inc., Old Bethpage, NY, USA). Uncoated fluoride-free hydroxyapatite discs (Himed Inc., Old Bethpage, NY, USA) served as a control group (Table 1).

2.2. Test Specimen Preparation

For test standardization, fluoride-free hydroxyapatite discs (Himed Inc., Old Bethpage, NY, USA) with the same porosity were used for all three tested materials as carriers to exclude fluoride release from the carrier material. The carrier discs had diameters of 5 mm and thicknesses of 2 mm.
The products to be examined were applied to the carrier discs according to the manufacturer’s instructions.
To avoid mechanical irritation of the side with the applied product, one side of the discs was marked with a pencil.

2.3. Fluoride Concentration Measurements

The fluoride release was determined using a fluoride ion electrode (Orion 9609BNWP, Thermo Fisher Scientific Inc., Chelmsford, MA, USA). In order to obtain reliable measurements for specimens with fluctuating ionic strength, a relative ionic strength should be set before the measurement. For this purpose, a special buffer solution, TISAB III (Total Ionic Strength Adjustment Buffer III Standardized, Thomas Scientific, Swedesboro, NJ, USA), was used as a total ionic strength adjustment buffer. TISAB III (5 mL) was diluted with 45 mL of bi-distilled water. This ensured a low pH value (5–5.5) with constant ionic strength and prevented the ions in the reagents from complexing and simulating a higher fluoride concentration. The measured fluoride value is given in parts per million. To calibrate the electrode, a two-point calibration was performed using standard solutions of sodium fluoride (2000 ppm) and diluted TISAB III solutions containing 0.4, 4, and 40 ppm. For two-point calibration, two standard solutions of the described series were chosen comprising the expected value, which was assessed by preliminary tests. The fluoride electrode was immersed in the respective standard solution and the value of the fluoride ion concentration was measured. If the measured values differed from the values of the standard solutions by more than 5%, the calibration had to be carried out again. The required slope of the fluoride electrode was given when the difference between the two measurements was between 54 and 60 mV. After calibration, the fluoride measurement was performed.

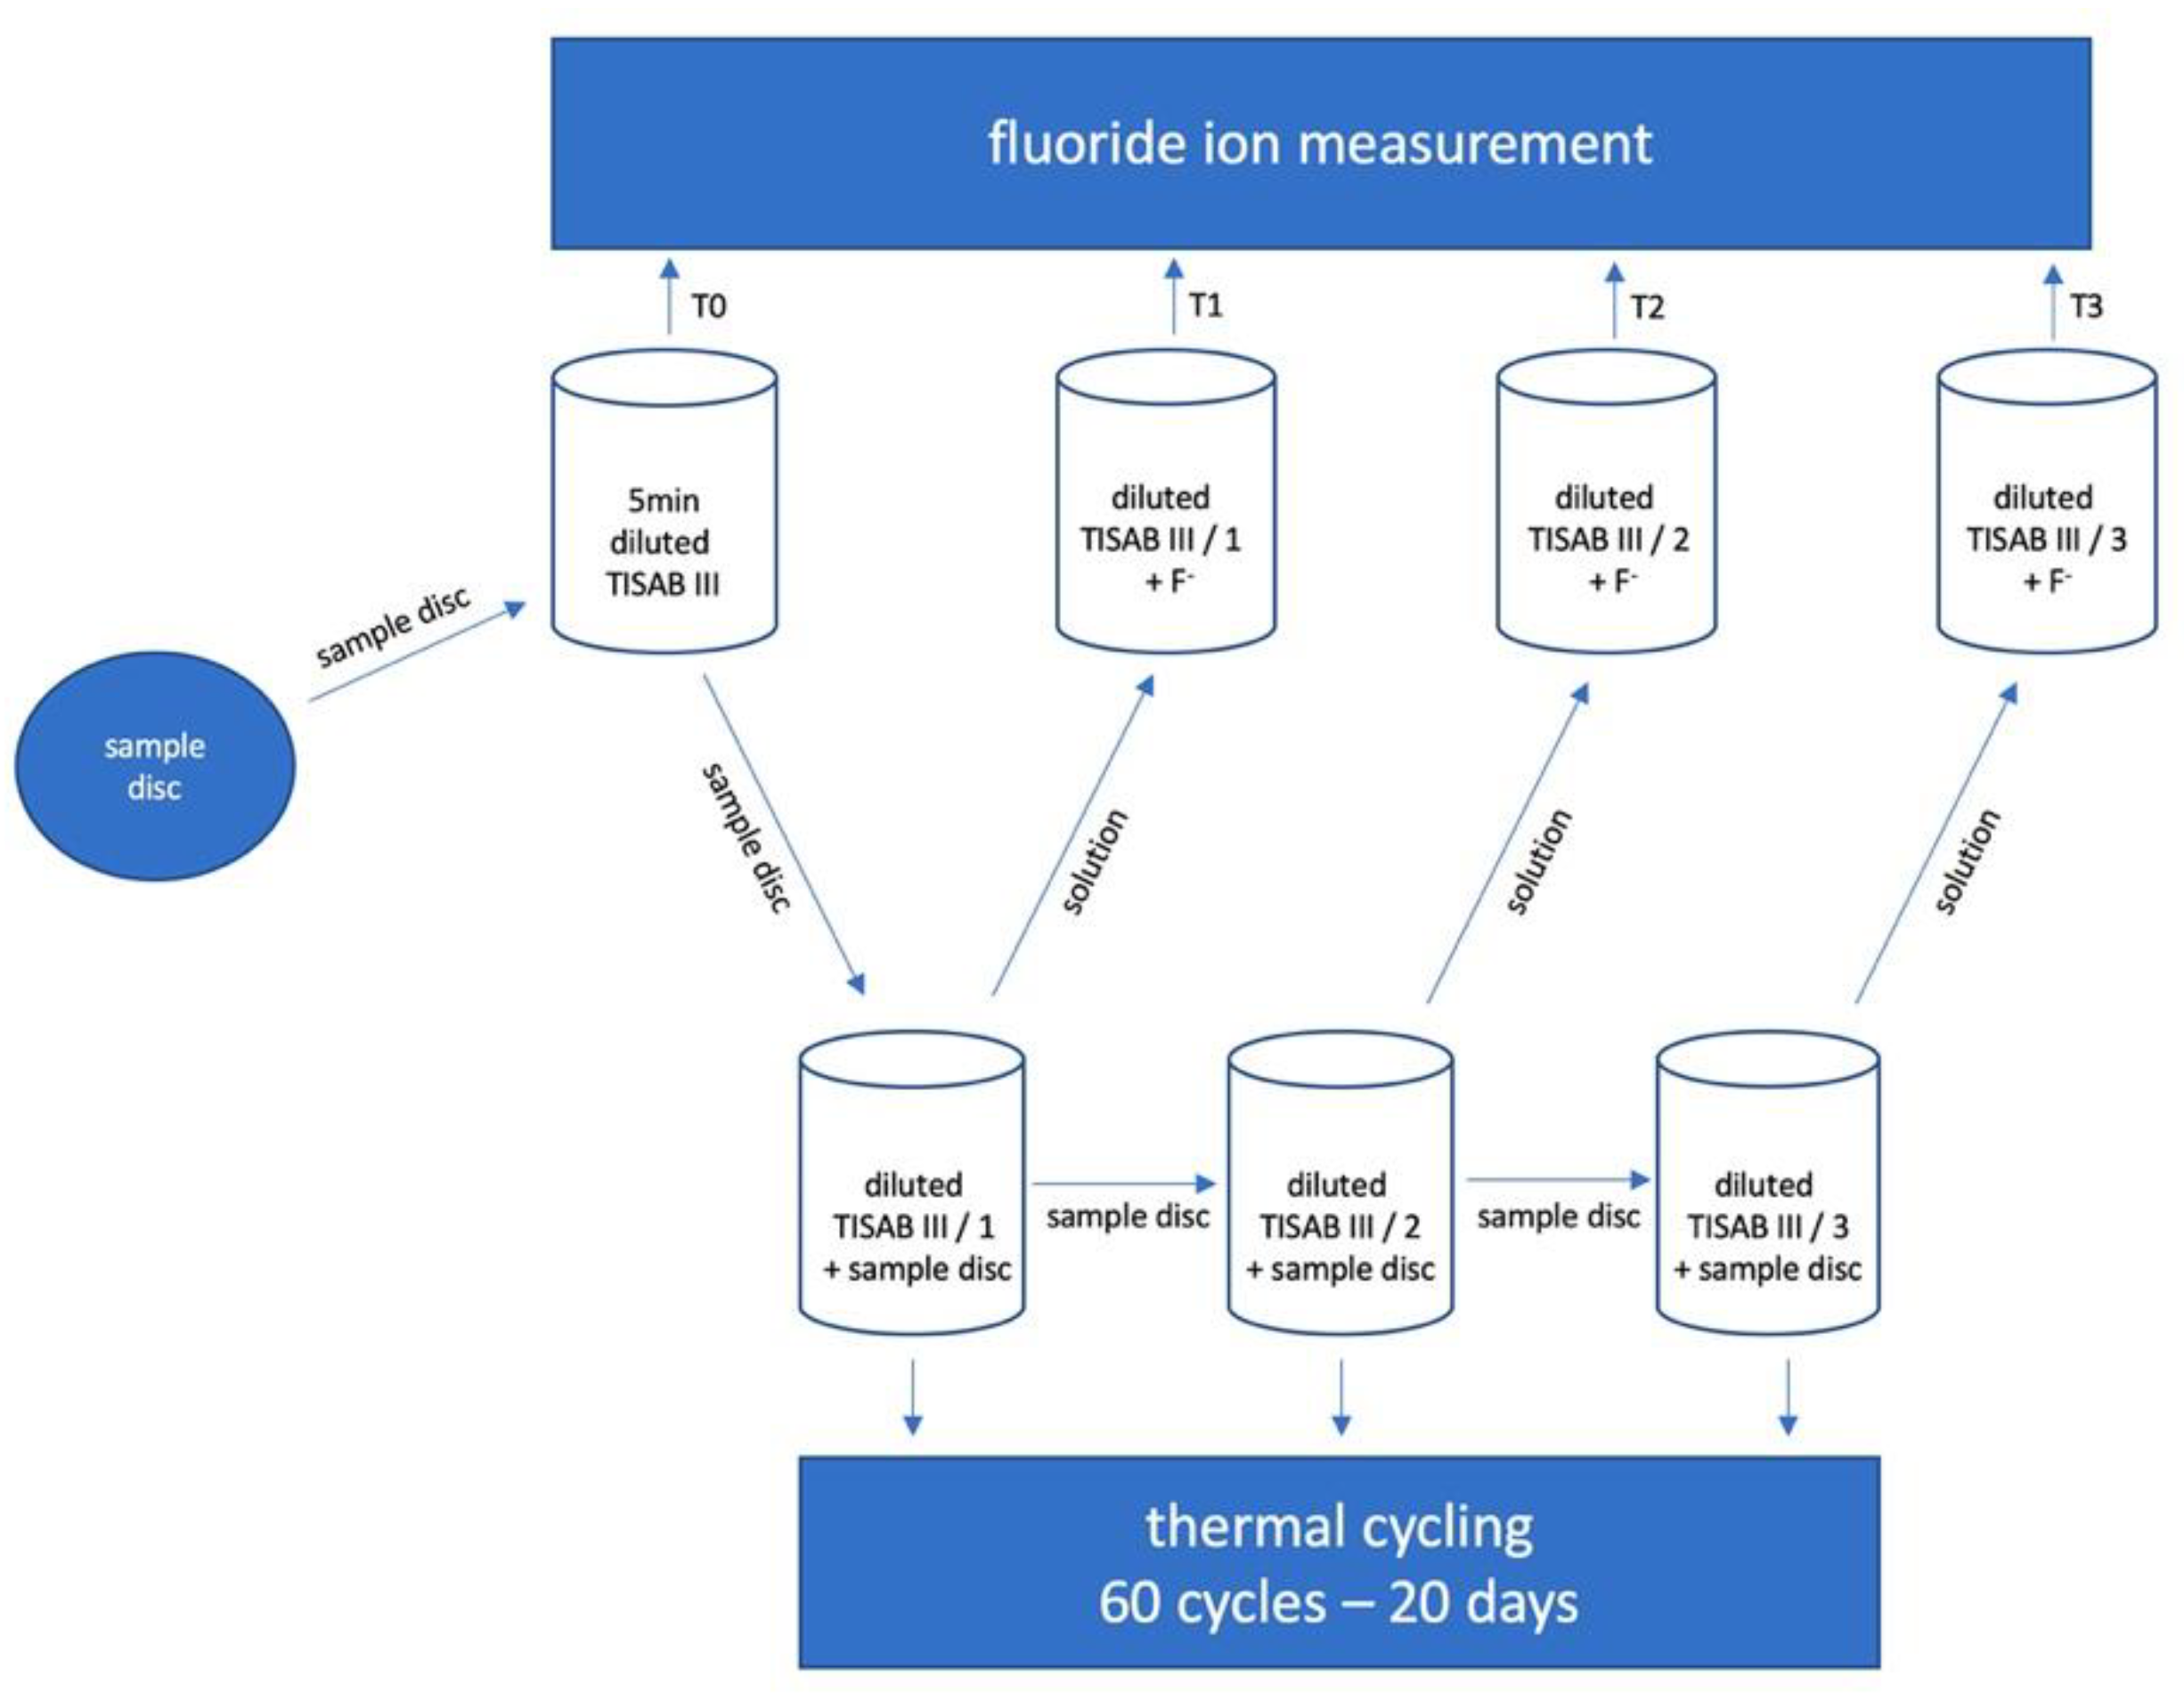
2.4. Experimental Procedure

Initially, 40 cryotubes were labeled according to the examination group, and each was filled with 1.5 mL of the diluted TISAB III. A test specimen was placed in each cryotube according to its group classification. For each of the four groups, a total of 10 specimens were used (N = 40, n = 10).
In order to simulate the influence of temperature during food intake in the oral cavity, the prepared cryotubes were subjected to a thermocycling process. The use of thermocycling as a method for testing fluoride varnishes under simulated oral conditions has been described before [15]. The value for the assumed minimum food temperature in the oral cavity was 5 °C while the maximum temperature was 55 °C. A thermal cycling run was 20 days with three cycles each day. The specimens remained for two hours at each temperature of 5 and 55 °C. The specimens of all four groups were exposed to 60 thermal cycles at T1 (duration of 20 days), 120 cycles at T2 (duration 40 days), and 180 cycles at T3 (duration of 60 days).
The fluoride concentration of the assay medium for each specimen from all four groups was examined at four different timepoints (T0–T3) (Figure 1). For the baseline measurement, T0, the specimens remained in the diluted TISAB III solution for 5 min with the lid closed. Then, the test specimens were separated from the examination medium and placed in a newly labeled cryotube with a new lot of diluted TISAB III solution for further thermocycling (Figure 1). This procedure was repeated after each thermocycling process (Figure 1). On the one hand, this separation procedure precluded the accumulation of fluoride values, while on the other hand it prevented a negative measuring effect due to the saturation of the examination medium with fluoride ions. Therefore, this process was performed prior to thermocycling runs (T0–T3) (Figure 1).
The old cryotubes with the remaining solution (examination medium) were resealed and placed on a vortex mixer for 10 s. A volume of 500 μL of the examination medium consisting of the diluted TISAB III and the fluoride released from the test products was pipetted off and placed in a 4 mL test tube. This procedure was followed by determination of the fluoride concentration. Before each fluoride concentration measurement (T0–T3) and before each change between the individual groups within the time of the examination, the fluoride electrode was calibrated. The fluoride concentration measurement took place until a stable value was found. For each test specimen, three values were noted. After each specimen was measured, the fluoride electrode was rinsed with bi-distilled water and dried with a dry wipe. To protect the test specimens from light exposure, they were stored in opaque containers.

2.5. Statistical Analysis

Statistical evaluation of the measurement results was carried out using the IBM SPSS Statistics 25 computer program (SPSS 25, Chicago, IL, USA). For all four different timepoints (T0, T1, T2, and T3) descriptive statistics were applied, and the normality of the distribution of fluoride values was tested using a Kolmogorov–Smirnov test. As a normal distribution was not found, non-parametric methods were used.
A Kruskal–Wallis H test was utilized to test for overall substantial differences between the studied materials at all timepoints (T0, T1, T2, and T3). A Kruskal–Wallis H test results in a higher power compared to the classical one-way ANOVA for non-parametric distributions [16].
A Mann–Whitney U test, which requires at least one rank scale in the data to be analyzed, was employed to evaluate the tested regimen according to pairwise comparison at all timepoints (T0, T1, T2, and T3). The advantage of this statistical test is that it does not depend on assumptions regarding the distribution of data, and can be used for average sample sizes of 10–20 samples [17].
The sample size calculation was based on a similar study [18]. With an alpha level of 0.05 and a power of 80%, a sample size per group of five test specimens was determined using G*Power (Heinrich Heine University Duesseldorf, Duesseldorf, Germany).

3. Results

The results of the Kruskal–Wallis H test indicated that there were significant, substantial differences between the studied materials for the fluoride concentration measurement at each timepoint. Excluding the control group of this statistical test also implied significant differences between the three varnishes at all measurement timepoints (Table 2).
The descriptive statistical values for almost all products (Table 3) showed a drop to a low, mostly homogeneous level after the first thermocycling from T1 to T2. This trend roughly corresponded with that for the control group, where the median fluoride concentration at baseline was 0.037 ppm at T0, dropping to 0.015 ppm at T1 after the first thermocycling, then further to 0.008 ppm at T2.
When considering the overall values for the products with regard to their fluoride release, Bifluorid 12 always had the highest concentrations over all parameters and measurement times. The median values for all carrier discs with Bifluorid 12 varied between a maximum of 37.667 ppm at T1 and a minimum of 0.927 ppm at T3. At baseline, the fluoride concentration was 8.582 ppm.
Fluor Protector S showed a maximum median value of 3.357 ppm at T1 and a minimum of 0.108 ppm at T2. The fluoride ion release at T3 was similar to that at T2, with a concentration of 0.114 ppm. The preliminary baseline test measurement of Fluor Protector S indicated a fluoride release of 1.455 ppm.
These products were followed by Protecto CaF2 Nano one step seal (T0 = 0.076 ppm, T1 = 0.085 ppm, T2 = 0.009 ppm, T3 = 0.012 ppm).
The CaP discs, which served as a control group, showed the least amount of fluoride ions released into the surrounding solution at all measurement times (T0 = 0.037 ppm, T1 = 0.015 ppm, T2 = 0.008 ppm, T3 = 0,010 ppm).
The control group and varnishes differed significantly from one another, as observed by pairwise comparison of independent samples (Table 4).
The evaluation according to the Mann–Whitney U test (Table 4) showed that the two products, Bifluorid 12 and Fluor Protector S, exhibited significant differences compared to the control group at all measurement timepoints, T0, T1, T2, and T3 (p < 0.001). Bifluorid 12 released significantly more fluoride ions into the solution at all measurement timepoints than did the other tested materials (p < 0.001).
Fluor Protector S showed a significantly higher fluoride release at all measurement timepoints (T0, T1, T2, and T3) than Protecto CaF2 nano and the control group (p < 0.001).
Protecto CaF2 nano performed better than the control group at T0, T1 (p < 0.001), and T3 (p < 0.05), but not at T2 (p = 0.052). At all measurement timepoints, Protecto CaF2 nano showed significantly less fluoride ion release than the other two tested fluoride-containing varnishes (p < 0.001).

4. Discussion

The enamel surface around orthodontically placed brackets is a retention site and shows increased risk of caries. In an in vitro study by Farrow et al. [19], it was shown that new demineralization occurred in only 7.7% of cases during the use of a fissure sealant as a bracket sealant, whereas in the control group with a conventional attachment of brackets without environmental sealing, the rate was 19.2%. Due to statistical insignificance, the authors questioned the use of varnishes to prevent white spots. In contrast, Frazier et al. demonstrated that tooth surfaces sealed with a fissure sealant developed 80% fewer occurrences of demineralization than the control group without sealant, and this difference was significant [20]. It has been reported that the use of fluoride-releasing materials around the bracket environment is beneficial to reducing white spot lesions in patients undergoing fixed appliance therapy [21,22]. To prevent white spot lesions, fluoride release should be prolonged [23].
This study examined fluoride ion release from different fluoride-releasing varnishes over a set time period based on an examination solution. Fluoride-free hydroxyapatite discs were used to prevent false measurements due to the fluorides that can be released from human enamel. An investigation on natural human or bovine teeth was discussed in advance during the planning of the study and was rejected because its use harbors the risk of a shift in the measured values due to fluorides that could detach from tooth enamel.
The release of fluoride ions from glass ionomer cement is a diffusion process [9]. Environmental temperature changes alter the diffusion behavior of the same material and can thereby affect the fluoride ion characteristics of the varnishes [24]. To simulate extreme thermal interactions of cold and hot food intake, three runs of a thermocycling process were used. Each run consisted of 60 cycles at 5 and 55 °C. Thermocycling is a well-known methodology for simulating thermal alteration [25,26], and the temperatures used in this study have been advocated for the last 20 years for testing dental materials [27].
To ensure the comparability of this study with others, standardized test procedures were used. Measuring fluoride concentrations by means of a fluoride ion electrode has been described previously in several studies [18,28,29].
In the literature, no study was found that measured dissolved fluoride release using a fluoride ion electrode and also included thermal alteration of the tested products by thermocycling.
The fluoride concentration was measured after successful calibration of the electrode between two set values using previously determined calibration solutions. By repeatedly measuring these calibration values before and between the series of measurements, whether the measuring range of the electrode had shifted during the measurement series could be detected. The measurement of each product was repeated three times to verify the fluoride concentration. In order to prevent the accumulation of fluoride in the examination medium, the solution was replaced by a new solution after each measurement time.
The product Bifluorid 12 showed the highest fluoride ion release capacity in our study. The interpretation of the global Kruskal–Wallis H test and the descriptive statistics, in addition to the pairwise Mann–Whitney U test, led to the conclusion that Bifluorid 12 outperformed all other tested products at all measurement timepoints, T0, T1, T2, and T3.
Our results on the fluoride release characteristics of Bifluorid 12 match the results of other studies showing that the fluoride release decreases over time [30]. Maas et al. [31] also found Bifluorid 12 to have the highest fluoride release in solution when compared to other product groups. This shows that the results are consistent with those of other studies. It can be assumed that Biflourid 12 is able to release fluoride for longer than the other products tested in our study.
The product Fluor Protector S showed similar characteristics to Bifluorid 12, but with lower median values of fluoride release at any measurement point. The results of our study show that Fluor Protector S had highly significant fluoride release until T1. After this time, fluoride release was detectable only at a low value. Bolis et al. investigated Fluor Protector S using a fluoride ion electrode after storage of the test specimen in an artificial saliva solution over a period of 4 h. Fluor Protector S showed the highest amount of fluoride uptake into enamel compared to other product groups, but its fluoride release was not the highest [32]. A peak fluoride release within the first hour following application [32] could not be confirmed by our data, as Fluor Protector S showed a peak fluoride release at T1 in our study (meaning after 20 days of thermal cycling). It can be assumed that Fluor Protector can deliver a high initial level of fluoride release to the surrounding oral cavity environment, but thereafter the fluoride levels fall to a minimum. For orthodontic treatment, which typically lasts about two years, continuous long-term fluoride release would be desirable. It is well documented that the fluoride concentration in the test medium is increased immediately after the use of various fluoride compounds in the dentifrice [33,34]. Showing a peak fluoride concentration in the tested medium after 20 days of thermocycling, our data suggest a different kinetic behavior for fluoride varnishes.
Protecto CaF2 nano one-step seal showed high fluoride release at T1 and T2 during the test period. Immediately after application of the product (T0) and after the first thermocycling at timepoint T1, peak fluoride release was detectable in the solution. When compared to the values of the control group at measurement timepoint T2, the difference is 0.001 ppm, though this is statistically insignificant, bordering on the significance level. At T3, the difference from the control group was 0.002 ppm. These values might not show clinical relevance; therefore, clinical effectiveness in long-term use and after a single application of Protecto CaF2 nano is to be questioned.
It should be noted that the measured values of fluoride ion concentrations are so low that accuracy cannot be guaranteed, even with the use of a highly sensitive fluoride ion electrode in this study. This could also be one of the reasons why a minimal amount of fluoride release was measured in the control group with hydroxyapatite discs.
A study by Chau et al. also showed minimal fluoride release, though into a culture medium, from hydroxyapatite discs serving as a control group [35]. Contamination cannot be ruled out completely.
In our study, three 60-cycle thermal cycling runs summing to 180 cycles were performed for each specimen. There have been studies that reported fewer cycle runs, but there have also been studies with more than 500 cycling runs [26,36]. Therefore, the fluoride ion release capacities of the products tested could be for a shorter time if tested with more cycling runs or under certain clinical conditions.
Taking into account that the control disc group showed a median value of 0.010 ppm at T3, and putting this in concordance with the other values at T3, it can be assumed that only Bifluorid 12 and Fluor Protector S provided a fluoride ion concentration above 0.03 ppm. It has been shown that the incorporation of fluoride levels of 0.03 ppm into a mineralizing solution like saliva enhances remineralization [37].
A solitary product application of once or twice per year, as recommended by the manufacturers, cannot be supported.
A recharge of the fluoride supply has been suggested by other authors every 3 to 3.5 months [13,14]. The combination of fluoride varnish applications twice a year with regular topical fluoride application every three months could lead to a reduced risk of demineralization during fixed orthodontic treatment.
The limitations of this study are its in vitro character, the use of fluoride-free hydroxyapatite carrier discs simulating tooth substance, and the number of thermocycling runs. Further in vivo studies are needed in which the material is applied to tooth substance in order to verify our findings under a caries model or normal clinical conditions.

5. Conclusions

This study examined the fluoride release characteristics of three fluoride-containing varnishes before and after thermal cycling. Within the limitations of this in vitro study, the peak release from the fluoride varnishes was observed at measurement timepoint T1 (after 20 days of thermocycling).
In this study, the fluoride-containing varnishes Bifluorid 12 and Fluor Protector S achieved significantly higher fluoride release values than did the other tested products over a period of 60 days. The results indicate that fluoride-containing varnishes release fluoride into the surrounding solution, through which they can offer inhibition of caries development for fixed appliance orthodontic therapy. However, this fluoride release might not be sufficiently prolonged to be as effective as the manufacturers claim.

Author Contributions

Conceptualization, G.D., M.B., and W.H.A.; methodology, S.C., E.A.N., and S.C.M.; validation, E.A.N., M.B., and S.C.M.; formal analysis, S.C. and J.H.; investigation, J.H.; resources, G.D. and M.B.; data curation W.H.A., E.A.N., and S.C.M.; writing—original draft preparation, S.C. and J.H.; writing—review and editing, G.D., E.A.N., M.B., W.H.A., and S.C.M.; visualization, S.C. and J.H.; supervision, G.D., M.B., and W.H.A.; project administration, G.D., M.B., and S.C. All authors have read and agreed to the published version of the manuscript.

Funding

This research received no external funding.

Institutional Review Board Statement

Not applicable.

Informed Consent Statement

Not applicable.

Data Availability Statement

Data are available on request.

Acknowledgments

We thank S. Haußmann for her technical support. We thank VOCO GmbH for kindly providing us with their products.

Conflicts of Interest

The authors declare no conflict of interest.

References

  1. Hochli, D.; Hersberger-Zurfluh, M.; Papageorgiou, S.N.; Eliades, T. Interventions for orthodontically induced white spot lesions: A systematic review and meta-analysis. Eur. J. Orthod. 2017, 39, 122–133. [Google Scholar] [CrossRef] [Green Version]
  2. Benson, P.E.; Shah, A.A.; Millett, D.T.; Dyer, F.; Parkin, N.; Vine, R.S. Fluorides, orthodontics and demineralization: A systematic review. J. Orthod. 2005, 32, 102–114. [Google Scholar] [CrossRef] [PubMed] [Green Version]
  3. de Oliveira Correia, A.M.; Borges, A.B.; Torres, C.R.G. Color masking prediction of posterior white spot lesions by resin infiltration in vitro. J. Dent. 2020, 95, 103308. [Google Scholar] [CrossRef]
  4. Geiger, A.M.; Gorelick, L.; Gwinnett, A.J.; Griswold, P.G. The effect of a fluoride program on white spot formation during orthodontic treatment. Am. J. Orthod. Dentofac. Orthop. 1988, 93, 29–37. [Google Scholar] [CrossRef]
  5. Sundararaj, D.; Venkatachalapathy, S.; Tandon, A.; Pereira, A. Critical evaluation of incidence and prevalence of white spot lesions during fixed orthodontic appliance treatment: A meta-analysis. J. Int. Soc. Prev. Community Dent. 2015, 5, 433–439. [Google Scholar] [CrossRef] [Green Version]
  6. Gorelick, L.; Geiger, A.M.; Gwinnett, A.J. Incidence of white spot formation after bonding and banding. Am. J. Orthod. 1982, 81, 93–98. [Google Scholar] [CrossRef]
  7. Korkmaz, Y.N.; Yagci, A. Comparing the effects of three different fluoride-releasing agents on white spot lesion prevention in patients treated with full coverage rapid maxillary expanders. Clin. Oral Investig. 2019, 23, 3275–3285. [Google Scholar] [CrossRef] [PubMed]
  8. Beckwith, F.R.; Ackerman, R.J., Jr.; Cobb, C.M.; Tira, D.E. An evaluation of factors affecting duration of orthodontic treatment. Am. J. Orthod. Dentofac. Orthop. 1999, 115, 439–447. [Google Scholar] [CrossRef]
  9. Tay, W.; Braden, M. Fluoride ion diffusion from polyalkenoate (glass-ionomer) cements. Biomaterials 1988, 9, 454–456. [Google Scholar] [CrossRef]
  10. Arnold, W.H.; Haase, A.; Hacklaender, J.; Gintner, Z.; Bánóczy, J.; Gaengler, P. Effect of pH of amine fluoride containing toothpastes on enamel remineralization in vitro. BMC Oral Health 2007, 7, 14. [Google Scholar] [CrossRef] [Green Version]
  11. Eggerath, J.; Kremniczky, T.; Gaengler, P.; Arnold, W. EDX-element analysis of the in vitro effect of fluoride oral hygiene tablets on artificial caries lesion formation and remineralization in human enamel. Open Dent. J. 2011, 5, 84. [Google Scholar] [CrossRef]
  12. Lagerlöf, F. Caries-protective factors in saliva. Adv. Dent. Res. 1994, 8, 229–238. [Google Scholar] [CrossRef] [Green Version]
  13. Vivaldi-Rodrigues, G.; Demito, C.F.; Bowman, S.J.; Ramos, A.L. The effectiveness of a fluoride varnish in preventing the development of white spot lesions. World J. Orthod. 2006, 7, 138–144. [Google Scholar]
  14. Knosel, M.; Ellenberger, D.; Goldner, Y.; Sandoval, P.; Wiechmann, D. In-vivo durability of a fluoride-releasing sealant (OpalSeal) for protection against white-spot lesion formation in orthodontic patients. Head Face Med. 2015, 11, 11. [Google Scholar] [CrossRef] [PubMed] [Green Version]
  15. Abdel-Haffiez, S.H.; Zaher, A.R.; Elharouny, N.M. Effects of a filled fluoride-releasing enamel sealant versus fluoride varnish on the prevention of enamel demineralization under simulated oral conditions. J. World Fed. Orthod. 2013, 2, e133–e136. [Google Scholar] [CrossRef]
  16. Hecke, T.V. Power study of anova versus Kruskal-Wallis test. J. Stat. Manag. Syst. 2012, 15, 241–247. [Google Scholar] [CrossRef]
  17. Nachar, N. The Mann-Whitney U: A test for assessing whether two independent samples come from the same distribution. Tutor. Quant. Methods Psychol. 2008, 4, 13–20. [Google Scholar] [CrossRef]
  18. Castillo, J.L.; Milgrom, P.; Kharasch, E.; Izutsu, K.; Fey, M. Evaluation of fluoride release from commercially available fluoride varnishes. J. Am. Dent. Assoc. 2001, 132, 1389–1392. [Google Scholar] [CrossRef] [PubMed]
  19. Farrow, M.L.; Newman, S.M.; Oesterle, L.J.; Shellhart, W.C. Filled and unfilled restorative materials to reduce enamel decalcification during fixed-appliance orthodontic treatment. Am. J. Orthod. Dentofac. Orthop. 2007, 132, 578.e1–578.e6. [Google Scholar] [CrossRef] [PubMed]
  20. Frazier, M.C.; Southard, T.E.; Doster, P.M. Prevention of enamel demineralization during orthodontic treatment: An in vitro study using pit and fissure sealants. Am. J. Orthod. Dentofac. Orthop. 1996, 110, 459–465. [Google Scholar] [CrossRef]
  21. Nascimento, P.L.d.M.M.; Fernandes, M.T.G.; Figueiredo, F.E.D.d.; Faria-e-Silva, A.L. Fluoride-releasing materials to prevent white spot lesions around orthodontic brackets: A systematic review. Braz. Dent. J. 2016, 27, 101–107. [Google Scholar] [CrossRef]
  22. Miller, M.J.; Bernstein, S.; Colaiacovo, S.L.; Nicolay, O.; Cisneros, G.J. Demineralized white spot lesions: An unmet challenge for orthodontists. In Seminars in Orthodontics; WB Saunders: Philadelphia, PA, USA, 2016; pp. 193–204. [Google Scholar]
  23. Premaraj, T.; Rohani, N.; Covey, D.; Premaraj, S. In vitro evaluation of surface properties of Pro Seal® and Opal® SealTM in preventing white spot lesions. Orthod. Craniofacial Res. 2017, 20, 134–138. [Google Scholar] [CrossRef]
  24. Yan, Z.; Sidhu, S.; Mahmoud, G.; Carrick, T.; McCabe, J. Effects of temperature on the fluoride release and recharging ability of glass ionomers. Oper. Dent. 2007, 32, 138–143. [Google Scholar] [CrossRef] [PubMed]
  25. Bishara, S.E.; Ajlouni, R.; Laffoon, J.F. Effect of thermocycling on the shear bond strength of a cyanoacrylate orthodontic adhesive. Am. J. Orthod. Dentofac. Orthop. 2003, 123, 21–24. [Google Scholar] [CrossRef]
  26. Khanehmasjedi, M.; Ghaemi, A.; Fard, V.N. The effects of various surface treatments on the shear bond strengths of metal Brackets to Restored Teeth by two different Composite. Med. Sci. 2019, 23, 660–669. [Google Scholar]
  27. Morresi, A.L.; D’Amario, M.; Capogreco, M.; Gatto, R.; Marzo, G.; D’Arcangelo, C.; Monaco, A. Thermal cycling for restorative materials: Does a standardized protocol exist in laboratory testing? A literature review. J. Mech. Behav. Biomed. Mater. 2014, 29, 295–308. [Google Scholar] [CrossRef]
  28. Chan, W.D.; Yang, L.; Wan, W.; Rizkalla, A.S. Fluoride release from dental cements and composites: A mechanistic study. Dent. Mater. 2006, 22, 366–373. [Google Scholar] [CrossRef]
  29. Poggio, C.; Andenna, G.; Ceci, M.; Beltrami, R.; Colombo, M.; Cucca, L. Fluoride release and uptake abilities of different fissure sealants. J. Clin. Exp. Dent. 2016, 8, e284. [Google Scholar] [CrossRef] [PubMed]
  30. Attin, T.; Schneider, K.; Buchalla, W. Abrasionsstabilität des KOH-iöslichen Fluorids auf Schmelz nach Applikation verschiedener Fluoridierungsmittel. Dtsch. Zahnärztl. Z. 2001, 56, 706–711. [Google Scholar]
  31. Maas, J.R.; Junior, I.M.F.; Lodi, C.S.; Delbem, A.C. Differences in loosely bound fluoride formation and anticaries effect of resin-based fluoride varnishes. Int. J. Paediatr. Dent. 2013, 23, 166–172. [Google Scholar] [CrossRef]
  32. Bolis, C.; Härtli, G.P.; Lendenmann, U. Fluoride Varnishes—Is There a Correlation Between Fluoride Release and Deposition on Enamel? Oral Health Prev. Dent. 2015, 13, 545–556. [Google Scholar] [PubMed]
  33. Naumova, E.; Arnold, W.; Gaengler, P. Fluoride bioavailability in saliva using DENTTABS® compared to dentifrice. Open Med. 2010, 5, 375–380. [Google Scholar] [CrossRef]
  34. Bruun, C.; Givskov, H.; Thylstrup, A. Whole saliva fluoride after toothbrushing with NaF and MFP dentifrices with different F concentrations. Caries Res. 1984, 18, 282–288. [Google Scholar] [CrossRef] [PubMed]
  35. Chau, N.P.T.; Pandit, S.; Jung, J.-E.; Jeon, J.-G. Evaluation of Streptococcus mutans adhesion to fluoride varnishes and subsequent change in biofilm accumulation and acidogenicity. J. Dent. 2014, 42, 726–734. [Google Scholar] [CrossRef]
  36. Malek, S.; Hossain, M.; Gafur, M.A.; Rana, M.S.; Moral, M.A.A. Comparative study of resin sealant and resin modified glass ionomer as pit and fissure sealant. Bangabandhu Sheikh Mujib Med Univ. J. 2017, 10, 21–26. [Google Scholar] [CrossRef]
  37. Featherstone, J.D. Prevention and reversal of dental caries: Role of low level fluoride. Community Dent. Oral Epidemiol. 1999, 27, 31–40. [Google Scholar] [CrossRef]
Figure 1. Setup of the present study (TISAB III: Total Ionic Strength Adjustment Buffer III, F: released fluoride ion concentration).
Applsci 11 01452 g001
Table 1. Group classification according to the examined materials.
MaterialGroupProduct NameManufacturerSubstance
Controls1Calcium Phosphate (CaP) discsHimed Inc., Old Bethpage, NY, USAhydroxyapatite
Varnishes2Bonadent Protecto CaF2 Nano one-step sealBonadent GmbH, Frankfurt, Germanysilicone polyacrylate, nano-fluorapatite, nano-calcium fluoride, ethylacetate
3VOCO Bifluorid 12 single doseVoco GmbH, Cuxhaven, Germany6% natrium fluoride, 6% calcium fluoride, ethylacetate, silicate
4Ivoclar Vivadent Fluor Protector SIvoclar Vivadent AG, Schaan, Liechtenstein1.5% ammonium fluoride, ethanol, water
Table 2. Kruskal–Wallis H test results for general differences between the four study groups regarding fluoride release.
With Control GroupT0T1T2T3
Asymp. Sig.<0.001 ***<0.001 ***<0.001 ***<0.001 ***
Without Control GroupT0T1T2T3
Asymp. Sig.<0.001 ***<0.001 ***<0.001 ***<0.001 ***
N = 40 (with control group) or N = 30 (without control group), n = 10 per group. T0 = preliminary test; T1 = 20 days thermocycling; T2 = 40 days thermocycling; T3 = 60 days thermocycling. *** = significance (p ≤ 0.005).
Table 3. Descriptive statistical values of fluoride ion release (in ppm) for the tested materials at all measurement times.
MaterialT0T1T2T3
Median (ppm)Median (ppm)Median (ppm)Median (ppm)
(95% CI Low–High)(95% CI Low–High)(95% CI Low–High)(95% CI Low–High)
Bifluorid 128.58237.6671.8370.927
(8.037–10.900)(32.167–43.867)(1.153–4.240)(0.666–1.160)
Fluor Protector S1.4553.3570.1080.114
(1.380–1.523)(2.923–3.713)(0.106–0.209)(0.089–0.278)
Protecto CaF2 Nano0.0760.0850.0090.012
(0.070–0.078)(0.039–0.224)(0.008–0.011)(0.011–0.012)
CaP discs0.0370.0150.0080.01
(0.036–0.037)(0.012–0.023)(0.008–0.010)(0.010–0.011)
Table 4. Mann–Whitney U test results for differences between groups regarding fluoride release (not corrected for ties).
GroupMeasurement Timepoint
T0T1T2T3
1 vs. 2<0.001 ***<0.001 ***0.052<0.05 **
1 vs. 3<0.001 ***<0.001 ***<0.001 ***<0.001 ***
1 vs. 4<0.001 ***<0.001 ***<0.001 ***<0.001 ***
2 vs. 3<0.001 ***<0.001 ***<0.001 ***<0.001 ***
2 vs. 4<0.001 ***<0.001 ***<0.001 ***<0.001 ***
3 vs. 4<0.001 ***<0.001 ***<0.001 ***<0.001 ***
control vs. varnishes<0.001 ***<0.001 ***<0.001 ***<0.001 ***
*** = significance (p ≤ 0.005) Exact Sig. [2 × (1-tailed Sig.)]. ** = significance (p ≤ 0.05) Exact Sig. [2 × (1-tailed Sig.)]. Group classification: 1, CaP discs; 2, Protecto CaF2 Nano; 3, Bifluorid 12; 4, Fluor Protector S.
Publisher’s Note: MDPI stays neutral with regard to jurisdictional claims in published maps and institutional affiliations.

