Article

Life Cycle Assessment of an NMC Battery for Application to Electric Light-Duty Commercial Vehicles and Comparison with a Sodium-Nickel-Chloride Battery

1
Dipartimento Energia “Galileo Ferraris”, CARS@Polito—Center for Automotive Research and Sustainable Mobility, Politecnico di Torino, Corso Duca degli Abruzzi 24, 10129 Torino, Italy
2
Dipartimento di Chimica, Materiali e Ingegneria Chimica “Giulio Natta”, Politecnico di Milano, Piazza Leonardo da Vinci 32, 20133 Milano, Italy
*
Author to whom correspondence should be addressed.
Appl. Sci. 2021, 11(3), 1160; https://doi.org/10.3390/app11031160
Submission received: 15 December 2020 / Revised: 13 January 2021 / Accepted: 23 January 2021 / Published: 27 January 2021
(This article belongs to the Section Mechanical Engineering)

Abstract

:
This paper presents the results of an environmental assessment of a Nickel-Manganese-Cobalt (NMC) Lithium-ion traction battery for Battery Electric Light-Duty Commercial Vehicles (BEV-LDCV) used for urban and regional freight haulage. A cradle-to-grave Life Cycle Inventory (LCI) of NMC111 is provided, operation and end-of-life stages are included, and insight is also given into a Life Cycle Assessment of different NMC chemistries. The environmental impacts of the manufacturing stages of the NMC111 battery are then compared with those of a Sodium-Nickel-Chloride (ZEBRA) battery. In the second part of the work, two electric-battery LDCVs (powered with NMC111 and ZEBRA batteries, respectively) and a diesel urban LDCV are analysed, considering a wide set of environmental impact categories. The results show that the NMC111 battery has the highest impacts from production in most of the impact categories. Active cathode material, Aluminium, Copper, and energy use for battery production are the main contributors to the environmental impact. However, when vehicle application is investigated, NMC111-BEV shows lower environmental impacts, in all the impact categories, than ZEBRA-BEV. This is mainly due to the greater efficiency of the NMC111 battery during vehicle operation. Finally, when comparing BEVs to a diesel LDCV, the electric powertrains show advantages over the diesel one as far as global warming, abiotic depletion potential-fossil fuels, photochemical oxidation, and ozone layer depletion are concerned. However, the diesel LDCV performs better in almost all the other investigated impact categories.

1. Introduction

In the past, the on-board energy supply of battery electric vehicles (BEVs) was based on lead-acid, Nickel-metal hydride (NiMH) or on Sodium-Nickel-Chloride (ZEBRA) batteries [1,2,3,4]. Over the years, an increasing number of battery types have been explored [5] in the search for better performances, stability, and/or longer lifespans. Among these, Li-ion batteries (LIB) have emerged as the dominant technology for BEVs [2,3,6,7]. The main reasons for this are connected to the favourable material characteristics of Lithium [1] Lithium is in fact the lightest of all known metals and offers the best electrochemical potential, which results in a higher power and energy density [1]. The latter is of paramount importance for BEVs in order to compete with the performance and costs of internal combustion engine vehicles [7,8].
Different cathode chemistries have been investigated for LIBs over the last decade. The first serial-production electric cars, launched just over a decade ago, used Lithium Cobalt Oxide (LCO) and Lithium Manganese Oxide (LMO) cathodes [6]. Attention then moved to other chemistries, for example, Nickel-Manganese-Cobalt oxide (NMC), Lithium Iron Phosphate (LFP) and, more recently, Lithium Nickel Cobalt Aluminium oxide (NCA) [3,6,9]. LFP batteries show an excellent cycle stability and long lifetime [3,10]. However, due to their low energy density [3,10], they are used less frequently in commercial BEVs [10]. NCA batteries are characterised by a high energy density but also by less safety [3,6]. NMC batteries feature the highest energy density after NCA ones [3] and are currently the choice for power tools, e-bikes, and many electric powertrains [10,11,12]. Therefore, since the launching of mass-market electric vehicles, the focus of research and innovation activities has shifted towards NMC batteries [3,6,12], as evidenced by the large number of recent patents on this subject [6]. The cathode combination is typically one-third Nickel, one-third Manganese and one-third Cobalt, and this combination is known as NMC111. However, Cobalt is expensive and in limited supply, and its content largely determines the overall cost and sustainability of NMC batteries [3,6,13,14,15,16]. Therefore, battery manufacturers are reducing the Cobalt content and shifting to cathodes with a higher Nickel content [3,11,13,14,15,16]. Some of the combinations that have proved successful are NMC532 (with 5 parts Nickel, 3 parts Cobalt, and 2 parts Manganese), NMC622 and NMC811 [3,7,11,13,14,15,16]. From the technical point of view, Nickel-based cells have a higher energy density [3,7,14,15,16] and longer cycle life than Cobalt-based cells, but they may also have a slightly lower voltage [17]. In addition, Nickel-based cells decrease the dependence on Cobalt resources, which are geographically concentrated, expensive [7,13,14,15,16], and are starting to be scarce due to the significant increase in the exploitation of the mineral deposits required to provide the raw materials necessary for the LIB market [5].
The environmental impacts of different battery types and chemistries are generally analysed using a Life Cycle Assessment (LCA) [10]. In fact, a complete LCA is comprehensive of all the life cycle stages that characterise a product. Many studies [9,11,12,18,19,20,21,22] have assessed the impacts of the production stage of NMC batteries, but they have not covered the other life cycle stages, and have often been neglected the End-of-Life (EoL) and Use stages.
As far as the End-of-Life (EoL) stage is concerned, the actual low recycling rates for LIB could lead to a loss in the environmental benefits inherent to this type of battery. Moreover, the great uncertainties associated with the use of certain materials (e.g., solvents) and energy in the recycling processes, due to the lack of industry data [10], have led many researchers to neglect the EoL stage. The impact of the EoL stage of NMC batteries has been found to only have been studied in a few works [23,24,25], in which three recycling processes were considered as alternatives (Pyrometallurgic, Hydrometallurgical and Direct) and in PEFCR [26], in which only one Pyrometallurgic-Hydrometallurgical cascade process was considered for a generic Li-ion battery.
As regards the Use stage, LIBs and electrification with low emissions play a central role in reducing emissions from road transport. In 2019, just under 8.5 Gt CO2 was produced by the transport sector [27]. Light-Duty Commercial Vehicles (LDCV), as well as Medium- and Heavy-Duty Lorries were responsible for about 2.3 Gt CO2 [27]) thus confirming that road cargo transportation is the most energy-intensive freight mode (per tkm) and that it runs almost exclusively on fossil fuel [28]. According to the IEA Sustainable Development Scenario (SDS), electric passenger car sales in the European Union are expected to rise from around 2% of the market in 2019 to more than 50% in 2030 and to cover virtually all sales in 2050 [27]. This shift towards electro-mobility has also been witnessed in light-duty lorries, urban buses, and motorbikes. Moreover, it has also affected medium- and heavy-duty lorries to a certain extent. Around half of the EU road freight involves journeys of no more than 200–300 km, for which EVs are a competitive option [24,29]. According to IEA SDS, by 2050, around 40% of medium- and heavy-duty lorries will be electric [27].
The relative benefits of electric lorries depend to a great extent on the vehicle efficiency associated with the drive cycle, travel demand, electric drive battery replacement, electricity generation, transmission efficiency, etc. [30]. Operating in an urban environment in which a significant portion of their travel time is spent idling, conventional light-duty vehicles result in a low fuel economy [30]. Increasingly serious congestion in cities causes vehicles to travel for a long period of time under low-speed conditions, thereby resulting in a lower fuel economy and more serious negative effects, such as congestion, GHG emissions, and noise [24]. Moreover, the frequent deceleration and stops that are typical of urban driving make regenerative braking a suitable option, and since these lorries usually operate on almost the same route every day and return to a company garage at the end of every operation, systematic central recharging is feasible [30].
Despite the importance of the electrification of commercial vehicles, almost 90% of the scientific publications about the environmental assessments of battery vehicles has focused on passenger cars, whereas the other vehicle types appear in less than 5% of the papers [31]. When LDCVs have been addressed, only a few selected impact categories have been considered for comparison purposes. For instance, Lee et al. [30] and Yang et al. [24] provided an analysis on delivery lorries in which they focused only on GHG emissions and energy use. As explained in [8], Nigro [32] discussed and compared alternative fuel technologies for LDCVs, albeit only in terms of GHG. In [33], the comparison was carried out in terms of GHG and costs. Overall, no application of NMC batteries to LDCV has been analysed in great detail, in terms of environmental impact.
The two studies that are closest to this aspect, as far as methodological aspects are concerned, are the one conducted by USEPA [34] and the PEFCR one on batteries conducted by Recharge [26]. They include all the life cycle stages of the battery and a wide comparison of different impact categories. Nevertheless, the former [34] was oriented towards specific emissions in the United States and considered EVs in general and not specifically LDCVs. This is a relevant aspect because of the different characteristics of LDCVs (e.g., vehicle mass) and their usage (e.g., the driving missions). Finally, the latter study [26] did not include NMC-specific impacts since it only considered generic Li-ion batteries. Furthermore, it was limited to a battery LCA and did not consider the entire LCA of a vehicle.
This paper is the result of part of a research work that was aimed at assessing the environmental footprint of Light-, Medium- and Heavy-Duty Commercial Vehicles equipped with different ICE-based powertrains (running on diesel oil, natural gas, or renewable fuels) and electrified powertrains based on different types of batteries, supercapacitors, or fuel cells. The first part of this research focused on an LDCV for urban and regional freight haulage. Unlike other studies, vehicle production was assessed on the basis of primary data provided by the vehicle manufacturer. These data have been reported in detail in a previous paper [35] in which diesel ICE, Natural Gas ICE, and ZEBRA battery electric vehicles were compared in terms of environmental footprint.
The previous analyses of the diesel ICE and ZEBRA battery electric vehicles have been updated for the present paper to consider Ecoinvent version 3.6, and a new electric vehicle, based on an NMC battery, has been added to the analyses.
The goal of this study has been twofold: first, the environmental impacts of NMC and ZEBRA batteries have been compared for application to LDCVs on both a mass and an energy basis. The environmental footprint of a case-study LDCV [35] has also been calculated for three different configurations: a conventional vehicle, equipped with a diesel Internal Combustion Engine (ICE), and two BEVs equipped with a ZEBRA and an NMC battery, respectively. The environmental impact results of the LCDV equipped with a ZEBRA battery were taken from a previous paper by the authors [35]. In other words, a complete set of environmental impact categories (see Section 2.1.5 for details) has been considered. The impacts associated with all the life-cycle stages of a product have been estimated, and the recycling phase of the battery components has been modelled through a process adapted to represent the Pyrometallurgic and Hydrometallurgical phases in cascade, as the PEFCR on batteries recommends [26]) The paper is organised as follows: first a detailed description of the adopted LCA methodology is presented, then the results of the LCIs for all the life cycle stages are reported. The result and discussion sections include the cradle-to-grave LCA of an NMC111 battery and insight into the LCA of different NMC chemistries (namely NMC811 and NMC622). The environmental impacts of the manufacturing stages of NMC111 are also compared with those of ZEBRA batteries. Finally, an LCA comparison of three LDCV configurations (NMC111-BEV, ZEBRA-BEV, and conventional diesel), including battery and vehicle production, vehicle maintenance, battery losses, and vehicle use phases, is reported.
The main novelties of this article are:
  • A complete Life Cycle Inventory of an NMC battery, which is fully replicable, is presented.
  • The environmental impact of the NMC battery has been analysed considering all of the product life cycle stages, including the amount of electricity lost during the recharging phase along the lifespan of the battery and the battery EoL.
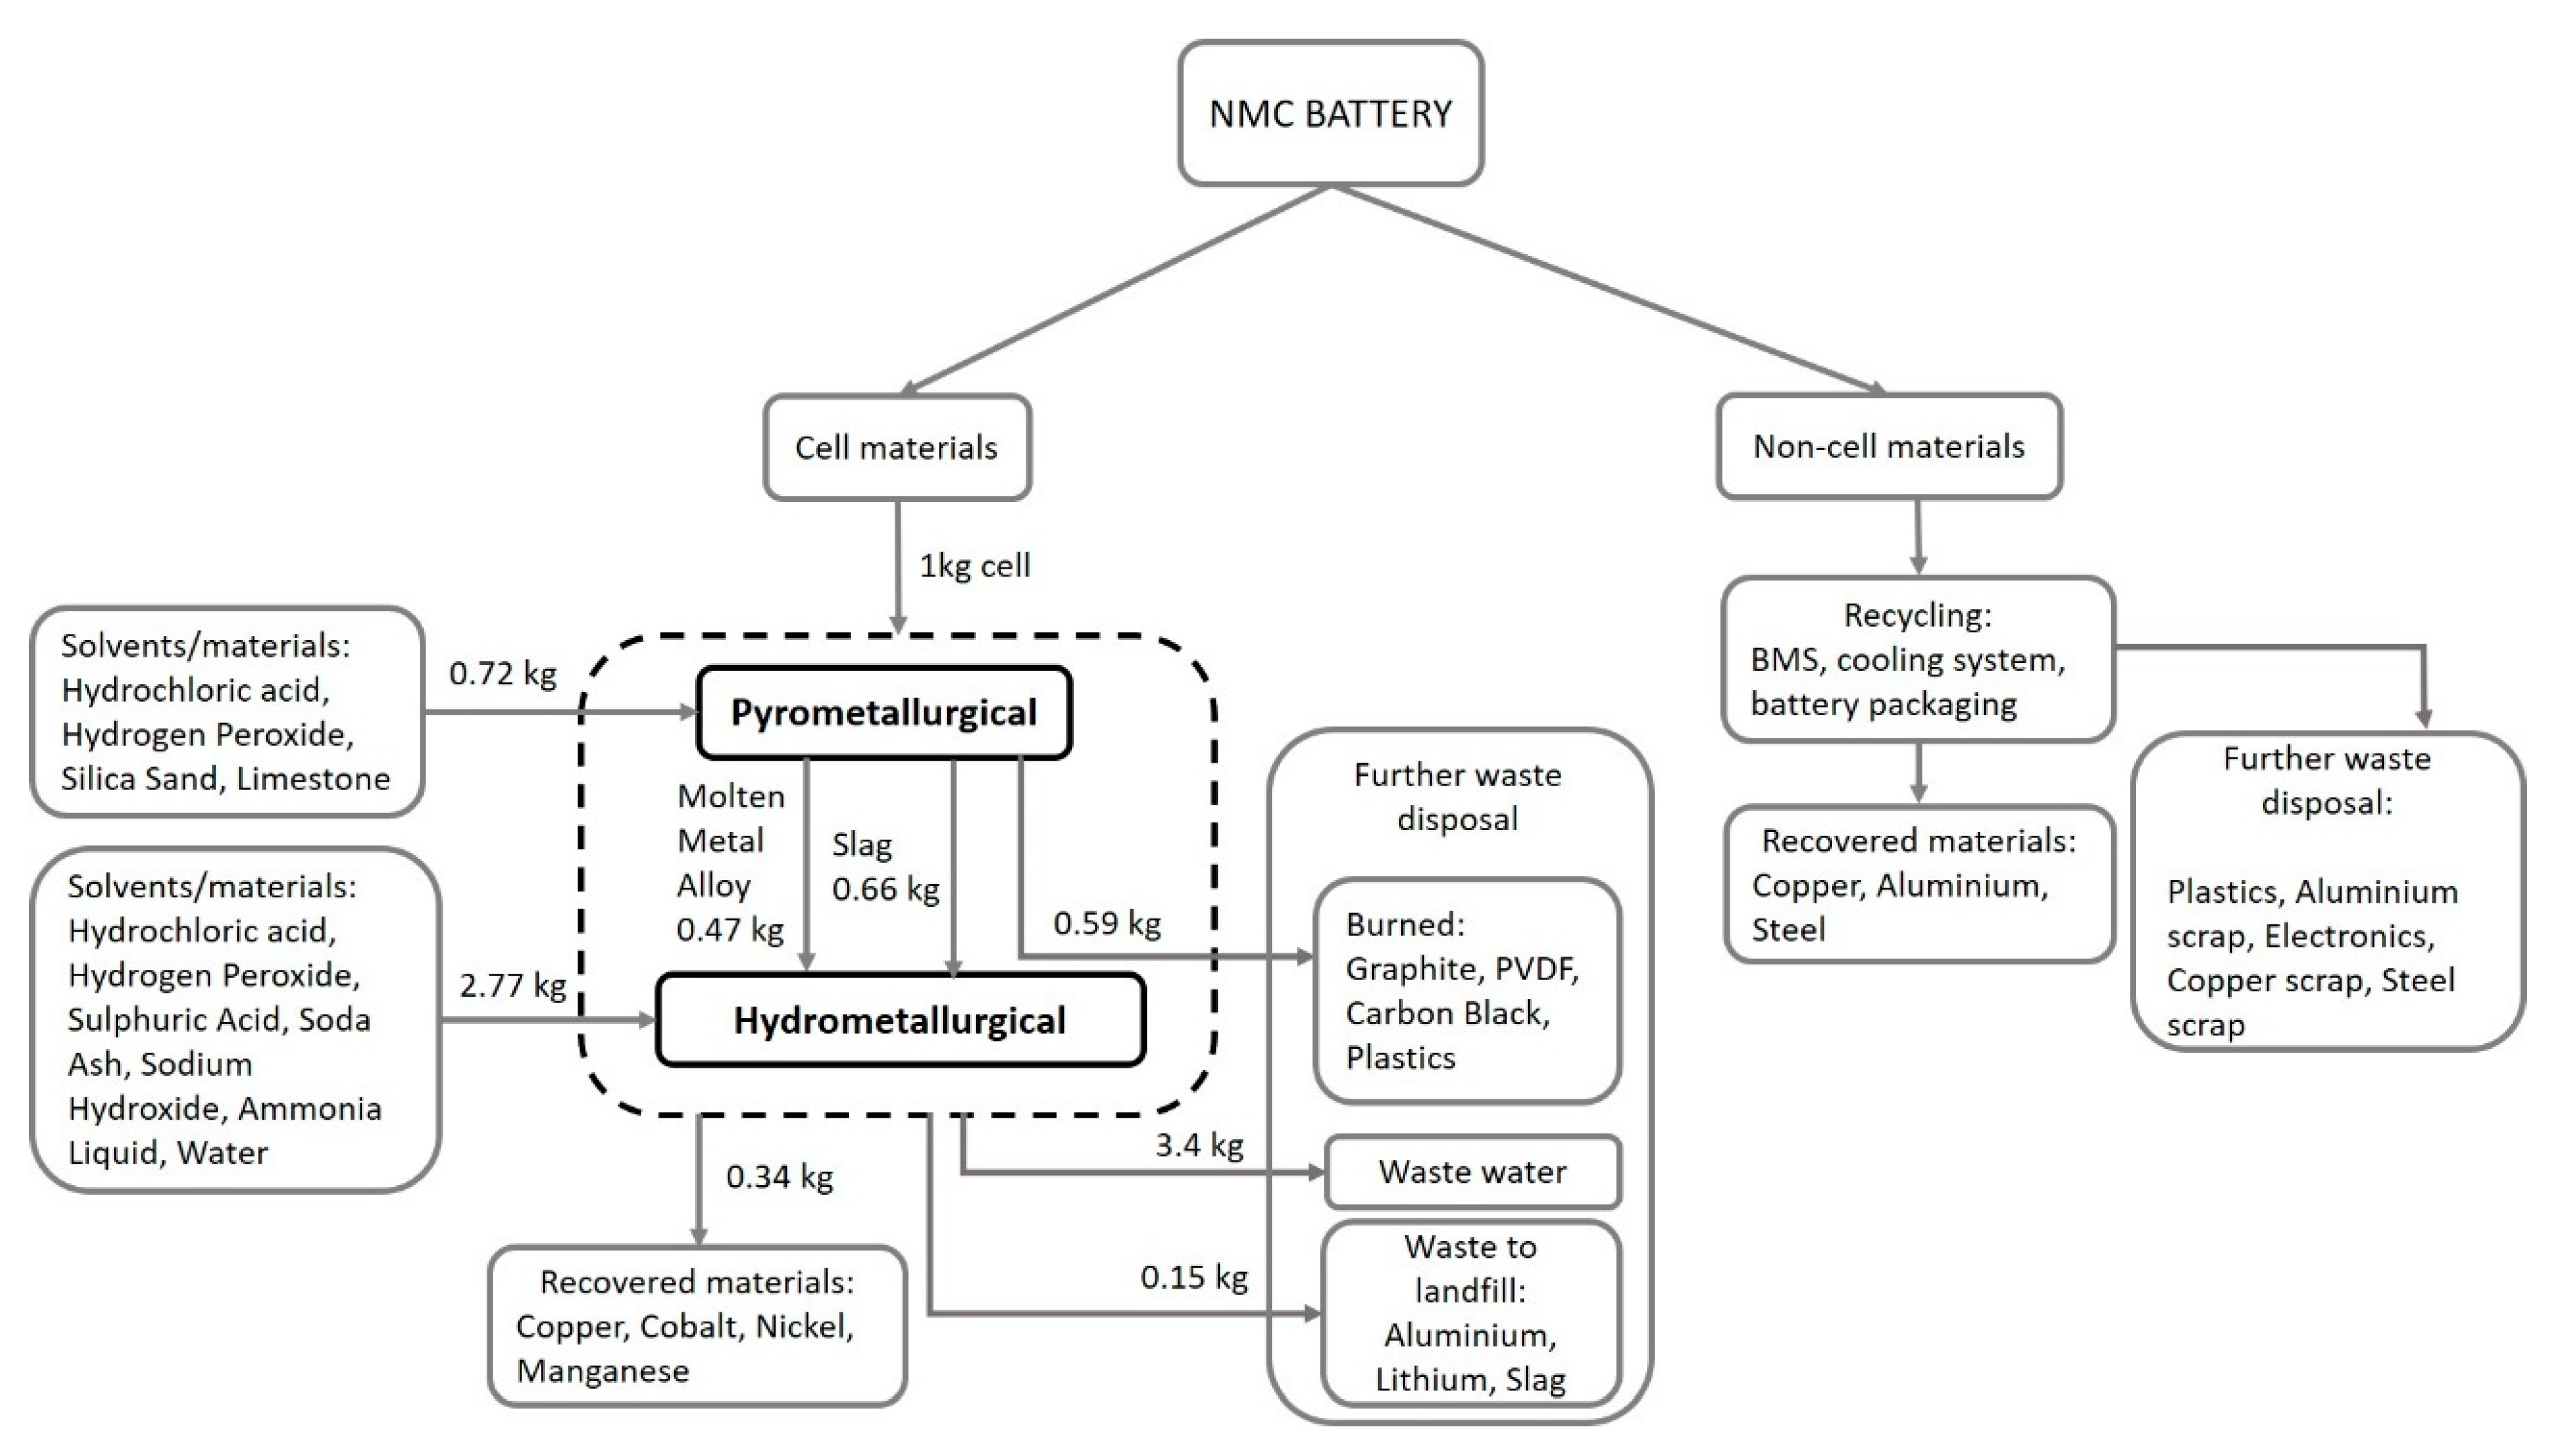
  • The recycling phase of the battery components has been analysed, as recommended in the PEFCR on batteries [26], i.e., by modelling the Pyrometallurgic and Hydrometallurgical recycling processes in cascade. These two processes are usually presented in the literature as alternative options for the recycling phase.
  • An application to electric LDCVs for urban and regional freight haulage has been analysed; most of the papers in the literature have instead focused on passenger cars.
  • The energy consumption and emissions from the vehicle use phase have been calculated by means of a backward-facing model of the case-study LDCV.
  • A total of 12 impact categories (listed in Section 2.1.5) have been analysed in the paper. These categories include the global warming potential and Energy Demand, which are the only impact categories that have usually been addressed in most of the studies in the literature.

2. Materials and Methods

Life Cycle Assessment (LCA) is as a well-established tool that is used to analyse the environmental impacts of products, services, and technologies [25]. It quantifies all the relevant emissions and resources consumed, the related environmental and health impacts, and the resource depletion issues that are associated with any goods or services [36]. ISO 14044 Environmental management-Life cycle assessment-Requirements and guidelines is the cornerstone standard on how to conduct an LCA [37].
The original LCA contribution of the present study is that it refers to a 35-kWh NMC111 battery pack for a BEV-LDCV.
LCA is structured in four phases that are here explained in the following sections: goal and scope definition, life cycle inventory, life cycle impact assessment, and interpretation.

2.1. Goal and Scope

The main goals of this LCA have been to establish the potential life cycle environmental impacts of an NMC111 battery pack and to compare the impacts of an electric LDCV, equipped with such an energy storage system (NMC-BEV), with those of the same vehicle equipped with a ZEBRA battery (ZEBRA-BEV). The assessment of the NMC battery type has included all the life cycle phases (End-of-Life and Use phase included) and different impact categories.
Finally, these two electric BEVs have been compared with the same LDCV equipped with a diesel ICE powertrain (DIE-ICEV) in order to evaluate the potential benefits achievable with the electrification of the vehicle. It is worth recalling that diesel ICE and ZEBRA battery electric vehicles had already been analysed in a previous paper by the authors [35]. The previous analysis has been updated to Ecoinvent version 3.6 for the present study.
Since the scope of an LCA should be clearly defined to ensure that the breadth, depth, and detail of the study are compatible and sufficient to address the stated goal (ISO14040), the main items of the scope are reported hereafter.

2.1.1. Product Characterisation: the NMC111 Battery

The electric vehicle analysed in this study is equipped with an NMC111 battery made up of 192 cells. Each battery cell has a cathode composed of LiNi0.33Co0.33Mn0.33O2, with the same molar ratios as Nickel, Manganese and Cobalt, and a graphite anode. The weight and the energy capacities of a single battery pack are 226 kg and 35 kWh, respectively. The main characteristics of the NMC111 battery pack are reported in Table 1. The primary data for this battery (i.e., numbers of cells and units, as well as the nominal voltage and available energy of the cell) were provided by the vehicle manufacturer.
Each ZEBRA battery pack is characterised by 266 kg and 32 kWh of storage capacity and contains 144 cells. The ZEBRA battery and its model have already been described in [35]. Therefore, only the NMC111 model created by the authors of this study is analysed in the following sections.
In the manufacturing and End-of-Life (EoL) stages, the materials and components required for the NMC battery are grouped into cell materials and non-cell materials. The cell components are made up of the electrodes, the separator, the electrolyte, and the cell container, while the non-cell components refer to the Battery Management System (BMS), cooling system, and battery packaging.

2.1.2. Functional Unit and Reference Flow

The functional unit defines the quantification of the function of a product. As defined in ISO14040, the primary purpose of a functional unit is to provide a reference to which the inputs and outputs are related, and this reference is necessary to ensure comparability of the LCA results.
The functional unit of the battery is 1 kWh of nominal energy capacity of the battery pack. The impacts are also reported, per unit mass of the battery pack (kg), for better usability and comparison purposes with other studies, in the supporting material section.
As far as the vehicle is concerned, the functional unit is the delivery service, and the reference flow is one km of the delivery mission. The delivery service includes a trip from a warehouse to distribution locations and back to the warehouse [35].
As this study concerns a high lifetime product, the life span of the vehicle has been considered equal to 240,000 km. No battery replacement has been considered. Detailed information on how the vehicle was modelled in our study is available in [35].

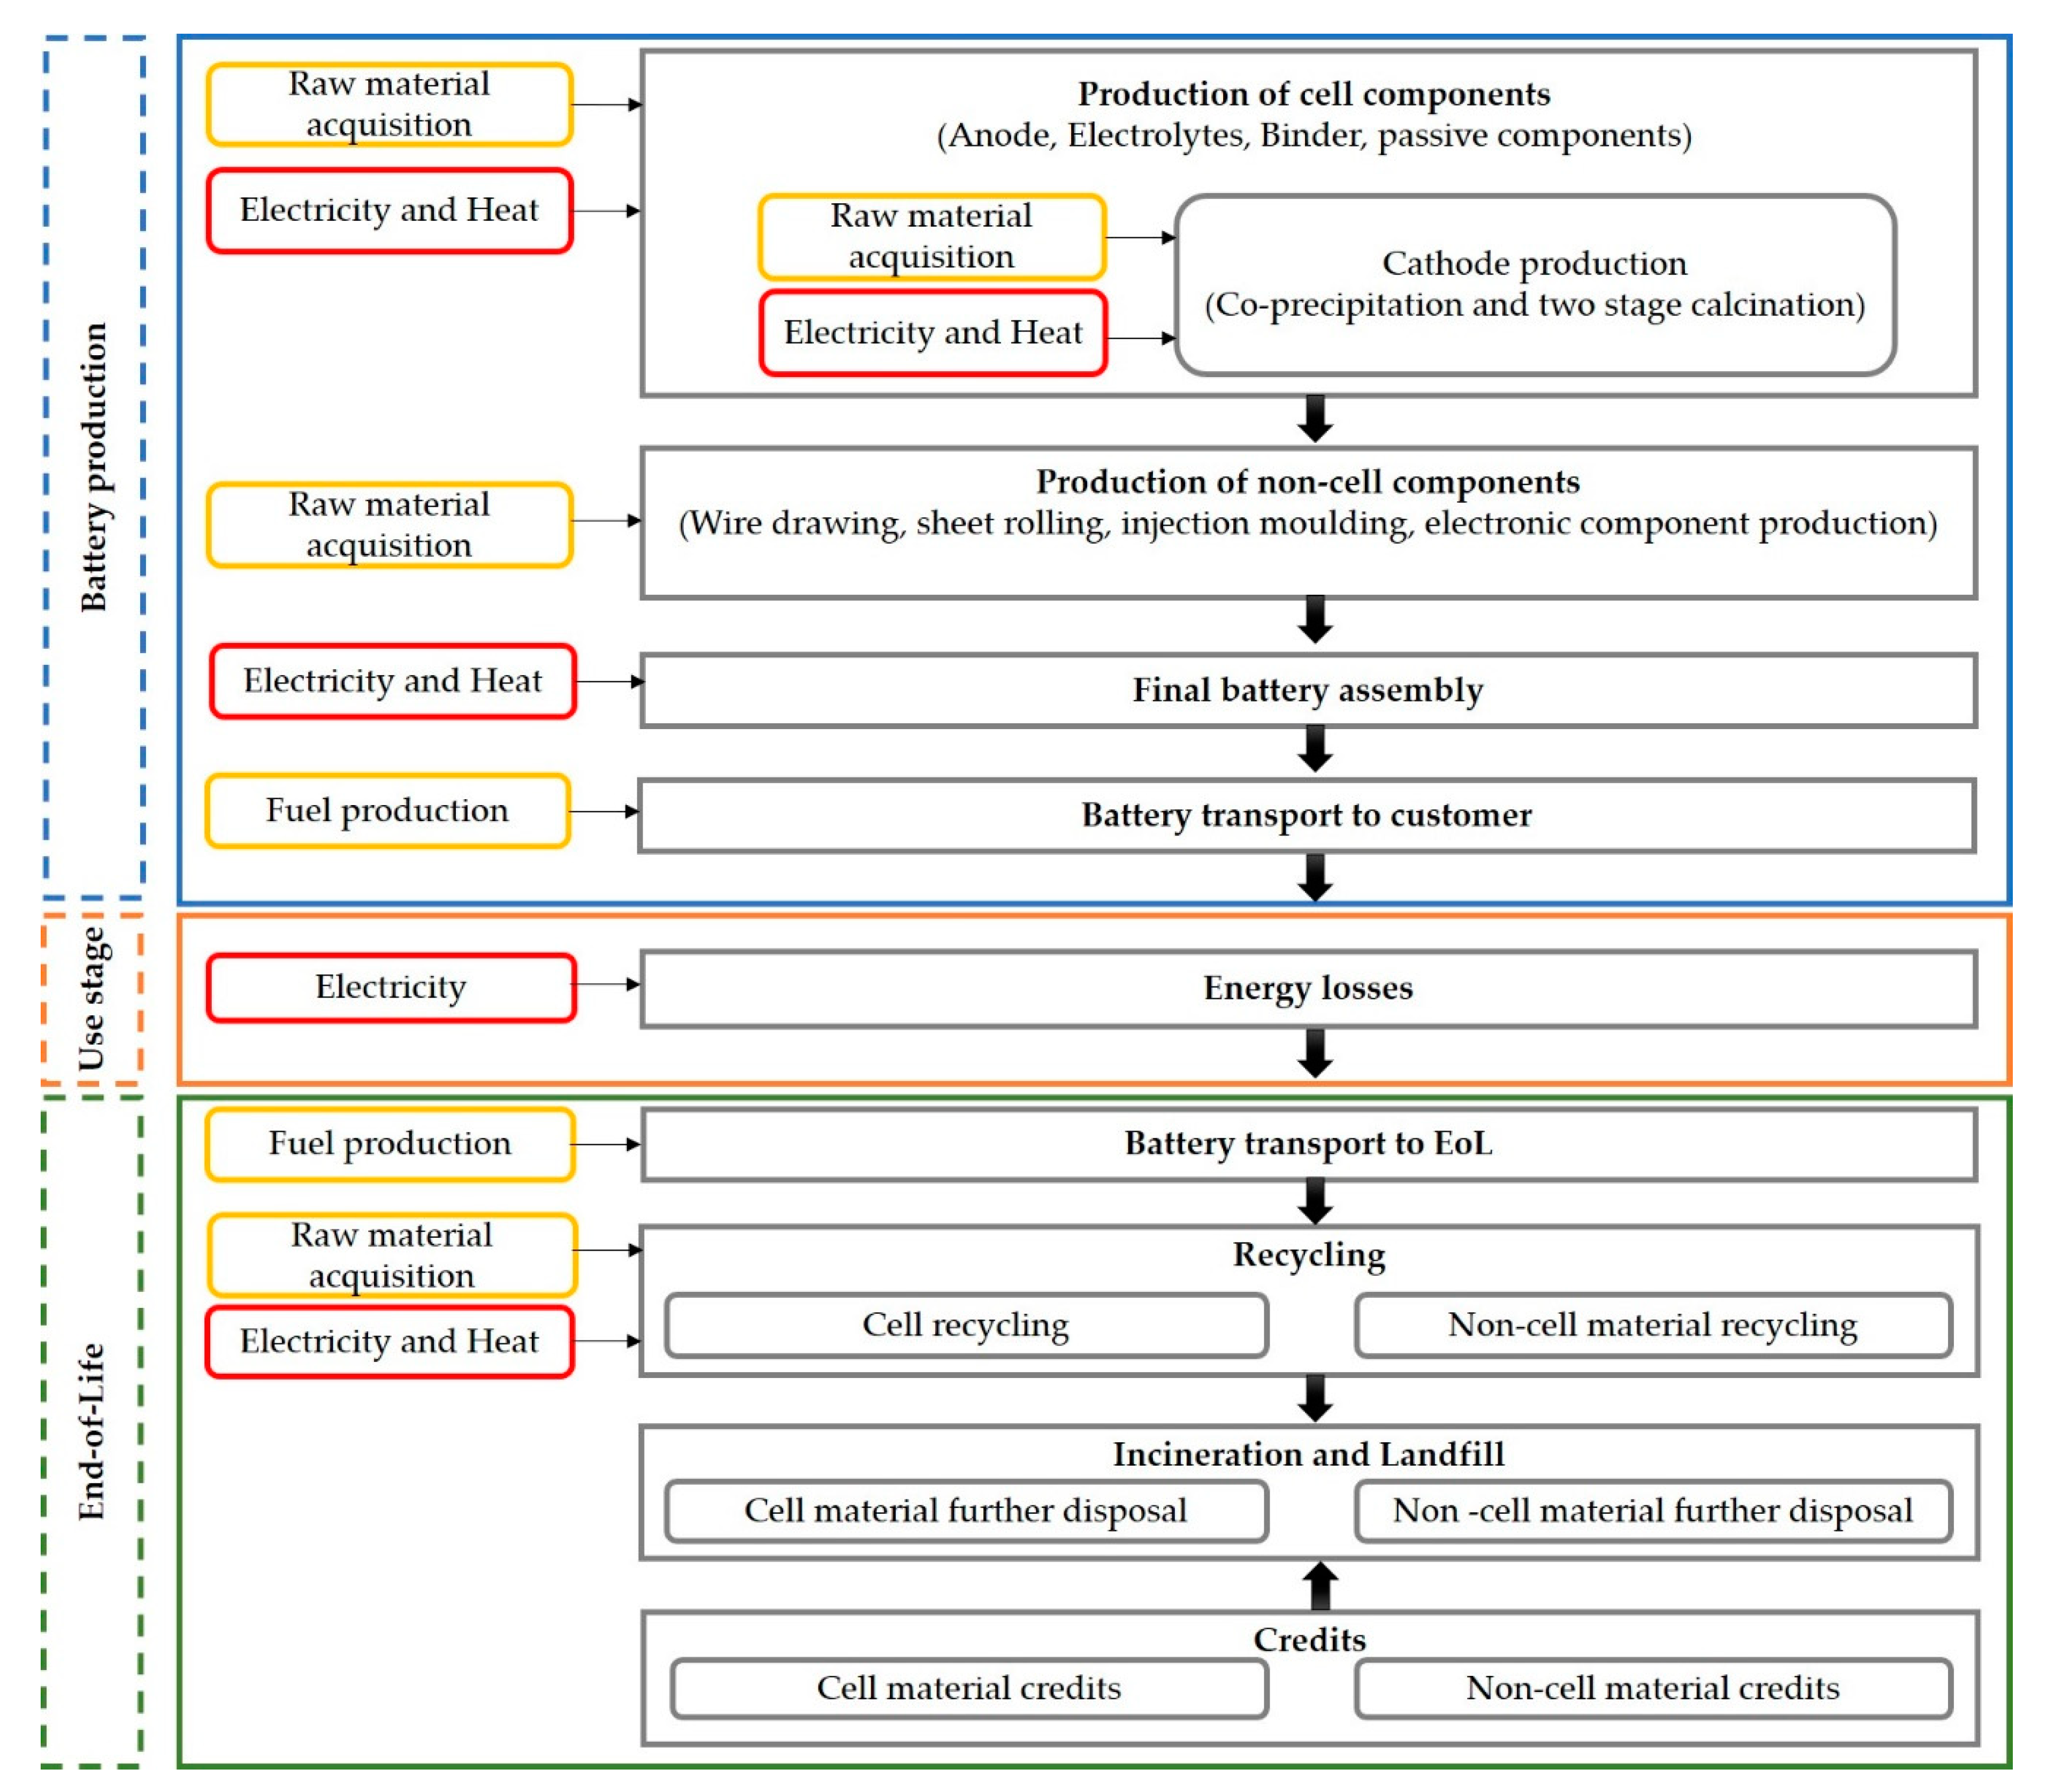
2.1.3. System Boundary and Data Sources

The system, with regards to the vehicle, ranges from the production of the components to the use phase (system boundary scheme as in [35]). The EoL phase of the vehicles has not been included here and will be discussed in detail in a separate paper. Information about the production materials of the vehicle and energy was taken from the primary data, whereas the vehicle use phase was evaluated using an ad hoc developed backward-facing simulation approach [35] that takes the longitudinal dynamics of the case-study LDCV into account. Additional details about this approach are given in Section 2.2.2.1.
The assessment of the NMC111 battery involves a cradle-to-grave assessment. The system definition covers the whole production chain, the use phase and the EoL (Figure 1). The NMC production stage includes the raw material supply, component production, cell and pack battery assembly, transport, and infrastructure. The bills of the materials and energy required for all the LCA stages of an NMC111 battery were determined on the basis of literature references and laboratory tests, as specified in Section 2.2. The specific emissions of each material and energy source were taken from the Ecoinvent 3.6 database.

2.1.4. Allocation and Multifunctionality

Allocation procedures are generally required when multiple products or coproducts are produced using the same process [34]. As there are no identified cases of coproducts in the battery manufacturing processes, no specific guidance is provided for allocation rules [26].
In the same way as for recycling, the battery product system is a closed-loop [23]. The 0:100 approach, with credits for avoided virgin material production, or the recyclability substitution approach, was therefore considered for the allocation of the EoL processes [39]. The approach assumes that the recycled materials produced at the EoL result in a benefit, as a result of the displaced virgin materials, which is eventually downgraded by a quality factor.

2.1.5. Impact Assessment

Such categories as global warming potential (GWP) and Cumulative Energy demand (CED) have been widely analysed in LCA studies. In this paper, we also had the aim of including other impact categories. The complete list of impact categories examined in this study is the following [34]:
  • Abiotic resource depletion potential (ADP)
  • ADP-fossil fuels (ADP-FF)
  • Global warming potential (GWP)
  • Acidification potential (AP)
  • Eutrophication potential (EP)
  • Ozone depletion potential (ODP)
  • Photochemical oxidation potential (POP)
  • Human toxicity potential (HTP)
  • Freshwater aquatic ecotoxicity potential (F-ECOTP)
  • Marine aquatic ecotoxicity potential (M-ECOTP)
  • Terrestrial ecotoxicity potential (T-ECOTP)
  • Cumulative Energy Demand (CED)
The abiotic depletion-fossil fuel potential is a measure of the potential for nonrenewable resource depletion during the production of a material or energy flow [34]. Air acidification causes increases in the acidity of soil and water, with the most visible manifestation being acid rain [34]. The Photochemical Oxidation Potential was added to evaluate the role played by air pollutants in photochemical pollution.
The midpoint indicator characterisation factors were taken from version 4.7 of the CML baseline method, published in August 2016, while the Cumulative Energy Demand was accounted for by referring to the CED method.

2.2. Life Cycle Inventory

Quantification of the life-cycle inventory (LCI) is the second phase of an LCA study: a product system is made up of the multiple processes needed to produce, use, dispose of, recycle, or reuse the product, and each process should include an inventory of the input and output flows [34]. A detailed description of the adopted LCI data collection methodology is reported hereafter.

2.2.1. Battery Production Phase

Automotive battery packs are commonly designed and manufactured in a pack–module–cell structure, in which cells can be clustered in modules [40], which can then be grouped into packs.
As far as the inventory of the battery pack is concerned, Argonne’s Everbatt closed-loop battery life-cycle model, published by the Argonne National laboratory, has recently been updated with primary data collected from large-scale commercial battery material producers and automotive LIB manufacturers [21]. The bill of materials (BOM) of the NMC111 battery was therefore derived from this model. An analysis (reported in Section 3.2) was conducted to evaluate the difference between NMC111 and two Nickel-rich cathode chemistries (NMC622 and NMC811). Again, in this case, the BOMs of NMC622 and NMC811 were derived from the Everbatt model. All three BOMs are reported in Table 2.
The NMC battery materials were divided into two groups (Table 2): the first one includes the materials of which the cells are made and the second one includes all the materials that complete the battery pack. As far as the energy demand for the production phase is concerned, the contributions for the cathode and cells were taken from [23] (see Section 2.2.1.1 and Section 2.2.1.2 for details), whereas those for non-cell materials were estimated on the basis of [22] (see Section 2.2.1.3).
As already mentioned, all the specific emissions were taken from the Ecoinvent 3.6 database.
Global average emissions were considered for the raw materials and for the heat involved in the NMC battery production phase.
Specific representative emissions of the Chinese national grid were used for electricity. In fact, even though there are over 200 LIB factories in operation around the world, since 2015, most of the production has been in China. Furthermore, although Nickel-Cobalt-Aluminium (NCA) cathodes are mainly produced in the United States and Japan, the global market leader for NMC cathodes is China, which changed its EV subsidies in 2017 to make NMC batteries eligible [41].

2.2.1.1. Cathode Production

The negative electrode of LIBs is primarily composed of graphite, although the mass share of active materials used in the cathode plays a significant role in determining the energy density of the cell [22].
The typical materials used for cathodes for NMC cells are produced through a two-stage process. In the first stage, an NMC precursor is produced. In the second stage, the precursor is treated, via calcination, with a Lithium compound.
The NMC cathode precursor production process begins with stoichiometric solutions of the substrates (NiSO4, MnSO4, CoSO4) reacting with hydroxide [15]. Once the substrates have mixed and dissolved completely, sodium hydroxide (NaOH) and ammonium hydroxide (NH4OH) are added to the solution. The reactor is then heated by steam to 50 °C and kept warm over a prolonged period of time, at the end of which Nickel, Manganese, and Cobalt coprecipitate as (Lia-NixMnyCozO2). The solid NMC(OH)2 is then filtered out, washed and dried to produce the NMC precursor [38]. The dried powder is then mixed with Lithium carbonate Li2CO3 and calcined to produce the desired oxide [15]. The complete LCI is reported in Table S1.

2.2.1.2. Battery Cell Production

The Argonne National Laboratory adopts a prismatic pouch cell structure in Everbatt. The pouch is made of a tri-layer polymer/Aluminium material. Aluminium and Copper foils serve as the current collectors at the cathode and anode, respectively [42].
The anode is typically composed of graphite and a PVDF binder [22]. To ensure the absence of any oxygen impurity in the graphite, it is baked at 1100 °C in an inert or reducing atmosphere [22]. The polymeric binder material holds the active material particles together, and a porous membrane separates the two electrodes [42].
The pores of both this separator and the active materials are filled with an electrolyte, modelled as LiPF6 (Lithium hexafluorophosphate). The NMC solvent N-methyl-2-pyrrolidone (NMP) was added to the mixture and then evaporated after the paste had been applied to the substrate [22].
The complete inventory of this process is shown in Table S2.

2.2.1.3. Production of the Non-Cell Materials

This inventory (Table S3) regards the production of the cell containers, separator, BMS, cooling system, and final packaging. The fundamental role of the separator is to prevent the two electrodes from touching, while allowing the electrons in the electrolyte to flow with as little resistance as possible [22]. The BMS allows battery cells to operate within safe parameters. It includes electronic boards, fasteners, and high- and low-voltage systems. The cooling system ensures that the battery cells work over a safe operating temperature range. Finally, the battery packaging serves as a structural support [43]. Given the uncertainty in the literature on the subdivision of materials that are not part of the cell, it was decided to treat these components as a single group.
Everbatt only provides the BOM for non-cell materials, and the non-cell material LCIs were therefore modelled according to the study conducted in [22]. The container production was inventoried with Aluminium and Steel sheet rolling as a proxy. Plastics are usually the dominant material in modules and battery packs, since they are resistant to corrosion, inexpensive, and light [22]. Polyethylene terephthalate (PET) was considered for plastics, and injection moulding was used as a proxy to model the processing of the PET [22]. The BMS impacts on the overall battery life-cycle were estimated, assuming that the BMS components had a similar mass share to that of the Power Supply Units of desktop computers, through a similar approach to that used in [42]
Finally, the amount of energy (electricity and heat) required to complete the manufacturing of the battery pack was derived from the total amount of energy required to manufacture NMC, as estimated in [22] (Details can be found in Section 1.1.4 of the Supplementary Materials).

2.2.2. Use Phase

2.2.2.1. Vehicle Use Phase

The emissions and consumptions of a vehicle depend to a great extent on the vehicle typology and the driving mission. In this study, the tailpipe emissions and fuel consumptions have been evaluated using an ad hoc developed backward-facing simulation approach [35] that takes the longitudinal dynamics of the case-study LDCV into account and estimates the efficiency of the diesel ICE, electric machines, the power converter, and transmission components on the basis of experimentally derived look-up tables provided by the manufacturers. Using such an approach, the ZEBRA and NMC batteries were modelled by means of an equivalent resistance circuit, in which the resistance and the open-circuit voltage of the battery were SOC-dependent, on the basis of experimental data provided by the manufactures. This approach was also used to estimate the CO2 and pollutant emissions for the diesel LDCV [35].
A conventional version of an LDCV and two electrified versions, equipped with NMC111 and sodium-ion ZEBRA batteries, respectively, have been studied. The vehicle lifespan considered in all the simulations was 240,000 kilometres. The main characteristics of the considered LDCVs are presented in Table 3. The different kerb weights for the two electric vehicles are related to the different chemistries of the batteries. ZEBRA-BEV was equipped with two battery packs [35]. A two-battery pack configuration was selected for the NMC-BEV in order to have a total battery capacity as close as possible to that of the ZEBRA vehicle. An additional configuration of NMC-BEV with three battery packs was also considered, and the results are presented in the result section. This configuration is characterised by a larger total battery capacity (105 kWh), i.e., an extended driving range and a slightly higher kerb mass (3185 kg) than the ZEBRA vehicle.
The driving cycle was chosen to represent a typical urban delivery mission of the LDCV. First, the LDCV was driven along an AUDC and then along an URBAN driving cycle with 50% of its maximum payload [35]. The AUDC + URBAN driving cycles were then repeated with no payload. This mission is called M1 in this paper. The AUDC and URBAN driving cycles in Table 4 are characterised by means of suitable metrics: duration, length, average (V-tract) and maximum speed (V-max). In addition, the table also reports the main energy performance of the LDCV for each driving cycle in running order: Specific Energy Consumption (SEC) for both traction (tract) and braking (brake), as well as the average power required for traction at the wheel level (P-tract).
Table 5 shows the fuel and energy consumption values calculated for the individual cycles. The value for mission M1 is shown in the final row.
BEV vehicles have zero CO2-ttw emissions, as there is no internal combustion engine on board. Moreover, it can be observed that the electrified vehicles have lower energy consumption values than conventional ones. This is due to the increased energy efficiency of the battery and electric motor. In addition, BEV models can recover part of the braking energy and store it inside the battery, which of course is not possible for a conventional vehicle.
The NMC111 battery has a lower energy consumption value than the ZEBRA ones. This can be ascribed to the fact that the ZEBRA battery requires an internal temperature of 270 °C to 350 °C for correct operation [35]. This requirement introduces a thermal flow through the battery when it is not working, which partially decreases the state of charge of the battery.

2.2.2.2. Battery Use Phase

The use stage has been managed according to the PEFCR [26] and thus considers the amount of electricity lost during the recharging phase over the lifespan of the battery.
Since no battery replacement is considered, the lifespan of the battery corresponds to the lifespan of the vehicle, which is equal to 240,000 km. The M1 mission (see Section 2.2.2.1) is considered to be representative of LDCV operation throughout its whole lifespan, and the average energy consumption is therefore calculated for M1 missions and then multiplied by the vehicle lifespan. The obtained value corresponds to the energy that the battery delivers in its life cycle, which is called “Application Service Energy” in what follows, according to nomenclature used in [26].
The energy losses are calculated as [15]:
L o s s e s = ( 1 e n e r g y   e f f i c i e n c y ) ( A p p l i c a t i o n   S e r v i c e   e n e r g y )
where “energy efficiency” includes the charge and battery losses [26]: the default data reported in [26] for the different battery types were used.
Specific representative emissions of the European grid were used in the Ecoinvent 3.6 database to estimate the impact categories, since the LDCV case study was mainly developed for the EU market.

2.2.3. End-of-Life

The impact of the EoL stage on both the cell materials and the non-cell materials was divided into three parts: Recycling (impact of the recycling process), Credits (savings obtained by replacing part of the virgin materials with recovered ones), and Further waste disposal (impacts necessary to complete the disposal of nonrecycled materials). It was assumed that the EoL phase occurred in Europe, and the average European electricity mix was therefore used.
Everbatt reports material and energy flows for both pyrometallurgical and hydrometallurgical recycling processes, with regards to the recycling of cell materials, but the two processes are modelled as alternatives. In this work, battery cell recycling was modelled through a combined recycling process (Figure 2), which is in line with the recommendations of PEFCR on rechargeable batteries [26]. In other words, the cells first underwent a pyrometallurgical process, and the metal alloy and slag obtained as outputs were then treated again through a hydrometallurgical process to extract valuable metals. The inventories for the pyrometallurgical and hydrometallurgical treatments were taken from the Everbatt model but adapted by the authors to this new approach. Further details are reported in Section 2.2.3.1, recycling of the cell materials.
The “Credits” for cell materials are due to the recovery of Nickel, Manganese, Cobalt, and Copper, whereas “Further waste disposal” quantifies the impact due to the wastewater treatment, incineration of Graphite, PVDF, Carbon black and Plastics, and the landfilling of Aluminium, Lithium, and the remaining slag.
The EoL, with reference to the non-cell materials, included the “Recycling” of BMS, the cooling system, and battery packaging, “Credits” for recovering Copper, Aluminium and Steel with appropriate recovery rates, and “Further waste disposal” to quantify the impact due to the treatment of the remaining nonrecycled materials. Further details are reported in Section 2.2.3.2 “Non-cell materials-EoL”.

2.2.3.1. Recycling of the Cell Materials

In the Pyrometallurgical process, batteries are fed to a furnace where they are smelted. This high-temperature process recovers an alloy of Co, Cu, Ni, and Fe [9] but does not allow graphite, electrolyte, and plastic materials (because they are burned), Aluminium (because it is oxidized), or Manganese to be recovered. However, Lithium exits from the furnace in a slag, along with Aluminium, because the recovery of Lithium is currently not economically viable [9]. The fate of the cell materials is detailed in Table S5.
The recycling process inventory is reported in Table S6. The required feed materials and energy for Pyrometallurgical and Hydrometallurgical processes are listed separately.
Since Everbatt provides the two Pyrometallurgical and Hydrometallurgical processes as alternatives, the amounts of materials and energy associated with the Hydrometallurgical process were adjusted, taking account the molten metal alloy resulting from the Pyrometallurgical step to model the process in cascade.

2.2.3.2. Non-Cell Materials-EoL

The inventory proposed in [43] was applied to model the recycling of non-cell materials. In other words, the recycling processes of the BMS, cooling system, and battery packaging were modelled taking into account the energy required for both the preparation of the Aluminium, Iron, and Copper scraps for recycling and the energy required to recycle each recoverable fraction.
The amounts of recovered materials were assessed considering the recovery rates R2 reported in PEFCR for rechargeable batteries [26]. According to this PEFCR, R2 is the proportion of material in the product that can be recycled (or reused) in a subsequent system. The suggested R2 values for Copper and Aluminium are 90%, whereas the R2 for Steel is 85%. The remaining parts of Copper and Steel were modelled according to the specific Ecoinvent “Market for scrap”, while the remaining Aluminium was considered to be sent for landfilling. In the case of PET, R2 was assumed equal to 0, whereas the electronic scrap and plastic materials were considered waste suitable for further treatment [26].
PEFCR also provides the Qsout/Qp rate (ratio between the quality of the outgoing secondary material and the quality of the primary one) for all the materials, and this is equal to 1 for metals. The inventory is reported in Table S7.

3. Life Cycle Impact Assessment: Results and Interpretations

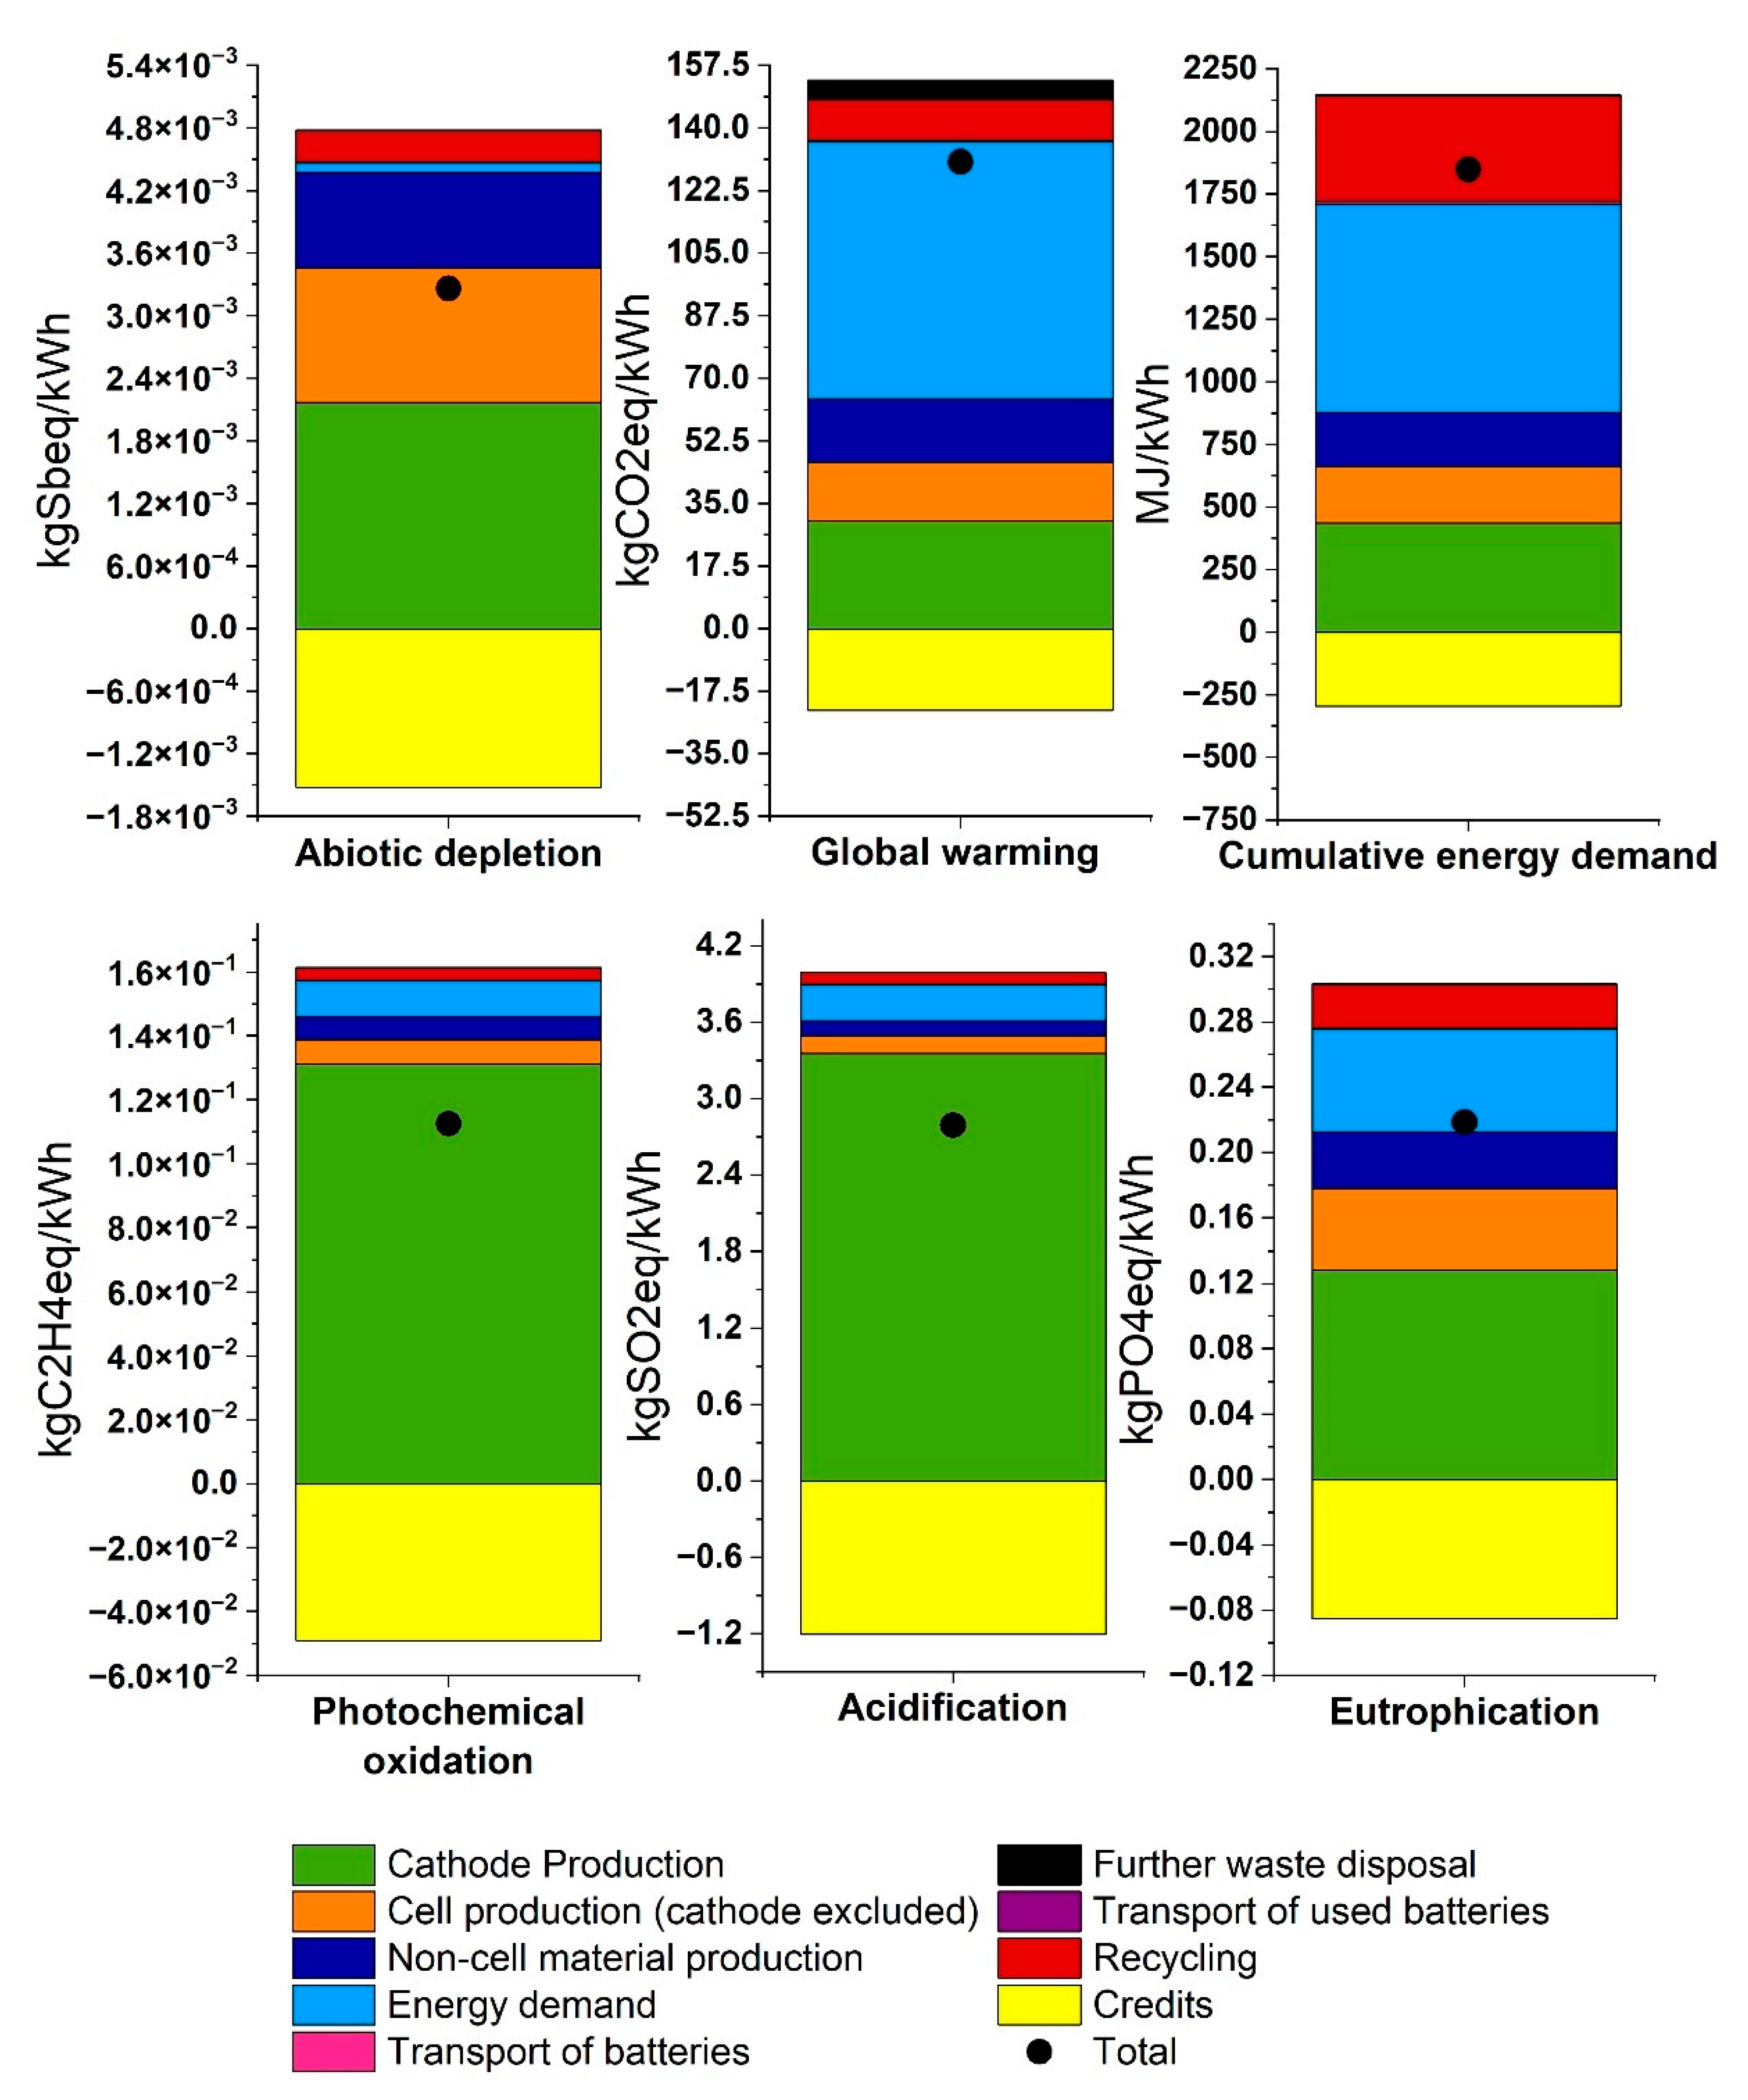
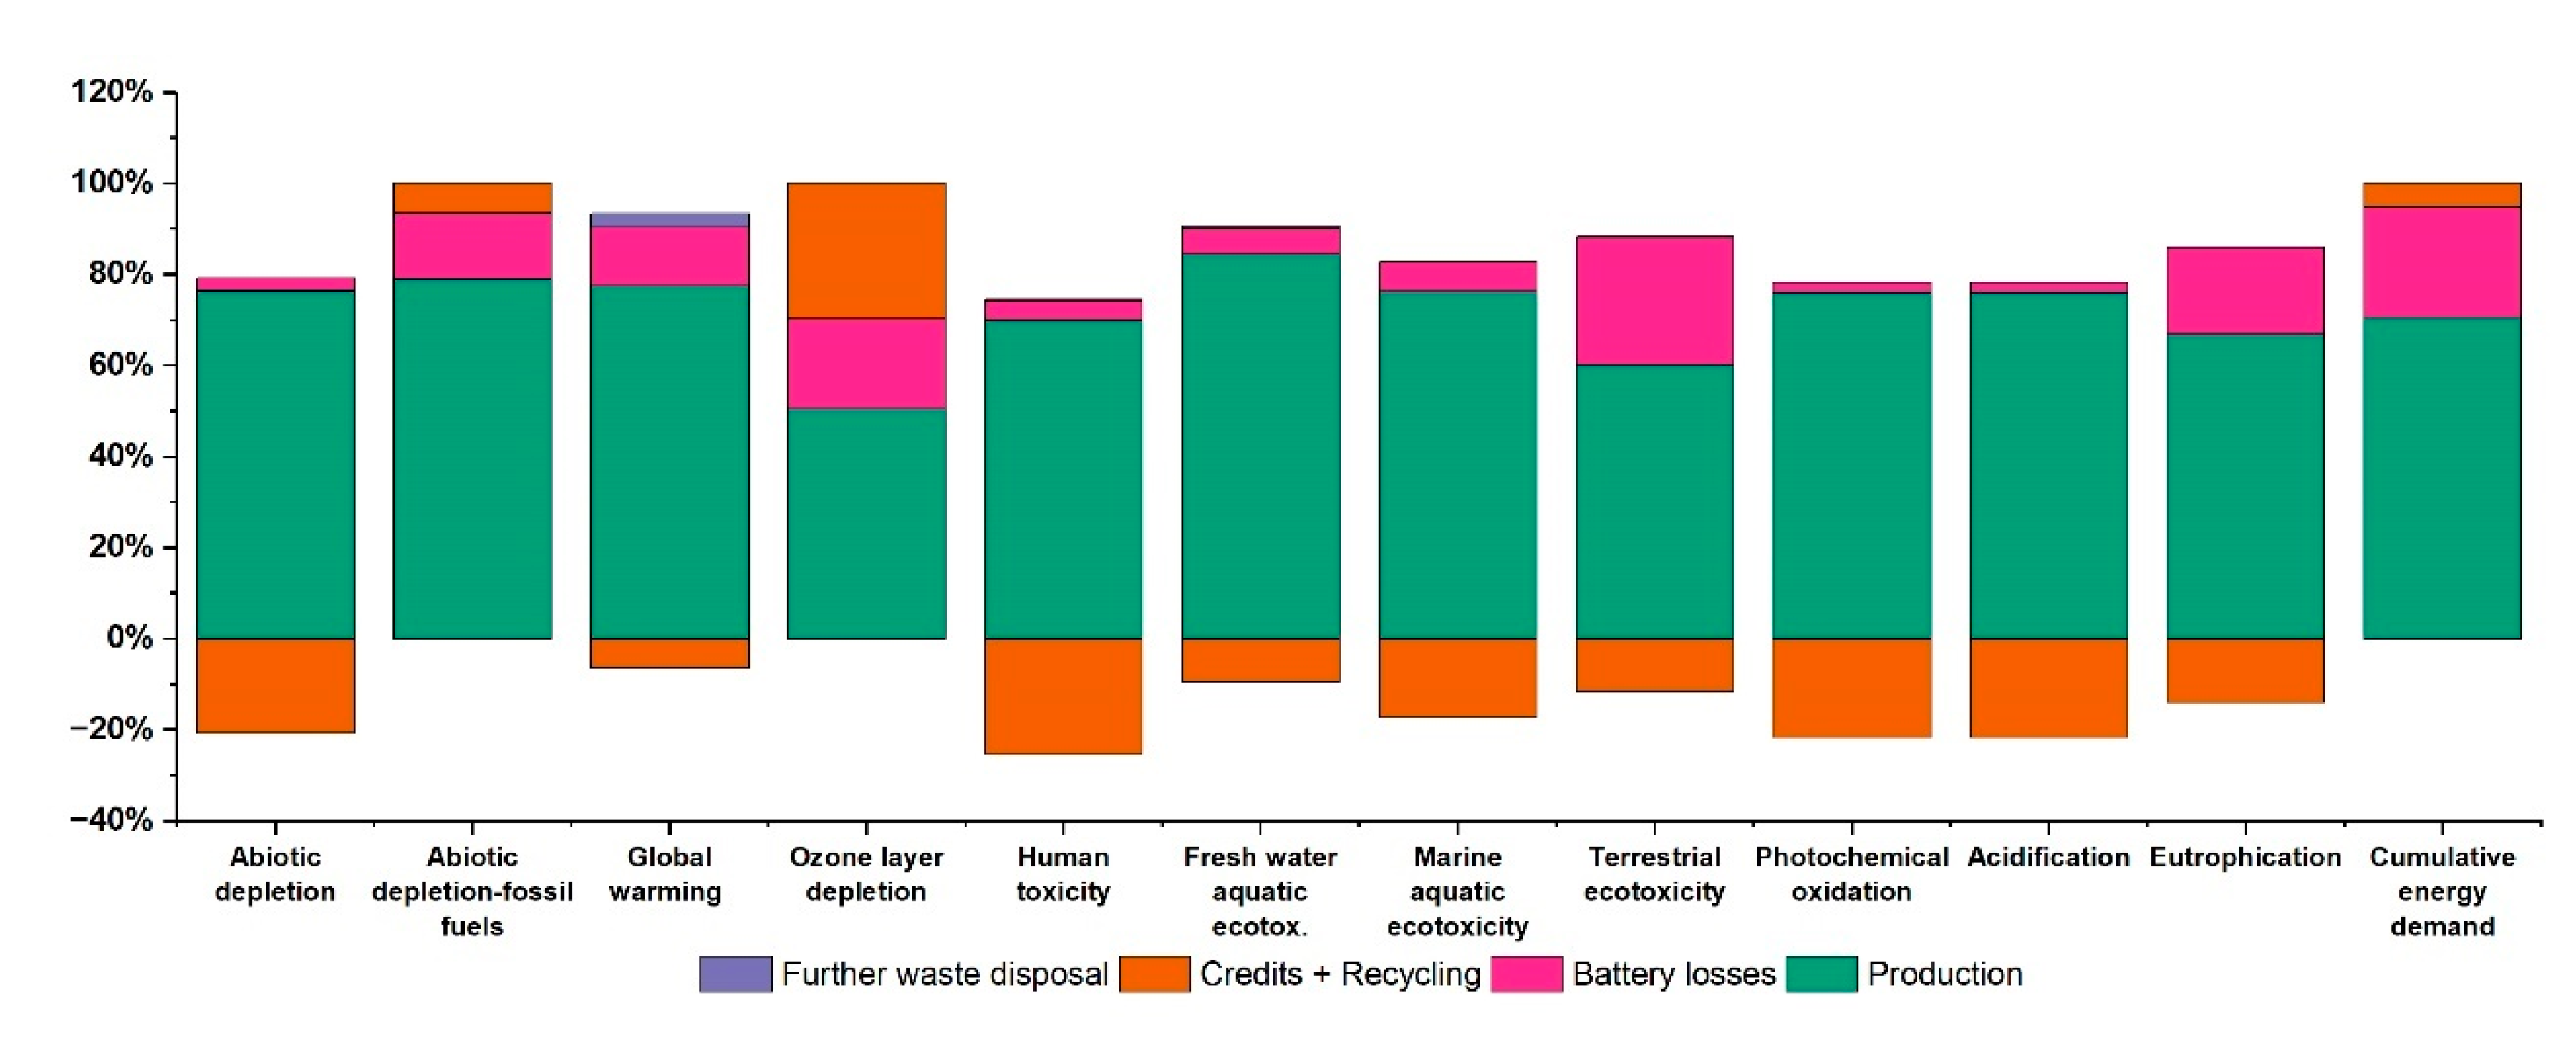
3.1. NMC Battery Impact Assessment

The life cycle impact assessment (LCIA) of the NMC battery described in the previous sections is reported in Figure 3 and Figure 4 per 1 kWh of the battery pack.
Figure 3 shows the contributions of battery production and EoL to LCIA for the selected impact categories (abiotic resource depletion potential, global warming potential, cumulative energy demand, photochemical oxidation potential, acidification potential, and eutrophication potential).
Since the production of cathodes is a key driver of LIB cradle-to-gate impacts [9], the impact due to cathode materials is reported separately in this figure. In particular, battery production is split into the production of the cathode (green bars), of the battery cell, excluding the cathode (orange bars), and of the non-cell materials (dark blue bars), along with the contributions of battery transport from the manufacturing plant to the customer (magenta bars). The total energy required for the manufacturing (of the cathode, cells, and the final assembly) is reported as a distinct contribution (light blue bars). Detailed results of all the impact categories are reported in Tables S9–S17.
The battery EoL includes the impact of both the cell and non-cell materials divided into three parts: for recycling (red bar), for further disposal (black bars) to quantify the impact due to the incineration and landfilling of materials, and environmental credits (yellow bars, negative values) in order to avoid the production of primary materials. The contributions related to the transport of used batteries to the recycling plant is also reported (purple bars). Detailed results of all the impact categories are reported in Table S19 (cell materials-EoL), Table S21 (cell material recycling) and Table S23 (non-cell materials -EoL).
The solid black circles in Figure 3 indicate the net impact of each category (i.e., environmental credits are taken into account).
Figure 3 shows, with reference to the Abiotic Depletion Potential (ADP), that the main impacts are related to cathode production (green bar, 69% of the total cathode production impact results from the extraction of Nickel) and cell production (orange bar, mainly because of Copper extraction). It is worth pointing out that the credits (yellow bar) have an important impact (−24%), which is mainly due to the avoided extraction of raw materials for the cell.
The main contributor to the global warming potential (GWP) is the total energy required for the manufacturing (light blue bar). This is mainly due to the production of the cathode, electrolyte, and battery pack. The percentage of the GWP impact attributable to the cathode is substantial, because of the extraction of Nickel and Cobalt. The main contributor, at the cell level, is Aluminium extraction. These outcomes are in line with other studies in the literature [34]. Considering the EoL stage, the main contributor is the recycling process (red bar), followed by further waste disposal (black bar). Sodium Hydroxide, Hydrogen Peroxide, Diesel oil, and the Electricity consumed during the process all contribute in nearly the same manner to the recycling process, whereas the incineration of graphite and carbon black are the main contributors to further waste disposal. It is worth noting that the GWP estimates depend to a great extent on the chosen electricity mix. As already mentioned, the case study assumes that the battery production occurs in China, whereas recycling is assumed to take place in Europe. The resulting GWP for the production and EoL phases is equal to 20.2 kgCO2/kgbattery-pack, including credits. If the battery production was moved to Europe, the electricity mix would change, and the transport logistics would be affected. By introducing these hypotheses into our LCA model, a GWP = 14.5 kgCO2/kgbattery-pack was estimated (a reduction of about 28% with respect to the case study).
As far as cumulative energy demand (CED) is concerned, recycling (red bar) plays the most important role after the energy required for manufacturing. The main contributor to recycling is the consumption of nonrenewable fossil fuels, with diesel oil consumption accounting for 68%. The cathode production stage (green bar) influences the CED result by 14%, partially because of the electricity demand and partially because of raw material extraction (especially Cobalt and Nickel). The main contributor among the non-cell materials (dark blue bar) is Aluminium extraction, whereas, in cell production (orange bar), Aluminium extraction, electricity, and heat are the primary contributors to CED.
The impact of Photochemical Oxidation (POP) is primarily attributable to the production of cathode materials (green bar). Aluminium extraction plays the main role in cell production (orange bar), whereas the credits (yellow bar) are mainly due to the avoided extraction of Nickel.
With reference to the Acidification (AP) impacts, the cathode is usually one of the most significant contributors to all battery chemistries [34]. In our study, it accounts for 63% of the total impact (green bar), mainly because of the upstream production of Nickel, which generates substantial Sulphur Dioxide emissions (94% of the cathode production impact) as a reaction by-product. The energy required for manufacturing (light blue bar) and cell material production (orange bar) are other significant contributors to AP. The main contributor to the latter is Aluminium extraction. Credits (yellow bar) involve a 30% saving of the total impact because of the avoided extraction of Nickel (87%).
Eutrophication (EP) is mainly affected by cathode production (green bar), because of the impact of Nickel (56%) and Cobalt (20%) extraction. The recycling process (red bar) accounts for about 6% of EP, mainly due to the use of electricity (41%) and Sodium Hydroxide (15%). Credits (yellow bar) significantly lower the total impact (−18%), because of the avoided production of Nickel, Copper and Aluminium.
Figure 4 reports a cradle-to-grave life cycle assessment of the NMC111 battery. The contributions to the LCA are split into production (cathode, cell, non-cell material, energy use, and battery transport from the manufacturing plant to the customer; green bars), further waste disposal related to the impact of incineration and landfilling of the materials (purple bars), environmental credits and recycling (orange bars), including collection and transport of the used batteries, and battery losses (magenta bars), estimated according to Section 2.2.2.2 “Battery use phase”. The results of each impact category are normalised so that the total height of each bar is equal to 100%.
As already mentioned, environmental credits are considered as negative contributions to the considered impact category, and the negative values of the orange bars therefore indicate that the environmental benefits derived from the credits overcome the burden of the recycling phase. The results in Figure 4 show that the orange bars are negative for all the examined impact categories, with the exception of ODP (as also reported in [43]), CED and Abiotic Depletion-Fossil Fuels (ADP-FF). This is mainly due to the use of diesel oil and sodium hydroxide in the recycling process.
The total life cycle environmental impacts and credits of all the impact categories examined in this study are also summarised in Table S8 (credits are presented as negative values), whereas Tables S19 and S23 report detailed EoL results of the cell and non-cell materials, respectively.
Overall, EoL produces environmental benefits that range from 3% to 25% of the total battery impact shown in Figure 4 for most of the considered categories. The highest benefits are shown for HTP (25%), POP (22%), AP (22%), and ADP (21%). However, the EoL stages increase the impact of ODP, ADP-FF, and CED by about 30%, 7%, and 5%, respectively.
In fact, at a cell level (Table S19), the combined effect of environmental credits and recycling results in a reduction in the impact for most of the considered categories (i.e., all the categories except CED, GWP, ODP, and ADP-FF). This has been achieved thanks to the adoption of the combined pyrometallurgical-hydrometallurgical recycling process described in Section 2.2.3, in which the environmental credits related to Cobalt, Nickel, Manganese, and Copper recovery result to be particularly significant. However, the environmental benefits of battery recycling could be further increased if other materials, such as graphite, electrolytes, Aluminium, and Lithium, were also recovered.
As far as the non-cell materials are concerned (Table S23), the environmental credits and recycling determine an impact reduction for all the examined categories. The impact reductions are mainly due to the energy consumption for ADP-FF (57%), ODP (59%), and CED (55%), whereas the preparation of Aluminium scraps for recycling is the main contributor to the reduction in impacts for all the other categories (51÷99 %).
It is worth pointing out that even though recycling tends to increase GWP at a cell level, recycling tends to decrease GWP at a battery-pack level, and the EoL stages globally improve the GWP impact by about 3%. This is due to the recycling of non-cell materials and points out the importance of increasing the recycling efficiencies and recycling rates of non-cell components.

3.2. Insight into the Life Cycle Assessment of Different NMC Chemistries

The upstream production of battery materials as a whole incurs more energy and environmental burdens than the cell production and pack assembly processes [21]. The most notable contributors are active cathode materials, Copper, Aluminium, and the energy demand. It seems reasonable to suppose that a change in the chemical composition of the cathode could lead to different LCA results.
Therefore, a study was made of the effect of the cathode chemistry by comparing the impacts of NMC111 with those of NMC811 and NMC622. The latter two represent the Nickel-rich cathode composition category, as can be inferred from their BOMs listed in Table 2. The comparison was conducted assuming that the three battery packs had the same energy capacity, that is, of 35 kWh, but different energy densities and thus different masses (e.g., NMC622 had the highest energy density and thus the lowest mass).
The comparison is reported in Figure 5 for the selected impact categories: GWP (Figure 5a), ADP (Figure 5b), POP (Figure 5c), and AP (Figure 5d). These categories were chosen since GWP is the most commonly used impact category and ADP represents resource exploitation, and it is linked to possible issues concerning the future demand for materials for batteries. POP and AP were chosen since their chemistries present significant differences. The contributions to the LCA were split following the same rationale already described in the comment to Figure 4. Solid black circles indicate the net impact of each category (i.e., environmental credits are taken into account).
GWP shows no significant difference between the NMC chemistries (Figure 5a). NMC111 is the most GHG intensive battery, whereas Nickel-rich batteries show slightly lower GHG emissions and higher recycling benefits. Moreover, NMC811 is slightly more GHG intensive than NMC622, because of the higher impact due to Nickel production. This in line with [44]. ADP shows a different trend and more significant differences (Figure 5b). Nickel-rich cathodes show a reduced ADP and greater benefits, linked to the amount of avoided Nickel production. Thus, although NMC622 is the least GHG intensive, NMC811 contributes less to abiotic resource exploitation. These results are in line with those reported in [45], where the comparison was carried out with the same energy density for the different cathode chemistries.
Both POP and AP show significant differences between the NMC chemistries (Figure 5c,d) and NMC811 shows the lowest impacts for both categories.
In what follows, the study only analyses the NMC111 battery that has been used to equip the case-study LDCV (NMC-BEV).

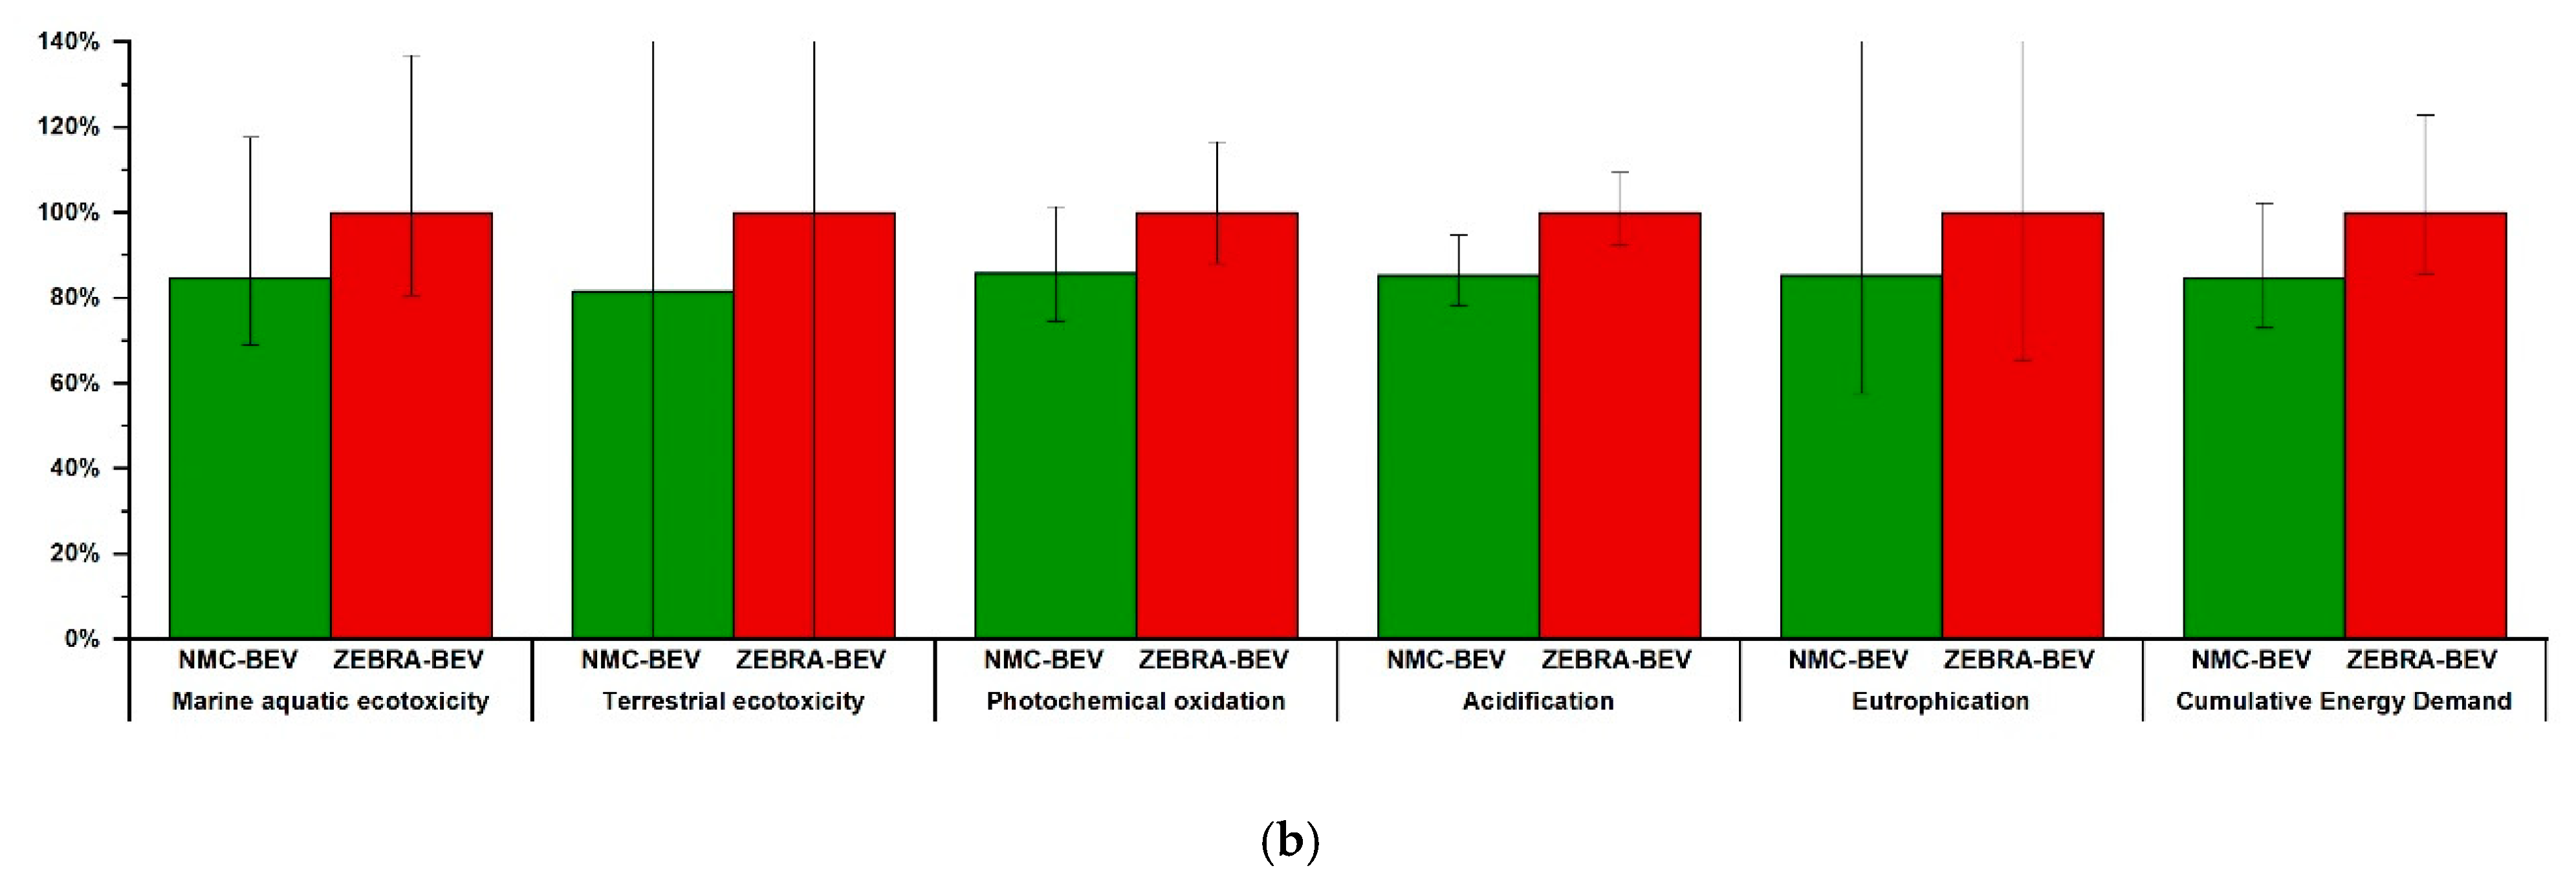
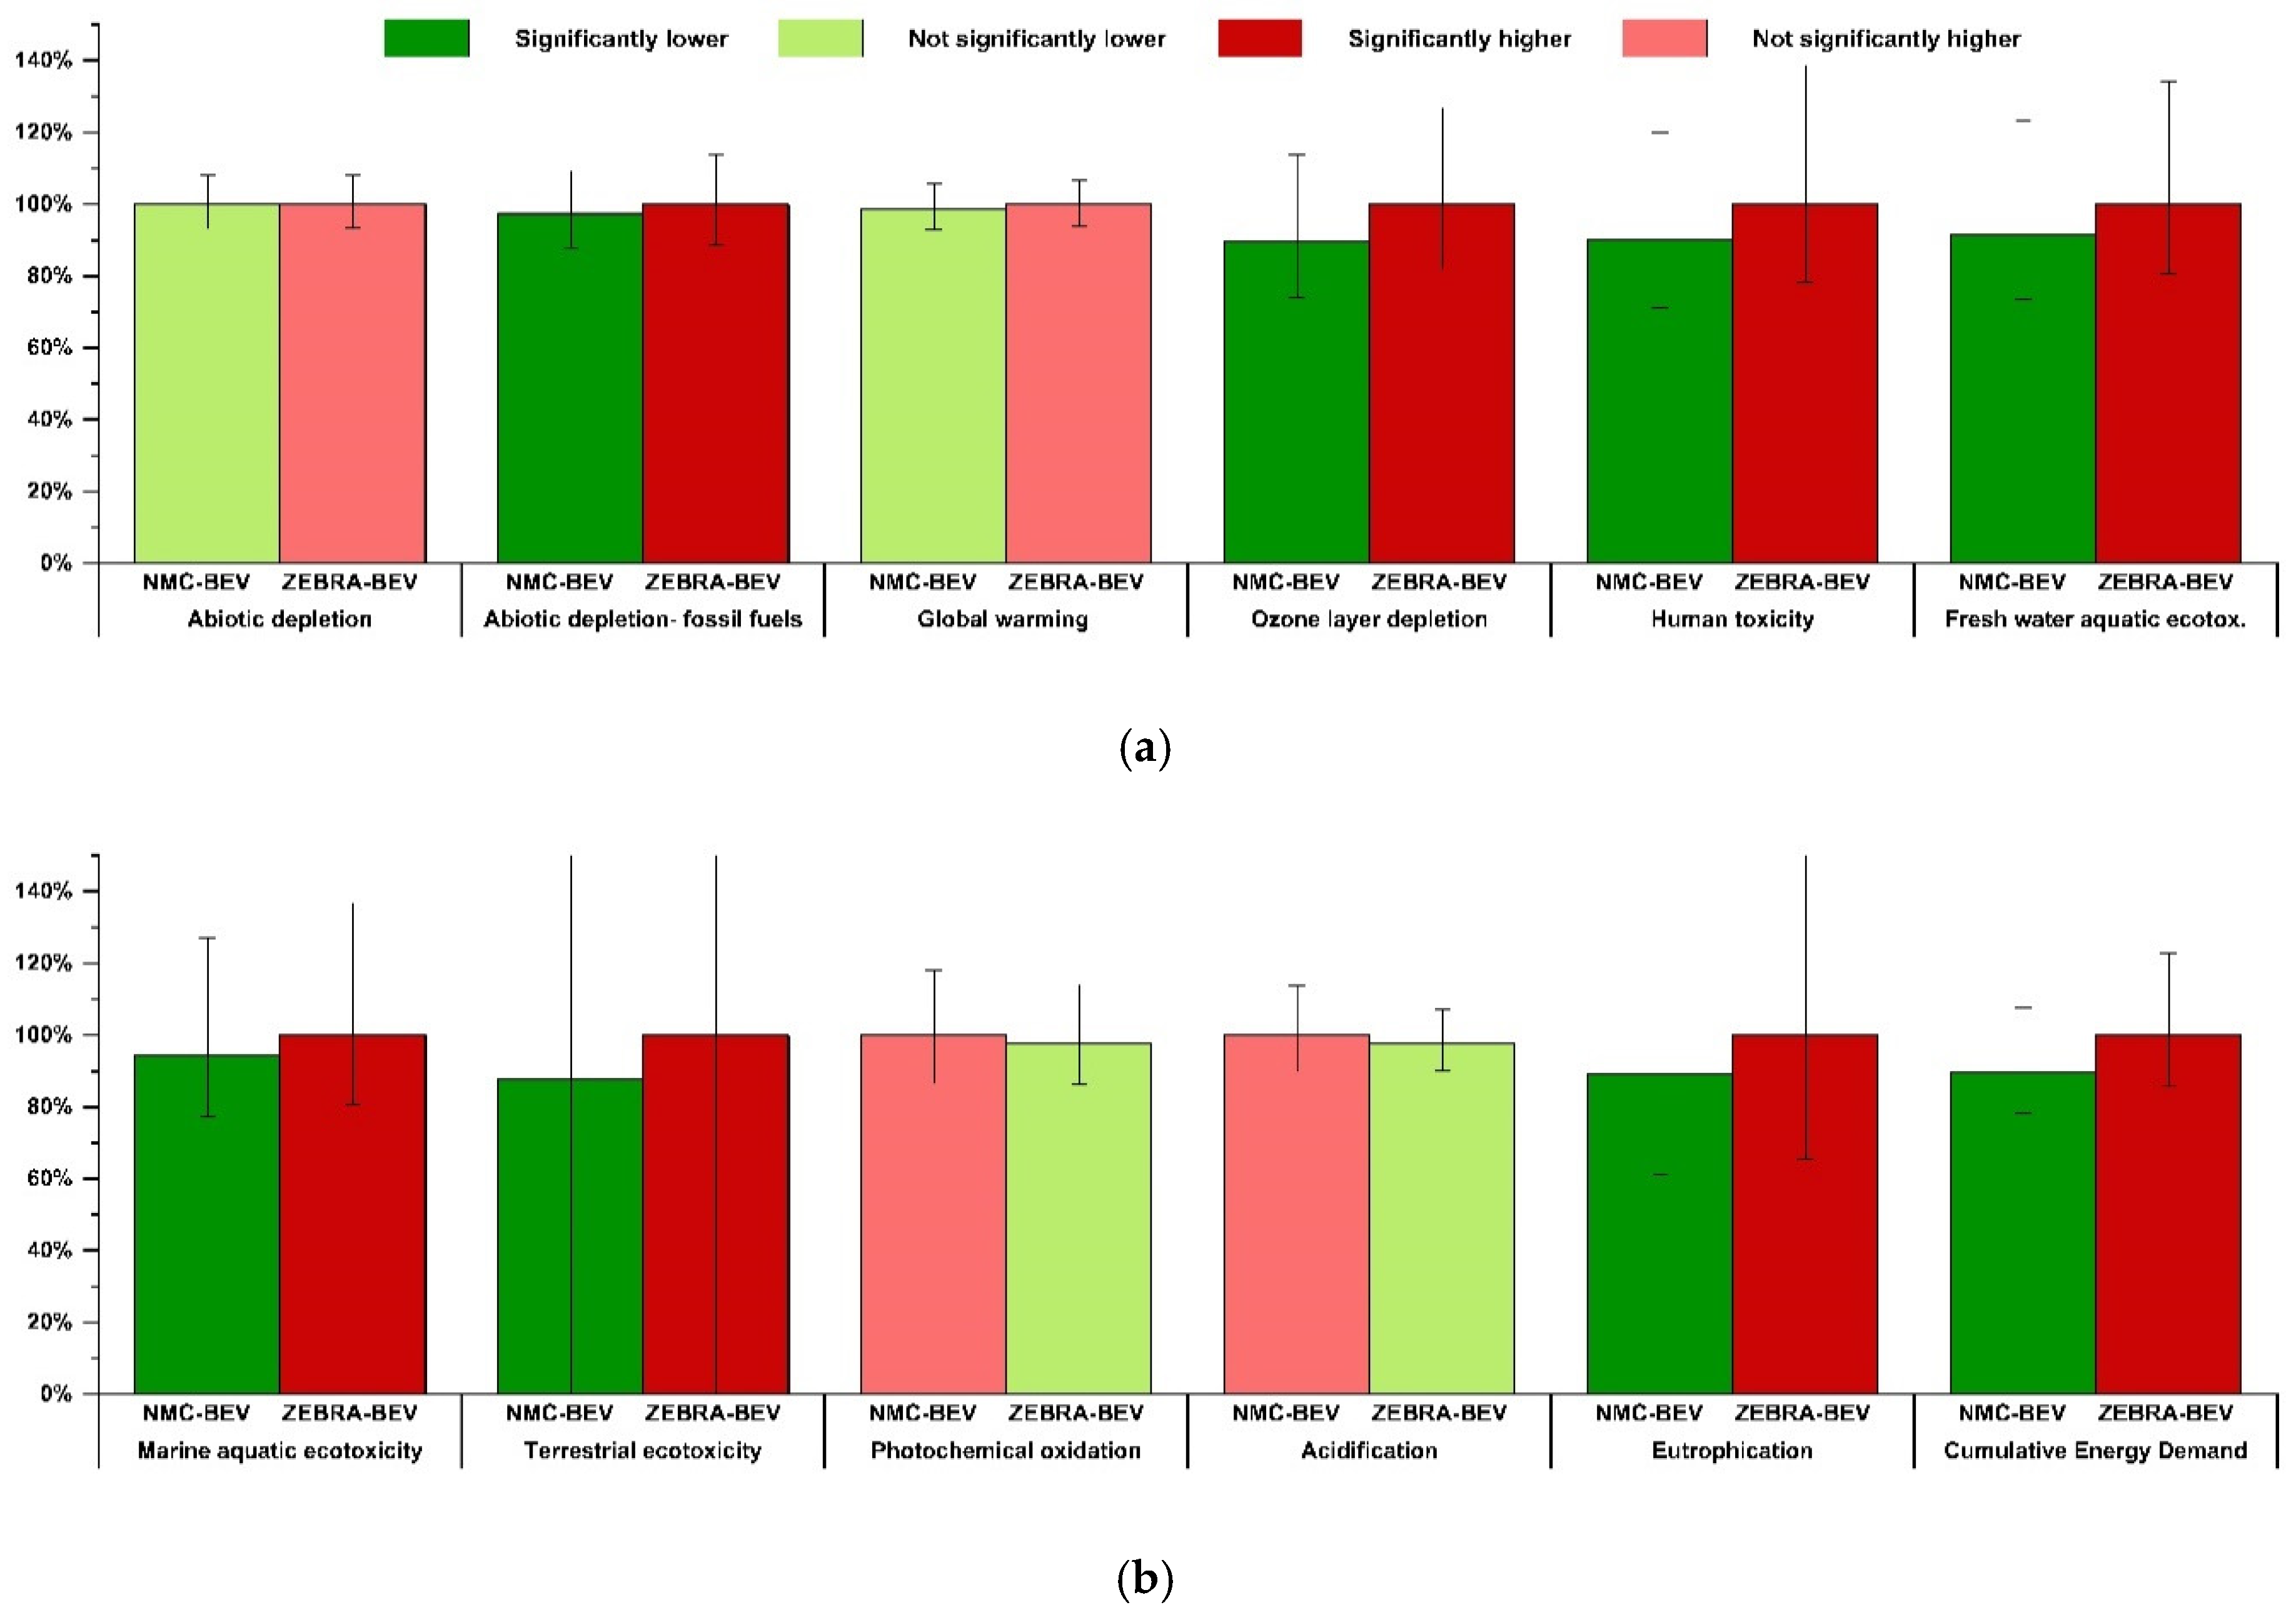
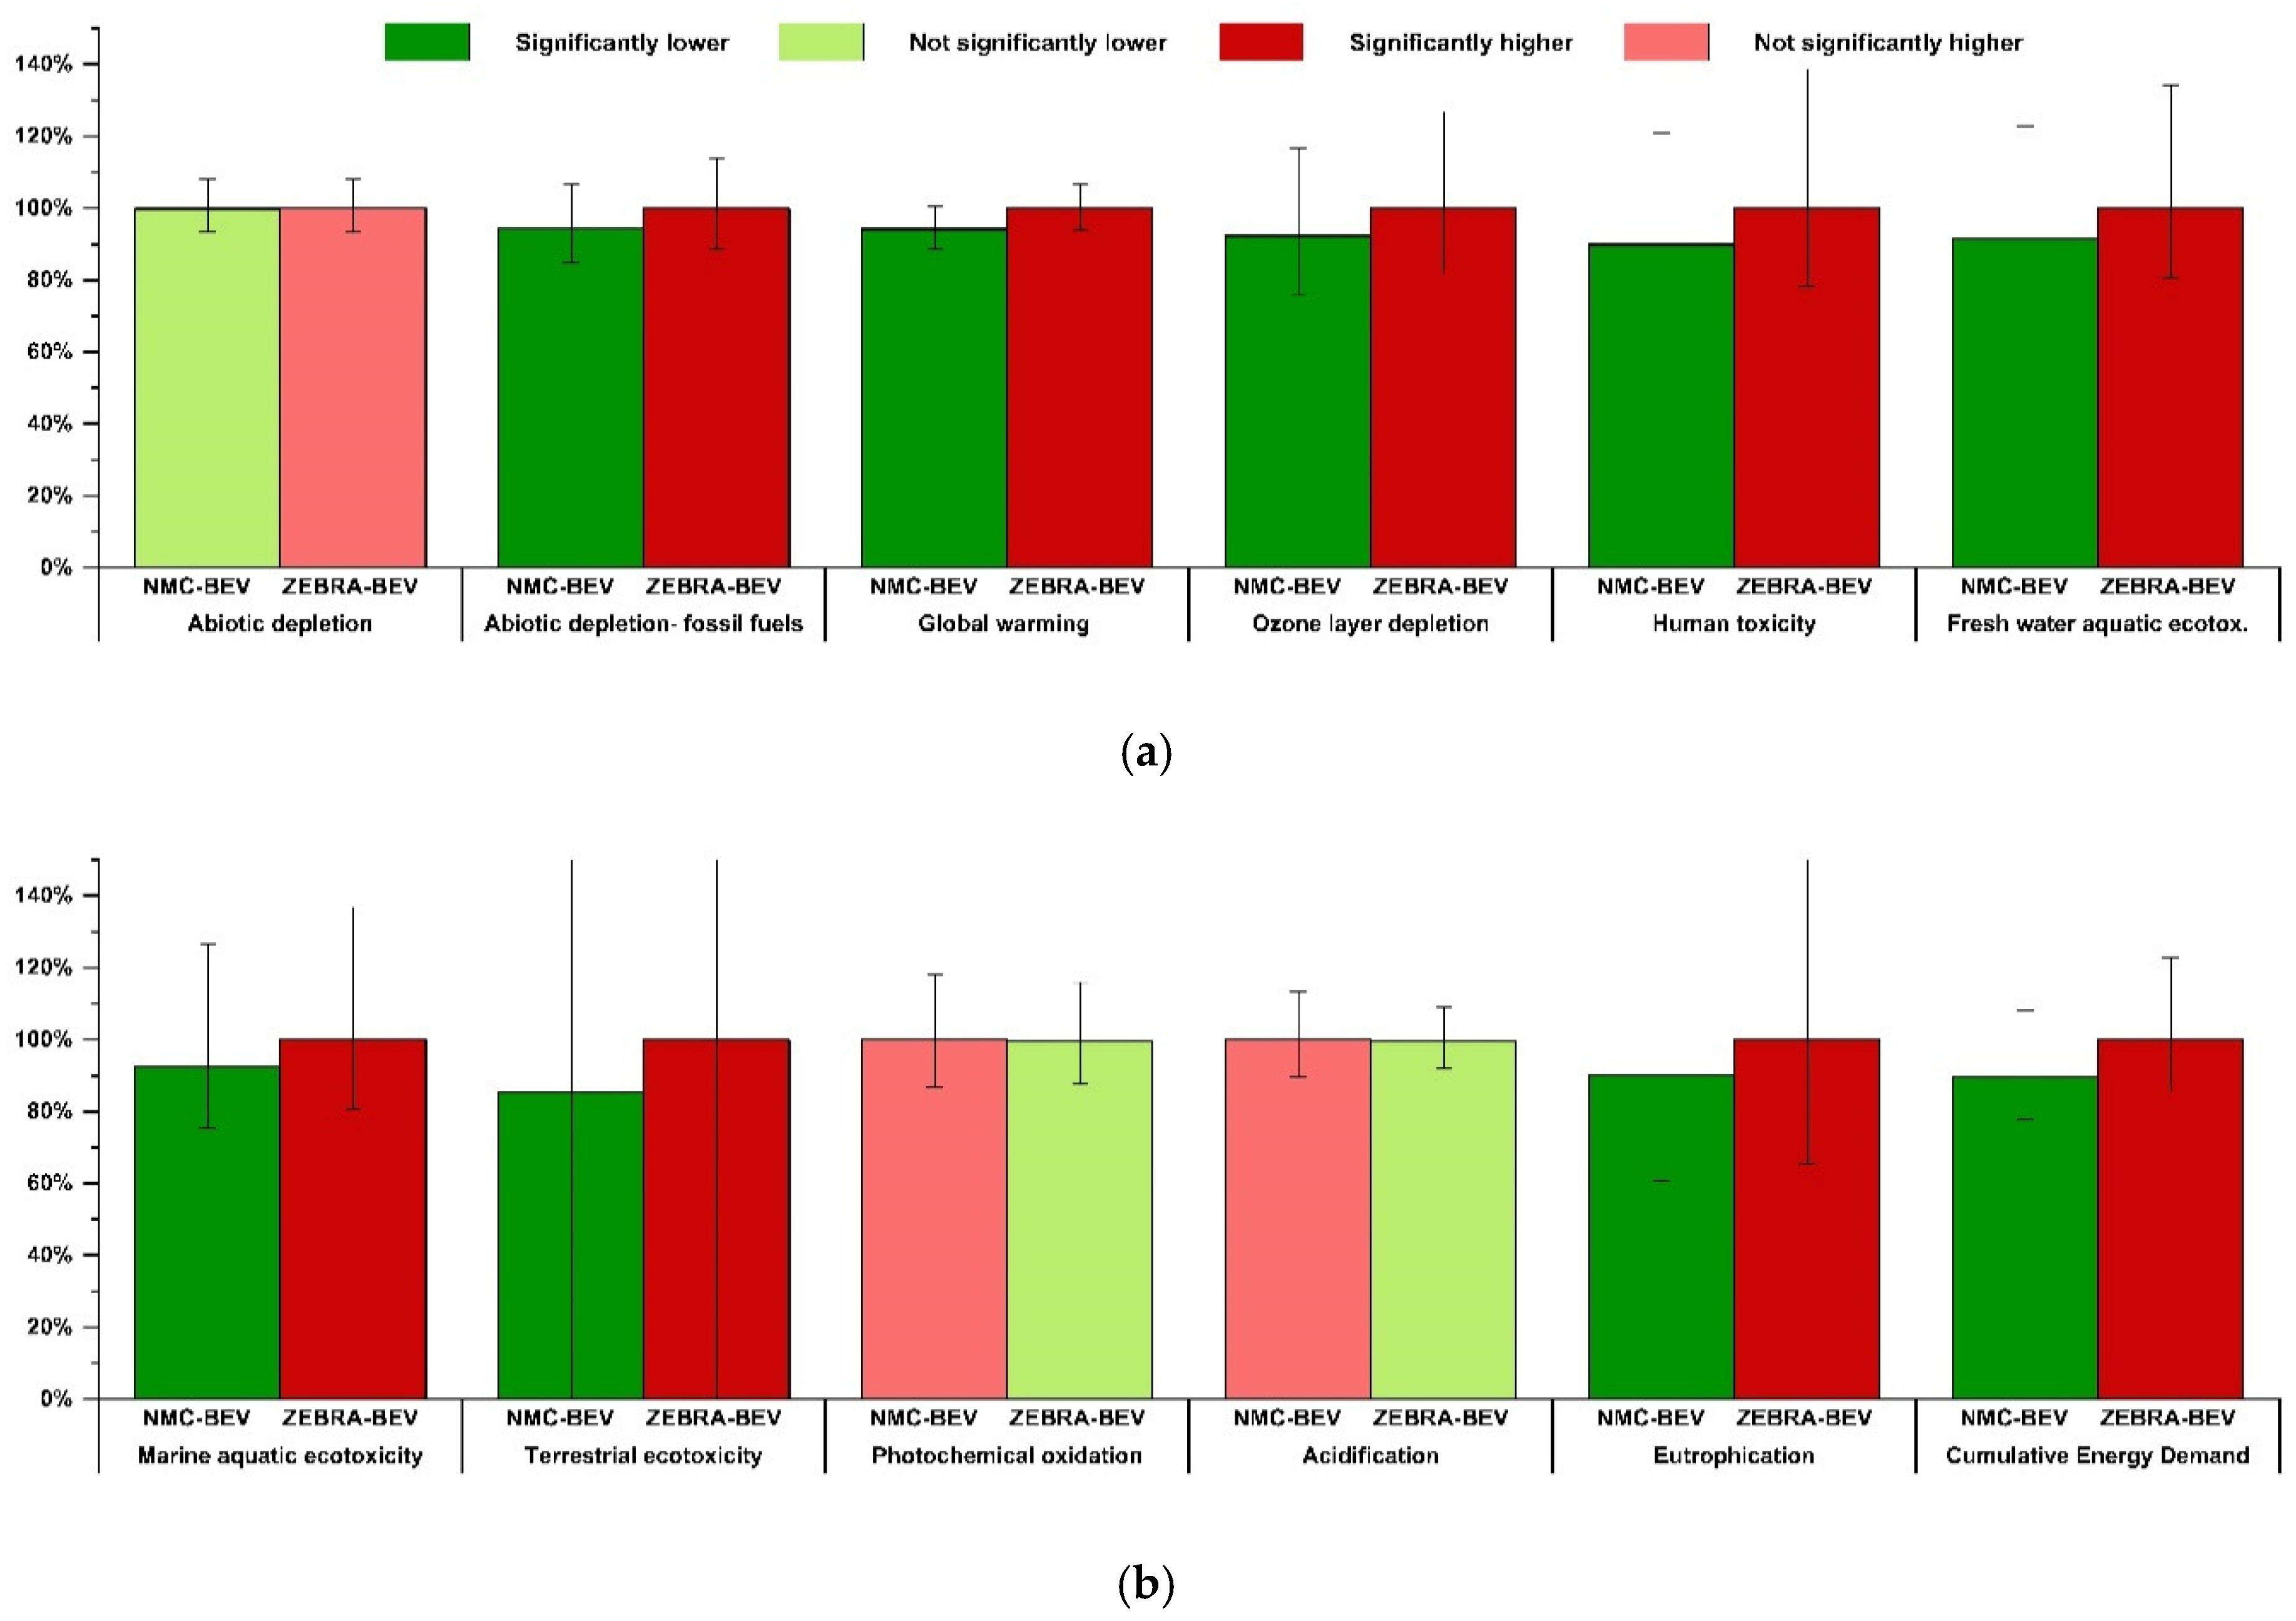
3.3. Comparison of the NMC and ZEBRA Batteries

Figure 6 compares the environmental impacts of the NMC111 and ZEBRA battery-pack production stages (cathode, cell and non-cell material production, energy use, and battery transport from the manufacturing plant to the customer). The production of the ZEBRA battery had been analysed in a previous study by the same authors [35] for application to the same LDCV as that of the present paper. The impacts are compared on both an energy basis (per 1kWh of the battery pack, Figure 6a) and on a mass basis (per 1kg of battery pack, Figure 6b). The results are normalised with respect to the highest value of each category and are reported as a percentage of that value.
The impacts of the NMC111 production have already been discussed in detail in Section 3.1, whereas the ZEBRA battery production impacts are summarised in Figure S3. The production of Nickel for the ZEBRA battery and the electricity required for the production process have an important impact in all the categories. It should be recalled that Nickel is responsible for up to 91% of the POP and 92% of the AP.
The comparison of NMC111 and ZEBRA on an energy basis (Figure 6a) shows a better environmental impact of NMC111 for most of the categories, except for GWP, ADP-FF, CED, and ODP. It should be pointed out that the energy mix of the production location affects the GWP of the batteries, and the NMC111 battery is produced in China in this study, whereas the ZEBRA battery is produced in Switzerland. Similar results to those of Figure 6a are apparent from the comparison on a mass basis in Figure 6b, even though the ZEBRA impacts are closer to those of NMC111 for most of the categories in which NMC111 performs better on an energy basis, and become better than NMC111 for EP. Moreover, the impacts of ZEBRA are further reduced, with respect to NMC111, for the categories in which NMC111 performs worse on an energy basis.
The EoL of NMC111 was analysed and discussed in Section 3.1. As far as the EoL of ZEBRA is concerned, there is a general lack of data on the recycling ecoprofiles [4]. For example, the EoL step was accounted for in the life cycle assessment of the ZEBRA battery reported in [46]. That study considered the average data of a European recycling process made up of a combination of the recycling processes for Lithium-ion and Nickel-metal hydride batteries. In this study, although all the components of a ZEBRA battery can be recycled, the EoL stage always increases the battery impact categories (GWP, ODP, HTP, M-ECOTP, F-ECOTP, T-ECOTP, POP, and AP were analysed in [46]) and accounts for 1.79 ÷ 7.13% of the total impact derived from the ZEBRA battery, depending on which impact category is considered (e.g., 4.07% for GWP). On the basis of these considerations, the EoL stage would not change the ranking of ZEBRA and NMC111 for the impact categories reported in Figure 6. In other words, EoL would further reduce the environmental impact of NMC111 for the impact categories in which the manufacturing stage of NMC111 shows smaller values than ZEBRA. EoL would not change the comparison of the other categories to any great extent, except for ODP, where the impact of NMC111 would further increase with respect to ZEBRA.

3.4. Comparison of the LDCV Vehicles: Diesel, NMC111-BEV, and ZEBRA-BEV

Figure 7 and Figure 8 compare the LCA impacts of the three versions of the vehicle, i.e., two electric LCDVs equipped with two NMC battery packs (NMC-BEV) and two ZEBRA battery packs (ZEBRA-BEV) as well as a conventional LCDV equipped with a Diesel engine (DIE-ICEV). The impacts were normalised to the highest score in each category. The impacts of each vehicle configuration in Figure 8 are split into the following contributions:
-
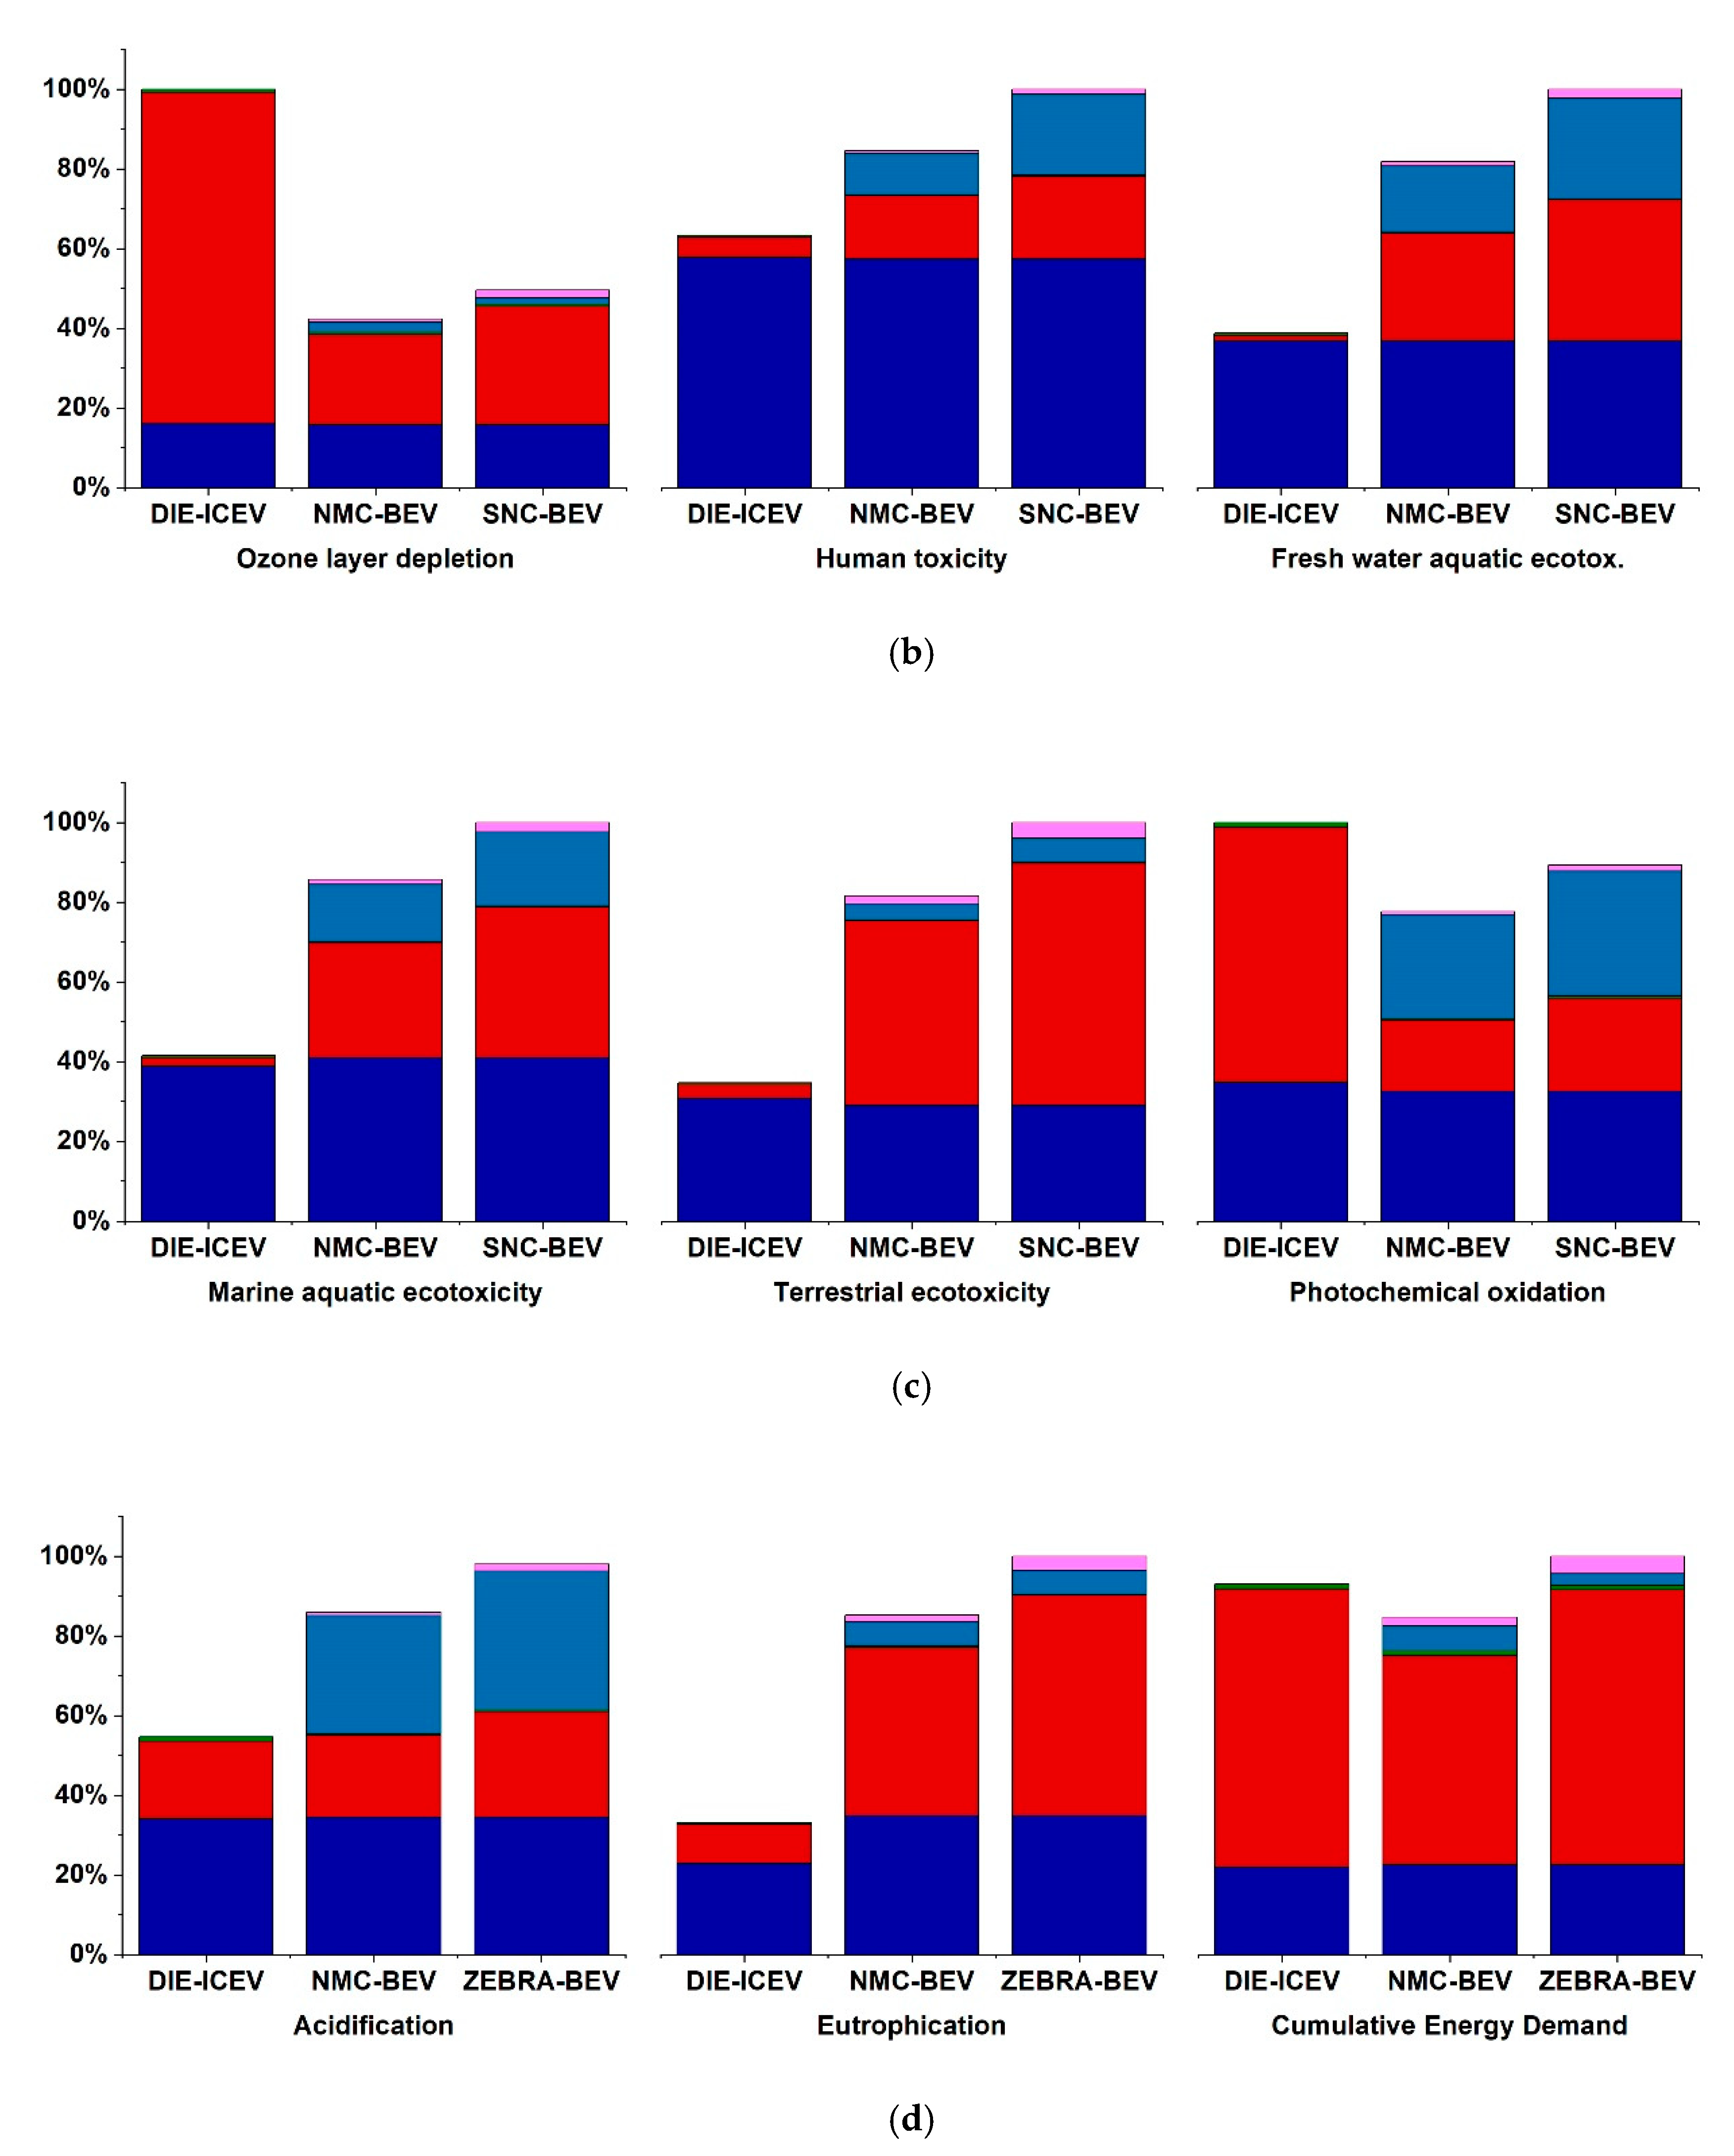
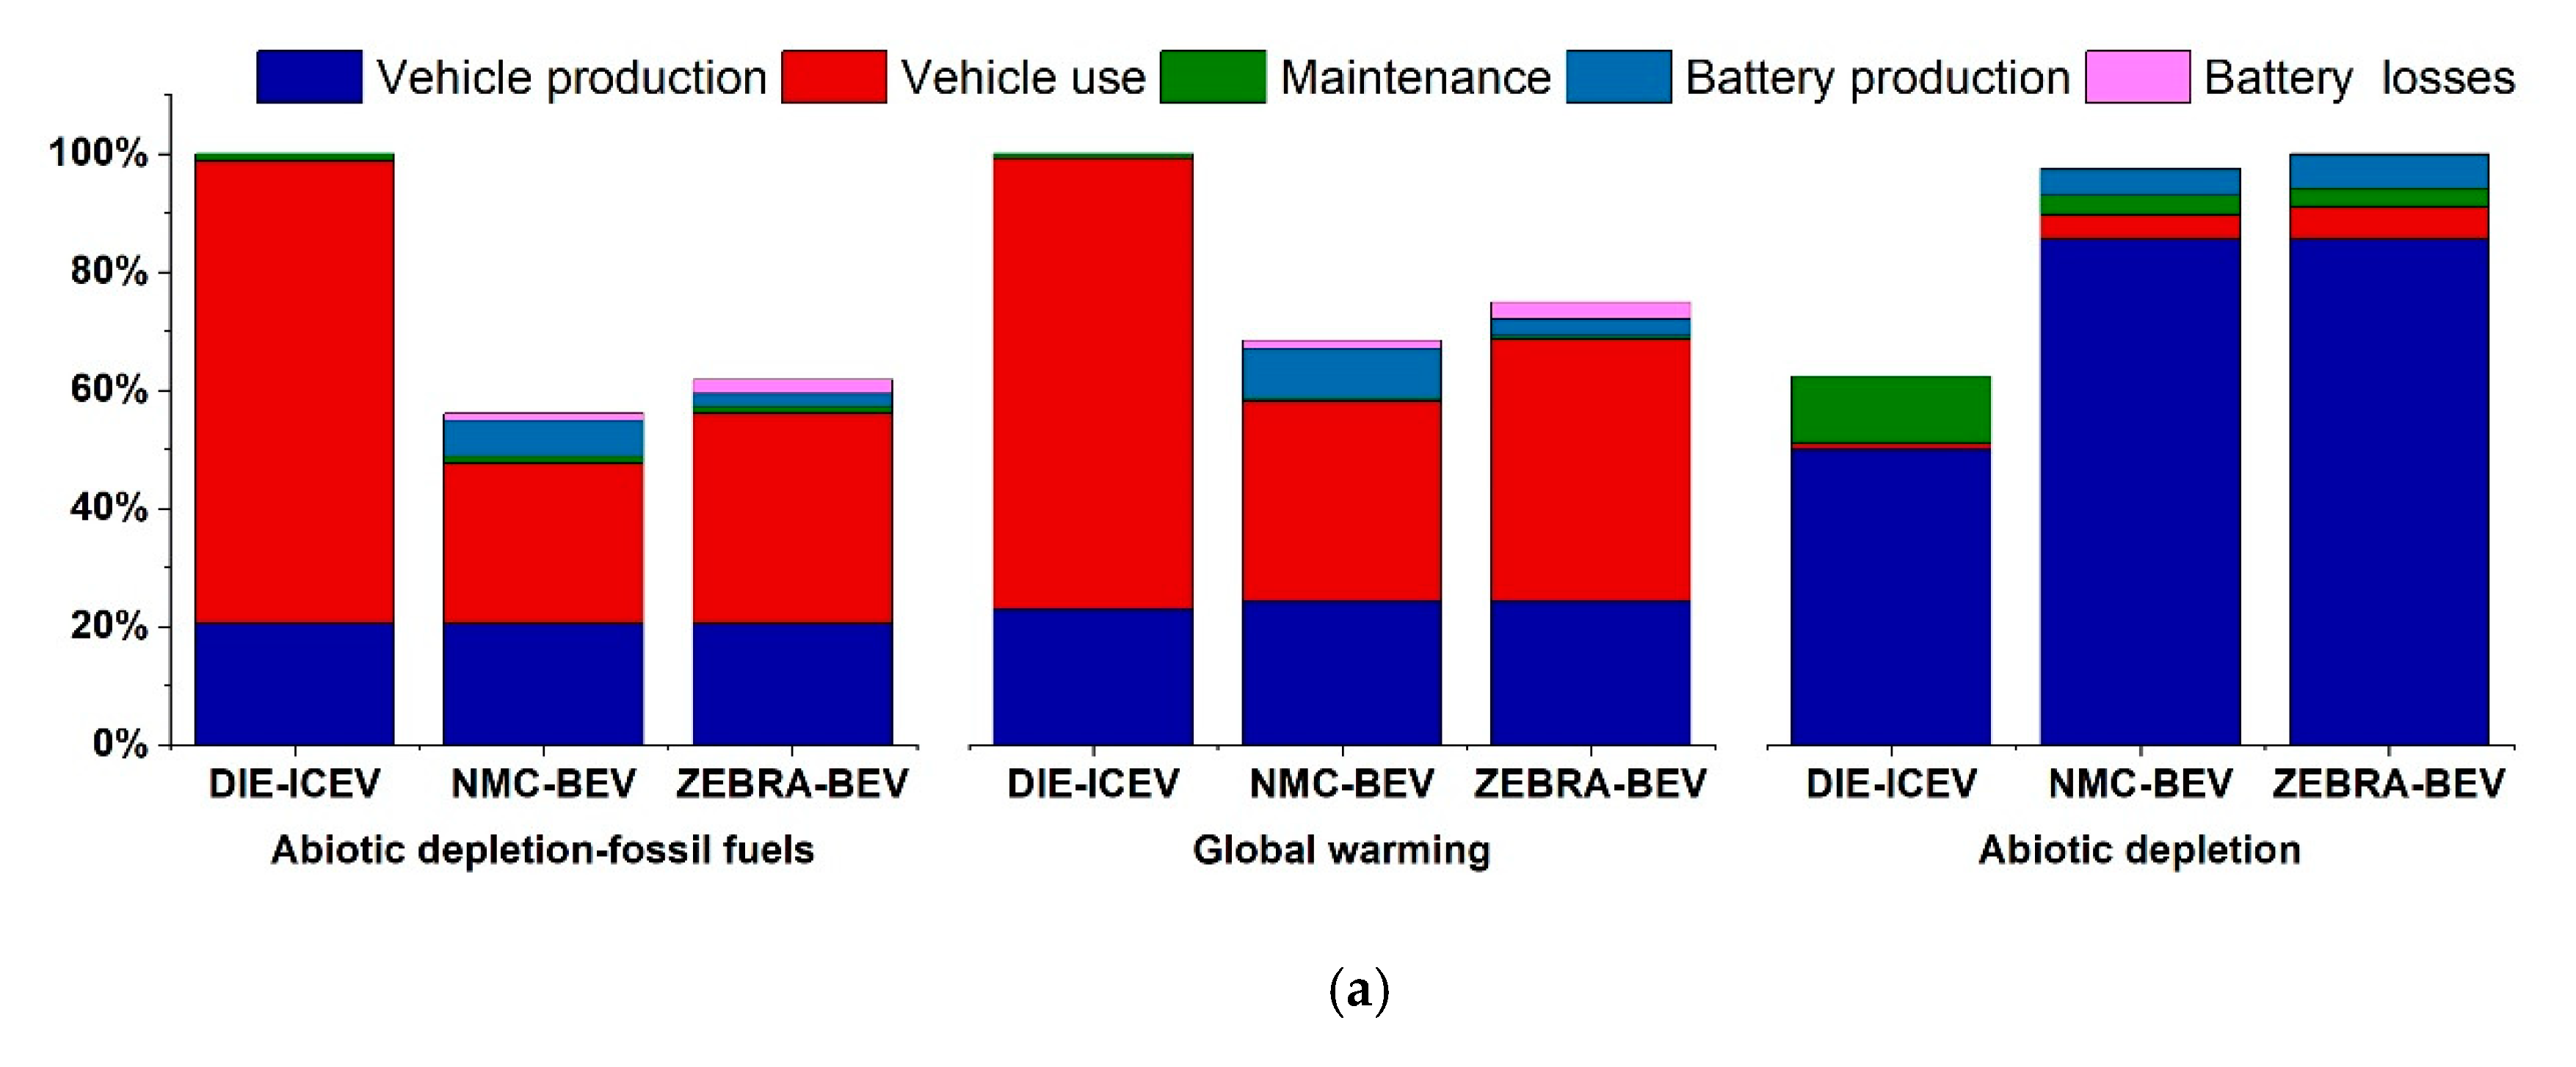
Battery production (light blue bar): this includes the production of the cathode, battery cell, and non-cell materials and includes the total energy required for the manufacturing and the contributions of the battery transport from the manufacturing plant to the customer.
-
Vehicle production (dark blue bar): this includes all the processes, that is, from component production to distribution of the vehicle on the market [35].
-
Maintenance (green bar): this takes vehicle maintenance into account. Maintenance was modelled according to [35].
-
Battery losses (Magenta bar): these account for the amount of electricity lost during the recharging phase along the lifespan of the battery and are estimated according to Section 2.2.2.2.
-
Vehicle use phase (red bar): Well-To-Wheel energy consumption and emissions from the vehicle use phase were calculated by means of a backward-facing model of the LDCV case study, as detailed in Section 2.2.2.1.
With reference to electric configurations, NMC-BEV (blue line in Figure 7) appears to be slightly better than ZEBRA-BEV (green line). A Monte Carlo analysis of the environmental impact estimations was carried out for these two configurations (see the Appendix A). It was shown that NMC-BEV has lower impacts than ZEBRA-BEV for 90–100% of the Monte Carlo runs, i.e., according to the guidelines reported in [47], the impact of NMC-BEV can be considered significantly lower than that of ZEBRA-BEV.
The electric configurations both show significant advantages, with respect to DIE-ICEV (red line in Figure 7), albeit only for GWP, ADP-FF, POP, and ODP. This can mainly be ascribed to the vehicle use phase (Figure 8). The three vehicle configurations have quite similar impacts for CED, whereas DIE-ICEV appears to be significantly more environmentally friendly than the electric versions of the same vehicle for all the other impact categories (HTP, F-ECOTP, M-ECOTP, T-ECOTP, AP, EP, and ADP).
The above-described differences can mainly be ascribed to the different impacts of the use phase for most of the impact categories (ADP-FF, GWP, ODP, HTP, F-ECOTP, M-ECOTP, T-ECOTP, EP, POP). The use stage impact of the electric vehicles is lower for the ADP-FF category, due to the higher efficiencies of the electric powertrains than the diesel one. For GWP, 87% of the DIE-ICEV use stage contribution is due to tailpipe CO2 emissions. As far as ODP is concerned, the high use stage contribution of DIE-ICEV is due to the release of refrigerants from the on-shore extraction of oil and gas (Well-To-Tank contribution). With reference to HTP, F-ECOTP, M-ECOTP, and T-ECOTP, the electric versions perform worse in the use stage, since the generation of electricity using fossil fuels produces toxins. For POP, the high use stage contribution of DIE-ICEV is mainly due to NOx and NMVOC tailpipe emissions. The impact of NMVOC emissions has been estimated according to the hydrocarbon emission speciation reported in [48,49,50]. The use-phase POP from electric powertrains is mainly due to energy carrier production, namely to the contribution of coal to electricity generation. Finally, EP is higher for the use stage of the electric versions due to Well-To-Tank phosphate emissions to water as a result of the disposal of spoils and sulphidic tailings during hard coal mining operations.
On the other hand, ADP is mainly affected by the vehicle production stage, where the electric powertrains show larger impacts. In fact, more than 70% of the vehicle production stage ADP for the BEVs is due to the production of electrification components.
It is worth noting that POP and AP are affected to a great extent by the battery production for electric LDCVs. NMC111 battery production contributes by about 30% to the total values of POP and AP, whereas ZEBRA battery production is responsible for up to 36−37% of the vehicle POP and AP.
An additional vehicle configuration, that is, one with three NMC battery packs was considered to assess the effect of an increased driving range on the environmental impact of the NMC-BEV.
The results shown in Figure 9 and the Monte Carlo analysis reported in the Appendix A show that, even when the third NMC111 battery pack is added, the impacts for NMC-BEV can be considered significantly lower than those of ZEBRA-BEV with two battery packs. This is apparent for all the categories in Figure 9, except for ADP, GWP, POP, and AP, for which the differences between the two configurations are not significant. With reference to GWP, the deterministic results in Figure 9 show that the NMC-BEV with three battery packs has a slightly lower GWP than ZEBRA-BEV. However, according to the Monte Carlo analysis, the NMC-BEV is lower than ZEBRA-BEV for 83% of the runs, but there is a 17% likelihood of obtaining the opposite result.
Finally, the production location of the NMC battery was changed, i.e., it was assumed that the NMC battery was produced in Europe using the average electricity mix. Figure 10 shows that the GWP of the NMC-BEV with three battery packs is lower than that of ZEBRA-BEV, and the uncertainty analysis reported in the Appendix A confirms that this occurs for 100% of the Monte Carlo runs.

4. Discussion

The main findings of this paper pertaining to the LCA of the NMC111 battery and to the LCA of the three configurations of the case study LDCV are compared in this section with those reported in the literature.
With reference to the cradle-to-grave life cycle assessment of the NMC111 battery reported in Figure 5, the battery production stage is the main contributor to all the considered impacts. Indeed, with the exception of the ODP, the battery production contribution is always above 60%. This is in line with the results published in the literature (see for instance, [43]). In other words, cathode production makes the largest contribution to all of the examined environmental impact categories, with the exception of ODP, ADP-FF, GWP, and CED. In fact, although the greatest impacts in ODP are attributed to cell recycling, GWP and the CED electricity and heat necessary for the production stage are the main contributors to ADP-FF. No study in the literature has analysed such a wide set of impact categories for NNC111, and most of the available analyses have focused on GWP. The GWP estimated in this paper is consistent with the study conducted by [19], in which GHG emissions, due to the electrical consumption of an NMC battery during manufacturing in China, accounted for 35% of the total GHG emissions.
The contribution of the production of non-cell materials to battery production is less than 30% for all the impact categories, except for ADP, CED, ADP-FF, and GWP, in which the production of non-cell materials accounts for 36%, 41%, 42%, and 46%, respectively. This is in line with the results reported in [18], in which the production of non-cell materials had a greater impact on ADP-FF, GWP, and ODP (the latter has also shown less impact in our study, accounting for only 19%), whereas CED and ADP were not investigated.
These outcomes confirm the importance of taking into account the impacts of battery production for both cell and non-cell materials when assessing the environmental sustainability of electric mobility [43].
Table 6 (adapted from [11]) compares the GWP results of this study with those available in the literature for production and recycling stages. The observed differences are mainly due to different battery compositions, locations, data sources, and energy demands. The works of Hao et al. [19] and Qiao et al. [51] were similar to this study, as far as location and battery composition are concerned, but the data sources were different (mainly based on GREET [52]. The studies of Majeau-Bettez et al. [22] and of Ellingsen et al. [18] are comparable with this study as far as energy demand is concerned, but the production locations were different and different assumptions were made about the battery composition.
In our study, battery losses, with reference to the battery use phase, have had a great impact on T-ECOTP, CED, EP, and ODP (25%, 19%, 17%, 17%, respectively). This outcome appears to be in line with [43], in which the battery losses were more significant for CED, GWP, EP, ODP (Ref. [43] did not analyse T-ECOTP). Excluding the battery use stage, which is dependent to a great extent on the operating conditions, the GWP of the NMC111 battery is 20.2 kgCO2eq/kgbatterypack and 130.4 kgCO2eq/kWh. The impact of cell recycling results in 9.7 kgCO2eq/kWh, while it increases to 11.3 kgCO2eq/kWh when non cell-material cycling is also considered. The transport of batteries contributes less than 1% to all the examined categories.
A literature study of the different assessments of NMC battery production, published by the Swedish Energy Agency [53], reports a maximum GWP of 146 kgCO2eq/kWh for manufacturing and of 15 kgCO2eq/kWh for recycling, values which appear to be comparable with the outcomes of our study.
With reference to the LCA of LCDV, the NMC-BEV in this study (GVW = 5200 kg) has a GWP of 0.299 ÷ 0.350 kgCO2/km (EoL excluded), depending on the number of battery packs mounted onto the vehicle (70 kWh or 105 kWh) and on the battery production location (China or Europe). In [31], a commercial electric light-vehicle (equipped with a 41-kWh battery pack and featuring a GVW = 3500 kg) was estimated to emit around 0.170 kgCO2/km (excluding EoL) in 2020. However, the absolute values of these two studies cannot be compared directly, due to differences in the vehicle GVW and in the nominal battery capacity.
In our study, the battery and vehicle production, vehicle use, and vehicle maintenance stages contribute to the GWP of NMC-BEV by 48%, 51%, and 1%, respectively. These percentages appear to be consistent with [31,54]. NMC-BEV has less impact than DIE-ICEV on GWP (−32 %) and CED (−12%) and this is consistent with the results of [31] (−45% and −20%, respectively).

5. Conclusions

This paper has reported an environmental assessment of an NMC Lithium-ion traction battery and of its application to a battery electric LDCV for urban and regional freight haulage.
The main original results were obtained from:
(a)
A cradle-to-grave life cycle assessment of an NMC111 battery, including production, further waste disposal related to the impact of incineration and the burial of materials, environmental credits, and recycling, as well as battery losses.
(b)
Insight into a life cycle assessment of different NMC chemistries.
(c)
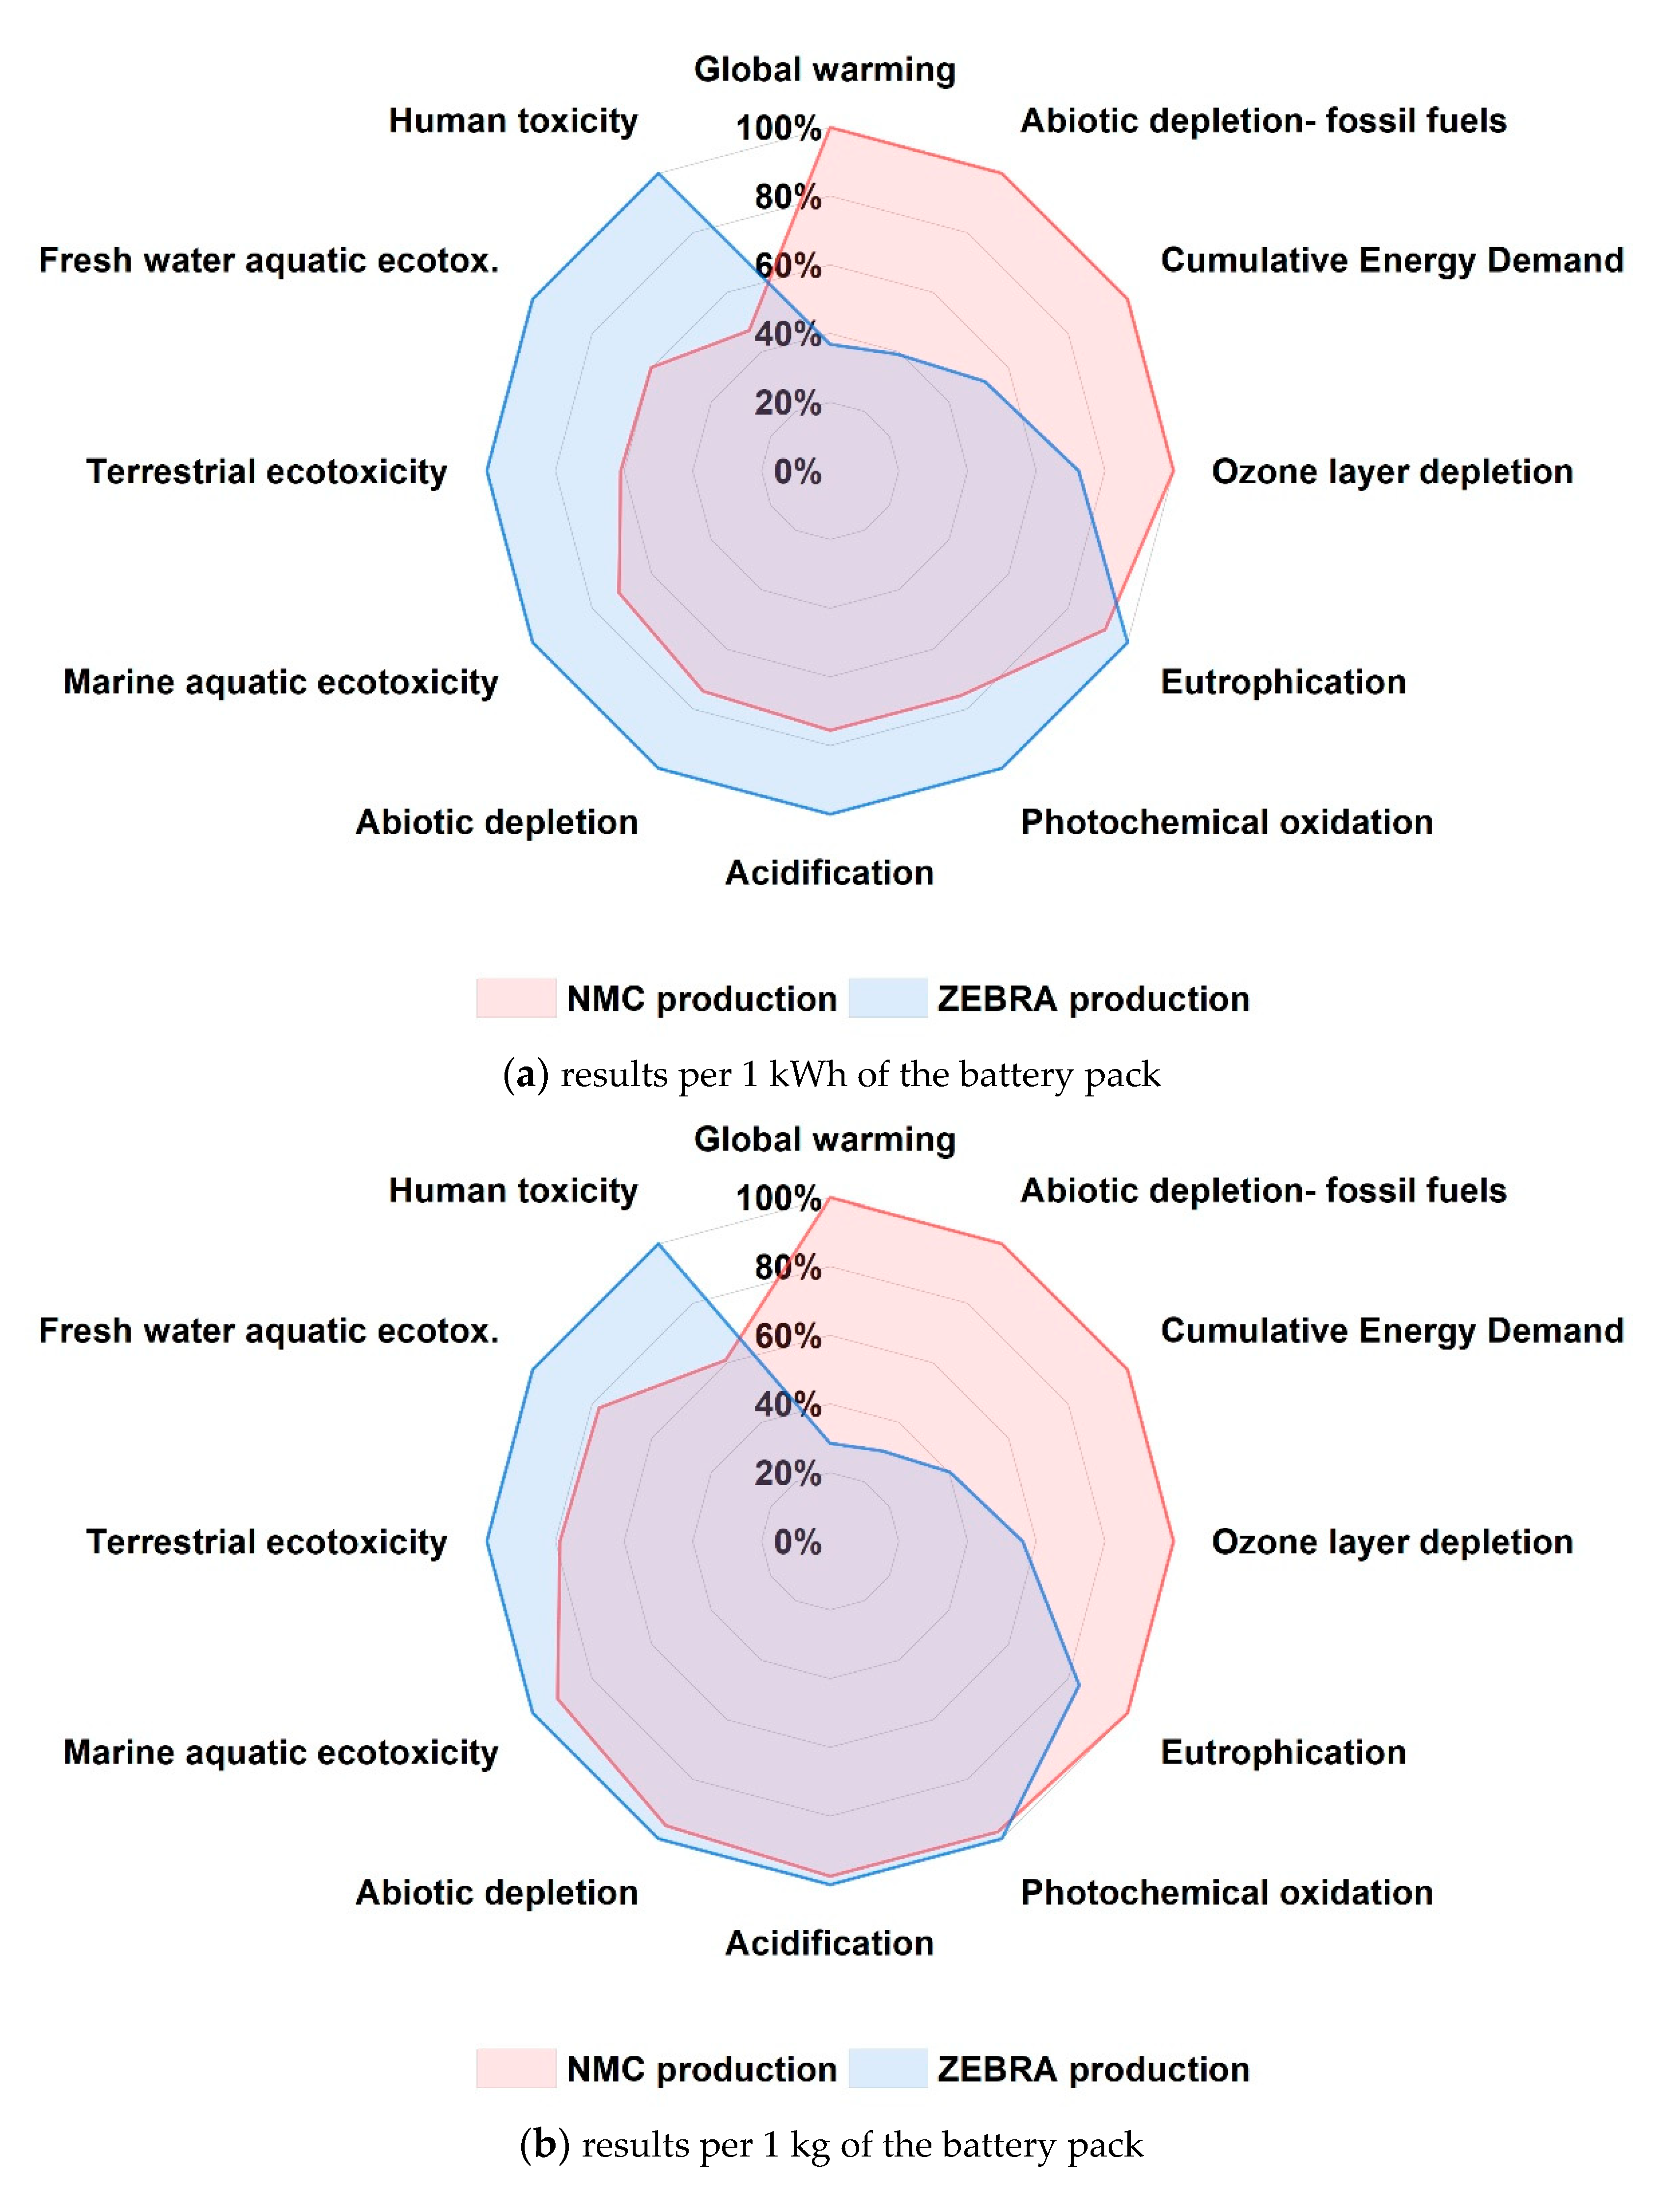
Life cycle assessment of the manufacturing stages of NMC111 and ZEBRA batteries.
(d)
A life cycle assessment of three LDCV configurations (NMC111-BEV, ZEBRA-BEV, and conventional diesel), including battery and vehicle production, vehicle maintenance, battery losses, and vehicle use phases.
The main findings for each topic are summarised hereafter.
Cradle-to-grave life cycle assessment of an NMC111 battery
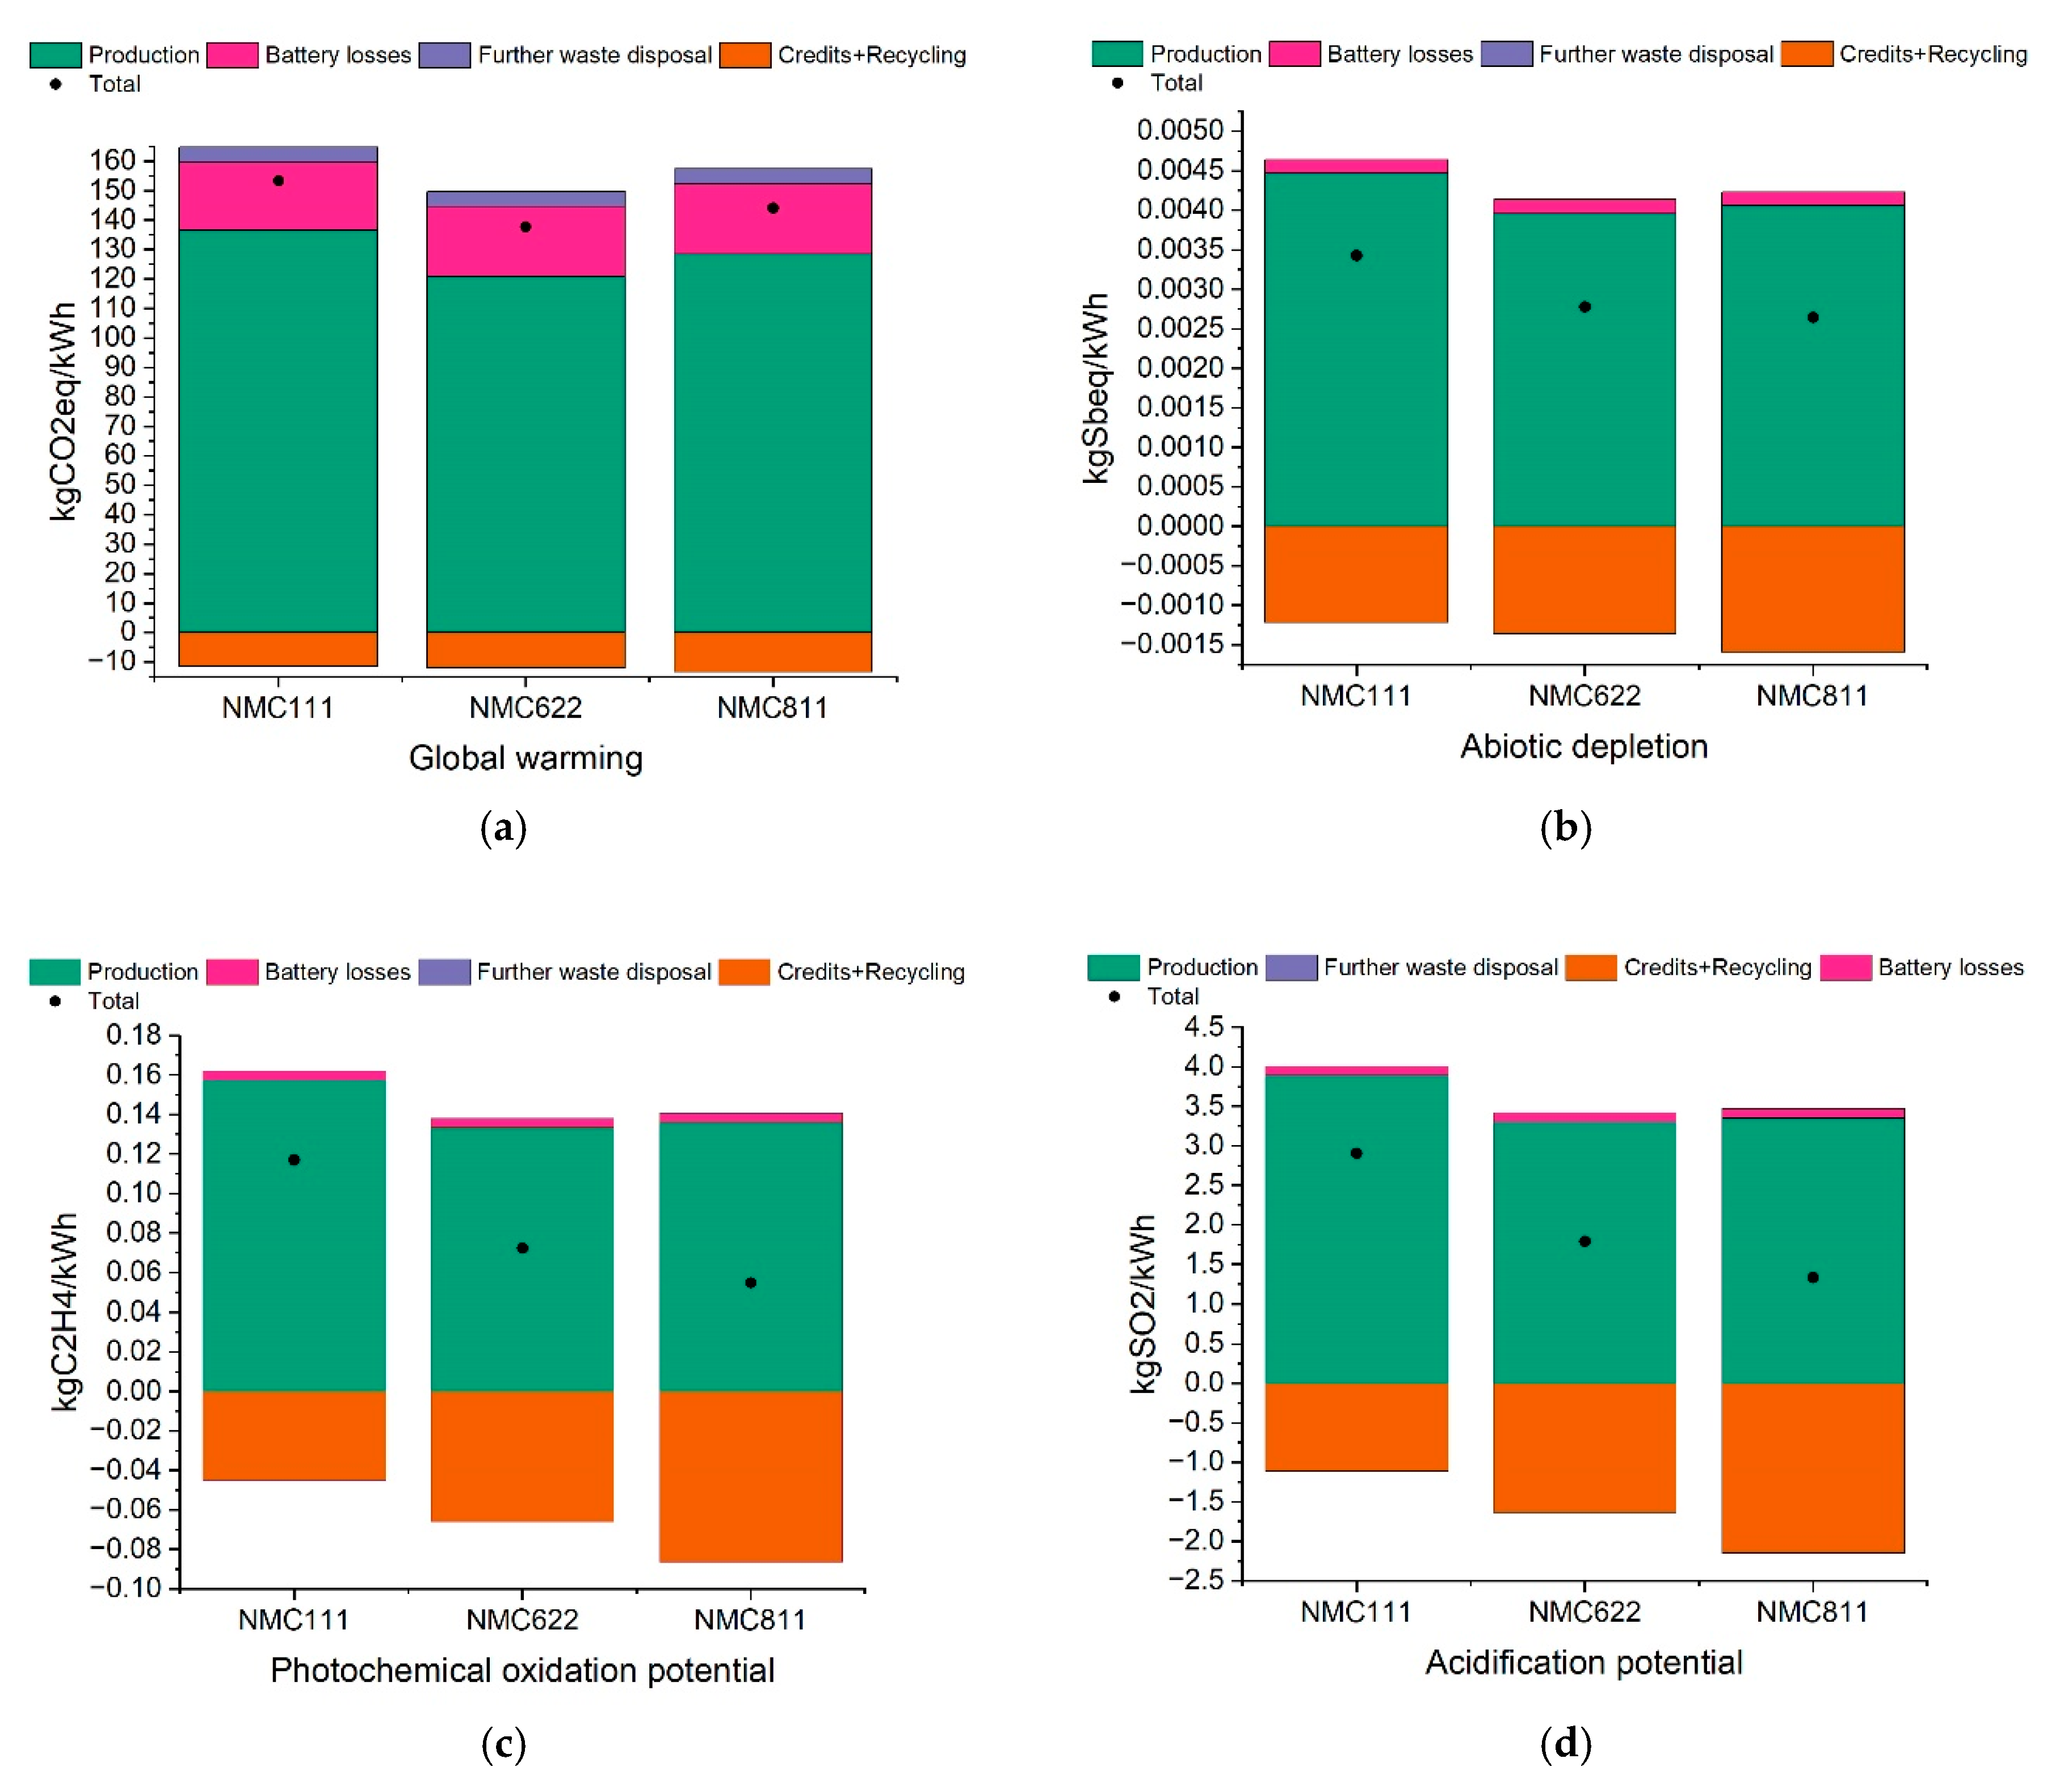
  • The production stage is the main contributor to the total impact in all the impact categories. The main factors responsible for the production impact of the NMC111 battery are Nickel, Aluminium, Copper, Cobalt, and Energy demand. The amount of energy and heat necessary for the production stage is a source of uncertainty, as it has only been possible to estimate it partially.
  • The contribution of the production of non-cell materials to battery production can range from 36% to 46% for many impact categories (ADP, CED, ADP-FF, and GWP). This confirms the importance of taking into account the impacts of battery production for both cell and non-cell materials when assessing the environmental sustainability of electric mobility.
  • EoL produces environmental benefits that range from 3% to 25% of the total battery impact for most of the considered categories. The greatest benefits are shown for HTP (25%), POP (22%), AP (22%), and ADP (21%). However, the EoL stages increase the impact of ODP, ADP-FF and CED by about 30%, 7%, and 5%, respectively. However, recycling could be improved, since many of the materials involved in the production of batteries are not recycled (e.g., Lithium, Aluminium). The amount of energy and heat necessary for the EoL stages is another source of uncertainty.
  • The battery production site influences GWP to a great extent, and the savings increase as the carbon intensity of the electricity chain decreases.
  • Since energy is a key factor for the total impacts of batteries, company data should be made public to encourage future LCAs.
Insight into the life cycle assessment of different NMC chemistries
  • In addition to NMC111, two cathode chemistries with increasing percentages of Nickel have been assessed, namely NMC622 and NMC811.
  • Even though GWP shows slight differences between the considered NMC chemistries, NMC622 results to be the battery with the least GWP intensive formulation.
  • ADP shows significant differences for the three chemistries. Nickel-rich cathodes mean reduced ADP and higher benefits, linked to the amount of avoided Nickel production. Thus, NMC811 contributes less to abiotic resource exploitation.
  • NMC811 also shows the lowest impacts for POP and AP.
Life cycle assessment of the manufacturing stages of the NMC111 and ZEBRA batteries
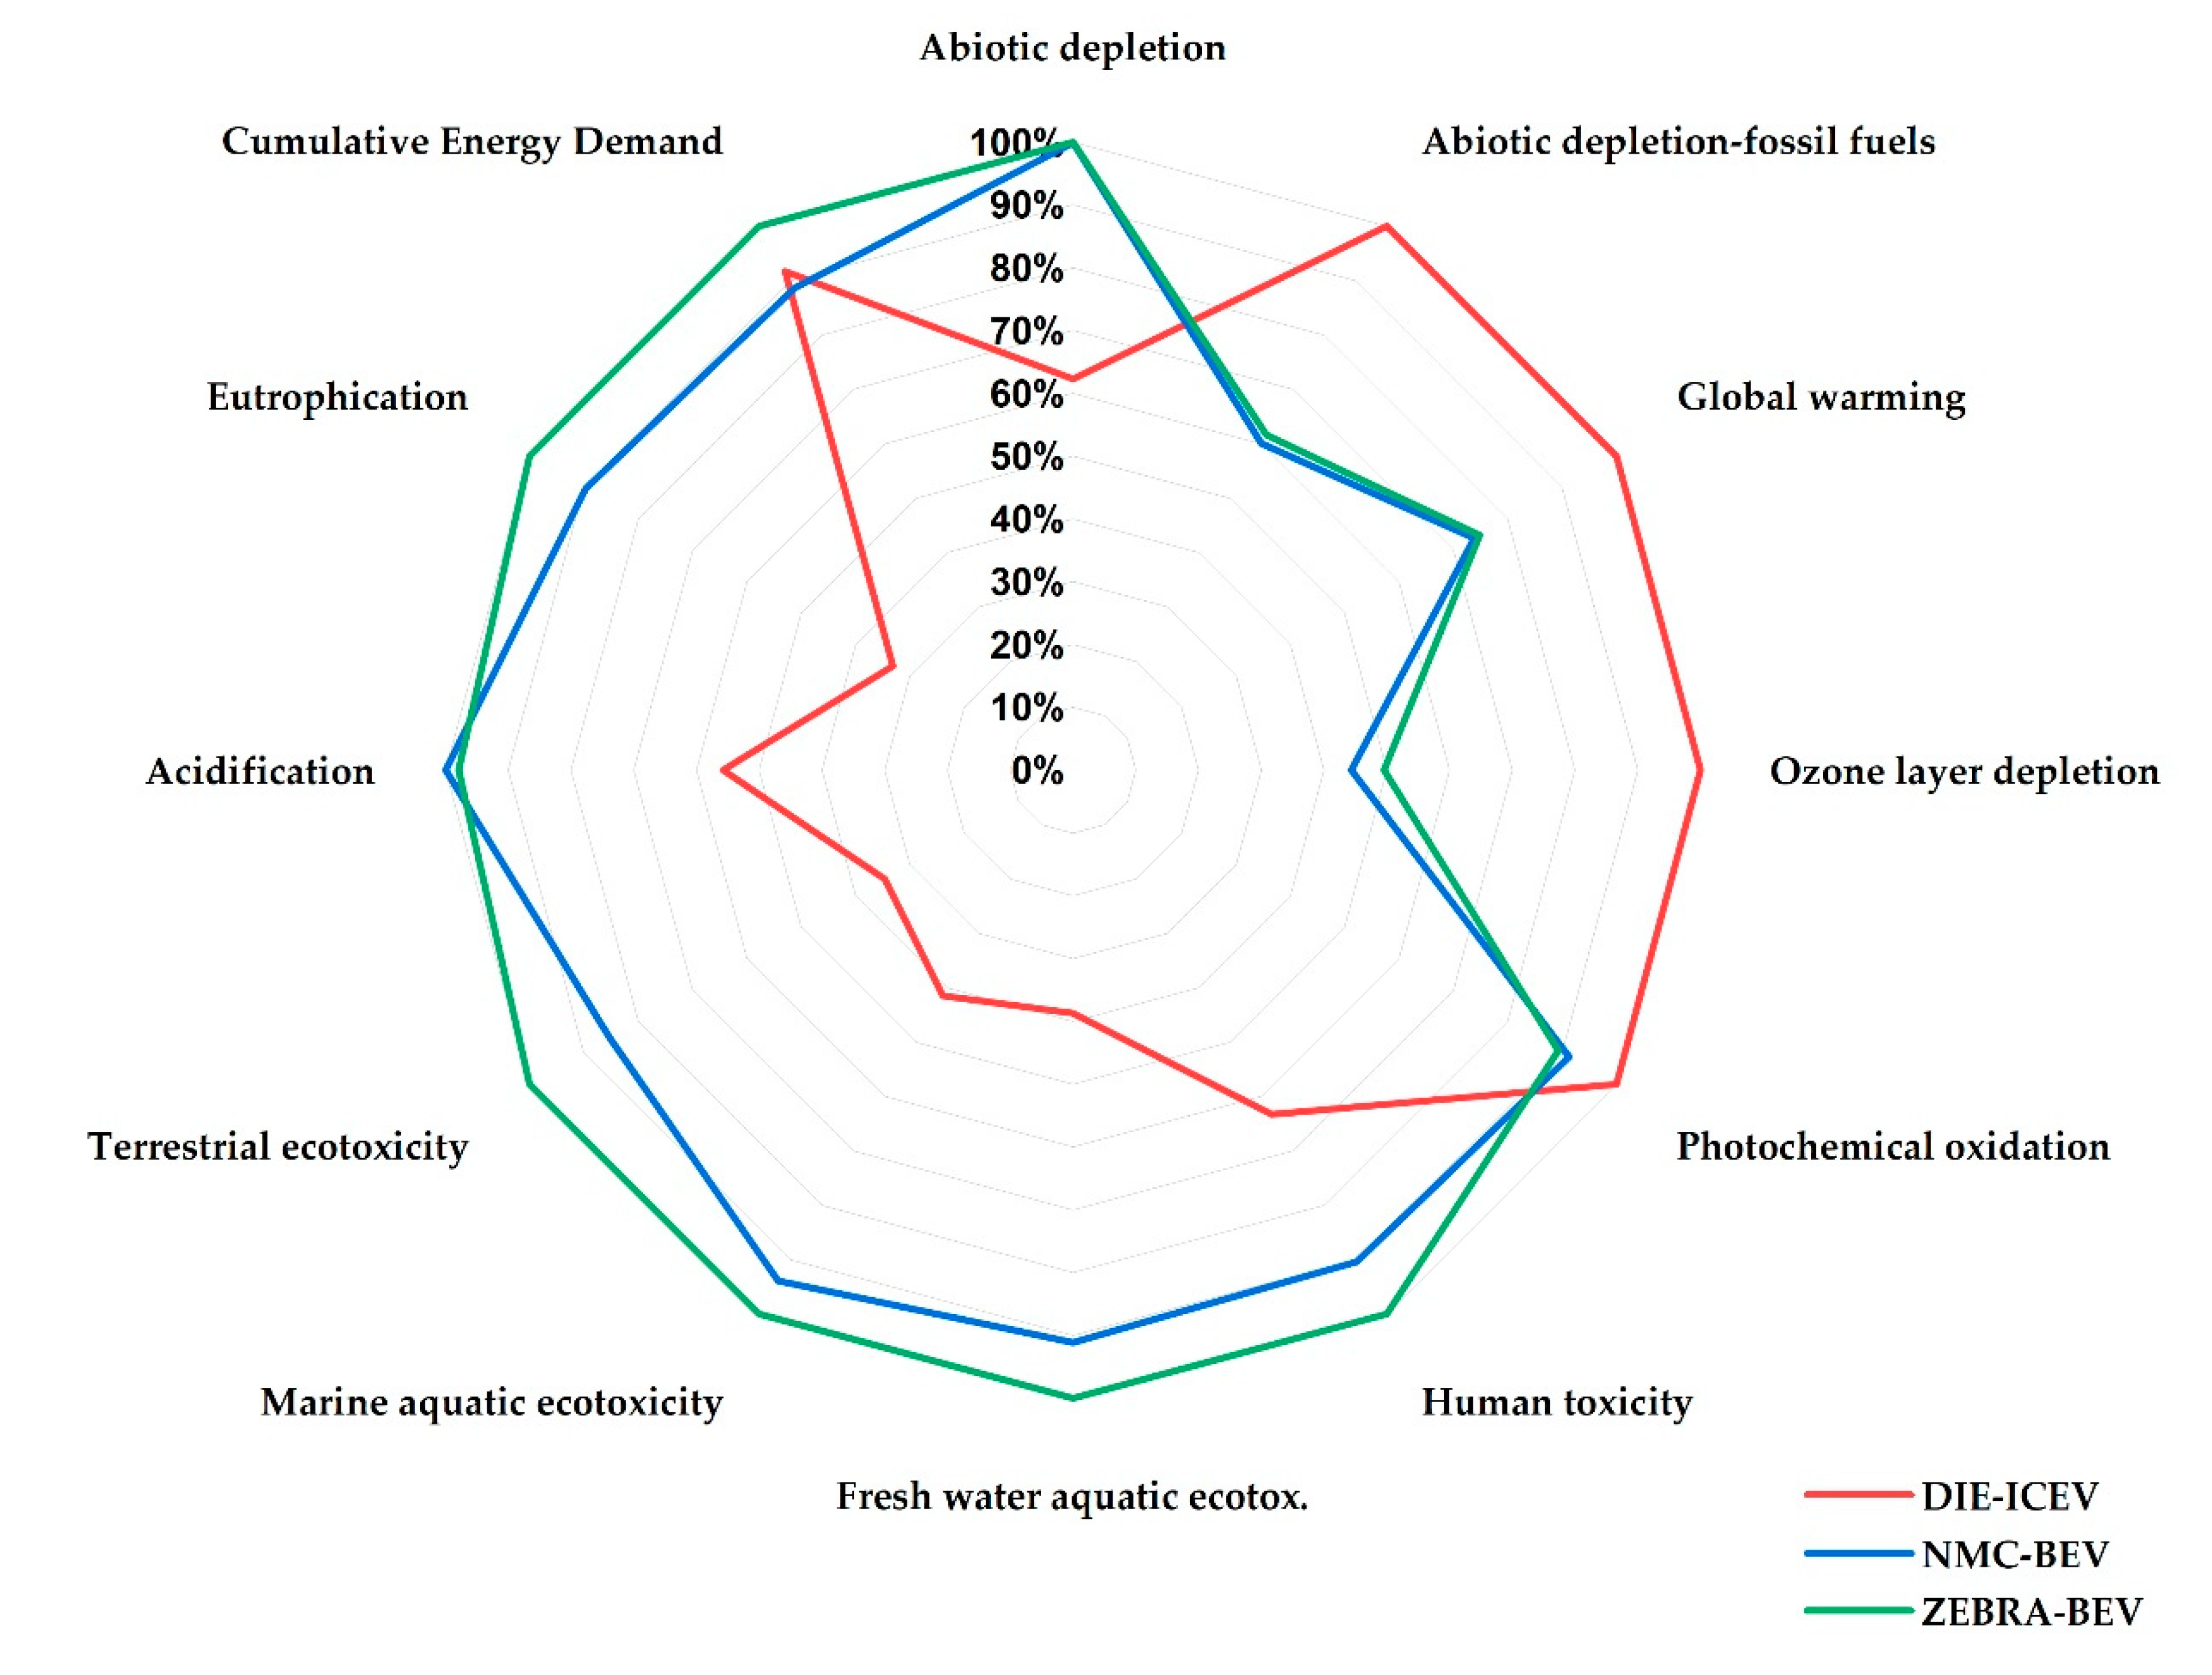
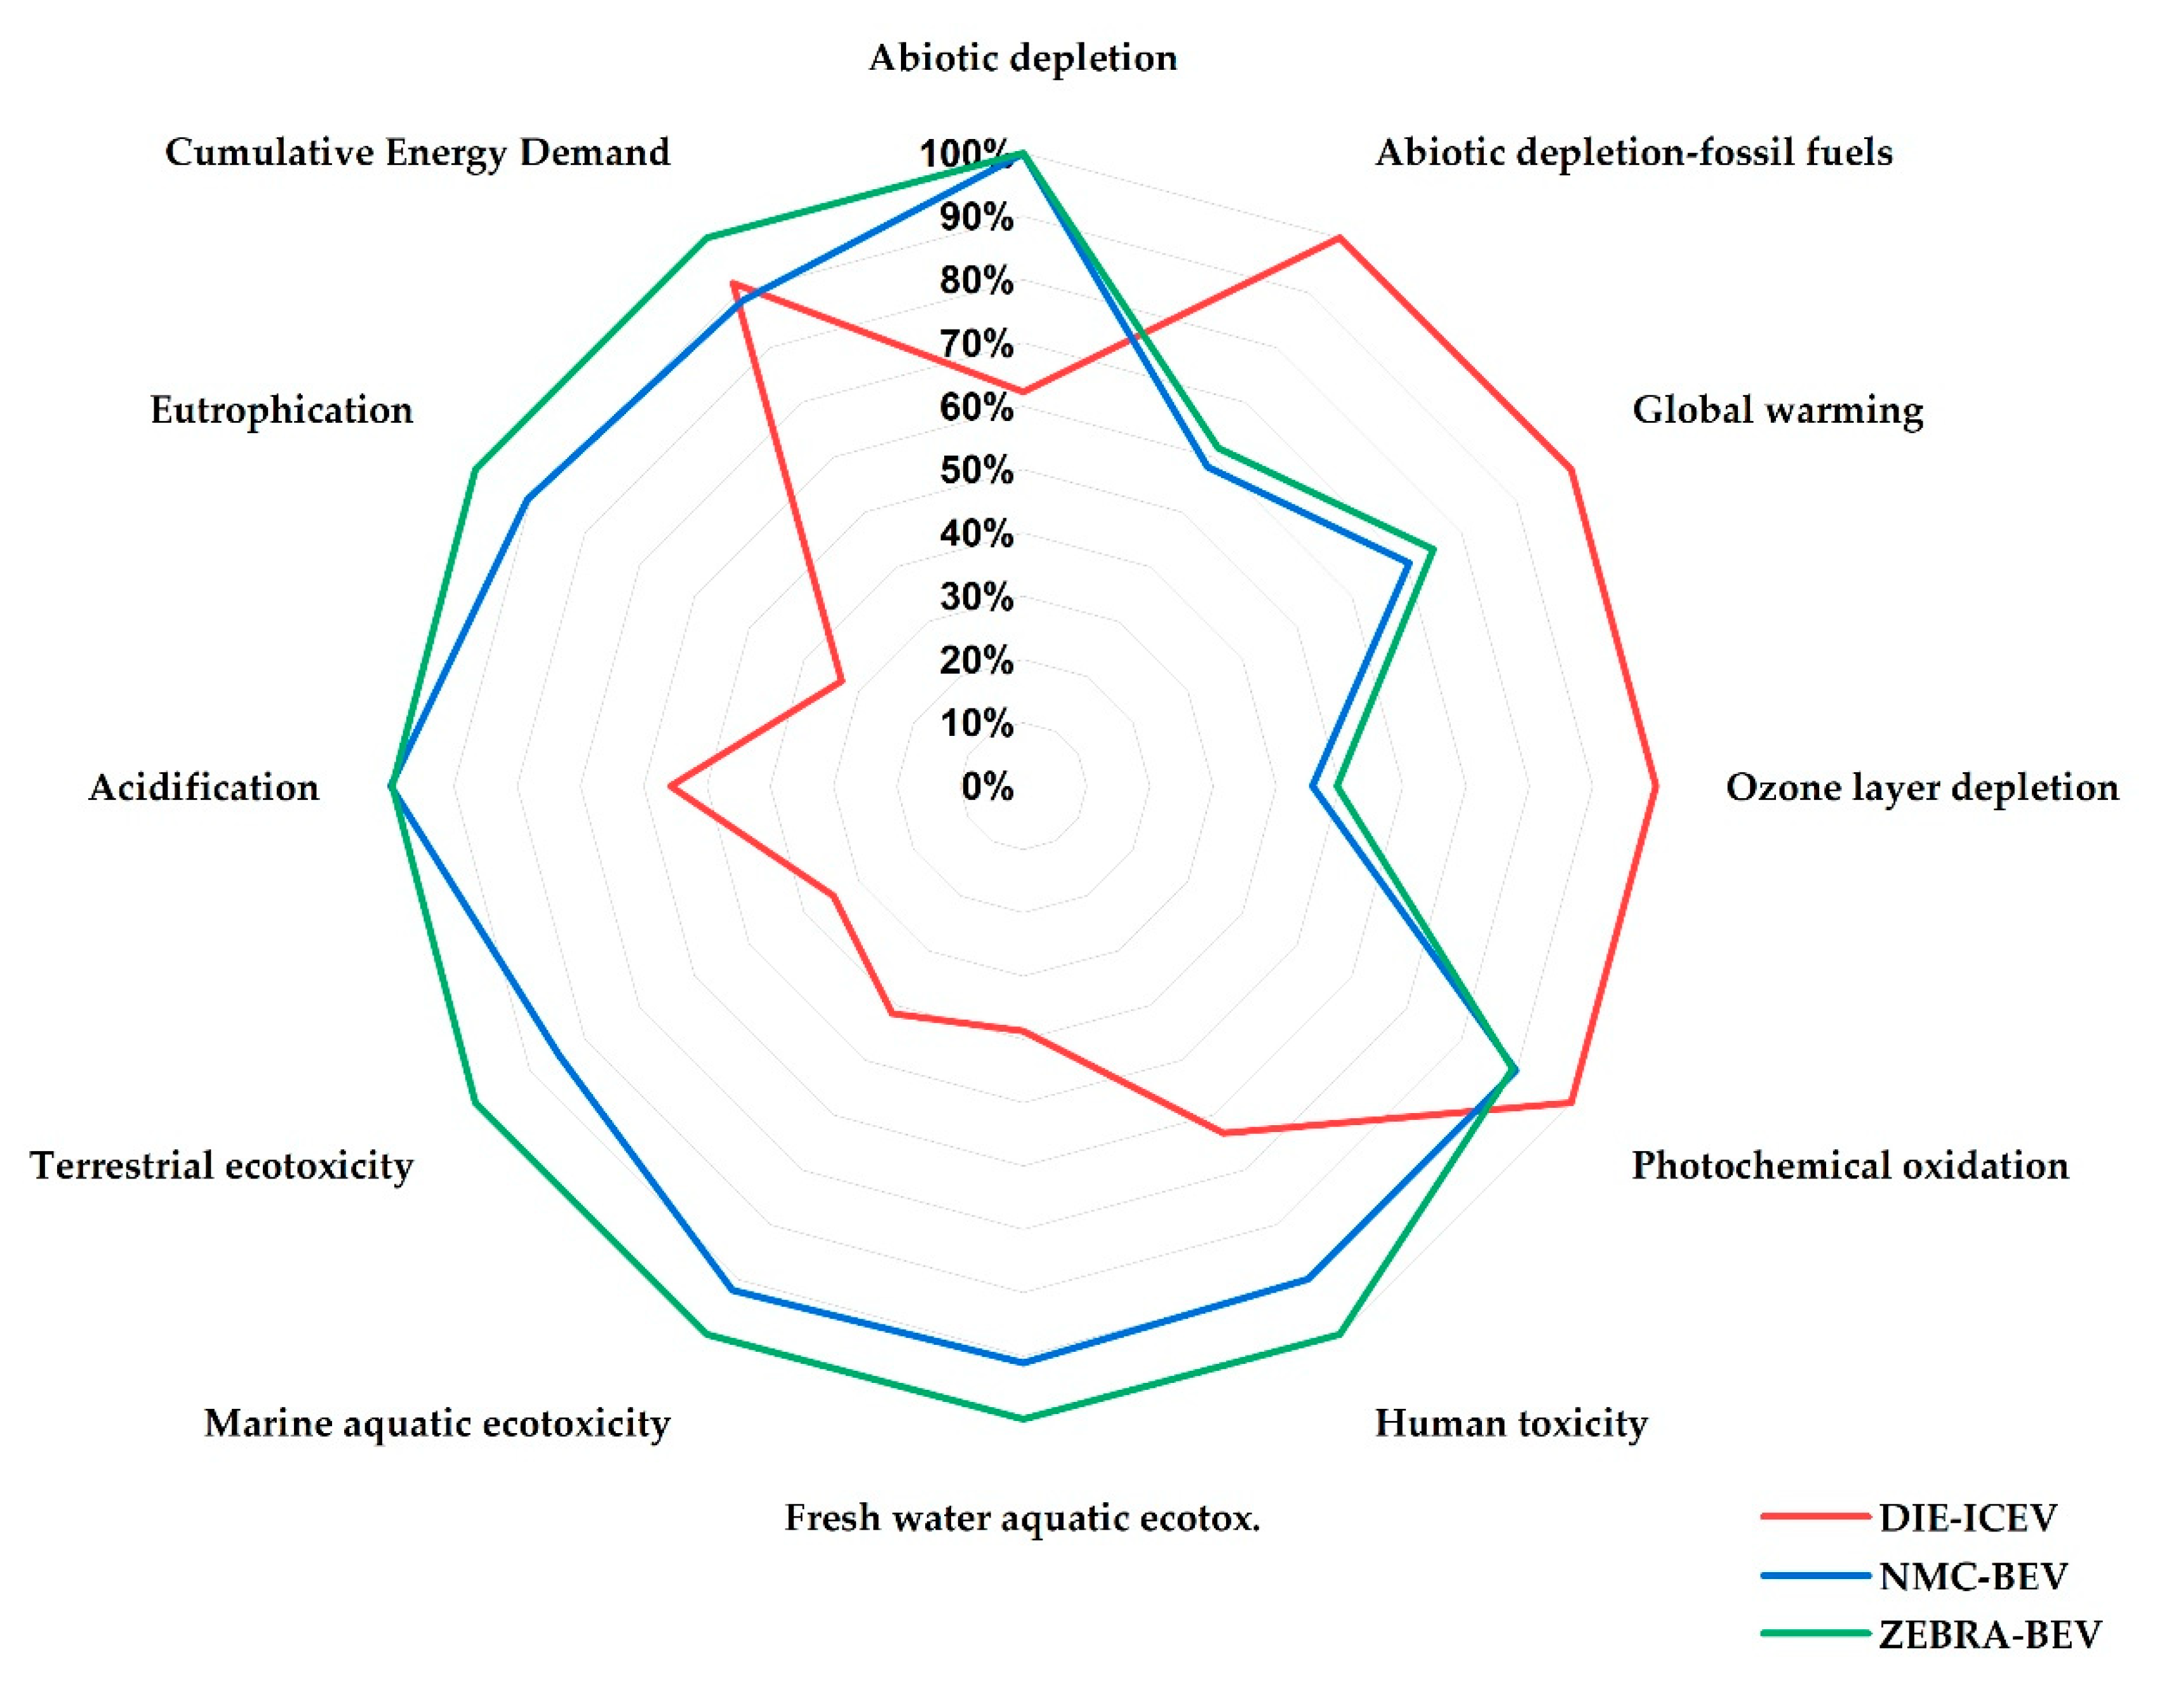
  • NMC111 performs better for all the impact categories, except for ADP-FF, GWP, ODP and CED, where ZEBRA shows the lowest impacts.
Life cycle assessment of three LDCV configurations: NMC111-BEV, ZEBRA-BEV, and conventional diesel
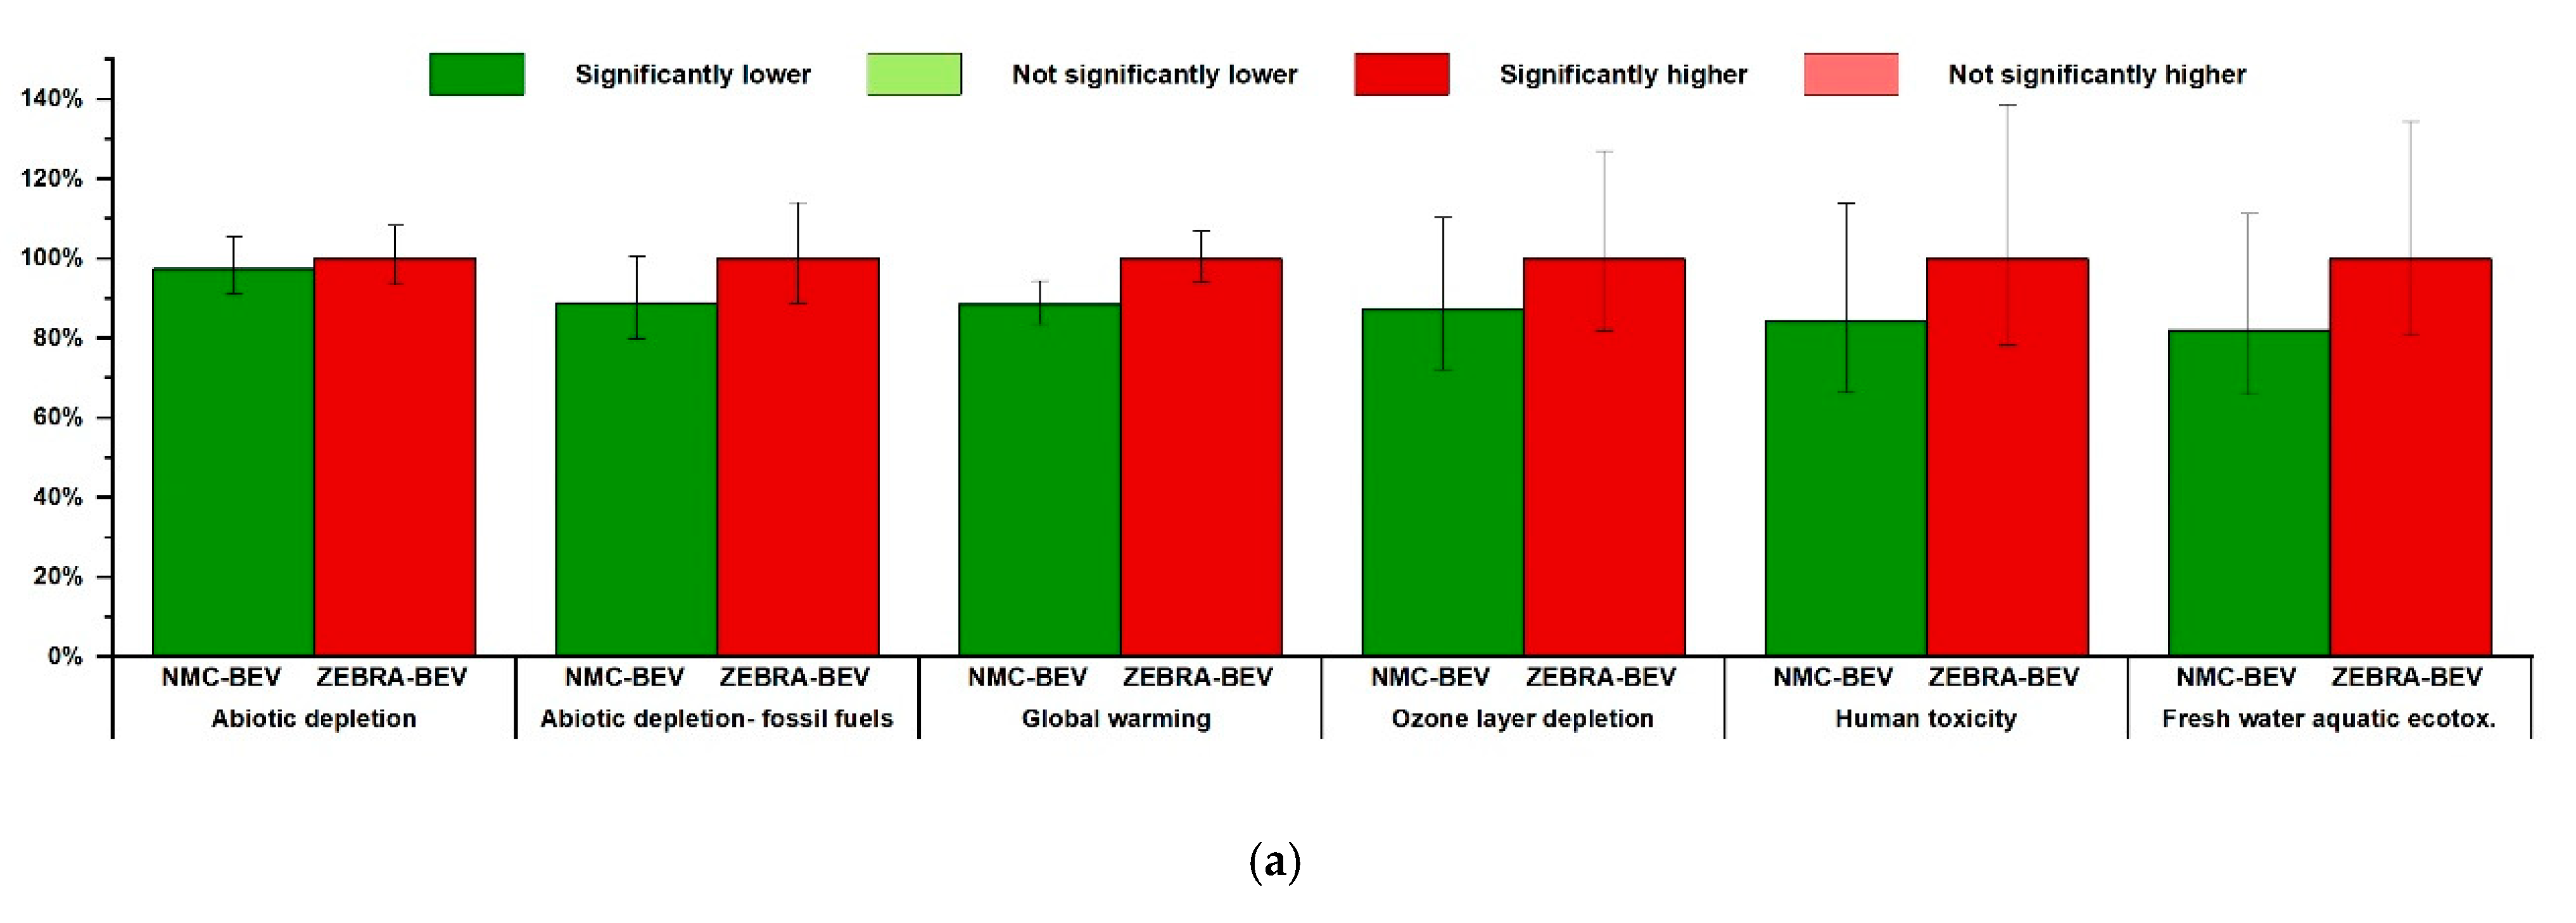
  • All the impact categories of NMC-BEV are significantly lower than those of ZEBRA-BEV.
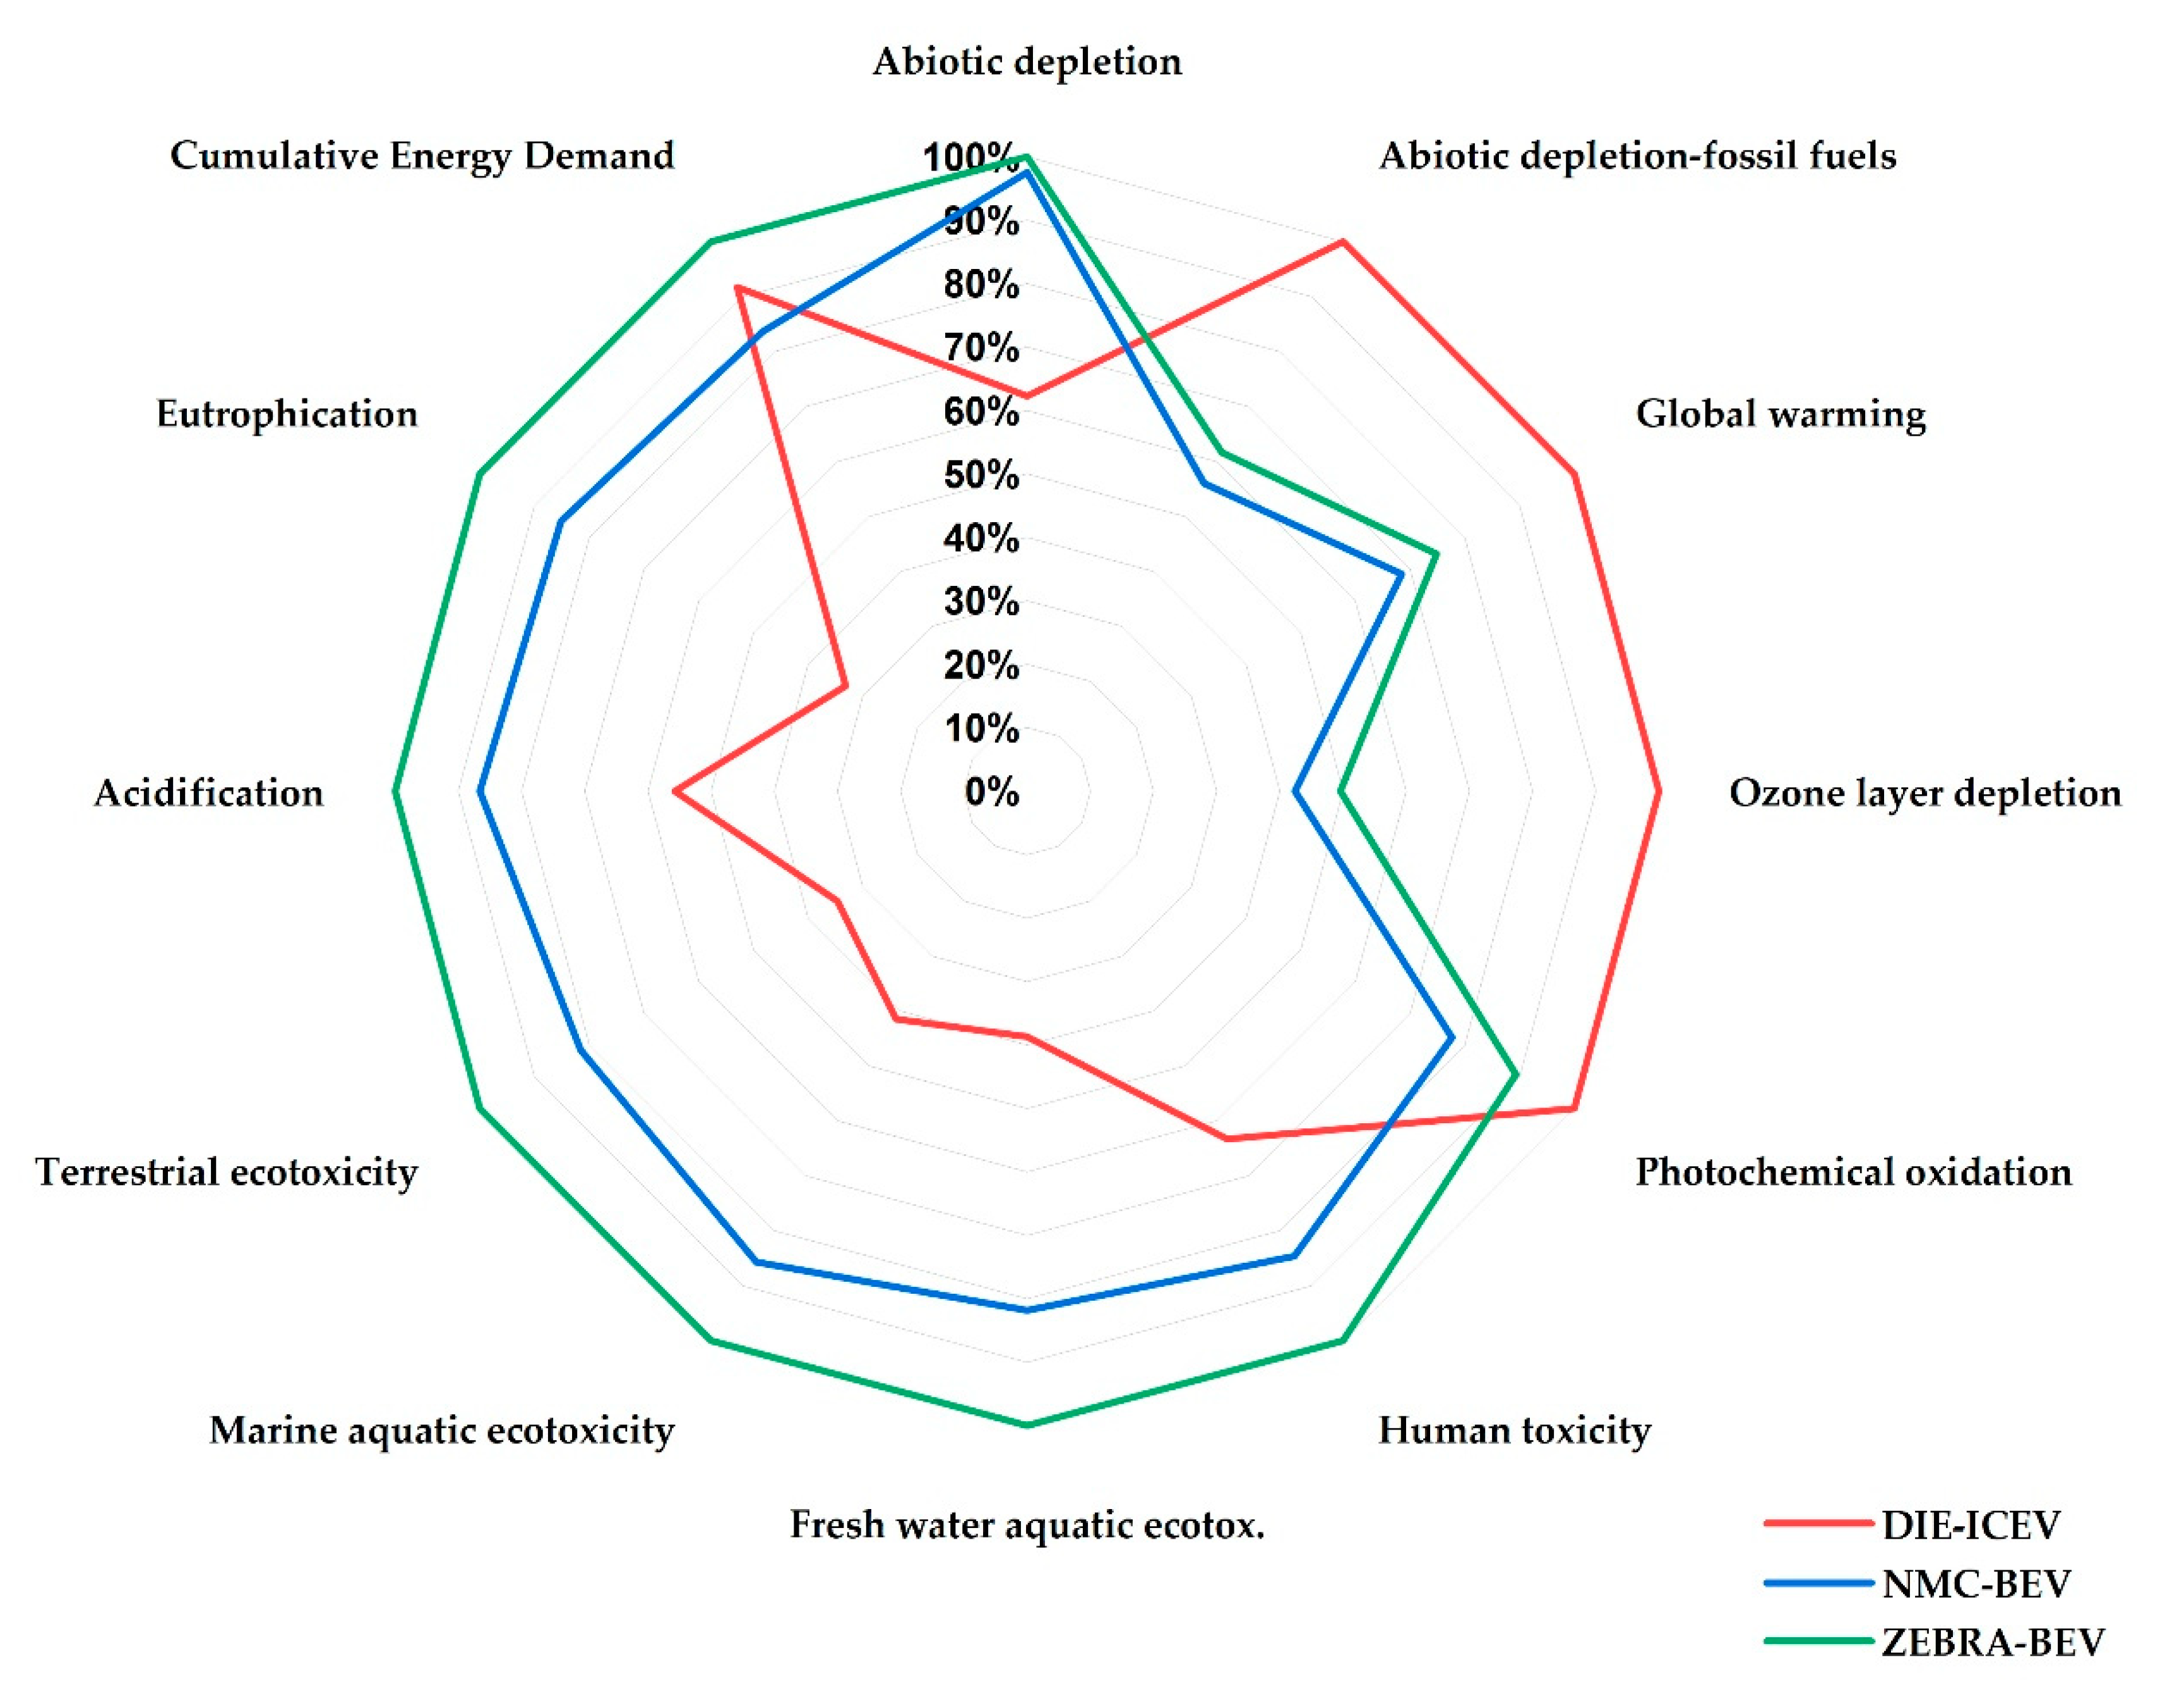
  • From a comparison of the vehicle LCA of the electric and diesel configurations, the following has emerged:
    The electric configurations show advantages over the diesel configuration, albeit only for GWP, POP, ADP-FF, and ODP.
    All the vehicle configurations seem to have quite similar impacts for CED.
    The diesel configuration shows a lower impact than the electric ones for HTP, F-ECOTP, M-ECOTP, T-ECOTP, AP, EP, and ADP.
    Both the NMC111 and ZEBRA batteries largely deteriorate the vehicle impacts, especially for POP (30 and 36%, respectively) and AP (30 and 37%, respectively).
    With reference to POP, it is worth pointing out that the use-phase emissions from electric powertrains are significant because of the energy carrier production, (especially because of the contribution of coal to electricity generation).
  • A new vehicle configuration has been introduced, for which the driving range of the NMC111-BEV has been increased by installing an additional NMC111 battery pack. Even though the impacts of the NMC111-BEV increase, these impacts can still be considered significantly lower than those of the ZEBRA BEV (with only two battery packs) for all the categories, except ADP, GWP, POP, and AP (for which the differences between the two configurations are not significant).
  • A further comparison has been made by varying the production site of NMC111 from China to Europe. The GWP of the NMC111-BEV with three battery packs reduces from 0.350 kgCO2/km to 0.299 kgCO2/km, when the production is moved from China to Europe.
Finally, it is worth highlighting the importance of the specific application case for which the battery is employed for the LCA results. The previous results show that when the total impacts of vehicles are considered, NMC-BEV performs better than ZEBRA-BEV in all the considered categories, whereas NMC is worse than ZEBRA for ADP-FF, GWP, ODP, and CED when only battery production is taken into account. This leads to the conclusion that the production and EoL impacts of a battery itself are not sufficient to draw conclusions about the impacts of a vehicle. The vehicle use phase in fact is extremely important to establish the best solution from an environmental point of view. Consequently, a careful modelling of the vehicle use phase can be of paramount importance for an accurate cradle-to-grave LCA of a vehicle. This highlights the importance of the approach used in this study, whereby vehicle tailpipe emissions and fuel consumption have been evaluated using an ad hoc developed backward-facing simulation approach that takes the longitudinal dynamics of the LDCV into account, and estimates the efficiency of diesel ICE, electric machines, power converters, and transmission components, on the basis of experimentally derived look-up tables provided by the manufacturers.

Supplementary Materials

Supplementary Materials: The following are available online at https://www.mdpi.com/2076-3417/11/3/1160/s1, Figure S1: Cathode production impacts per kg battery pack, Figure S2: Cell production impact per kg battery pack, Figure S3: ZEBRA battery’s production impacts, Figure S4: Uncertainty analysis of NMC-BEV per km. In this figure NMC-BEV is powered by 2 battery packs, Figure S5: Uncertainty analysis of NMC-BEV per km. In this figure NMC-BEV is powered by 3 battery packs, Figure S6. Uncertainty analysis of ZEBRA-BEV per km, Table S1: Life Cycle Inventory of cathode production per kg cathode, Table S2: Life Cycle Inventory of cell production per kg cell, Table S3: Life Cycle Inventory of non-cell materials per 1 kg battery pack, Table S4: Life Cycle Inventory of the amount of energy required for the final assembly of 1 kg battery pack, Table S5: Fate of materials, Table S6: Inventory of cell EoL per kg cell, Table S7: Inventory of non-cell EoL per kg battery pack, Table S8: Total life cycle environmental impacts referred to 1 kg of battery pack, Table S9: Impact assessment of battery production stage per kg of battery pack, Table S10: Impact assessment of battery production per kWh, Table S11: Impact assessment of cathode production per kg battery pack, Table S12: Impact assessment of cathode production per kWh, Table S13: Impact assessment of cell production per kg battery pack, Table S14: Impact assessment of cell production per kWh, Table S15: Impact assessment of non-cell materials production per kg battery pack, Table S16: Impact assessment of non-cell materials production per kWh, Table S17: Impact assessment of final assembly’s energy per kg of battery pack, Table S18: Impact assessment of cell EoL per kg battery pack, Table S19: Impact assessment of cell EoL per kWh, Table S20: Impact assessment of cell recycling per kg battery pack, Table S21: Impact assessment of cell recycling per kWh, Table S22: Impact assessment of non-cell materials EoL per kg battery pack, Table S23: Impact assessment of non-cell materials EoL per kWh, Table S24: Impact assessment of Zebra battery per kg battery pack, Table S25: Impact assessment of Zebra battery per kWh, Table S26: Impact assessment of DIE-ICEV per km, Table S27: Impact assessment of NMC-BEV per km (first scenario with 2 NMC battery packs), Table S28: Impact assessment of NMC-BEV per km (second scenario with 3 NMC battery packs), Table S29: Impact assessment of ZEBRA-BEV per km, Table S30: Monte Carlo analysis, Table S31: Monte Carlo analysis, Table S32: Monte Carlo analysis. Comparison between battery production in China and in Europe in the second scenario (3 NMC battery packs power the NMC-BEV).

Author Contributions

Investigation and methodology development, A.A. and M.L.M.; formal analysis, A.A. and M.L.M.; writing–original draft preparation, A.A. and M.L.M., writing—review and editing G.D. and E.S.; supervision G.D. and E.S. All authors have read and agreed to the published version of the manuscript.

Funding

This research received no external funding.

Conflicts of Interest

The authors declare no conflict of interest.

Abbreviations

ADPAbiotic Depletion Potential
ADP-FFAbiotic Depletion Potential-Fossil Fuels
APAcidification potential
BEVBattery Electric Vehicle
BMSBattery Management System
BOLBeginning of Life
BOMBill of Materials
CEDCumulative Energy Demand
EoLEnd-of-Life
EPEutrophication potential
F-ECOTPFreshwater Aquatic Ecotoxicity
FUFunctional Unit
GHGGreenhouse gas
GVWGross Vehicle Weight
GWPGlobal warming potential
HTPHuman Toxicity Potential
ICEVInternal Combustion Engine Vehicle
LCILife Cycle Inventory
LCIALife Cycle Impact Assessment
LDCVLight Duty Commercial Vehicle
LFPLithium Iron Phosphate
LIBLi-Ion Batteries
LCALife Cycle Assessment
LiPF6Lithium Hexafluorophosphate
M-ECOTPMarine Aquatic Ecotoxicity Potential
NMCNickel-Manganese-Cobalt
NMPN-methyl-2-pyrrolidone
ODPOzone depletion potential
PEPolyethylene
PEFCRProduct Environmental Footprint Category Rule
PETpolyethylene terephthalate
POPPhotochemical Oxidation Potential
PPPolypropylene
T-ECOTPTerrestrial Ecotoxicity Potential
ZEBRASodium-Nickel-Chloride

Appendix A. Monte Carlo Analysis of the Impact Assessment Results

Uncertainty in LCA is pervasive, and it is widely acknowledged that uncertainty analyses should be carried out in LCA to grant a more rigorous status to the conclusions of a study [55]. The Monte Carlo technique has here been used to measure the effects that the data and process uncertainties have on the LCA results [56]. Monte Carlo analysis is a numerical way of processing uncertainty data and establishing an uncertainty range in the calculated results [47]. In order to use Monte Carlo analysis to estimate the overall uncertainty of a life cycle system, a sufficient number of iterations of the model must be run to converge on a mean value [56]. In order to ensure an adequate convergence with real systems [56], 10,000 iterations were used for this study.
In this study, NMC111-BEV and ZEBRA-BEV were first assessed in a stand-alone analysis (Figures S5–S7) and then a comparative analysis of the two BEV alternative systems was conducted.
Figure A1 compares the LCA impacts of the two versions of the electric LDCV, i.e., equipped with two NMC battery packs (NMC-BEV) and two ZEBRA battery packs (ZEBRA-BEV). The impacts were normalised to the highest score in each category. The vertical line shows the uncertainty range for each vehicle and the impact category. The range expresses 95% confidence interval [47]. Considering all the unit processes, about 65% of the values contain uncertainty data. About 90–100% of the Monte Carlo runs have shown that NMC-BEV has lower impacts than ZEBRA-BEV for all the categories (Tables S30–S32), i.e., according to the guidelines reported in [47], the impact of NMC-BEV can be considered significantly lower than that of ZEBRA-BEV.
The standard error of the mean (SEM) indicates how much the mean value is changed by the previous Monte Carlo run. The lower the SEM, the more reliable the results are (a SEM below 0.01 is acceptable) [47]. In this study, SEM is acceptable (≤0.01) for all the vehicle configurations and all the impact categories, except for Marine Aquatic Ecotoxicity, for which SEM ranges from 0.82 ÷ 1.67 were obtained.
Figure A1. (a,b) Graphical representation of the comparison of the uncertainty range of the BEV vehicles. In this Monte Carlo analysis, the NMC111-BEV is powered by 2 battery packs. Some impact categories present higher values than 140% and lower ones than 0%.
Applsci 11 01160 g0a1aApplsci 11 01160 g0a1b
A second scenario, in which three NMC battery packs are mounted onto the vehicle, has been considered to increase the driving range of the electric LDV. In this case, the impacts of the NMC-BEV increase and, when the Monte Carlo analysis is conducted, the difference is not significant for only four effects: ADP, GWP, POP, and AP. This is shown in Figure A2, where the brighter colours represent a significant difference between the two vehicles, while the lighter colours represent no significant differences.
The ZEBRA-BEV vehicle has higher ozone layer depletion, eutrophication, and cumulative energy demand results than NMC-BEV in 100% of the runs.
The deterministic results show that NMC-BEV has the lowest GWP result of the three alternatives. However, according to the Monte Carlo analysis, NMC-BEV is lower than ZEBRA-BEV, for 83% of the runs, but there is a 17% likelihood of obtaining the opposite result.
Figure A2. (a,b) Graphical representation of the comparison of the uncertainty range of the BEV vehicles. In this Monte Carlo analysis, the NMC-BEV is powered by 3 battery packs. Some impact categories present higher values than 140% and lower ones than 0%.
Applsci 11 01160 g0a2
A comparative uncertainty analysis was also carried out between the ZEBRA-BEV vehicle and the second scenario of the NMC-BEV vehicle by varying the production location of the NMC battery, that is, assuming it is produced in Europe using the European average electricity mix instead of in China. Figure A3 shows that, in this case, the GWP of the NMC-BEV is lower than ZEBRA-BEV for 100% of the runs, while the difference remains insignificant for Abiotic depletion, Acidification, and Photochemical Oxidation (further details are available in the supporting material section).
Figure A3. (a,b) Graphical representation of the comparison of the uncertainty range of the BEV vehicles, varying the production location of the NMC battery. In this Monte Carlo analysis, the NMC-BEV is powered by 3 battery packs. Some impact categories present higher values than 140% and lower ones than 0%.
Applsci 11 01160 g0a3

References

  1. Notter, D.A.; Gauch, M.; Widmer, R.; Wäger, P.; Stamp, A.; Zah, R.; Althaus, H.-J. Contribution of Li-ion batteries to the environmental impact of electric vehicles. Environ. Sci. Technol. 2010, 44, 6550–6556. [Google Scholar] [CrossRef] [PubMed]
  2. Iclodean, C.; Varga, B.; Burnete, N.; Cimerdean, D.; Jurchiş, B. Comparison of Different Battery Types for Electric Vehicles. IOP Conf. Ser. Mater. Sci. Eng. 2017, 252. [Google Scholar] [CrossRef] [Green Version]
  3. Ding, Y.; Cano, Z.P.; Yu, A.; Lu, J.; Chen, Z. Automotive Li-Ion Batteries: Current Status and Future Perspectives. Electrochem. Energy Rev. 2019, 2, 1–28. [Google Scholar] [CrossRef]
  4. Ou, D. State of the Art of Life Cycle Inventory Data for Electric Vehicle Batteries. Master’s Thesis, Degree Project in Environmental Engineering, School of Architecture and the Built Environment, KTH Royal Institute of Technology, Stockholm, Sweden, 2017. Available online: https://kth.diva-portal.org/smash/get/diva2:1163424/FULLTEXT01.pdf (accessed on 15 November 2020).
  5. Velázquez-Martínez, O.; Valio, J.; Santasalo-Aarnio, A.; Reuter, M.; Serna-Guerrero, R. A critical review of lithium-ion battery recycling processes from a circular economy perspective. Batteries 2019, 5, 68. [Google Scholar] [CrossRef] [Green Version]
  6. International Energy Agency. Innovation in Batteries and Electricity Storage. 2020. Available online: https://www.iea.org/reports/innovation-in-batteries-and-electricity-storage (accessed on 15 November 2020).
  7. Märker, K.; Reeves, P.J.; Xu, C.; Griffith, K.J.; Grey, C.P. Evolution of Structure and Lithium Dynamics in LiNi0.8Mn0.1Co0.1O2 (NMC811) Cathodes during Electrochemical Cycling. Chem. Mater. 2019, 31, 2545–2554. [Google Scholar] [CrossRef]
  8. Margaritis, D.; Anagnostopoulou, A.; Tromaras, A.; Boile, M. Electric commercial vehicles: Practical perspectives and future research directions. Res. Transp. Bus. Manag. 2016, 18, 4–10. [Google Scholar] [CrossRef]
  9. Dunn, J.B.; Gaines, L.; Kelly, J.C.; James, C.; Gallagher, K.G. The significance of Li-ion batteries in electric vehicle life-cycle energy and emissions and recycling’s role in its reduction. Energy Environ. Sci. 2015, 8, 158–168. [Google Scholar] [CrossRef]
  10. Ellingsen, L.A.W.; Hung, C.R.; Strømman, A.H. Identifying key assumptions and differences in life cycle assessment studies of lithium-ion traction batteries with focus on greenhouse gas emissions. Transp. Res. Part D Transp. Environ. 2017, 55, 82–90. [Google Scholar] [CrossRef]
  11. Kallitsis, E.; Korre, A.; Kelsall, G.; Kupfersberger, M.; Nie, Z. Environmental life cycle assessment of the production in China of lithium-ion batteries with nickel-cobalt-manganese cathodes utilising novel electrode chemistries. J. Clean. Prod. 2020, 254, 120067. [Google Scholar] [CrossRef]
  12. Kelly, J.C.; Dai, Q.; Wang, M. Globally regional life cycle analysis of automotive lithium-ion nickel manganese cobalt batteries. Mitig. Adapt. Strateg. Glob. Chang. 2019. [Google Scholar] [CrossRef]
  13. Wentker, M.; Greenwood, M.; Leker, J. A bottom-up approach to lithium-ion battery cost modeling with a focus on cathode active materials. Energies 2019, 12, 504. [Google Scholar] [CrossRef] [Green Version]
  14. Miao, Y.; Hynan, P.; von Jouanne, A.; Yokochi, A. Current li-ion battery technologies in electric vehicles and opportunities for advancements. Energies 2019, 12, 1074. [Google Scholar] [CrossRef] [Green Version]
  15. Ahmed, S.; Nelson, P.A.; Gallagher, K.G.; Susarla, N.; Dees, D.W. Cost and energy demand of producing nickel manganese cobalt cathode material for lithium ion batteries. J. Power Sources 2017, 342, 733–740. [Google Scholar] [CrossRef] [Green Version]
  16. Wood, M.; Li, J.; Ruther, R.E.; Du, Z.; Self, E.C.; Meyer, H.M.; Daniel, C.; Belharouak, I.; Wood, I.D.L. Chemical stability and long-term cell performance of low-cobalt, Ni-Rich cathodes prepared by aqueous processing for high-energy Li-Ion batteries. Energy Storage Mater. 2020, 24, 188–197. [Google Scholar] [CrossRef]
  17. Battery University. Learning the Basics about Batteries—Types of Lithium-ion. Available online: https://batteryuniversity.com/learn/article/types_of_lithium_ion#:~:text=Nickel-based-systems-have-higher,-and-higher-to-boost-capacity (accessed on 10 January 2020).
  18. Ellingsen, L.A.W.; Majeau-Bettez, G.; Singh, B.; Srivastava, A.K.; Valøen, L.O.; Strømman, A.H. Life Cycle Assessment of a Lithium-Ion Battery Vehicle Pack. J. Ind. Ecol. 2014, 18, 113–124. [Google Scholar] [CrossRef] [Green Version]
  19. Hao, H.; Mu, Z.; Jiang, S.; Liu, Z.; Zhao, F. GHG Emissions from the production of lithium-ion batteries for electric vehicles in China. Sustainability 2017, 9, 504. [Google Scholar] [CrossRef] [Green Version]
  20. Hawkins, T.R.; Singh, B.; Majeau-Bettez, G.; Strømman, A.H. Comparative Environmental Life Cycle Assessment of Conventional and Electric Vehicles. J. Ind. Ecol. 2013, 17, 53–64. [Google Scholar] [CrossRef]
  21. Dai, Q.; Kelly, J.C.; Gaines, L.; Wang, M. Life cycle analysis of lithium-ion batteries for automotive applications. Batteries 2019, 5, 48. [Google Scholar] [CrossRef] [Green Version]
  22. Majeau-Bettez, G.; Hawkins, T.R.; Strømman, A.H. Life Cycle Environmental Assessment of Lithium-Ion and Nickel Metal Hydride Batteries for Plug-In Hybrid and Battery Electric Vehicles. Environ. Sci. Technol. 2011, 45, 4548–4554. [Google Scholar] [CrossRef]
  23. Dai, Q.; Spangenberger, J.; Ahmed, S.; Gaines, L.; Kelly, J.C.; Wang, M. EverBatt: A Closed-loop Battery Recycling Cost and Environmental Impacts Model Energy Systems Division; Argonne National Lab. (ANL): Argonne, IL, USA, 2019. [Google Scholar]
  24. Yang, L.; Hao, C.; Chai, Y. Life cycle assessment of commercial delivery trucks: Diesel, plug-in electric, and battery-swap electric. Sustainability 2018, 10, 4547. [Google Scholar] [CrossRef] [Green Version]
  25. Nordelöf, A.; Poulikidou, S.; Chordia, M.; de Oliveira, F.B.; Tivander, J.; Arvidsson, R. Methodological approaches to end-of-life modelling in life cycle assessments of lithium-ion batteries. Batteries 2019, 5, 51. [Google Scholar] [CrossRef] [Green Version]
  26. Recharge. PEFCR—Product Environmental Footprint Category Rules for High Specific Energy Rechargeable Batteries for Mobile Applications; European Commission: Brussels, Belgium, 2020; pp. 1–98. [Google Scholar]
  27. Energy Agency. World Energy Outlook 2020; IEA: Paris, France, 2020. [Google Scholar]
  28. Çabukoglu, E.; Georges, G.; Küng, L.; Pareschi, G.; Boulouchos, K. Battery electric propulsion: An option for heavy-duty vehicles? Results from a Swiss case-study. Transp. Res. Part C Emerg. Technol. 2018, 88, 107–123. [Google Scholar] [CrossRef]
  29. Teoh, T.; Kunze, O.; Teo, C.C.; Wong, Y.D. Decarbonisation of urban freight transport using electric vehicles and opportunity charging. Sustainability 2018, 10, 3258. [Google Scholar] [CrossRef] [Green Version]
  30. Lee, D.Y.; Thomas, V.M.; Brown, M.A. Electric urban delivery trucks: Energy use, greenhouse gas emissions, and cost-effectiveness. Environ. Sci. Technol. 2013, 47, 8022–8030. [Google Scholar] [CrossRef]
  31. Ricardo. Determining the Environmental Impacts of Conventional and Alternatively Fuelled Vehicles through LCA—Interim Report; Directorate-General for Climate Action (European Commission), Ricardo Energy & Environment: Brussels, Belgium, 2020; pp. 1–456. [Google Scholar]
  32. Nigro, N. Lifecycle Greenhouse Gas Emissions from Different Light-Duty Vehicle and Fuel Pathways: A Synthesis of Recent Research. 2013. Available online: https://www.c2es.org/document/lifecycle-greenhouse-gas-emissions-from-different-light-duty-vehicle-and-fuel-pathways-a-synthesis-of-recent-research/ (accessed on 10 December 2020).
  33. Argonne National Laboratory. Cradle-to-Grave Lifecycle Analysis of U.S. Light-Duty Vehicle-Fuel Pathways: A Greenhouse Gas Emissions and Economic Assessment of Current (2015) and Future (2025–2030) Technologies; Argonne National Lab. (ANL): Argonne, IL, USA, 2016; pp. 1689–1699. [Google Scholar]
  34. Amarakoon, S.; Smith, J.; Segal, B. Application of Life-Cycle Assessment to Nanoscale Technology: Lithium-ion Batteries for Electric Vehicles. 2013. Available online: http://www.epa.gov/dfe/pubs/projects/lbnp/final-li-ion-battery-lca-report.pdf (accessed on 2 September 2020).
  35. Marmiroli, B.; Venditti, M.; Dotelli, G.; Spessa, E. The transport of goods in the urban environment: A comparative life cycle assessment of electric, compressed natural gas and diesel light-duty vehicles. Appl. Energy 2020, 260, 114236. [Google Scholar] [CrossRef]
  36. European Commission—Joint Research Centre—Institute for Environment and Sustainability. International Reference Life Cycle Data System (ILCD) Handbook—General guide for Life Cycle Assessment—Detailed Guidance, 1st ed.; EUR 24708 EN; Publications Office of the European Union: Luxembourg, March 2010. [Google Scholar]
  37. Zackrisson, M.; Avellán, L.; Orlenius, J. Life cycle assessment of lithium-ion batteries for plug-in hybrid electric vehicles-Critical issues. J. Clean. Prod. 2010, 18, 1519–1529. [Google Scholar] [CrossRef]
  38. Dai, Q.; Kelly, C.J.; Dunn, J.; Benavides, T.P. Update of Bill-of-materials and Cathode Materials Production for Lithium-ion Batteries in the GREET Model. U.S. Dep. Energy. 2018. Available online: https://greet.es.anl.gov/publication-update_bom_cm (accessed on 31 August 2020).
  39. Allacker, K.; Mathieux, F.; Pennington, D.; Pant, R. The search for an appropriate end-of-life formula for the purpose of the European Commission Environmental Footprint initiative. Int. J. Life Cycle Assess. 2017, 22, 1441–1458. [Google Scholar] [CrossRef]
  40. Zwicker, M.F.R.; Moghadam, M.; Zhang, W.; Nielsen, C.V. Automotive battery pack manufacturing—A review of battery to tab joining. J. Adv. Join. Process. 2020, 1, 100017. [Google Scholar] [CrossRef]
  41. Bennett, L.M.S. Who Wants to Be in Charge? IEA. 2017. Available online: https://www.iea.org/commentaries/who-wants-to-be-in-charge (accessed on 25 November 2020).
  42. Dunn, J.K.J.; James, C.; Gaines, L.; Gallagher, K.; Dai, Q. Material and Energy Flows in the Production of Cathode and Anode Materials for Lithium Ion Batteries; Argonne National Lab. (ANL): Argonne, IL, USA, 2015. [Google Scholar]
  43. Cusenza, M.A.; Bobba, S.; Ardente, F.; Cellura, M.; di Persio, F. Energy and environmental assessment of a traction lithium-ion battery pack for plug-in hybrid electric vehicles. J. Clean. Prod. 2019, 215, 634–649. [Google Scholar] [CrossRef]
  44. Gorner, M. The Global EV Outlook 2019—Life-Cycle Analysis the Clean Energy Ministerial Electric Vehicles Initiative; IEA International Energy Agency, ITF Workshop “LCA of urban Transport Business Models”: Paris, France, 2019; Available online: https://www.iea.org/reports/global-ev-outlook-2019#abstract (accessed on 31 August 2020).
  45. Mohr, M.; Peters, J.F.; Baumann, M.; Weil, M. Toward a cell-chemistry specific life cycle assessment of lithium-ion battery recycling processes. J. Ind. Ecol. 2020, 24, 1310–1322. [Google Scholar] [CrossRef]
  46. Longo, S.; Antonucci, V.; Cellura, M.; Ferraro, M. Life cycle assessment of storage systems: The case study of a sodium/nickel chloride battery. J. Clean. Prod. 2014, 85, 337–346. [Google Scholar] [CrossRef]
  47. Goedkoop, M.; Oele, M.; Leijting, J.; Ponsioen, T.; Meijer, E. Introduction to LCA with SimaPro; PRé, Report Version 5.2. Available online: https://www.researchgate.net/publication/305444131_Introduction_to_LCA_with_SimaPro (accessed on 31 August 2020).
  48. Newkirk, M.S.; Smith, L.R.; Merritt, P.M. Heavy-duty diesel hydrocarbon speciation: Key issues and technological challenges. SAE Tech. Pap. 1993. [Google Scholar] [CrossRef]
  49. Bohac, S.V.; Han, M.; Jacobs, T.J.; López, A.J.; Assanis, D.N.; Szymkowicz, P.G. Speciated hydrocarbon emissions from an automotive diesel engine and DOC utilizing conventional and PCI combustion. SAE Tech. Pap. 2006, 2006. [Google Scholar] [CrossRef]
  50. Payri, F.; Bermúdez, V.R.; Tormos, B.; Linares, W.G. Hydrocarbon emissions speciation in diesel and biodiesel exhausts. Atmos. Environ. 2009, 43, 1273–1279. [Google Scholar] [CrossRef]
  51. Qiao, Q.; Zhao, F.; Liu, Z.; Jiang, S.; Hao, H. Cradle-to-gate greenhouse gas emissions of battery electric and internal combustion engine vehicles in China. Appl. Energy 2017, 204, 1399–1411. [Google Scholar] [CrossRef]
  52. Argonne National Laboratory. GREET® Model the Greenhouse Gases, Regulated Emissions, and Energy Use in Technologies Mode. Available online: https://greet.es.anl.gov/ (accessed on 3 February 2020).
  53. Emilsson, E.; Dahllöf, L. Lithium-Ion Vehicle Battery Production. Status 2019 on Energy Use, CO2 Emissions, Use of Metals, Products Environmental Footprint, and Recycling; No. C 444; IVL Swedish Environmental Research Institute: Stockholm, Sweden, November 2019. [Google Scholar]
  54. Xiong, S.; Ji, J.; Ma, X. Comparative life cycle energy and GHG emission analysis for BEVs and PHEVs: A case study in China. Energies 2019, 12, 834. [Google Scholar] [CrossRef] [Green Version]
  55. Heijungs, R. On the number of Monte Carlo runs in comparative probabilistic LCA. Int. J. Life Cycle Assess. 2020, 25, 394–402. [Google Scholar] [CrossRef] [Green Version]
  56. Raynolds, M.; Checkel, M.D.; Fraser, R.A. Application of Monte Carlo analysis to life cycle assessment. SAE Tech. Pap. 1999. [Google Scholar] [CrossRef]
Figure 1. System boundaries of the LCA of the battery (adapted from PEFCR).
Applsci 11 01160 g001
Figure 2. End-of-Life of the battery components.
Applsci 11 01160 g002
Figure 3. Impacts of NMC111 production and EoL per 1 kWh of battery pack (N.B.: the contribution of the battery use phase is not reported in this plot).
Applsci 11 01160 g003
Figure 4. Cradle-to-grave life cycle assessment of the NMC111 battery.
Applsci 11 01160 g004
Figure 5. Impacts per kWh of different NMC chemistries (a) for the global warming potential (GWP) impact; (b) for the abiotic resource depletion potential (ADP) impact; (c) for the photochemical oxidation potential (POP) impact; (d) for the AP impact.
Applsci 11 01160 g005
Figure 6. Comparison of the NMC111 and ZEBRA manufacturing stages (a) energy basis; (b) mass basis. The impacts are normalised to the highest score in each category.
Applsci 11 01160 g006
Figure 7. Comparison of the environmental performances of NMC111-BEV, ZEBRA-BEV, and DIE-ICEV. The impacts were normalised to the highest score in each category; only the vehicle/battery manufacturing and use stages are included.
Applsci 11 01160 g007
Figure 8. (ad) The LCA of the conventional diesel vehicle (DIE-ICEV), the electric vehicle with two NMC111 battery packs (NMC-BEV), and the electric vehicle with two ZEBRA battery packs (ZEBRA-BEV). The contributions from the production and use-phase of the battery and vehicle and from vehicle maintenance are highlighted for each impact category; no EoL is considered here.
Applsci 11 01160 g008aApplsci 11 01160 g008b
Figure 9. Comparison of the impact categories for NMC111-BEV with an additional battery pack, ZEBRA-BEV and DIE-ICEV. The impacts were normalised to the highest score in each category.
Applsci 11 01160 g009
Figure 10. Comparison of the impact categories for NMC111-BEV, with an additional battery pack and the production location in Europe, with ZEBRA-BEV and DIE-ICEV. The impacts were normalised to the highest score in each category.
Applsci 11 01160 g010
Table 1. Characteristics of the NMC111 battery pack.
Characteristics Sources
Available Energy (BOL)35 kWhPrimary data
No. of parallel units per battery pack2Primary data
No. of cells in series per each unit96Primary data
Nominal voltage of the cell3.7 VPrimary data
Cell weight0.856 kgSecondary data 1
Battery pack weight226 kgEstimated 1
1 From [38].
Table 2. Bills of materials (BOMs) of three types of NMC batteries per kg of battery pack.
NMC111NMC622NMC811
Cell materialskgkgkg
Active Cathode Material0.2870.2630.253
Graphite0.1600.1710.168
Carbon black0.0200.0180.014
Binder (PVDF)0.0250.0240.029
Copper0.1340.1340.131
Aluminium0.0690.0690.068
Electrolyte: LiPF60.0180.0180.021
Electrolyte: Ethylene Carbonate0.0500.0500.057
Electrolyte: Dimethyl Carbonate0.0500.0500.057
Plastic: Polypropylene0.0120.0120.011
Plastic: Polyethylene0.0030.0030.003
Non-cell materials
Copper0.0030.0020.003
Aluminium0.1840.1860.187
Steel0.0070.0040.006
PET0.0050.0040.005
Electronics0.0370.0370.038
Table 3. Main data of the vehicle.
ParametersDIESEL-ICEVNMC-BEVZEBRA-BEV
GVW [kg]520052005200
Max Payload [kg]249519182064
Maximum Power [kW]1078080
Maximum Torque [Nm]350300300
Kerb weight [kg]257729593039
No. of battery packs-22
Total battery capacity [kWh]-7064
Total battery weight [kg]-452532
Table 4. Main parameters of the driving cycles.
CycleDuration [s]Length [km]SEC-Tract [kWh/km]SEC-Brake [kWh/km]V-Tract [km/h]V-Max [km/h]P-Tract [kW]
AUDC9934.830.56−0.4725.4857.7014.15
URBAN258313.480.47−0.4229.8675.2914.07
Table 5. CO2 emissions and Energy Consumption TTW referring to the M1 mission.
CO2-TTW [g/km]EC-TTW [Wh/km]
CycleLoadDIE-ICEV 1NMC-BEVZEBRA-BEVDIE-ICEVZEBRA-BEVNMC-BEV
AUDC50355.2--1424.0561.1424.6
URB50318.1--1276.0540.0406.0
AUDC0301.1--1208.0515.6380.4
URB0277.1--1111.0506.0373
M1 312.9--1254.7530.7396
1 A lower heating value of 42.6 MJ/kg and a density of 0.846 kg/L were assumed for diesel oil.
Table 6. The impacts of GWP on NMC batteries in literature.
StudyProduction
Location
Battery Mass (kg)Battery Capacity (kWh)Manufacturing
(kgCO2eq/kWh)
Manufacturing
(kgCO2eq/kWh)
Recycling
(kgCO2eq/kWh)
[22]EU(1)(1)19622
[18]KR/NO25326.617218
[19]CN1702810417.2
[14]US-40121-
[51]CN188.72711717
[53]averageaverageaverage146-15
This studyCN2263513521.2
This studyEU10015.411.3
1 Majeau-Bettez et al. considered a battery energy density of 112 Wh/kg.
Publisher’s Note: MDPI stays neutral with regard to jurisdictional claims in published maps and institutional affiliations.

