Freshness Monitoring of Packaged Vegetables


Department of Electrical and Computer Engineering, McMaster University, Hamilton, ON L8S 4L8, Canada
*
Author to whom correspondence should be addressed.
Appl. Sci. 2020, 10(21), 7937; https://doi.org/10.3390/app10217937
Submission received: 16 October 2020
/
Revised: 1 November 2020
/
Accepted: 2 November 2020
/
Published: 9 November 2020
(This article belongs to the Section Food Science and Technology)
Abstract
:Smart packaging is an emerging technology that has a great potential in solving conventional food packaging problems and in meeting the evolving packaged vegetables market needs. The advantages of using such a system lies in extending the shelf life of products, ensuring the safety and the compliance of these packages while reducing the food waste; hence, lessening the negative environmental impacts. Many new concepts were developed to serve this purpose, especially in the meat and fish industry with less focus on fruits and vegetables. However, making use of these evolving technologies in packaging of vegetables will yield in many positive outcomes. In this review, we discuss the new technologies and approaches used, or have the potential to be used, in smart packaging of vegetables. We describe the technical aspects and the commercial applications of the techniques used to monitor the quality and the freshness of vegetables. Factors affecting the freshness and the spoilage of vegetables are summarized. Then, some of the technologies used in smart packaging such as sensors, indicators, and data carriers that are integrated with sensors, to monitor and provide a dynamic output about the quality and safety of the packaged produce are discussed. Comparison between various intelligent systems is provided followed by a brief review of active packaging systems. Finally, challenges, legal aspects, and limitations facing this smart packaging industry are discussed together with outlook and future improvements.
1. Introduction
Food packaging was developed to serve several purposes such as limiting food loss and preserving food quality for longer periods. Its main functions can be summarized as protection from possible contaminations as it acts as a barrier, communication of the package information about brands and nutritional content, containment, and convenience to accommodate the fast-paced customer’s lifestyle [1]. However, continuous changes in customer and industry demands led to the evolution of smart packaging as an alternative to conventional packaging. An important purpose of smart packaging is to trace and preserve perishable goods as much as possible while ensuring safety, reducing food waste and environmental impact through monitoring and sensing. Generally, food loss is considered one of the main issues of concern around the world. It was found that almost one third of the food produced is wasted along the supply chain [2]. In Canada, in 2019, the estimated food loss was worth $31 billion, of which 30% was vegetables [2].
Food waste occurs along different stages in the supply chain, starting with on farm waste as a result of inadequate harvesting and handling, to losses through processing and storage, then in transportation and distribution due to the use of unsuitable facilities, and losses at the retail shops due to limited shelf-life or improper storing. Figure 1 shows percentages of food losses for different categories, from post-harvest to distribution. Fruits and vegetables are considered a major contributor after the roots, tubers, and oil-breaking corps to food wastage along the supply chain with 21.6% [3]. Apart from the ethical side of wasting food, other problems such as food contamination is an issue of concern. Many deaths over the years were linked to presence of pathogens in packaged food [4]. The economic loss and the environmental depletion of agricultural resources are also major problems that need to be addressed. All of that brought to attention the necessity to take the appropriate measures to ensure control and reduction in these wastage rates. Smart packaging presents a viable solution in such application to reduce the inefficiencies and wastage in the food supply chain [5].
Many papers were published about the use of smart systems in different food and beverage industries [6]. Some discussed their use in monitoring water quality [7,8,9,10,11]. Other publications focused on freshness detection and control of packaged meat and animal products [12,13,14,15]. Some others were concerned about the freshness of the produce in general [16,17,18,19,20], with less attention and focus to vegetables in specific. However, with the recent increase of illnesses outbreaks related to packaged vegetables [21], the need to have more research on vegetable freshness inside a package in specific became a necessity. This is to avoid food wastage while ensuring the health and safety of the public. Smart systems have a great potential in such application. Smart packaging can be used to monitor the freshness and the quality of the food inside, and also to detect the presence of substances such as Bisphenol A migrating from the plastic package itself that is used in the food and beverage industries [22]. Therefore, with the continuous improvement in smart systems technologies, the possibility of commercial use of smart packaging in the food industry is rising.
In this paper we provide a review of the state-of-the-art smart packaging systems used. Definition and classification into intelligent and active packaging systems are discussed in the first two sections. In the Section 3, we present some of the most important factors affecting vegetables inside the package. In Section 4, intelligent systems are further classified into sensors, indicators, and data carriers with various commercial top niche examples of each category briefly described. In Section 5, a comparison between different intelligent systems are summarized. In Section 6, an introduction to active packaging with a glance on different scavenging and object releasing active components is overviewed. In Section 7, challenges, outlook, and future research opportunities are discussed. In Section 8, a conclusion is provided emphasizing on the importance of smart packaging systems in evaluating freshness monitoring of vegetables.
2. Classification
In the last two decades smart packaging has become popular especially because it leads the consumer and businesses to make better decisions regarding food quality. It can be further classified into two main categories: intelligent packaging (IP) to monitor the freshness and safety, and active packaging (AP) to keep or improve the quality. IP is defined as one of the packaging systems that plays an important role by providing means of sensing/indicating and communicating the information about the freshness and the safety of the consumed vegetables and aims to prolong the shelf life. This emerging packaging technology, that serves as a barrier against environmental influences such as odors, dust, micro-organisms, facilitates decision making regarding the quality of the packaged food. IP contains smart devices that are capable of tracing and monitoring the freshness of the produce. It can also store and transfer the sensed information to retailers and stakeholders to improve the technology. Intelligent packaging (IP) can be classified into three main categories: sensors, indicators, and data carrier, as shown in Figure 2. Each category can be either placed inside or on the package to provide information about each package, or to monitor the environment surrounding the packages [1,23]. In contrast, active packaging (AP) is defined as the system that incorporates active components such as scavenging or releasing objects in response to changes in package headspace to extend the shelf-life of the packaged food. AP can be further classified depending on the objects used inside the package into scavengers and releasers. Scavenging objects concern the capture of excess moisture, odors, and gases such as moisture absorbers, oxygen scavengers, and odor absorbers [23]. The releasing objects are usually emitters/generators that release objects such as antimicrobials agents, carbon dioxide emitters, and antioxidants [23].
3. Factors Indicating the Freshness of Packaged Vegetables
In order to assess the freshness of packaged food, we need to determine which parameters influence its quality so smart monitoring systems can be developed. Examples of such parameters include oxygen and carbon dioxide concentration inside the package, pathogen count, and humidity. In this section, some of the key factors affecting the quality of vegetables are briefly discussed. Some key parameters include respiration gases, temperature, humidity, chlorophyll content in leafy greens, and pathogens that affect the safety of vegetables.
3.1. Oxygen and Carbon Dioxide Effects
Oxygen and carbon dioxide are considered the most important gases because of their global influence on metabolism which has a huge impact on quality of packaged vegetables. These two gases are a crucial part of respiration and photosynthesis processes in vegetables. After cutting vegetables, photosynthesis stops, while breathing continues. In respiration, the oxygen is consumed through chemical reaction to provide energy for vegetables, emitting carbon dioxide as an outcome of that reaction. The ratio between these gases inside the package affects the freshness, firmness, and the color of the packaged product [16]. Thus, keeping these gases’ combination within a certain range inside the package, which is known as modified atmosphere packaging (MAP), is essential to prolong storage duration and shelf-life of packaged vegetable. Three main process of how these gases affect the packaged vegetables are briefly discussed.
3.1.1. Oxidation
The appropriate amount of oxygen inside the package is chosen depending on the type of vegetables. Oxidation is considered an important factor that can affect their shelf life. For example, the oxidation process induces the browning in vegetables by the action of polyphenol oxidase (PPO) [24]. PPO is a coper-containing metalloprotein enzyme that becomes exposed to air in fresh cut vegetables catalyzes the oxidation of phenolic compounds producing quinone, then further reaction with other amino acids produces brown pigment colors (Melanin) on exposed chloroplasts [16,24,25]. The summarized reaction is shown in Figure 3. Therefore, inhibiting this oxidation process requires adjustment of the oxygen partial pressure inside the package. For instance, for lettuce it was found that keeping the oxygen in the range of 0–1 kPa will reduce this process significantly. The problem of oxidation does not only lie in the brown color that might affect customers’ desire to buy, but also leads to loss of the nutritional value of vegetables due to destruction of many nutrients such as vitamins and proteins. Moreover, the flavor may also change with this process, thus the quality deteriorates [23].
3.1.2. Respiratory Metabolism
Respiration generally affects all the metabolic pathways occurring in vegetables. Where through breathing, the consumption of oxygen together with the metabolic materials such as sugars and acids will lead to reduced shelf life of vegetables. This biological process has an effect in suppressing or enhancing the meristematic activity in many vegetables such as asparagus, broccoli, and onions [16]. The meristematic region is where the tissues responsible for the growth are found. For example, controlling the range of oxygen in packaged onions to 3 kPa will result in suppressing the activity of this region, thus preventing sprout and bulb weight loss which will prolong the storage time [16,26].
Elevating carbon dioxide concentration was found to reduce chlorophyll degradation [16]. At the same time, increasing its concentration above certain limits depending on the vegetable type may induce the fermentation process [16]. Hence, keeping CO2 percentage inside the package within the right amount can control the deterioration of chlorophyll content for many vegetables as in broccoli, cabbage, asparagus, and spinach when the partial pressure is kept in the range of 3–5 kPa. Moreover, elevating carbon dioxide concentration would also suppress to a lesser extent the respiration and metabolic materials consumption compared to oxygen [16,27].
3.2. Ethylene Response
Ethylene (C2H4) is a natural hormone that stimulates the ripening process in plants. Reducing the oxygen partial pressure while elevating carbon dioxide to appropriate levels inside the package inhibit ethylene production, this was initially demonstrated by Burg and Burg [28]. For instance, using O2 partial pressure of 0.5–5 kPa and CO2 of 1–5 kPa while keeping the temperature in the range of 0–5 °C for cabbage reduced the ethylene production and hence prolonged its life [16]. In addition, for broccoli, a reduction in methane production by 20% was obtained when treated with 60% CO2 and 20% O2 at 25 °C [29]. This response for low oxygen pressures can be interpreted by understanding ethylene biosynthesis in plants which was described by Yang cycle, where the conversion of 1-aminocyclopropane-1-carboxylicacid (ACC) enzyme to ethylene is suppressed as this reaction is limited by the oxygen concentration inside the package [28,29]. A similar effect was noticed when elevating carbon dioxide levels, where both conversion from ACC to ethylene and the biosynthesis of this enzyme were inhibited [18,28,30].
3.3. Pathogens
Post-harvest handling of leafy greens such as lettuce and spinach has been of concern due to the possibility of contamination with different pathogens. Their presence usually indicates the contamination of vegetables with fecal material and poor sanitation. Many illnesses and deaths reported over the years were related to food contamination [31,32,33]. Thus, legal limits were set for the allowed count of these microorganisms inside a food packaged to ensure its safety. A summary of the most common pathogens in vegetables with their unsatisfactory limits are shown in Table 1.
One of the most common microorganisms found in vegetables is Escherichia coli (E. coli). Most E. coli strains are usually harmless if within the acceptable limits that differs between countries. One study was done in 2007 on 100 samples of bags with tag “ready to eat” of spinach and lettuce from around the world that tested for E. coli presence using the FDA Bacteriological Analytical Manual methods. The number of these bacteria were then counted with the use of Coli Complete disc which is the association of official analytical chemists (AOAC) official method [35,36,37]. The results showed that bagged leafy greens have generic E. coli in the range of 4 to 7 , which is considered a controversial limit in many countries, and satisfactory in others as not all countries have a limit set for generic E. coli count. However, there is a specific strain of E. coli that should not be detected in any raw vegetables or ready to eat food, known as E. coli (O157:H7) that was identified as the reason for dangerous illness and led, in severe cases, to 33 deaths in USA only between 2003 and 2012 [38]. Several outbreaks linked to it were reported over the years. In 2019, the FDA and CDA announced the outbreak of E. coli related to Romaine lettuce consumption [39,40]. Thus, the presence of E. coli (O157:H7) should be absent from any ready to eat food. In addition to E. coli, other pathogens such as Listeria, Salmonella spp., and Shigella spp. that are found in fresh-cut vegetables and salad bags can cause illness and may also lead to death. For example, Salmonella accounts to 47% of foodborne diseases in Brazil in 2010 [41]. Between 1988 and 2007, the contribution of these pathogens in the foodborne outbreaks related to vegetables and fruits was reported internationally as follows: E. coli 19.5%, L. monocytogenes 1.9%, Salmonella spp. 7.2%, Shigella spp. 28.9%, and Bacillus cereus 8.1% [42]. Fortunately, sensor technologies play a key role in monitoring and tracing these pathogens, and thus nowadays, controlling such outbreaks is much easier than before. In contrast, the number of reported deaths due to foodborne has decreased over the years from thousands [43] in the period between 1998–2008 in USA to hundreds in the period between 2009–2015 in USA [44]. The decrease in mortality rate is due to having better tracking and prevention procedures of food.
Studies done in 2016 [45], and in 2014 [46], suggested that there is a potential growth of micro-organisms inside plastic bags during transportation, distribution, and retail storage. This is an important discovery, as it emphasizes the need to have precise monitoring systems to track and control the variations due to various environmental changes during the stages of supply chain, and to warn when the number of these pathogens exceeds the allowed range. The reason for microorganisms’ growth is related to the temperature fluctuations along the supply chain since temperature variations has a great effect on their growth rate inside the package. It was found that for E. coli O157:H7, the growth rate can be inhibited if storage temperature is kept <5 °C [34,47]. It was noticed that a more significant growth rate occurs from 8 °C to 12 °C while the visual freshness of the product is maintained. The count of this strain of E. coli increases with temperature [48,49,50]. For Salmonella, a significant increase in the population is noticed for packaged arugula over 6 days when stored at 15 °C (4.05 ) compared to when stored at 7 °C (2.11 ) [51]. Another study done in 2001 [34], showed that L. monocytogenes growth rate is increased by approximately 1.5 log cycles as the temperature rises from 4 °C to 8 °C over a period of 12 days for packaged lettuce. Shigella sonnei showed a rapid growth of approximately 2.72 on chopped parsley at 21 °C within two days while an inhibited growth is noticed when chopped parsley is kept at 4 °C [52]. The growth rate of Bacillus cereus, often found in cooked chilled food and pasteurized vegetables such as courgette broth, is inhibited when kept <10 °C [53]. Therefore, understanding how pathogens react to temperature variation is essential to check safety of packaged food. Hence, monitoring the storage and the display units is very crucial to ensure that pathogens’ growth is inhibited or controlled for compliance with food safety.
3.4. Chlorophyll Content and Leaf Senescence Effect for Packaged Leafy Greens
Chlorophyll (Chl) are the green pigments found in plants that allows the absorbance of light energy needed for photosynthesis. These pigments have different absorbance and reflectance corresponding to different light wavelengths. The peak absorbance occurs at the blue light and to a lesser extent in red light, while high reflectance is noticed around green light, that is why we see the leaves green in color. The reason for this strong absorbance is due to the electron transitions between the blue and red energy levels [54].
Knowing Chl concentration helps to a great extent in assessing the freshness of leafy greens. Spectral reflectance is considered one of the fastest non-destructive methods that can identify Chl concentration in vegetables. It was found that there is a correlation between the maximum slope of reflectance and the Chl content at wavelengths between 690–740 nm, which is known as the “red edge” [54]. The higher the concentration of Chl, the broader its absorbability becomes, and the less reflectance occurs shifting the red edge to longer wavelengths. Thus, the red reflectance can be considered as a reliable parameter to indicate the concentration of Chl. It was noticed that the reflectance of fresh lettuce tissue is different from old one at specific wavelengths as shown in Figure 4. Where a distinct reflectance difference is maximized with the use of near infrared light (700–900 nm), similar results were also noticed with spinach [55]. However, the near infra-red (NIR) reflectance is not only sensitive to changes in Chl content, but also to changes in the leaf structure and water content. For this reason, development of decay sensors or indicators based on spectral imaging and Chl fluorescence imaging can help identify the quality of the packaged vegetables whether by quantifying the content of Chl or by measuring the reflectance [56,57,58,59,60].
The correlation between the chlorophyll breakdown with time is related to the leaf’s senescence. Many other hypotheses evolved trying to explain this phenomenon. For instance, it was recently suggested that this degradation is due to the catabolic process of Chl as a part of senescence [61]. Another study suggested that the decrease of carotenoids which protects Chl from light leads to loss in the green pigments [62]. Other studies suggested that the contact of chlorophyllase, which is present in the outer membrane of the chloroplast, with the Chl inside the chloroplast leads to the destruction of Chl [63]. Regardless of these hypotheses, the common fact is that the Chl concentration degrades with time and hence can be used as indicator to vegetables freshness.
3.5. Humidity
Undoubtedly, water content inside the package is considered an important factor to monitor. This is because the relative high humidity accompanied with temperature fluctuations will lead to water condensation, which in turn will induce growth of yeast, mold, fungus, and bacteria on the surface of fresh-cut vegetables or even might spread inside through the places where tissue injuries are present [16]. Furthermore, in the case of using perforated plastic packages, blockage of these small holes might occur with the condensed water drops inside, leading to reduced respiration rate than the desired and hence faster deterioration and spoilage of vegetables. The fog resulting from having high humidity inside the package would not give a clear vision of the product quality inside, which may affect the consumer’s decision to buy the product [16].
4. Intelligent Packaging (IP)
Incorporating an external smart component as part of packaging to monitor, trace and convey information is what referred to as intelligent packaging (IP). There are three main categories to classify these systems: Sensors, indicators, and data carriers. In this section, examples on each of these categories are discussed as part of freshness monitoring for packaged vegetables.
4.1. Sensors
There are many types of sensors that have the potential to be used in smart packaging. The advantages that this category provides over other intelligent systems is their high sensitivity and accuracy, in addition to providing measurements about certain parameters such as temperature, humidity, and gas concentration inside the package, as sensors are capable of quantifying the pre-reported parameters. Sensors can be integrated with other IP systems like radio frequency identification (RFID) tags to provide more information and data transmission through these tags. In this section, four different types of sensors are presented: optical, biosensors, gas, and humidity sensors.
4.1.1. Optical Sensors
Optical sensors play an important role in determining the freshness of vegetables, due to their capability of sensing the optical variations resulting from changes in chlorophyll content. These sensors can also sense pathogens’ growth using fluorescence or hyperspectral imaging to indicate deterioration and spoilage. Optical sensors provide accurate results and are highly sensitive. Optical sensor technologies are considered promising in detecting the deterioration of packaged green leaves such as bagged lettuce, spinach and arugula. Hyperspectral imaging relies on the intensity and spectral characteristics of light reflected from the leaves. On the other hand, chlorophyll (Chl) fluorescence imaging relies on the reflection as a result of exciting the chlorophyll using light [57]. However, the current cost of such systems is still a drawback for their commercial use.
At present, chlorophyll fluorescence imaging use fluorometers to measure the amount of emitted light after excitations of Chl with light at certain wavelengths. Illuminating the leaves will give a photon of energy, h, to Chl pigments. This will lead to creation of excited unstable state (S1’), that has a very short half-life in the order of nanoseconds [64]. Therefore, through the relaxation process, light will be emitted as shown in Jablonski diagram in Figure 5a. The wavelength of the emitted light depends on the energy difference in the two states. Chl pigments are classified into Chl-a and Chl-b. Chl-a was found to be a good fluorescent material, hence fluorescence is measured based on the excitation of Chl-a. Chl-a has two absorption peaks, one at 430 nm (blue light) and the other at 665 nm (red light) with higher absorption at the blue light [65,66]. For emission, Chl-a emits in the red-light region at 680 nm (higher) and 750 nm [65,66]. This means that for better resolution, a fluorometer will excite at 430 nm and measure fluorescence at 680 nm. However, due to the decomposition of Chl-a at 430 nm into by-products such as pheophytin, 460 nm light is used for excitation of Chl-a [65,66]. The connection between the fluorescence intensity and Chl is based on Beer–Lamberts law of absorption [65,66]. Although the quantum efficiency of Chl is low and in the range of 2% to 10% of the absorbed light [67], it is still a very useful and powerful technique for plant physiologists in studying Chl fluorescence effect in vegetation [68,69,70].
There are many techniques used to make fluorometers, such as the ones based on the pulse amplitude modulation (PAM) [71], or on pump and probe signals [72,73]. These techniques rely on the wide-field detection and have a limited spatial resolution in the orders of millimeter [74]. These methods depend on the transition of Chl for adaptation from dark to light environment. An example of such system is as shown in Figure 5b. Fluorescence imaging systems consists of light source for excitation of the Chl in the sample, hence the re-emission will be captured by the camera after which it is processed in a computer. Light emitting diodes (LEDs) are widely used in fluorometers because of their ability to control the intensity of light and its duration. While for the detecting camera, normally the commercial version is enough for this purpose without packaging. However, for Chl fluorescence imaging of leafy greens inside plastic bags, the decayed tissue with no fluorescence will not be distinguished from the background which also does not fluoresce [58]. Therefore, cameras with higher sensitivity are required for such systems or the use of hyperspectral images can be an alternative for more accuracy [58,59].
Hyperspectral imaging, which is also known as imaging spectrometer, obtains a spectrum for each pixel in the image, it provides the electromagnetic spectral information for the use in the identification of surfaces. These devices measure the reflectance of the light from a surface as a series of narrow and contiguous wavelengths bands. The fact that the pixel is shown as a spectrum gives much more information about the leaves and their freshness. The schematic of such a system is very similar to that used in fluorescence imaging, shown in Figure 5b. The broad-spectrum light source, with typical spectral range of 380 nm to 1012 nm, will cause elastic scattering in the leaves. Then, the reflectance is captured by the spectrometer in the form of simultaneous images in a high number of bands [75]. Each resulting pixel from the contiguous reflectance spectrum will give three-dimensional hyperspectral cubic data, with two of them in the spatial domain and one in the spectral domain for further processing. For leafy greens monitoring, the use of reflectance at 671 nm was found better in differentiating between the white parts of leafy greens as in lettuce from the white background [75]. The main difference between spectral imaging and fluorescence imaging is that measurements with fluorometers rely on the visible spectrum fluorescence re-emission of photons. While in hyper-spectral imaging, the reflectance is measured from the whole electromagnetic spectrum, providing more accurate results with higher resolution and a wider wavelength range to evaluate surfaces of interest [75,76].
Decay sensors were developed to evaluate the reflectance and fluorescence spectra of leafy greens through Chl fluorescence imaging and hyperspectral imaging. In [58], both techniques were used to detect freshness of plastic bagged lettuce. One of the lettuce decay indices was developed based on the use of modified hyperspectral indices developed in [77]. The modified relation of reflectance was chosen based on the reflectance difference spectrum between fresh and decayed tissues. They provided a logarithmic ratio between the reflectance at different wavelengths as a performance index called LEDI4. The other lettuce decay index was used to measure Chl fluorescence known as LEDICF, which is defined as the ratio between the minimum Chl fluorescence to the maximum fluorescence. The minimum level of fluorescence is measured usually after switching the measuring light, because the exciting beam is not sufficient to induce electron transport [78]. The maximum fluorescence is then measured after applying a saturated light pulse [78].
The best performance was observed with the use of hyper-spectral imaging in terms of sensitivity, specificity, and early decay detection for different color groups of lettuce. In [58], for lettuce, the white color image indicated fresh tissue, red for decayed tissue, and blue was for the background. However, the accuracy of such a sensor was low when it came to white stacks of lettuce and was misidentified as decayed, giving a false negative output of the sample. Thus, it was concluded that the hyperspectral technique for freshness detection is better suited to evaluate green leaves such as baby spinach or butterhead lettuce. The other imaging technique that was tested in [58], used a fluorescence index which gave a better performance and higher sensitivity in identifying the white parts, but it misclassified as decayed the red fresh tissues, found in red oak lettuce. Here, the white color indicated decayed tissue, and the blue color, fresh tissue. Evaluations of these parameters (LEDI4 and LEDICF) showed positive correlations between each other and the visual rating scale, as illustrated in Figure 6. The results of this experiment were successful in classifying fresh from decayed tissue of plastic bagged lettuce packaged with modified atmosphere (MAP). It is harder to generalize whether this technique can work for all packaging types, but it works on different types of leafy green vegetables. Furthermore, this approach needs adjustment with the cut-off values for the indices if more specific classification is needed such as: fresh, intermediate, or decayed. The choice of which imaging technique to be used depends on the color of the product. Both parameters (LEDI4 and LEDICF) showed high accuracy of 96.7–96.9% in evaluating the quality of bagged leafy greens [58]. Hence, there is a possibility of using commercial imaging sensors to identify and monitor the freshness of such products.
For pathogen detection, the use of hyperspectral imaging (HSI) together with the integration of chemometric and an artificial neural network was developed in [79]. This technology depends on the formation of metabolic by-products because of pathogens activity that induces biochemical changes and indicates contamination of food. Taking hyperspectral images of bagged leafy greens, spinach for instance, over the range 400–1000 nm will give a spectrum with varied reflectance depending on the intensity of E. coli present. The outcome of these images is a 3D cube that gives information about total spatial distance, wavelength, and intensity of the image from where the quantitative and qualitative data can be extracted using principal component analysis (PCA) [79]. For prediction and computing of E. coli number in packaged spinach, artificial neural network (ANN) can be applied on the hyperspectral data. In [79], the ANN used consisted of seven artificial neurons to obtain better performance in counts prediction. Regression analysis used showed a good fit between the predicted from ANN and true values obtained.
For more convenient interpretation, a prediction map is constructed to give a visual indication based on the fingerprint left by the E. coli count on the leaves of each pixel in the spatial plane of the hyperspectral image based on the chemometric techniques. This map shows visual color changes as the count increase, which allows for an easy, rapid, and accurate detection. The blue color is considered the control and as the concentration of E. coli on the leaves increase, color shift towards green, yellow, orange, and then red [79]. This allows for easier detection of the contaminated samples with visual colors as shown in Figure 7. This simple method shows the high possibility of using such a technique for the detection of pathogens. Testing of this technology is done only on certain strain of E. coli (K12); hence, more tests are needed to validate and ensure its compatibility to detect other strains of E. coli or even other pathogens.
Many other techniques were used for detection of contamination of vegetables with the use of conventional NIR spectroscopy [80,81,82,83]. However, the information provided from these techniques lacks the spatial information as only one spectrum is provided for each sample. Thus, information about chemical composition will not be extracted compared to hyperspectral imaging where the information is represented in 3-D.
4.1.2. Biosensors
Biosensors are analytical devices that detect, record, and convert biological responses into easily measured signals such as electrical or optical signals. This category of sensors consists of two main elements: bio-receptors, which recognize the target analyte, and transducers, which convert the target recognition into a measurable signal. These bio-receptors can be further classified into antibodies, enzymes, cells, DNA, biomimetic, or phage, while the transducer can be electrical, optical, chemical, magnetic, or micromechanical [31,84]. In general, the first two types of these bio-receptors are widely used in the food packaging industry and have a promising potential in vegetable packaging for contamination assessment. In this section, the focus will be mainly on antibody-based biosensors.
Antibody-based bio-receptors rely on the concept of “lock and key” fit with the antigens. Antigens are proteins found on the surface of the pathogen and can also be synthesized to bind with a large set of pathogens. Antibodies are made up from light and heavy chains of polypeptide and have two regions: a variable region which change its structure to fit the antigen, and a constant region with constant structure [31]. As biosensors, antibodies are generally immobilized on the surface of the detector, so that, with their unique property of binding to the antigen and recognizing the molecular structure, they will sense the presence of pathogens, as shown in Figure 8a [31]. The process of antibodies attachment to labels such as isotopes, fluorophores, or enzymes for the purpose of detection, is termed antibody labeling. The interactions between antigen and antigen-specific antibodies are converted to digital signals that can be read out with the use of transducers that are electrochemical, magnetic, optical, or mass-based. Figure 8b illustrates the functional blocks of antibody-based biosensors. The sensitivities of these sensors depend on both the sensitivity of the transducer and the quality of antibodies that are used. In this section, an overview of different types of antibody-based biosensors will be briefly discussed [31,80].
Optical Biosensors
The use of optical systems as a part of biosensors has been extensively investigated. These biosensors use light-based interactions to measure the biochemical reactions. One of the common methods for freshness detection of foodborne pathogens is surface plasmon resonance (SPR) [80]. This opto-electronic phenomenon is based on the energy transfer to electrons in a metal surface as from visible or near infrared monochromatic light through a prism into surface plasmon resonance to be detected by photodiodes. The photon energy transferred to electrons will free them and lead to the generation of electromagnetic waves (surface plasmons) that resonate and absorb light; thus, the reflectivity will be minimum at this specific angle [80]. This angle is a function of refractive index which depends on the mass of immobilized antibodies. The reflected beam will shift to longer wavelength due to the biomolecular interaction changing the refractive index [80]. Hence, measuring this change will qualitatively detect the presence of these analytes without the need for enriching and culturing. Figure 9a summarizes the working principle of this biosensor. The advantages of this SPR technology are their high sensitivity and selectivity and they can be made in the form of compact chips. On the other hand, the use of prism is not always suitable for chip-based sensors. Moreover, there is a limit in the number of simultaneous measurements that can be performed. To overcome these issues, the use of multiple channels sensors was proposed to allow for parallel measurements. SPR imaging biochips were used to measure change in refractive index, in order to reduce non-specific signals from background [85,86].
Another approach is the grating-coupled SPR imaging that uses optical diffraction gratings for coupling and providing angle readings, and it is a low cost and wide dynamic range imaging [86,87,88,89]. In [90], an SPR-based protein chip, as illustrated in Figure 9b, was used for the detection of E. coli O157:H7, Salmonella, and other pathogens. This means that there is a high potential of using such a system in packaging. By integrating this chip as part of the package, the package can be screened with the use of light source and SPR spectroscopy to check if pathogens are present. Furthermore, the response of antigens binding to the immobilized antibodies on Au-substrate was enhanced with the use of G protein [80,90]. Other popular optical biosensors that are used for pathogens include Raman spectroscopy [91,92], Fourier transform infrared (FT-IR) [93], and fiber optics [94]. However, these techniques need culturing to increase the biomass of the pathogen before detection. In addition, the difficulty in integrating these as part of the packaging where contact of food with nanoparticles (NP) is unavoidable, makes them suitable for a different stage of supply chain, for instance in pre-packaging. Other techniques developed for bacterial detection as a type of freshness indicator include those based on surface plasmon resonance (SPR) [95], hyperspectral imaging [79], or polymerase chain reaction [96,97]. However, these methods require expensive equipment that make them non-commercial for use in supermarkets for monitoring packaged vegetables.
Electrochemical Biosensors
Electrochemical biosensors are those in which the binding elements are antibodies and the transducers are electrochemical. The binding response of antibodies to antigens will be converted into an electrical signal with the electrodes. The advantages of this biosensor category are low-cost and the possibility of coupling with other biosensing techniques. However, its sensitivity is less than optical biosensors. This category can be classified according to the output formats as amperometry, impedimetry, potentiometry, or conductimetry [80]. Amperometric is when an applied voltage excites the electroactive species, leading to oxidation or reduction and current flow. The higher the concentration of the analyte, the higher is the current produced. This measurement method gives higher sensitivity compared to potentiometry. In a potentiometric biosensor, the voltage between the electrodes for near the zero current is measured and the potential will build-up as a result of the bio-recognition process. A conductimetric biosensor relies on the use of conductive polymer to turn the analyte into electrical signal. In this type, incorporating nanoparticles (NPs) can increase the conductivity which will enhance the sensitivity of the system. The last one is the impedimetric type which depends on the metabolites of the microbes as a result of redox reactions that will decrease the impedance; that is, the conductance and capacitance increases [30,80]. Table 2 shows a comparison between the common electrochemical biosensors for pathogens’ detection of vegetables.
Commercial Biosensors
Toxin Alert has produced a visual biosensor known as Toxin GuardTM [104,105]. This biosensor immunoassay uses the concept of antigen/antigen-specific antibodies to detect pathogens in the form of antibodies sandwich with thickness of 100 µm [106]. There are two types of antibodies used: the capture antibodies and the detector antibodies. Capture antibodies are immobilized and incorporated into a thin layer of polymer plastic films such as polyethylene and are patterned in the form of icons in a nutrient gel such as agarose gel [106]. The detector antibodies are labeled with colorimetric enzymes or luminescent chromophore dyes that will change color upon binding to antigens and are free to move in the nutrient gel layer. Then, a permeable protector gel coat is applied forming compartments that act as test sites and allow for specific pathogens to penetrate. Detector ligands will bind to pathogen antigens, and the nutritious gel will support the rapid growth of penetrated pathogens. The detector antibodies binding to the antigens of pathogens will then migrate toward the captured ligand due to affinity, leading to a distinctive pattern shapes where the chromophores are concentrated [106]. The response time is 30 min to show different patterns and up to 72 h to give a distinct dark color change [106]. The advantages of this biosensor lies in its ability to simultaneously detect and identify several bacterial types such as: E. coli, E. coli O157:H7, Salmonella, and Listeria, its stability and suitability for warm and cold environments, and its shelf life of one year [104,105,106,107]. However, small amounts of micro-organisms that may still cause diseases are not captured due to sensitivity limitations [104,105,107]. Figure 10 shows a picture of Toxin Guard biosensors.
Recently, a new technology known as Janus emulsion droplets was developed for the detection of bacteria using E. coli as the model system for testing [108,109]. This technique, based on Janus particles, shows a promise to be part of vegetable packaging as pathogens detectors. Janus particles have been used for many sensing applications such as in biomedicine and highly selective sensors [87,110]. These nanoparticles have different hemispheres with distinct physical and biochemical properties. The surface nature of these particles is like that of the living cells which enabled their use as E. coli detector. The droplets are prepared with the use of surface-active agents that are made of carbohydrates and their optical properties (allow light to pass) change because of pathogen recognition through carbohydrate–lectin interactions. Half of these hemisphere will bind to the pathogen forming clusters of these droplets in a way that induce light scattering that depends on the concentration of pathogens, as shown in in Figure 11. Measurement in this system can be either quantitative with a quick response code (QR) for binary readout on such surfaces using smart-phone application while placing these droplets inside transparent chamber, or quantitative with the use of image processing techniques [108]. This system has a limit of detection of 104 CFU/mL with a response time of around 5s [109,111]. The advantages here are the fast response and the ease of implementation, as detection can be done by the naked eye or with use of mobile phones. This sensing technique is not yet commercialized. However, if these droplets turned into films or thin membranes that are implemented as part of packaging for the purpose of pathogen detection, then the possibility of integration within packages will be much higher.
NP-based microbial sensors can be used instead of conventional biosensors. Incorporation of other materials such as silver nanoparticles (AgNPs), and gold nanoparticles (AuNPs) was noticed to interact with proteins of pathogens such as E. coli preventing their DNA replication [12,112,113,114]. The advantages of using NPs in sensors are in their unique optical and electrical properties that improve the sensitivity, response time, and selectivity compared to biological sensors. NPs can also act like a “magnet” to capture specific pathogens, and such systems are known as immunomagnetic separation-based (IMS-based) detection [115]. Magnetic nanoparticles such as (Fe2O3) can bind to specific antibodies that can be used to identify pathogens. This will allow for detection due to observable electrical and optical changes after binding and for isolating pathogens by applying an external electric field [116,117]. The working principles of IMS are shown in Figure 12. However, the use of these nanoparticles is still being studied as there are concerns about the possibility of their migration to food inside the package. The validation process of such sensors should be carefully studied, as issues regarding the safety and hazards must be addressed to ensure public health safety.
4.1.3. Gas Sensors
These sensors concern the quantitative measurement of gas concentration, mainly oxygen and carbon dioxide, due to their big effect on the metabolism of packaged vegetables and hence their quality. For carbon dioxide detection, optical-based gas sensors are a promising technology in food packaging applications. Commonly used types rely on fluorescence with the use of CO2-sensitive dyes or on colorimetric change as result of using pH sensitive dyes [118].
Dry solid CO2 sensor is an opto-chemical sensor that uses fluorescent dyes that change their luminescence with the carbon dioxide level. An example on this type that can be used in vegetable packaging is in ref. [119] which is based on the use of pH-sensitive fluorescent dyes 1-hydroxypyrene-3,6,8-trisulfonate (HPTS) incorporated within plastic films. As the CO2 concentration increases, the fluorescence of the dye decreases. The response time for this dye is less than 2 min, and its recovery time of less than 40 min [119]. The advantages of HPTS plastic film CO2 sensor are: its stability in various environments such as water and acidic solutions, high sensitivity (%CO2 = 0.29%), and its shelf life can extend to more than 6 months if kept in a dark storage environment [119]. The limitation lies in difficulties of finding suitable fluorescent material for food applications and better sensitivity is required to cover the measuring range of 0–100% [118]. Another example on this dry carbon dioxide sensor type was tested on ready-to-eat packaged salads in [118] that is based on Förster Resonance Energy Transfer (FRET). FRET mechanism relies on energy transfer from donor fluorophore to acceptor chromophore [120]. Here, phosphorescent donor dye Pt-porphyrin (PtTFPP) will emit energy at 650 nm to be absorbed by pH indicator chromophore (α-naphtholphthalein NP) acceptor. The mixture of both complexes will result in films which have varying optical responses with carbon dioxide concentration. The concentration of carbon dioxide affects the FRET. It is highest kin no CO2 and decreases as the CO2 increases. For this sensor, the energy transfer will have optical responses from blue to colorless when the CO2 is in the range of 0–10%, which makes this sensor suitable with modified atmosphere vegetable packages that have the same range of CO2 [118]. The response time of this sensor is 1 min with a recovery time of less than 4 min. Its sensitivity is constant for 21 days at 4 °C which is considered suitable for vegetable packaging applications [107,118,121]. The safety of this sensor was tested and it showed no traces of dyes migrating to the packaged food, which is a big advantage for commercial uses. The limitation of this sensor is its temperature sensitivity, deterioration of its performance if carbon dioxide or oxygen concentrations are higher than 10%, susceptibility to signal drift, and cross-sensitivity with O2. To overcome the cross-sensitivity for this sensor type, the oxygen concentration is measured to compensate for its effect, thus, the sensor can be used to evaluate the concentration of both CO2 and O2 at the same time [118].
A sol-gel based optical carbon dioxide sensor that uses the pH indicator 1-hydroxypyrene-3,6,8-trisulfonate (HPTS) immobilized on a hydrophobic modified silica matrix forming membranes, was developed in [114]. The working principle of this sensor depends on the luminance intensity being quenched by CO2 that leads to its fluorescence. The fluorescence intensity lifetime is then converted and measured in phase domain with the use of the dual luminophore referencing (DLR) method [121,122,123,124]. In this technique, the fluorescent dye is co-immobilized with an inert referencing luminophore such as ruthenium complex that has a long lifetime and high absorption rate of blue to green light. In phase domain, the HPTS dye fluorescence intensity signal will have a zero-phase angle due to its short lifetime while the reference luminophore will have a phase shift. The total measured signal will represent the superposition of both signals leading to a different combined measured phase. Thus, the change in carbon dioxide concentration will lead to change in the amplitude of fluorescence intensity signals of both luminophores. This amplitude change will correspond to a phase change in the total measured signal which is a function of carbon dioxide in the sample gas [124]. This sensor has a resolution better than 1%, a limit of detection of 0.08%, and a minimized cross-sensitivity with oxygen of 0.6% [112,125]. It is stable for more than seven months, which makes it suitable for vegetable packaging applications [107,124]. However, this sensor suffers from oxygen sensitivity, as the commonly used reference luminophore (ruthenium complex) is affected by oxygen, and from temperature sensitivity. Therefore, the need of a correction protocol is essential to guarantee accurate measurements of gas concentrations [121,122,123,124].
A nondispersive infrared (NDIR) sensor can be used to monitor the storage environment of a package or can be integrated as part of RFID tags. This type depends on the selective light absorption of gases at different wavelengths due to their different quantum energies. For carbon dioxide, it absorbs at 2.7, 4.3, and 15 μm, the light passes through two tubes, one acting as the reference with nitrogen which does not absorb light, and the other having the gas to be measured. The ratio of the attenuation between the tubes is proportional to carbon dioxide concentration. The advantages of these sensors are their accurate reading, immunity to temperature, and humidity, but they are relatively more expensive compared to thermal resistors-based carbon dioxide sensors [126,127].
Another type of sensing is based on thermal resistors whose resistance changes according to the thermal conductivity of carbon dioxide passing through it. The thermal resistors are two arms of a Wheatstone bridge that is shown in Figure 13. This type relies on the variation of the conductivity with the concentration of carbon dioxide, but it is also affected by temperature and humidity. The idea here is to measure the resistance of the thermal resistor in the CO2 atmosphere by comparing its value to an identical thermistor in a reference chamber with sealed atmosphere under same temperature and humidity conditions. An increase in the concertation of the gas causes the molecular weight to be heavier compared to the dry air, shifting the output to positive, and the opposite occurs when there is less carbon dioxide in the air. The linear response of this sensor made it very suitable for gas detection up to 100% [13,128]. However, the drawback of this type is in the dependence on other factors such as humidity and temperature that makes the sensor reading unreliable unless these conditions are the same and constant in both chambers [13,128]. Many other carbon dioxide sensors were developed based on other techniques such as emulsions of iconic liquids at room temperature [129], and the polymer hydrogel-based sensor [130]. However, an important concern with these sensors that are used to quantify carbon dioxide will be the possibility of migration of the sensor materials to the food.
Monitoring oxygen inside the package is important because an adequate amount of O2 is needed to maintain vegetables freshness. Therefore, a lot of mechanisms were developed to measure oxygen content inside a package. The most common oxygen sensors are photoluminescence-based (fluorescence or phosphorescence) that rely on the quenching principle of oxygen sensitive dyes. Photoluminescent dyes are usually embedded in oxygen permeable polymers or sol-gel matrices in the form of labels or dots. Oxygen is considered a very common fluorescence quencher of the electronically excited oxygen sensitive dye. The interaction of light with oxygen molecules will deactivate the phosphors of the active dye, so the emission intensity and the lifetime of the dye will decrease, reflecting the change in level of oxygen inside the package [105,131]. The concentration of oxygen is related to quenching fluorescence through the Stern–Volmer equation, which can be used for quantitative measurements [132]. This type of sensor is considered superior over conventional oxygen sensors such as electrochemical-based oxygen sensor for food packaging applications for the following reasons: non-destructive, clean, reversible, fast response, and does not consume oxygen in the headspace of the package. However, degradation in the dye may cause disturbance in the light path and is a limitation together with its susceptibility to drift [19]. There are several common dyes, that were used for oxygen sensing of packaged vegetables such as [Ru(dpp)3]2 [124], PtTFPP [133], PtOEPK [134,135], and PtTPTBPF [136]. Table 3 provides a brief comparison of photophysical properties for four common sensing dyes.
The first commercial photoluminescence-based sensor for oxygen detection was developed by OxySense, also known as O2xydotsTM which is suitable for packaged vegetables [13]. The dots have an oxygen sensitive dye that is illuminated with blue light. A photodetector is used to detect red color emissions and measure the fluorescence lifetime [13]. The fluorescence will depend on the oxygen concentration which will quench the emissions as its level increases. Another popular oxygen sensor that can be used for freshness monitoring is the galvanic cell type. This electrochemical sensor has three main parts: cathode, anode, and oxygen permeable membrane that allow oxygen diffusion from the surrounding to the electrodes (cathode and anode) where oxidation and reduction reactions takes place [141,142,143]. The electrolyte soluble anode will free electrons that will reach the cathode where diffused oxygen will absorb these free electrons. This will allow for current to flow between electrodes depending on the concentration of oxygen diffused. The self-powering property, low cost, and the absence of cross-sensitivity to carbon dioxide are important advantages of these sensors [141,142,143].
A comparison between some of the commercial oxygen and carbon dioxide sensors used in packaged vegetables with respect to principle of operation, typical specifications, and cost is summarized in Table 4.
4.1.4. Humidity Sensors
Freshness of packaged vegetables is highly affected by the water content, which creates a suitable environment for mold and bacterial growth. Thus, for water vapor monitoring, many humidity sensors were developed over the years for different applications such as storage environment monitoring, ventilating, and air condition systems (HVAC systems), and home heating systems. The fact that humidity sensors can be made now as thin films or membranes enabled the possibility of their use as part of packaged vegetable monitoring, especially with their possibility of integrating with RFID tags. The thin films can be classified into three main categories depending on the sensing material used: polymer, ceramic (semiconductor), and hybrid (polymer/ceramic [149]. Each one of them can be further classified into capacitive or resistive based on the transduction. Although ceramic has more advantages compared to polymer such as mechanical strength and physical stability, polymers are more promising and cost-effective option with acceptable sensitivity suitable for humidity monitoring in packaged vegetables.
The sensing functionality of thin porous films depends on the measurable changes of electrical properties due to water uptake. Water molecules interactions have different dominating mechanisms that affect humidity-sensitivity characteristics. At low RH, the interaction of water molecules is dominated by electronic conduction. At high RH, ionic conduction is dominant, meanwhile at medium RH both are contributing [149,150]. A summary for different types of thin film humidity sensors that are used or can be used as an intelligent system for package characterization in food industry are shown in Table 5 with their specifications.
4.2. Indicators
Indicators are devices that provide information about the change in characteristics as a result of interaction in the presence or absence of substance such as micro-organisms, oxygen and carbon dioxide. These devices do not have a receptor or a transducer as in sensors. They just rely on direct visible changes. This class of devices can be sub-divided into three main categories: time-temperature indicators (TTIs), gas indicators, and freshness indicators [117]. These indicators are widely used in the meat industry. However, the low-cost and simplicity of integrating them with packaging, opened the opportunity for their use in other food industries [117].
4.2.1. Time-Temperature Indicators (TTIs)
These indicators are labels placed on each package from outside to provide information about the temperature history of each package. TTIs act as a very useful visual or electronic indicator for the freshness of the products by tracing its temperature. The indication occurs as a result of irreversible responses to temperature variation due to chemical, electronic, or even nanoparticle changes. These indicators can be classified into three main categories: (1) Critical temperature indicators that give limited information about the product where indication is provided as to whether a reference temperature was exceeded or not. (2) Partial history TTIs which provide accumulative temperature versus time changes with respect to a reference temperature. (3) Full history indicators that provides all the temperature changes throughout the whole storage period [4,5,77,167].
The working principle of these indicators depends on color change as a response to enzymatic-, polymer-, microbial-, photochemical-, or diffusion-based reactions [105]. For an enzymatic-based indicator, the mixture between pH dye, the lipid substrate, and lipolytic enzyme will stimulate reactions of free fatty acids, which in turn degrade the pH leading to visual change. For a polymer-based indicator, it relies on the fast color change of the active solid-state polymer as a result of high temperatures and at a slower rate at low temperatures. This type depends on changes of optical properties of the active polymer in response to temperature variation, therefore no activation is needed before use, but attention to its storage temperature before use is essential [105]. A microbial-based TTI relies on increased growth rate of micro-organisms inoculated into the label due to high temperature exposures. For photochromic reactions, the use of photosensitive compounds causes a reaction resulting in changes in their color in response to temperature fluctuations over time. In a diffusion-based indicator, the colored fatty acid ester causes a temperature-time dependent diffusion through an indicator track. Here, the low-cost, small size, reliability, and the ease-of-use made them more commercially viable than other intelligent systems. However, exposure to very low temperatures affect the spoilage of some vegetables, too; thus, the limitation of TTIs lies in the difficulty to give information whether the package was exposed to subminimum temperatures or not for example, if carrots were frozen at temperature below −1.8 , freezing injury may cause sunken, pitted areas, or even internal browning [168]. Hence, the need for more complicated systems is essential, depending on the packaged produce such as the use of RFID tags to quantitatively monitor temperature, moisture and gas concentration quantitatively [94,169].
Many TTIs were commercialized and are widely used for monitoring perishable goods. Fresh-Check® is an example of polymer-based self-adhesive chemical indicator in the form of labels that are produced by TEMPTIME Corporation, [13,167,170,171], as shown in Figure 14a. This indicator is a full history type that is based on a solid-state polymerization reaction. The active center polymer, such as diacetylene monomer placed in the inner ring, will change the inner circle color from red to black color matching the outside reference marker as the package is exposed to high temperatures over time, giving a visual indication regarding the quality of packaged food. The higher the temperature the package was exposed to, the faster the color will change.
Monitor MarkTM is a commercial example of a partial-history TTI [13,167,170,172]. This easy-to-use indicator provides temperature versus time history of the product and remains active for months when kept below its threshold temperature. Figure 14b shows an illustration of this indicator. This is a one-time use label made of layers of paper and films connected to a chemical reservoir. The working principle is based on the diffusion of blue-dyed fatty acid ester through a film as a result of melting due to its exposure to a higher temperature than the reference temperature. Thus, a blue color will appear on the left edge and gradually move to the right at a rate that depends on the temperature exposure. If temperature is below the reference, the dye will be in the solid-state phase and hence will not move through the porous paper. This type require activation prior to use by removing the activation strip. A response timecard is then used to interpret the extent of color movement (run out time) in terms of time and temperature.
OnVuTM indicator is a photochemical-based TTI that indicates whether the product was exposed to high temperatures over time. This device is fabricated with the use of a temperature sensitive printable ink that changes its color from colorless to blue upon activation with UV light [173]. A UV blocking filter is then thermally transferred on the top of charged UV photochromic ink with the use of a thermo-transfer ribbon (TTR), to prevent further exposure to UV light and hence guarantee the irreversible change of color [169,173]. With time, the color starts to revert to a color matching the reference at a rate corresponding to time and temperature change as shown in Figure 14c. The intensity and the pulse modulation of the UV light used for activation will control the shelf life of this label which is directly related to the shelf life of packaged vegetables. This indicator is considered a very cheap and flexible option for such applications [174].
eO® is a microbial-based TTI [105,175], shown in Figure 14d. The food-grade microorganism in the label mixed with the nutritive environment in the shape of flower, will grow differently depending on the temperature history of the package. As a result, lactic acid will be produced, and the pH degradation will cause the pH dye to change accordingly from green to red color indicating spoilage of the packaged vegetable.
Timestrip® is a diffusion-based TTI and is illustrated in Figure 14e [176]. The blue fatty esters will show a line upon activation. Then, this dye will melt and migrate through the porous membrane when the temperature is higher than the reference temperature, and the indicator will show the accumulated time of temperature breach of the packaged food. This indicator is now upgraded into a new electronic smart TTI version known as eTimestrip® [176]. Figure 14f shows an illustration of this new indicator. This type is a full history indicator that uses LEDs to show the status of package. A green light indicates that the temperature is ok, a flashing red light when exposed to high temperature, and an orange light if the indicator is ready to use or if it is not working. The real-time data for the temperature variation will be recorded with time and can be retrieved when scanning the label using a smart phone application. This will allow for more accurate data regarding temperature versus time. This new upgrade may be very costly if used for each package of vegetable. If it is used for bulk monitoring of packaged vegetables, the cost will be reduced.
Checkpoint® indicator, shown in Figure 14g, is an example of enzymatic-based TTI that turns from green to red as a result of enzymatic reaction [4,5,105,117,167,170]. Before activation, the self-adhesive label has two separate compartments: One has pH indicating dye mixed with lipolytic enzyme, and the other is lipid substrate such as glycerine, tricapronate (tricaproin), or tripelargolin. Upon activation by hand pressure, the two compartments will react in a rate corresponding to time and temperature variations. The reaction will free the fatty acids, leading to a pH decrease and hence, the color will change accordingly.
Tempix® is an example of a diffusion-based TTI [177,178]. Figure 14h is an illustration of this indicator. The indicator is made from thermal porous paper with thermally printed barcodes and a cavity where the activation liquid is applied. The liquid substance will turn into a solid-state if the temperature is below the threshold. In case a temperature breach occurs, the substance will melt and will migrate toward the barcodes. The fact that the activator is made alkaline will cause the diffused liquid to act as a bleach for the barcodes, hence affecting its readability by scanners.
A comparison between some of the commercially available TTIs based on the reaction type, typical characteristics, and cost are shown in Table 6.
4.2.2. Gas and Humidity Indicators
Gas and humidity indicators are used to monitor the gas composition and water content inside the food package. These indicators are in the form of printable labels, films, or tablets that are placed inside the package to give information about the changes in gas mixture inside the headspace of packaged vegetables, and other ready-to-eat packaged food such as salad. Changes in the gas composition are a result of respiration of vegetables, leakage, or generated by the microorganisms present that will change the indicator color. Oxygen, carbon dioxide and water vapor indicators are the most popular ones used in the food industry. Most of these indicators depends on the binding reaction between the gas and the indicator, or on redox reactions which will change the dyes such as methylene blue that is used to give visual indications [107].
Gas indicators are used to monitor the variation of gases in the head space of packaged vegetables. At the time of packaging, the ratio of gases mixture is adjusted through a modified atmosphere packaging (MAP) technique to extend the shelf life of vegetables. An example of oxygen indicators, known as Tell-Tab [179], show color changes from pink to purple when the oxygen concentration inside the package is 0.1% or greater. This type requires no activation. Therefore, it must be placed in oxygen absorbing packets until being introduced to packages. In contrast, for the Ageless Eye® oxygen indicator [180], the color changes from pink to blue when the oxygen concentration is 0.5% or more inside the package. For carbon dioxide indicators, pH responsive dyes such as cresol red are used [181]. In this case, the diffusion of carbon dioxide through the permeable membrane causes a chemical reaction with the pH dye, leading to a color change. As the concentration of CO2 increases, the color changes from red to yellow. This type of indicator is reversible and insensitive to moisture inside the package.
For moisture indicators, humidity cards that give visual color indications of the relative humidity were developed by IMPAK. These cards are injected with cobalt chloride solution that changes from sky blue to purple or pink as the humidity increases. The cost of such cards ranges from $0.14–$0.65 with an RH range of 8 to 80% [179]. Another interesting example for humidity monitoring is with carbon-coated copper nanoparticles dispersed on a glass substrate, resulting in a film that swells in low humidity due to the increase of the separation between the NPs. As the humidity gets higher, the water vapor starts to condense on the strip film, leading to destructive interference at perpendicular incident angles. Hence, reflection and absorption of light will have different light colors depending on the amount of water vapor concentration inside. This film can measure RH between 45% and 100%, with the color changing from orange (around 50% RH) to blue (70% RH), pink then green (100% RH) as water vapor saturation increases [115,182]. This metallic color film has a reversible color change which gives the possibility of reusing and recycling such indicators. Using it inside the package as a film or using labels impregnated with these NPs will create real-time monitoring for the humidity, when compared against a pre-set color reference, the humidity percentage can be monitored. Furthermore, this strip can indicate the presence of other gases such as ethanol vapor [115,182].
4.2.3. Freshness Indicators
Freshness indicators have the target of detecting the chemical changes or the microbial growth inside the packages based on reactions with the growth metabolites such as carbon dioxide, oxygen, ethanol, lactic acid, glucose, and the other volatile organic compounds. They require a direct contact of indicator with the food. Thus, all the materials used together with the output of these reactions should comply with food regulations. A commercial example, Food FreshTM [13,183], shown in Figure 15a, is a timer for the safe consumption period that ranges between few days to several months. It is made of polyethylene terephthalate (PET) that changes its color with time. Typically, this product is used for meat and jars like mayonnaise. However, it can be modified depending on the products monitoring time, and for vegetable packages, it normally lasts for several days.
The Insignia Technologies integrity indicators [184] are used to indicate the freshness of packaged perishable food products. These indicators use sensing films made from proprietary smart plastics and inks that show color changes as a response to carbon dioxide level, leakage, temperature variation, or shelf life. For carbon dioxide monitoring, light yellow color will turn to dark purple to indicate freshness of a packaged product as shown in Figure 15b. This indicator was initially for meat, but it is claimed that it can also be used on any product as long as it was flushed with carbon dioxide while processing for modified atmosphere packaging (MAP). This is the case for bagged salads, as flushing with carbon dioxide is used to inhibit the growth of aerobic bacteria or molds [185,186].
4.3. Data Carriers
Data carriers enable the flow of information about the packages along the supply chain. They do not assess the quality of packaged vegetables but are integrated with sensors and indicators in the form of tags or labels that assess the freshness of the product. Then, these carriers will communicate the gathered data through readers. The most common data carriers used in food packaging are radio frequency identification tags (RFID) and barcodes.
4.3.1. RFID
RFID tags are devices that use electromagnetic field to monitor various measurements and are capable of communicating the readings through a reader that emits radio frequency waves to capture the data stored on the chip with the use of antenna in the RFID. Figure 16 shows a schematic diagram of components in a RFID system. Since the RFID tags have only antennas, other sensors and indicators are usually added to be used for freshness monitoring. To utilize the functionality of this technology, many sensors and indicators are added to these tags. RFID tags can be classified into three main types [187]:
- 1)
- Passive tags with no batteries on the chip and are powered through the electromagnetic induction produced from placing the reader nearby. This type has a long shelf life, but a relatively short reading distance.
- 2)
- Semi passive tags that have a battery to power the chip, but the reader is essential to power broadcasting of the signal. This type is in active most of the time, and it also has a long shelf life.
- 3)
- Active tags that have their own battery to power.
Table 7 provides a comparison of important features among passive, semi-passive, and active tags [1,23,105,188,189].
In recent years, there is an increasing trend toward employing these tags as a part of smart packaging systems. RFID tags are more convenient than barcode technology and can store more data while simultaneously providing real-time monitoring for more than one type of information (temperature, humidity, product information). Packaged vegetable monitoring normally uses the high frequency (HF) range. However, there are many factors that need to be considered with the use of this technology in smart packaging, for instance, their cost needs to be low for commercial use. The lifespan of such tags should cover the lifetime of the products monitored through the choice of appropriate battery life span in active tags, for instance. In addition, signal loss due to absorption by water in human bodies or moisture in packages may lead to low-level microwave signals which are maybe difficult to detect [105].
In [147], a vegetable monitoring system using RFID tags was integrated with respiration gas sensors to evaluate the quality of the monitored vegetables. The idea relied on measuring the amount of respiration gases: oxygen and carbon dioxide produced in the package. As shown earlier, the freshness of vegetables and fruits depends on the ratio of these two gases. To quantify the respiration rate, respiration quotient (RQ) defined as the ratio between the volume of CO2 to O2 per unit time is used. If RQ is more than 1, then the freshness of packaged vegetables and fruits are degrading. This experiment was tried on green mume stored in plastic package for several days using different low-density polyethylene (LDPE) packages. It shows that RQ >1 as the quality deteriorates. The oxygen sensor used was a galvanic type, while the carbon dioxide sensor was a thermal conductive type. These sensors were connected to the RFID antenna forming RFID tags and placed inside a leafy greens package to monitor the gas concentration with storage. It shows how the oxygen concentration decreases while the carbon dioxide increases, indicating deterioration of the vegetables monitored. With the LED color changing from blue (fresh) to red (not fresh), indication of the freshness can be achieved. However, more research and development are needed in terms of finding less bulky inexpensive circuits to ensure the practicality of such techniques in monitoring freshness without much affecting the final product cost or even the packaging and processing cost [147]. Other smart sensors with RFID tags for vegetable ripening evaluation were demonstrated [190,191].
Another smart RFID label, introduced in [128], used several sensors’ temperature, humidity, and ammonia. This system can be used in logistic chains monitoring. The storage area or the display units can have these labels installed to monitor real-time temperature variations. These smart tags can be attached to each bagged or packaged vegetables. Thus, more information can be extracted about the freshness of vegetables or even about the growth rate of pathogens. The multisensory platform that was made of printed electronics is then integrated with a screen-printed HF RFID antenna label, from where the data can be read through an RFID reader. In general, during the measurement mode, the data from sensors are measured one by one, then are written in memory until it is read by an external reader. The presence of a resistance temperature detector (RTD) on the RFID label is not only to provide temperature reading, but also to act as temperature compensator for the other two sensors (humidity and ammonia) because of the strong dependence of ambient absolute humidity and the sensitivity of their sensing layers to temperature. The RTD values were in the range of 500–550 Ω with a measuring range of −10 °C to 80 °C. In addition, the resolution of this sensor was 1 °C [128]. The humidity sensor uses the variation of dielectric constant with water vapor. This constant is much higher than the one in interdigitated electrode’s (IDE). Therefore, absorption of moisture will be reflected as an increase in the capacitance, and hence humidity can be measured. This sensor gives relative humidity, after compensating for temperature. The advantage in this RFID label is that the usual drawback of cross-sensitivity between temperature and humidity, which was noticed in earlier studies in printed RTD and humidity sensors [167], is absent. The reason for that is the DP protection layer on top of the RTD, which has a low water vapor permeability, preventing a direct contact between water vapor and the RTD [128]. The source of power in this system is a battery with a capacity of 150 mAh. It can last up to 57 days knowing that the periodicity of the measurement is every 60 min for a duration of 30 s. This lifetime is enough for monitoring storage and display temperature and humidity variations and can provide a real time update [128]. TempTRIP® RFID temperature tags are a commercial example of this technology used to monitor and record the temperature and time throughout the supply chain, and data can be collected later through readers [192]. It has an operating range of −30 °C ± 50 °C and temperature accuracy of ±0.2 °C [193]. Another example is Easy2 log© which is a semi-passive RFID tag that is also used to monitor temperature with an operating range of −20 °C ± 70 °C and temperature accuracy of ±0.5 °C [194].
4.3.2. Barcodes
Barcodes are considered one of the most popular data carriers due to its simplicity of use and low cost. These codes carry information about products through lines with different widths separated by spaces, and with numbers written underneath. The Universal Product Code (UPC) barcode is mostly used now. Barcodes are used to track the location of every package along the supply chain as each one has a unique UPC. This type of data carriers can also be integrated with sensors and indicators to check the freshness of packaged vegetables through erasing or amending the barcode to make it unreadable.
There are many other examples that uses barcode labeled antibodies as biosensors. For example, a barcode capable of sensing the presence of pathogens and identifying whether a product is contaminated or not, known as the “Food Sentinel System”, is shown in Figure 17a. This system uses two barcodes, one for the information about the product which is readable by barcode reader, and another for contamination code symbol which is usually unreadable in case of safe food. The antibodies are labeled and made in the form of a membrane attached to a part of the barcode. When contamination is detected, one barcode will be unreadable and the other readable. This is because lines appear when antigens bind to the antibodies on the barcode or disappear due to their dissociation from the substrate in case of bacterial metabolite being present [30,105,195,196]. This system uses labeled antibodies on the membrane of the barcode to identify specific antigens. Another version of this technology is based on turning the membrane containing antibodies into red ink when a pathogen attaches to it, and so would not be readable by scanners. An illustration of this indicator is shown in Figure 17b [196,197].
A microbial TTI placed over barcode, known as TRACEO® has the labelled barcode impregnated with lactic acid bacteria that changes the color of the barcode from transparent to opaque due to time expiration or indication of high temperature exposure of the package. Thus, this barcode will become unreadable showing that produce is no longer safe to consume [105].
5. Comparison between Intelligent Systems
In this section, a brief comparison based on the advantages and disadvantages in terms of cost, sensitivity, and the way of reading the output between the previously discussed systems used in vegetable packaging for the purpose of freshness monitoring are summarized in Table 8.
6. Active Packaging (AP)
Active packaging can be defined as a system that uses active components such as scavengers and releasing objects as a part of packaging material or inside the headspace, for the purpose of extending the shelf-life of the packaged product [83,170]. The target of such a system is to adjust and improve the environment inside the package to keep the packaged product fresh and free from contamination. Active packaging has several applications in different fields such as pharmaceuticals and health care, energy and power, and food packaging. This packaging system can be classified according to its functionality or the active components used. For functionality, the system is divided into: scavenging that capture objects from headspace of a package such as oxygen scavengers, moisture absorbers, and odor absorbers; or releasing the release components for specific purposes such as antimicrobial, antioxidants, and carbon dioxide emitters. This system can also be classified based on the active components used into oxygen scavengers, carbon dioxide absorbers or emitters, moisture absorbers, temperature compensating films, or preservative releasers.
Oxygen scavengers help to control the amount of oxygen inside the package and are usually in the form of sachets, labels or plastic films. Oxygen scavengers contain either metallic powders such as iron, which reacts with the water inside the package using the oxygen to produce a stable oxide, or non-metallic scavengers that uses a reducing agent such as ascorbate salts or enzymic systems.
Carbon dioxide scavengers or emitters are used to maintain carbon dioxide within a specific limit which in turn reduces the effect of vegetable injury and color change. For example, the prolonged freshness of shiitake mushroom and eggplant were observed with the use of CO2 absorbers [198,199]. Furthermore, keeping the percentage of this gas within a certain limit shows a difference on the freshness of different vegetables such as potato, onions, lettuce, cucumber, and cauliflower [200]. These scavengers or emitters use a valve to release a gas; or powders as physical absorbers, or in sachets or granules form that uses chemicals such as calcium hydroxide mixed with oxygen scavengers [1,201].
Moisture absorbers play a key role in vegetable packaging, since they absorb accumulated water and/or water vapor inside the package, inhibiting mold and bacterial growth, and hence prolonging the shelf-life of the packaged vegetables. These absorbers controls humidity either in the liquid phase or in the vapor phase. Liquid-state absorbers are usually sachets filled with silica gel such as natural clays or drip absorbing pads that consists of strong absorbent polymer sandwiched between microporous polymers. Vapor-state absorbers are typically humectant layers between permeable plastic films [201].
Temperature compensating films rely on the use of polymer-based membranes that adjust their permeability for oxygen and carbon dioxide depending on the temperature variation to help control the percentage of these gases within a certain range [1,23,202]. These films allow for CO2 penetration at rates that are four time faster than O2 to ensure a slower rate of respiration and dehydration inside the package. In this way the freshness is prolonged. A schematic illustration of the method is given in Figure 18. Low-density polyethylene (LDPE) is an example of such materials that can be used as a temperature compensating film [16]. These films are available for manufacturers packaging and even for home use [1,201].
Preservative releasers such as antimicrobial and antioxidants are components that can be added directly to the food or can be mixed with packaging materials to release objects to inhibit the growth of bacteria or to reduce the oxidation process that leads to loss of packaged food nutritional value and change its color. For antimicrobial packaging, commercialization is still limited due to the safety concerns and masking the spoilage of packaged food. This may give a false indication regarding the freshness of the food and may lead to improper hygiene along the supply chain as a result of depending on antimicrobial presence [203]. For antioxidants, synthetic types such as butylated hydroxytoluene (BHT), butylated hydroxyanisole (BHA), or tertiary butylhydroquinone (TBHQ) are traditionally used as antioxidants [1,201]. However, due to the potential toxicity of the food as a result of their migration, there is increasing interest toward the use of natural antioxidants, where the antioxidants are made of natural components such as vitamin E or rosemary containing plastic films [1,201,204].
A summary of the commercial names of AP systems, used for packaged vegetables, that are classified depending on the active component is given in Table 9.
7. Challenges, Outlook, and Future Research
Smart packaging is a powerful way to change the current quality assessment models used for packaged vegetables from “Use by” or “Best Before” to more dynamic paradigms. However, several challenges and concerns should be carefully considered. One of the major concerns is the safety of the smart systems used with direct contact to food, especially with the possibility to migrate to food. Therefore, the substances used shall pass and comply with all food regulations regarding the material used. In Europe for instance, there are two main regulation standards’ 1935/2004/EC and 450/2009/EC to control and enhance the safety of smart packaged vegetables, while the US USFDA regulations are for active packaging materials [105]. In Canada, there is the food and drug act and regulations for food packaging and for materials used. Thus, the authorization to use new materials in labels requires a complex and long process for regulatory approval. This may inhibit companies from investing in this field. Therefore, more cooperation between government agencies and commercial entities are required.
Accuracy and robustness of smart sensing systems need to be very high to guarantee public safety and welfare. False positive should be avoided, as having a package labeled safe despite its contamination can cause very serious health and legal problems. The false negative should also be minimized as this is considered an economic loss. New validation techniques and methodologies need to evolve to support testing of such systems. Studies are needed on how the existing systems may be upgraded to improve the quality of smart packaging systems and decrease the number of errors.
Sustainability of the smart system used is an important factor due to its huge impact on the depletion of natural resources. However, many components of the smart packaging systems such as batteries are not environmentally friendly. Thus, the disposal of these smart sensors or labels must be carefully considered. A potential solution of this challenge is in the development of recyclable technology together with the shift toward integrating bio-degradable materials as part of packaging. Green sustainability, a growing trend in smart packaging, can help in reducing environmental impacts. This concept is relatively new and requires more studies and new regulations.
The cost of smart packaging systems is a major limitation for its widespread commercialization. Increasing the unit price of packaged vegetables will not satisfy most consumers. The return-on-investment may then negatively affect manufacturers, inhibiting potential investments in smart packaging technologies. However, the huge food waste in retail and distribution that can be avoided with the use of such technologies. For instance, the outbreaks of E. coli in lettuce in early 2019, lead most traders, manufacturers, and distributers to discard whole batches to avoid the possibility of contamination. This is a big loss that could have been avoided with the use of smart packaging technologies. Risk management may improve with the use of information traced and extracted using real-time monitoring systems that gives more information about the behavior of food. Systems under development should consider the cost to ensure that any price increase will be within few cents per package.
Cyber security and data security are also major concerns that need to be addressed. With improved traceability and tracking systems along the supply chain of the packaged vegetable comes the challenge of handling big data generated from real-time monitoring of packages. For this, the infrastructure requires upgrading of the network to fit the increasing capacity of data generated, and to keep the information private and safe against theft. This is because a consumer information such as location, or preferences may be part of the data gathered. Cryptography can help solving this problem in smart packaging systems. With these precautions, continuously gathering more reliable information about each package state along the supply chain can provide more insights about the consumer preference and current market trends without misuse by hackers.
The need for new manufacturing techniques that comply with the current packaging guidelines is essential to spread and commercialize smart packaging systems use. One promising technology with the potential to overcome some limitations in the packaging industry is printable electronics. Inkjet printing, for instance, is considered a low-cost easy way to produce films from solutions that can be later incorporated as a part of the package [211,212]. The use of nanotechnology also has a great potential in the packaging industry [213]. This is because NPs have the following advantages: ease of integration within packages, uniqueness of functionality that can be provided, high accuracy, ability to communicate information, and low-cost
8. Conclusions
In this article, we review the current trends in smart packaging systems. The smart packaging systems provide potential solutions to the conventional packaging problems such as food loss and contamination. For packaged vegetables, the most important factors to monitor as a part of freshness assessment of vegetables are the ratio of oxygen and carbon dioxide inside the package, ethylene response, pathogen presence, and temperature, which has a huge effect on pathogens growth rate, chlorophyll content, and humidity. Tracking these parameters can be done through intelligent systems such as sensors (optical, bio, gas, and humidity), indicators (TTI, gas and humidity, and freshness), or by data carriers (RFID tags and barcodes). Adjusting these parameters can be done using active packaging such as using scavenging objects (oxygen or carbon dioxide scavengers, moisture absorbers), or releasing objects (oxygen or carbon dioxide emitters, antioxidants, antimicrobials). However, the challenges facing this industry in terms of complexity of legislations and regulation, cost, privacy concerns, and sustainability of the systems used are inhibiting mass-production of such smart systems. Therefore, collaboration between the researchers, industries, regulatory agencies, and the consumers will allow for further development of smart packaging systems.
Author Contributions
The manuscript was written through contributions from all authors. M.J.D. conceived of the idea, and together with H.B., G.K.S., P.R. and A.U.A., defined the detailed contents of the paper. H.B. wrote the first draft of the article which was critiqued by all authors. The article was then revised by H.B., M.J.D. and A.U.A.. All authors have read and agreed to the published version of the manuscript.
Funding
This research was supported by NSERC Green Electronics Network (GreEN, Grant No. 508526-7), a Discovery Grant from the Natural Science and Engineering Research Council (NSERC) of Canada of Canada and the Canada Research Chair program.
Conflicts of Interest
The authors declare no conflict of interest.
References
- Han, J.; Ruiz-Garcia, L.; Qian, J.; Yang, X. Food packaging: A comprehensive review and future trends. Compr. Rev. Food Sci. Food Saf. 2018, 17, 860–877. [Google Scholar] [CrossRef] [Green Version]
- Food Waste in Canada. Available online: https://lovefoodhatewaste.ca/about/food-waste/ (accessed on 21 March 2020).
- The State of Food and Agriculture. Available online: http://www.fao.org/3/ca6030en/ca6030en.pdf (accessed on 21 March 2020).
- Behravesh, C.B.; Jones, T.F.; Vugia, D.J.; Long, C.; Marcus, R.; Smith, K.; Thomas, S.; Zansky, S.; Fullerton, K.E.; Henao, O.L.; et al. FoodNet Working Group, Deaths Associated With Bacterial Pathogens Transmitted Commonly Through Food: Foodborne Diseases Active Surveillance Network (FoodNet), 1996–2005. J. Infect. Dis. 2011, 204, 263–267. [Google Scholar] [CrossRef] [PubMed] [Green Version]
- Taking Stock: Reducing Food Loss and Waste in Canada. Available online: https://www.canada.ca/en/environment-climate-change/services/managing-reducing-waste/food-loss-waste/taking-stock.html#toc4 (accessed on 21 March 2020).
- Plimmer, J. Augmenting and securing the consumer brand experience through smart and intelligent packaging for food, beverages and other fast-moving consumer goods. In Trends in Packaging of Food, Beverages and Other Fast-Moving Consumer Goods Markets, Materials and Technologies, 1st ed.; Farmer, N., Ed.; Woodhead Publishing Series in Food Science; Technology and Nutrition: Philadelphia, PA, USA, 2013; pp. 35–57. [Google Scholar]
- Jin, H.; Qin, Y.; Pan, S.; Alam, A.U.; Dong, S.; Ghosh, R.; Deen, M.J. Open-Source Low-Cost Wireless Potentiometric Instrument for pH Determination Experiments. J. Chem. Educ. 2018, 95, 326–330. [Google Scholar] [CrossRef] [Green Version]
- Alam, A.U.; Clyne, D.; Jin, H.; Hu, N.X.; Deen, M.J. Fully Integrated, Simple, and Low-Cost Electrochemical Sensor Array for in Situ Water Quality Monitoring. Acs Sens. 2020, 5, 412–422. [Google Scholar] [CrossRef]
- Alam, A.U.; Howlader, M.M.; Hu, N.X.; Deen, M.J. Electrochemical sensing of lead in drinking water using β-cyclodextrin-modified MWCNTs. Sens. Actuat. B Chem. 2019, 296, 126632. [Google Scholar] [CrossRef] [Green Version]
- Qin, Y.; Alam, A.U.; Pan, S.; Howlader, M.M.; Ghosh, R.; Hu, N.X.; Deen, M.J. Integrated water quality monitoring system with pH, free chlorine, and temperature sensors. Sens. Actuat. B Chem. 2018, 255, 781–790. [Google Scholar] [CrossRef]
- Alam, A.U.; Qin, Y.; Howlader, M.M.; Hu, N.X.; Deen, M.J. Electrochemical sensing of acetaminophen using multi-walled carbon nanotube and β-cyclodextrin. Sens. Actuat. B Chem. 2018, 254, 896–909. [Google Scholar] [CrossRef]
- Gallocchio, F.; Cibin, V.; Biancotto, G.; Roccato, A.; Muzzolon, O.; Carmen, L.; Simone, B.; Manodori, L.; Fabrizi, A.; Patuzzi, I. Testing nano-silver food packaging to evaluate silver migration and food spoilage bacteria on chicken meat. Food Addit. Contam. Part A 2016, 33, 1063–1071. [Google Scholar] [CrossRef] [PubMed]
- Mohebi, E.; Marquez, L. Intelligent packaging in meat industry: An overview of existing solutions. J. Food Sci. Technol. 2015, 52, 3947–3964. [Google Scholar] [CrossRef]
- Solomon, M.B.; Eastridge, J.S.; Paroczay, E.W.; Williams, J.L.; Shackell, G.H.; Dodds, K.G. Animal Biotechnology for the Enhancement of Meat Quality. In Meat Biotechnology, 1st ed; Tolrá, F., Ed.; Springer Science +Business Media LLC: New York, NY, USA, 2008; pp. 2–91. [Google Scholar]
- Holman, B.W.B.; Kerry, J.P.; Hopkins, D.L. A review of patents for the smart packaging of meat and muscle-based food products, Bentham science. Recent Patents Food Nutr. Agric. 2018, 9, 3–13. [Google Scholar] [CrossRef]
- Beaudry, R.; Scully, A.D.; Horsham, M.A. MAP as a basis for active packaging. Active packaging for fruits and vegetables. In Intelligent and Active Packaging for Fruits and Vegetables, 1st ed.; Wilson, C.L., Ed.; CRC Press: Boca Raton, FL, USA, 2007; pp. 31–72. [Google Scholar]
- Beaudry, R.M. Effect of O2 and CO2 partial pressure on selected phenomena affecting fruit and vegetable quality. Postharvest Biol. Technol. 1999, 16, 293–303. [Google Scholar] [CrossRef]
- Zhen-guo, L.; Yu, L.; Jian-guo, D.; Rong-jiang, X.; Mei-zhen, Z. Effect of low oxygen and high carbon dioxide on the levels of ethylene and 1-aminocyclopropane-1-carboxylic acid in ripening apple fruits. J. Plant Growth Regul. 1983, 2, 81–87. [Google Scholar] [CrossRef]
- Shirazi, A.; Cameron, A.C. Controlling relative humidity in modified atmosphere packages of tomato fruit. Hortscience 1992, 27, 336–339. [Google Scholar] [CrossRef] [Green Version]
- Pant, A.F.; Thielmann, J.; Kuswandi, B. Active Packaging of Fresh and Fresh-cut Fruit and Vegetables. Intelligent Packaging Applications for Fruits and Vegetables. In Innovative Packaging of Fruits and Vegetables: Strategies for Safety and Quality Maintenance, 1st ed.; Siddiqui, M.W., Rahman, M.S., Wani, A.A., Eds.; CRC Press: Boca Raton, FL, USA, 2007; pp. 49–104. [Google Scholar]
- Callejón, R.M.; Rodríguez-Naranjo, M.I.; Úbeda, C.; Hornedo-Ortega, R.; García, M.C.; Garcia-Parrilla, M.C.; Troncoso, A.M. Reported foodborne outbreaks due to fresh produce in the United States and european union: Trends and causes. Foodborne Pathog. Dis. 2015, 12, 32–38. [Google Scholar] [CrossRef]
- Alam, A.U.; Deen, M.J. Bisphenol A Electrochemical Sensor Using Graphene Oxide and β-Cyclodextrin-Functionalized Multi-Walled Carbon Nanotubes. Anal. Chem. 2020, 92, 5532–5539. [Google Scholar] [CrossRef]
- Yam, K.L.; Takhistov, P.T.; Miltz, J. Intelligent packaging: Concepts and applications. J. Food Sci. 2005, 70, R1–R10. [Google Scholar] [CrossRef]
- Queiroz, C.; Mendes Lopes, M.L.; Fialho, E.; Valente-Mesquita, V.L. Polyphenol oxidase: Characteristics and mechanisms of browning control. Food Rev. Int. 2008, 24, 361–375. [Google Scholar] [CrossRef]
- Taranto, F.; Pasqualone, A.; Mangini, G.; Tripodi, P.; Miazzi, M.M.; Pavan, S.; Montemurro, C. Polyphenol Oxidase in crops: Biochemical, physiological and genetic aspects. Int. J. Mol. Sci. 2017, 18, 377. [Google Scholar] [CrossRef]
- Sharma, K.; Lee, Y.R.; Park, S.W.; Nile, S.H. Importance of growth hormones and temperature for physiological regulation of dormancy and sprouting in onions. Food Rev. Int. 2016, 32, 233–255. [Google Scholar] [CrossRef]
- Wang, S.S.; Haard, N.F.; Dimarco, G.R. Chlorophyll degradation during controlled atmosphere storage of asparagus. J. Food Sci. 1971, 36, 657–661. [Google Scholar] [CrossRef]
- Burg, S.P.; Burg, E.A. Molecular requirements for the biological activity of ethylene. Plant Physiol. 1967, 42, 144–152. [Google Scholar] [CrossRef] [Green Version]
- Kubu, Y.; Inaba, A.; Nakamura, R. Respiration and C2H4 Production in Various Harvested Crops Held in CO2 -enriched Atmospheres. J. Amer. Soc. Hort. Sci. 1990, 115, 975–978. [Google Scholar] [CrossRef] [Green Version]
- Falagán, N.; Terry, L.A. Recent Advances in Controlled and Modified Atmosphere of Fresh Produce. Johns. Matthey Technol. Rev. 2018, 62, 107–117. [Google Scholar] [CrossRef]
- Velusamy, V.; Arshak, K.; Korostynska, O.; Oliwa, K.; Adley, C. An overview of foodborne pathogen detection: In the perspective of biosensors. Biotechnol. Adv. 2010, 28, 232–254. [Google Scholar] [CrossRef] [PubMed]
- Public Health Inspector’s Guide to Environmental Microbiology Laboratory Testing. 2019. Available online: https://www.publichealthontario.ca/-/media/documents/lab/phi-guide.pdf?la=en (accessed on 21 March 2020).
- Microbial Guidelines for Ready-to-Eat Foods. Available online: https://www.albertahealthservices.ca/assets/wf/eph/wf-eh-microbial-guidelines-for-ready-to-eat-foods.pdf (accessed on 21 March 2020).
- Francis, G.A.; O’Beirne, D. Food-borne Pathogen Effects of vegetable type, package atmosphere and storage temperature on growth and survival of Escherichia coli O157:H7 and Listeria monocytogenes. J. Ind. Microbiol. Biotechnol. 2001, 27, 111–116. [Google Scholar] [CrossRef]
- U.S. FDA Bacteriological Analytical Manual. Available online: https://www.fda.gov/food/laboratory-methods-food/bam-chapter-4-enumeration-escherichia-coli-and-coliform-bacteria (accessed on 21 March 2020).
- AOAC Official Method 992.30 Confirmed total Coliform and Escherichia Coli in All Foods. Available online: http://www.biocontrolsys.com/assets/uploads/ColiComplete_AOAC%20Method%20992.30.pdf (accessed on 21 March 2020).
- Valentin-Bon, I.; Jacobson, A.; Monday, S.R.; Feng, P.C.H. Microbiological quality of bagged cut spinach and lettuce mixes. Appl. Env. Microbiol. 2008, 74, 1240–1242. [Google Scholar] [CrossRef] [PubMed] [Green Version]
- Heiman, K.E.; Mody, R.K.; Johnson, S.D.; Griffin, P.M.; Gould, L.H. Escherichia coli O157 Outbreaks in the United States, 2003-2012. Emerg. Infect. Dis. 2015, 21, 1293–1301. [Google Scholar] [CrossRef] [PubMed]
- Outbreak Investigation of E. coli: Romaine from Salinas, California (November 2019). Available online: https://www.fda.gov/food/outbreaks-foodborne-illness/outbreak-investigation-e-coli-romaine-salinas-california-november-2019 (accessed on 21 March 2020).
- Outbreak of E. coli Infections Linked to Romaine Lettuce (2019). Available online: https://www.cdc.gov/ecoli/2019/o157h7-11-19/index.html (accessed on 21 March 2020).
- Sant’Ana, A.S.; Franco, B.D.G.M.; Schaffner, D.W. Risk of infection with Salmonella and Listeria monocytogenes due to consumption of ready-to-eat leafy vegetables in Brazil. J. Food Control 2014, 42, 1–8. [Google Scholar] [CrossRef] [Green Version]
- Greig, J.D.; Ravel, A. Analysis of foodborne outbreak data reported internationally for source attribution. Int. J. Food Microbiol. 2009, 130, 77–87. [Google Scholar] [CrossRef]
- Painter, J.A.; Hoekstra, R.M.; Ayers, T.; Tauxe, R.V.; Braden, C.R.; Angulo, F.J.; Griffin, P.M. Attribution of Foodborne Illnesses, Hospitalizations, and Deaths to Food Commodities by using Outbreak Data, United States, 1998–2008. Emerg. Infect. Dis. 2013, 19, 407–415. [Google Scholar] [CrossRef]
- Dewey-Mattia, D.; Manikonda, K.; Hall, A.J.; Wise, M.E.; Crowe, S.J. Surveillance for Foodborne Disease Outbreaks—United States, 2009–2015. MMWR Surveill Summ. 2018, 67, 1–11. [Google Scholar] [CrossRef]
- Brown, W.; Ryser, E.; Gorman, L.; Steinmaus, S.; Vorst, K. Transit temperatures experienced by fresh- cut leafy greens during cross-country shipment. Food Contr. 2016, 61, 146–155. [Google Scholar] [CrossRef]
- Zeng, W.; Vorst, K.; Brown, W.; Marks, B.P.; Jeong, S.; Pérez-Rodríguez, F.; Ryser, E.T. Growth of Escherichia coli O157:H7 and Listeria monocytogenes in packaged 667 fresh-cut romaine mix at fluctuating temperatures during commercial transport, retail 668 storage, and display. J. Food Prot. 2014, 77, 197–206. [Google Scholar] [CrossRef]
- Koseki, S.; Isobe, S. Prediction of pathogen growth on iceberg lettuce under real temperature history during distribution from farm to table. Int. J. Food Microbiol. 2005, 104, 239–248. [Google Scholar] [CrossRef]
- Luo, Y.; He, Q.; McEvoy, J.L. Effect of Storage Temperature and Duration on the Behavior of Escherichia coli O157:H7 on Packaged Fresh-Cut Salad Containing Romaine and Iceberg Lettuce. J. Food Sci. 2010, 75, M390–M397. [Google Scholar] [CrossRef]
- O’Beirne, D.; Zagory, D. Microbial safety of modified atmosphere packaged fresh-cut produce. In Modified and Controlled Atmospheres for the Storage, Transportation, and Packaging of Horticultural Commodities, 1st ed.; Yehia, E.M., Ed.; CRC Press: Boca Raton, FL, USA, 2009; pp. 213–231. [Google Scholar]
- McEvoy, J.L.; Luo, Y.; Zhou, B.; Feng, H.; Conway, W.S. Potential of Escherichia coli O157:H7 to grow on field-cored lettuce as impacted by postharvest storage time and temperature. Int. J. Food Microbiol. 2009, 128, 506–509. [Google Scholar] [CrossRef]
- Sant’Ana, A.S.; Barbosa, M.S.; Destro, M.T.; Landgraf, M.; Franco, B.D.G.M. Growth potential of Salmonella spp. and Listeria monocytogenes in nine types of ready-to-eat vegetables stored at variable temperature conditions during shelf-life. Int. J. Food Microbiol. 2012, 157, 52–85. [Google Scholar] [CrossRef]
- Wu, F.M.; Doyle, M.P.; Beuchat, L.R.; Wells, J.G.; Mintz, E.D.; Swaminathan, B. Fate of Shigella sonnei on parsley and Methods of Disinfection. J. Food Prot. 2000, 63, 568–572. [Google Scholar] [CrossRef] [PubMed]
- Choma, C.; Clavel, T.; Dominguez, H.; Razafindramboa, N.; Soumille, H.; Nguyen-the, C.; Schmitt, P. Effect of temperature on growth characteristics of Bacillus cereus TZ415. Int. J. Food Microbiol. 2000, 55, 73–77. [Google Scholar] [CrossRef]
- Curran, P.J.; Dungan, J.L.; Gholz, H.L. Exploring the relationship between reflectance red edge and chlorophyll content in slash pine. Tree Physiol. 1990, 7, 33–48. [Google Scholar] [CrossRef]
- Diezma, B.; Lleó, L.; Roger, J.M.; Herrero-Langreo, A.; Lunadei, L.; Ruiz-Altisent, M. Examination of the quality of spinach leaves using hyperspectral imaging. Postharvest Biol. Technol. 2013, 85, 8–17. [Google Scholar] [CrossRef] [Green Version]
- Baker, N.R. Chlorophyll fluorescence: A probe of photosynthesis in vivo. Annu. Rev. Plant Biol. 2008, 59, 89–113. [Google Scholar] [CrossRef] [Green Version]
- Muneer, S.; Kim, E.J.; Park, J.S.; Lee, J.H. Influence of green, red and blue light emitting diodes on multiprotein complex proteins and photosynthetic activity under different light intensities in lettuce leaves (Lactuca sativa L.). Int. J. Mol. Sci. 2014, 15, 4657–4670. [Google Scholar] [CrossRef]
- Simko, I.; Jimenez-Berni, J.A.; Furbank, R.T. Detection of decay in fresh-cut lettuce using hyperspectral imaging and chlorophyll fluorescence imaging. Postharvest Biol. Technol. 2015, 106, 44–52. [Google Scholar] [CrossRef]
- Lenk, S.; Chaerle, L.; Pfündel, E.E.; Langsdorf, G.; Hagenbeek, D.; Lichtenthaler, H.K.; Buschmann, C. Multispectral fluorescence and reflectance imaging at the leaf level and its possible applications. J. Exp. Bot. 2007, 58, 807–814. [Google Scholar] [CrossRef] [Green Version]
- Jones, C.L.; Weckler, P.R.; Maness, N.O.; Jayasekara, R.; Stone, M.L.; Chrz, D. Remote sensing-based method for estimating Chlorophyll concentration in spinach. Trans. Asabe 2007, 50, 2267–2273. [Google Scholar] [CrossRef]
- Hörtensteiner, S.; Kräutler, B. Chlorophyll breakdown in higher plants. Bba Bioenerg. 2011, 1807, 977–988. [Google Scholar] [CrossRef] [Green Version]
- Biswall, B. Carotenoid catabolism during leaf senescence and its control by light. Photochem. Photobiol. B. 1995, 30, 3–14. [Google Scholar] [CrossRef]
- Ferrante, A.; Incrocci, L.; Maggini, R.; Serra, G.; Tognoni, F. Colour changes of fresh-cut leafy vegetables during storage. J. Food Agric. 2004, 2, 40–44. [Google Scholar]
- Fluorescence Imaging: Principles and Methods. Available online: http://www.bu.edu/picf/files/2010/10/Fluor-ImagingPrinciples.pdf (accessed on 21 March 2020).
- Vegetation Spectral Signature Cheat Sheet. Available online: https://grindgis.com/remote-sensing/vegetation-spectral-signature-cheat-sheet (accessed on 21 March 2020).
- Zheng, S.; Ya, G.; Yingtian, H.; Chao, L.; Xiaoping, W. In-site chlorophyll-a fluorometer based on lock-in amplifier. Proc. SPIE 10850 Ocean Op. Inf. Technol. 2019, 10850, 085014. [Google Scholar] [CrossRef]
- Trissl, H.W.; Gao, Y.; Wulf, K. Theoretical fluorescence induction curves derived from coupled differential equations describing the primary photochemistry of photosystem ii by an exciton-radical pair equilibrium. Biophys. J. 1993, 64, 974–988. [Google Scholar] [CrossRef] [Green Version]
- Strasser, R.J.; Srivastava, A.; Govindjee, G. Polyphasic chlorophyll a fluorescence transient in plants and cyanobacteria. Photochem. Photobiol. 2008, 61, 32–42. [Google Scholar] [CrossRef]
- Zarco-Tejada, P.J.; Miller, J.R.; Mohammed, G.H.; Noland, T.L. Chlorophyll fluorescence effects on vegetation apparent reflectance: I. Leaf-level measurements and model simulation. Remote Sens Env. 2000, 74, 582–595. [Google Scholar] [CrossRef]
- Krause, G.H.; Weis, E. Chlorophyll fluorescence and photosynthesis: The basics. Annu. Rev. Plant Biol. 1991, 42, 313–349. [Google Scholar] [CrossRef]
- Chreiber, U.; Schliwa, U.; Bilger, W. Continuous recording of photochemical and non-photochemical chlorophyll fluorescence quenching with a new type of modulation fluorometer. Photosynth Res. 1986, 10, 51–62. [Google Scholar] [CrossRef]
- Mauzerall, D. Light-induced fluorescence changes in chlorella, and the primary photoreactions for the production of oxygen. Proc. Nat. Acad. Sci. USA 1972, 69, 1358–1362. [Google Scholar] [CrossRef] [Green Version]
- Falkowski, P.G.; Wyman, K.; Ley, A.C.; Mauzerall, D.C. Relationship of steady-state photosynthesis to fluorescence in eucaryotic algae. BBA Bioenerg. 1986, 849, 183–192. [Google Scholar] [CrossRef]
- Tseng, Y.; Chu, S. High spatio-temporal-resolution detection of chlorophyll fluorescence dynamics from a single chloroplast with confocal imaging fluorometer. Plant Methods 2016, 13, 43. [Google Scholar] [CrossRef] [Green Version]
- Shippert, P. Why use hyperspectral imagery? Photogramm. Eng. Remote Sens. 2004, 70, 377–380. [Google Scholar]
- Spectral Imaging and Linear Unmixing. Available online: https://www.microscopyu.com/techniques/confocal/spectral-imaging-and-linear-unmixing (accessed on 21 March 2020).
- Xue, L.; Yang, L. Deriving leaf chlorophyll content of green-leafy vegetables from hyperspectral reflectance. Isprs J. Photogramm. Remote Sens. 2009, 64, 97–106. [Google Scholar] [CrossRef]
- Murchie, E.H.; Lawson, T. Chlorophyll fluorescence analysis: A guide to good practice and understanding some new applications. J. Exp. Bot. 2013, 64, 3983–3998. [Google Scholar] [CrossRef] [PubMed] [Green Version]
- Siripatrawan, U.; Makino, Y.; Kawagoe, Y.; Oshita, S. Rapid detection of Escherichia coli contamination in packaged fresh spinach using hyperspectral imaging. Talanta 2011, 85, 276–281. [Google Scholar] [CrossRef]
- Muhammad-Tahir, Z.; Alocilja, E.C. A disposable biosensor for pathogen detection in fresh produce samples. Biosys. Eng. 2004, 88, 145–155. [Google Scholar] [CrossRef]
- Muhammad-Tahir, Z.; Alocilja, E.C. Fabrication of a disposable biosensor for Escherichia coli O157: H7 detection. IEEE Sens. J. 2003, 3, 345–351. [Google Scholar] [CrossRef]
- Suthiluk, P.; Saranwong, S.; Kawano, S.; Numthuam, S.; Satake, T. Possibility of using near infrared spectroscopy for evaluation of bacterial contamination in shredded cabbage. Int. J. Food Sci. Technol. 2008, 43, 160–165. [Google Scholar] [CrossRef]
- Sustainabiliy and Functionality at the Heart of Packaging Innovation. Available online: https://www.slideshare.net/islemyezza/sustainability-functionality-at-the-heart-of-packaging-innovation (accessed on 21 March 2020).
- Silva, L.M.D.C.; dos Santos, V.S.; Salgado, A.M.; Pereira, K.S. Biosensors for contaminants monitoring in food and environment for human and environmental health. In State of the Art in Biosensors: Environmental and Medical Applications; Rinken, T., Ed.; InTech: London, UK, 2013; pp. 152–168. [Google Scholar]
- Scarano, S.; Mascini, M.; Turner, A.P.F.; Minunni, M. Surface Plasmon Resonance Imaging for Affinity-based Biosensors. Biosens. Bioelectron. 2010, 25, 957–966. [Google Scholar] [CrossRef] [Green Version]
- Kumar, S.; Dilbaghi, N.; Barnela, M.; Bhanjana, G.; Kumar, R. Biosensors as novel platforms for detection of food pathogens and allergens. Bionanoscience 2012, 2, 96–217. [Google Scholar] [CrossRef]
- Yi, Y.; Sanchez, L.; Gao, Y.; Yu, Y. Janus particles for biological imaging and sensing. Analyst 2016, 141, 3526–3539. [Google Scholar] [CrossRef] [Green Version]
- Brockman, J.M.; Fernandez, S.M. Grating-coupled surface plasmon resonance for rapid, label-free, array-based sensing. Am. Lab. 2001, 33, 37–41. [Google Scholar]
- Unfricht, D.W.; Colpitts, S.L.; Fernandez, S.M.; Lynes, M.A. Grating-coupled surface plasmon resonance: A cell and protein microarray platform. Proteomics 2005, 5, 4432–4442. [Google Scholar] [CrossRef]
- Oh, B.K.; Lee, W.; Chun, B.S.; Bae, Y.M.; Lee, W.H.; Choi, J.W. The fabrication of protein chip based on surface plasmon resonance for detection of pathogens. Biosens. Bioelectron. 2005, 20, 1847–1850. [Google Scholar] [CrossRef]
- Wang, H.; Zhou, Y.; Jiang, X.; Sun, B.; Zhu, Y.; Wang, H.; .He, Y. Simultaneous capture, detection, and inactivation of bacteria as enabled by a Surface-Enhanced Raman scattering multifunctional chip. Angew. Chem. Int. Ed. 2015, 54, 5132–5136. [Google Scholar] [CrossRef]
- Schmilovitch, Z.; Mizrach, A.; Alchanatis, V.; Kritzman, G.; Korotic, R.; Irudayaraj, J.; Debroy, C. Detection of bacteria with low-resolution Raman spectroscopy. Trans. Asae 2005, 48, 1843–1850. [Google Scholar] [CrossRef]
- Al-Holy, M.A.; Lin, M.; Cavinato, A.G.; Rasco, B.A. The use of Fourier transform infrared spectroscopy to differentiate Escherichia coli O157: H7 from other bacteria inoculated into apple juice. Food Microbiol. 2006, 23, 162–168. [Google Scholar] [CrossRef] [PubMed]
- Liu, Y.C.; Ye, J.M.; Li, Y.B. Rapid detection of Escherichia coli O157: H7 inoculated in ground beef, chicken carcass, and lettuce samples with an immunomagnetic chemiluminescence fiber-optic biosensor. J. Food Prot. 2003, 66, 512–517. [Google Scholar] [CrossRef]
- Bhunia, A.K. Biosensors and Bio-Based Methods for the Separation and Detection of Foodborne Pathogens. Adv. Food Nutr. Res. 2008, 54, 1–44. [Google Scholar]
- McKillip, J.L.; Jaykus, L.-A.; Drake, M. Influence of Growth in a Food Medium on the Detection of Escherichia Coli O157: H7 by Polymerase Chain Reaction. J. Food Prot. 2002, 65, 1775–1779. [Google Scholar] [CrossRef] [PubMed]
- Nakano, S.; Kobayashi, T.; Funabiki, K.; Matsumura, A.; Nagao, Y.; Yamada, T. PCR Detection of Bacillus and Staphylococcus in Various Foods. J. Food Prot. 2004, 67, 1271–1277. [Google Scholar] [CrossRef]
- Ruan, C.; Wang, H.; Li, Y. A bienzyme electrochemical biosensor coupled with immunomagnetic separation for rapid detection of Escherichia coli O15: H7 in food samples. Trans Asae 2002, 45, 249–255. [Google Scholar] [CrossRef]
- Ercole, C.; Del Gallo, M.; Mosiello, L.; Baccella, S.; Lepidi, A. Escherichia coli detection in vegetable food by a potentiometric biosensor. Sens. Actuat B Chem. 2003, 91, 163–168. [Google Scholar] [CrossRef]
- Muhammad-Tahir, Z.; Alocilja, E.C. A conductometric biosensor for biosecurity. Biosens. Bioelectron. 2003, 18, 813–819. [Google Scholar] [CrossRef]
- Pal, S.; Ying, W.; Alocija, E.C.; Downes, F.P. Sensitivity and specificity performance of a direct- charge transfer biosensor for detecting Bacillus cereus in selected food matrices. Biosys. Eng. 2008, 99, 461–468. [Google Scholar] [CrossRef]
- Munoz-Berbel, X.; Vigues, N.; Jenkins, A.T.A.; Mas, J.; Munoz, F.J. Impedimetric approach for quantifying low bacteria concentrations based on the changes produced in the electrode-solution interface during the preattachment stage. Biosens. Bioelectron. 2008, 23, 1540–1546. [Google Scholar] [CrossRef] [PubMed]
- Tully, E.; Higson, S.P.; O’Kennedy, R. The development of a ‘labeless’ immunosensor for the detection of Listeria monocytogenes cell surface protein, Internalin B. Biosens. Bioelectron. 2008, 23, 906–912. [Google Scholar] [CrossRef]
- Toxin Alert! Available online: https://www.theengineer.co.uk/toxin-alert/ (accessed on 21 March 2020).
- Lee, S.J.; Rahman, A.T.M.M. Intelligent Packaging for food products. In Innovation in Food Packaging, 2nd ed.; Han, J.H., Ed.; Academic Press: London, UK, 2014; pp. 171–203. [Google Scholar]
- Bodenhamer, W.T.; Jupiter, F. Method and Apparatus for Selective Biological Material Detection. U.S. Patent 006051388, 18 April 2000. [Google Scholar]
- Ghaani, M.; Cozzolino, C.A.; Castelli, G.; Farris, S. An overview of the intelligent packaging technologies in the food sector. Trends Food Sci. Technol. 2006, 51, 1–11. [Google Scholar] [CrossRef] [Green Version]
- Zhang, Q.; Savagatrup, S.; Kaplonek, P.; Seeberger, P.H.; Swager, T.M. Janus emulsions for the detection of bacteria. Acs Cent. Sci. 2017, 3, 309–313. [Google Scholar] [CrossRef]
- Yoshida, M.; Roh, K.H.; Mandal, S.; Bhaskar, S.; Lim, D.; Nandivada, H.; Deng, X.; Lahann, J. Structurally Controlled Bio- Hybrid Materials Based on Unidirectional Association of Anisotropic Microparticles with Human Endothelial Cells. Adv. Mater. 2009, 21, 4920–4925. [Google Scholar] [CrossRef] [PubMed]
- Le, T.C.; Zhai, J.; Chiu, W.-H.; Tran, P.A.; Tran, N. Janus particles: Recent advances in the biomedical applications. Int. J. Nanomed. 2019, 14, 6749–6777. [Google Scholar] [CrossRef] [Green Version]
- Suci, P.A.; Kang, S.; Young, M.; Douglas, T. A Streptavidin- Protein Cage Janus Particle for Polarized Targeting and Modular Functionalization. J. Am. Chem. Soc. 2009, 131, 9164–9165. [Google Scholar] [CrossRef]
- Wang, L.-F.; Rhim, J.W. Preparation and application of agar/alginate/collagenternary blend functional food packaging films. Int. J. Biol. Macromol. 2015, 80, 460–468. [Google Scholar] [CrossRef]
- DeMoura, M.R.; Mattoso, L.H.; Zucolotto, V. Development of cellulose-based bactericidal nano composites containing silver nanoparticles and their use as active Food packaging. J. Food Eng. 2012, 109, 520–524. [Google Scholar] [CrossRef]
- Tankhiwale, R.; Bajpai, S. Graft copolymerization onto cellulose-based filter paper and its further development as silver nanoparticles loaded antibacterial food-packaging material. Colloids Surf. B Biointerfaces 2009, 69, 164–168. [Google Scholar] [CrossRef] [PubMed]
- Duncan, T.V. Applications of nanotechnology in food packaging and food safety: Barrier materials, antimicrobials and sensors. J. Colloid Interface Sci. 2011, 363, 1–24. [Google Scholar] [CrossRef]
- Kuorwel, K.K.; Cran, M.J.; Orbell, J.D.; Buddhadasa, S.; Bigger, S.W. Review of mechanical properties, migration, and potential applications in active food packaging systems containing nanoclays and nanosilver. Compr. Rev. Food Sci. Food Saf. 2015, 14, 411–430. [Google Scholar] [CrossRef] [Green Version]
- Mustafa, F.; Andreescu, S. Chemical and biological sensors for food-quality monitoring and smart packaging. Foods 2018, 7, 168. [Google Scholar] [CrossRef] [Green Version]
- Borchert, N.B.; Kerry, J.P.; Papkovsky, D.B. A CO2 sensor based on Pt-porphyrin dye and FRET scheme for food packaging applications. Sens. Actuators B. Chem. 2013, 176, 157–165. [Google Scholar] [CrossRef]
- Mills, A.; Chang, Q. Fluorescent plastic film sensors for carbon dioxide. Analyst 1993, 118, 839–843. [Google Scholar] [CrossRef]
- Sahoo, H. Förster resonance energy transfer—a spectroscopic nanoruler: Principle and applications. J. Photochem. Photobiol. C 2011, 12, 20–30. [Google Scholar] [CrossRef]
- Kalpana, S.; Priyadarshini, S.R.; Leena, M.M.; Moses, J.A.; Anandharamakrishnan, C. Intelligent packaging: Trends and applications in food systems. Trends Food Sci. Technol. 2019, 93, 145–157. [Google Scholar] [CrossRef]
- McEvoy, A.K.; Bueltzingsloewen, C.V.; McDonagh, C.M.; MacCraith, B.D.; Klimant, I.; Wolfveis, O.S. Optical sensors for application in intelligent food-packaging technology. Proc. Spie Int. Soc. Opt. Eng. 2003, 4876, 806–815. [Google Scholar] [CrossRef]
- Boniello, C.; Mayr, T.; Bolivar, J.M.; Nidetzky, B. Dual-lifetime referencing (DLR): A powerful method for on-line measurement of internal pH in carrier-bound immobilized biocatalysts. Bmc Biotechnol. 2012, 12, 11–12. [Google Scholar] [CrossRef] [Green Version]
- Puligundla, P.; Jung, J.; Ko, S. Carbon dioxide sensors for intelligent food packaging applications. Food Control 2012, 25, 328–333. [Google Scholar] [CrossRef]
- Bultzingslowen, C.V.; McEvoy, A.K.; McDonagh, C.; MacCraith, B.D.; Klimant, I.; Krause, C.; Wolfveis, O.S. Sol-gel based optical carbon dioxide sensor employing dual luminophore referencing for application in food packaging technology. Analyst 2002, 127, 1478–1483. [Google Scholar] [CrossRef] [PubMed]
- Thermal Conductivity Versus Infrared CO2 Sensors. Available online: https://labincubators.net/blogs/blog/thermal-conductivity-versus-infrared-co2-sensors. (accessed on 21 March 2020).
- Neethirajan, S.; Jayas, D.S.; Sadistap, S. Carbon dioxide (CO2) sensors for agri-food industry- A review. Food Bioprocess. Technol. 2009, 2, 115–121. [Google Scholar] [CrossRef]
- Quintero, A.V.; Molina-Lopez, F.; Smits, E.C.P.; Danesh, E.; Brand, J.V.D.; Persaud, K.; Oprea, A.; Barsan, N.; Weimar, U.; de Rooij, N.F.; et al. Smart RFID label with a printed multisensor platform for environmental monitoring. Flex. Print. Electron. 2016, 1, 025003. [Google Scholar] [CrossRef] [Green Version]
- Borisov, S.M.; Waldhier, M.C.; Klimant, I.; Wolfbeis, O.S. Optical carbon dioxide sensors based on silicone-encapsulated room-temperature ionic liquids. Chem. Mater. 2007, 19, 6187–6194. [Google Scholar] [CrossRef]
- Shin, J.; Braun, P.V.; Lee, W. Fast response photonic crystal pH sensor based on template photo-polymerized hydrogel inverse opal. Sens. Actuators B 2010, 150, 183–190. [Google Scholar] [CrossRef]
- Banerjee, S.; Kelly, C.; Kerry, J.P.; Papkovsky, D.B. High throughput non- destructive assessment of quality and safety of packaged food products using phosphorescent oxygen sensors. Trends Food Sci. Technol. 2016, 50, 85–102. [Google Scholar] [CrossRef] [Green Version]
- Lakowitcz, J.R. Principles of Fluorescence Spectroscopy, 3rd ed.; Springer: New York, NY, USA, 2006; pp. 278–327. [Google Scholar]
- Borisov, S.M.; Nuss, G.; Klimant, I. Red light-excitable oxygen sensing materials based on Platinum (II) and Palladium (II) benzoporphyrins. Anal. Chem. 2008, 80, 9435–9442. [Google Scholar] [CrossRef]
- Fitzgerald, M.; Papkovsky, D.B.; Smiddy, M.; Kerry, J.P.; O’Sullivan, C.K.; Buckley, D.J.; Guilbault, G.G. Nondestructive monitoring of oxygen profiles in packaged foods using phase-fluorimetric oxygen sensor. J. Food Sci. 2001, 66, 105–110. [Google Scholar] [CrossRef]
- Hempel, A.; Sullivan, M.; Papkovsky, D.; Kerry, J. Assessment and use of optical oxygen sensors as tools to assist in optimal product component selection for the development of packs of ready-to-eat mixed salads and for the non- destructive monitoring of in-pack oxygen levels using chilled storage. Foods 2013, 2, 213–244. [Google Scholar] [CrossRef]
- Borisov, S.; Klimant, I. Luminescent nanobeads for optical sensing and imaging of dissolved oxygen. Microchim. Acta 2009, 164, 7–15. [Google Scholar] [CrossRef]
- Mills, A. Oxygen indicators and intelligent inks for packaging food. Chem. Soc. Rev. 2005, 34, 1003–1011. [Google Scholar] [CrossRef] [PubMed]
- Lai, S.W.; Hou, Y.J.; Che, C.M.; Pang, H.L.; Wong, K.Y.; Chang, C.K.; Zhu, N. Electronic spectroscopy, photophysical properties, and emission quenching studies of an oxydatively robust perfuorinated platinum porphyrin. Inorg. Chem. 2004, 43, 3724–3732. [Google Scholar] [CrossRef]
- Papkovsky, D.B.; Ponomarev, G.V.; Trettnak, W.; O’Leary, P. Phosphorescent complexes of phorphyrin ketones: Optical properties and application to oxygen sensing. Anal. Chem. 1995, 67, 4112–4117. [Google Scholar] [CrossRef]
- Borisov, S.M.; Nuss, G.; Haas, W.; Saf, R.; Schmuck, M.; Klimant, I. New NIR-emitting complexes of platinum(II) and palladium(II) with fuorinated benzoporphyrins. J. Photochem. Photob. A 2009, 201, 128–135. [Google Scholar] [CrossRef]
- Fujita, Y.; Kudo, H.; Tanigawa, I. Galvanic Cell Type Oxygen Sensor. U.S. Patent 4495051, 22 January 1985. [Google Scholar]
- Willett, M. Oxygen Sensing for Industrial Safety—Evolution and New Approaches. Sensor (Basel) 2014, 14, 6084–6103. [Google Scholar] [CrossRef] [Green Version]
- Electrochemical Oxygen Gas Sensor. Available online: http://www.gassensor.ru/data/files/oxygen/SENKOO2.pdf (accessed on 21 March 2020).
- Non-Invasive Oxygen Measurement Systems, Oxysense Oxygen Analyzer 325i. Available online: https://www.systechillinois.com/en/products/oxysense-325i (accessed on 21 March 2020).
- OpTech-O2 Model P. Available online: https://www.mocon.com/assets/documents/optech.pdf (accessed on 21 March 2020).
- Oxygen Gas Sensor. Available online: https://datasheetspdf.com/parts/SS1118.pdf?id=791078 (accessed on 21 March 2020).
- Eom, K.H.; Kim, M.C.; Lee, S.-J.; Lee, C.W. The Vegetable Freshness Monitoring System Using RFID with Oxygen and Carbon Dioxide Sensor. Int. J. Distrib. Sens. Netw. 2012, 8, 472986. [Google Scholar] [CrossRef] [Green Version]
- Infrared CO2 Sensor SRH Series User Manual. Available online: https://pdf.directindustry.com/pdf/cubic-sensor-instrument-co-ltd/infrared-co2-sensor-srh-series-user-manual/54752-634077.html (accessed on 21 March 2020).
- Farahani, H.; Wagiran, R.; Hamidon, M.N. Humidity Sensors Principle, Mechanism, and Fabrication Technologies: A Comprehensive Review. Sensors 2014, 14, 7881–7939. [Google Scholar] [CrossRef] [Green Version]
- Göpel, W.; Jones, T.A.; Kleitz, M.; Lundström, I.; Seiyama, T. Sensors: A Comprehensive Survey, 1st ed.; Hesse, J., Zemel, J.N., Eds.; VCH: Weinheim, Germany, 2008; Volume 3, pp. 988–1012. [Google Scholar]
- Lin, W.-D.; Chang, H.-M.; Wu, R.-J. Applied Novel Sensing Material Graphene/polypyrrole for Humidity Sensor. Sens. Actuators B Chem. 2013, 181, 326–331. [Google Scholar] [CrossRef]
- Kim, E.; Kim, S.Y.; Jo, G.; Kim, S.; Park, M.J. Colorimetric and Resistive Polymer Electrolyte Thin Films for Real-Time Humidity Sensors. Acs Appl. Mater. Interfaces 2012, 4, 5179–5187. [Google Scholar] [CrossRef]
- Cha, J.-R.; Gong, M.-S. Polyelectrolyte Humid Membranes Anchored to the Gold Surface on Flexible Polyimide Substrate and Their Water Durability. Sens. Actuators B Chem. 2011, 160, 1082–1090. [Google Scholar] [CrossRef]
- Su, P.-G.; Wang, C.-S. Novel Flexible Resistive-Type Humidity Sensor. Sens. Actuators B Chem. 2007, 123, 1071–1076. [Google Scholar] [CrossRef]
- Bibi, F.; Guillaume, C.; Vena, A.; Gontard, N.; Sorli, B. Wheat gluten, a bio-polymer layer to monitor relative humidity in food packaging: Electric and dielectric characterization. Sens. Actuators A Phys. 2016, 247, 355–367. [Google Scholar] [CrossRef] [Green Version]
- Rivadeneyra, A.; Fernández-Salmerón, J.; Agudo, M.; López-Villanueva, J.A.; Capitan-Vallvey, L.F.; Palma, A.J. Design and characterization of a low thermal drift capacitive humidity sensor by inkjet-printing. Sens. Actuators B Chem. 2014, 195, 123–131. [Google Scholar] [CrossRef]
- Harris, K.D.; Huizinga, A.; Brett, M.J. High-Speed Porous Thin Film Humidity Sensors. Electrochem. Solid State Lett. 2002, 5, H27–H29. [Google Scholar] [CrossRef]
- Harrey, P.M.; Ramsey, B.J.; Evans, P.S.A.; Harrison, D.J. Capacitive-Type Humidity Sensors Fabricated Using the Offset Lithographic Printing Process. Sens. Actuators B Chem. 2002, 87, 226–232. [Google Scholar] [CrossRef]
- Lei, X.; Rui, W.; Qi, X.; Dan, Z.; Yong, L. Micro Humidity Sensor with High Sensitivity and Quick Response/Recovery Based on ZnO/TiO2 Composite Nanofibers. Chin. Phys. Lett. 2011, 28, 070702. [Google Scholar] [CrossRef]
- Imran, Z.; Batool, S.S.; Jamil, H.; Usman, M.; Israr-Qadir, M.; Shah, S.H.; Jamil-Rana, S.; Rafiq, M.A.; Hasan, M.M.; Willander, M. Excellent Humidity Sensing Properties of Cadmium Titanate Nanofibers. Ceram. Int. 2013, 39, 457–462. [Google Scholar] [CrossRef]
- Kim, Y.; Jung, B.; Lee, H.; Kim, H.; Lee, K.; Park, H. Capacitive humidity sensor design based on anodic aluminum oxide. Sens. Actuators B Chem. 2009, 141, 441–446. [Google Scholar] [CrossRef]
- Xie, W.; Liu, B.; Xiao, S.; Li, H.; Wang, Y.; Cai, D.; Wang, D.; Wang, L.; Liu, Y.; Li, Q.; et al. High performance humidity sensors based on CeO2 nanoparticles. Sens. Actuators B Chem. 2015, 215, 125–132. [Google Scholar] [CrossRef]
- Su, P.-G.; Wang, C.-P. Flexible Humidity Sensor Based on TiO2 Nanoparticles-Polypyrrole-Poly-[3-(methacrylamino)propyl] Trimethyl Ammonium Chloride Composite Materials. Sens. Actuators B Chem. 2008, 129, 538–543. [Google Scholar] [CrossRef]
- Su, P.-G.; Huang, L.-N. Humidity Sensors Based on TiO2 Nanoparticles/polypyrrole Composite Thin Films. Sens. Actuators B Chem. 2007, 123, 501–507. [Google Scholar] [CrossRef]
- Ahmad, Z.; Zafar, Q.; Sulaiman, K.; Akram, R.; Karimov, K.S. A Humidity Sensing Organic-Inorganic Composite for Environmental Monitoring. Sensors 2013, 13, 3615–3624. [Google Scholar] [CrossRef] [Green Version]
- Aziz, F.; Sayyad, M.H.; Sulaiman, K.; Majlis, B.H.; Karimov, K.S.; Ahmad, Z.; Sugandi, G. Corrigendum: Influence of Humidity Conditions on the Capacitive and Resistive Response of an Al/VOPc/Pt Co-Planar Humidity Sensor. Meas. Sci. Technol. 2012, 23, 069501. [Google Scholar] [CrossRef]
- Molina-Lopez, F.; Quintero, A.V.; Mattana, G.; Briand, D.; de Rooij, N.F. Large-area compatible fabrication and encapsulation of inkjet-printed humidity sensors on flexible foils with integrated thermal compensation. J. Micromech. Microeng. 2013, 23, 025012. [Google Scholar] [CrossRef]
- Low Temperature Effects. Available online: https://www.postharvest.net.au/postharvest-fundamentals/temperature/low-temperature-effects/ (accessed on 21 March 2020).
- Sharrock, K.R. Advances in freshness and safety indicators in food and beverage packaging. In Emerging Food Packaging Technologies: Principles and Practice, 1st ed.; Yam, K.L., Lee, D.S., Eds.; Woodhead Publishing: Cambridge, UK, 2012; pp. 175–197. [Google Scholar]
- Robertson, G.L. Active and intelligent packaging. In Food Packaging–Principles and Practice, 3rd ed.; CRC Press: Boca Raton, FL, USA, 2013; pp. 399–428. [Google Scholar]
- Coll, M.B.; Salthill, I.E. Solder Paste with a Time Temperature Indicator. U.S. Patent 6331076, 18 December 2001. [Google Scholar]
- 3M Monitor Mark Time Temperature Indicator. Available online: https://multimedia.3m.com/mws/media/215506O/3mtm-monitormarktm-time-temperature-indicators-brochure.pdf (accessed on 21 March 2020).
- What It Takes to Make it Work: The OnVu™ TTI. Available online: http://ccm.ytally.com/index.php?id=83&no_cache=1&sword_list[]=on&sword_list[]=vu (accessed on 21 March 2020).
- Intelligent Packaging. Available online: https://www.slideshare.net/nithyac12/intelligent-packaging (accessed on 21 March 2020).
- Cryolog Offers Intelligent Traceability Solutions. Available online: https://www.fis.com/fis/techno/newtechno.asp?id=36695&l=s&ndb=1 (accessed on 21 March 2020).
- Timestrip. Available online: https://timestrip.com (accessed on 21 March 2020).
- The Indicator. Available online: https://www.tempix.com/the-indicator (accessed on 21 March 2020).
- Norrby, H.; Nygardh, M. A Package for storing goods in a preservative state provided with a temperature indicator and a method for making such packages. WO Patent 2005026017A1, 24 March 2005. [Google Scholar]
- Oxygen Absorbers. Available online: https://www.impakcorporation.com/oxygen_absorbers/oxygen_indicating_tablets (accessed on 21 March 2020).
- Ageless Eye Oxygen Indicator. Available online: https://www.mgc.co.jp/eng/products/sc/ageless-eye.html (accessed on 21 March 2020).
- Chatterjee, C.; Sen, A. Sensitive Colorimetric Sensors for Visual Detection of Carbon Dioxide and Sulfur Dioxide. J. Mater. Chem. A 2015, 3, 5642. [Google Scholar] [CrossRef]
- Luechinger, N.A.; Loher, L.; Athanassiou, E.K.; Grass, R.N.; Stark, W.J. Highly Sensitive Optical Detection of Humidity on Polymer/Metal Nanoparticle Hybrid Films. Langmuir 2007, 23, 3473–3477. [Google Scholar] [CrossRef]
- Food Fresh Indicators-Shelf Life Label. Available online: https://www.indiamart.com/proddetail/food-fresh-indicators-shelf-life-label-8226669333.html (accessed on 21 March 2020).
- Insignia Technologies. Available online: https://www.insigniatechnologies.com/technology.php (accessed on 21 March 2020).
- Colour Changing Label Set for Mid-2013 Launch, Says Insignia Technologies. 2012. Available online: https://www.foodnavigator.com/Article/2012/11/12/Insignia-Technologies-target-UK-with-Novas-Embedded-label (accessed on 21 March 2020).
- Sorbent Systems, Gas Flush/Modified Atmosphere Packaging. Available online: https://www.sorbentsystems.com/gas-flush.html (accessed on 21 March 2020).
- Bai, H.W.; Zhou, G.H.; Hu, Y.N.; Sun, A.D.; Xu, X.L.; Liu, X.J.; Lu, C.H. Traceability technologies for farm animals and their products in China. Food Control 2017, 79, 35–43. [Google Scholar] [CrossRef]
- Fang, Z.; Zhao, Y.; Warner, R.D.; Johnson, S.K. Active and intelligent packaging in meat industry. Trends Food Sci. Technol. 2017, 61, 60–71. [Google Scholar] [CrossRef]
- Bibi, F.; Guillaume, C.; Gontard, N.; Sorli, B. A review: RFID technology having sensing aptitudes for food industry and their contribution to tracking and monitoring of food products. Trends Food Sci. Technol. 2017, 62, 91–103. [Google Scholar] [CrossRef]
- Formisano, F.; Massera, E.; Vito, S.; Buonanno, A.; Francia, G.; Veneri, P. RFID tag for vegetable ripening evaluation using an auxiliary smart gas sensor. Sens. IEEE 2014, 2026–2029. [Google Scholar] [CrossRef]
- Formisano, F.; Massera, E.; Vito, S.; Buonanno, A.; Francia, G.; Veneri, P. Auxiliary smart gas sensor prototype plugged in a RFID active tag for ripening evaluation. In Proceedings of the 2015 XVIII AISEM Annual Conference, Trento, Italy, 3–5 February 2015; pp. 1–4. [Google Scholar] [CrossRef]
- Temperature Loggers. Available online: http://temptrip.com/products#temp_loggers (accessed on 21 March 2020).
- Tablets and Edge Readers. Available online: http://temptrip.com/products#tablets_and_readers (accessed on 21 March 2020).
- RT0005 Easy2Log Low Cost, Semi-Passive UHF Logger Tag. Available online: https://www.caenrfid.com/en/products/rt0005/ (accessed on 21 March 2020).
- Woodman, J.G. Detection of Contaminants in Food. U.S. Patent 6270724, 7 August 2001. [Google Scholar]
- SIRA Technologies. Available online: http://www.ncf-net.org/patents/pdf/SIRA-2002.pdf (accessed on 21 March 2020).
- Poyatos-Racionero, E.; Ros-Lis, J.V.; Vivancos, J.; Martínez-Máñez, R. Recent advances on intelligent packaging as tools to reduce food waste. J. Clean. Prod. 2018, 172, 3398–3409. [Google Scholar] [CrossRef]
- Wang, H.J.; An, D.S.; Rhim, J.; Lee, D.S. A multi-functional biofilm used as an active insert in modified atmosphere packaging for fresh produce. Packag. Technol. Sci. 2015, 28, 999–1010. [Google Scholar] [CrossRef]
- Veasna, H.; Hwang, Y.S.; Choi, J.M.; Ahn, Y.J.; Lim, B.S.; Chun, J.P. 1-Methylcyclopropene and carbon dioxide absorber reduce chilling injury of eggplant (Solanum melongena L.) during MAP storage. J. Bio-Environ. Control 2012, 21, 50–56. [Google Scholar]
- Watkins, C.B. Responses of horticultural commodities to high carbon dioxide as related to modified atmosphere packaging. HortTechnology 2000, 10, 501–506. [Google Scholar] [CrossRef]
- Brian, P.F. Day. Active Packaging of Food. In Smart Packaging Technologies for Fast Moving Consumer Goods, 1st ed; Kerry, J., Butler, P., Eds.; John Wiley & Sons Ltd.: Ontario, CA, USA, 2008; pp. 1–18. [Google Scholar]
- Advances in Packaging Fresh Produce. Available online: https://fstjournal.org/features/30-3/packaging-fresh-produce (accessed on 21 March 2020).
- Nestle Standards on Materials in Contact with Food. Available online: https://www.nestle.com.pe/sites/g/files/pydnoa276/files/nosotros/informacion-proveedores-nestle/documents/actualizacion%202019/nestle%20standards%20abstract%20(version%205.0,%202018).pdf (accessed on 21 March 2020).
- Gómez-Estaca, J.; López-de-Dicastillo, C.; Hernández-Muñoz, P.; Catalá, R.; Gavara, R. Advances in antioxidant active food packaging. Trends Food Sci. Technol. 2014, 35, 42–51. [Google Scholar] [CrossRef]
- Butler, B.L. Cryovac® OS2000TM Polymeric oxygen scavenging systems. In Proceedings of the World Conference on Packaging: Proceedings of the 13th Intl. Assoc. of Packaging Res. Insts., East Lansing, MI, USA, 23–28 June 2002; pp. 157–162. [Google Scholar]
- Charles, F.; Anchez, J.S.; Gontard, N. Modeling of Active Modified Atmosphere Packaging of Endives Exposed to Several Postharvest Temperatures. J. Food Sci. 2005, 70, 443–449. [Google Scholar] [CrossRef]
- Carbon Dioxide CO2 Absorber Best Quality GAS Absorber 1.6 to 9g Used for Kimchi. Available online: https://www.alibaba.com/product-detail/carbon-dioxide-absorber-best-qualityGAS_60762119626.html?spm=a2700.galleryofferlist.0.0.52684b2ccVfZQ8&s=p (accessed on 21 March 2020).
- BreatheWay Technology. Available online: https://www.breatheway.com (accessed on 21 March 2020).
- Clearly Fresh Re-Closeable Zip Bags. Available online: https://www.clearlyfreshbags.com/products/clearly-fresh-bags-10-re-closeable-zip-bags (accessed on 21 March 2020).
- Intelimer Polymers Unique Products. Available online: https://www.annualreports.com/HostedData/AnnualReportArchive/l/NASDAQ_LNDC_2009.pdf (accessed on 21 March 2020).
- Qin, Y.H.; Alam, A.U.; Howlader, M.M.R.; Hu, N.X.; Deen, M.J. Inkjet Printing of a Highly Loaded Palladium Ink for Integrated, Low-Cost pH Sensors. Adv. Funct. Mater. 2016, 26, 4923–4933. [Google Scholar] [CrossRef]
- Qin, Y.; Alam, A.U.; Pan, S.; Howlader, M.M.; Ghosh, R.; Selvaganapathy, P.R.; Wu, Y.; Deen, M.J. Low-temperature solution processing of palladium/palladium oxide films and their pH sensing performance. Talanta 2016, 146, 517–524. [Google Scholar] [CrossRef]
- Wyser, Y.; Adams, M.; Avella, M.; Carlander, D.; Garcia, L.; Pieper, G.; Rennen, M.; Schuermans, J.; Weiss, J. Outlook and challenges of Nanotechnologies for food packaging. Packag. Technol. Sci. 2016, 29, 615–648. [Google Scholar] [CrossRef] [Green Version]
Figure 1.
Food loss percentages along the supply chain (Data based on FAO 2019 report [3]).
Figure 1.
Food loss percentages along the supply chain (Data based on FAO 2019 report [3]).

Figure 2.
Smart packaging system classification.

Figure 3.
Polyphenol oxidase (PPO) reaction responsible for browning in vegetables.

Figure 4.
Reflectance for fresh and decayed tissue versus wavelengths. (Regenerated with permission from Postharvest Biology and Technology journal [58]).
Figure 4.
Reflectance for fresh and decayed tissue versus wavelengths. (Regenerated with permission from Postharvest Biology and Technology journal [58]).

Figure 5.
(a) Jablonski diagram illustrating the excitation and emission process. (b) Schematic of general Chl fluorometer system.
Figure 5.
(a) Jablonski diagram illustrating the excitation and emission process. (b) Schematic of general Chl fluorometer system.

Figure 6.
Decay detection of lettuce with LEDI4 and LEDICF versus visual rating, the black line represents the theoretical perfect match. (reproduced with permission from Postharvest Biology and Technology journal [58]).
Figure 6.
Decay detection of lettuce with LEDI4 and LEDICF versus visual rating, the black line represents the theoretical perfect match. (reproduced with permission from Postharvest Biology and Technology journal [58]).

Figure 7.
Map prediction for different samples with increasing number of E. coli from left to right, the blue is the control sample, and the left color is the target color expected.
Figure 7.
Map prediction for different samples with increasing number of E. coli from left to right, the blue is the control sample, and the left color is the target color expected.

Figure 8.
(a) Antigen and antigen-specific antibody “Lock and Key” sensing. (b) Functional block of antibody-based biosensors.
Figure 8.
(a) Antigen and antigen-specific antibody “Lock and Key” sensing. (b) Functional block of antibody-based biosensors.

Figure 9.
(a) Working principle of surface plasmon resonance (SPR) biosensors. (b) Working principle of SPR biosensors chip.
Figure 9.
(a) Working principle of surface plasmon resonance (SPR) biosensors. (b) Working principle of SPR biosensors chip.

Figure 10.
Toxin GuardTM biosensor.

Figure 11.
(a) Optical top view for Janus droplets shows their transparency. (b) Part of Janus partials forming carbohydrate-based interactions is capable of binding to ConA which is like antigens of E. Coli. (c) Binding with ConA shows how Janus droplets cluster causing optical changes.
Figure 11.
(a) Optical top view for Janus droplets shows their transparency. (b) Part of Janus partials forming carbohydrate-based interactions is capable of binding to ConA which is like antigens of E. Coli. (c) Binding with ConA shows how Janus droplets cluster causing optical changes.


Figure 12.
Schematic of immunomagnetic separation (IMS) with the use of nanoparticles (NPs) and antibodies.
Figure 12.
Schematic of immunomagnetic separation (IMS) with the use of nanoparticles (NPs) and antibodies.

Figure 13.
Structure of CO2 sensor in a Wheatstone bridge configuration.

Figure 14.
(a) Fresh-Check® indicator. (b) Monitor Mark indicator. (c) Time-temperature effect on OnVuTM indicator. (d) eO® indicator. (e) Timestrip® indicator. (f) eTimestrip® indicator. (g) Checkpoint® indicator. (h) Tempix® indicator.
Figure 14.
(a) Fresh-Check® indicator. (b) Monitor Mark indicator. (c) Time-temperature effect on OnVuTM indicator. (d) eO® indicator. (e) Timestrip® indicator. (f) eTimestrip® indicator. (g) Checkpoint® indicator. (h) Tempix® indicator.


Figure 15.
(a) Food FreshTM indicator. (b) Monitor Mark indicator.

Figure 16.
Radio frequency identification (RFID) technology.

Figure 17.
(a) Form of food sentinel system. (b) Another form of food sentinel system.

Figure 18.
Working principle of temperature compensating films.


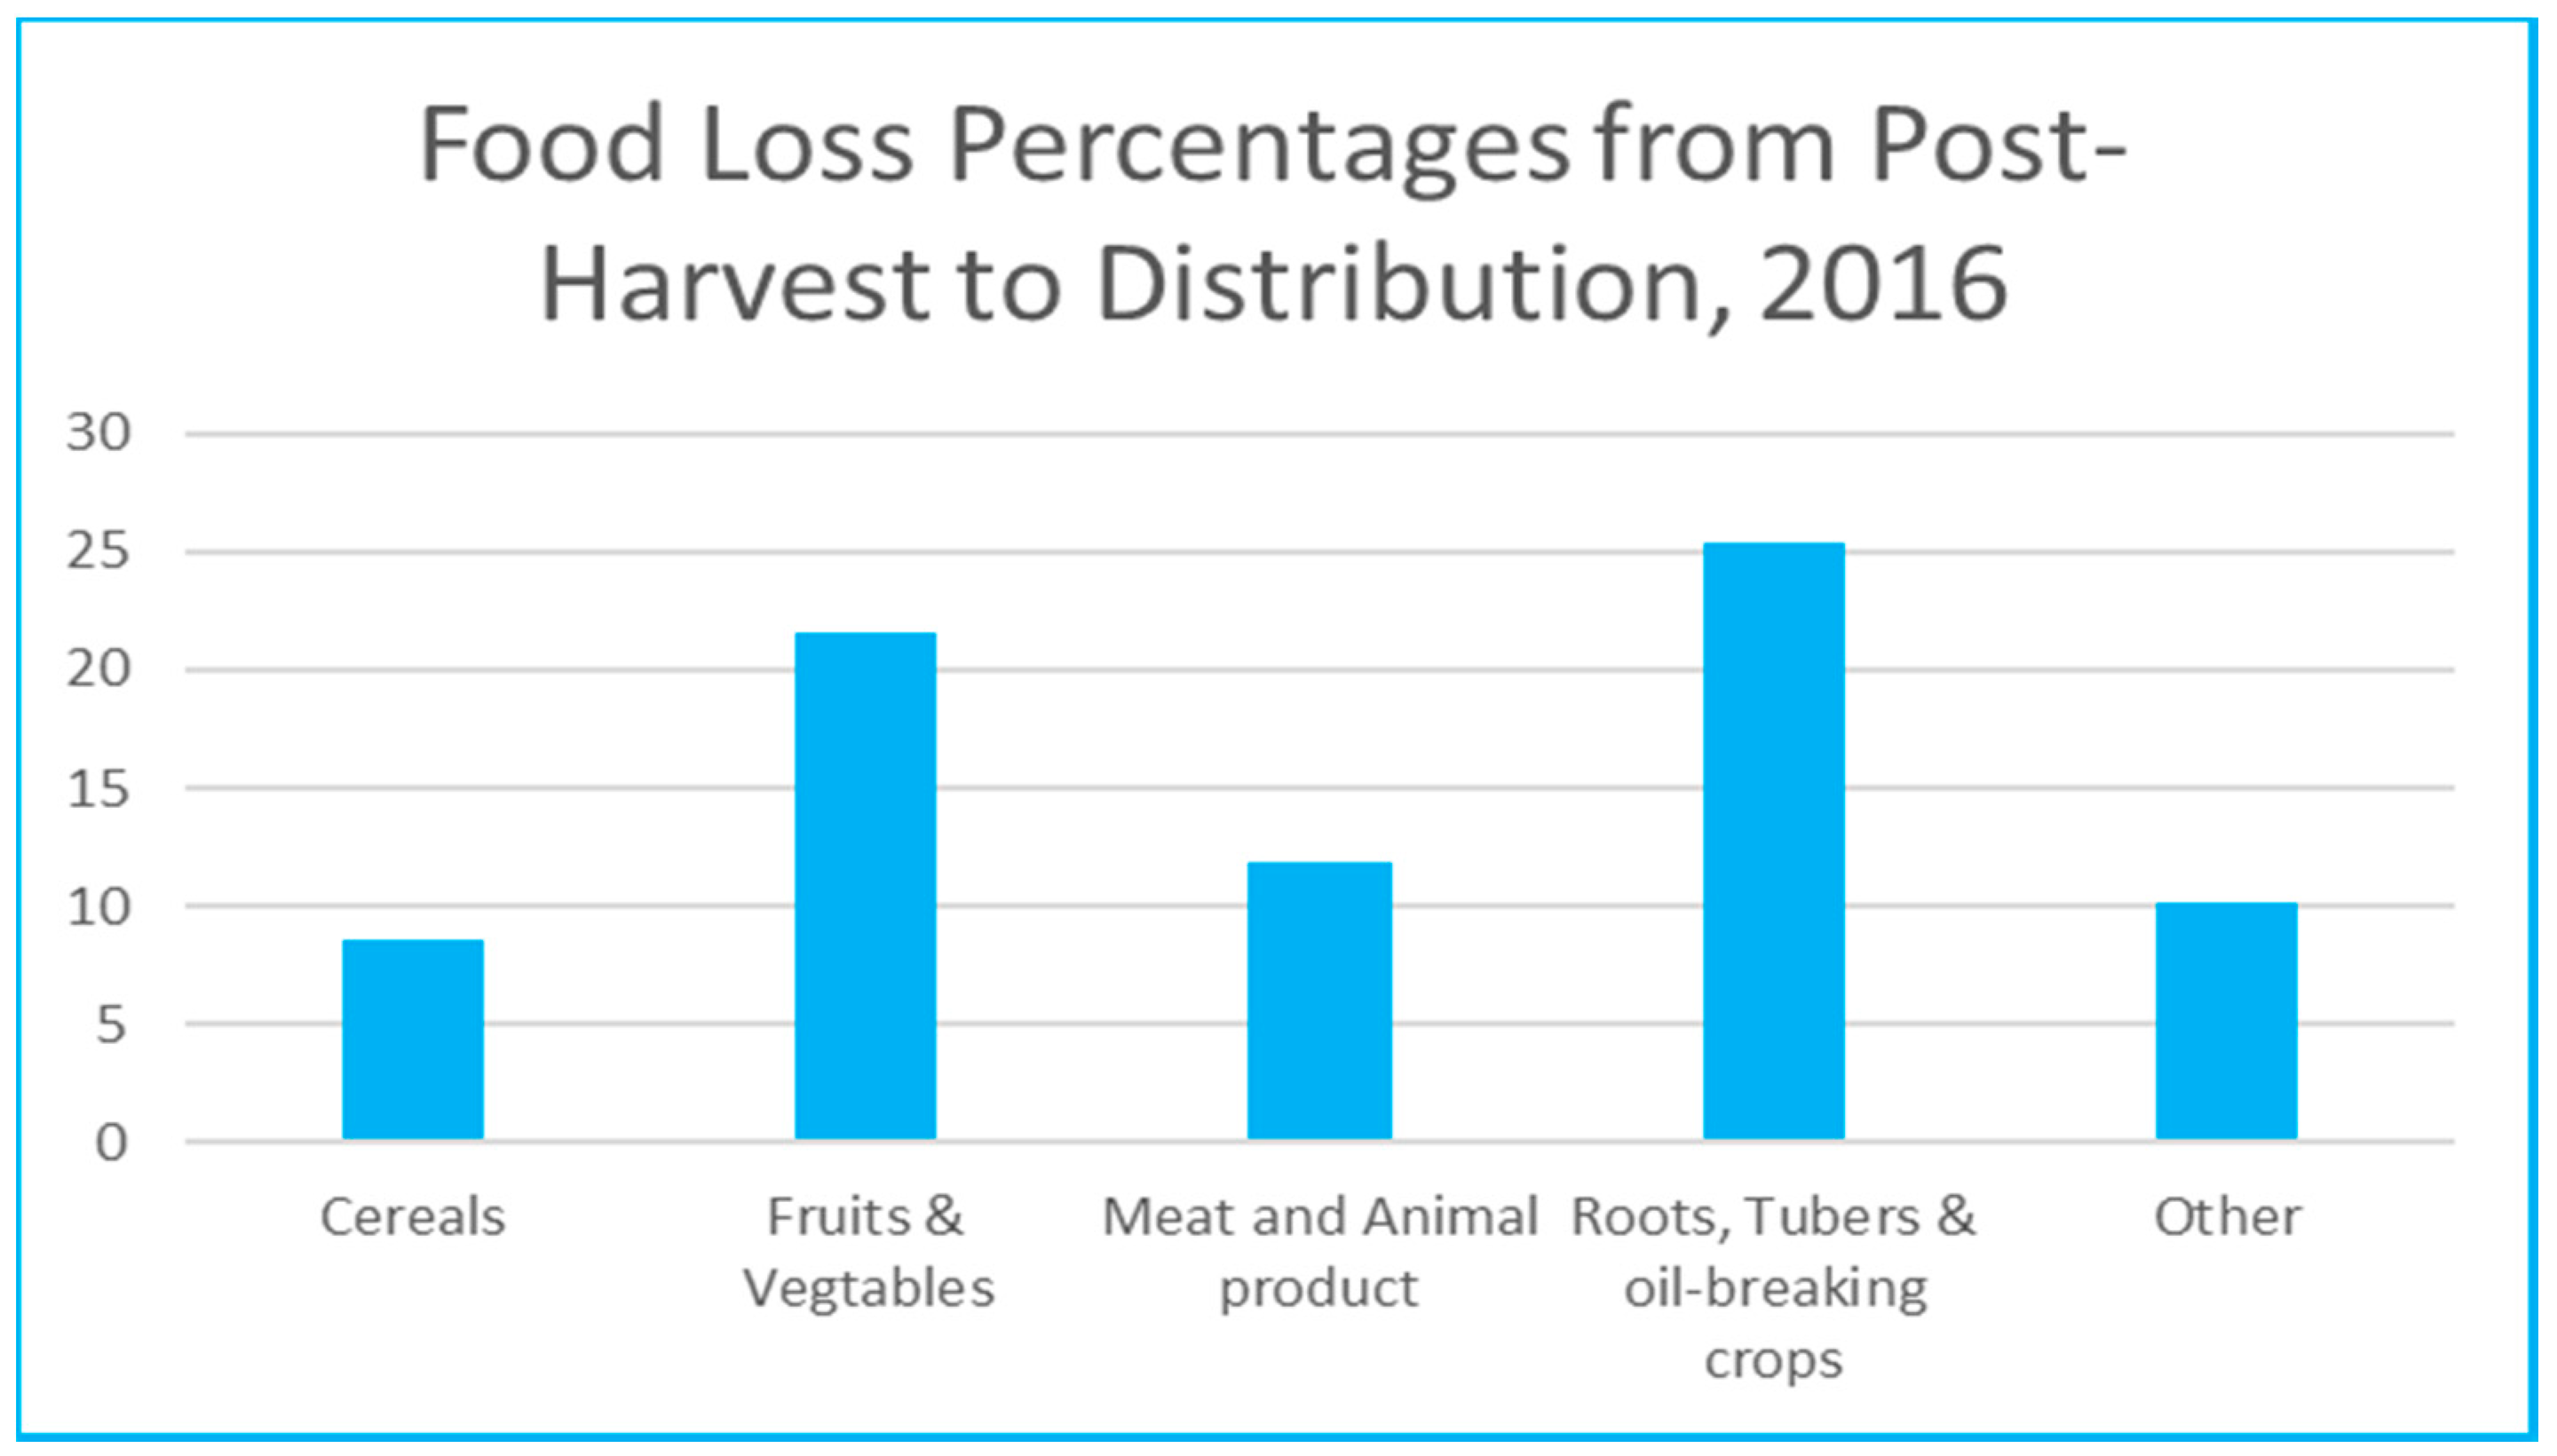
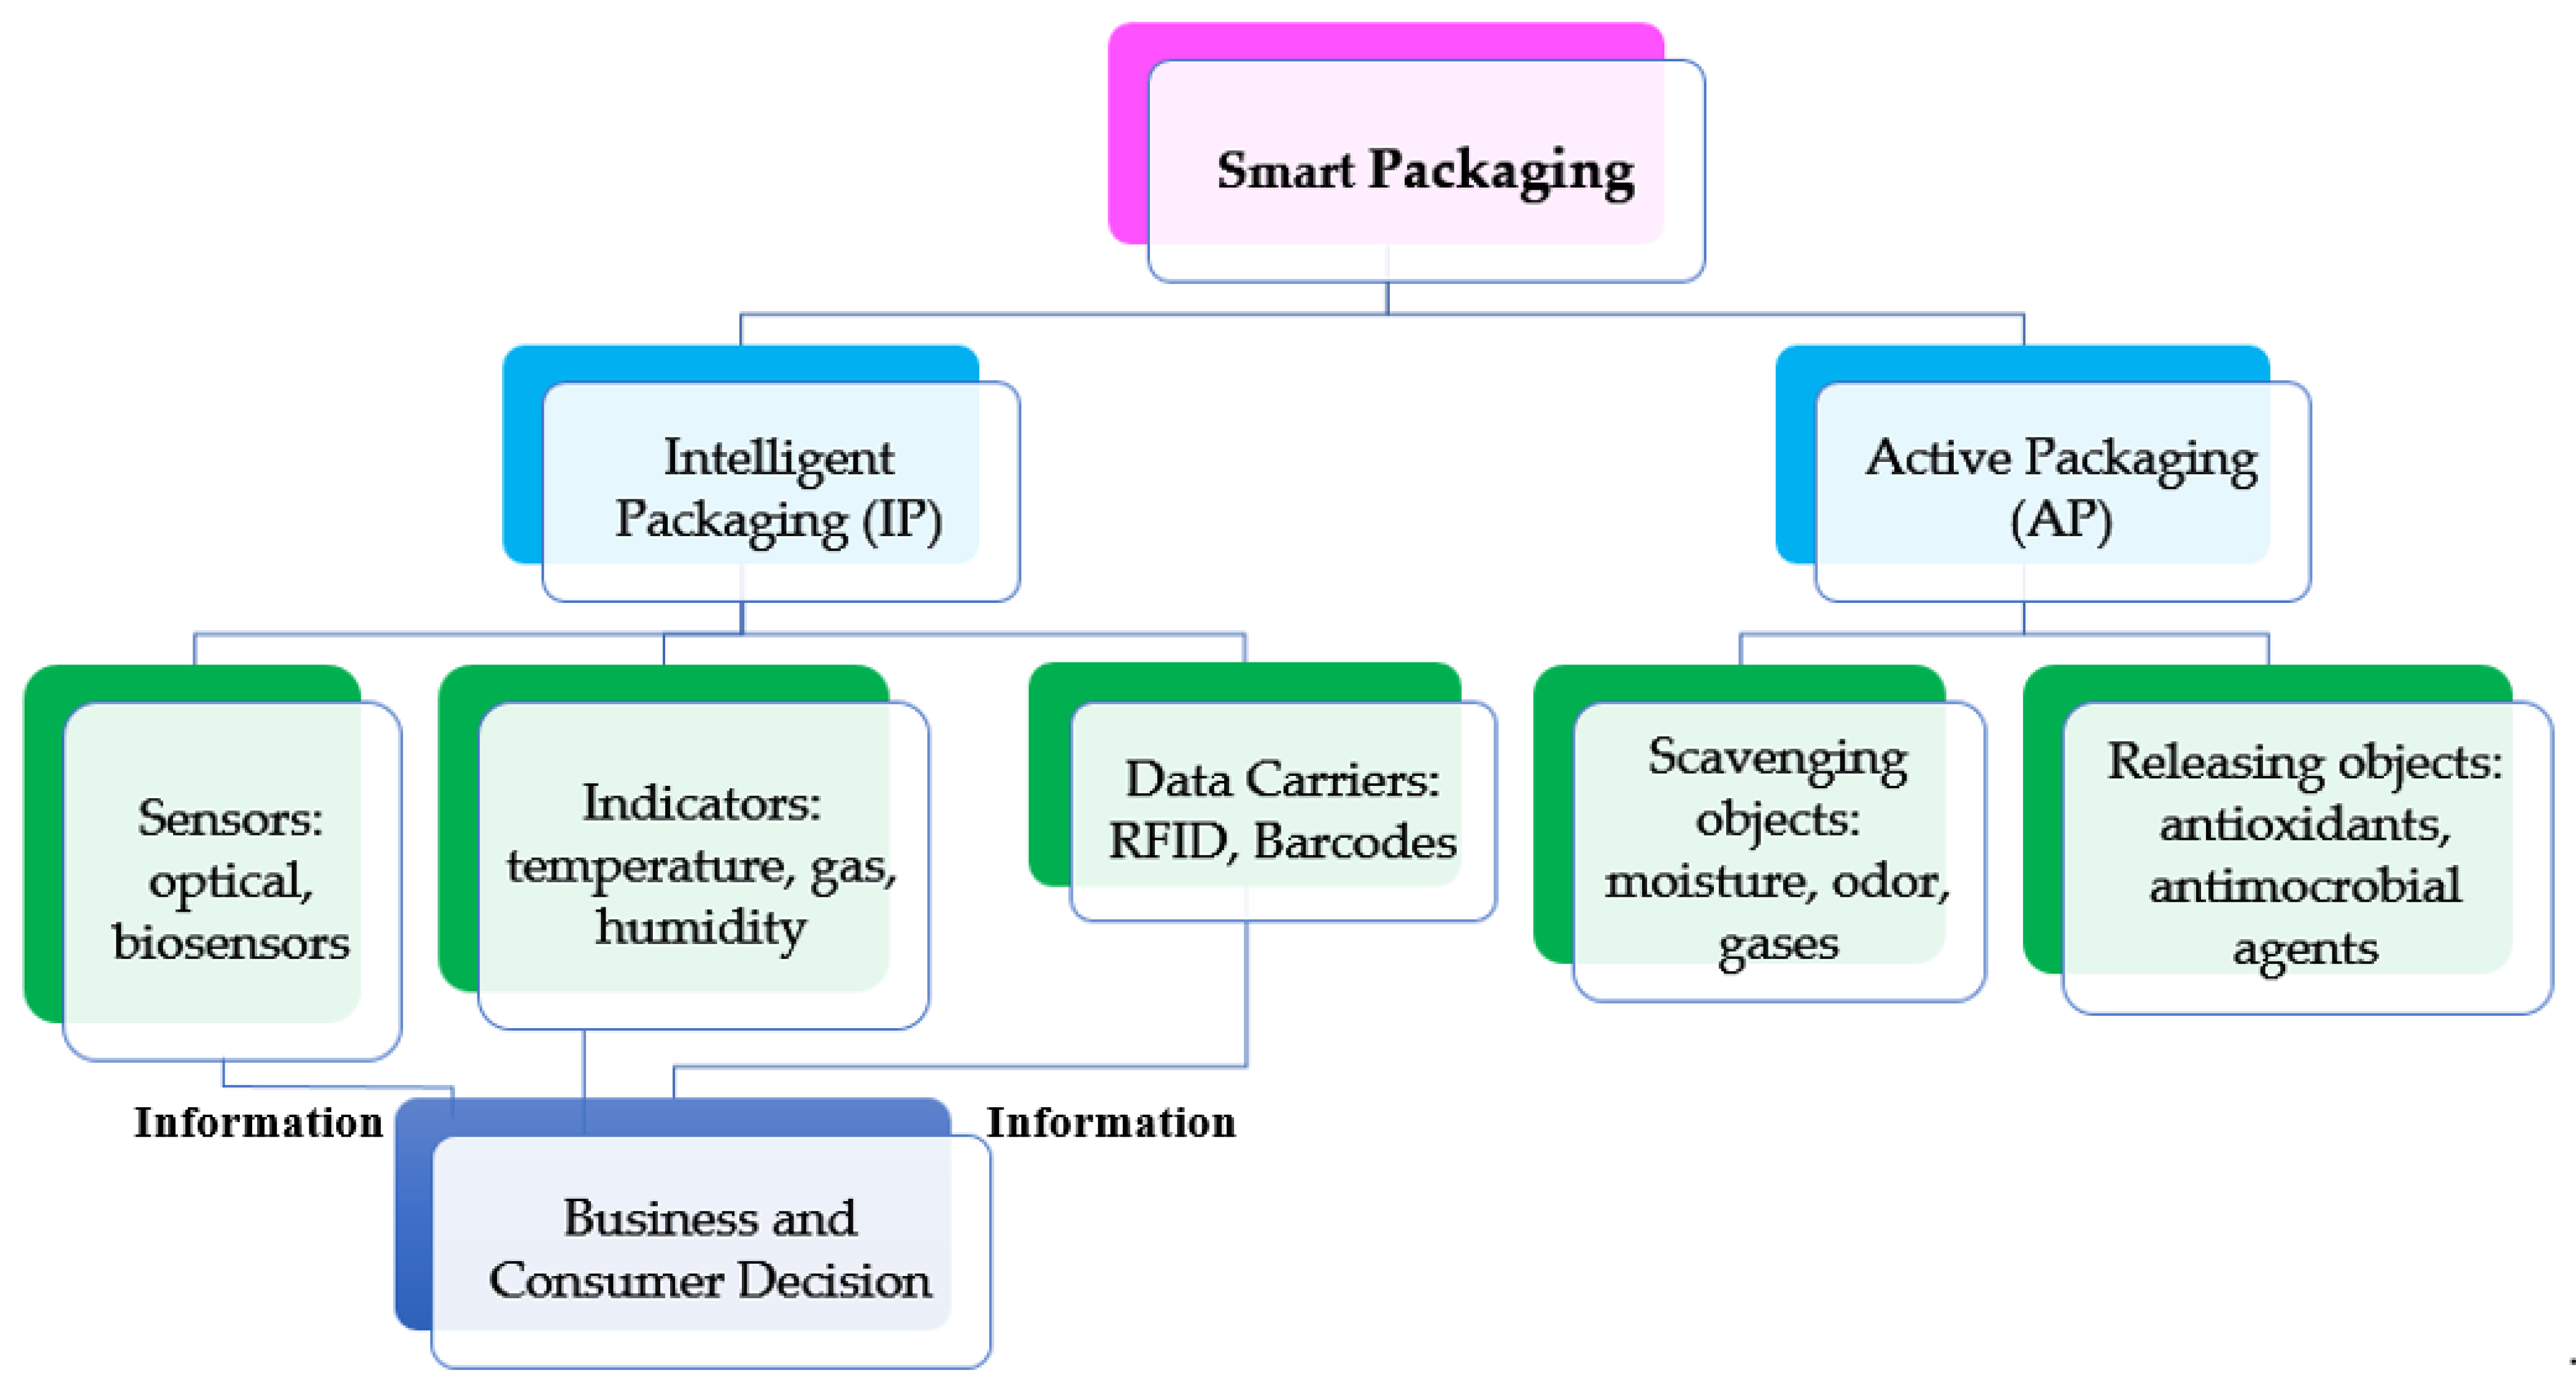
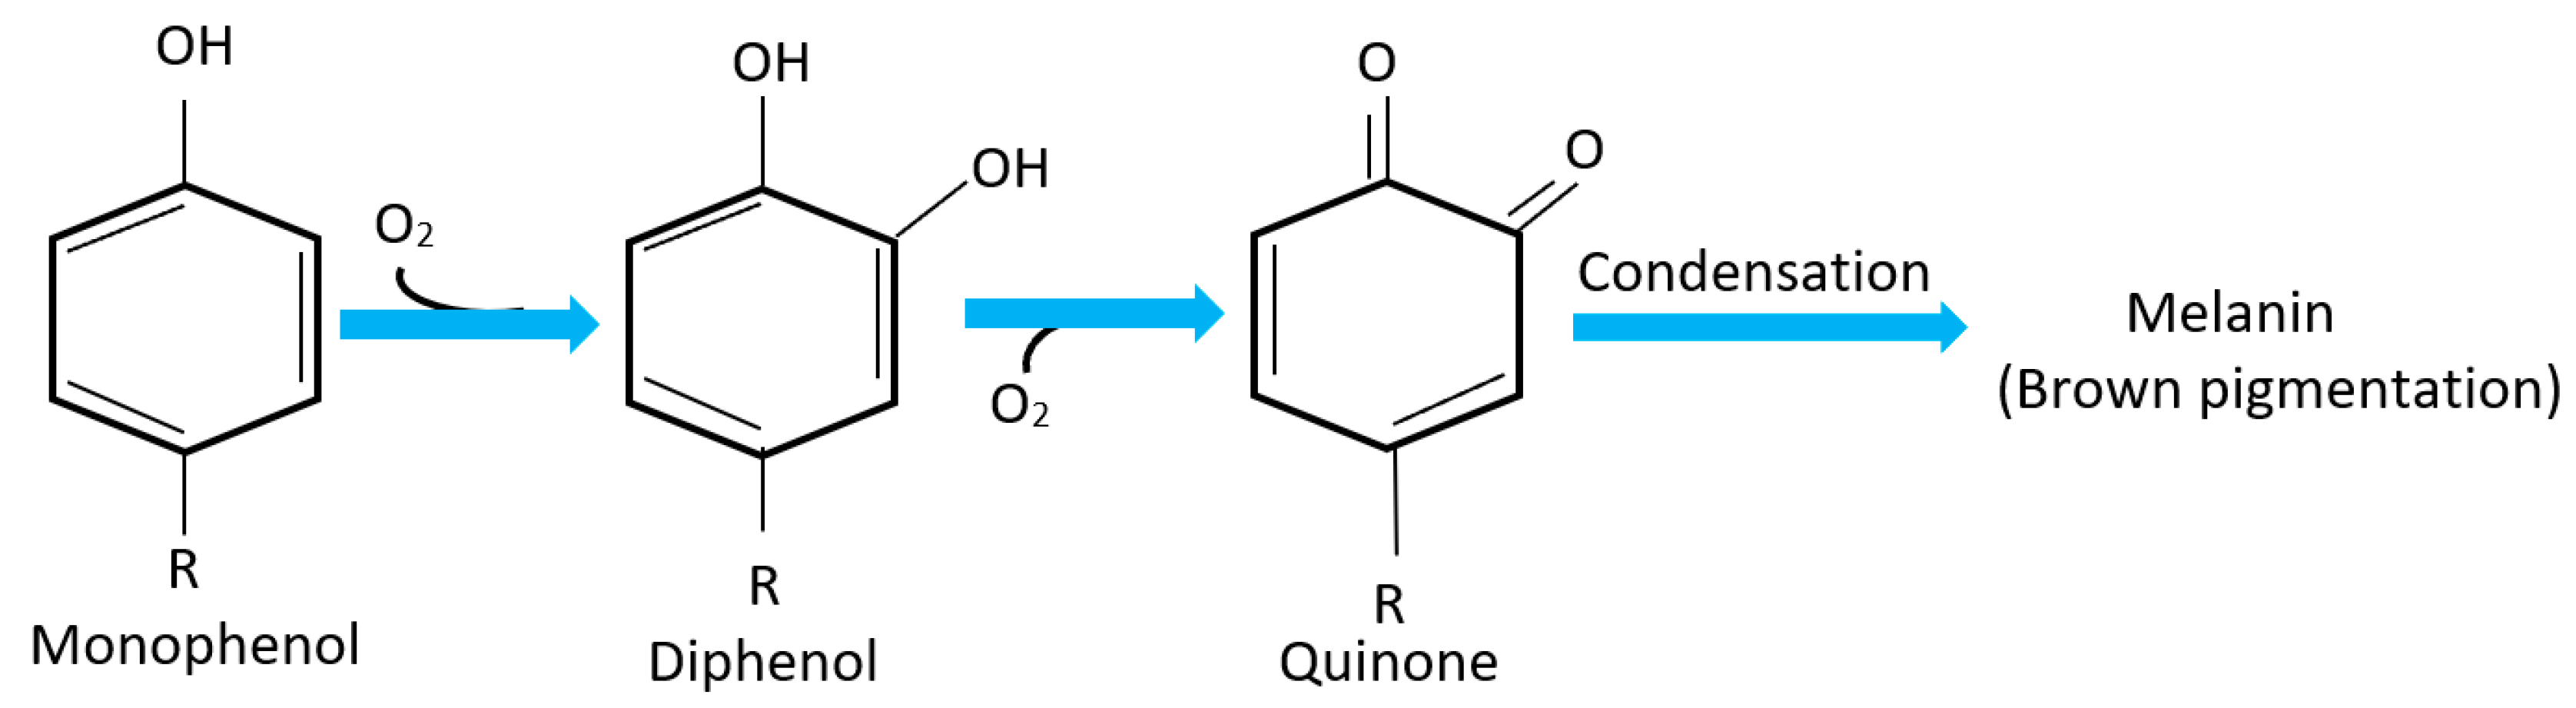
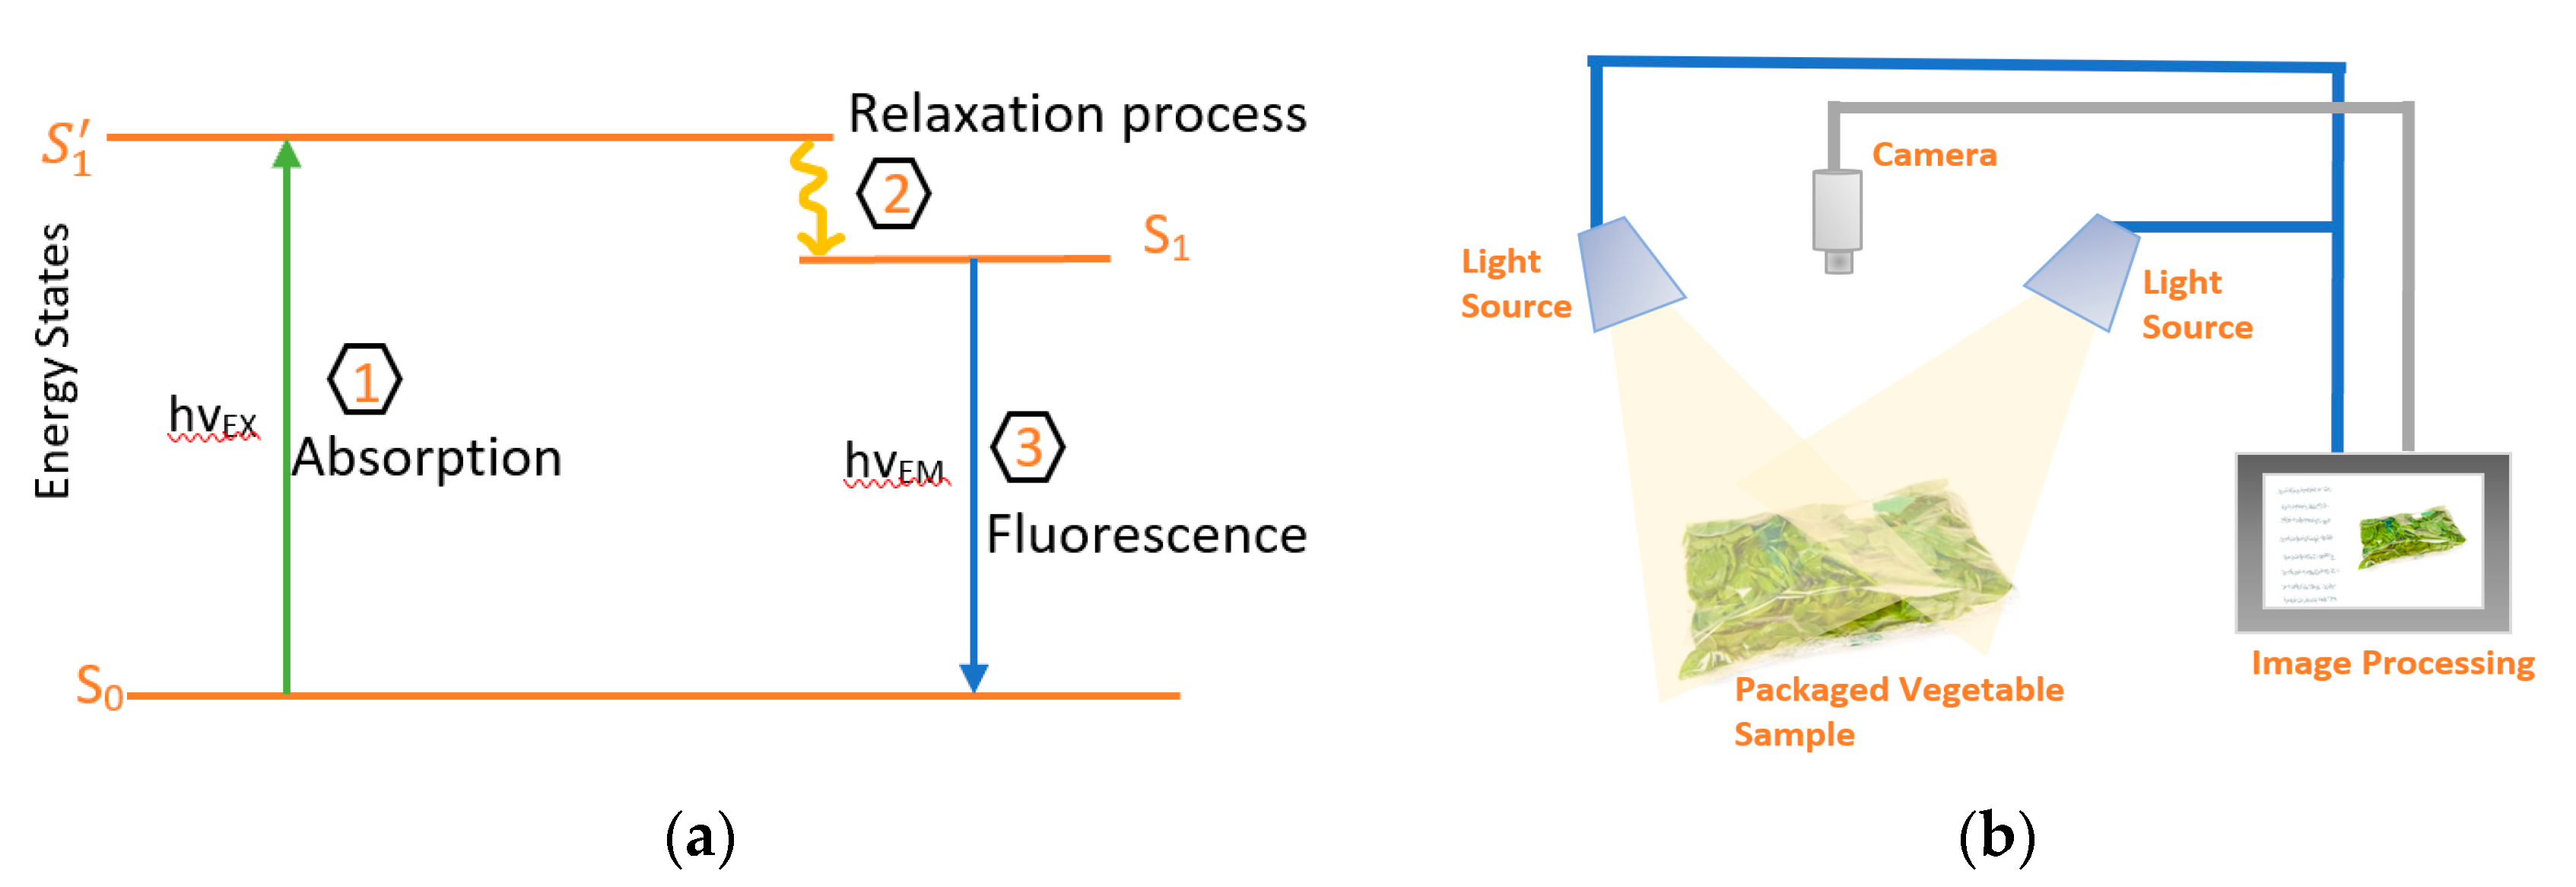
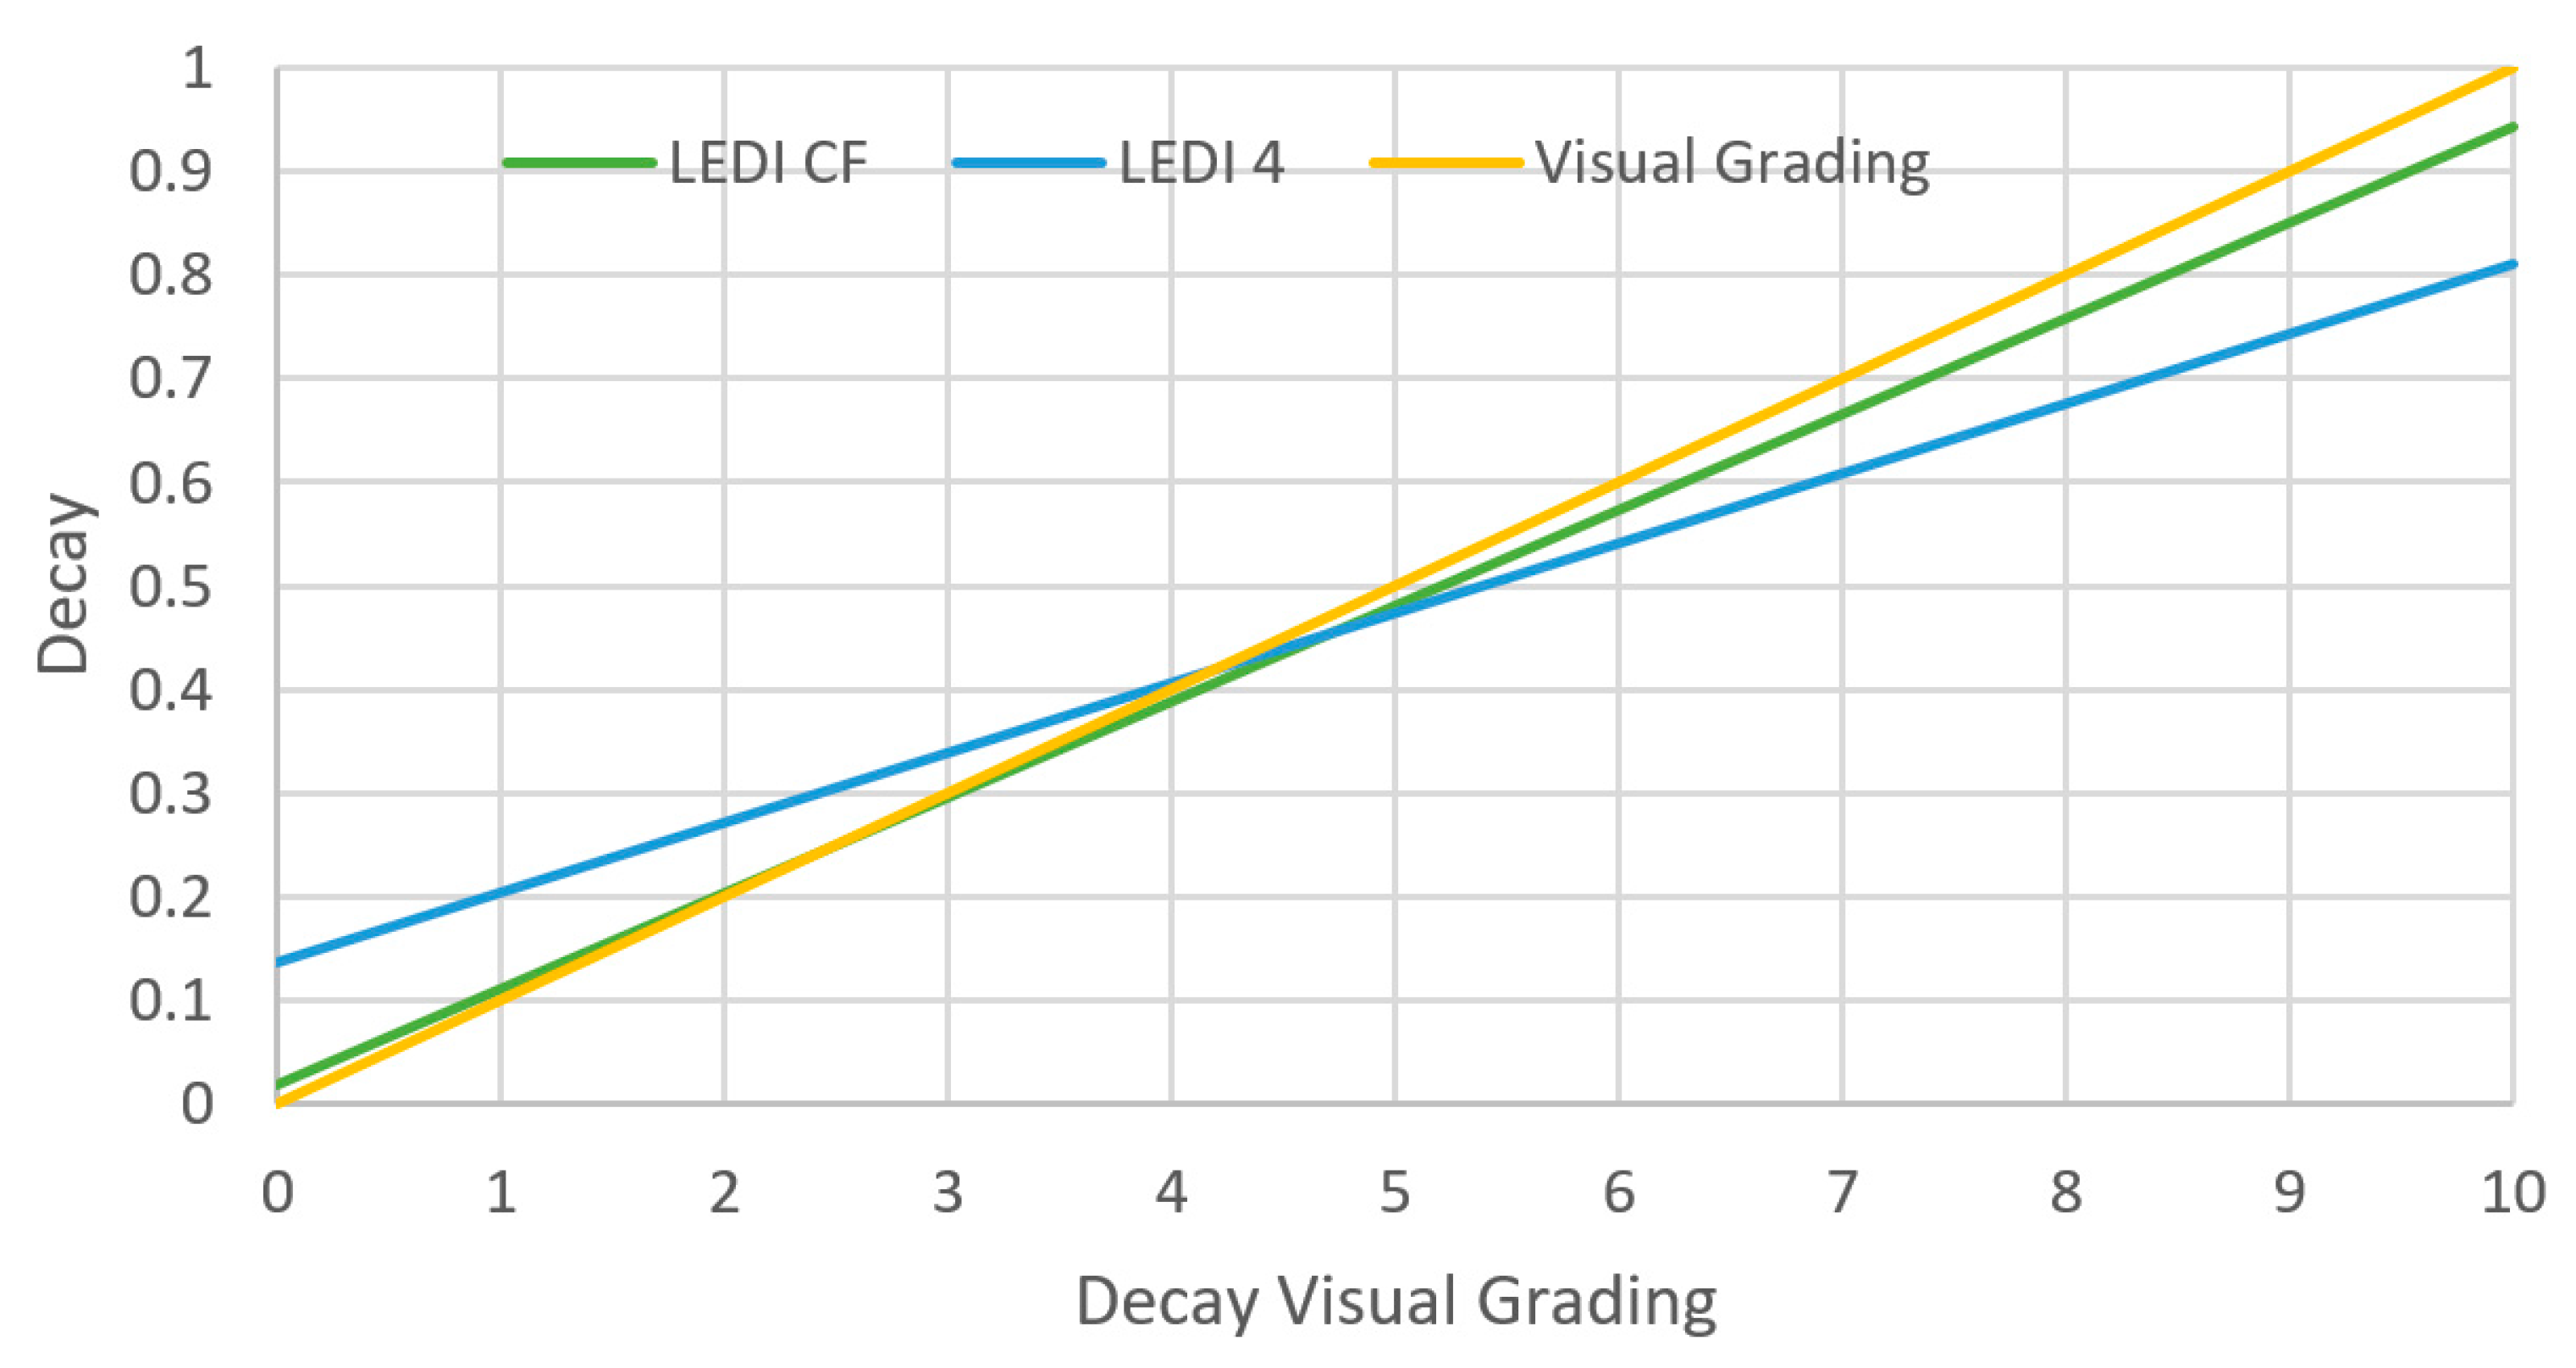
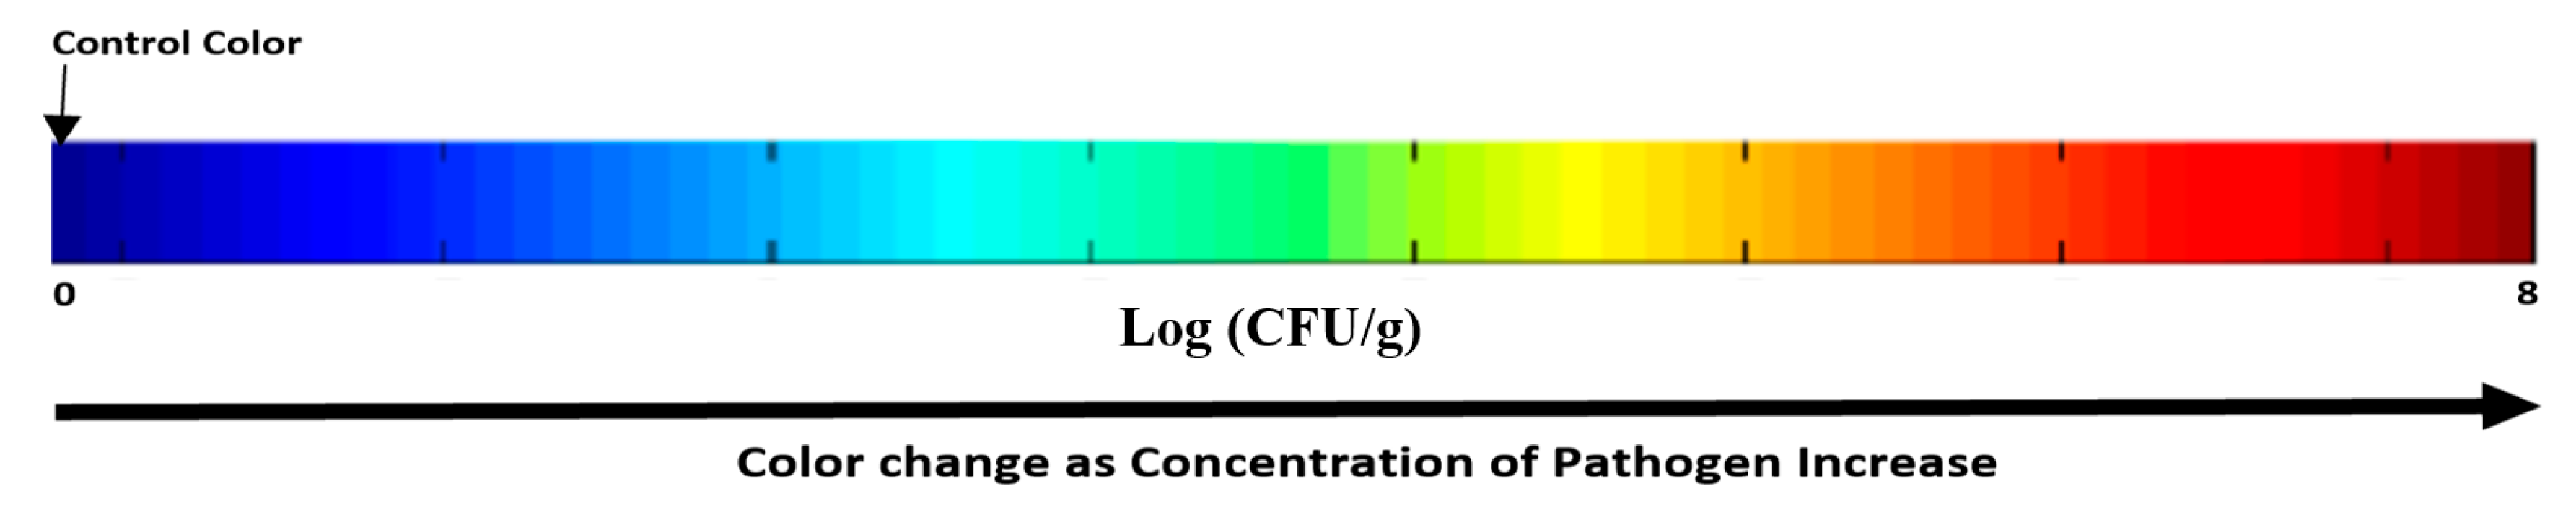
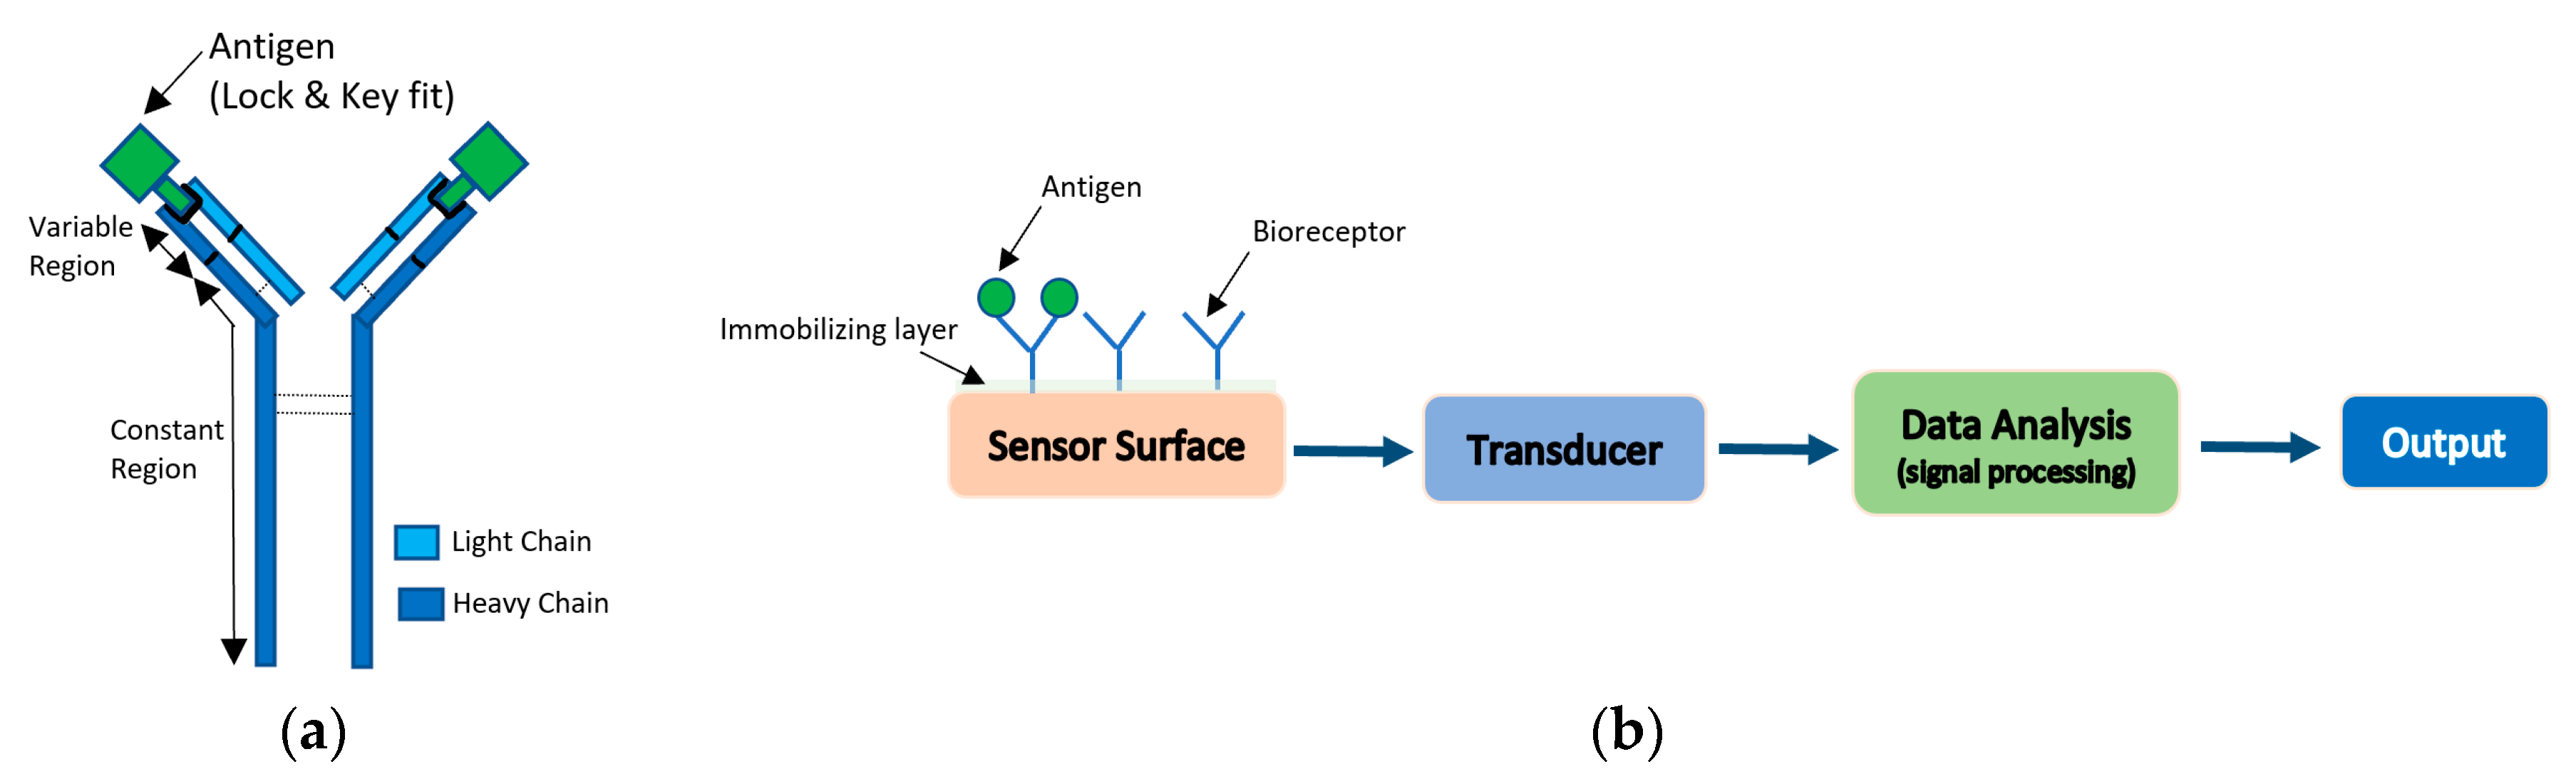
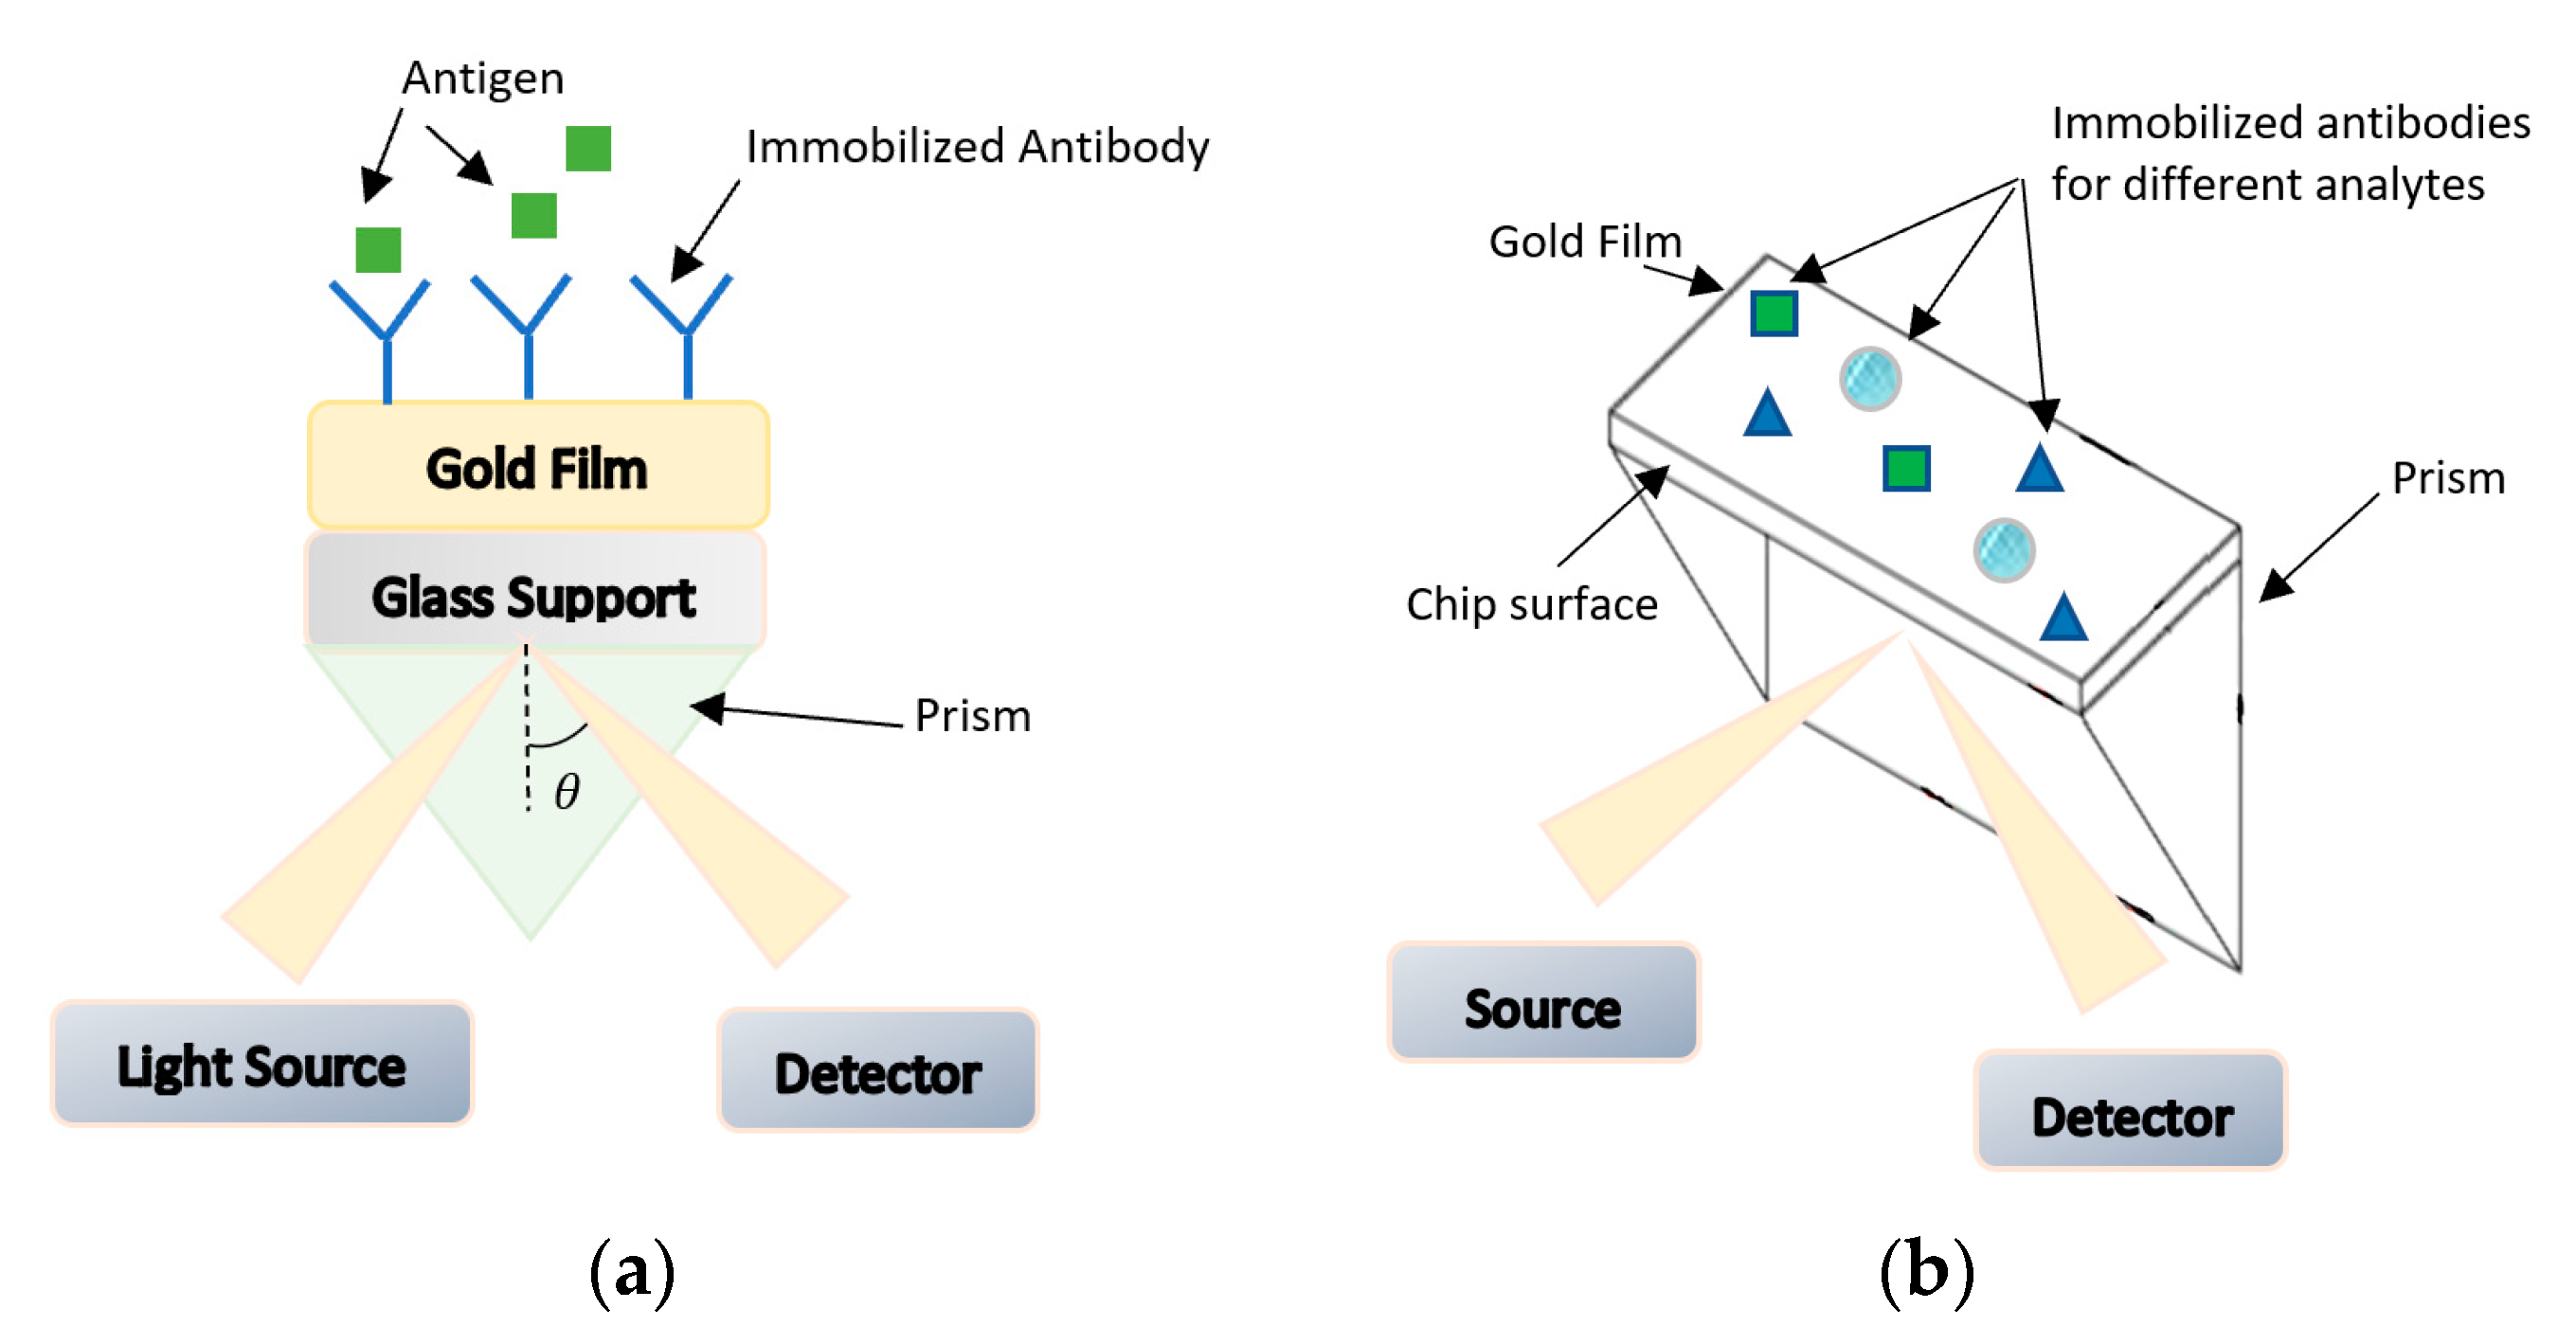
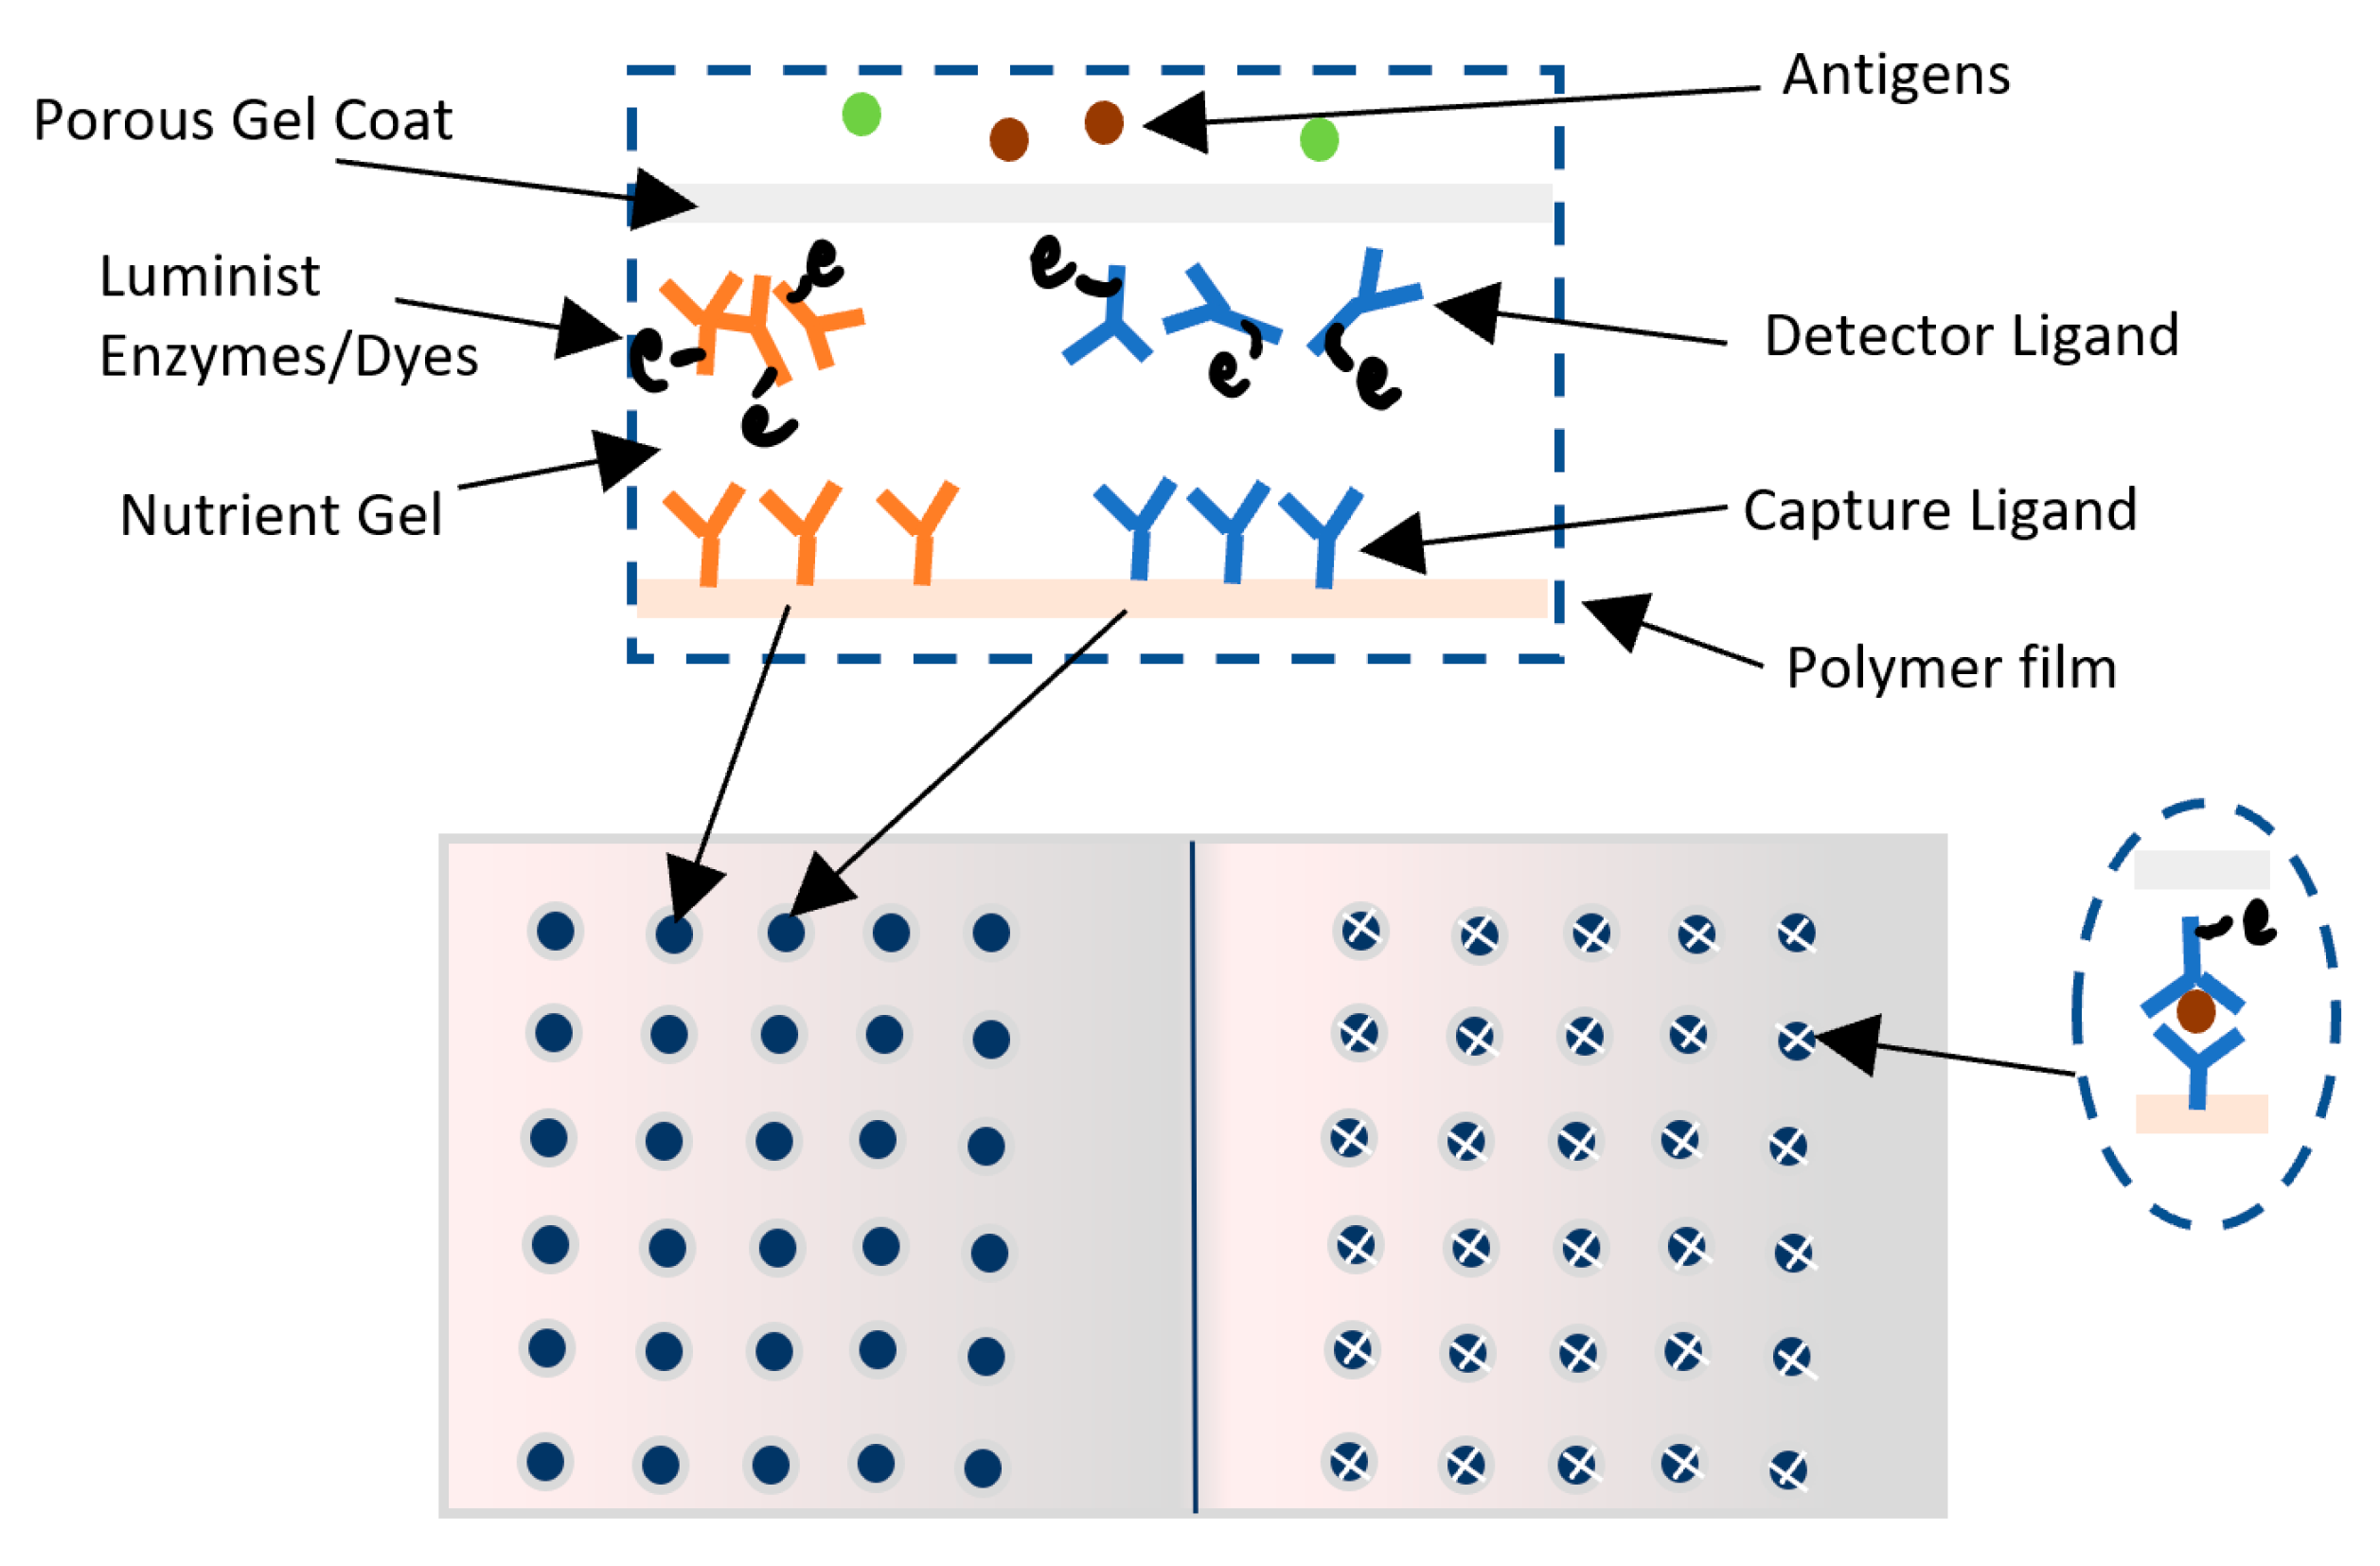
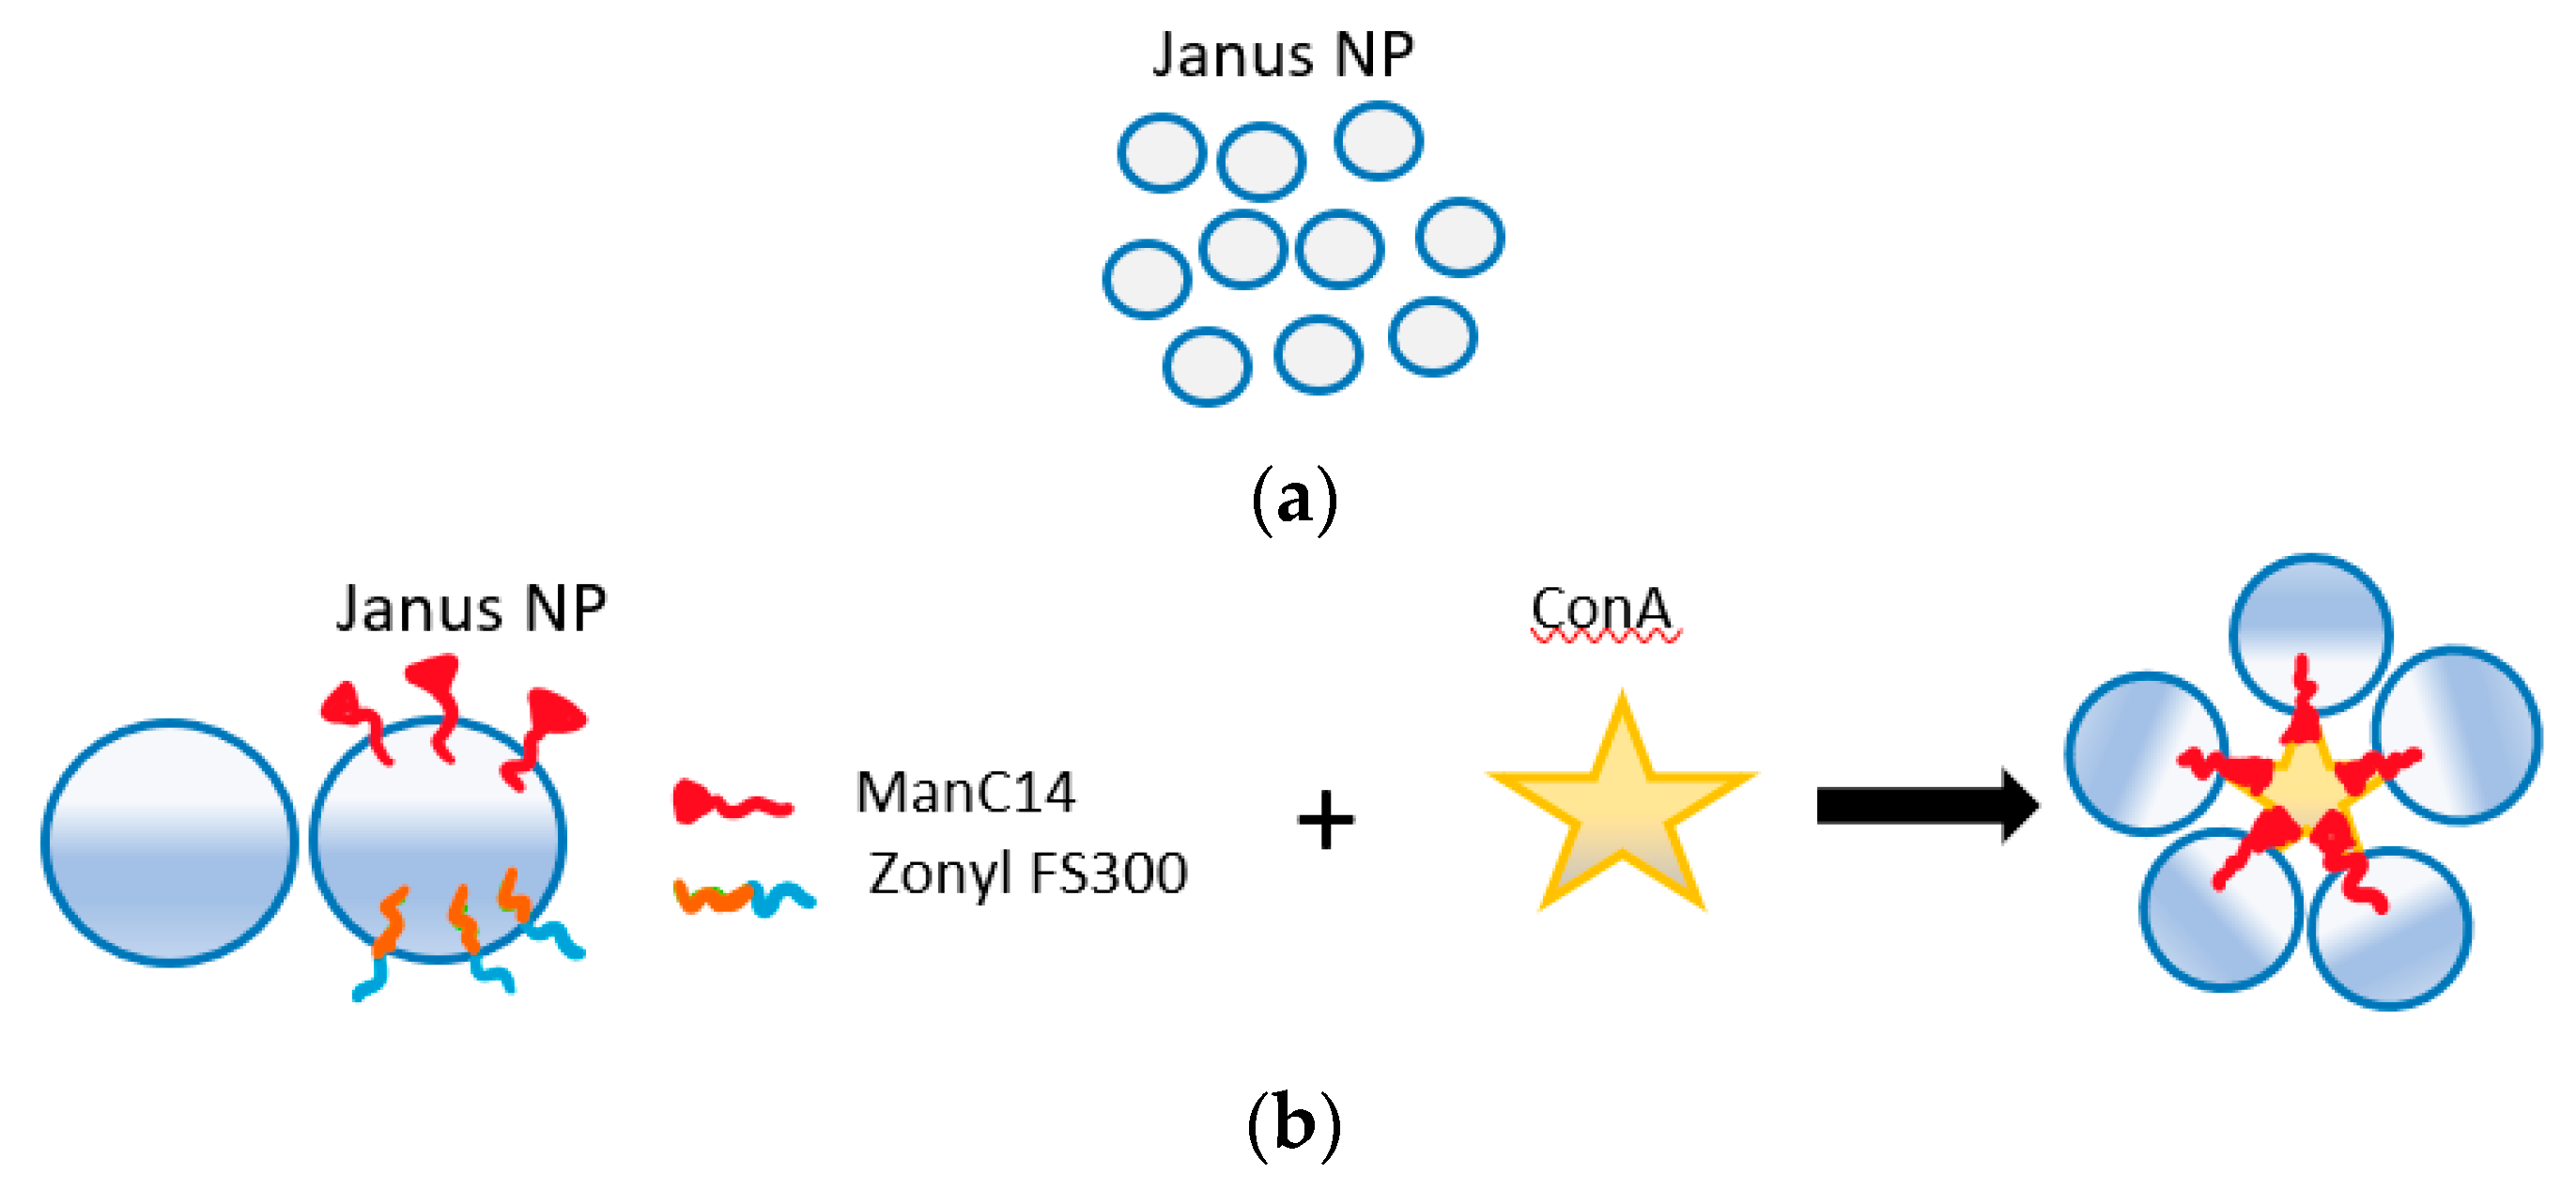
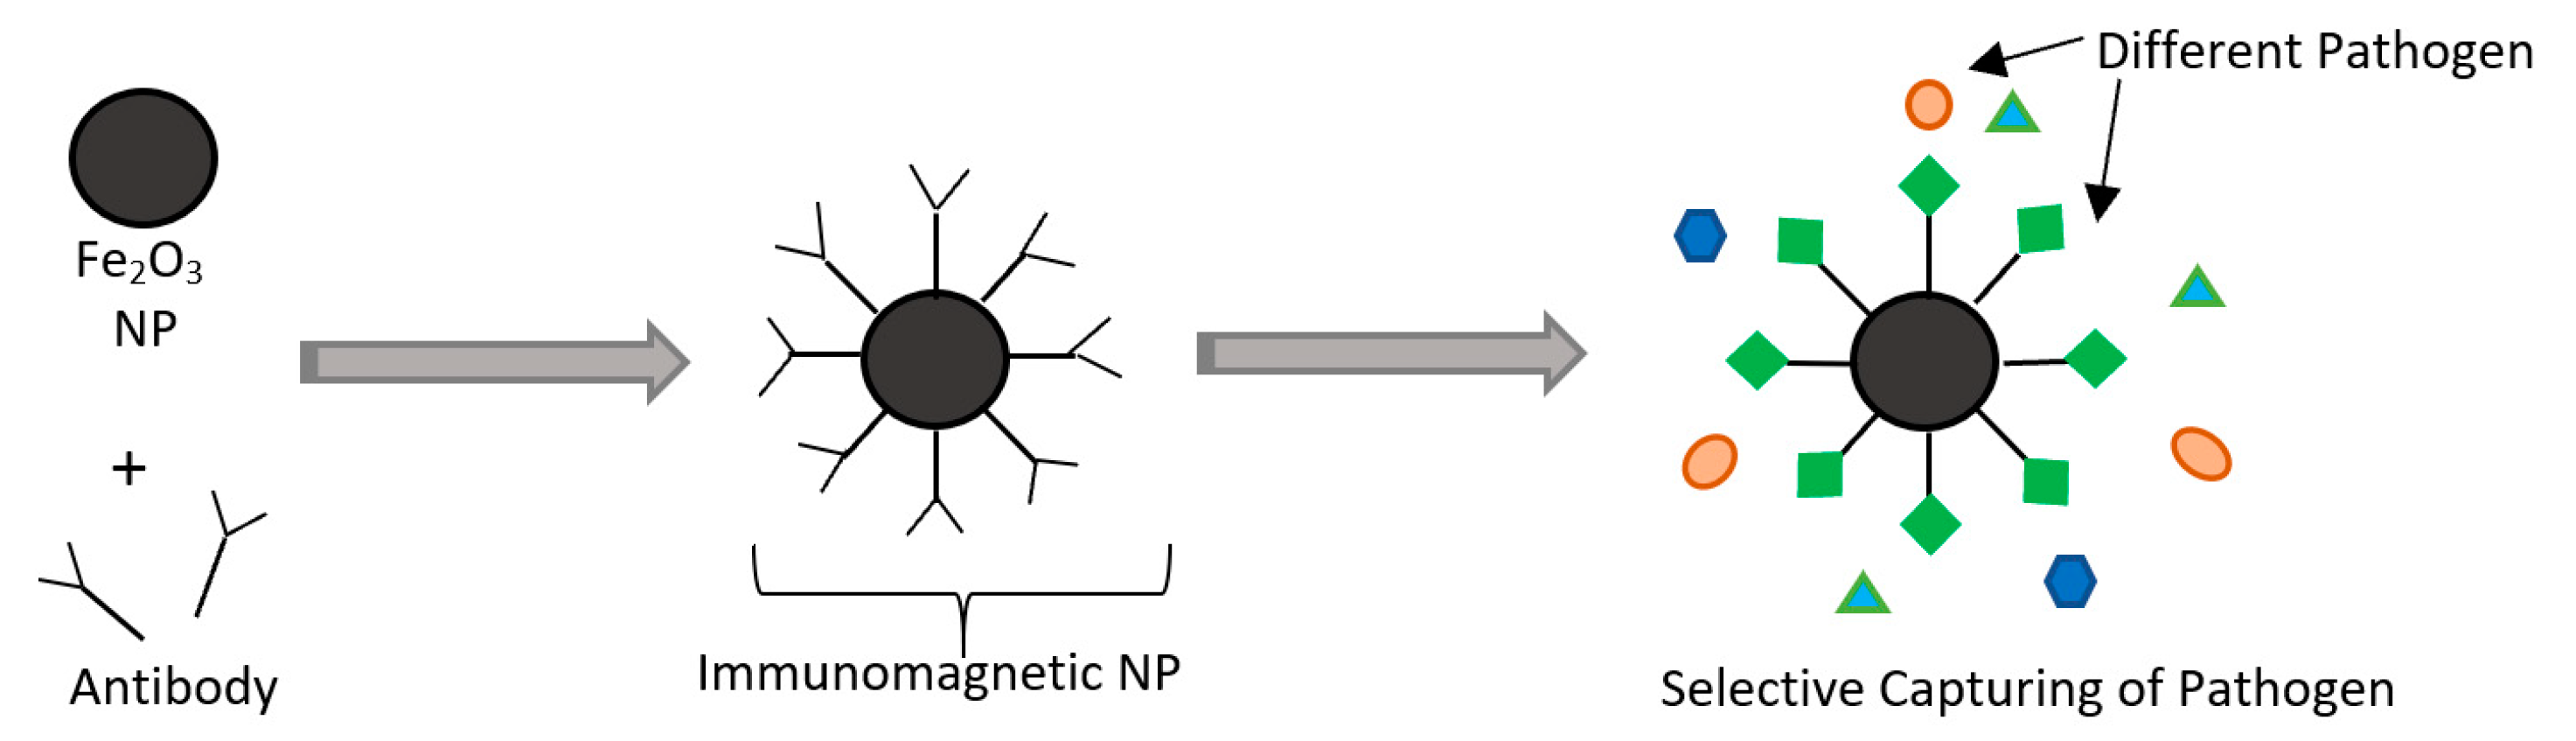
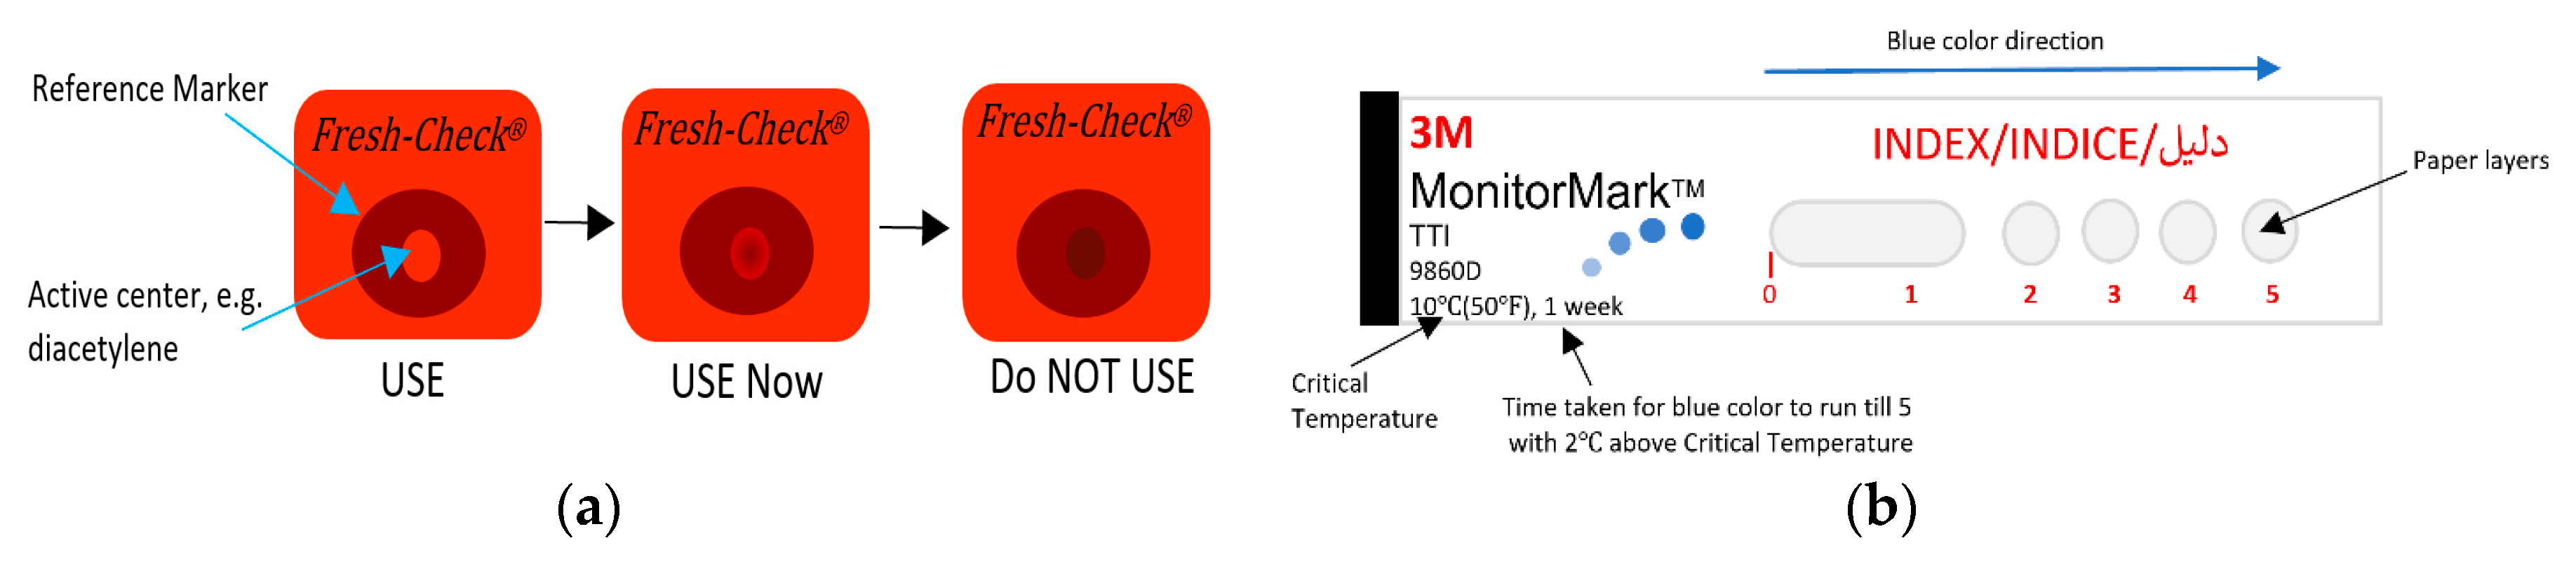
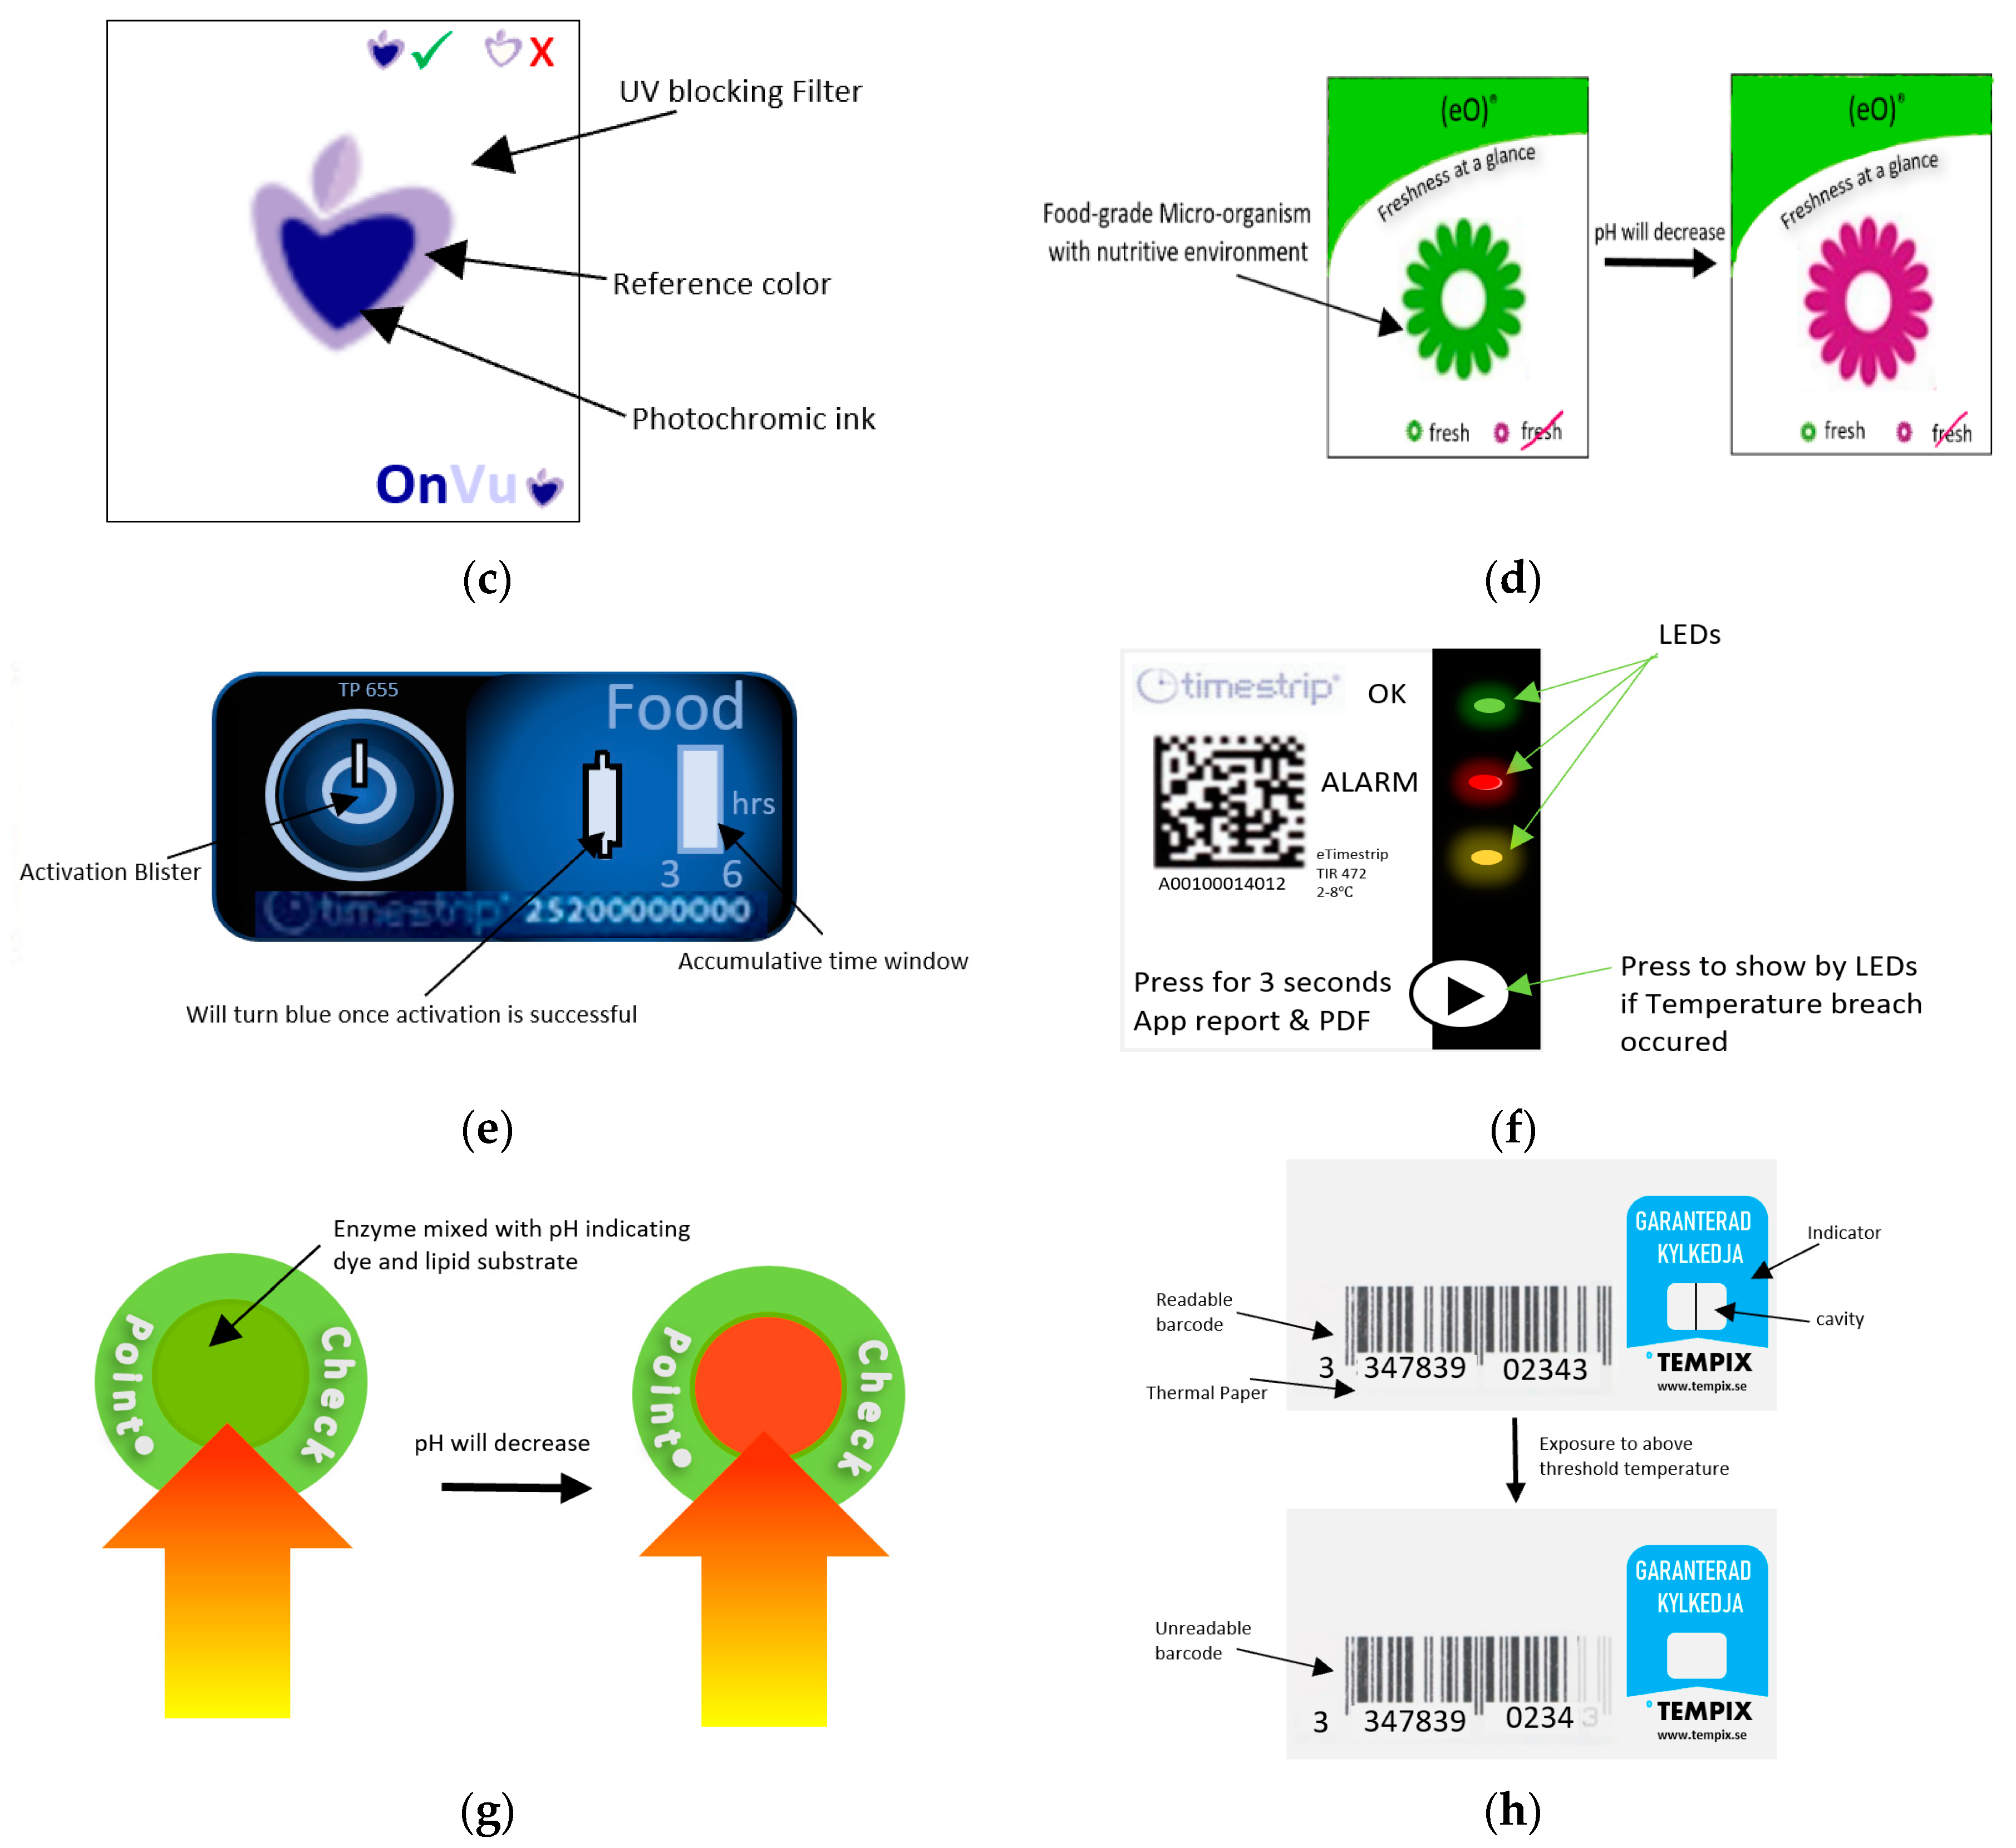
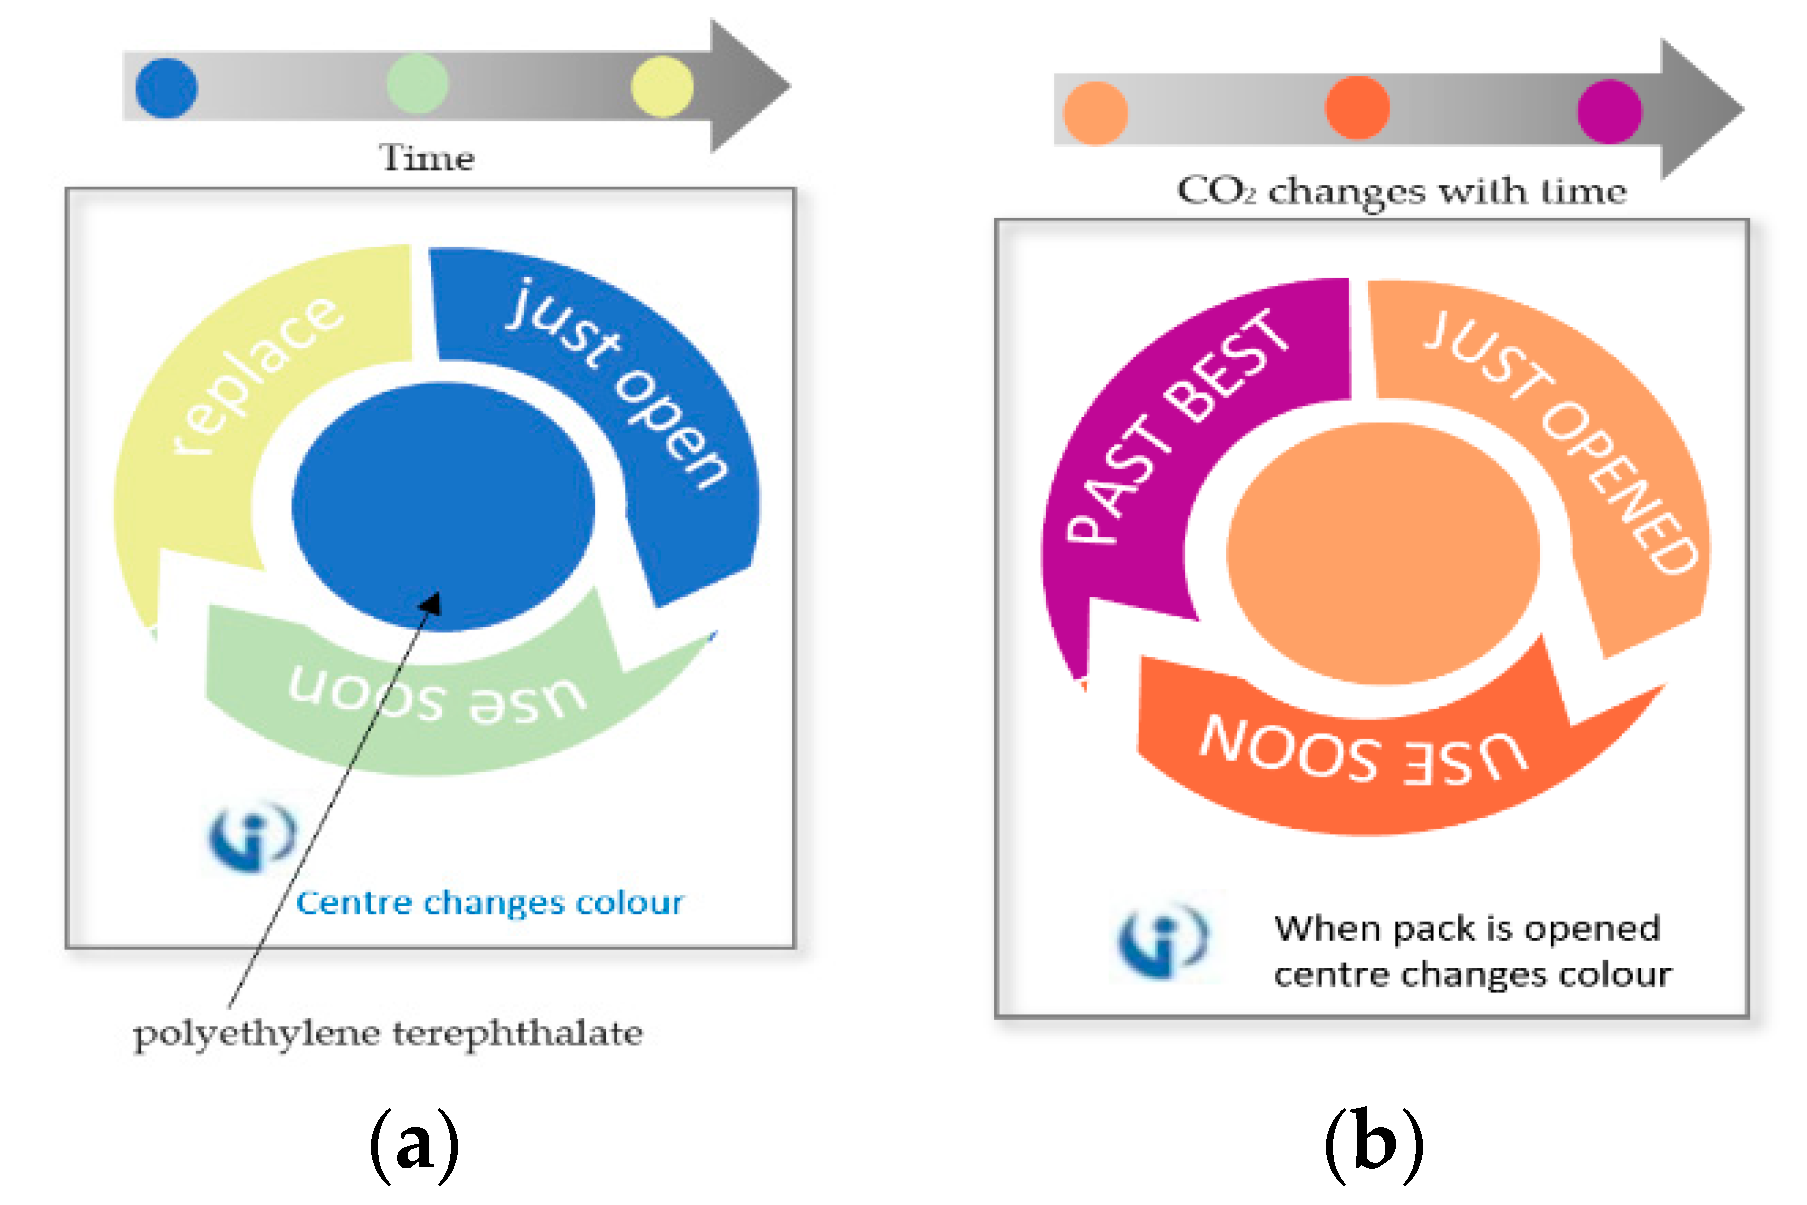
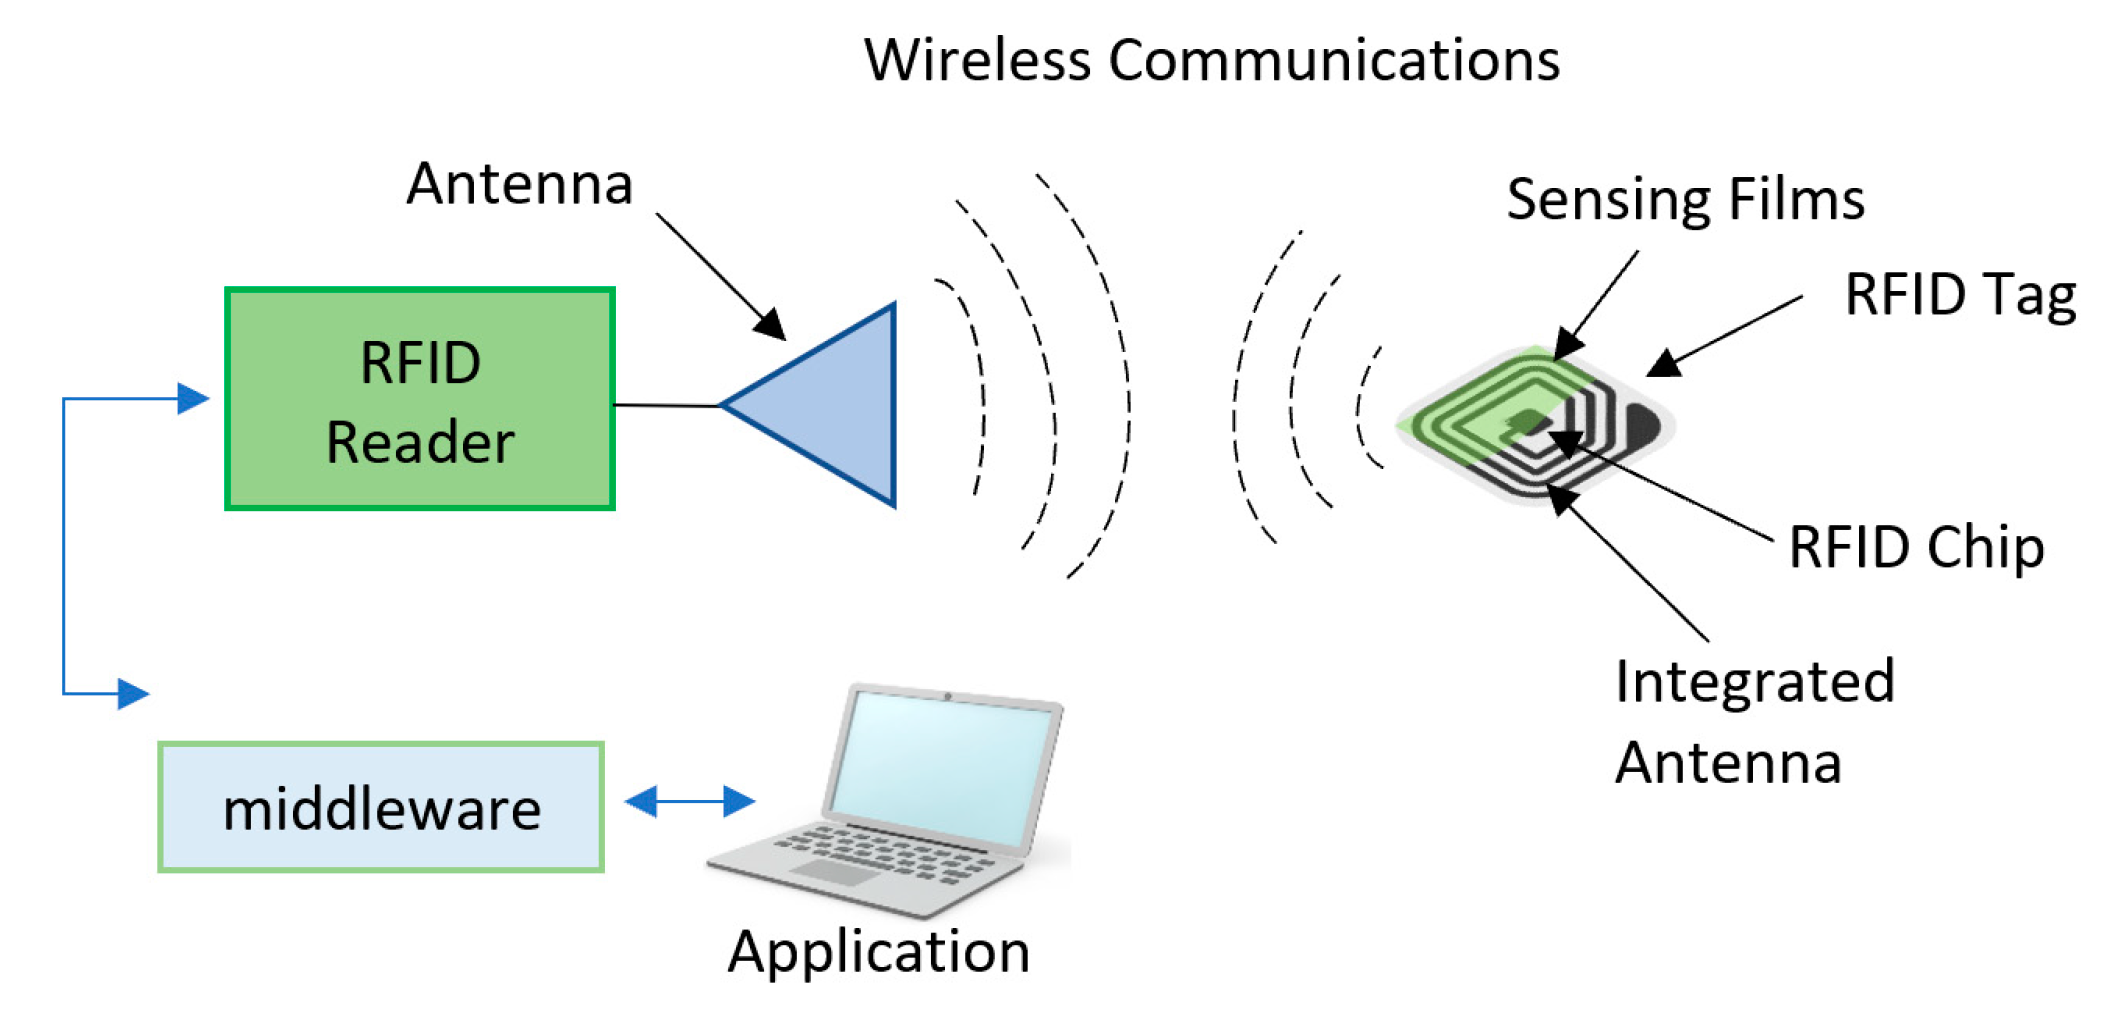
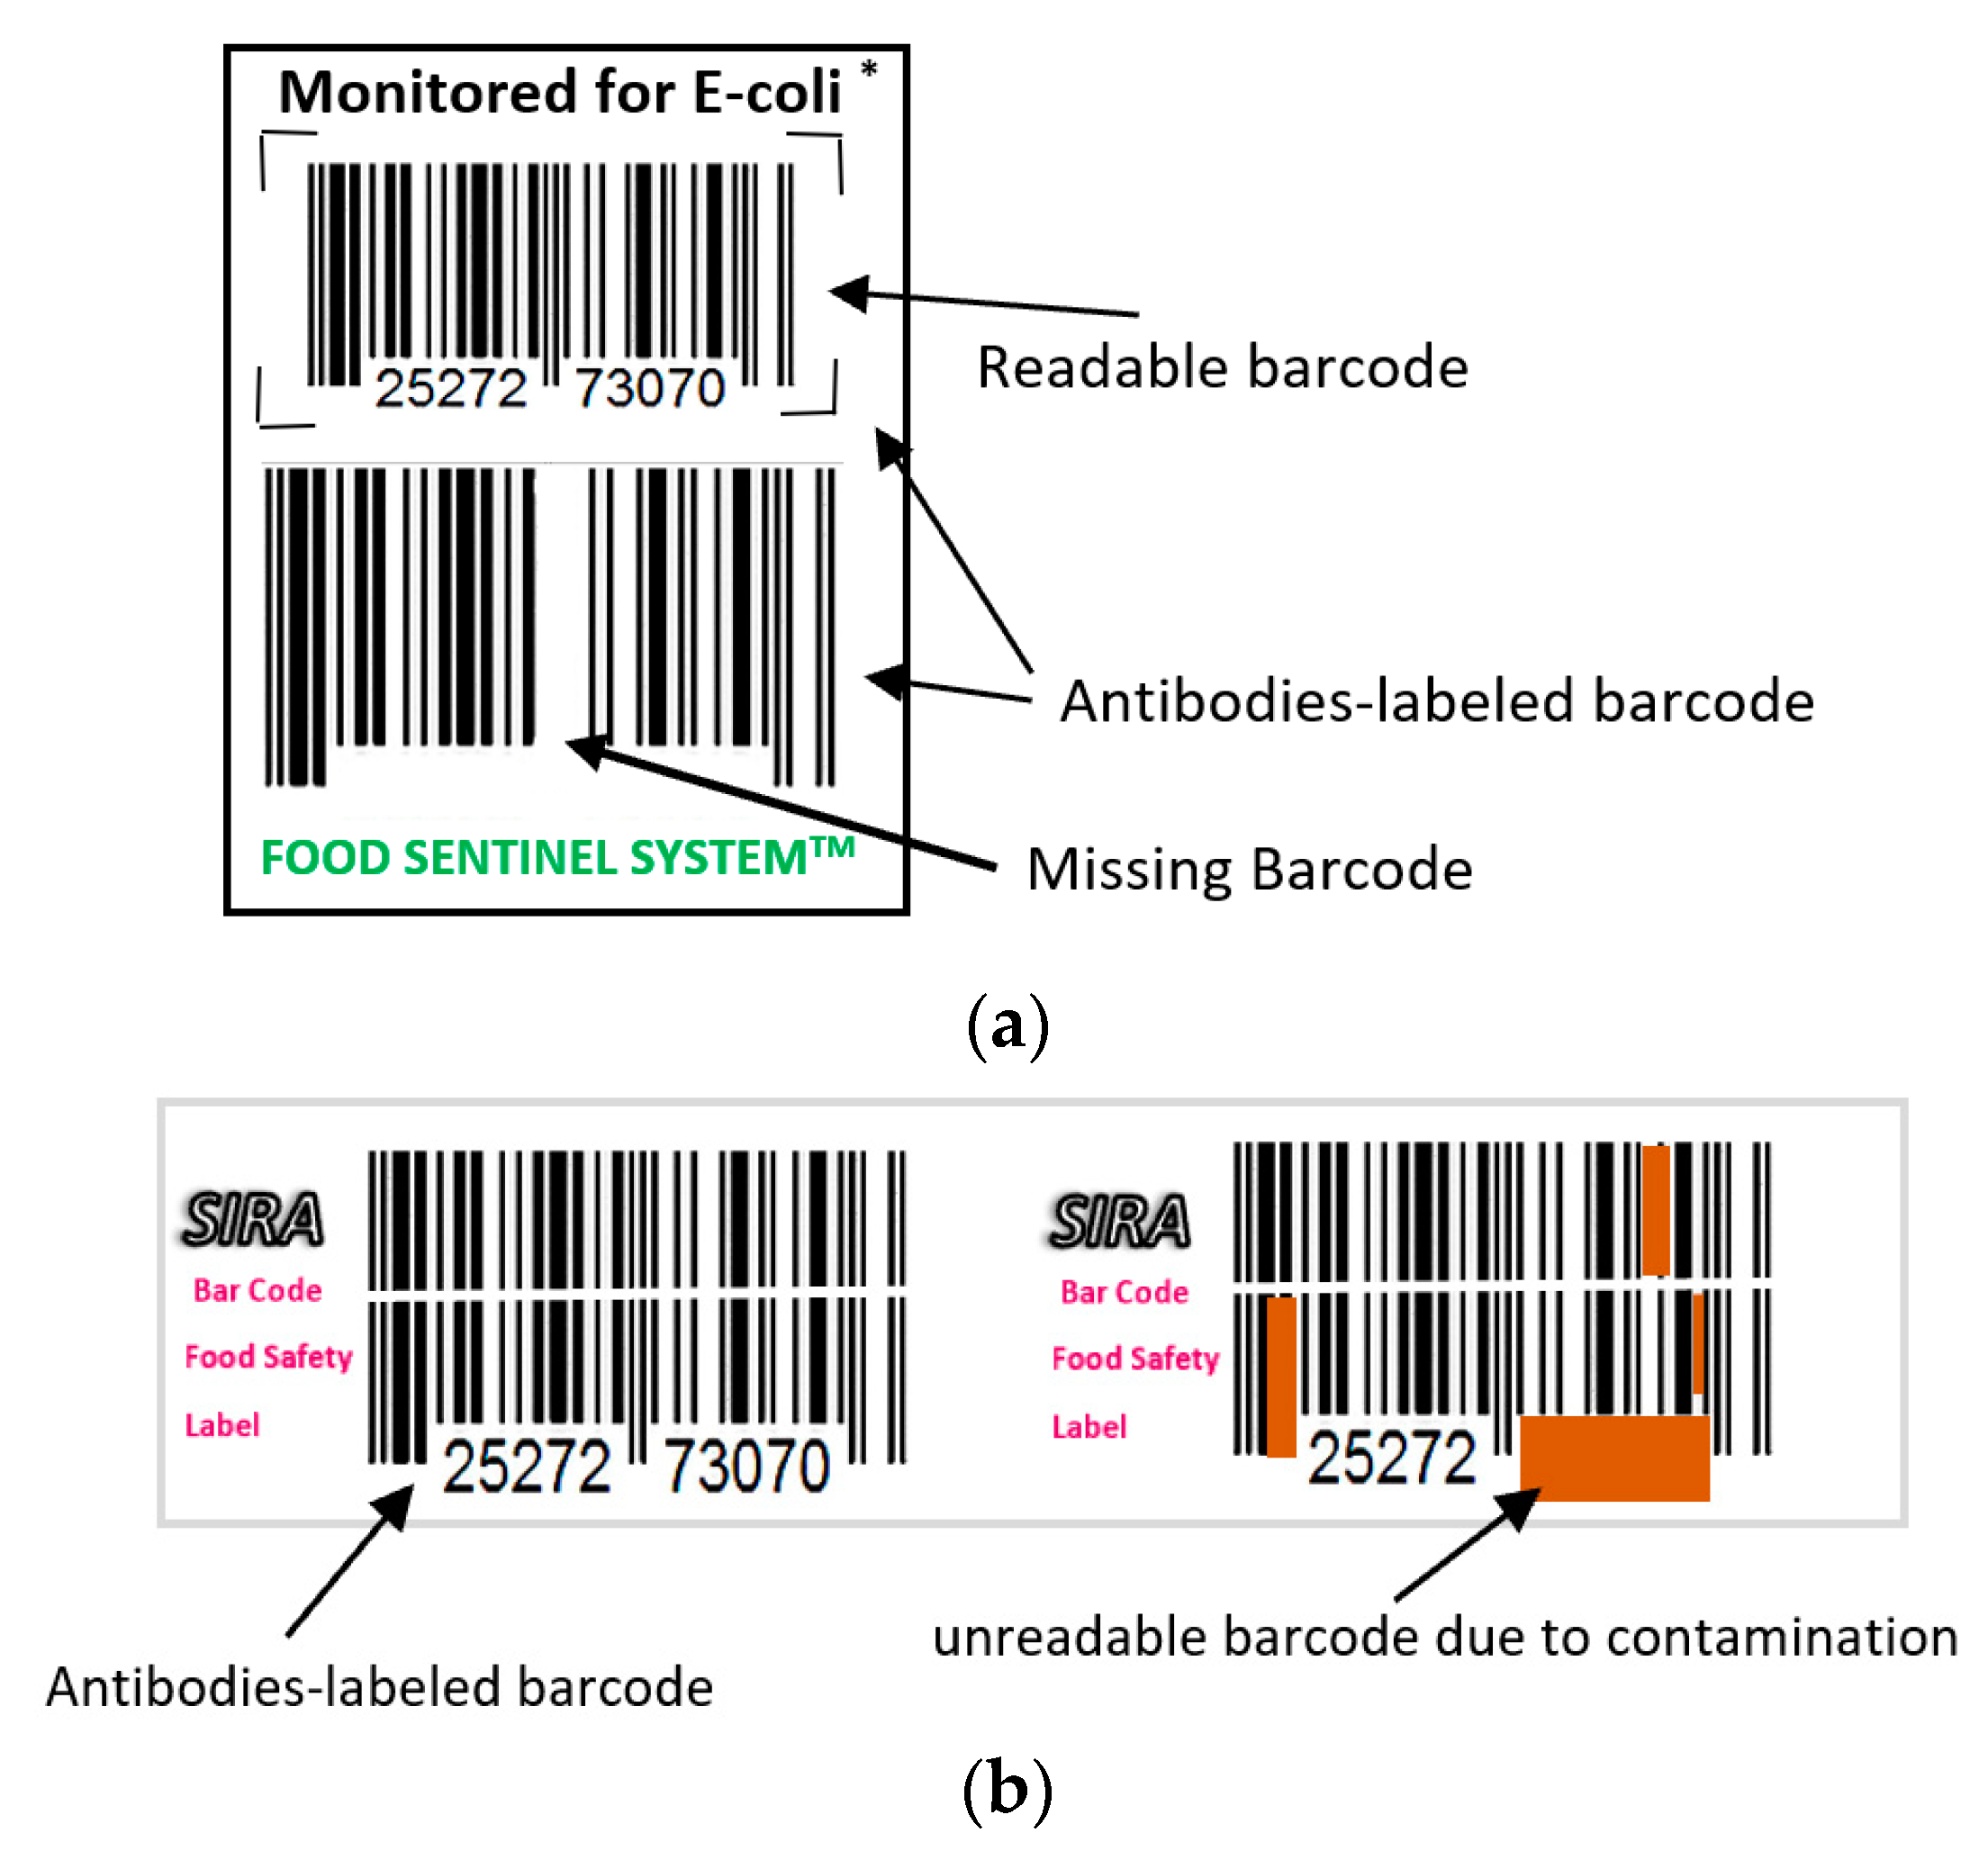
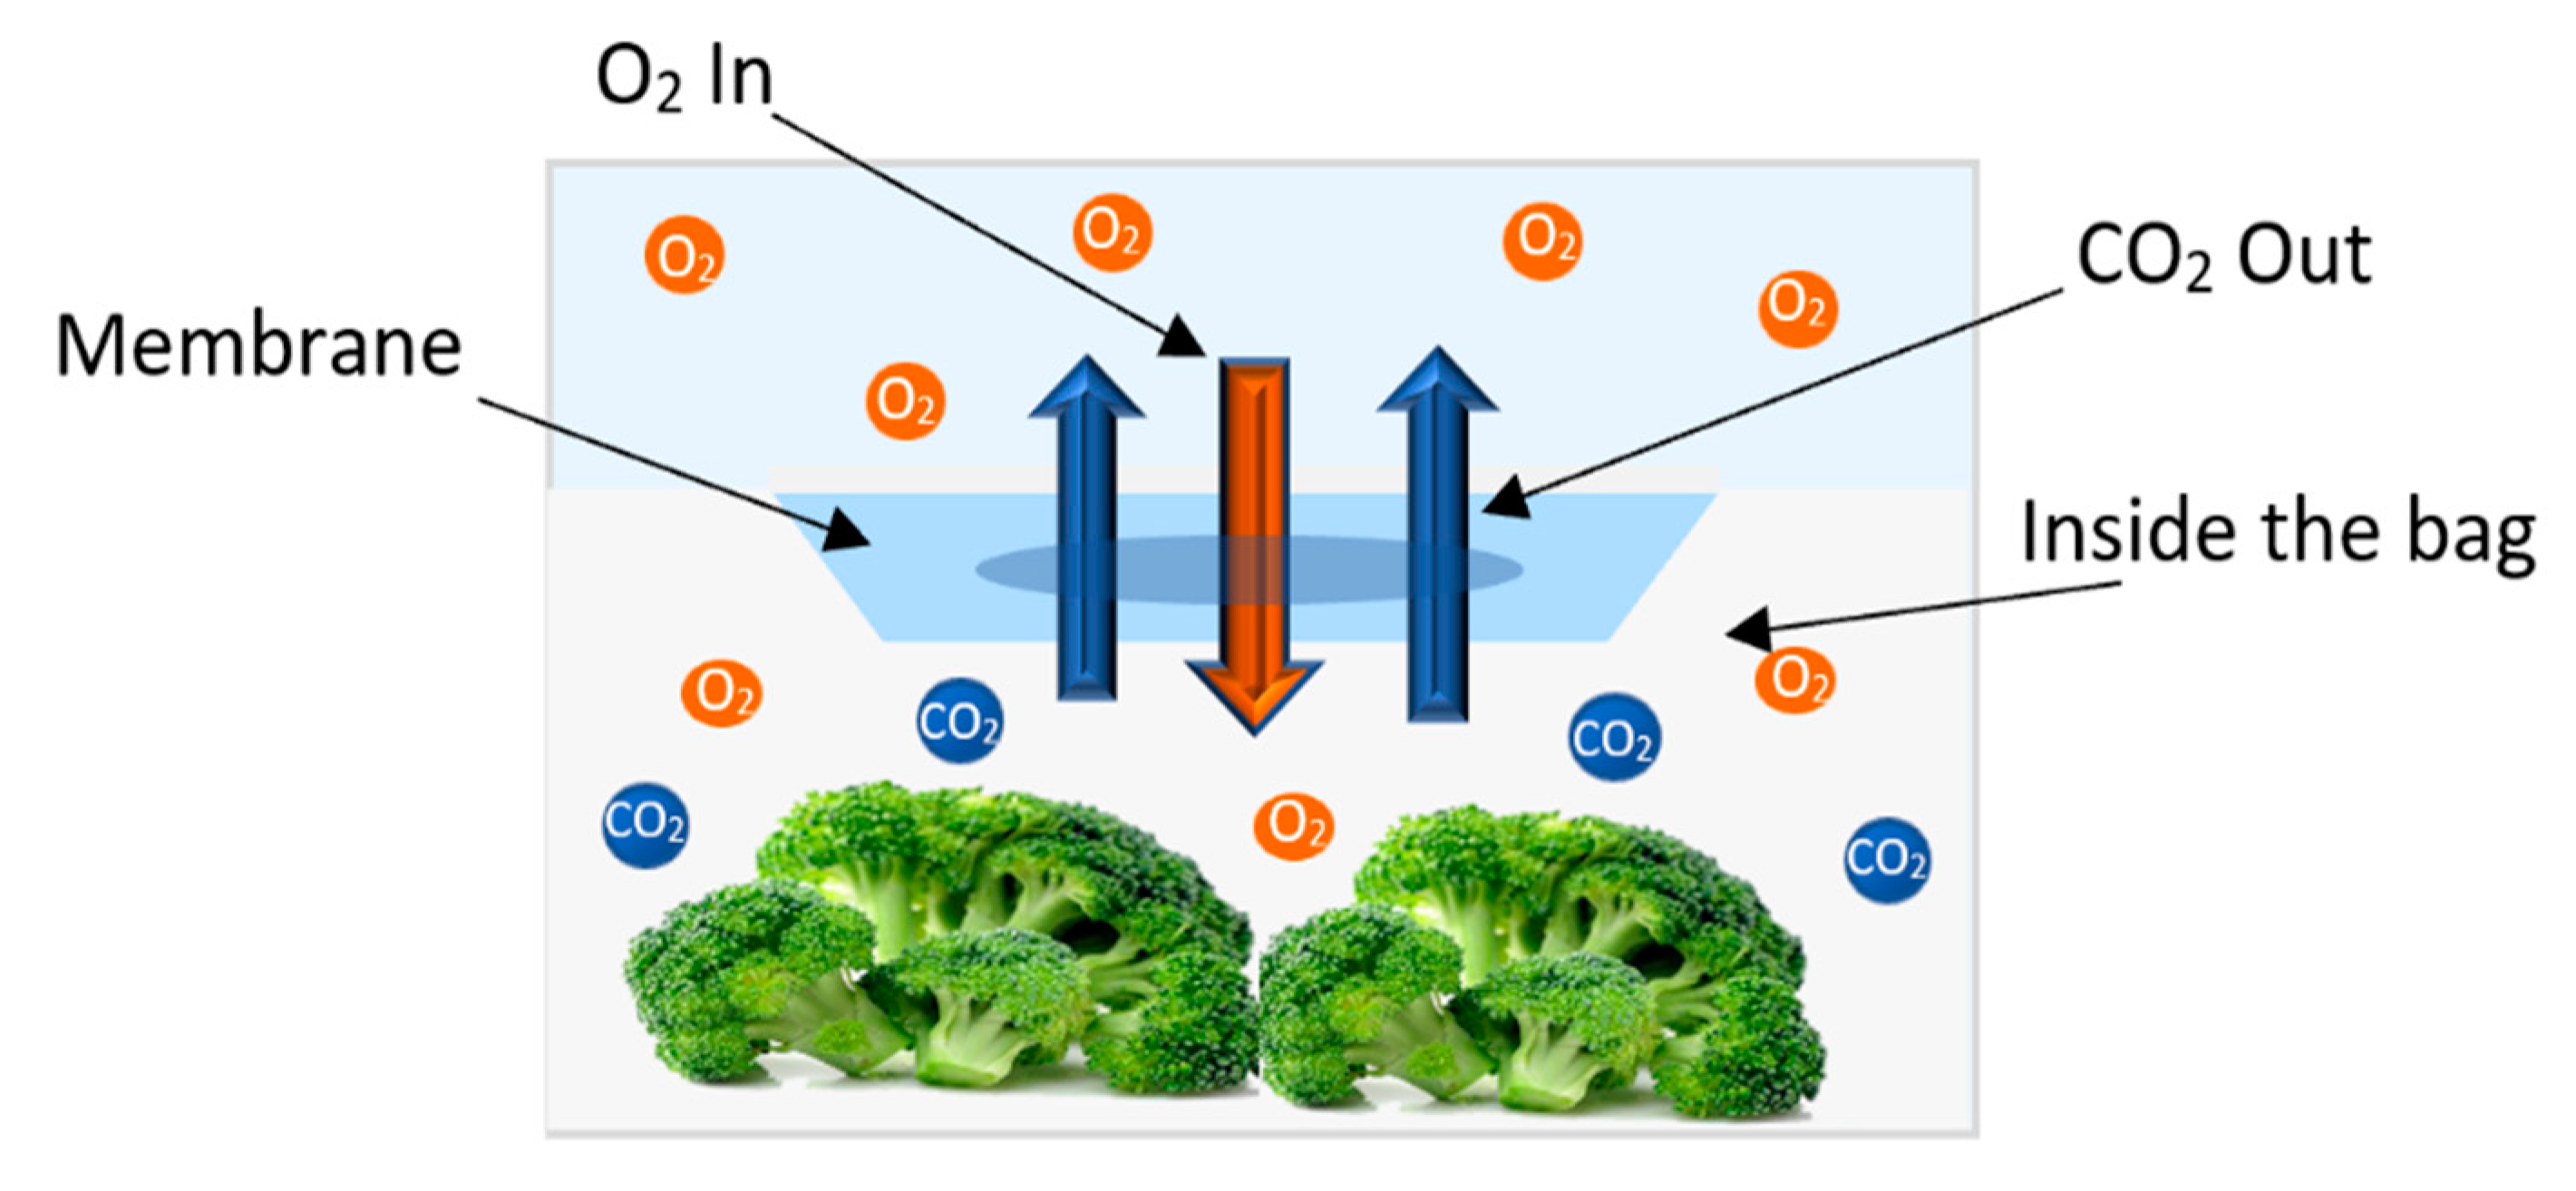
Table 1.
Pathogens in vegetables responsible for foodborne illness.
| Pathogen | Unsatisfactory Limits (CFU/g) | Incubation Period | Symptoms | Illness | Ref. |
|---|---|---|---|---|---|
| Escherichia Coli | ≥100 | 2–4 days | Stomach pain, diarrhea, nausea, chills, fever, and headache | Hemorrhagic colitis | [31,32,33] |
| Escherichia coli O157:H7 | > 0 | 3–4 days | Severe stomach cramps, diarrhea, vomit, fever | Hemorrhagic colitis | [31,32,33] |
| Salmonella spp. | > 0 | 12 to 24 h | Stomach pain, diarrhea, nausea, chills, fever, and headache | Salmonellosis | [31,32] |
| L. mono-cytogenes | >108 or 102–103 for susceptible people | 2 days to 3 weeks | Fever, chills, headache, backache, sometimes abdominal pain and diarrhea | Listeriosi | [31,32,34] |
| Shigella spp. | > 0 | 12–50 h | Abdominal pain, cramps, fever, vomiting, and diarrhea containing blood and mucus | Shigellosi | [31,32] |
| Bacillus cereus | ≥104 | 30 min to 15 h | Diarrhea, abdominal cramps, nausea, and vomiting | Bacillus cereus food poisoning | [31,32,33] |
Table 2.
Electrochemical foodborne pathogen detection.
| Transducer | Analyte | Limit of Detection (CFU/mL) | Response Time | Reference |
|---|---|---|---|---|
| Amperometric | E. coli O157:H7 | 77 ± 0.4 | 6 min | [80] |
| 7.8 ×101 | 10 min | [81] | ||
| 6 × 10² cells/mL | 2 h | [98] | ||
| Potentiometric | E. coli | 10 cells/mL | 1.5 h | [99] |
| Conductometric | E. coli O157:H7 | 7.9 ± 0.3 × 101 | 10 min | [100] |
| E. coli | 7.5 ± 0.3 × 101 | 10 min | [100] | |
| Salmonella spp. | 8.3 ± 0.6 × 101 | 10 min | [100] | |
| Bacillus cereus | 35–88 | 6 min | [101] | |
| Impedimetric | E. coli | 101–107 | - | [102] |
| L. monocytogenes | 4.1 pg/mL | 30 min | [103] |
Table 3.
Photophysical properties of commonly used oxygen dyes in oxygen sensing.
| Oxygen Sensing Dye | Max Absorption Wavelength (nm) | Max Emission Wavelength (nm) | Luminescence Lifetime (μs) | Ref. |
|---|---|---|---|---|
| [Ru(dpp)3]2 | 452 | 613, 627 | 5.3 | [137] |
| PtTFPP | 390 (323), 504 (23.2), 538 (29.4) | 647, 710 | 60 | [138] |
| PtOEPK | 398 (86.2), 592 (55.1) | 758 | 60 | [139] |
| PtTPTBPF | 430 (212), 615 (146) | 773 | 50 | [140] |
Table 4.
Commercial O2 and CO2 sensors used in vegetable package monitoring.
| Commercial Name Examples | Gas Detected | Principle of Operation | Operating Range (%) | Accuracy | Operating Temperature (℃) | Operating Humidity | Packaging Form | Cost ($) | Ref. |
|---|---|---|---|---|---|---|---|---|---|
| O2xydotsTM | O2 | Fluorescence-based using [Ru(dpp)3] Cl2 dye | 0–30 | 5% of reading | 0–50 | 0–100% | Dots with silicon glue | ~4.3 | [144] |
| OptechTM -O2 Platinum | O2 | Fluorescence-based using PtTBP dye | 0.015–25 | 3% of reading | 5–40 | 0–100% | Adhesive label | ~3 | [145] |
| Pst3 | O2 | Fluorescence-based using PtTFPP dye | 0–100 | ±0.4% @20.9% O2 | 0–50 | 0–100% | Dots with silicon glue | ~33 | [131] |
| SS1118 | O2 | Galvanic Type | 0~100 | < ±1.0% | −10~50 | 0~99% RH | RFID tag | Up to 100 | [146,147] |
| Cubic SRH | CO2 | NDIR | 0–20 | < ±2.0%FS | −20–70 | - | Possible in RFID tags | Up to 100 | [148] |
| NAP-21A | CO2 | Thermal Conductivity | 0~100 | 0.2 mV/%CO2 | −10~50 | 0~95% RH | RFID tag | 0.001–0.1 | [147] |
Table 5.
Specification of thin film/membrane humidity sensors.
| Sensing Material | Transducer | RH Range (%) | Response Time (s) | Sensitivity | Hysteresis (%RH) | Ref. |
|---|---|---|---|---|---|---|
| Polymer | Resistive | 12–90 | 15–20 | 136 | <0.16 | [151] |
| 20–95 | ~5 | high | Small | [152] | ||
| 20–95 | 97 | 31.5%/%RH | −1.1 to −0.8 | [153] | ||
| 10–90 | 45 | −0.0327 log Z/%RH | 6.1 | [154] | ||
| Capacitive | 20–95 | - | 162 ± 0.6 fF/%RH | <7 | [155] | |
| 10–98 | 356 ± 3 | 4.5 fF/%RH | <10 | [156] | ||
| 15–90 | 0.075–0.175 | 0.33 pF/%RH (15–62% RH) 46 pF/%RH (62–90%) | - | [157] | ||
| 10–90 | 108 | ~1 pF/%RH | <2 | [158] | ||
| Ceramic | Resistive | 10–90 | 4 | >4%/%RH | <2 | [159] |
| 40–90 | 4 | 10.01 MΩ/% RH | <7 | [160] | ||
| Capacitive | 30–95 | 188 | 483 fF/%RH | >65 | [161] | |
| 11–98 | 10 | 111 pF/%RH | ~2 | [162] | ||
| Hybrid (Polymer/Ceramic) | Resistive | 30–90 | 45 | −0.0655 log Z/%RH | <2 | [163] |
| 30–90 | 40 | −0.0306 log Z/%RH | - | [164] | ||
| Capacitive | 40–100 | 13 | ~31.6 pF/%RH | 12–13.3 | [165] | |
| 50–95 | 20 | 32.19%/%RH | - | [166] |
Table 6.
Comparison between commercially available TTIs.
| TTI Commercial Name | Reaction Type | Response | Need Activation | Cost ($) | Temperature Oper-Ating Range (°C) |
|---|---|---|---|---|---|
| Fresh-Check® | Polymeric | Red to black | N | 0.02–0.04 | - |
| Monitor Mark TM | Diffusion | Colorless to blue | Y | 2–4 | −15 °C to +31 |
| OnVuTM | Photochemical | Dark Blue to colorless | Y | 0.01–0.05 | 0 °C to +25 |
| eO® | Microbial | Green to Red | N | 0.05–0.17 | 2 to +12 |
| Timestrip® | Diffusion | Green to red | N | ~0.6 | 2 to 8 |
| eTimestrip® | electronic | Green LED off Red LED ON | Y | - | −30 to 70 |
| Checkpoint® | Enzymatic | Tricolor green to yellow to red | Y | 0.05–0.15 | −20 to 5 |
| Tempix® | Diffusion | Barcode lines disappear | Y | <0.01 | −35 to +32 |
Table 7.
Comparison of important features among active, semi-passive, and passive tags.
| Feature | Active | Semi-Passive | Passive |
|---|---|---|---|
| Power | Battery | Use battery to power chip, and power from reader to send data | Power from reader |
| Cost | Up to $100 | $10–$50 | ~$0.5 |
| Communication distance | 20–100 m | ~30.5 m | Up to 10 m |
| Life Duration | Limited, depends on battery power | Depend on battery and use | Depend on use |
| Operating Frequencies | 433 MHz, 2.45 GHz, 5.8 GHz | 850 MHz to 950 MHz | 128 kHz, 13.6 MHz, 915 MHz, 2.45 GHz |
Table 8.
Comparison between different intelligent systems.
| Intelligent Systems | Optical Sensors | Biosensors | Gas Sensors | Humidity Sensors | TTI | Gas Indicators | Freshness Indicators | RFID | Barcodes |
|---|---|---|---|---|---|---|---|---|---|
| Advantages |
|
|
|
|
|
|
|
|
|
| Disadvantages |
|
|
|
|
|
|
|
|
|
Table 9.
Comparison between different intelligent systems.
| AP System | Commercial Name | Packaging Form | Reference |
|---|---|---|---|
| O2 scavengers | ATCO® LH-100 | Labels | [20] |
| Cryovac® OS2000TM | Film | [205] | |
| CO2 scavengers | ATCO® CO-450 | Sachets | [206] |
| Ageless® | Sachets & labels | [201] | |
| Freshlock® | Sachets | [1] | |
| Yome | Sachets | [207] | |
| Moisture absorbers | Tyvek® | Sachets | [20] |
| Pad-Loc Fresh® | Pads | [1] | |
| PichitTM | Film | [1] | |
| Temperature compensating films | BreatheWay® | Film | [208,209] |
| Intellimer® | Film | [210] |
Publisher’s Note: MDPI stays neutral with regard to jurisdictional claims in published maps and institutional affiliations. |
© 2020 by the authors. Licensee MDPI, Basel, Switzerland. This article is an open access article distributed under the terms and conditions of the Creative Commons Attribution (CC BY) license (http://creativecommons.org/licenses/by/4.0/).
Share and Cite
MDPI and ACS Style
Beshai, H.; Sarabha, G.K.; Rathi, P.; Alam, A.U.; Deen, M.J. Freshness Monitoring of Packaged Vegetables. Appl. Sci. 2020, 10, 7937. https://doi.org/10.3390/app10217937
AMA Style
Beshai H, Sarabha GK, Rathi P, Alam AU, Deen MJ. Freshness Monitoring of Packaged Vegetables. Applied Sciences. 2020; 10(21):7937. https://doi.org/10.3390/app10217937
Chicago/Turabian StyleBeshai, Heba, Gursimran K. Sarabha, Pranali Rathi, Arif U. Alam, and M. Jamal Deen. 2020. "Freshness Monitoring of Packaged Vegetables" Applied Sciences 10, no. 21: 7937. https://doi.org/10.3390/app10217937
Note that from the first issue of 2016, this journal uses article numbers instead of page numbers. See further details here.