Article

Cone Beam CT Imaging of the Paranasal Region with a Multipurpose X-ray System—Image Quality and Radiation Exposure

1
Department of Radiology, University Hospital Erlangen, Maximiliansplatz 3, 91054 Erlangen, Germany
2
Institute of Anatomy I, University of Erlangen-Nuremberg, Krankenhausstr. 12, 91054 Erlangen, Germany
*
Author to whom correspondence should be addressed.
Appl. Sci. 2020, 10(17), 5876; https://doi.org/10.3390/app10175876
Submission received: 20 May 2020 / Revised: 13 August 2020 / Accepted: 13 August 2020 / Published: 25 August 2020

Abstract

:
Besides X-ray and fluoroscopy, a previously introduced X-ray scanner offers a 3D cone beam option (Multitom Rax, Siemens Healthcare). The aim of this study was to evaluate various scan parameters and post-processing steps to optimize image quality and radiation exposure for imaging of the parasinus region. Four human cadaver heads were examined with different tube voltages (90–121 kV), dose levels (DLs) (278–2180 nGy) and pre-filtration methods (none, Cu 0.2 mm, Cu 0.3 mm and Sn 0.4 mm). All images were reconstructed in 2 mm slice thickness with and without a metal artifact reduction algorithm in three different kernels. In total, 80 different scan protocols and 480 datasets were evaluated. Image quality was rated on a 5-point Likert scale. Radiation exposure (mean computed tomography volume index (CTDIvol) and effective dose) was calculated for each scan. The most dose-effective combination for the diagnosis of sinusitis was 121 kV/DL of 278/0.3 mm copper (CTDIvol 1.70 mGy, effective dose 77 µSv). Scan protocols with 121 kV/DL1090/0.3 mm copper were rated sufficient for preoperative sinus surgery planning (CTDIvol 4.66 mGy, effective dose 212 µSv). Therefore, sinusitis and preoperative sinus surgery planning can be performed in diagnostic image quality at low radiation dose levels with a multipurpose X-ray system.

1. Introduction

Sinusitis is a frequent disorder and one of the most common conditions treated by primary care physicians [1]. Each year in the United States, sinusitis affects one in seven adults, and is diagnosed in 31 million patients [2]. The direct costs of sinusitis, including medications, outpatient and emergency department visits, ancillary tests and procedures, are estimated to be $3 billion per year in the United States. Sinusitis is the fifth most common diagnosis for which antibiotics are prescribed [2,3] and can occur as acute or chronic infection. Multi-slice computed tomography (MSCT) is frequently used for imaging of the parasinus region [4,5]. It provides essential information for planning the surgical approach, image-guided navigation, and robotic surgery [6,7]. According to the current guidelines, it is mandatory before functional endoscopic sinus surgery (FESS) to visualize individual anatomic variants and the extension of the disease [8]. The computed tomography (CT) scan of the paranasal sinuses have superseded the conventional standard radiography as it offers more precise anatomic information to the surgeon on the complex anatomy of the sinus cavities and their drainage pathways, in particularly the ostiomeatal complex [9,10]. To adhere to the ALARA principle (“as low as reasonably achievable”) different approaches to lower radiation exposure in parasinus CT have been proposed like low kV scanning and spectral shaping [11,12]. Alternatively, cone beam CT (CBCT) has been shown to be an efficient alternative to conventional CT scans to identify sinusitis disease and serves as a guide for surgical intervention [13]. With its flat-panel detector technology it is characterized by high spatial resolution to provide excellent detail of the bony anatomy with the drawback of limited soft tissue information [14]. Because of the relatively lower costs in comparison with modern helical CT scanners, CBCTs with small detectors, also named as digital volume tomography (DVT), are increasingly used for imaging of the paranasal sinuses. Originally developed for dentistry and orthodontic diagnostics, DVTs with increasing field of view (FoV) sizes due to bigger flat detectors and further advances in technology are becoming increasingly popular for ENT specialists [15,16]. They are even able to perform tomography independently using DVT for diagnostic and preoperative imaging [17] assuming they have the appropriate technical qualifications in radiation protection. For this reason, an X-ray machine that has a 3D CBCT option would be interesting for X-ray practices, in order to be able to offer CBCTs in addition to classic X-rays with a small fleet of equipment.
A new type of X-ray machine developed primarily for digital X-ray and fluoroscopic examinations is additionally equipped with flat-panel detector technology for CBCT [18]. With this multipurpose device, 3D imaging of the paranasal sinuses can be performed. Different pre-filtration options like copper and tin, metal artefact reduction algorithms (as metal implants can also affect image quality in CBCT as in MSCT) and different kV levels are available. As imaging of the sinuses is among the most common scans requested in the field of otorhinolaryngology, this additional option would be a considerable advantage in terms of cost efficiency as fluoroscopic examinations are becoming increasingly rare.
The aim of this study was to define and evaluate dose-optimized protocols for the diagnosis of sinusitis and preoperative sinus surgery planning using different kV levels, pre-filtration options and metal artefact reduction algorithms.

2. Materials and Methods

2.1. Image Acquisition

In total, four cadaver heads were scanned with a multipurpose X-ray system (Multitom Rax, Siemens Healthcare). The 3D CBCT has an amorphous silicon flat detector with a cesium iodide scintillator of 43 × 43 cm area and has an image matrix of 1420 × 1436 pixels with a pixel size of 296 µm (both after binning of 2 × 2). The reconstructed voxel size was 0.5 mm (isotropic). The maximum diameter of field of view for reconstruction was 23 cm. Reconstruction is based on a filtered back projection algorithm (Feldkamp, Davis, Kress) with additional correction methods to compensate for noncircular movement [19]. The X-ray tube (OPTITOP; Siemens Healthcare) has a 0.6 mm focal spot. Various tube voltages (90, 100 and 121 kV) and dose levels (DLs) can be selected as setting parameters resulting in different scan protocols. Preset and selectable DLs are 278, 548, 1090, 2180 nGy. The X-ray tube target material is tungsten. The DL serves as the target DL for the automatic exposure control. The aim is to keep the dose at the image receptor constant for all projections. The tube current is modulated by the system and was between 44–374 mAs. The detector and tube are attached to two telescopic arms with a hinge. While moving along a predetermined trajectory, fluoroscopic images are acquired. The trajectory is defined by its position and scanning angle range. All scans were performed after geometric calibration of the trajectory. For the upright trajectory, a set of 512 images were acquired with a framerate of 8 fr∙s-1, resulting in a scan-time of 20 sec over a 187-degree arc-travel (system version VE30B, product status 2017).
First, one cadaver head was examined with all available scan parameters to obtain an impression of image quality and radiation exposure. Three different tube-voltage settings (90, 100 and 121 kV) and four different DLs (278, 548, 1090 and 2180) were evaluated, each DL with and without pre-filtration of the X-ray beam with a 0.2 mm copper filter (“Cu”) to constrict the energy spectrum. Images were reconstructed in 2 mm axial and coronal slice thickness and post-processed with three different image “kernels” ranging from soft to hard (“smooth”, “medium”, “bone”). Additional post-processing was performed with and without the metal artifact reduction (MAR) algorithm [20].
The subsequent scans of the three remaining heads were performed to further optimize image quality for selected protocols (121 kV) based on the results of the first cadaver head. Four different DLs (278, 548, 1090 and 2180), pre-filtration with 0.2 and 0.3 mm copper and tin (Sn) (0.4 mm) were evaluated.
To find protocols with the best compromise between image quality and radiation exposure for preoperative surgery a mean computed tomography volume index (CTDIvol) of 8 mGy was considered the upper limit [21].

2.2. Image Quality Assessment

All datasets were stored in DICOM format and protocol-related information was removed. A 3D post-processing platform (syngo.via, Siemens Healthcare) was used to display all datasets. Two board-certified radiologists (9 and 10 years of experience in head and neck radiology) analysed the images. The window setting could be changed by the raters at their own discretion. The default setting was W 2000 C 0. For the first cadaver head overall impression of the images was assessed according to the subjectively perceived image impression and rated (sufficient image quality vs. insufficient/noisy image quality).
Image quality for the remaining three cadaver heads was measured by using an ordinal performance scale with 5 levels (5-point Likert scale). The demarcation of 10 anatomic regions (lamina papyracea, lamina cribrosa, nasal septum, ethmoid air cells, sinus walls, orbital floor, lacrimal duct, carotid canal, tympanic cavity, mastoid cells) and incidental “pathologic” conditions (paranasal and mastoid fluid collections) was rated as follows: 5 excellent, 4 good, 3 moderate, 2 sufficient, 1 insufficient image quality.
The overall rating for each protocol was defined by the worst rating of these 10 anatomic structures and two “pathologic” conditions. Image quality of 3 was considered “sufficient” for pre-operative evaluation for sinusitis surgery, and image quality of 2 to detect or rule out sinusitis [11]. Noise measurements were not performed since noise values do not adequately reflect the diagnostic value in high contrast objects [11]. For the evaluation of MAR a 3-point Likert scale was used, 3 = no beam hardening despite metal implants, 2 = moderate beam hardening artifacts, cortical structure of maxilla/mandible definable, but not reliably assessable everywhere, 1 = strong beam hardening artifacts, impairment of anatomical structures. Cohen’s Κ was calculated for inter-rater reliability by using SPSS Statistics 21.0 (IBM Corp).

2.3. Estimation of Radiation Exposure

CTDIvol was calculated after a modified (to account for geometric inequality) scanning of a 16 cm standard head phantom (data not shown, see [22]). CTDIvol was calculated following the IEC (International Electrotechnical Commission) 60601-2-44 A1 standard method [23]. DAP (dose area product) was specified as logged by the device. The effective dose was based on the dose length product (DLP) and calculated using the following formula according to the International Commission on Radiological Protection Publication 103 (ICRP 103): DLP [mGy × cm] × 0.0019 [mSv × mGy−1 × cm−1] [24].

3. Results

Cohen’s Κ for inter-rater reliability calculated from the raw data was 0.74.

3.1. First Cadaver Head Scan

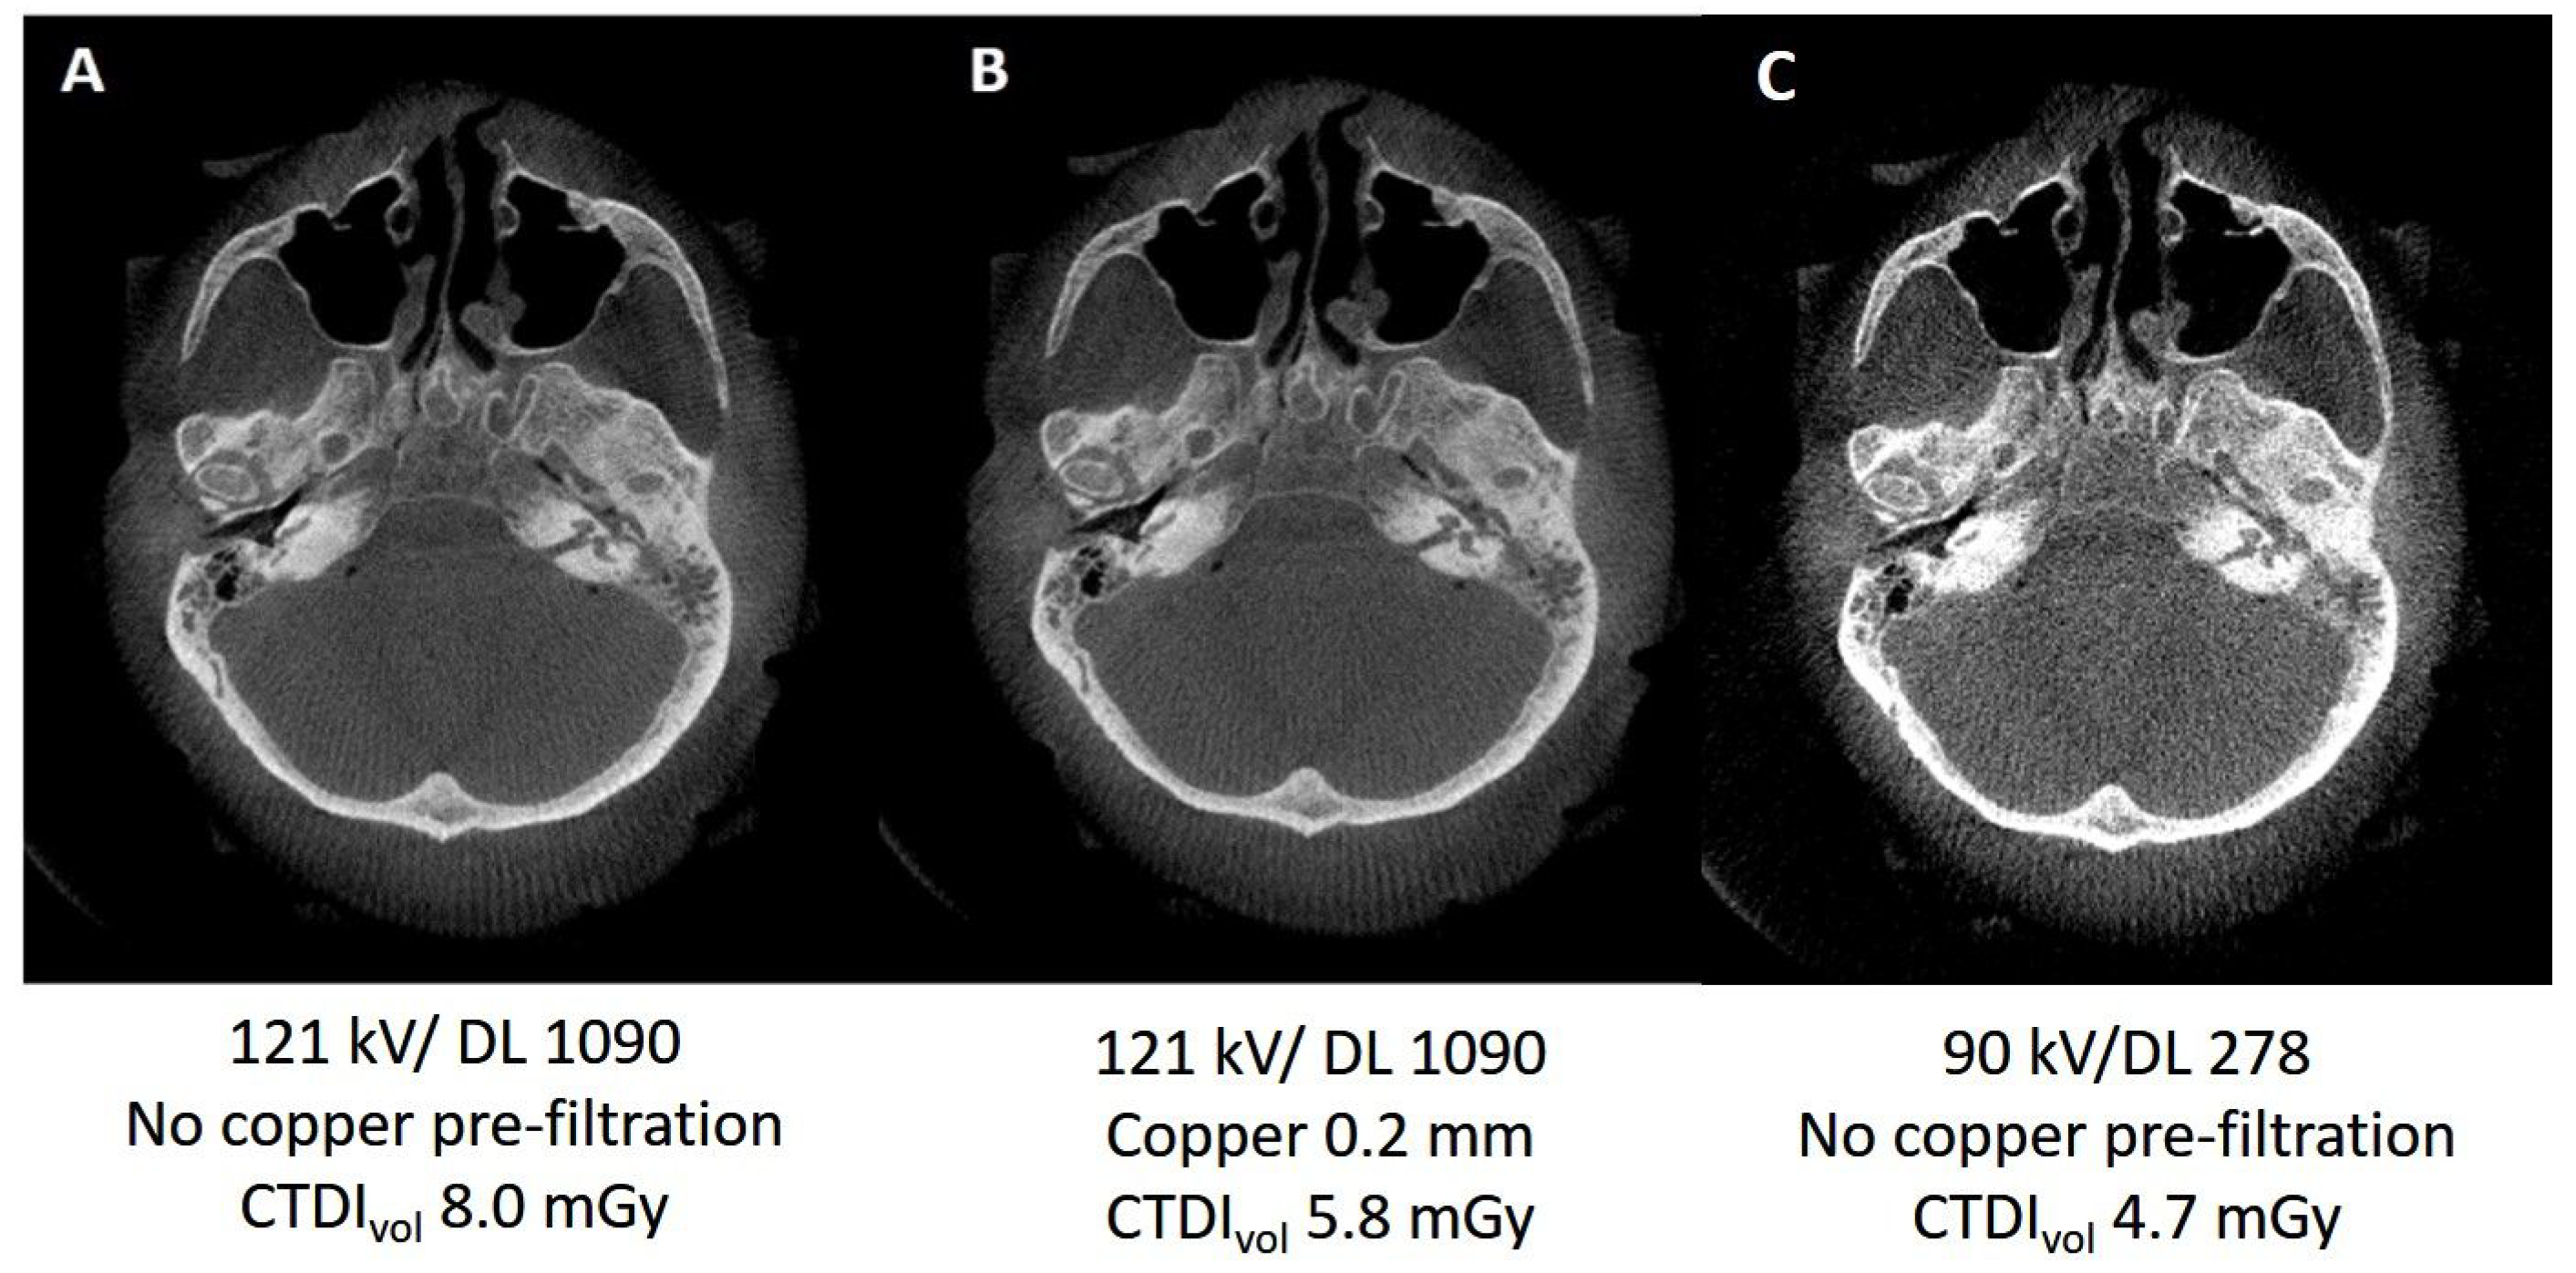
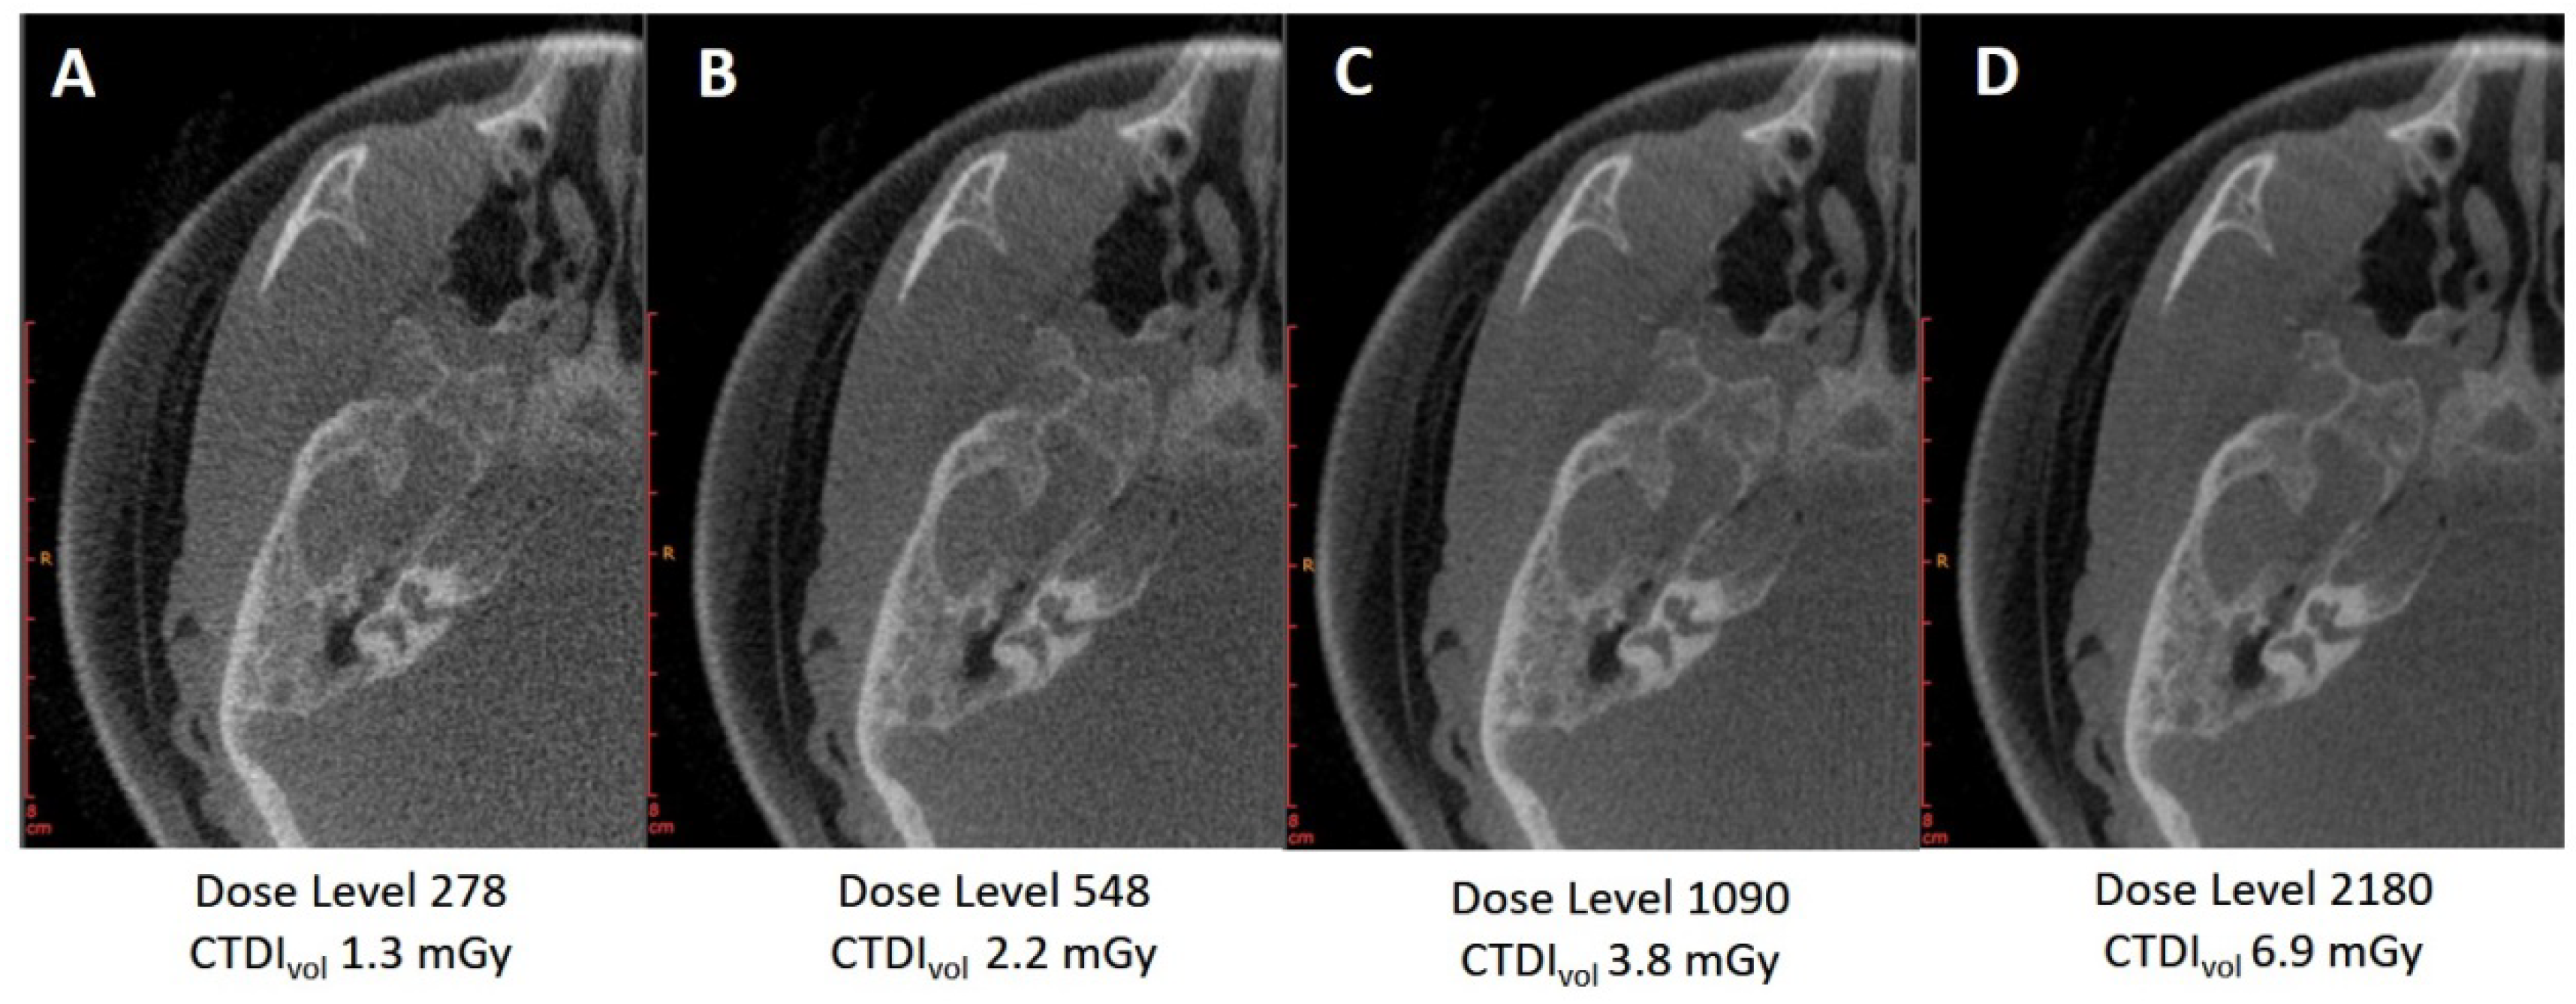
3.1.1. Variation of Tube Voltage

Three protocols with a DL of 278 at 90 kV, 100 kV and 121 kV and two protocols with a DL of 548 at 100 kV and 121 kV had a CTDIvol < 8 mGy. Additional copper pre-filtration further reduced the radiation dose without deteriorating image quality (Figure 1A,B). Pre-filtration of the beam with 0.2 mm copper resulted in an average reduction in radiation exposure of 32%. With copper pre-filtration, a DL of 548 at 90 kV and a DL of 1090 at 121 kV additionally achieved a CTDIvol < 8 mGy. In total 12 protocols with a CTDIvol < 8 mGy were compared and the best compromise between radiation exposure and subjectively perceived image quality delivered the 121 kV setting.

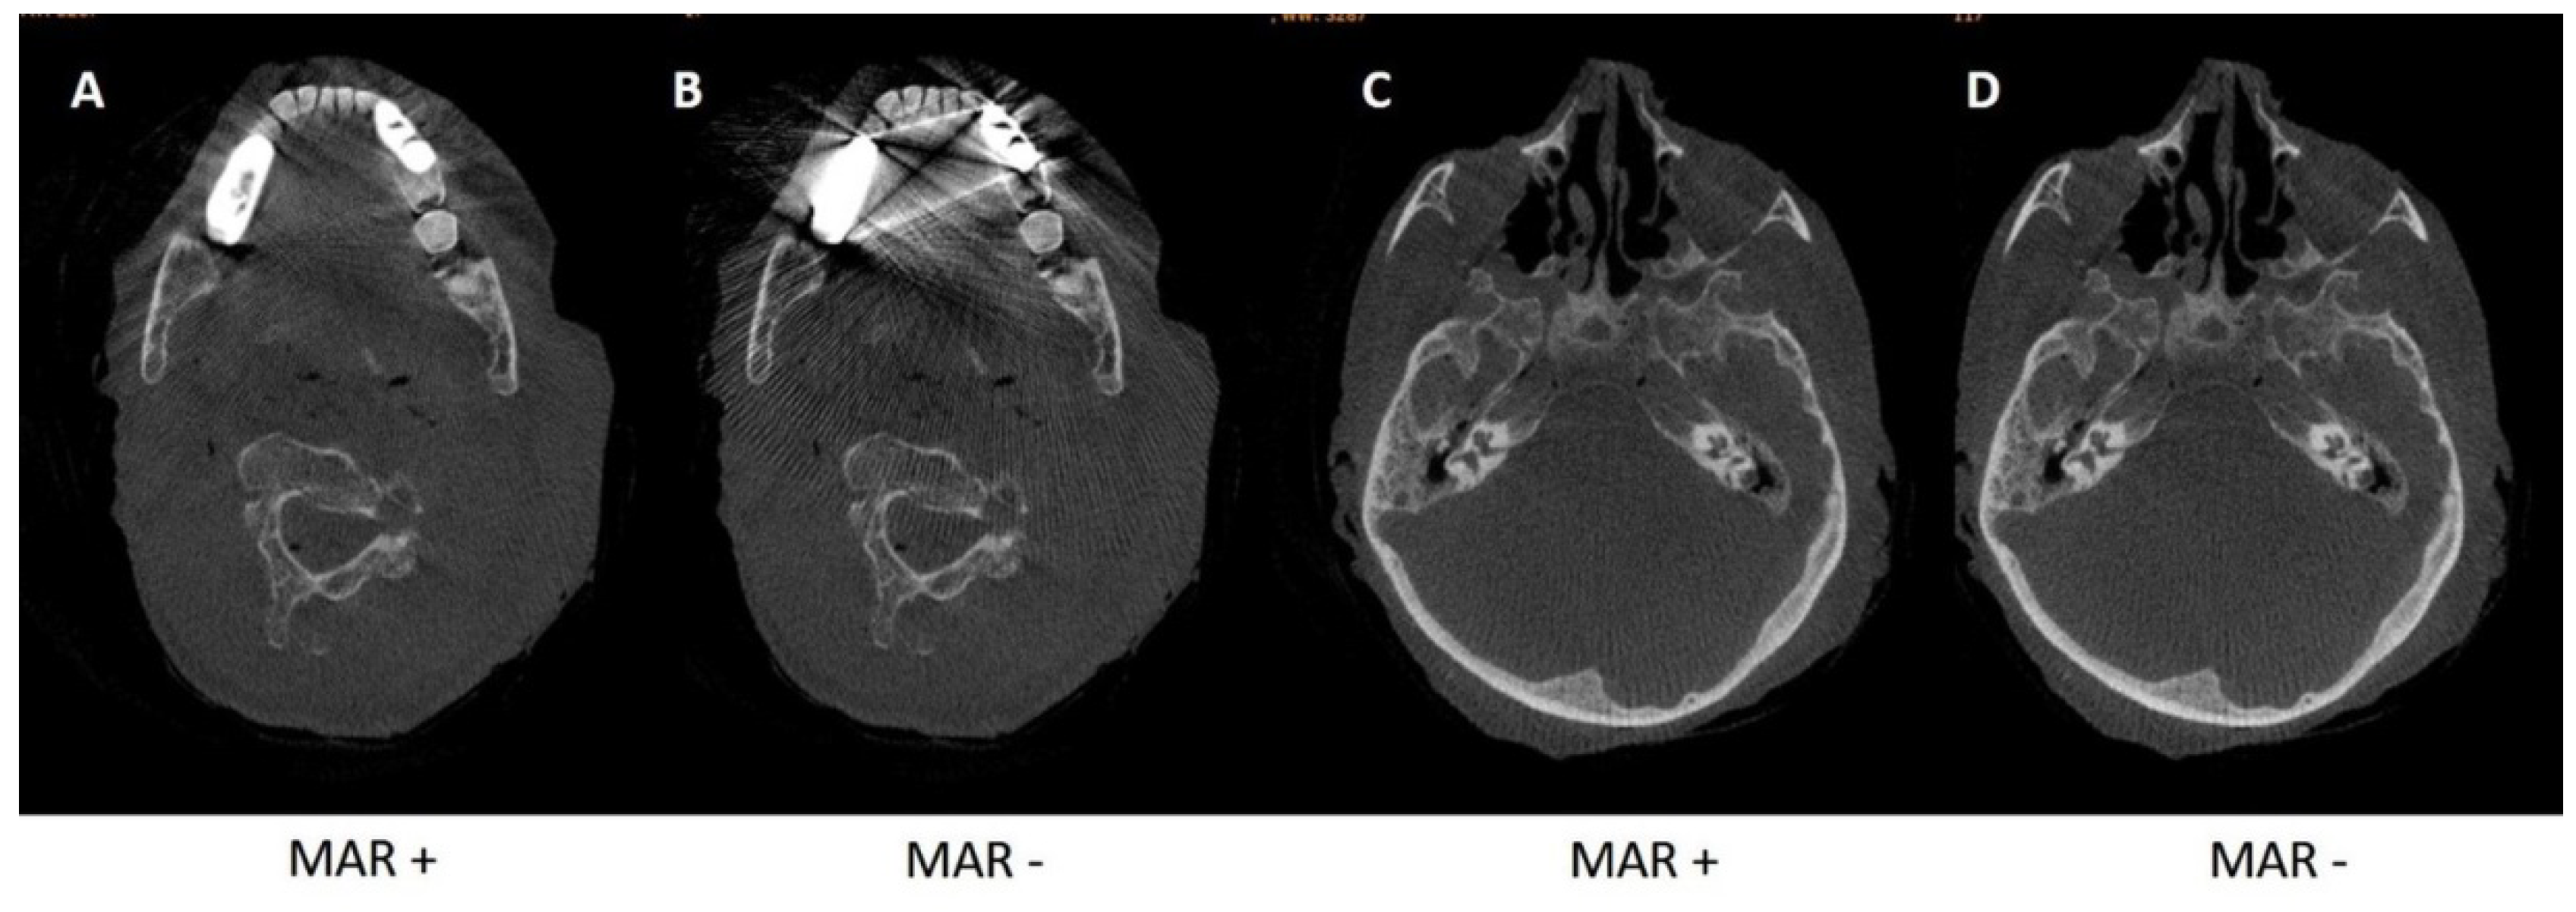
3.1.2. Metal Artifact Reduction Algorithm

All four cadaver heads had dental implants. The metal artifact reduction algorithm was beneficial in all examined data sets (Figure 2) (mean Likert scale value 2 with MAR vs. 1 without MAR). Less beam hardening artifacts were visible due to MAR, the cortex of the mandible and maxilla and the bony structures were better visible (Figure 2A,B). MAR did not miscalculate or disturb the datasets (Figure 2C). Beam-hardening artifacts of metal implants were visible even in the vertebral bodies in the images without MAR, but not in images with MAR. Despite MAR, the bony fixation of the implants was not visible in some places, depending on the angle of rotation and the direction of the beam hardening artifacts (Figure 2A).

3.1.3. Kernels

Hard kernels substantially increased image noise (Figure 3A), whereas soft kernels (smooth) led to a blurred visualisation of the bony edges yet with significantly less image noise (Figure 3C). In terms of image impression, the medium kernel (Figure 3B) delivered the best compromise between image noise and sharp bony edges.

3.2. Results for Cadaver Heads 2–4

3.2.1. Pre-Filtration with 0.2 vs. 0.3 mm Copper Filter

Based on the results of cadaver head 1 121 kV protocols were further evaluated with additional copper pre-filtration. Image quality was comparable between different data sets scanned without, with 0.2 mm or 0.3 mm copper filters. The radiation dose could be reduced to 40% compared to the dose without pre-filtering by using a 0.2 mm thick copper filter, and to 42 to 60% of the original dose by using a 0.3 mm thick copper filter. See Table 1 for detailed results and Figure 4 for representative images with copper pre-filtration.

3.2.2. Pre-Filtration with 0.4 mm Tin Filter

Pre-filtration with a tin filter led to higher image noise which decreased image quality. The bony walls of mastoid cells were virtually invisible at a scan level of DL 278 nGy and 548 DL of at least 2180 was required for sufficient visualisation of the anatomic structure, which considerably increased the radiation dose by a factor of 5 (see Table 1). Data sets with tin pre-filtration were not adequate for preoperative imaging (see Figure 5 and Table 1).

3.3. Statistical Evaluation: Preoperative Imaging vs. Imaging of Sinusitis

As shown in Table 1, the scan protocol with 121 kV/DL 278 was sufficient to reliably detect sinusitis (minimum score of 2 was achieved, see reference [11]). Pre-filtering with a 0.3 mm copper filter achieved an average CTDIvol of 1.70 mGy.
A sufficient image quality for preoperative imaging was achieved within all four skulls of both readers at 121 kV/1090. Important structures for the FESS, such as the bony walls of the carotid canal or that of the orbit [7], were only rated with a “3” above a DL of 1090, which, by definition, was defined as the minimum requirement for preoperative planning of sinus surgery (Figure 6). When pre-filtering the beam with a 0.3 mm thick copper filter, the average resulting radiation dose was 4.7 mGy (CTDIvol). A further increase of the DL to 2180 did not change regarding image quality (overall minimum score on Likert Scale remained “3”, see Table 1), but the CTDIvol increased to an average radiation dose of 5.6 mGy (CTDIvol), when pre-filtered with a 0.3 mm copper filter. Thus, a scan protocol with 121 kV/DL 1090 and a pre-filtering of the beam with 0.3 mm is the protocol of choice for preoperative imaging.

4. Discussion

For imaging the parasinus region with a previously introduced multipurpose X-ray device with 3D cone beam option [18], various scan parameters and post-processing steps were examined to optimize image quality and radiation exposure. The best compromise between radiation exposure and image quality for the diagnosis of sinusitis was found at 121 kV/ DL 278 and for preoperative imaging at 121 kV/DL 1090. In our study, the effective dose for ruling out sinusitis was 0.077 mSv and for preoperative imaging 0.212 mSv.
In modern medicine, examination protocols tailored to the specific patients’ anatomy and clinical indication are mandatory. The scan range of the parasinus region includes radiosensitive organs like the eye lens. Due to the typically young age of the patients and repetitive scans, radiation exposure is a relevant topic for this cohort. Today numerous manufacturers offer a wide range of CBCT and DVT units that differ both in their technical characteristics and in terms of radiation exposure [25]. In a dental and maxillofacial study with a large cohort of 500 patients examined with CBCT mean CTDIvol was 9.11 mGy [26]. In other studies with CBCT, the radiation exposure is recorded as the effective dose. In a meta-analysis of 23 dental CBCT units the average effective dose was 0.212 mSv using large FoVs [27]. In a recently published review for radiation dose in non-dental CBCT applications the overall mean effective dose for imaging the paranasal sinuses was 119.0 µSv [28] with comparability limited due to the smaller FoVs of the devices used for the studies (i.e., 15 × 12 cm, 13 × 10 cm). The effective dose is in between our results for the low-dose scanning protocol (77 µSv) and the protocol recommended for preoperative planning (212 µSv). The slightly higher dose required for preoperative imaging than for the diagnosis of sinusitis is mainly due to the carotid canal. The carotid canal is surrounded by soft tissue and requires higher dose levels for preoperative assessment.
One drawback of scanning patients on CBCT is its inferior soft tissue visualisation compared to CT [29] and magnetic resonance imaging (MRI) [30]. Even modern CBCTs lack sufficient soft tissue display, so using the multi-purpose device for soft tissue evaluation cannot be recommended. In case of unclear soft tissue lesions or if soft tissue lesions are suspected the method of choice is MRI [30]. MRI is also capable of ruling out sinusitis but fine bony structures cannot be visualized. Another disadvantage of MRI is the long examination time and the significantly higher costs.
In summary, the multi-purpose X-ray machine equipped with a 3D CBCT option offers the opportunity to examine patients with dedicated protocols based on their clinical indication for the diagnosis of sinusitis and for preoperative imaging. The radiation dose for both protocols is within the range of DVT and other CBCTs.
Some limitations of our study need to be addressed.
First, four cadaver skulls were examined to evaluate image quality and to determine optimal scan protocols as well as post-processing steps. These dedicated protocols need to be verified in a larger cohort.
Second, all four cadaver heads were examined in an upright position, which should correspond to the posture of a seated patient. Tilting the jaw to improve image quality or to lower radiation exposure in CBCT by reducing the impact of metal implant artifacts as proposed in [31] has not been attempted.
Third, as cadaver heads were examined no motion artifacts occurred. The examination time for CBCT is approx. 20 s and movement artifacts could significantly influence image quality [32]. Further studies on human subjects are recommended to validate our results and suitable head fixation aids must be developed to minimize motion artifacts.

5. Conclusions

The multifunctional X-ray unit used in this study is suitable for the diagnosis of sinusitis and can also be used for preoperative imaging. The 3D option of this primarily for X-ray technology developed machine offers a significant advantage over conventional X-rays of the paranasal sinuses. The resulting radiation exposure is in the range of published DVT and CBCT examinations of the paranasal sinuses.

Author Contributions

Conceptualization, S.O., M.S. and W.W.; methodology, S.O. and W.W.; software, M.U.; validation, S.O., W.W. and M.M.; formal analysis, S.O.; investigation, S.O.; resources, T.B. and M.U.; data curation, S.O.; writing—original draft preparation, S.O.; writing—review and editing, S.O., M.M. and W.W.; visualization, S.O.; supervision, W.W. and M.U.; project administration, S.O.; All authors have read and agreed to the published version of the manuscript.

Funding

This research received no external funding.

Conflicts of Interest

The authors declare no conflict of interest.

Disclaimer

The presented method is not commercially available. Due to regulatory reasons, its future availability cannot be guaranteed. The Siemens Multitom Rax is not available in all countries, its future availability cannot be guaranteed.

References

  1. Blackwell, D.L.; Lucas, J.W.; Clarke, T.C. Summary health statistics for U.S. adults: National health interview survey, 2012. Vital Health Stat. 2014, 10, 1–161. [Google Scholar]
  2. Rosenfeld, R.M.; Andes, D.; Bhattacharyya, N.; Cheung, D.; Eisenberg, S.; Ganiats, T.G.; Gelzer, A.; Hamilos, D.; Haydon, R.C., III; Hudgins, P.A.; et al. Clinical practice guideline: Adult sinusitis. Otolaryngol. Head Neck Surg. 2007, 137, S1–S31. [Google Scholar] [CrossRef] [PubMed]
  3. Anon, J.B.; Jacobs, M.R.; Poole, M.D. Antimicrobial treatment guidelines for acute bacterial rhinosinusitis. Otolaryngol. Head Neck Surg. 2004, 130, 1–45. [Google Scholar] [PubMed]
  4. Duvoisin, B.; Landry, M.; Chapuis, L.; Krayenbuhl, M.; Schnyder, P. Low-dose CT and inflammatory disease of the paranasal sinuses. Neuroradiology 1991, 33, 403–406. [Google Scholar] [CrossRef] [PubMed]
  5. Tack, D.; Widelec, J.; De Maertelaer, V.; Bailly, J.M.; Delcour, C.; Gevenois, P.A. Comparison between low-dose and standard-dose multidetector CT in patients with suspected chronic sinusitis. Am. J. Roentgenol. 2003, 181, 939–944. [Google Scholar] [CrossRef] [PubMed]
  6. Abul-Kasim, K.; Strombeck, A.; Sahlstrand-Johnson, P. Low-dose computed tomography of the paranasal sinuses: Radiation doses and reliability analysis. Am. J. Otolaryngol. 2011, 32, 47–51. [Google Scholar] [CrossRef]
  7. Hoang, J.K.; Eastwood, J.D.; Tebbit, C.L.; Glastonbury, C.M. Multiplanar sinus CT: A systematic approach to imaging before functional endoscopic sinus surgery. Am. J. Roentgenol. 2010, 194, W527–W536. [Google Scholar] [CrossRef] [PubMed] [Green Version]
  8. Cashman, E.C.; Macmahon, P.J.; Smyth, D. Computed tomography scans of paranasal sinuses before functional endoscopic sinus surgery. World J. Radiol. 2011, 3, 199–204. [Google Scholar] [CrossRef]
  9. Ide, C.; Trigaux, J.P.; Eloy, P. Chronic sinusitis: The role of imaging. Acta Otorhinolaryngol. Belg. 1997, 51, 247–258. [Google Scholar]
  10. Konen, E.; Faibel, M.; Kleinbaum, Y.; Wolf, M.; Lusky, A.; Hoffman, C.; Eyal, A.; Tadmor, R. The value of the occipitomental (Waters’) view in diagnosis of sinusitis: A comparative study with computed tomography. Clin. Radiol. 2000, 55, 856–860. [Google Scholar] [CrossRef]
  11. Lell, M.M.; May, M.S.; Brand, M.; Eller, A.; Buder, T.; Hofmann, E.; Uder, M.; Wuest, W. Imaging the Parasinus Region with a Third-Generation Dual-Source CT and the Effect of Tin Filtration on Image Quality and Radiation Dose. Am. J. Neuroradiol. 2015, 36, 1225–1230. [Google Scholar] [CrossRef] [PubMed] [Green Version]
  12. Wuest, W.; May, M.; Saake, M.; Brand, M.; Uder, M.; Lell, M. Low-Dose CT of the Paranasal Sinuses: Minimizing X-Ray Exposure with Spectral Shaping. Eur. Radiol. 2016, 26, 4155–4161. [Google Scholar] [CrossRef] [PubMed]
  13. Miracle, A.C.; Mukherji, S.K. Conebeam CT of the head and neck, part 2: Clinical applications. Am. J. Neuroradiol. 2009, 30, 1285–1292. [Google Scholar] [CrossRef] [PubMed] [Green Version]
  14. Miracle, A.C.; Mukherji, S.K. Conebeam CT of the head and neck, part 1: Physical principles. Am. J. Neuroradiol. 2009, 30, 1088–1095. [Google Scholar] [CrossRef] [PubMed] [Green Version]
  15. Dammann, F.; Bootz, F.; Cohnen, M.; Hassfeld, S.; Tatagiba, M.; Kosling, S. Diagnostic imaging modalities in head and neck disease. Dtsch. Arztebl. Int. 2014, 111, 417–423. [Google Scholar] [CrossRef] [PubMed] [Green Version]
  16. Zoumalan, R.A.; Lebowitz, R.A.; Wang, E.; Yung, K.; Babb, J.S.; Jacobs, J.B. Flat panel cone beam computed tomography of the sinuses. Otolaryngol. Head Neck Surg. 2009, 140, 841–844. [Google Scholar] [CrossRef]
  17. Casselman, J.W.; Gieraerts, K.; Volders, D.; Delanote, J.; Mermuys, K.; De Foer, B.; Swennen, G. Cone beam CT: Non-dental applications. Jbr-Btr 2013, 96, 333–353. [Google Scholar] [CrossRef] [Green Version]
  18. Benz, R.M.; Garcia, M.A.; Amsler, F.; Voigt, J.; Fieselmann, A.; Falkowski, A.L.; Stieltjes, B.; Hirschmann, A. Initial evaluation of image performance of a 3-D X-ray system: Phantom-based comparison of 3-D tomography with conventional computed tomography. J. Med. Imaging 2018, 5, 015502. [Google Scholar] [CrossRef]
  19. Feldkamp, L.A.; Davis, L.C.; Kress, J.W. Practical cone-beam algorithm. J. Opt. Soc. Am. 1984, 1, 612–619. [Google Scholar] [CrossRef] [Green Version]
  20. Meyer, E.; Raupach, R.; Lell, M.; Schmidt, B.; Kachelriess, M. Frequency split metal artifact reduction (FSMAR) in computed tomography. Med. Phys. 2012, 39, 1904–1916. [Google Scholar] [CrossRef]
  21. Schegerer, A.A.; Loose, R.; Heuser, L.; Brix, G. Diagnostic reference levels for diagnostic and interventional X-ray procedures in Germany: Update and handling—Answer to the comments of members of the chest radiology workshop of the German Roentgen Society. Rofo 2020, 192, 83. [Google Scholar] [CrossRef] [PubMed]
  22. Benz, R.M.; Harder, D.; Amsler, F.; Voigt, J.; Fieselmann, A.; Falkowski, A.L.; Stieltjes, B.; Hirschmann, A. Initial Assessment of a Prototype 3D Cone-Beam Computed Tomography System for Imaging of the Lumbar Spine, Evaluating Human Cadaveric Specimens in the Upright Position. Investig. Radiol. 2018, 53, 714–719. [Google Scholar] [CrossRef] [PubMed]
  23. International Electrotechnical Commission. Medical Electrical Equipment—Part 2-44, Special Requirements for the Safety of X-Ray Equipment for Computed Tomography; IEC Central Office: Geneva, Switzerland, 2004. [Google Scholar]
  24. Deak, P.D.; Smal, Y.; Kalender, W.A. Multisection CT protocols: Sex- and age-specific conversion factors used to determine effective dose from dose-length product. Radiology 2010, 257, 158–166. [Google Scholar] [CrossRef] [PubMed] [Green Version]
  25. Nemtoi, A.; Czink, C.; Haba, D.; Gahleitner, A. Cone beam CT: A current overview of devices. Dentomaxillofac. Radiol. 2013, 42, 20120443. [Google Scholar] [CrossRef] [PubMed] [Green Version]
  26. Nardi, C.; Borri, C.; Regini, F.; Calistri, L.; Castellani, A.; Lorini, C.; Colagrande, S. Metal and motion artifacts by cone beam computed tomography (CBCT) in dental and maxillofacial study. Radiol. Med. 2015, 120, 618–626. [Google Scholar] [CrossRef] [PubMed]
  27. Ludlow, J.B.; Timothy, R.; Walker, C.; Hunter, R.; Benavides, E.; Samuelson, D.B.; Scheske, M.J. Effective dose of dental CBCT-a meta analysis of published data and additional data for nine CBCT units. Dentomaxillofac. Radiol. 2015, 44, 20140197. [Google Scholar] [CrossRef] [Green Version]
  28. Nardi, C.; Salerno, S.; Molteni, R.; Occhipinti, M.; Grazzini, G.; Norberti, N.; Cordopatri, C.; Colagrande, S. Radiation dose in non-dental cone beam CT applications: A systematic review. Radiol. Med. 2018, 123, 765–777. [Google Scholar] [CrossRef] [Green Version]
  29. Fakhran, S.; Alhilali, L.; Sreedher, G.; Dohatcu, A.C.; Lee, S.; Ferguson, B.; Branstetter, B.F., IV. Comparison of simulated cone beam computed tomography to conventional helical computed tomography for imaging of rhinosinusitis. Laryngoscope 2014, 124, 2002–2006. [Google Scholar] [CrossRef]
  30. Pulickal, G.G.; Navaratnam, A.V.; Nguyen, T.; Dragan, A.D.; Dziedzic, M.; Lingam, R.K. Imaging Sinonasal disease with MRI: Providing insight over and above CT. Eur. J. Radiol. 2018, 102, 157–168. [Google Scholar] [CrossRef]
  31. Luckow, M.; Deyhle, H.; Beckmann, F.; Dagassan-Berndt, D.; Muller, B. Tilting the jaw to improve the image quality or to reduce the dose in cone-beam computed tomography. Eur. J. Radiol. 2011, 80, e389–e393. [Google Scholar] [CrossRef]
  32. Spin-Neto, R.; Costa, C.; Salgado, D.M.; Zambrana, N.R.; Gotfredsen, E.; Wenzel, A. Patient movement characteristics and the impact on CBCT image quality and interpretability. Dentomaxillofac. Radiol. 2018, 47, 20170216. [Google Scholar] [CrossRef] [PubMed]
Figure 1. Comparison of datasets (121 kV/ DL 1090) without (A) and with 0.2 mm copper pre-filtration (B) Axial reconstructed images. Slice thickness 2 mm. No objectifiable difference in image quality. (C) For comparison 90 kV/DL 278.
Applsci 10 05876 g001
Figure 2. Axial slices (Scan protocol 121 kV/DL 1090), with (+) and without (−) metal artifact reduction algorithm (MAR), raw datasets. Less beam hardening artifacts visible in (A) than in (B). No miscalculation of datasets with MAR (A and C vs. B and D)
Applsci 10 05876 g002
Figure 3. Post-processed data set of a scan with 121 kV/DL 278 and pre-filtration with 0.2 mm copper, raw datasets. Higher image noise in (A) than in (B) and (C). Blurred visualisation of bony edges in (C) compared to (A) and (B). (B) was rated as the best compromise.
Applsci 10 05876 g003
Figure 4. Comparison of datasets (121 kV/DL 1090) without (A) und with 0.2 mm copper (B,C), respectively 0.3 mm copper pre-filtration (D). Despite decreasing radiation exposure, pre-filtering with copper shows no deterioration in the image quality in the head overview (A,B) or in terms of the recognisability of details (C,D).
Applsci 10 05876 g004
Figure 5. Display of image quality at 121 kV and pre-filtering of X-rays with 0.4 mm tin filter, rising dose levels from (AD). Data sets with tin pre-filtration were rated as insufficient for preoperative imaging.
Applsci 10 05876 g005
Figure 6. Difference between 121 kV/DL 278 (A,C) and 121 kV/DL 1090 (B,D). Note the better detail visibility of the bony structures in (B) (orbital floor: arrow; olfactory fossa: arrowhead) or in (D) (carotid canal: arrow).
Applsci 10 05876 g006
Table 1. Display of the minimum achieved scores of the four skulls depending on the scan protocol (mean value of both readers, stars * mark a difference in the minimum scores of the two readers). Additional information: average radiation exposure values of each protocol (DAP = Dose Area Product, CTDIvol = mean computed tomography volume index).
Scan Protocol at 121 kVMinimum Score of Each ReaderOverall Minimum ScoreAverage DAP (cGycm2)Mean CTDIvol (mGy)
DL (nGy)Pre-FiltrationSkull 1Skull 2Skull 3Skull 4
2780.2 mm Cu2222213.12.4
2780.3 mm Cu 222212.61.7
5480.2 mm Cu22/3 *22/3 *223.93.2
5480.3 mm Cu 2/3 *22/3 *221.02.8
10900.2 mm Cu3333/4 *346.55.2
10900.3 mm Cu 333/4 *340.54.7
21800.2 mm Cu343/4 *43122.08.1
21800.3 mm Cu 43/4 *43153.95.6
2780.4 mm Sn 111149.31.3
5480.4 mm Sn 111188.01.9
10900.4 mm Sn 111/2 *1214.03.2
21800.4 mm Sn 11/2 *21400.45.7

