Article

Potential Use of Near-Infrared Spectroscopy to Predict Fatty Acid Profile of Meat from Different European Autochthonous Pig Breeds

by
Alberto Ortiz
1,*,
Silvia Parrini
2,
David Tejerina
1,
José Pedro Pinto de Araújo
3,
Marjeta Čandek-Potokar
4,
Alessandro Crovetti
2,
Juan Maria Garcia-Casco
5,
Joel González
6,
Francisco Ignacio Hernández-García
7,
Danijel Karolyi
8,
Vladimir Margeta
9,
José Manuel Martins
10,
Rosa Nieto
11,
Matthias Petig
12,
Violeta Razmaite
13,
Francesco Sirtori
2,
Bénédicte Lebret
14 and
Riccardo Bozzi
2
1
Meat Quality Area, Center of Scientific and Technological Research of Extremadura (CICYTEX-La Orden), Junta de Extremadura, Guadajira, 06187 Badajoz, Spain
2
Department of Agriculture, Food, Environment and Forestry (DAGRI), 50144 Florence, Italy
3
Centro de Investigação de Montanha (CIMO), Instituto Politécnico de Viana do Castelo, Escola Superior Agrária, Refóios do Lima, 4990-706 Ponte de Lima, Portugal
4
Kmetijski Inštitut Slovenije, Hacquetova ulica 17, SI-1000 Ljubljana, Slovenia
5
Centro I+D en Cerdo Ibérico, INIA-Zafra, Ctra Ex101 km 4.7, 06300 Zafra, Spain
6
Finca Camps i Armet, 17121 Monells, Spain
7
Animal Production Área, Center of Scientific and Technological Research of Extremadura (CICYTEX-La Orden), Junta de Extremadura, Guadajira, 06187 Badajoz, Spain
8
Department of Animal Science, University of Zagreb Faculty of Agriculture, Svetosimunska cesta 25, 10000 Zagreb, Croatia
9
Department for Animal production and biotechnology, Faculty of Agrobiotechnical Sciences Osijek, Vladimira Preloga 1, HR-31000 Osijek, Croatia
10
MED-Mediterranean Institute for Agriculture, Environment and Development & Departamento de Zootecnia, Escola de Ciências e Tecnologia, Universidade de Évora, Pólo da Mitra, Ap. 94, 7006-554 Évora, Portugal
11
Department of Physiology and Biochemistry of Animal Nutrition, Estacion Experimental del Zaidin, Spanish National Research Council, CSIC, Profesor Albareda 1, 18008 Granada, Spain
12
BESH, Haller Str. 20, 74549 Wolpertshausen, Germany
13
Animal Science Institute, Lithuanian University of Health Sciences, 82317 Baisogala, Lithuania
14
PEGASE, INRAE, Institut Agro, 35590 Saint-Gilles, France
*
Author to whom correspondence should be addressed.
Appl. Sci. 2020, 10(17), 5801; https://doi.org/10.3390/app10175801
Submission received: 23 July 2020 / Revised: 18 August 2020 / Accepted: 19 August 2020 / Published: 21 August 2020
(This article belongs to the Special Issue New Frontiers in Meat Science and Technology)

Abstract

:

Featured Application

Meat and meat products from autochthonous pig breeds enjoy a worldwide prestige because of their organoleptic, health, and sensory features. Nevertheless, these autochthonous breeds are characterized by a local production mainly derived from small populations, which make the assurance of traceability and quality control technically and/or economically feasible. Thus, a collective management would make possible the development of robust near-infrared calibration models, supporting the application of this technology to the traceability and quality control of meat derived from these native breeds in an efficient, practical, and affordable way

Abstract

Autochthonous pig breeds provide products of differentiated quality, among which quality control is difficult to perform and insufficient for current market requirements. The present research evaluates the predictive ability of near-infrared (NIR) spectroscopy, combined with chemometric methods as a rapid and affordable tool to assure traceability and quality control. Thus, NIR technology was assessed for intact and minced muscle Longissimus thoracis et lumborum samples collected from 12 European autochthonous pig breeds for the quantification of lipid content and fatty acid composition. Different tests were performed using different numbers of samples for calibration and validation. The best predictive ability was found using minced presentation and set with 80% of the samples for the calibration and the remaining 20% for the external validation test for the following traits: lipid content and saturated and polyunsaturated fatty acids, which attained both the highest determination coefficients (0.89, 0.61, and 0.65, respectively) and the lowest root mean square errors in external validation (0.62, 1.82, and 1.36, respectively). Lower predictive ability was observed for intact muscles. These results could contribute to improve the management of autochthonous breeds and to ensure quality of their products by traditional meat industry chains.

Graphical Abstract

1. Introduction

The increasing consumer demand for meat products derived from autochthonous breeds reared in extensive systems may be due to the positive perception of society towards these breeds, regarding the conservation of the environment and animal welfare [1,2], as well as their high quality products in terms of organoleptic, health, and sensory features [3].
The quality of meat products from autochthonous pig breeds derives from different production factors linked to rearing areas, such as outdoor production systems and feeding regimen, mainly based on natural resources, but also from genetic backgrounds [4]. Even if autochthonous breeds are characterized by local production, mainly derived from small populations, their commercial projection should not be. An example of this possibility is the Iberian pig, an autochthonous pig breed from the southwest of the Iberian Peninsula, which is well renowned in Europe [5]. The case of the Iberian pig is not unique and other local breeds, such as Bísaro and Alentejano from Portugal, Cinta Senese from Italy, Krskopolje from Slovenia, and Turopolje from Croatia [6], are well-known for the distinguished quality of their derived products [5], even if their diffusion rarely goes beyond national borders.
Nevertheless, ensuring quality and control procedures of these products is a difficult task due to the high degree of variability resulting from all the above-mentioned production factors to which autochthonous breeds are exposed. Quality control is not only claimed by consumers [7] but is also one of the objectives of the processing industries in synergy, with the traceability protocols as part of the quality controls required for a European and international diffusion of these products [8].
Regarding the quality control of the products, the fatty acid (FA) profile has been considered a key factor, since it affects sensory attributes [9,10] as well as the technological traits of the meat intended for dry-cured products. Additionally, the prediction of fat content and fatty acid composition would allow for better control in transformation processes and formulation of pork products, ensuring technological and sensory quality, as well as an adequate shelf life. For this reason, fatty acid profile of intramuscular fat (IMF) has been the target of previous studies in Iberian [11], Gascon [12], and Cinta Senese [13] breeds. Furthermore, given both the marked adipogenic nature of the local breeds compared to the breeds selected for growth rate and leanness of the carcass and the influence of the production system on the fatty acid profile of the pig [10], the acidic profile of the IMF was used to check the traceability according to the different diets in the Iberian breed.
Classical fatty acids analysis is performed through gas chromatography, which is time-consuming and expensive and generates hazardous waste. Such conditions make the regular use in industrial plants unsuitable and not fully able to meet the demands of regional, national, and international markets. In fact, these analyses are not applied to all the processed animals, but only on a small proportion of them, as it occurs in the Iberian breed [14], making control and traceability by individual carcasses and products impossible.
In this sense, near-infrared spectroscopy (NIRS) has proven to be both rapid and effective for large-scale meat quality control [7,15,16], as well as to possess a high potential for fatty acids prediction in Iberian [14,17], Krškopolje, and Turopolje [18] breeds. Nevertheless, before using NIRS technology, a preparatory study based on extensive calibration and chemical composition data is necessary and thus the large volume of samples required to collect the full range of variability needed could make the implementation of these protocols technically and/or economically unfeasible in local breeds characterized by small effective size, and this may explain the lack of NIRS researches in most of these breeds.
Local pig breeds, being different both in terms of genetics and breeding areas, include a large degree of variability of the studied traits, which could represent an exploratory study for NIRS calibration processes [19]. At the same time, such sample variability, when well-managed, could allow the development of robust calibration methods, also in untapped pig breeds, in a practical and affordable way. The present study was carried out with this aim in the framework of the EU H2020 project TREASURE.
The industries require the application of rapid and practical technologies that operate on whole pieces, such as NIRS, for the qualitative characterization of top-quality cuts with high commercial value.
However, recent studies pointed out a lower predictive ability when data from these cuts were compared with those derived from minced samples [14,15], and, therefore, further research remains to be done.
In this framework, the current research aims to evaluate the feasibility of NIRS technology, using various chemometrical approaches for the quantification of lipid and fatty acid profiles of IMF from intact and minced loin (muscle Longissimus thoracis et lumborum) from various European autochthonous pig breeds.

2. Materials and Methods
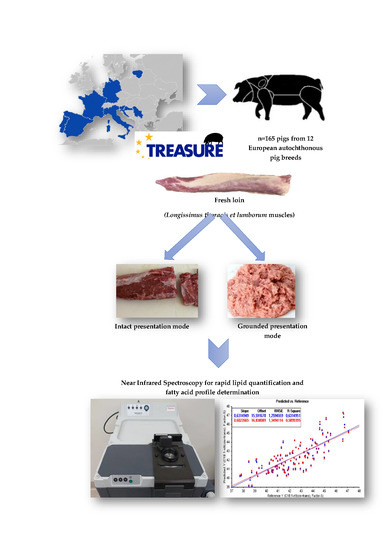
2.1. Meat Samples

A total of 165 samples of muscle Longissimus thoracis et lumborum (LTL) (from the left side of the carcasses and freed of the surrounding and intermuscular fat and connective tissue) were collected from 12 European local pig breeds related to 13 different TREASURE project partners from 8 countries (Table 1). Regarding the standards for the protection of pigs, animals were in compliance with the research ethics committee constituted at the General Assembly held in Ljubljana on 9 April 2015 (Treasure H2020, Grant Agreement Nº 634476). Subsequently, slice samples at a minimum 2.5 thickness were vacuum-packed individually and frozen at −20 °C and sent to the University of Florence for NIR spectra acquisition and fatty acid profile determination.

2.2. Spectra Acquisition

Two sample presentation modes were evaluated for the analysis of LTL samples: intact and minced muscles. In intact LTL samples, NIR spectra were collected after thawing at 4 ± 1 C for 24 h. Subsequently, an aliquot of each sample was minced in order to collect NIR spectra data in both intact and minced modes. For each scan mode (intact and minced), two aliquot samples were scanned by fourier transformation near-infrared spectroscopy (FT-NIRS). From each muscle, one minced sub-sample was collected to determine the fatty acid profile through gas chromatography.
NIR spectra were collected using the FT-NIRS Antaris II model (Thermo Scientific, Waltham, MA, USA). Samples were exposed in a circular quartz cup spinner (60 mm of diameter) for an electro-magnetic scan in the absorbance mode. Each spectral measurement was obtained from 32 scans performed at a wave number resolution of 4 cm−1 over the range of 1000 to 2500 nm and corrected against the background spectra of room environment. Absorbance data were collected as log 1/R (R: reflectance), as it results in a more linear response according to analytic concentration [20], and 3.112 data points were recorded per sample. Each intact and minced sample final spectra was obtained by averaging the performed spectra measurements to assess the potential of FT-NIRS prediction.

2.3. Reference Analysis

For each sample, IMF was extracted with chloroform/methanol (2:1, vol/vol), according to [21]. Subsequently, the fatty acid profile of total lipid was determined [22]. Fatty acid methyl esters (FAMEs) were obtained by esterification and analyzed by gas chromatography using a Varian 430 apparatus (Varian Inc., Palo Alto, CA, USA) equipped with a flame ionization detector. FA separation occurred in a Supelco Omegawax TM 320 capillary column (30 m length; 0.32 mm internal diameter; 0.25 μm film thickness; Supelco, Bellafonte, PA, USA). The chromatographic conditions were an initial temperature of 160 °C, which was then increased by 2 °C/min until reaching 220 °C. A total of 1 µL of hexane-diluted sample was injected with the carrier gas (helium) at a constant flow of 1.5 mL/min and at a split ratio of 1:20. The detector temperature was set at 260 °C. The chromatograms were recorded using computing integrator software (Galaxie Chromatography Data System 1.9.302.952; Varian Inc.). The FAs were identified by comparing the retention time of FAMEs with the standard Supelco 37-component FAME mix (Supelco) and were quantified through calibration curves using nonadecanoic acid (C19:0) (Supelco) as an internal standard. The amount of each fatty acid was calculated on the total of fatty acids detected and expressed as g/100 g of FAMEs, and the different fatty acid groups were obtained: sum of all saturated fatty acids (SFA) detected (C12:0+ C13:0 + C14:0 + C15:0 + C16:0 + C17:0 + C18:0 + C20:0 + C22:0); sum of all monounsaturated fatty acids (MUFA) detected (C14:1 n-5 + C16:1 n-9 + C16:1 n-7 + C17:1 + C18:1 n-9 + C18:1 n-7 + C20:1 n-9 + C20:1 n-7 + C22:1 n-9 + C16:4 n-1); sum of all polyunsaturated fatty acids (PUFA) detected (C18:2 n-6 + C18:3 n-4 + C18:3 n-3 + C20:2 n-6 + C20:3 n-6 + C20:4 n-6 + C20:3 n-3 + C20:5 n-3 + C22:4 n-6 + C22:5 n-3), as well as the quotient of PUFA n-6/PUFA n-3.

2.4. Chemometric Analysis

All spectra were processed by chemometric analysis using Unscrambler CAMO® software. Detection of outliers was performed by observing the spectra plot and by principal component analysis (PCA). Possible outliers were expected to show high residual values and high Hotelling’s T2 statistic values. T2 was calculated from the sample scores (samples projected in the PCA model) and indicated the variation of each sample within the model. During the elaboration of the models, outliers were identified and removed.
The cleaned data set was then randomly split into four different test sets as follows: (i) Test 1 (80–20%); (ii) Test 2 (60–40%); (iii) Test 3 (40–60%), and (iv) Test 4 (20–80%), where the first number was the percentage of samples used in the calibration tests and the second was the percentage used in the external validation tests. The external validation sets were randomly selected but guaranteed the presence of samples from all breeds.
Calibration models were built using partial least square regression (PLSR). To optimize the accuracy of calibration, several mathematical pre-treatments were applied, namely multiplicative scatter correction (MSC) and standard normal variate (SNV), with or without the de-trending (DT) option, for the correction of scatter effects in the spectra [23]. Furthermore, two derivative mathematical treatments of the log 1/R were tested in order to optimize the extraction of useful information from the spectra: Savitzky-Golay (2, 10, 9), second order derivative, 10 smoothing left side points, and 9 smoothing right side points; and Savitzky-Golay (1, 11, 15), first order derivative, 11 smoothing left side points, and 15 smoothing right side points [24]. All calibrations were evaluated in both the full NIR spectra and those reduced into specific regions for each test (1, 2, 3, and 4). Cross-validation with the leave-one-out method was performed to determine the number of factors or latent variables (LVs) in the regression models, avoiding the overfitting, and to validate the calibration model. In this cross-validation process, uncertainty (SECV) and certainty estimators or the determination coefficient (1-VR) were calculated. The predictive ability of the model was analyzed based on the highest value of the determination coefficient (1-VR) and the root mean square error of cross validation (RMSECV). The ratio between the standard deviation (SD) of the set of samples and the SECV (SD/SECV, known as the residual prediction deviation (RPD) index) and the relationship between the interval of composition of the reference data for the collective calibration (Ymax − Ymin) and the SECV, known as the range error ratio (RER) index, were calculated since they are considered as statistics indicators with the greatest weight in the precision of a NIRS calibration model [25].
For each parameter, the external validation was performed with the best fitting calibration model, and the coefficient of determination of external validation (R2v) and root mean square error of external validation (RMSEV) were reported.

3. Results

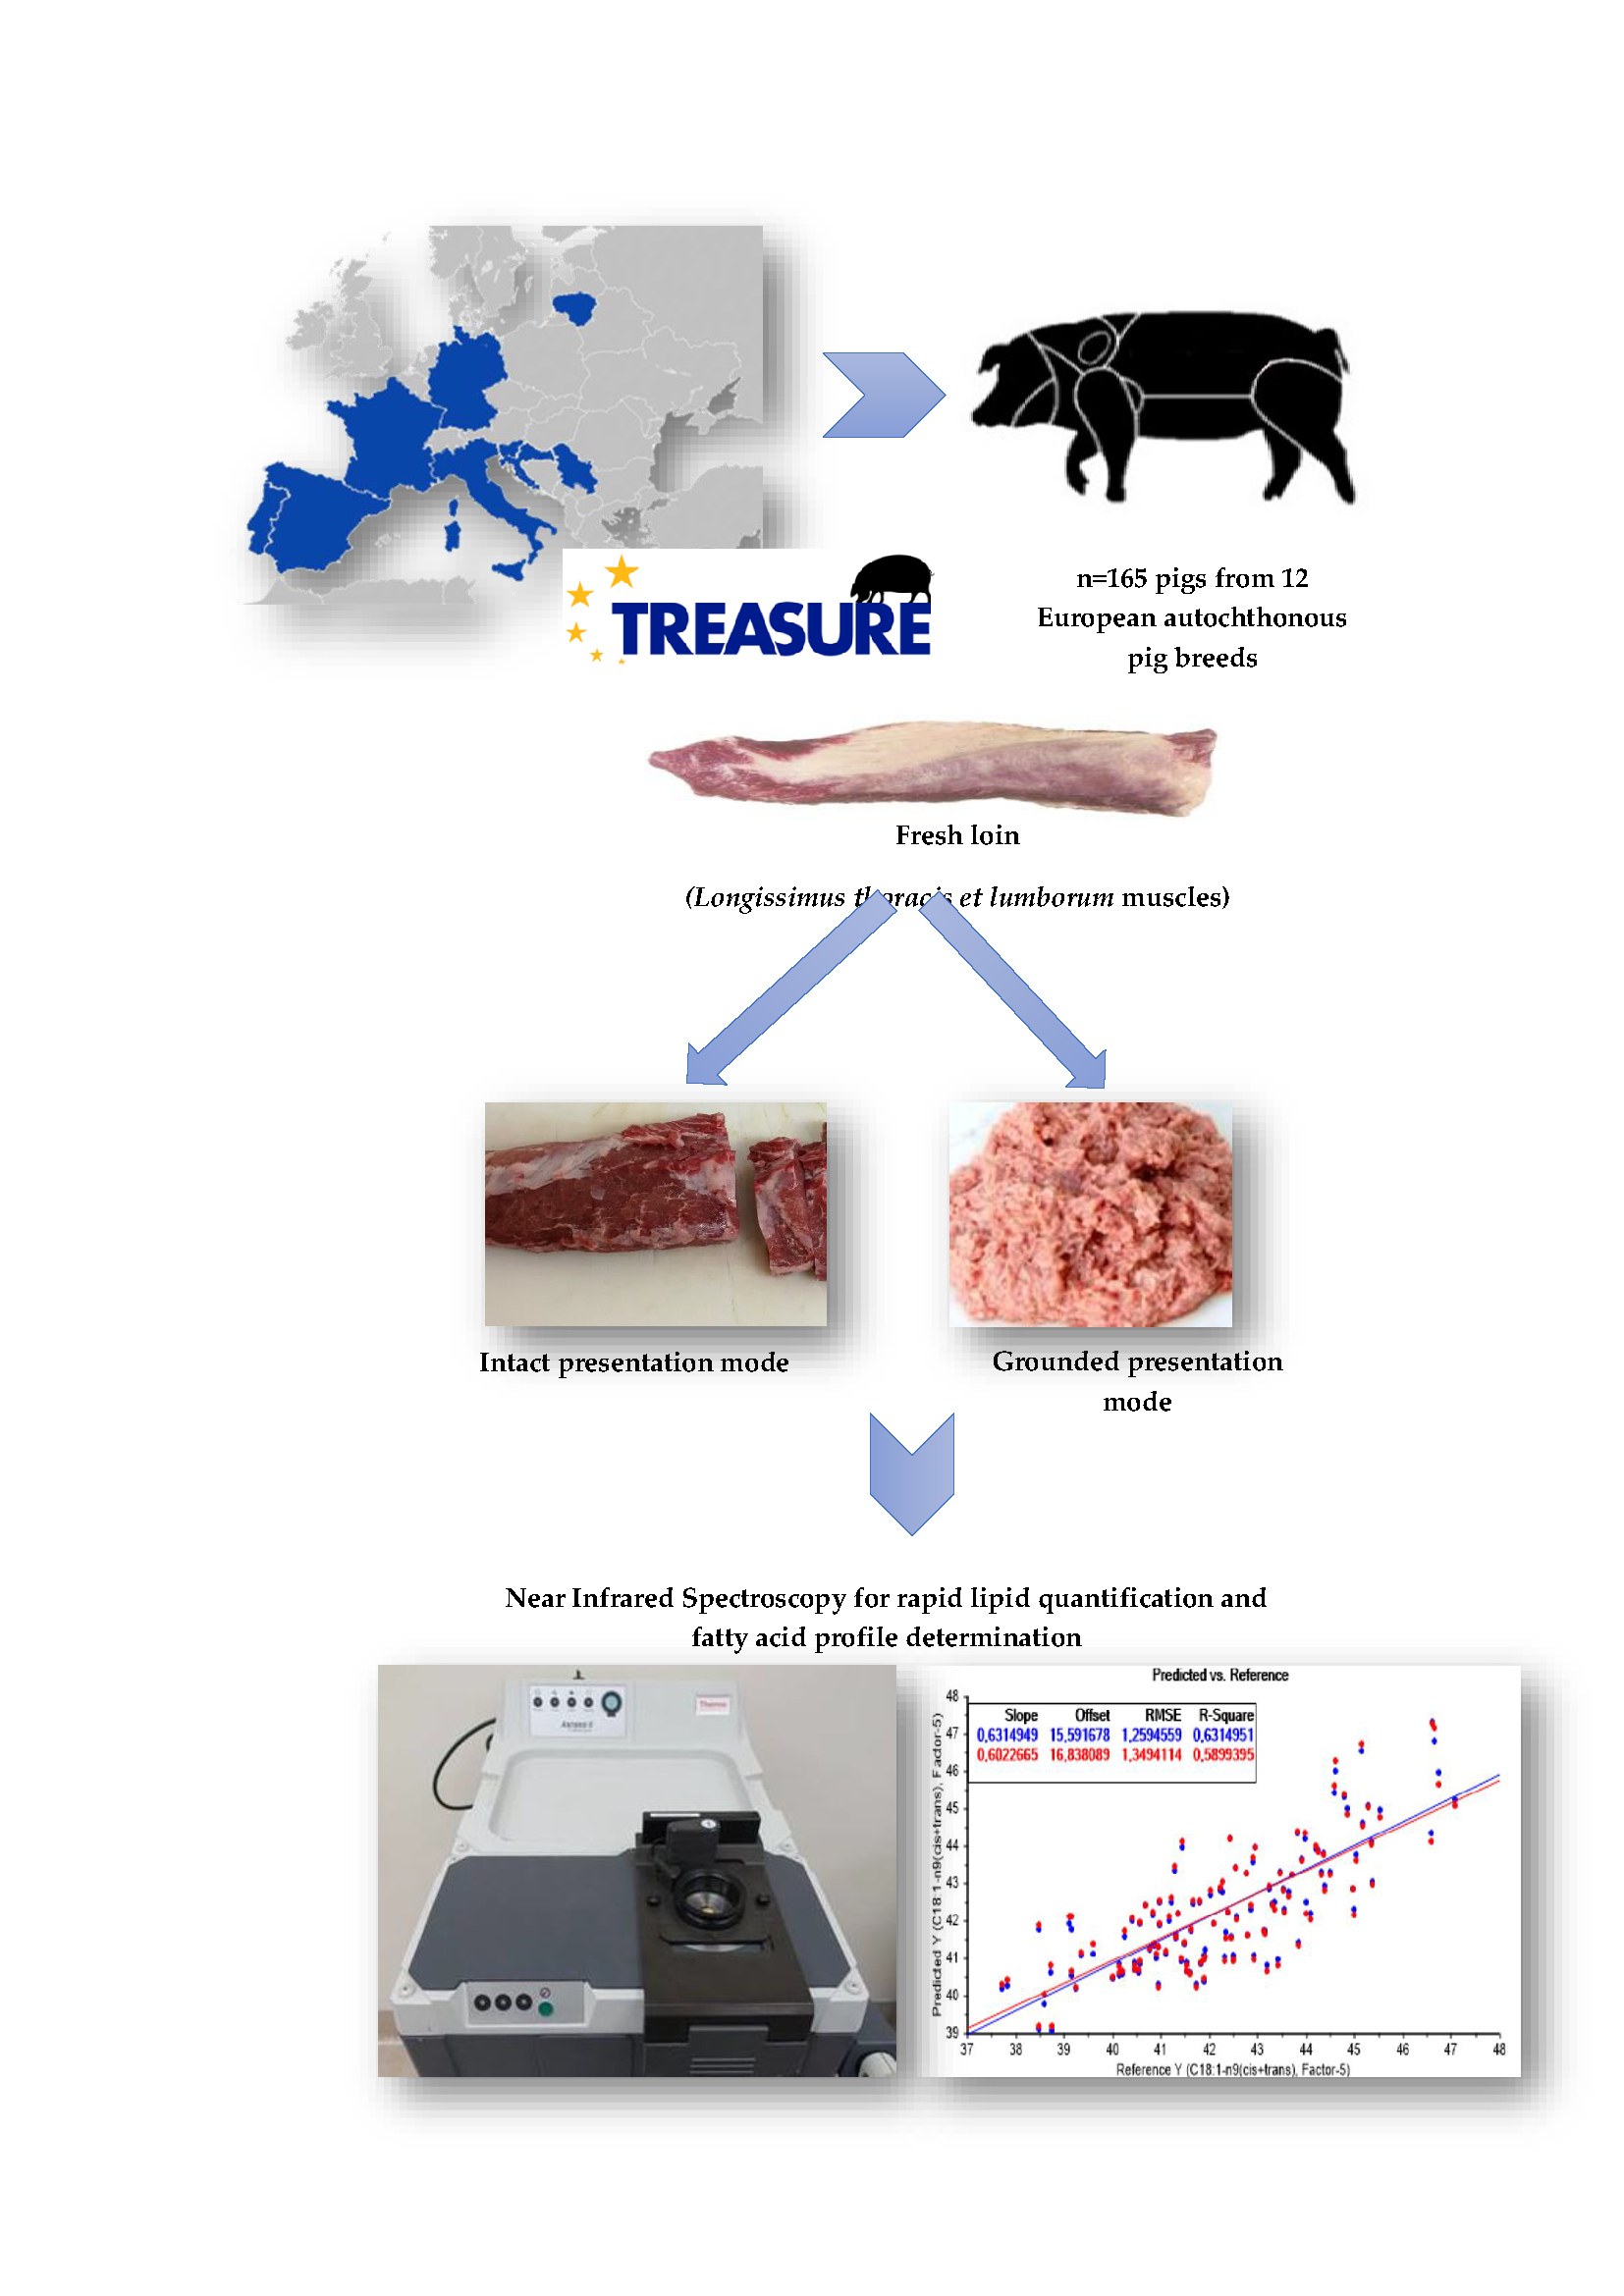
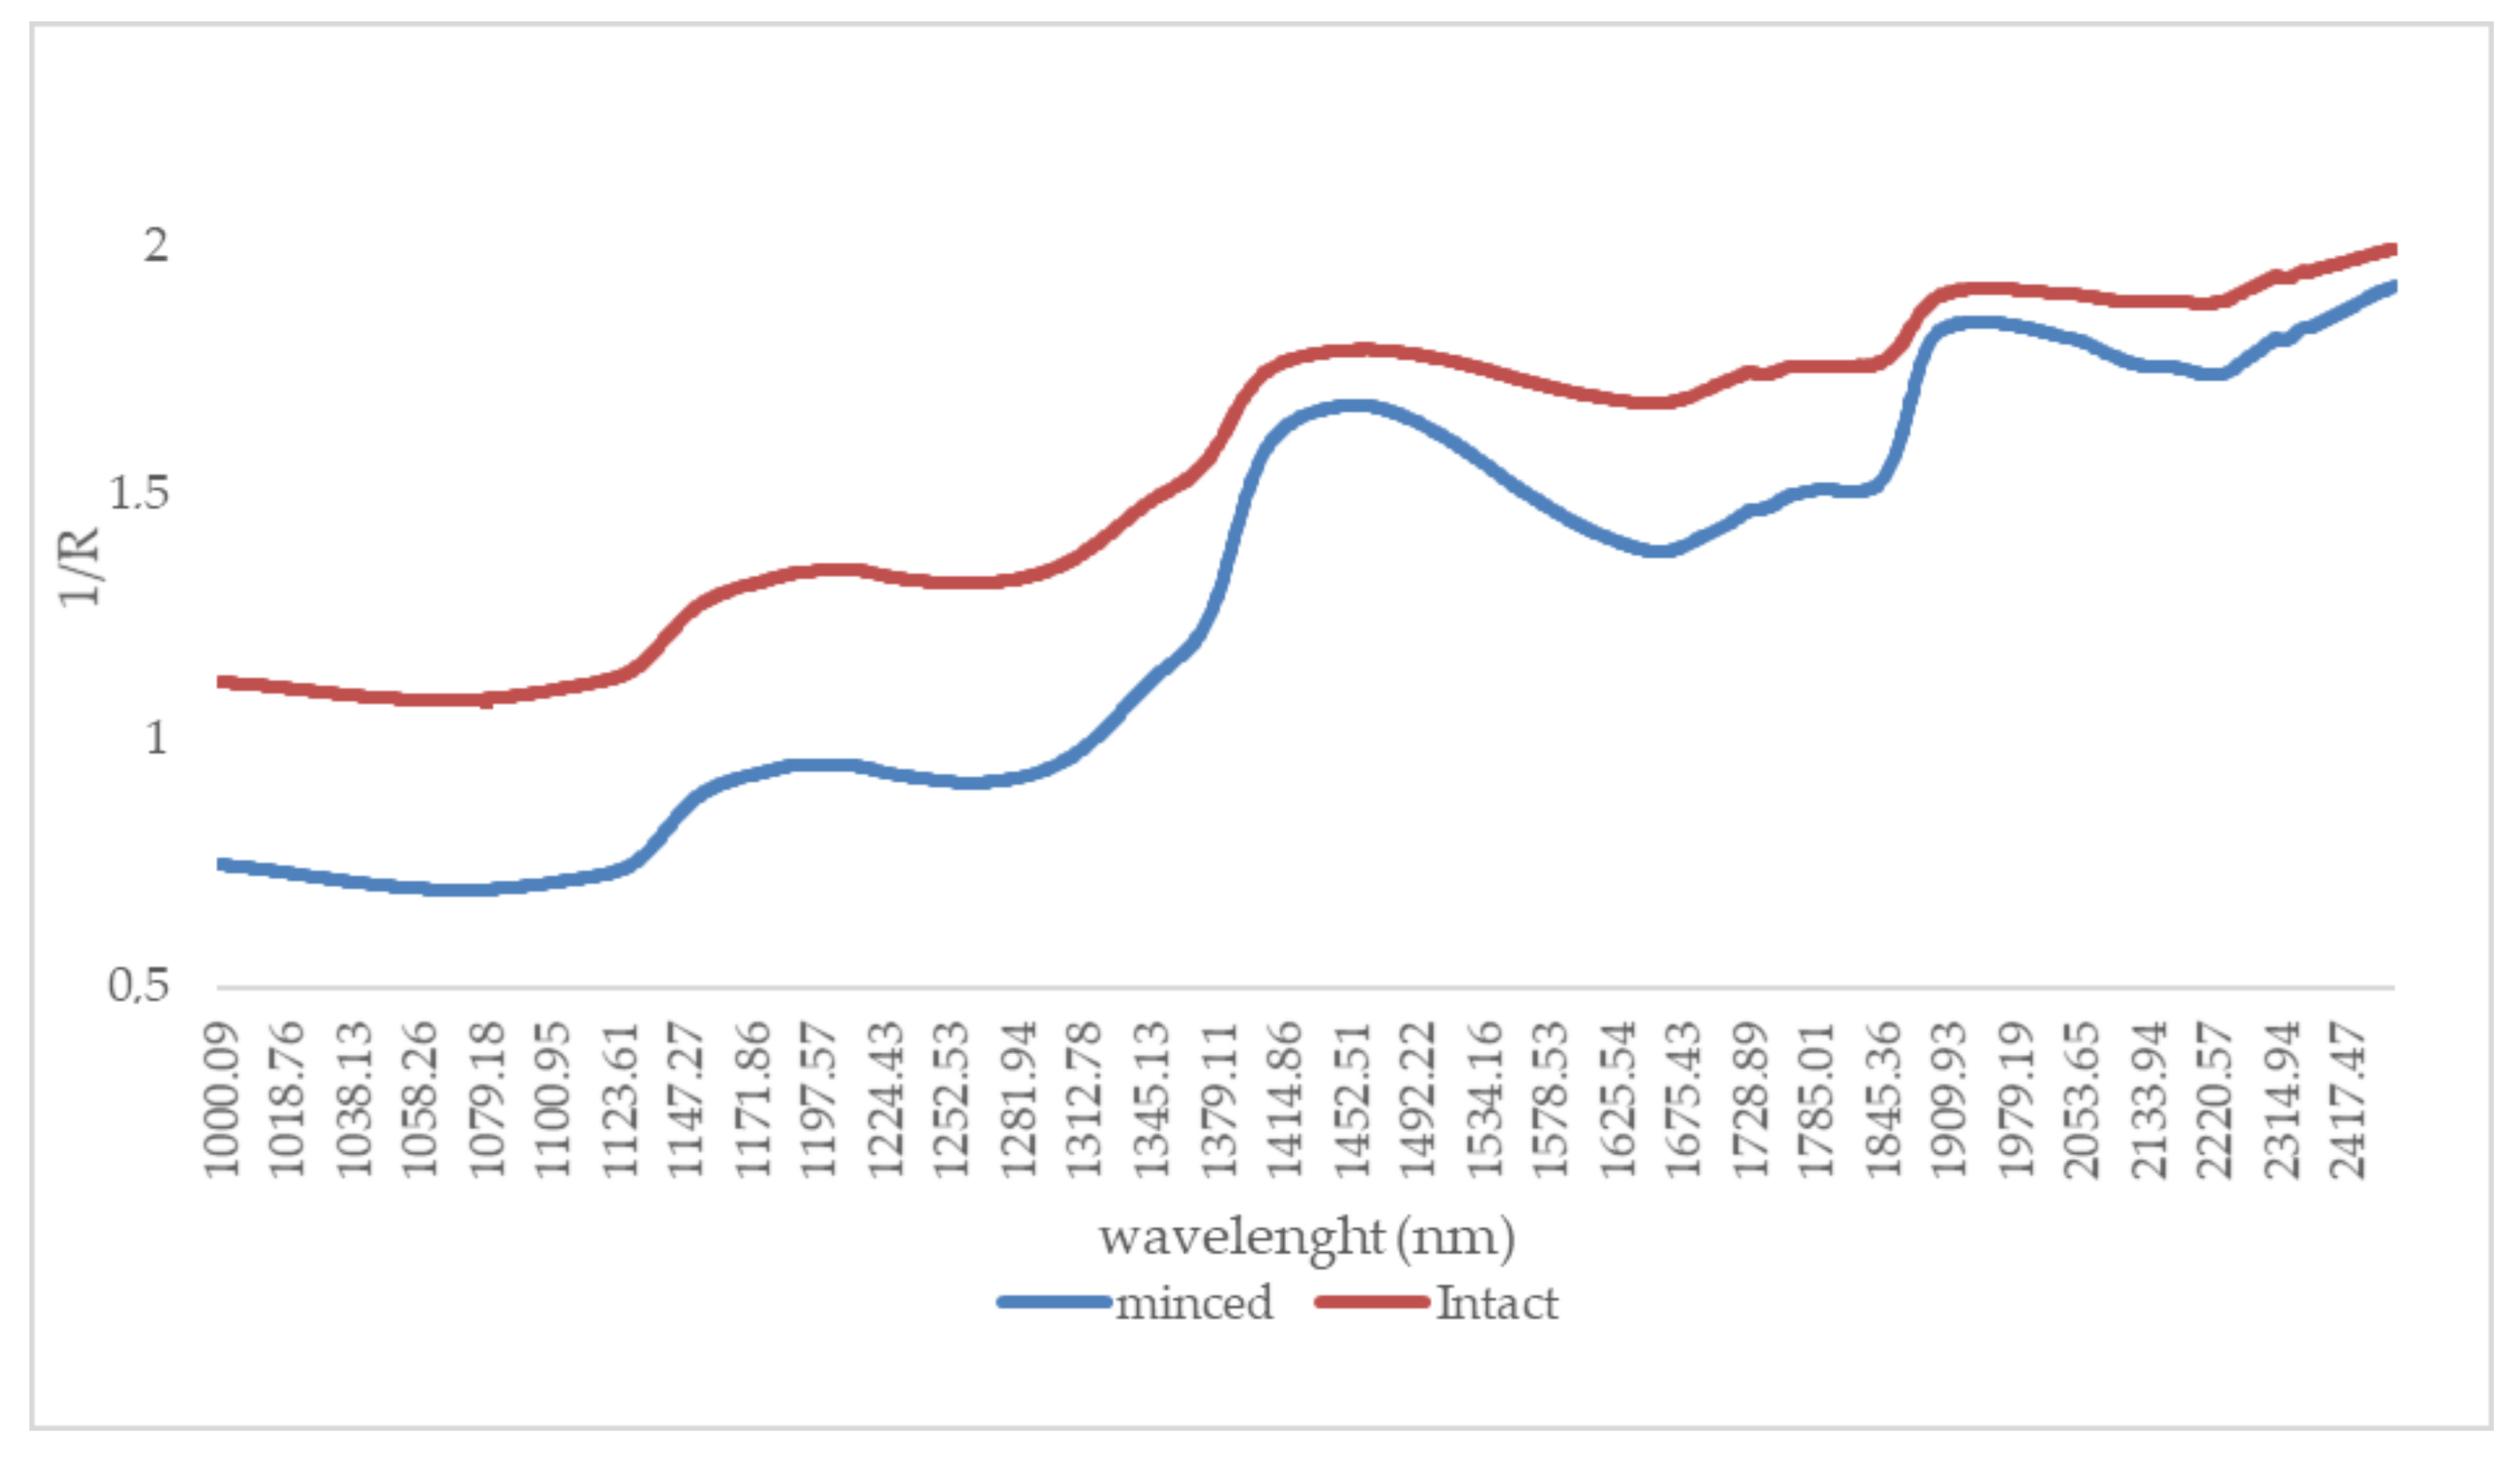
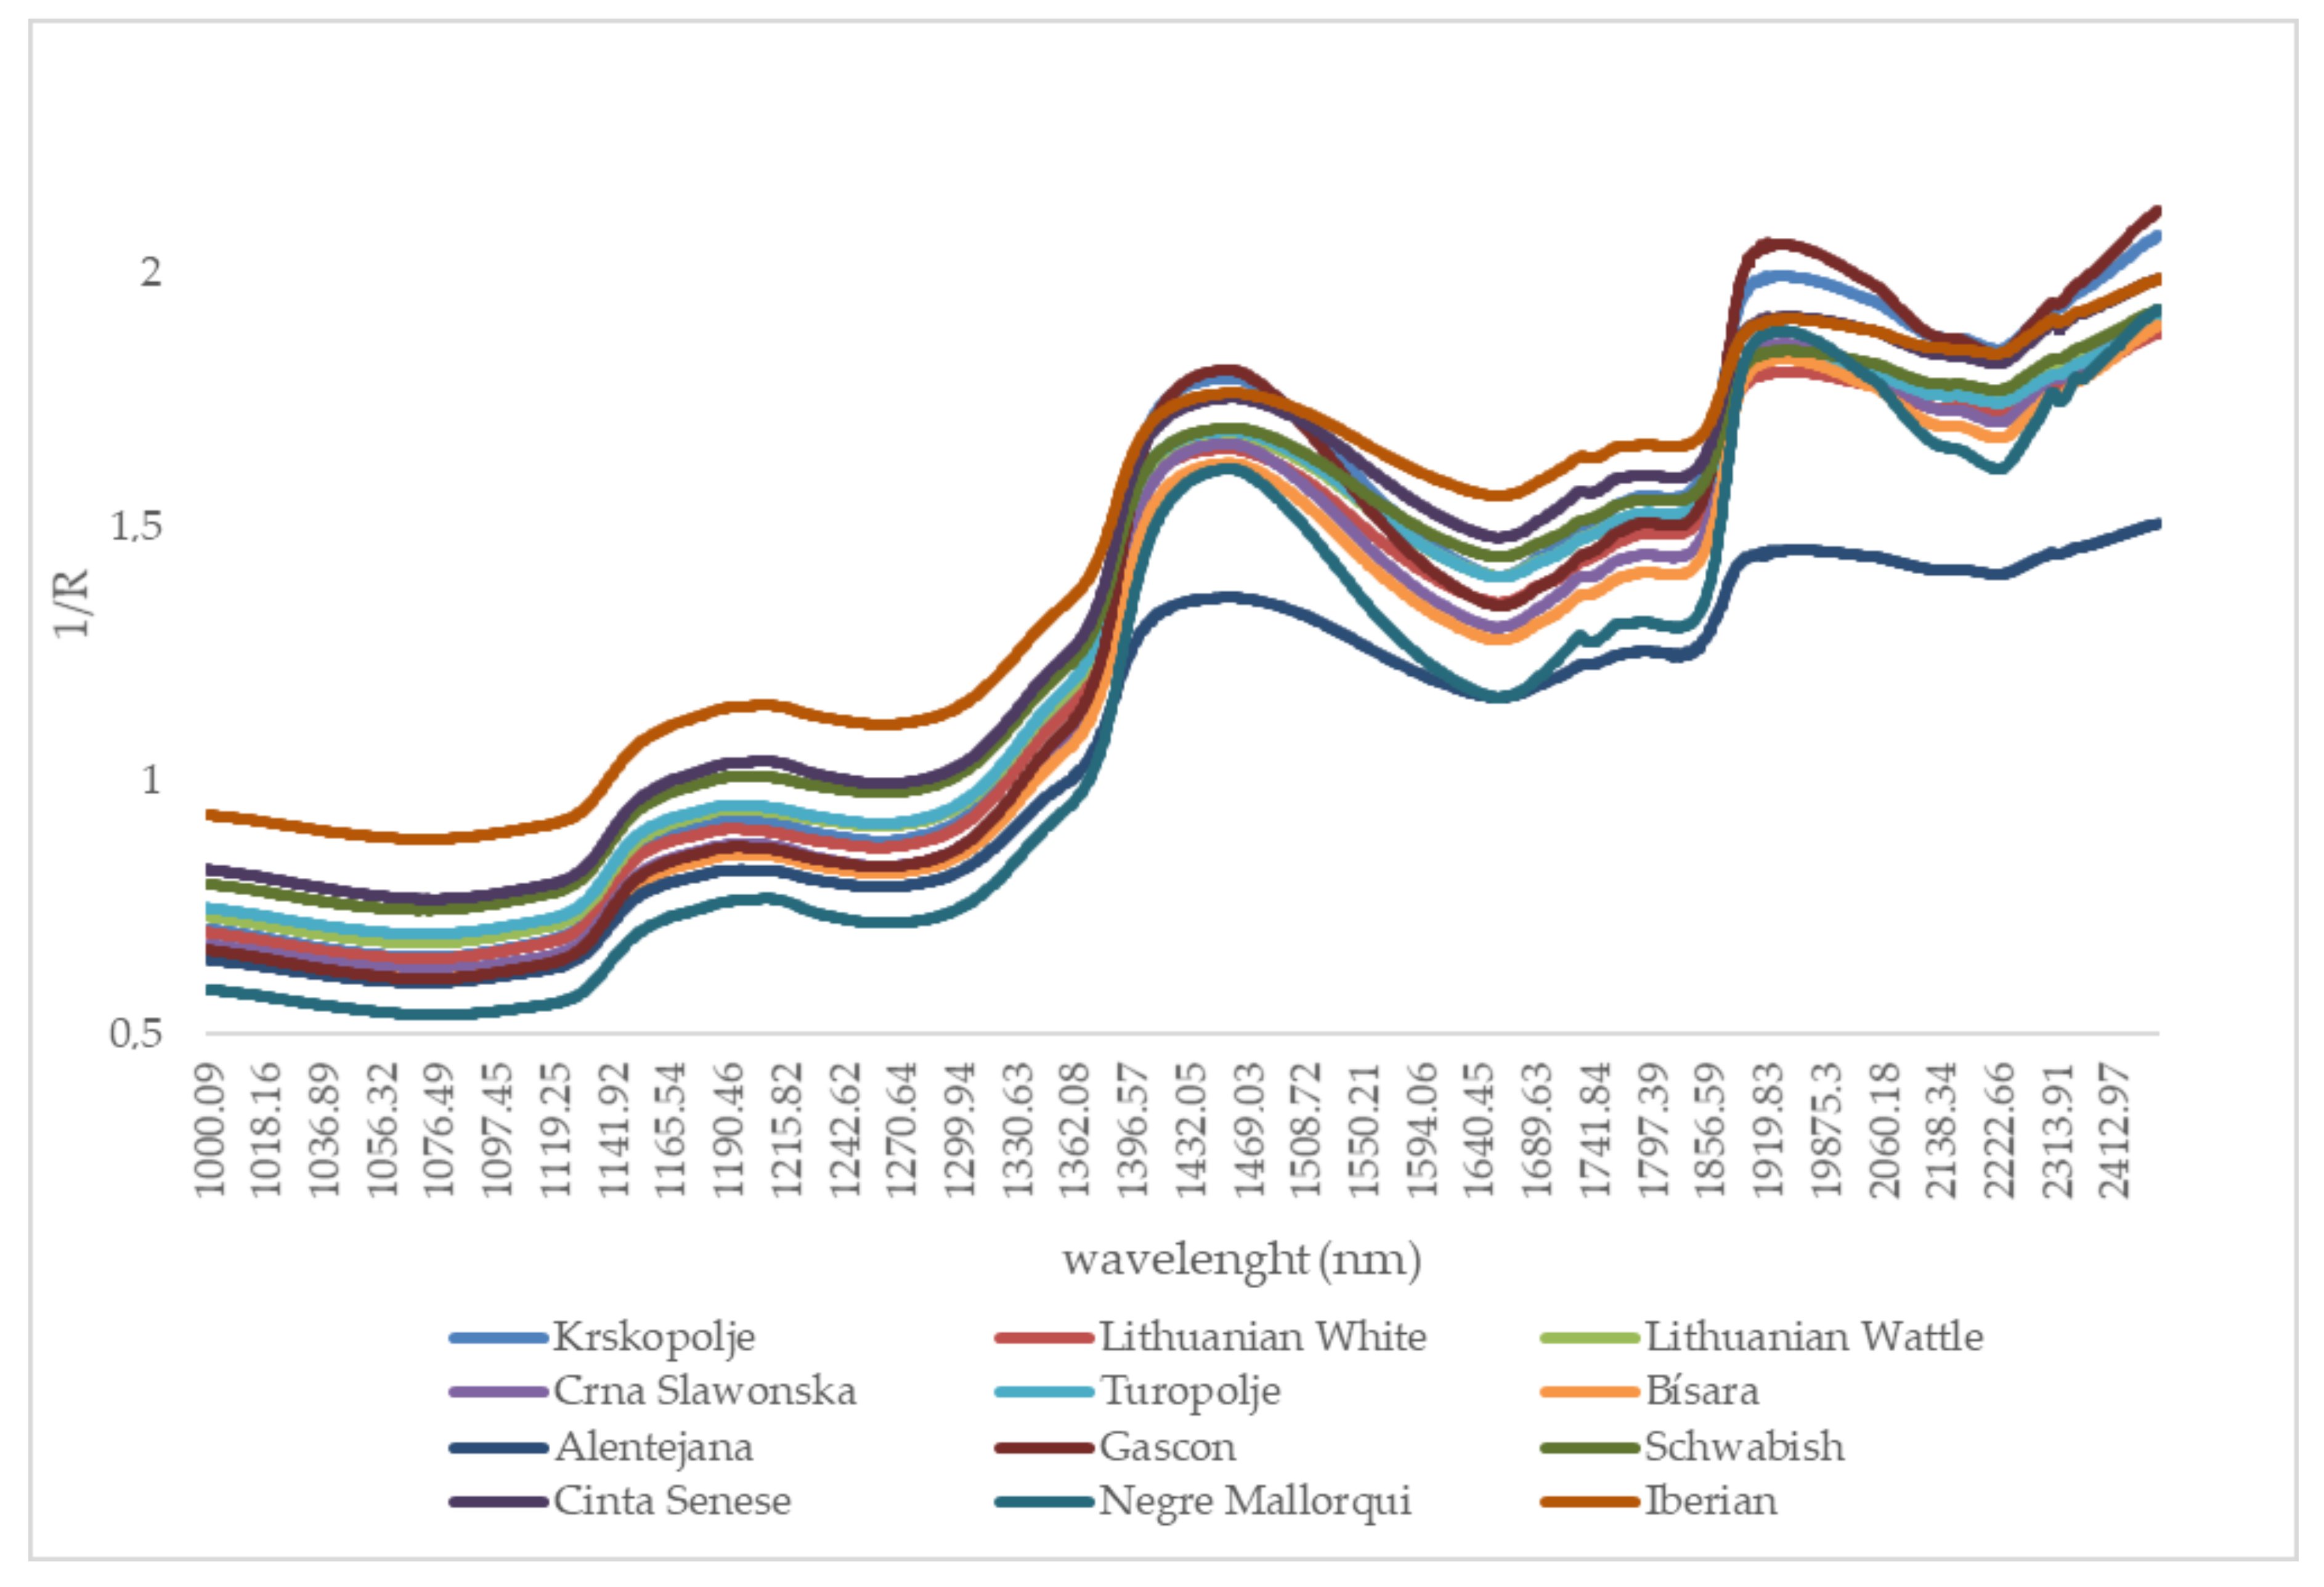
3.1. NIRS Spectral Features

Figure 1 shows the absorbance (log 1/R) mean spectra for both presentation modes for intact and minced LTL muscle. As depicted in the graph, the absorbance of intact samples is higher than that of minced samples which is in concordance with previous studies carried out in LTL muscle samples from Iberian pigs [15]. This could be explained by the loss of the meat structure, because muscle grinding can interfere with light absorbance [26]. Although NIR meat spectra determined broader peaks when compared to other agri-food products, the fat (1190 nm), protein (1500 nm), and water (1900 nm) absorptions could also be noteworthy [15,26].
Figure 2 and Figure 3 display the absorbance (log 1/R) mean spectra of intact and minced LTL samples, respectively, from the 12 autochthonous pig breeds used in this study. Most of the average spectra from both presentation modes followed similar patterns for all breeds, showing the absorbance peaks associated with the main constituents mentioned above, but also showing broader peaks in intact spectra samples. It should be highlighted that the main spectral discrepancy between intact and minced mode spectra was observed for Alentejana and, additionally, although to a lesser extent, in the Negre Mallorquí breed, for which a lower absorbance value in 1640 nm was detected (Figure 2 and Figure 3). The absorbance values of the different spectra covered a wide range, which is required to develop robust NIRS models. This variability is also reflected in the descriptive statistics of the chemical composition for intact (Table 2) and minced (Table 3) LTL samples.

3.2. Descriptive Statistics by Conventional Analysis

The lipids content and main fatty acid profile from the IMF of the 12 autochthonous breeds for intact and minced LTL muscle samples, from the test with the best fitting prediction equations (calibration and external validation statistics), are shown in Table 2 and Table 3, respectively.
The first evaluation of the descriptive statistics indicated a wide range of values in all parameters studied, probably derived from the diverse production systems and conditions of the breeds under study [5]. This variability could lead to the development of reliable and reproducible predictive models by NIRS technology.
On the other hand, both calibration and external validation sets had similar mean and standard deviation values for intact and minced samples (Table 2 and Table 3), which indicate an appropriate representation of the variability in both sets. This could lead to an increase in the effective calibration range and consequently could obtain adequate calibration statistics [17].
The major fatty acids were oleic acid (C18:1 n-9), whose values ranged from 37.67 to 47.08 g/100g FAMEs, together with palmitic acid (C16:0), whose values ranged between 20.10 and 29.34 g/100g FAMEs (Table 2 and Table 3).
In general terms, mean values of C16:0, C18:0 (stearic acid) and the saturated fatty acid (SFA) group (Table 2 and Table 3) were slightly higher than those found in the same muscle in the Iberian pig breed [10], were similar to those found in IMF from different Iberian dry-cured sausages [17], and were slightly lower than values found in fresh and seasoned fat from the Cinta Senese pig breed [27]. Additionally, similar SFA values were observed in Krškopolje and Turopolje [18] breeds.
Regarding C18:1 n-9, mean values observed (Table 2 and Table 3) were lower than those found in IMF from Iberian dry-cured sausages [17], in LTL muscle from Iberian pigs [10,28], in LTL muscle from Gascon [29], and in subcutaneous fat from Cinta Senese pigs [27]. Nevertheless, MUFA content was quite similar to the ones reported by the above-mentioned studies and also to those reported in [18].
Regarding C18:2 n-6 (linoleic acid) and C18:3 n-3 (linolenic acid), values observed in the present study were lower than those found in Iberian [17] and Cinta Senese breeds [27]. Additionally, PUFA values were lower than those reported in [18], but similar to those found in [17] and higher than values reported in [29].
However, to our knowledge, there is no scientific literature that considers such diversity of pig breeds in the development of calibration models together with different feeding regimes, interacting with factors such as genetics or age at slaughter. Only [18] evaluated some proximate composition and fatty acid groups but considered only two of the native breeds from the present study: Krškopolje and Turopolje. Subsequently, it is difficult to compare these results with those from other studies, as the former are derived from the average values of all the breeds studied.

3.3. NIRS Prediction Equations (Calibration and External Validation)

The statistics for the best calibration models for both presentation modes (intact and minced samples), obtained after testing several pre-treatment signals and spectral regions, together with different tests involving different numbers of samples for calibration and validation sets, were used for predicting the lipids content and fatty acid profile in LTL muscles from European autochthonous pig breeds and are shown in Table 4 and Table 5.

3.3.1. Lipid Content

As can be observed in Table 4 (intact) and Table 5 (minced), as it was expected, calibration and cross-validation statistics revealed a better prediction model for lipids in the minced presentation mode in comparison to the intact mode. For both intact and minced LTL, Test 1 provided better results. In fact, the coefficient of determination for cross-validation (1-VR) and root mean square error of cross validation (RMSECV) in minced samples were 0.89 and 0.66 (considering 1111–1400; 1620–1780; 2200–2400 nm wavelength regions; Table 5) whilst in the intact presentation mode, 1-VR decreased to 0.56 and RMSECV was 1.55, in this case considering the full spectral range (Table 4).
NIRS prediction models with 1-VR values higher than 0.70 indicated a good predictive ability, whilst values between 0.30 and 0.69 could only be used to separate samples with higher and lower analytical values [30]. Therefore, the model developed with minced LTL could be used to predict the total content of lipids of LTL muscle, regardless of the autochthonous breed they belong to.
On the other hand, RPDcvvalues (widely used for assessing the prediction efficiency of NIRS equations [25]) and RERcv(used to assess accuracy [31]) achieved values of 3.41 and 16.95, respectively, in minced LTL, thus indicating a reliable prediction power for the equations, according to [31,32]. The intact presentation mode, by contrast, would only allow us to classify the lipid meat content into high, low, and medium values. The lower predictive ability of intact samples, when compared to minced samples, was in agreement with scientific literature. For example, [14] obtained better calibration models after sample preparation of subcutaneous fat from Iberian breed pigs, compared to direct measurements in the carcass. The same influence of sample preparation was observed in LTL muscle from commercial pig breeds [33,34], as well as in the Iberian breed [15]. Mean values of 1-VR and RMSEC in lipids content from intact and minced LTL observed in the present study were slightly lower than those reported by [15] in LTL muscle from Iberian pigs. Again, [18] reported higher values than those reported in the present study for these parameters using the same muscle but employing only Krškopolje and Turopolje pig breeds.
After the calibration process, equations were validated with an external set of samples, as explained before, and the validation statistics for intact samples (Table 4) did not overcome the values described by [30] in terms of coefficient of determination for validation (R2v), which decreased to 0.23. Additionally, RPDvdecreased to 1.14 without achieving the minimum values suggested by [32] for a reliable quantitative model. In the minced presentation mode, Rv2 remained above 0.7 and RMSEV achieved a value of 0.62 (Table 5). RPDvreached the value of 1.91, thus showing the predictive ability of the model for the minced presentation mode. The present results are in agreement with those of [15], which reported a similar trend for the same muscle, although they obtained better statistics for the quantification in the minced presentation mode in comparison with the values observed in our study, whilst [18] did not consider an external validation. To our knowledge, there is no scientific literature on NIRS technology in other autochthonous pig breeds regarding this parameter.

3.3.2. Major Constituents

NIRS prediction equations for the main fatty acids (C16:0, C18:0, C18:1 n-9, C18:2 n-6, and C18:3 n-3) of IMF were developed using the full spectra range both in the intact and minced presentation modes (Table 4), except for C18:2 n-6 in minced meat, in which models were developed in a specific wavelength range, 1176-1333/1638-1835 nm, where the model showed the best accuracy (Table 5).
Regarding the test used to perform the calibration models, in the intact presentation mode (Table 4), Test 1 was selected for all parameters, with the exception of C18:1 n-9, where the best results were obtained in Test 3 (calibration test composed of 40% of samples and external validation test with 60%). Different tests were selected in the minced presentation mode. For C16:0, C18:1 n-9, and all fatty acid groups (SFA, MUFA, and PUFA), the best calibration was obtained using Test 1, whilst C18:2 n-6 and C18:3 n-3 were attained with Test 2 (calibration test composed of 60% of samples and external validation test with 40%). Test 3 was used for C18:0.
As previously observed in the total lipids parameter, in general, the mean values of 1-VR were lower in the intact presentation mode, reaching the lowest values for C18:0 (<0.20) and the maximum values for C18:1 n-9 (0.41) (Table 4). According to the 1-VR statistic, calibration models for C16:0, C18:1 n-9, and C18:2 n-6 could only be used to discriminate samples with high and low analytical value in the intact presentation mode (Table 4). For the other fatty acids considered (C18:0 and C18:3 n-3), the low 1-VR value makes it impossible to use the model, even for classification as high and low values in intact muscles. The lower predictive ability in intact samples has been previously described [14,15].
Contrarily, medium-high values of 1-VR were observed in the minced presentation mode, with values ranging from 0.50 to 0.83. More specifically, the equations developed for C18:2 n-6 and C18:3 n-3 exceeded the values of 0.7 for this statistic, being 0.83 and 0.73, respectively. Henceforth, the quantitative prediction of these fatty acids in the minced samples of LTL muscle could be possible. Regarding the RMSECV statistic, lower values were observed in the minced presentation mode compared to the intact mode (Table 4 and Table 5), C18:2 n-6 and C18:3 n-3 being the best performing models, since they showed an RMSECV of 0.87 and 0.06 in minced samples (Table 5), as compared to an average of 6.37 and 0.32 g/100 g FAMEs, respectively (Table 3). Regarding RPDcv and RERcv statistics in the latest parameters, although satisfactory values were observed in the minced presentation mode for C18:3 n-3, with 1.90 and 10.63, respectively, the situation was not the same for C18:2 n-6, where lower values of both statistics were observed (Table 5). For the rest of the fatty acids considered in the minced presentation mode, values of RPDcvranged from 1.37 (C18:0) to 1.67 (C18:1 n-9), whilst RERcv values ranged from 6.04 (C18:0) to 8.86 (C16:0). Therefore, with the exception of C18:3 n-3, the predictive ability of the models should be improved to overcome the limits of reliability in terms of RPD and RER [31,32].
Regarding the scientific literature, previous studies reported determination coefficients greater than 0.7 for C16:0, C18:0, C18:1 n-9, C18:2 n-6, and C18:3 n-3 in calibration models developed in LTL muscle [28] and subcutaneous backfat [35], although considering only one breed (Iberian pig). Additionally, [17] obtained higher determination coefficients for C16:0 and C18:0 in different sausages from Iberian breed pigs, although reported lower values for C18:1 n-9, C18:2 n-6, and C18:3 n-3 than those observed in the present study. Nevertheless, to the best of our knowledge, there are no studies concerning the development of quantitative NIRS calibration models in the rest of the breeds considered in this study or for different breeds considered together.
Validation using an external set of samples, as expected, showed lower values for R2v, and higher values in RMSEV were reported in intact versus minced presentation modes (Table 4 and Table 5). C16:0 and C18:0 attained the highest Rv2, with 0.66 and 0.71, and the lowest RMSEV, with 0.75 and 0.69, respectively, as well as the best RPDv (1.74 and 1.84) and RERv (8.29 and 7.52) values, respectively (Table 5). Therefore, the limits fixed by [32] and [31] to ensure the reliability of the models were exceeded. This means that the calibration model developed could be used for quantitative prediction of C16:0 and C18:0 contents. The rest of the fatty acids reached values of R2v ranging from 0.33 for C18:3 n-3 to 0.66 for C18:2 n-6 and values of RMSEV that ranged from 0.33 for C18:3 n-3 to 0.66 for C18:2 n-6 in the minced presentation mode (Table 5); therefore, they could be suitable for discriminating between high, medium, and low values, though not for their quantification.

3.3.3. Fatty Acids Groups

Regarding the models developed for the main groups of fatty acids, Test 1 was used for all groups and for both-intact and minced-presentation modes (Table 4 and Table 5). Regarding the spectrum range, the full spectrum, from 1000 to 2500 nm, was used in intact models (Table 4), whereas different ranges were used in the minced presentation mode (Table 5).
Generally, better coefficients of determination for cross-validation (1-VR) were observed in the minced presentation mode (Table 5) when compared to intact (Table 4) SFA, MUFA, and PUFA fatty acids groups. Values lower than 0.36 were observed for all fatty acids groups in intact samples, excluding PUFA n-3, which obtained a slightly higher result (0.41). In the minced presentation mode (Table 5), 1-VR coefficients were medium to high, reaching values of 0.61, 0.53, and 0.65 for SFA, MUFA, and PUFA, respectively, and values of 0.64 and 0.72 for n-6 and n-3 PUFA. These 1-VR values could have been influenced by those of their major individual fatty acids (C16:0 and C18:0 for SFA; C18:1 n-9 for MUFA and C18:2 n-6 and C18:3 n-3 for PUFA), according to data showed in Table 5. The average 1-VR values observed in the minced presentation mode were similar to those reported for sausages from Iberian breed pigs [17], but lower than those reported in the LTL muscle, also from Iberian breed pigs [28]. Better 1-VR values compared to our study were reported by [18] for the SFA, PUFA, and n-6 PUFA fatty acid groups, whereas they obtained lower accuracy for MUFA and PUFA n-3, in the same muscle but considering only Krškopolje and Turopolje breeds.
Regarding RMSECV, values in the minced presentation mode ranged from 1.24 to 1.97 for SFA and MUFA (Table 5), respectively, which were slightly higher than those reported previously [17,28]. Additionally, [18] found a lower RMSECV value for SFA, although the value observed for MUFA was higher.
In the minced presentation mode, RPDcv values ranged from 1.45 (MUFA) to 1.75 (SFA) (Table 5), the latter being the only fatty acid group that exceeded the reliable limit described by [32]. The RERcv value for SFA was quite high, at 10.43, thus pointing out the ability of the model for quantitative prediction in the minced presentation model (Table 5), whereas PUFA attained 1.69 for RPDcv and 8.43 for RERcv, which are acceptable values. RPDcv values reported in the present study were in line for SFA and slightly higher for MUFA than those reported by [18]. Although these models could allow us to discriminate between high, medium, and low values for SFA, MUFA, and PUFA [30], further studies increasing the number of samples are required to increase the data set and thereby improve the accuracy of the prediction models obtained for SFA, MUFA, and PUFA. The moderate discriminating ability of the present models is probably due to the complexity of sample types when considering different breeds, with different production and feeding systems.
When the calibration models were validated with an external set of samples, different patterns were noticed regarding the presentation mode of the samples. Surprisingly, in the intact presentation mode, there was an improvement in the determination coefficients (R2v) for MUFA and PUFA, a reduction in the RMSEV for both, and therefore an increase in the RPDv and RERv statistics (Table 4). The opposite trend was observed for SFA and MUFA in the minced presentation mode; however, PUFA obtained a higher R2v, a lower RMSEV, and a higher RPDv and RERvwhen compared to the calibration set (Table 5). In fact, the RPDv for the latter was 1.79, showing a suitable predictive reliability, according to [32].

4. Conclusions

The present research represents an exploratory study that contributes towards shedding light on the NIRS potential of the autochthonous breed sector for rapid meat quality evaluation. Greater predictive abilities for lipids and fatty acid profiles were observed for the minced LTL presentation mode when compared with those obtained on intact muscle samples. Nevertheless, the equation developed for lipids content was able to classify intact pieces into high, low, and medium values, which would allow a reliable model to make real-time decisions and would make it available for a wide variety of autochthonous breeds. Good prediction ability was obtained for some groups of fatty acids, such as SFA and PUFA, and particularly for C18:3 n-3 in minced LTL muscle. Henceforth, these prediction models could be used to assess the fatty acid profile, easing the management of autochthonous pig breeds and, therefore, allowing us to differentiate the quality of the derived products.
It is noteworthy to point out that the best prediction equations were carried out on Test 1 for most of the parameters studied, which suggests that a large set of samples is needed to perform calibration models, especially when considering different breeds with different production and feeding systems. Future efforts should focus on expanding the number of samples of each breed and assess whether the improvement of the NIRS calibration models is possible.

Author Contributions

Conceptualization, A.O., S.P., D.T., F.S., and R.B.; formal analysis, A.O., S.P. and A.C.; funding acquisition, R.B.; project administration, J.M.G.-C.; resources, J.P.P.d.A., M.Č.-P., J.M.G.-C., J.G., F.I.H.-G., D.K., V.M., J.M.M., R.N., M.P., V.R., and B.L.; validation, B.L.; writing—original draft, A.O. and S.P.; writing—review and editing, D.T., J.P.P.d.A., M.Č.-P., J.G., F.I.H.-G., D.K., V.M., J.M.M., R.N., M.P., V.R., and R.B. All authors have read and agreed to the published version of the manuscript.

Funding

This research was funded by the European Union’s Horizon 2020 research and innovation program, grant number 634476, for the project with acronym TREASURE. The content of this article reflects only the authors’ view and the European Union Agency is not responsible for any use that may be made of the information it contains.

Acknowledgments

Alberto Ortiz thanks the Junta of Extremadura and the European Social Fund for the pre-doctoral grant (PD16057) and the GR18098.

Conflicts of Interest

The authors declare no conflict of interest. The funders had no role in the design of the study; in the collection, analyses, or interpretation of data; in the writing of the manuscript, or in the decision to publish the results.

References

  1. Aparicio, M.; Vargas, J.D. Considerations on ethics and animal welfare in extensive pig production: Breeding and fattening Iberian pig. Livest. Sci. 2006, 103, 237–242. [Google Scholar] [CrossRef]
  2. Temple, D.; Manteca, X.; Velarde, A.; Dalmau, A. Assessment of animal welfare through behavioural parameters in Iberian pigs in intensive and extensive conditions. Appl. Anim. Behav. Sci. 2011, 131, 29–39. [Google Scholar] [CrossRef]
  3. Vitalea, M.; Kallas, Z.; Rivera-Toapanta, E.; Karolyi, D.; Cerjak, M.; Lebret, B.; Lenoire, H.; Pugliese, C.; Aquilani, C.; Čandek-Potokar, M.; et al. Consumers’ expectations and liking of traditional and innovative pork products from European autochthonous pig breeds. Meat Sci. 2020, 168, 108179. [Google Scholar] [CrossRef] [PubMed]
  4. Lebret, B. Effects of feeding and rearing systems on growth, carcass composition and meat quality in pigs. Animal 2008, 2, 1548–1558. [Google Scholar] [CrossRef] [Green Version]
  5. Pugliese, C.; Sirtori, F. Quality of meat and meat products produced from southern European pig breeds. Meat Sci. 2012, 90, 511–518. [Google Scholar] [CrossRef] [PubMed]
  6. Čandek-Potokar, M.; Batorek Lukač, N.; Tomažin, U.; Škrlep, M.; Nieto, R. Analytical Review of Productive Performance of Local Pig Breeds. In European Local Pig Breeds-Diversity and Performance; Candek-Potokar, M., Nieto Linan, R., Eds.; IntechOpen: London, UK, 2019. [Google Scholar]
  7. Prieto, N.; Pawluczyk, O.; Dugan, M.E.R.; Aalhus, J.L. A Review of the Principles and Applications of Near-Infrared Spectroscopy to Characterize Meat, Fat, and Meat Products. Appl. Spectrosc. 2017, 71, 1403–1426. [Google Scholar] [CrossRef] [PubMed] [Green Version]
  8. Edwards, S. Product quality attributes associated with outdoor pig production. Livest. Prod. Sci. 2005, 95, 5–14. [Google Scholar] [CrossRef]
  9. Gandemer, G. Lipids in muscle and adipose tissues, changes during processing and sensory properties of meat products. Meat Sci. 2002, 62, 309–321. [Google Scholar] [CrossRef]
  10. Tejerina, D.; García-Torres, S.; Cabeza De Vaca, M.; Vázquez, F.M.; Cava, R. Effect of production system on physical-chemical, antioxidant and fatty acids composition of Longissimus dorsi and Serratus ventralis muscles from Iberian pig. Food Chem. 2012, 133, 293–299. [Google Scholar] [CrossRef]
  11. Mayoral, A.I.; Dorado, M.; Guillén, M.T.; Robina, A.; Vivo, J.M.; Vázquez, C.; Ruiz, J. Development of meat and carcass quality characteristics in Iberian pigs reared outdoors. Meat Sci. 1999, 52, 315–324. [Google Scholar] [CrossRef]
  12. Labroue, F.; Goumy, S.; Gruand, J.; Mourot, J.; Neelz, V.; Legault, C. Comparaison au Large White de quatre races locales porcines françaises pour les performances de croissance, de carcasse et de qualité de la viande. Journées la Rech. Porc. Fr. 2000, 32, 403–411. [Google Scholar]
  13. Franci, O.; Bozzi, R.; Pugliese, C.; Acciaioli, A.; Campodoni, G.; Gandini, G. Performance of Cinta Senese pigs and their crosses with Large White. 1 Muscle and subcutaneous fat characteristics. Meat Sci. 2005, 69, 545–550. [Google Scholar] [CrossRef] [PubMed]
  14. Pérez-Marín, D.; De Pedro-Sanz, E.J.; Guerrero-Ginel, J.E.; Garrido-Varo, A. A feasibility study on the use of near-infrared spectroscopy for prediction of the fatty acid profile in live Iberian pigs and carcasses. Meat Sci. 2009, 83, 627–633. [Google Scholar] [CrossRef]
  15. Cáceres-Nevado, J.M.; Garrido-Varo, A.; De Pedro-Sanz, E.; Pérez-Marín, D.C. Fourier transform near-infrared spectroscopy coupled to a long fibre optic head for the quality control of Iberian pork loins: Intact versus minced. Meat Sci. 2019, 153, 86–93. [Google Scholar] [CrossRef]
  16. Zamora-Rojas, E.; Garrido-Varo, A.; De Pedro-Sanz, E.; Guerrero-Ginel, J.E.; Pérez-Marín, D. In-situ Iberian pig carcass classification using a micro-electro-mechanical system (MEMS)-based near infrared (NIR) spectrometer. Meat Sci. 2011, 95, 503–511. [Google Scholar] [CrossRef] [PubMed]
  17. Fernández-Cabanás, V.M.; Polvillo, O.; Rodríguez-Acuña, R.; Botella, B.; Horcada, A. Rapid determination of the fatty acid profile in pork dry-cured sausages by NIR spectroscopy. Food Chem. 2011, 124, 373–378. [Google Scholar] [CrossRef]
  18. Prevolnik-Povše, M.; Karolyi, D.; Tomažin, U.; Škrlep, M.; Pugliese, C.; Lebret, B.; Čandek-Potokar, M. Accuracy of Near Infrared Spectroscopy to Predict Quality of Pork and Pork Products Including Samples of Krškopolje and Turopolje Pigs. Agric. Conspec. Sci. 2017, 83, 205–209. [Google Scholar]
  19. Parrini, S.; Acciaioli, A.; Franci, O.; Pugliese, C.; Bozzi, R. Near Infrared Spectroscopy technology for prediction of chemical composition of natural fresh pastures. J. Appl. Anim. Res. 2019, 47, 514–520. [Google Scholar] [CrossRef]
  20. Birth, G.; Hecht, H. The Physics of Near-Infrared Reflectance. In Near Infrared Technology in the Agricultural and Food Industries; Norris, K., Williams, P., Eds.; American Association of Cereal Chemits: St. Paul, MN, USA, 1987. [Google Scholar]
  21. Folch, J.; Lees, M.; Sloane-Stanley, G.A. A simple method for the isolation and purification of total lipids from animal tissues. J. Biol. Chem. 1957, 226, 497–509. [Google Scholar]
  22. Morrison, W.R.; Smith, L.M. Preparation of fatty acid methyl esters and dimethylac-etals from lipids with boron fluoridemethanol. J. Lipid Res. 1964, 5, 600–608. [Google Scholar]
  23. Barnes, R.; Dhanoa, M.; Lister, S. Standard normal variate transformation and de-trending of near infrared diffuse reflectance spectrea. Appl. Spectrosc. 1989, 43, 772–777. [Google Scholar] [CrossRef]
  24. Shenk, J.; Westerhaus, M.; Abrams, S. Protocol for NIR calibrations: Monitoring analysis results and recalibration. In Near Infrared Spectrosctroscopy; Analysis of Forage, Quality; USDA-ARS Agric. Handbook, N 643; Martens, C., Shenk, J.S., Bart, F.E., Eds.; USDA-ARS: Washington, DC, USA, 1989; pp. 104–110. [Google Scholar]
  25. Williams, P. Implementation of near infrared technology. In Near-Infrared Technology in the Agricultural and Food Industries, 2nd ed.; Williams, P.C., Norris, K., Eds.; American Association of Cereal Chemists: St. Paul, MN, USA , 2001; pp. 145–169. [Google Scholar]
  26. Cozzolino, D.; Murray, I.; Scaife, J.; Paterson, R. Study of dissected lamb muscles by visible and near infrared reflectance spectroscopy for composition assessement. Anim. Sci. 2000, 70, 417–423. [Google Scholar] [CrossRef]
  27. Pugliese, C.; Sirtori, F.; Acciaioli, A.; Bozzi, R.; Campodoni, G.; Franci, O. Quality of fresh and seasoned fat of Cinta Senese pigs as affected by fattening with chestnut. Meat Sci. 2013, 93, 92–97. [Google Scholar] [CrossRef] [PubMed]
  28. González-Martín, I.; González-Pérez, C.; Álvarez-García, N.; González-Cabrera, J. On-line determination of fatty acid composition in intramuscular fat of iberian pork loin by NIRs with a remote reflectance fibre optic probe. Meat Sci. 2005, 69, 243–248. [Google Scholar] [CrossRef] [PubMed]
  29. Sans, P.; Andrade, M.J.; Ventanas, S.; Ruiz, J. Quality characteristics of fresh meat from pigs of Gascon breed. Food Sci. Technol. Int. 2004, 10, 29–34. [Google Scholar] [CrossRef]
  30. Shenk, J.; Westerhaus, M.O. Calibration the ISI way. In Near Infrared Spectroscopy: The Future Waves; Davies, A.M.C., Williams, P.C., Eds.; NIR Publications: Chichester, UK, 1996; pp. 198–202. [Google Scholar]
  31. Millmier, A.; Lorimor, J.; Hurburgh, J.R.; Fulhage, C.; Hattey, J.; Zhang, H. Near-infrared sensing of manure nutrients. Trans. ASAE 2000, 43, 903–908. [Google Scholar] [CrossRef]
  32. Saeys, W.; Darius, P.; Ramon, H. Potential for on-site analysis of hog manure using a visual and near infrared diode array reflectance spectrometer. J. Near Infrared Spectrosc. 2004, 12, 299–309. [Google Scholar] [CrossRef]
  33. Barlocco, N.; Vadell, A.; Ballesteros, F.; Galietta, G.; Cozzolino, D. Predicting intramuscular fat, moisture and Warner-Bratzler shear force in pork muscle using near infrared reflectance spectroscopy. Anim. Sci. 2006, 82, 111–116. [Google Scholar] [CrossRef]
  34. Fan, Y.; Liao, Y.; Cheng, F. Predicting of intramuscular fat content in pork using near infrared spectroscopy and multivariate analysis. Int. J. Food Prop. 2018, 21, 1180–1189. [Google Scholar] [CrossRef] [Green Version]
  35. Zamora-Rojas, E.; Garrido-Varo, A.; De Pedro-Sanz, E.; Guerrero-Ginel, J.E.; Pérez-Marín, D. Prediction of fatty acids content in pig adipose tissue by near infrared spectroscopy: At-line versus in-situ analysis. Meat Sci. 2013, 95, 503–511. [Google Scholar] [CrossRef]
Figure 1. Absorbance mean spectra of minced (blue) and intact (red) Longissimus thoracis et lumborum samples from the 12 breeds studied. The Y-axis values correspond to the absorbance (1/R) of the samples along the different wavelengths (from 1000 to 2500 nm) (X-axis).
Applsci 10 05801 g001
Figure 2. Absorbance mean spectra of the 12 breeds studied from intact Longissimus thoracis et lumborum muscle. The Y-axis values correspond to the absorbance (1/R) of the samples along the different wavelengths (from 1000 to 2500 nm) (X-axis).
Applsci 10 05801 g002
Figure 3. Absorbance mean spectra of the 12 breeds studied from minced Longissimus thoracis et lumborum. The Y-axis values correspond to the absorbance (1/R) of the samples along the different wavelengths (from 1000 to 2500 nm) (X-axis).
Applsci 10 05801 g003
Table 1. Number of Longissimus thoracis et lumborum samples according to pig breed.
BreedLongissimus thoracis et lumborum Samples
Alentejana10
Bísara25
Cinta Senese20
Crna Slawonska16
Gascon5
Iberian25
Krskopolje5
Lithuanian Wattle9
Lithuanian White Old type24
Negre Mallorquí5
Schwabisch Hãllisches 16
Turopolje5
Table 2. Descriptive statistics of intramuscular fat (IMF) content and fatty acid composition from intact Longissimus thoracis et lumborum samples (calibration and validation sample sets).
ParametersTestCalibrationExternal Validation
NMeanMinMaxSD NMeanMinMaxSD
IMF (g/100 g)11004.140.5612.422.33414.411.2910.432.06
fatty acid composition (g/100 g FAMEs)
C16:0110025.4920.1031.531.274125.5623.0329.331.50
C18:0 110011.598.2414.101.274111.628.9914.211.00
C18:1 n-935641.5837.6746.652.218542.3337.2748.192.28
C18:2 n-6 1856.333.1510.981.77566.742.6610.236.74
C18:3 n-311000.330.110.780.13410.300.150.680.13
SFA110043.1230.1545.632.644139.1534.2244.862.45
MUFA110052.0245.8958.762.764151.9146.1559.452.87
PUFA11009.073.4614.002.40418.904.3215.462.54
PUFA n-611008.273.2413.022.18418.193.9913.752.33
PUFA n-311000.580.251.110.21410.520.251.100.22
Test 1: Calibration test composed of 80% of samples and 20% external validation test; Test 2: Calibration test composed of 60% of samples and 40% external validation test; Test 3: Calibration test composed of 40% of samples and 60% external validation test. Values are expressed as the means ± standard error. Number of samples (N). Standard deviation (SD). Fatty acid methyl esters (FAMEs). Sum of all saturated fatty acids (SFA) detected (C12:0 + C13:0 + C14:0 + C15:0 + C16:0 + C17:0 + C18:0 + C20:0 + C22:0). Sum of all monounsaturated fatty acids (MUFA) detected (C14:1 n-5 + C16:1 n-9 + C16:1 n-7 + C17:1 + C18:1 n-9 + C18:1 n-7 + C20:1 n-9 + C20:1 n-7 + C22:1 n-9 + C16:4 n-1). Sum of all polyunsaturated fatty acids (PUFA) detected (C18:2 n-6 + C18:3 n-4 + C18:3 n-3 + C20:2 n-6 + C20:3 n-6 + C20:4 n-6 + C20:3 n-3 + C20:5 n-3 + C22:4 n-6 + C22:5 n-3).
Table 3. Descriptive statistics of intramuscular fat (IMF) content and fatty acid composition from minced Longissimus thoracis et lumborum samples (calibration and validation sample sets).
ParametersTestCalibrationExternal Validation
NMeanMinMaxSD nMeanMinMaxSD
IMF (g/100 g)11194.261.3012.422.24344.101.636.221.17
fatty acid composition (g/100 g FAMEs)
C16:0112025.4921.3629.341.373225.4523.6029.841.31
C18:036211.248.5513.981.239211.458.9914.211.28
C18:1 n-9111442.3137.7147.082.092942.4937.2745.782.51
C18:2 n-62926.372.6610.871.80626.393.6010.981.85
C18:3 n-32920.320.110.780.32620.300.150.680.12
SFA111738.8431.9044.302.173438.7835.6845.532.35
MUFA111752.3844.5658.452.883452.5346.1557.993.19
PUFA11178.623.4616.182.55328.795.2314.772.48
PUFA n-611167.873.2414.442.32318.184.5713.652.28
PUFA n-311200.550.171.110.22310.670.270.520.17
Test 1: Calibration test composed of 80% of samples and 20% external validation test; Test 2: Calibration test composed of 60% of samples and 40% external validation test; Test 3: Calibration test composed of 40% of samples and 60% external validation test. Values are expressed as the mean ± standard error. Number of samples (N). Standard deviation (SD). Fatty acid methyl esters (FAMEs). Sum of all saturated fatty acids (SFA) detected (C12:0 + C13:0 + C14:0 + C15:0 + C16:0 + C17:0 + C18:0 + C20:0 + C22:0). Sum of all monounsaturated fatty acids (MUFA) detected (C14:1 n-5 + C16:1 n-9 + C16:1 n-7 + C17:1 + C18:1 n-9 + C18:1 n-7 + C20:1 n-9 + C20:1 n-7 + C22:1 n-9 + C16:4 n-1). Sum of all polyunsaturated fatty acids (PUFA) detected (C18:2 n-6 + C18:3 n-4 + C18:3 n-3 + C20:2 n-6 + C20:3 n-6 + C20:4 n-6 + C20:3 n-3 + C20:5 n-3 + C22:4 n-6 + C22:5 n-3).
Table 4. Near-infrared spectroscopy (NIRS) predictive equations (calibration and external validation) for intramuscular fat (IMF) and fatty acid profile in intact Longissimus thoracis et lumborum muscle.
ParameterTestMath TreatmentRange (nm)LVsCalibrationCross ValidationExternal Validation
R2cRMSEC1-VRRMSECVRPDcvRERcvR2vRMSEVRPDvRERv
IMF (g/100 g)1SNV+DT1000–250020.601.470.561.551.507.720.231.791.145.08
fatty acid composition (g/100 g FAMEs)
C16:01SNV+DT + 1,11,151000–250070.601.050.351.340.950.820.261.281.174.91
C18:01-1000–2500 <0.20-<0.20---<0.20---
C18:1 n-9 3MSC+2,10,91000–250040.631.320.411.781.255.090.172.071.155.52
C18:2 n-6 1SNV+DT1000–250050.431.260.301.411.695.800.441.321.335.72
C18:3 n-31SNV+DT1000–250050.340.100.200.141.125.78<0.250.121.114.53
SFA1-1000–25001<0.20-<0.20---<0.20---
MUFA1SNV+DT + 1,11,151000–250060.432.080.292.611.054.920.551.911.496.89
PUFA1SNV+DT + 1,11,151000–250050.501.680.361.941.235.410.541.711.476.47
PUFA n-61SNV+DT + 1,11,151000–250040.561.490.331.801.205.400.551.551.496.24
PUFA n-31SNV + DT1000–2500100.470.160.410.171.285.000.220.191.164.91
Test 1: Calibration test composed of 80% of samples and 20% external validation test; Test 3: calibration test composed of 40% of samples and 60 and external validation test. Standard normal variate (SNV); de-trending (DT); multiplicative scatter correction (MSC). Latent variables (LVs) or number of partial least square (PLS) terms; coefficient of determination in calibration (R2c);, root mean square error of calibration (RMSEC); coefficient of determination in cross-validation (1-VR); root mean square error of cross validation (RMSECV); residual prediction deviation in cross validation (RPDcv); range error ratio in cross validation (RERcv); coefficient of determination of external validation (R2v); root mean square error of external validation ( RMSEV); residual prediction deviation in external validation (RPDv); range error ratio in external validation (RERv). Fatty acid methyl esters (FAMEs). Sum of all saturated fatty acids (SFA) detected (C12:0 + C13:0 + C14:0 + C15:0 + C16:0 + C17:0 + C18:0 + C20:0 + C22:0). Sum of all monounsaturated fatty acids (MUFA) detected (C14:1 n-5 + C16:1 n-9 + C16:1 n-7 + C17:1 + C18:1 n-9 + C18:1 n-7 + C20:1 n-9 + C20:1 n-7 + C22:1 n-9 + C16:4 n-1). Sum of all polyunsaturated fatty acids (PUFA) detected (C18:2 n-6 + C18:3 n-4 + C18:3 n-3 + C20:2 n-6 + C20:3 n-6 + C20:4 n-6 + C20:3 n-3 + C20:5 n-3 + C22:4 n-6 + C22:5 n-3).
Table 5. NIRS predictive equations (calibration and external validation) for intramuscular fat (IMF) and fatty acid profile in minced Longissimus thoracis et lumborum muscle.
ParameterTestMath TreatmentRange (nm) LVsCalibrationCross ValidationExternal Validation
R2cRMSEC1-VRRMSECVRPDcvRERcvR2vRMSEVRPDvRERv
IMF (g/100 g)1SNV, DT1111–1400/1620–1780/2200–240040.890.760.890.663.4116.950.710.621.917.50
fatty acid composition (g/100 g FAMEs)
C16:01SNV, DT + 2,10,91000–250070.720.730.580.901.528.860.660.751.748.29
C18:03SNV, DT + 2,10,91000–250060.710.660.500.891.376.040.710.691.847.52
C18:1 n-91MSC + 2,10,91000–250070.641.250.591.341.676.950.461.811.374.64
C18:2 n-62SNV, DT1176–1333/1638–183560.780.830.830.870.631.100.661.071.716.80
C18:3 n-32MSC1000–250060.820.050.730.061.9010.630.330.101.265.58
SFA1MSC + 2,10,91000–250090.791.000.611.241.7510.430.391.821.285.36
MUFA1SNV, DT + 1,11,154596–940050.601.830.531.971.457.010.392.451.294.77
PUFA1SNV, DT + 1,11,151176–1333/1638–183590.771.210.651.501.698.430.691.361.796.89
PUFA n-61SNV, DT + 1,11,151176–1333/1638–1835110.791.060.641.421.437.870.671.291.746.93
PUFA n-31SNV, DT + 1,11,151000–2500100.800.100.720.121.867.970.670.101.756.29
Test 1: Calibration test composed of 80% of samples and 20% external validation test; Test 2: Calibration test composed of 60% of samples and 40% external validation test; Test 3: Calibration test composed of 40% of samples and 60% external validation test. Standard normal variate (SNV); de-trending (DT); multiplicative scatter correction (MSC). Latent variables (LVs) or number of partial least square (PLS) terms; coefficient of determination in calibration (R2c);, root mean square error of calibration (RMSEC); coefficient of determination in cross-validation (1-VR); root mean square error of cross validation (RMSECV); residual prediction deviation in cross validation (RPDcv); range error ratio in cross validation (RERcv); coefficient of determination of external validation (R2v); root mean square error of external validation ( RMSEV); residual prediction deviation in external validation (RPDv); range error ratio in external validation (RERv). Fatty acid methyl esters (FAMEs). Sum of all saturated fatty acids (SFA) detected (C12:0 + C13:0 + C14:0 + C15:0 + C16:0 + C17:0 + C18:0 + C20:0 + C22:0). Sum of all monounsaturated fatty acids (MUFA) detected (C14:1 n-5 + C16:1 n-9 + C16:1 n-7 + C17:1 + C18:1 n-9 + C18:1 n-7 + C20:1 n-9 + C20:1 n-7 + C22:1 n-9 + C16:4 n-1). Sum of all polyunsaturated fatty acids (PUFA) detected (C18:2 n-6 + C18:3 n-4 + C18:3 n-3 + C20:2 n-6 + C20:3 n-6 + C20:4 n-6 + C20:3 n-3 + C20:5 n-3 + C22:4 n-6 + C22:5 n-3).

