Article

Luteinizing Hormone-Releasing Hormone (LHRH) Conjugated Magnetite Nanoparticles as MRI Contrast Agents for Breast Cancer Imaging

1
Department of Mechanical and Aerospace Engineering, Princeton University, Olden Street, Princeton, NJ 08544, USA
2
Princeton Institute of Science and Technology of Materials (PRISM), Princeton University, 70 Prospect Street, Princeton, NJ 08544, USA
3
Department of Mechanical Engineering, Higgins Lab, Worcester Polytechnic Institute (WPI), 100 Institute Road, Worcester, MA 01609, USA
4
Molecular Imaging Center, Rutgers University, 41 Gordon Road, Piscataway, NJ 08854, USA
*
Author to whom correspondence should be addressed.
Appl. Sci. 2020, 10(15), 5175; https://doi.org/10.3390/app10155175
Submission received: 2 July 2020 / Revised: 23 July 2020 / Accepted: 24 July 2020 / Published: 28 July 2020
(This article belongs to the Special Issue Nanoparticles for Diagnosis and Therapies)

Abstract

:
Targeted magnetic resonance imaging (MRI) contrast agents offer platforms for the specific detection of many diseases, including cancer. This study explores the applicability of luteinizing hormone-releasing hormone-conjugated PEG-coated magnetite nanoparticles (LHRH-MNPs) to the enhancement of triple negative breast cancer (TNBC) detection. In vitro MRI studies were first performed, showing the consistent darkening effect of both MNPs and LHRH-MNPs in T2-weighted maps. Using a mouse model with an induced subcutaneous tumor, MNPs and LHRH-MNPs were injected into xenograft MDA-MB-231. This was done through intratumoral and intravenous injections, respectively, enabling direction comparisons of the two nanoparticles. Intratumorally injected LHRH-MNPs maintained T2 signals within the breast tumors up to two weeks, revealing long-term tumor enhancement ability, while the signal started to recover towards the contrast of the original tumor before injection in the case of MNPs at 24 h post injection. For intravenous administration, LHRH-MNPs continued to darken breast tumor 24 h following injection, whereas contrast enhancement was not obvious in animals injected with MNPs. These results show the potential of LHRH-MNPs as negative contrast agents for the specific detection of TNBC.

1. Introduction

Triple negative breast cancers (TNBC) are high-risk and highly aggressive metastatic types of malignancies [1,2]. TNBC is so called due to the absence of expression of estrogen receptors (ER), progesterone-receptors (PR) and human epidermal growth factor receptor 2 (HER2) [1]. TNBC not responsive to established hormone therapies and anti-HER2 therapy that are designed to target ER, PR or HER2 receptors [1]. Therefore, in addition to surgical resection, TNBC is usually treated with radiotherapy or chemotherapy, or a combination of both, which are non-targeted treatments associated with short- and long-term side effects [3,4,5]. Due to the lack of tumor-specific predictive biomarkers [2], TNBC has overall poorer prognosis and clinical outcomes compared to other breast cancer subtypes, and is also associated with limited treatment options [6]. Among the subtypes of breast cancers, TNBC accounts for approximately 15% of all breast cancers but is associated with disproportionate high rates of recurrence and mortality [3,7]. Patients diagnosed with metastatic TNBC were shown to have a median survival of approximately 13 months [8]. Furthermore, the limitations and misinterpretations in current breast cancer screening techniques also lead to the delay of prognosis of TNBC. For example, TNBC is likely to exhibit benign morphological features in ultrasound (US) imaging and mammography [9]. On the other hand, magnetic resonance imaging (MRI) is shown with the ability to detect suspicious features of the TNBC tumors which are interpreted as benign masses by conventional radiological imaging [9,10]. Therefore, improved screening and imaging methodologies are clearly needed in the diagnostic screening and disease monitoring in TNBC to facilitate treatment efficacy [11].
As one of the widely used imaging modalities in breast cancer management, MRI is a non-invasive medical imaging technique that does not use ionizing radiation [12,13]. MRI signal is related to the differences in the magnetic moments of the protons (in water molecules) in their excited and relaxed states in the area of interest [14]. As the human body is largely composed of water, when within in a magnetic field, the protons have their magnetic moments aligned initially to the direction of the applied external magnetic field [15]. When an RF electromagnetic field is applied, their magnetic moments change [15]. Upon the removal of the RF signal, the magnetic moments of the protons gradually return to their original states [16]. The recovery process is characterized by two relaxation mechanisms, the spin-lattice relaxation process T1 (longitudinal relaxation) and the spin-spin T2 (transverse relaxation). Since the relaxation times (T1 and T2) of the protons in different tissues differ, the structures of “normal” and “diseased” tissues can, therefore, be distinguished [14,17].
To further improve MRI sensitivity and analysis of specific anatomical sites, magnetite nanoparticles have been developed and used as contrast agents to generate anatomical and functional MR images for pathophysiological information [14]. These materials are exceptional candidates as contrast agents in MRI due to the combined advantages of their magnetic properties, biocompatibility, and applicability to in vivo studies [14,17,18]. When magnetite nanoparticles are introduced into the body, they generate an additional magnetic field (under externally applied magnetic field, i.e., by MRI) that affects those of the nearby hydrogen protons [14]. The combined magnetic moments lead to a reduced relaxation time of protons in the vicinity [17]. Magnetite nanoparticles mainly shorten the T2 relaxation times of the tissues in which they accumulate and generate negative contrast (darkening) on T2 weighted images that are often used for the enhanced visualization and the detection of diseased tissues [14]. Therefore, by coupling tumor specific molecular recognition units to magnetite nanoparticles, the newly created nanocarriers can be directed to attach specifically to tumor sites, where they can enhance MRI contrast, and potentially enable the early detection of cancer [17,19,20].
The receptor for luteinizing hormone-releasing hormone (LHRH) has been shown to be expressed in over 50% of TNBC, and can be used for the specific targeting of receptors on the surfaces of TNBC [21,22,23]. On the design of LHRH-specific targets for TNBC, efforts have been made to engineer LHRH-conjugated magnetite nanoparticles as MRI contrast agents, aiming for specific signal enhancement of the lesion for the early detection of TNBC [24,25,26,27]. Prior work by Meng et al. [24] demonstrated that LHRH-conjugated bare superparamagnetic iron oxide nanoparticles brighten excised breast tumors in vitro in T2-weighted MR imaging. However, bare magnetite nanoparticles without protective surface coatings tend to aggregate and are subjected to rapid clearing from the body by the reticuloendothelial system (RES) [17]. Hence, in an effort to achieve nanoparticle monodispersity, and to extend the circulation time of nanoparticles in vivo, polyethylene glycol (PEG) coated magnetite nanoparticles (MNPs) and LHRH conjugated MNPs (LHRH-MNPs) were formulated [25,26]. The specific adhesion and enhanced cellular uptake between LHRH-MNPs and TNBC cells have also been demonstrated under in vitro conditions. However, in vivo applications of coated LHRH-MNPs have not been demonstrated in the enhancement of MRI contrast using subcutaneous xenograft tumor models. Such demonstration is important, since it is known that the use of inert coatings can significantly enhance or reduce the nanoparticle magnetization [28].
Hence, in this study, we explore the effectiveness of MNPs and LHRH-MNPs as MRI contrast agents for the specific imaging of TNBC through in vitro and in vivo experiments. To investigate the specificity of LHRH targeting in vivo, MRI images of mice bearing MDA-MB-231 xenograft tumors were obtained before and after intratumoral and intravenous injections of MNPs or LHRH-MNPs. The implications of the results are discussed for the use of LHRH-MNPs in the detection and treatment of TNBC.

2. Materials and Methods

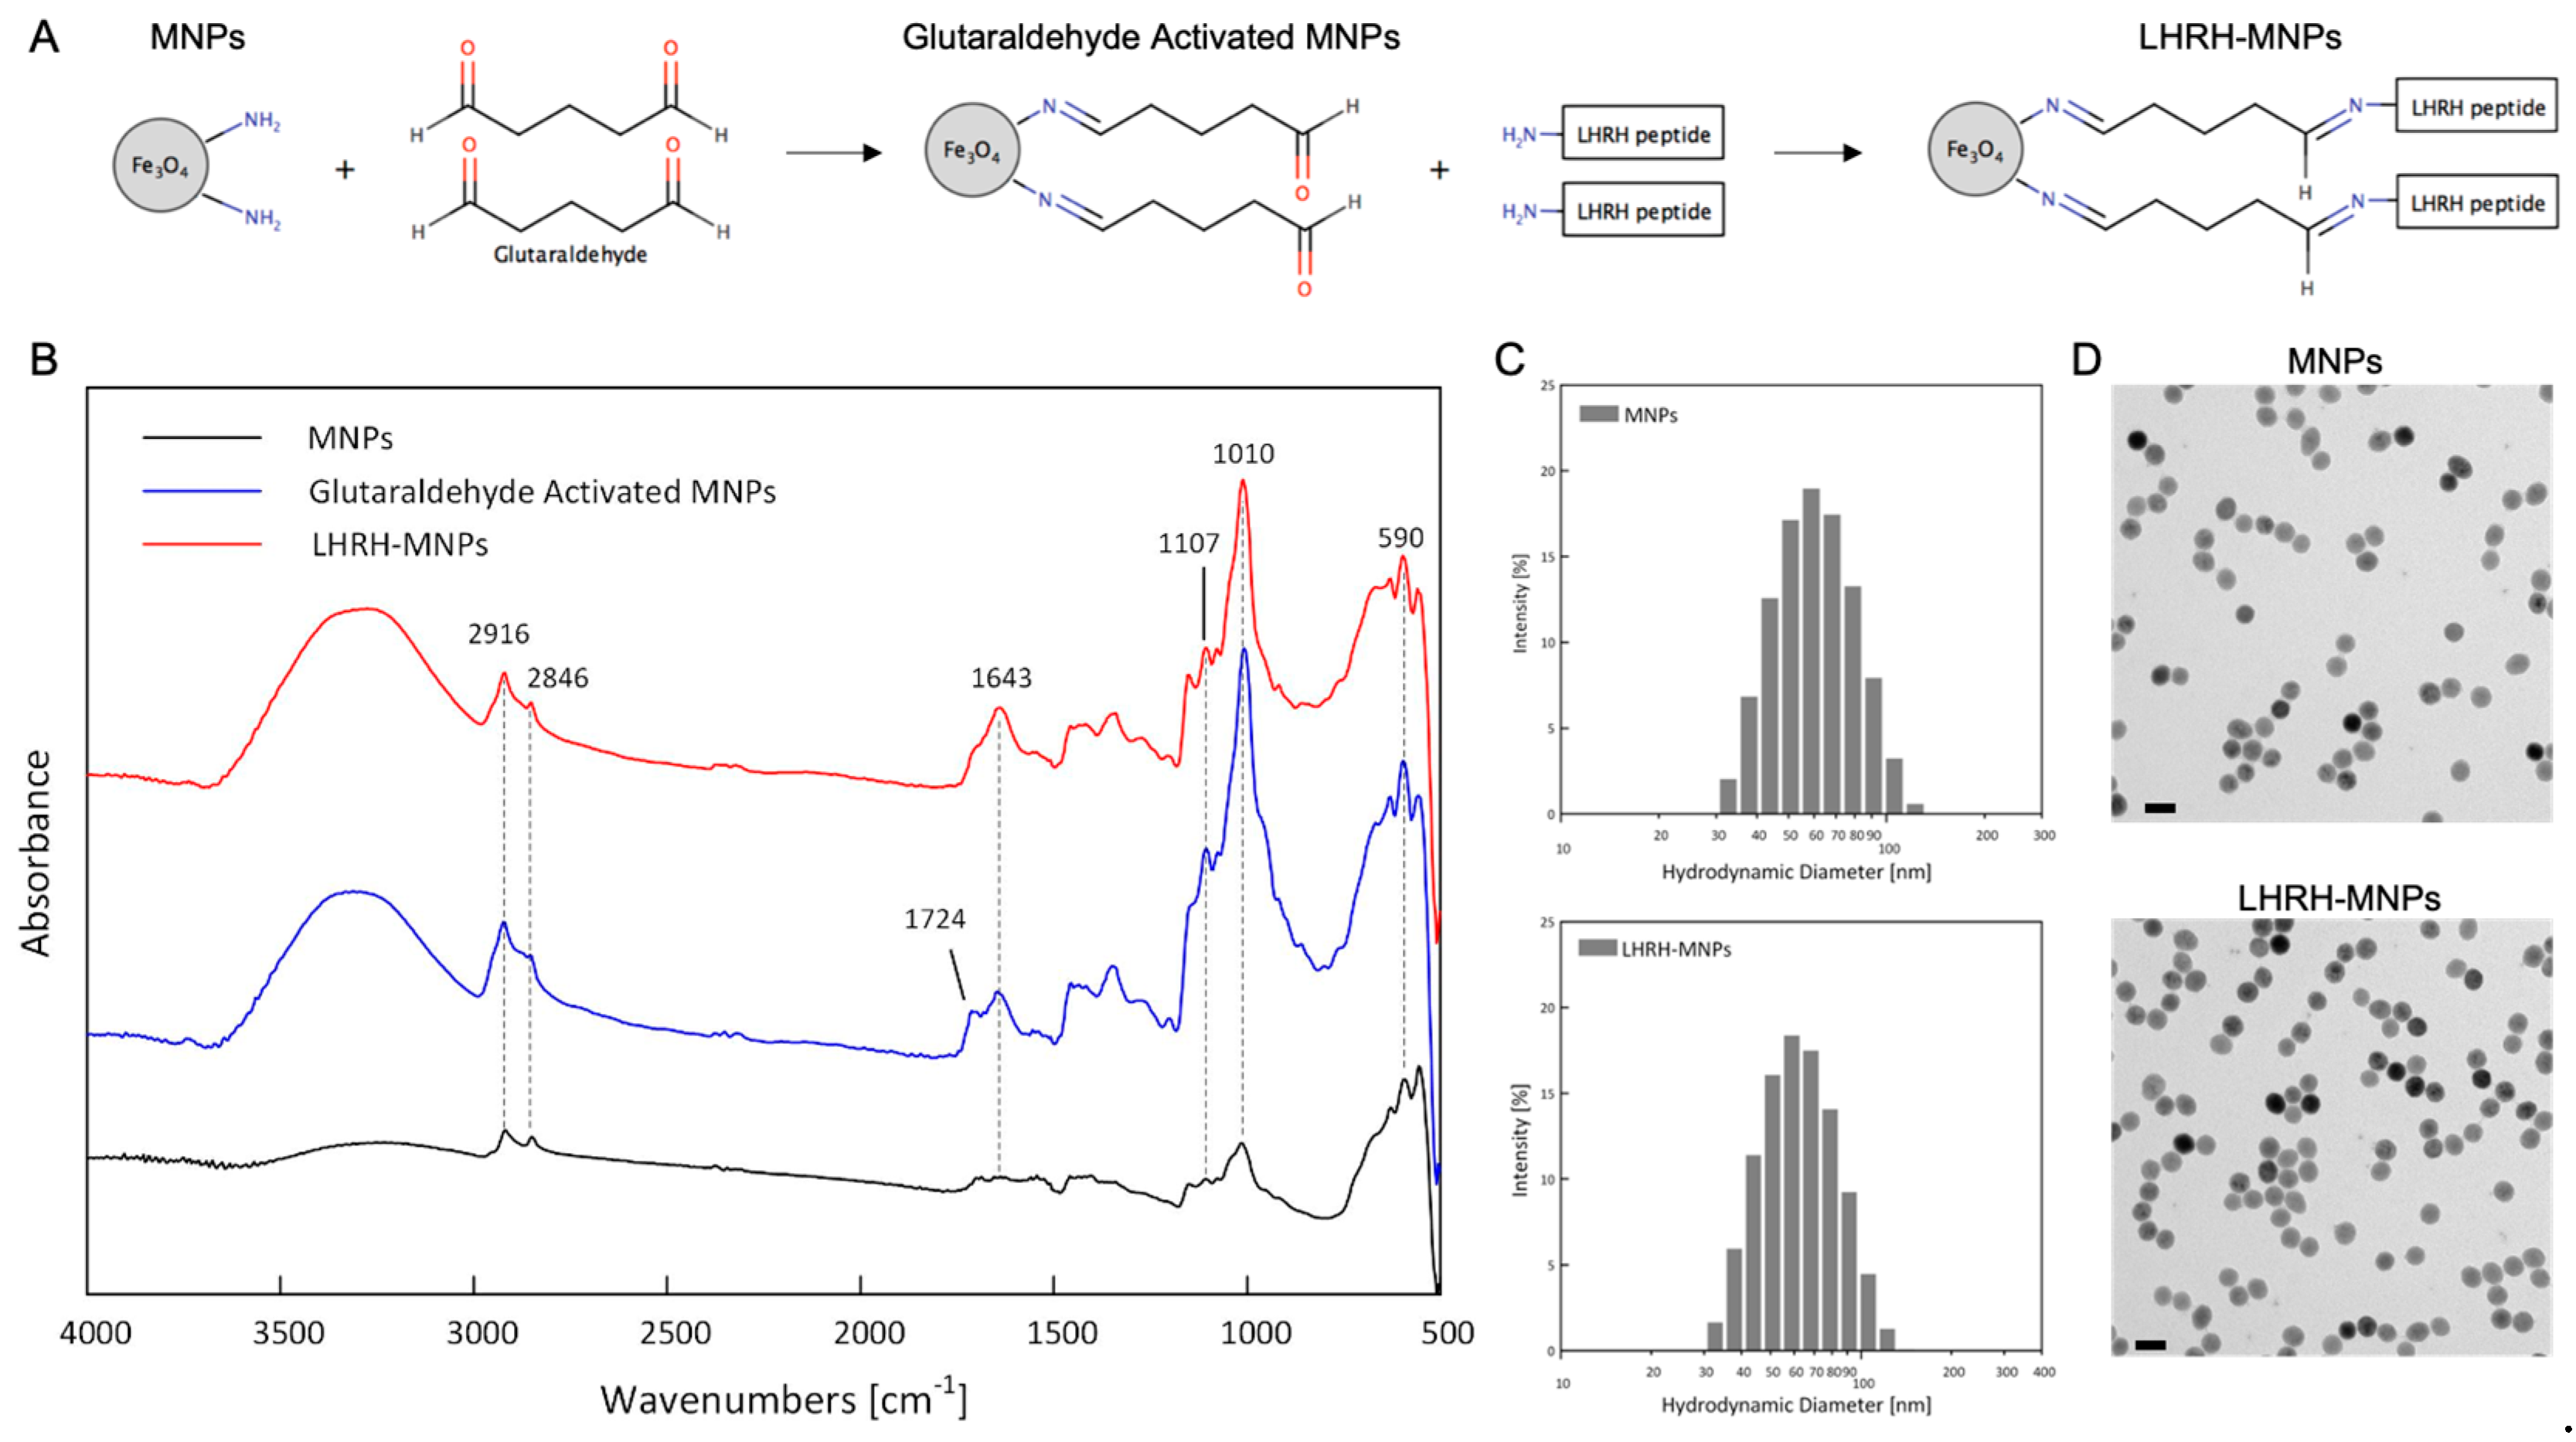
2.1. Conjugation of LHRH Peptides to MNPs

PEG-coated magnetite nanoparticles (MNPs) were purchased from Ocean NanoTech, LLC (San Diego, CA, USA). The MNPs consisted of an Fe3O4 core, a monolayer of oleic acid, and a polyethylene glycol (PEG) coating. The surfaces of MNPs were functionalized with amine groups (180 groups per nanoparticle, private communication, 2016) allowing for further conjugation. These MNPs were dispersed in deionized (DI) water with a concentration of 1 mg Fe∙mL−1. Luteinizing hormone-releasing hormone (LHRH) peptides (Bachem, Bubendorf, Switzerland) were conjugated to MNPs using glutaraldehyde crosslinking chemistry, according to a previously established protocol [25,26]. The sequence of LHRH is Pyr-His-Trp-Ser-Tyr-D-Trp-Leu-Arg-Pro-Gly-NH2.

2.2. Characterization of MNPs and LHRH-MNPs

Both MNPs and LHRH-MNPs were characterized through a variety of techniques, following protocols established by our group [25,26]. Transmission electron microscopy (TEM) (Philips, Amsterdam, Netherlands) was used to assess nanoparticle size and morphology. Dynamic light scattering (DLS), polydispersity index (PDI) and zeta potential (ZP) measurements were performed to assess the particle size, monodispersity and surface charges (Malvern Instruments, Malvern, UK). Fourier transform infrared spectroscopy (FTIR) (Shimadzu, Kyoto, Japan) was carried out to assess chemical composition of nanoparticles before and after conjugation. A vibrating-sample magnetometer (VSM) (Lake Shore Cryotronics, Inc., Westerville, OH, USA) was used to measure the magnetic properties of MNPs and LHRH-MNPs.

2.3. Iron Concentration Measurement

The iron concentration of the MNPs was determined using the potassium thiocyanate method [24]. Briefly, 12 M hydrochloric acid and 0.5 M potassium thiocyanate were added into solutions of MNPs or LHRH-MNPs. Fe3+ ions and thiocyanate (SCN) ions reacted and formed FeSCN2+ complex ions, which had a blood-red color and indicated the presence of Fe3O4. The concentration of nanoparticle solution was then measured based on the absorbance of red-colored FeSCN2+ ions by UV spectroscopy (Evolution 300 UV-Vis spectrophotometer, Thermo Electron, Waltham, MA, USA) at a wavelength of 480 nm. Based on Beer Lambert’s law, the absorbance is directly proportional to the concentration of Fe3+ in solution from which the nanoparticles concentration can be calculated.
A calibration curve was thus obtained by plotting absorbance at 480 nm against corresponding known Fe3O4 nanoparticle concentrations. The concentrations of Fe3O4 in solution were determined from a calibration curve that was obtained from the maximum absorbance at a wavelength of 480 nm.

2.4. In Vitro MRI Scans

For in vitro MRI studies, six concentrations of MNP and LHRH-MNP solutions (0.025, 0.05, 0.1, 0.2, 0.4 and 0.8 mg Fe∙mL−1) were scanned using a 1 T M2 High Performance MRI System (Aspect Imaging Technologies Ltd., Netanya, Israel). DI water with no nanoparticles was included as a control for all of the studied samples. Both gradient echo-T1 (GRE) and fast spin echo-T2 (FSE) weighted images of MNPs and LHRH-MNPs were acquired with the sequences listed in Table 1.

2.5. In Vivo MRI Study

In this study, BALB/c nude mice (7 weeks old) were obtained from Jackson Laboratory (Bar Harbor, ME, USA). All animal experiments were performed in accordance with a protocol approved by the Institutional Animal Care and Use Committee (IACUC) of Rutgers University. MRI scans were performed using a 1 T M2 High Performance MRI System (Aspect Imaging Technologies Ltd., Netanya, Israel) with the sequences listed in Table 1. For in vivo studies, all MR imaging procedures were performed under inhalation anesthesia with isoflurane at a concentration of 4–5% for induction of anesthesia and 2% for maintenance. The mice were secured within the animal bed and placed in the coil with a compatible physiological monitoring system. An aliquot of nanoparticles was injected into the animals without removing the mouse from the MRI holder. MR images were then performed on the same animal at same position under identical scanning sequences. Body temperature and respiration rate were monitored throughout the scan. Following scanning, the animals were monitored and allowed to recover on a heat pad.

2.5.1. MR Imaging of Magnetite Nanoparticles in Non-Tumor-Bearing Mice

Pre-contrast whole-body mice MR images were obtained for both T1- and T2-weighted scans as baseline. An aliquot (200 µL) of 20 mg (Fe3O4)∙kg−1 (mouse weight) LHRH-MNPs were then injected through the tail vein. The mice were then scanned immediately post injection using the same acquisition parameters.

2.5.2. Triple Negative Breast Cancer Tumor Model

MDA-MB-231 human breast cancer cells (ATCC, Manassas, VA, USA) were injected into the back flank of the mice to introduce TNBC tumor. Prior to cell induction, MDA-MB-231 cells were grown in L-15 base media supplemented with 100 I.U.∙mL−1 penicillin/100 μg∙mL−1 streptomycin and 10% FBS at 37 °C under normal atmospheric pressure. Nude mice received MDA-MB-231 cells in a Matrigel suspension (1 × 10⁷ cells per mouse) through subcutaneous injection following the approved IACUC protocol. After cell injection, the mice were monitored daily and the tumor sizes were measured on a weekly basis to monitor tumor growth using both calipers and MRI.

2.5.3. MR Imaging of Tumor-Bearing Mice through Intratumoral Injection

A subset of animals (n = 2) received intratumoral injections at 4 weeks post tumor implantation. After T2-weighted pre-imaging, an aliquot (200 µL) of 20 mg (Fe3O4)∙kg−1 (mouse weight) MNPs or LHRH-MNPs were injected directly into the tumor. The animals were scanned 2 h and 24 h post nanoparticle injection. At these end points (2 h and 24 h), the mice were sacrificed. The tumors were then removed from euthanized mice and frozen for further analysis.

2.5.4. MR Imaging of Tumor-Bearing Mice through Intravenous Injection

Intravenous nanoparticle injection was performed 14, 21 and 28 d post tumor implantation. At each time point, after native T2-weighted images were acquired, the mice received either MNPs or LHRH-MNPs intravenously. The mice were distributed randomly into three treatment groups: group 1 received saline injection (as control), group 2 received 20 mg (Fe3O4)∙kg−1 MNPs, and group 3 received 20 mg (Fe3O4)∙kg−1 LHRH-MNPs (n = 2). The animals were scanned immediately post nanoparticle injections to investigate the contrast enhancement of the tumors. The tumor-bearing mice were imaged consecutively over the next two weeks (immediately, 2 h, 24 h and 2 weeks post injection), using the T2-weighted imaging protocol, as described above. At the end of the study, the mice were euthanized (2 h, 24 h and 2 weeks) and the tumors were removed and frozen for further analysis.

2.6. MR Image Analysis

To assess the signal enhancement of nanoparticles in vitro, signal-to-noise ratio (SNR) was calculated using the following expression:
SNRnanoparticle = SInanoparticle/SDnoise
where SInanoparticle is the signal intensity (SI) of nanoparticles in aqueous solution and SDnoise is the standard deviation (SD) of noise. From in vivo studies, MRI slices that best showed the breast tumor before nanoparticle injection and after nanoparticle infusion were selected to determine the SI of original tumor and nanoparticle enhanced tumor by standard region-of-interest (ROI) measurements. To evaluate the efficacy of contrast enhancement in tumors, contrast-to-noise ratio (CNR)
CNR = (SIA − SIB)/SDnoise
and relative contrast
relative contrast = (SIA − SIB)/SIA
were calculated to compare the signals between original tumor tissues and nanoparticle enhanced tumor tissues following established protocols, where tissue A has higher SI than tissue B [29,30]. Three randomized ROIs were selected for each image. For all analyses, ROIs were of identical sizes and shapes from similar locations for each set of images, and SInoise was determined from ROIs drawn outside of the area of samples from three randomly selected areas. SI was measured by ImageJ software (NIH, Bethesda, MD). Numbers were represented by average ± standard error.

2.7. Immunohistochemistry Staining

The breast tumors were excised and snap-frozen in liquid nitrogen. The frozen tumors were embedded in optimum cutting temperature (OCT) compound and cut into 20 µm sections using a cryostat (Leica, Wetzlar, Germany). Histology was performed with immunochemistry staining of LHRH receptors according to previously established protocol [23,27]. Briefly, the tumor sections were stained with anti-LHRH antibodies (MilliporeSigma, Burlington, MA, USA) at 4 °C overnight. Alexa Fluor 488 goat anti-mouse IgG (Invitrogen, Carlsbad, CA, USA) was used as secondary antibody. Slides were mounted with antifade mounting medium with DAPI (Thermo Fisher Scientific, Waltham, MA, USA) and examined using a confocal microscopy (Leica, Wetzlar, Germany).

2.8. Ethics Statement

NIH guidelines for the care and use of laboratory animals (NIH Publication #85-23 Rev. 1985) were followed throughout these studies.

2.9. Statistical Analysis

Statistical analysis was used to evaluate the significance of the experimental data. Specifically, one-way analysis of variance (ANOVA), with Tukey’s multiple comparisons method, was performed for experiments containing more than two groups. Two-way ANOVA analysis, followed by Tukey’s multiple comparisons test, was used to compare multiple groups at multiple time points. p < 0.05 was defined as statistically significant.

3. Results

3.1. LHRH-MNP Conjugation

Water-dispersible MNPs with approximately 180 free amine groups available on the surface were obtained, allowing for further modification and functionalization (Private Communication, Ocean Nanotech, 2016) [25]. LHRH peptides were conjugated to the surface of MNPs through glutaraldehyde crosslinking chemistry following protocols established in our previous studies (Figure 1A) [25]. The associated changes of nanoparticle surface chemistry before and after LHRH conjugation were characterized using FTIR. IR spectra of MNPs glutaraldehyde activated MNP and LHRH conjugated MNPs are shown in Figure 1B. Briefly, all spectra exhibited peaks at 590 cm−1 that were characteristics of Fe-O in Fe3O4. The IR spectra also showed the characteristics of the amine-terminal PEG with methylene signature peaks at 2916 cm−1 and 2864 cm−1 for asymmetric and symmetric stretching of C–H, respectively [31,32]. Additional peaks at 1010 cm−1 and 1107 cm−1 were related to the C-O stretching in the PEG coating. In glutaraldehyde activated MNPs, carbonyl groups were introduced at 1724 cm−1 (C=O stretching) as the amine groups on MNP surfaces reacted with glutaraldehyde. In addition, the peak at 1643 cm−1 was attributed to C=N stretching of imine groups that were formed between amine of MNPs and glutaraldehyde [33]. When LHRH was introduced into glutaraldehyde active MNPs, the amine groups in LHRH peptides reacted with the remaining carbonyl groups in glutaraldehyde. As a result, the carbonyl groups that were present in glutaraldehyde activated MNPs disappeared in the spectra of the LHRH-MNPs, indicating successful conjugation.

3.2. Nanoparticle Structure and Size Distribution

The size distribution of magnetite nanoparticles was measured before and after peptide conjugation. This was obtained by calculating the core diameter from transmission electron microscopy (TEM) images, as well as the hydrodynamic diameters obtained from dynamic light scattering (DLS) (Figure 1C,D) [25]. Both MNPs and LHRH-MNPs exhibited spherical shapes, as revealed by TEM, with an average core diameter of approx. 30 nm (31.9 ± 2.4 nm for MNPs and 32.1 ± 2.1 nm for LHRH-MNPs) (Figure 1D). The average hydrodynamic diameter was measured using a particle size analyzer to be of 58.1 ± 0.3 nm for MNPs and 59.3 ± 0.6 nm for LHRH-MNPs (Figure 1C). Since hydrodynamic diameter measures the combined size of both nanoparticle core and the surrounding solvent molecules, the hydrodynamic diameters are slightly bigger than the measured core diameters. In addition, the organic layer coating (i.e., PEG) is transparent to the electron beam in TEM, leading to the discrepancy between core size and hydrodynamic diameter of the nanoparticles. The hydrophilic PEG coating facilitated the dispersion of MNPs and LHRH-MNPs in aqueous solution. The polydispersity index (PDI) for MNPs and LHRH-MNPs was measured to be 0.07 ± 0.01 and 0.09 ± 0.01, respectively, indicating that the nanoparticles were uniformly dispersed, as shown in Figure 1C,D. These results suggest that MNPs and LHRH-MNPs are monodisperse in water, without aggregation or clustering during LHRH conjugation. Lastly, the zeta potential was found to be 2.9 ± 0.3 mV for MNPs and 4.9 ± 0.6 mV for LHRH-MNPs.

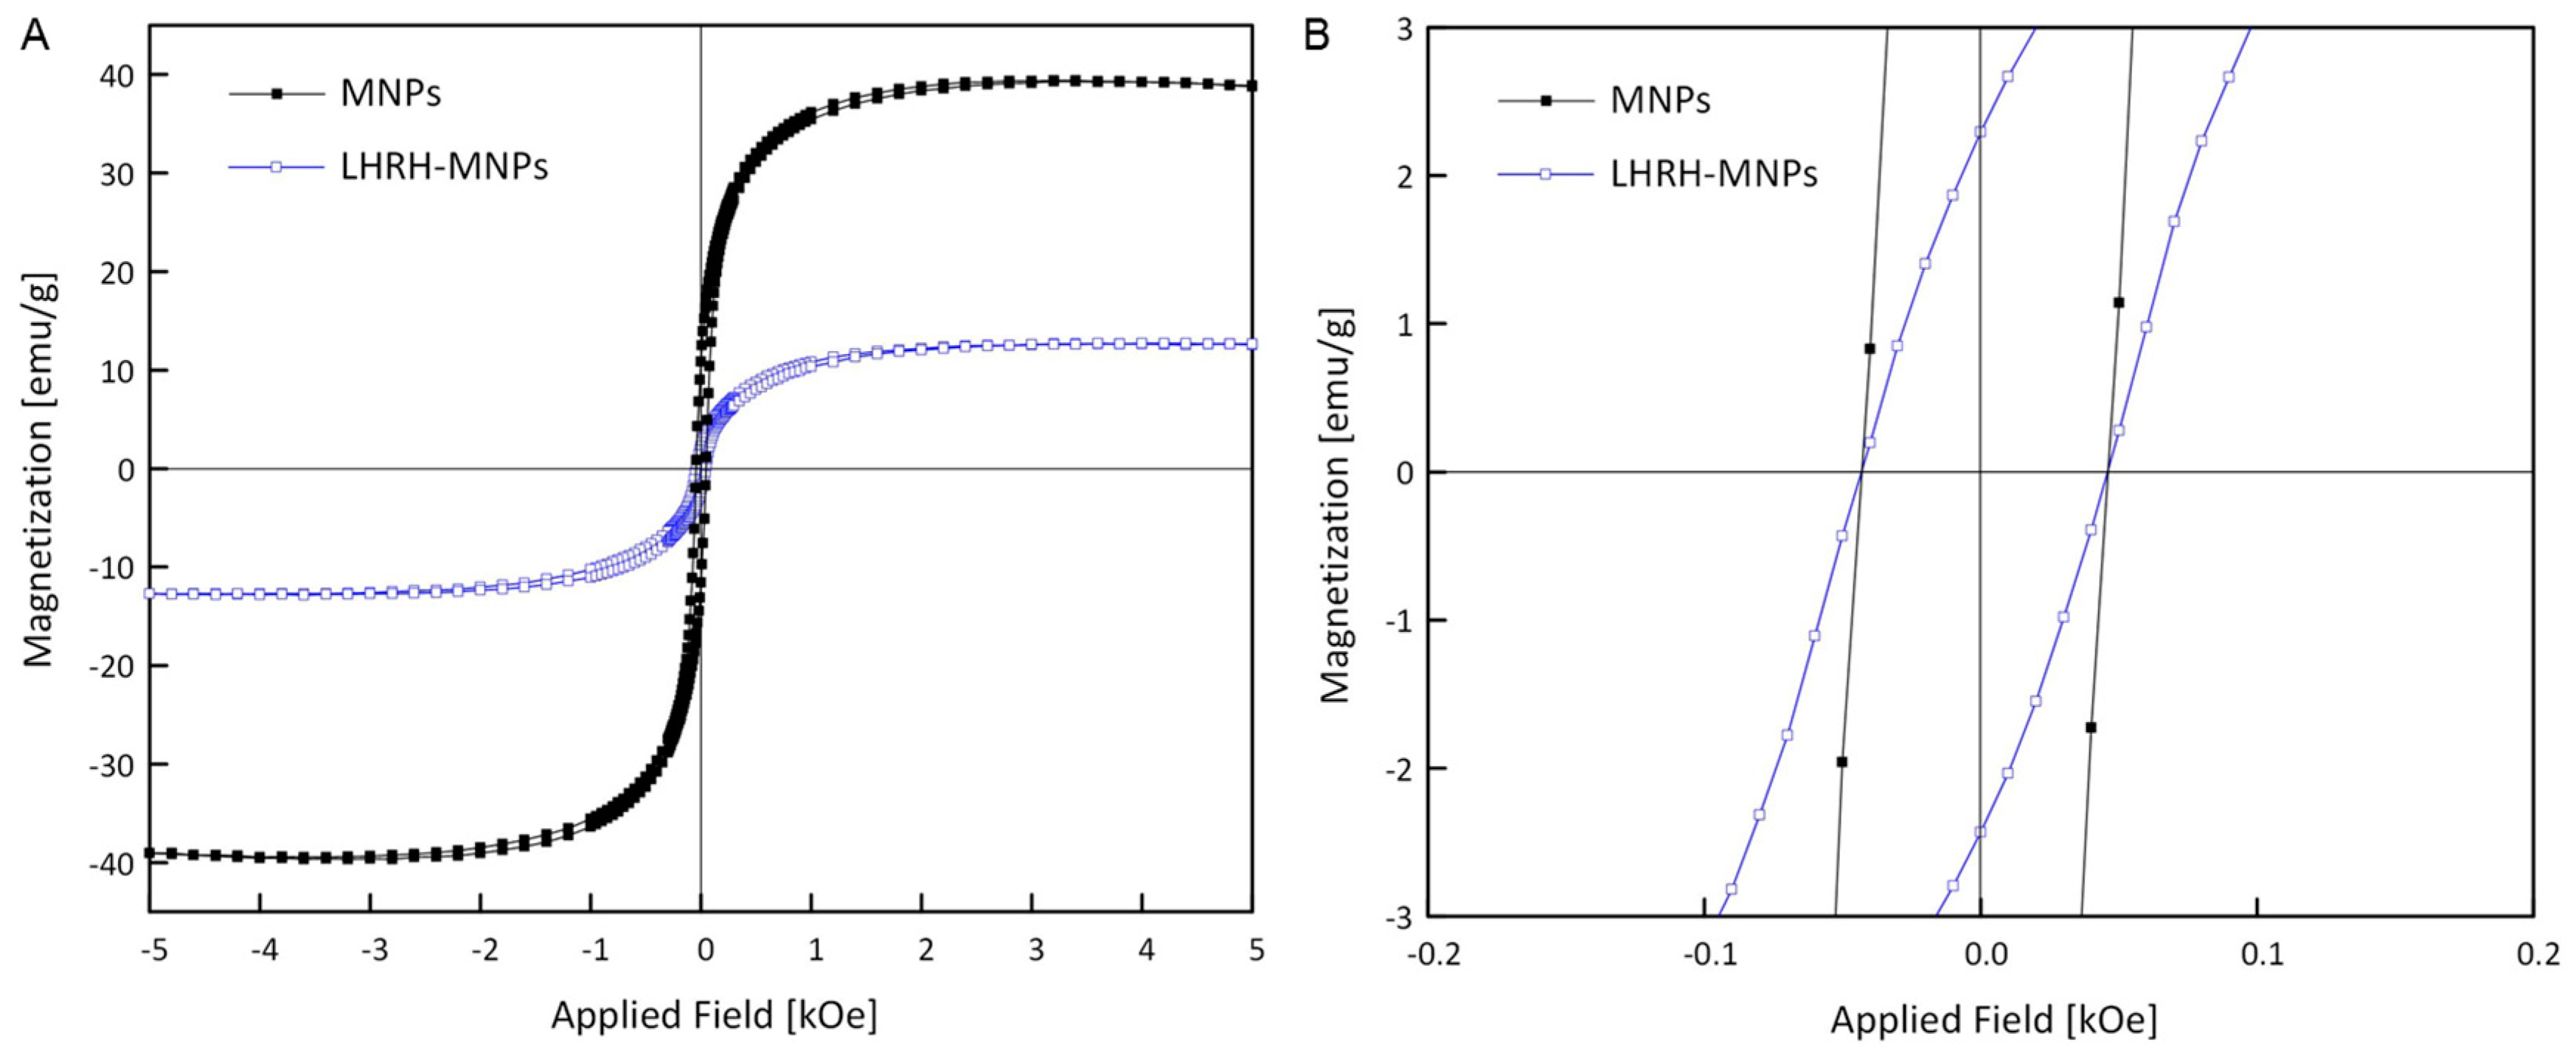
3.3. Magnetic Properties of MNPs and LHRH-MNPs

The magnetic properties of magnetite nanoparticles were examined using a vibrating sample magnetometer (VSM). Typical plots of moment versus magnetic field (M-H) for MNPs and LHRH-MNPs are presented in Figure 2, showing the hysteresis loops measured at 300 K in an applied magnetic field of up to ± 5 kOe. The saturation magnetization values of MNPs and LHRH-MNPs are 40 emu∙g−1 and 13 emu∙g−1, respectively. Both values are small, compared to the value reported for bulk Fe3O4, which is 92 emu∙g−1 [34]. The reduction in saturation magnetization is possibly attributed to the presence of the PEG coating, which reduces the relative mass ratio of the magnetic component. The PEG coating also affects the surface properties of the Fe3O4.
The saturation magnetization was further decreased with the addition of LHRH, possibly due to the presence of the peptides. As observed, MNPs and LHRH-MNPs exhibited non-negligible coercive fields at room temperature (25 °C), indicating that the systems did not exhibit superparamagnetic properties. Due to the existence of coercivity (approximately 45 Oe for both nanoparticles) and remanence (11.0 emu∙g−1 for MNPs and 2.3 emu∙g−1 for LHRH-MNPs) after the removal of the magnetic fields (Figure 2B), both MNPs and LHRH-MNPs were shown to be ferromagnetic at room temperature, indicating that they can be manipulated by an external magnetic field. Therefore, MNPs and LHRH-MNPs can serve as potential MRI contrast agents for cancer imaging.

3.4. Nanoparticle Concentration Characterization

To analyze the amount of iron in MNPs or LHRH-MNPs, thiocyanate ions (SCN) were added into a nanoparticle solution to make the presence of ferric ions (Fe3+) visible. The reaction Fe3+ + SCN → FeSCN2+ formed a blood-red colored complex, and the intensity of the color can be correlated against known iron concentration of a series of standard solutions. The standard absorbance-concentration curve obtained for MNPs of known concentration is presented in Figure 3. The calibration curve was obtained by plotting absorbance at wavelength of 480 nm against known Fe concentration. A colorimetric characterization was used to determine the concentrations of Fe in the nanoparticle solutions that was used for the MRI experiments.

3.5. In Vitro MRI

To demonstrate the T1 and T2 effects of MNPs and LHRH-MNPs in vitro, MR images of the aqueous solutions, with different nanoparticle concentrations, were obtained (Figure 4). Figure 4 shows the T1- and T2-weighted MR images of the as-prepared MNPs and conjugated LHRH-MNPs, in which the Fe concentrations were 0.025, 0.05, 0.1, 0.2, 0.4, 0.8 mg (Fe)∙mL−1, from left to right. Solutions of both types of nanoparticles exhibited concentration dependent hyperintensities and hypointensities in T1- and T2- weighted maps, respectively, as measured using a 1 T magnetic coil system. In comparison with DI water, the signal intensity (SI) of T2-weighted phantom images decreased for both types of nanoparticles (Figure 4C,E). In contrast, the brightness of the T1-weighted MR images first increased with increasing Fe concentration up to approximately 0.1 mg (Fe)∙mL−1 then decreased, as revealed by the trend of SNR (Figure 4B,D). These results suggest that both the MNPs and the LHRH-MNPs have the potential to serve as T2-based contrast agents, given the darkening consistency in T2 compared to T1. Thus, the in vitro study provided insights into the effects of nanoparticles on MRI signals, which are critical to understand before proceeding to in vivo studies.

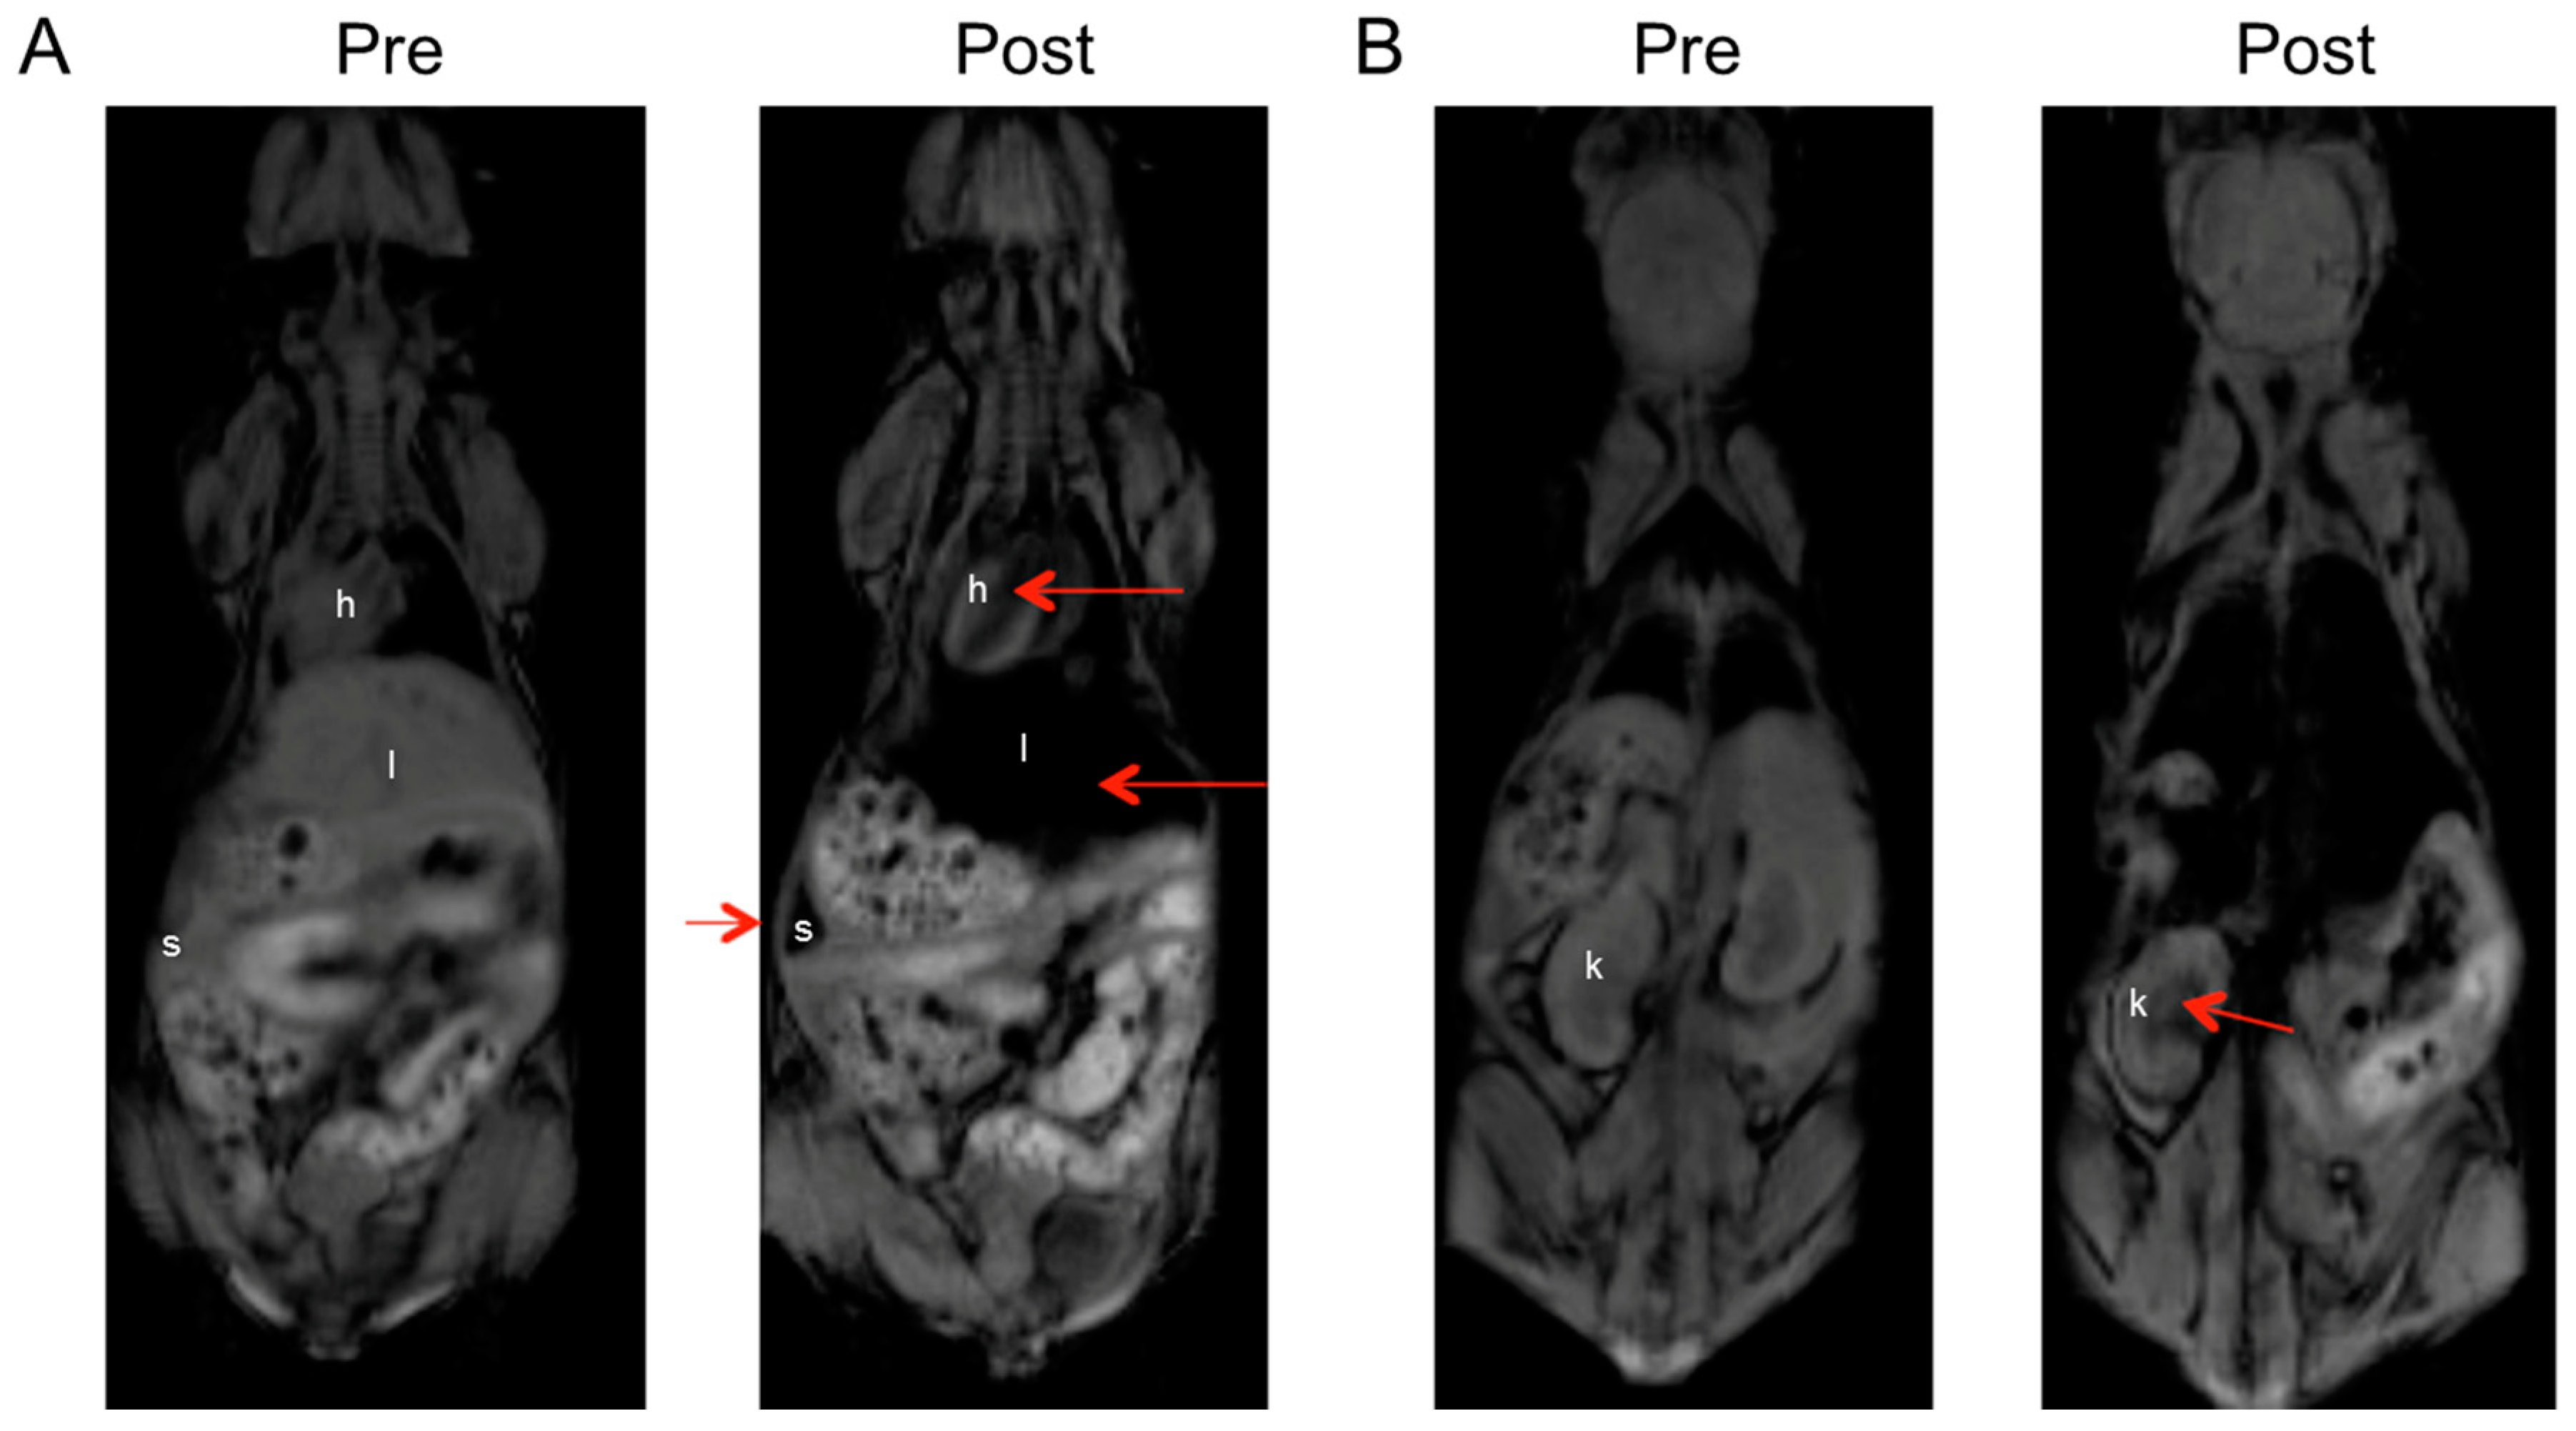
3.6. In Vivo MRI of Non-Tumor-Bearing Mice

In an effort to evaluate the potential of these nanoparticles for in vivo MR imaging, LHRH-MNPs were first administered intravenously into non-tumor-bearing mice. Whole body T1 and T2 images before nanoparticle injection were taken as a baseline (Figure 5 and Figure 6). Substantial contrast enhancement in both T1- and T2-weighted scans was observed immediately post injection. Particularly in T1-weighted MR images, the position of the liver in Figure 5A became visibly darker. In addition, a negative contrast was observed for the spleen, heart and kidney (Figure 5B). Figure 6 showed the darkening enrichment that was observed in the T2-weighted MR images in the coronal views of the mice. These are centered on the liver, kidney, spleen and major blood vessels acquired before and after the injection.

3.7. In Vivo MRI of Tumor-Bearing Mice through Intratumoral Injections

To evaluate the applicability of LHRH-MNPs for breast cancer imaging, T2-weighted MRI scans were performed in a MDA-MB-231 xenograft tumor model. This TNBC tumor model was established in-house by the subcutaneous injection of breast cancer cells into back flanks of non-tumor-bearing nude mice, and the tumor volume was monitored by MRI on a weekly basis for durations up to 28 d (Figure 7). All of the mice tolerated the procedure well without any noticeable complications.
Figure 8 shows T2-weighted MR scans obtained from mice with subcutaneous xenograft tumors at 4 weeks post induction. Each tumor was injected directly with either MNPs or LHRH-MNPs at a dose of 20 mg of Fe3O4 per kg mouse body weight. Before intratumoral injections, the positions of the xenograft tumors were visible, as indicated by yellow dashed ovals (Figure 8). The immediate post-contrast MRI scans showed significant signal voids in the tumors (indicated by the yellow arrows in Figure 8), owing to the presence of injected nanoparticles. MRI scans were used to monitor the mice at 2 h, 24 h and 2 weeks post intratumoral injection (Figure 8). For MNPs, the contrast enhancement was present immediately after nanoparticle injection, and then the signal started to recover after 24 h (Figure 8A,C). In contrast to MNPs, the tumors injected with LHRH-MNPs maintained a negative signal for durations up to two weeks (Figure 8B,D).
To quantify the contrast level, the tumors were identified as the region of interest (ROI), and signal-to-noise ratio (SNR) and relative contrast (%) were calculated from the MRI scans using Equations (1), (2) and (3) presented in Section 2.6. Specifically, the signal intensity (SI) of the tumor at each scanning time point after injection of MNPs or LHRH-MNPs injections were compared to the SI value of the tumor before nanoparticle administration. The injection of MNPs led to tumor enhancement immediately after injection with a relative contrast of 32 ± 6% and 27 ± 10% at 2 h (p > 0.05). Whereas after 24 h, the contrast level was reduced to half (14 ± 9%), which was maintained for two weeks (15 ± 10%) (p > 0.05). Compared to injection of MNPs, injection of LHRH-MNPs resulted in overall higher relative contrast that was preserved at ~60% (59 ± 22%, 58 ± 21%, 59 ± 23%, and 54 ± 25%, for immediate, 2 h, 24 h and 2 weeks post injection) through a period of 2 weeks. No significant difference was observed between these values (p > 0.05), suggesting that long-term detectability of LHRH-MNPs could be achieved in vivo under T2-weighted MR imaging for at least 14 d after intratumoral injection.

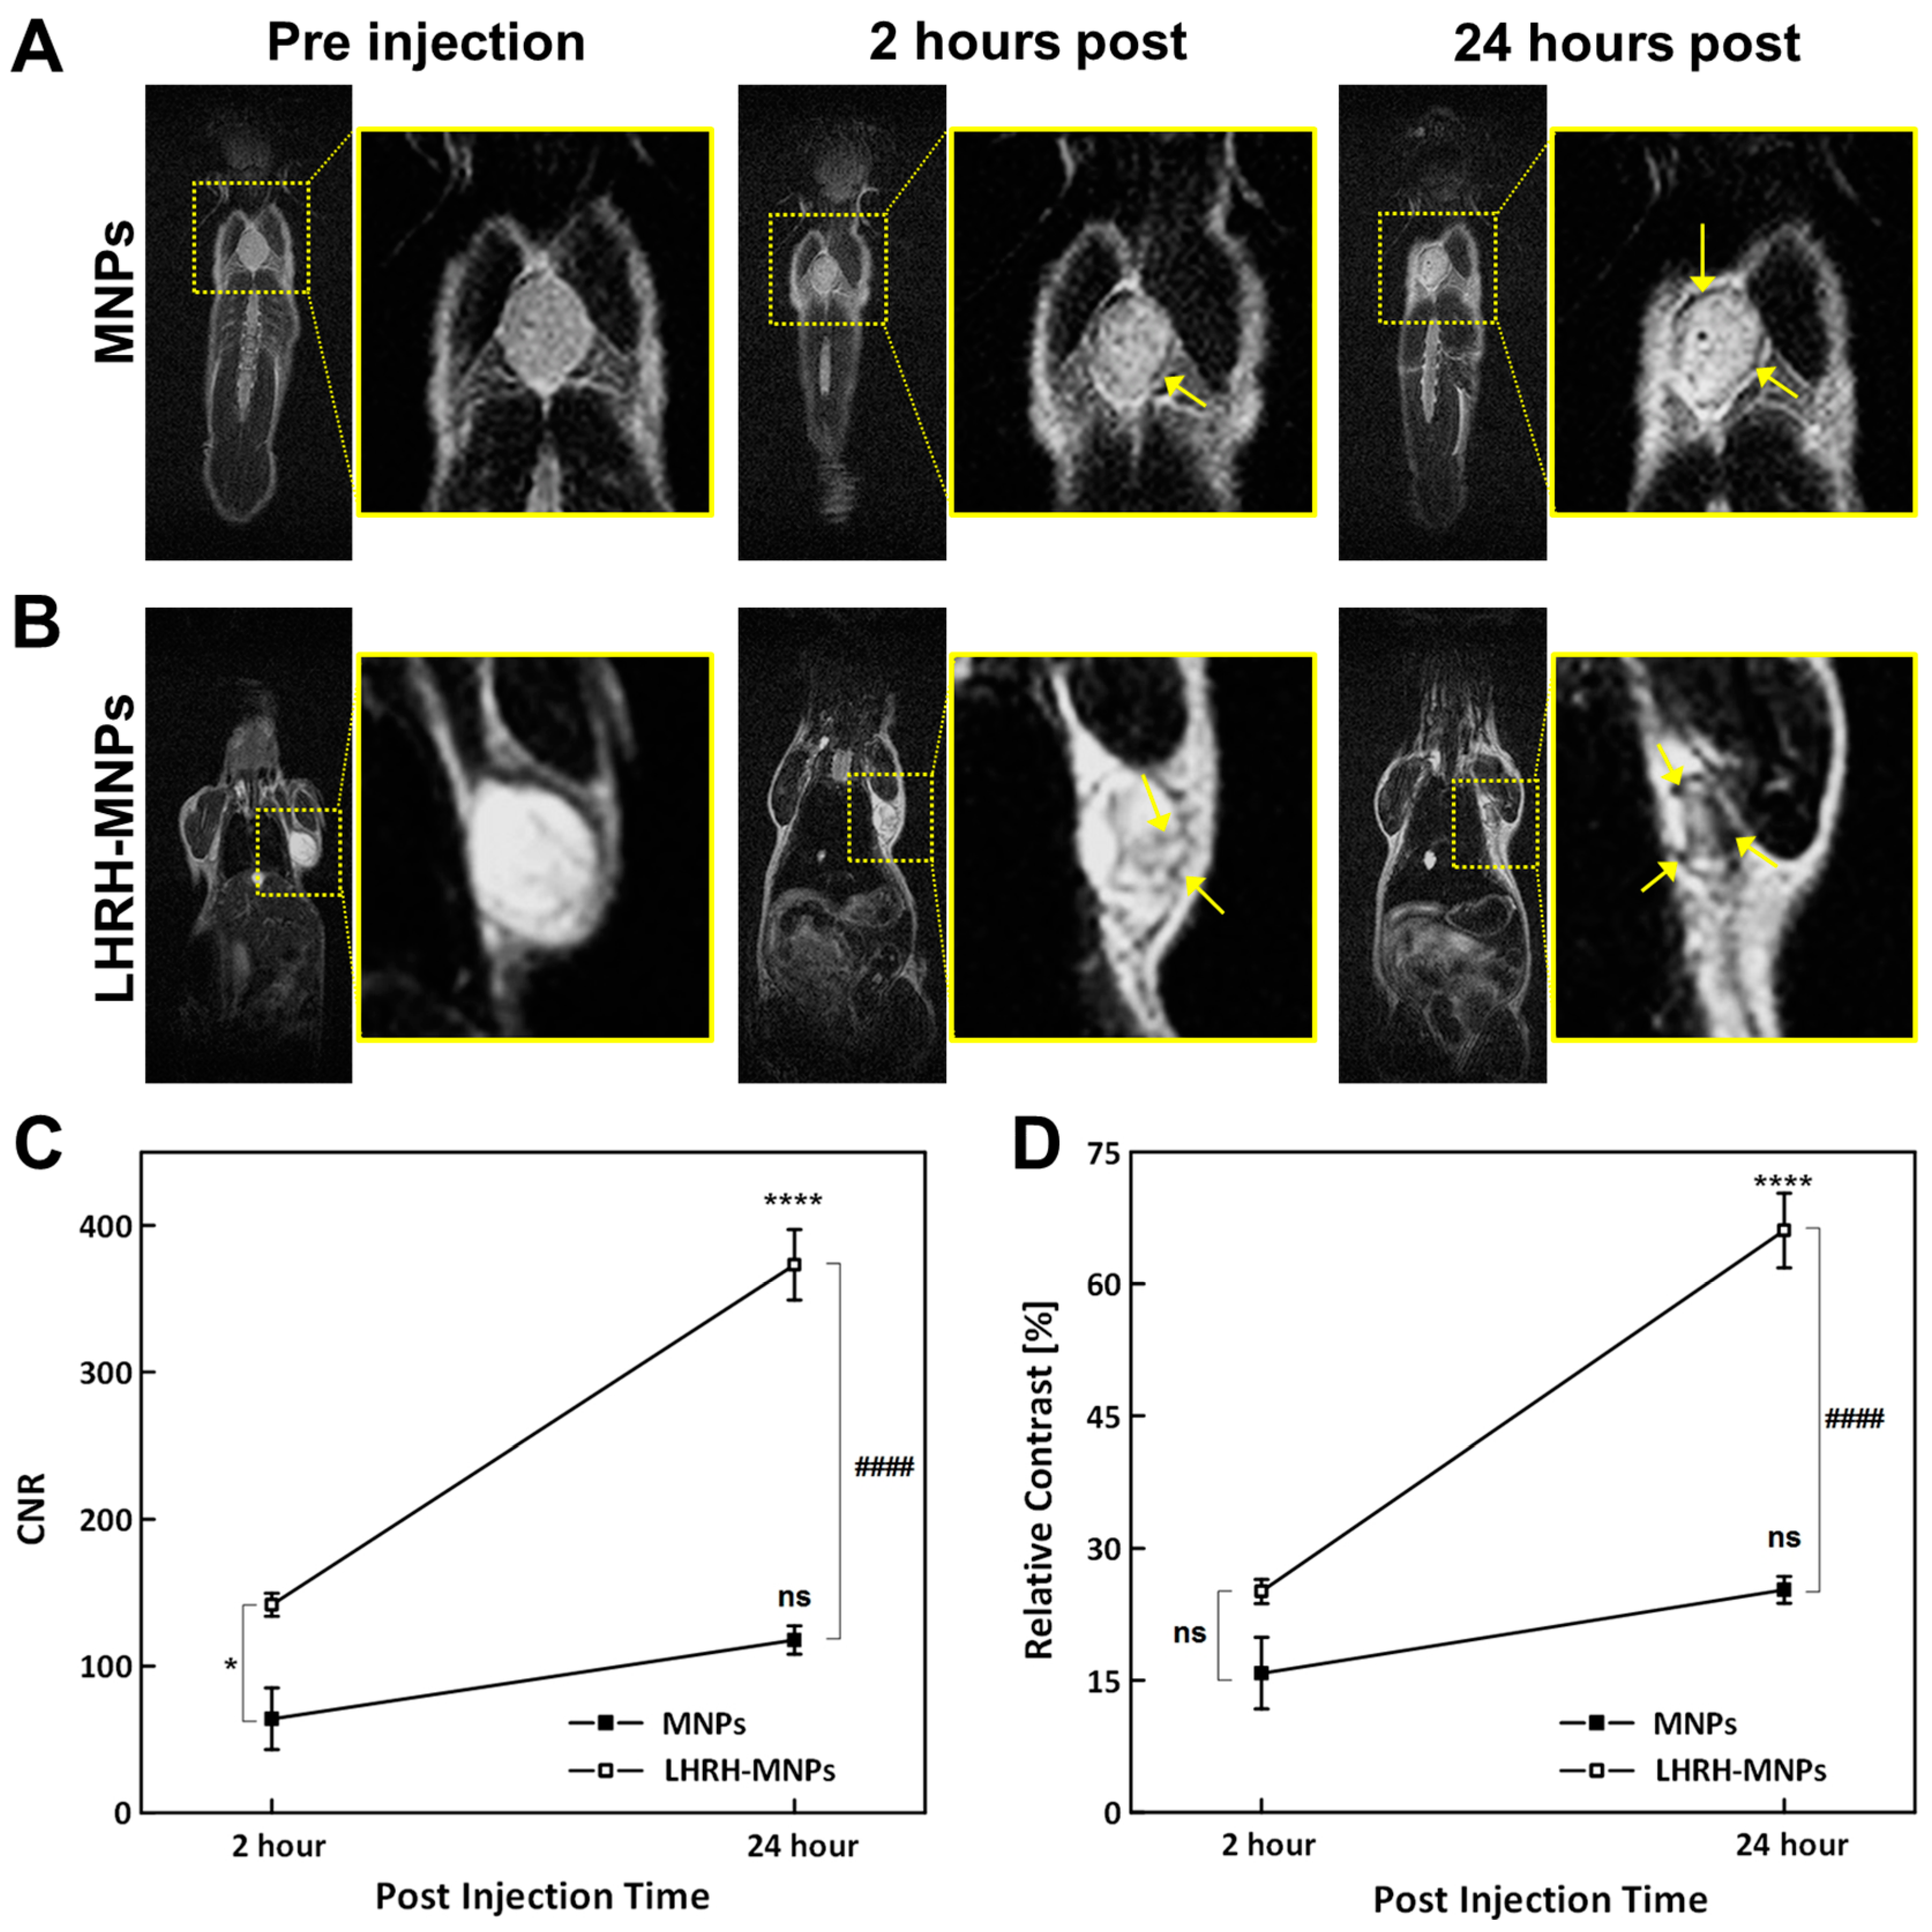
3.8. In Vivo MRI of Tumor-Bearing Mice through Intravenous Injections

To study the clinical potential of the prepared nanoparticles, the contrast feasibility of MNPs or LHRH-MNPs under systematic circulation inside the mice were investigated through intravenous injection in tumor-bearing mice. Figure 9 shows T2-weighted MR images after injection of MNPs or LHRH-MNPs through the tail vein at a concentration of 20 mg of Fe3O4 per kg of mouse body weight. Significant signal attenuation was observed in the tumor region in the LHRH-MNP treated group at 2 h post injection, and the contrast became enhanced after 24 h, which facilitated the differentiation between tumors and surrounding tissues (Figure 9B). However, such contrast changes were not obvious in the mice injected with MNPs (Figure 9A).
The tumor-to-nanoparticle contrast varied over time and the maximum relative contrast were found to be 25 ± 1% and 66 ± 4% at 24 h post injection for MNPs and LHRH-MNPs (p < 0.0001), respectively (Figure 9C). No statistical significance in attenuation was detected for MNPs between 2 h (15 ± 4%) and 24 h (25 ± 1%) (p = 0.2), whereas the negative enhancement in LHRH-MNP treated group was significant (25 ± 1% at 2 h and 66 ± 4% at 24 h, p < 0.0001). The index suggested that LHRH-MNPs exhibited much higher signal changes for breast tumor imaging and detection limit compared to MNPs as the T2 based MRI contrast agents. The current results also highlight the potential for future applications of LHRH-MNPs as contrast agents in the early diagnosis of cancer.

3.9. Immunohistochemical Staining of LHRH Receptors

The breast tumors were excised 4-weeks post tumor induction and processed for LHRH receptor staining. The overexpressed LHRH receptors in excised tumor suggested the successful implementation of a mice model to study breast cancers that overexpress LHRH receptors (Figure 10). Figure 10 shows that the breast tissue consisted of tube-shaped structures, which may correlate with the duct features shown in tubular carcinoma of breast.

4. Discussion

This study shows that MNPs and LHRH-MNPs can be used in imaging human TNBC in xenograft tumors as negative (T2) MRI contrast agents. Specifically, in T2-weighted MR imaging, the signal intensity in each voxel is given by
SI = S0e−TE/T2
where S0 is proportional to both the spin density and T1-weighting factor in the voxel, TE is the echo time, and T2 is the transverse relaxation time of a given tissue [35]. Hence, when the gray scale is darker, the SI is smaller and the relaxation time T2 is shorter. With the presence of nanoparticles in tumor, an additional magnetic field (caused by the nanoparticles) is introduced and induces local field inhomogeneity that increases the speed of proton transverse relaxation and shortens the T2 relaxation time, resulting in a hyperintense change in MRI signals. The negative agents or T2 agents are so-called since they cause darkening of images on their sites.
Our results showed that the targeted LHRH-MNPs accumulated in various vital organs in the non-tumor bearing mice, including the liver, spleen, kidney and spleen (Figure 5 and Figure 6). The remarkable darkening of liver and spleen is most likely because both are macrophage-rich organs, which take up nanoparticles and finally remove them by common elimination pathways in the reticuloendothelial system [36]. For instance, Kupffer cells in the liver [37,38] can uptake LHRH-MNPs, which lead to a faster T2 relaxation in liver and the resultant darkening effect. The negative signals in heart and kidney are probably due to the presence of LHRH-MNPs in the blood pool [39].
Non-targeted MNPs caused negative signals in tumors by T2-weighted MRI imaging immediately following intratumoral and intravenous injections. This may be attributed to the enhanced permeability and retention (EPR) effect in solid tumors as a passive uptake pathway for nanoparticle accumulation to facilitate the specific MR imaging of tumor sites [40]. In addition, MNPs have positively-charged surfaces, as revealed by zeta potentials, and thus they are able to adhere more easily to the negatively-charged surfaces of cell membranes by electrostatic interactions. Positively-charged nanoparticles are generally taken up to a greater degree under faster cell phagocytosis rates, compared to their neutral or negatively-charged counterparts [41]. It appears that the tumor T2 signal intensity of MNP-treated animals started to revert to the pre-injection intensity after 24 h, for both intratumoral and intravenous injections (Figure 8 and Figure 9). It is likely that MNPs undergo gradual metabolic processes, thereby reducing the amount and distribution of MNPs in the tumors.
Compared to MNPs, targeted LHRH-MNPs exhibited excellent lesion-detecting ability and longer imaging windows in T2-weighted MR imaging for TNBC (Figure 8 and Figure 9). In intratumoral injections, the negative contrast in the tumor remained constant for 14 d, whereas the relative contrast started to recover in the MNP-treated group at 24 h, following injection. In intravenously injected mice, infused LHRH-MNPs caused significant signal attenuation, with an increase of over 2.5-fold at 24 h compared to 2 h, indicating continuous darkening of the tumor. Specifically, after 2 h, the edge of the tumor began to show enhancement, and the intensification became more obvious at 24 h, where the majority of the tumor were darkened compared to the pre-injection state (Figure 9). Such enhancement was not significant in MNP treated animals. These results suggest the specificity of LHRH-MNPs in the targeted imaging of TNBCs. In conjunction with passive EPR-based accumulation and favorable electrostatic interaction between positively-charged nanoparticle surface and cell membrane, LHRH-MNPs are highly likely to attach to TNBC tissues, due to specific receptor-ligand interactions.
Previously, LHRH-MNPs had been found to demonstrate excellent binding specificity to a human TNBC cancer cell line (MDA-MB-231) which overexpresses LHRH receptors [25,26]. Specifically, the adhesion measured between LHRH-MNPs and MDA-MB-231 TNBC cells was fourteen-fold the adhesion between unmodified MNPs and TNBC cells [26]. As a result of receptor-ligand specificity, the enhanced adhesive interaction leads LHRH-MNPs to enter into TNBC cells lead via receptor-mediated endocytosis, with faster internalization kinetics [25,26]. In vitro results showed that LHRH-MNPs are both thermodynamically and kinetically more favorable to enter into TNBC cells compared to MNPs [25]. In vivo imaging (Figure 8 and Figure 9) demonstrated that the presence of LHRH ligands enabled specific delivery of the particles to the tumor and increased their ability to target TNBC tumors through an active pathway, thus making the tumors appear darker compared to the non-LHRH targeted group (MNP-treated group). Importantly, the TNBC tumors can be detected more readily with LHRH-MNPs than with MNPs. The LHRH-directed interaction between LHRH-MNPs and TNBC allows the LHRH-MNPs to stay in the tumor for longer durations, leading to the potential feasibility for long-term monitoring of the tumors. Therefore, LHRH-MNPs have the potential to be developed into multifunctional nanocarriers for the early detection and localized treatment of TNBC.
Lastly, it is important to note that the overexpression of LHRH receptors has been demonstrated in several human malignant tumors, including breast cancer, ovarian cancer, endometrial cancer, pancreatic cancer, and other types of cancer [42,43]. Since LHRH receptors are not expressed in the majority of normal tissues [43], these receptors play a critical role in targeted therapy of tumors. Studies have demonstrated the effectiveness of LHRH-targeted drug delivery platforms for cancer therapy by using LHRH peptides to direct anticancer drugs and imaging agents to the cancer site, while minimizing collateral damage to healthy tissues [23,44,45,46,47]. Taking advantage of overexpressed LHRH receptors by the tumor cells, LHRH targeting ligands can be exploited to guide the delivery of LHRH-MNPs to treat a variety of cancers in addition to TNBC, in addition to detecting the metastasis. In this study, the MR imaging was performed at 28 d post tumor implantation. Further studies are clearly needed to investigate the efficacy in the early detection and localized treatment of TNBC in the context of LHRH-MNP based targeting motifs. Imaging at 7 d, 14 d, and 21 d would be necessary. To better understand the long term imaging efficacy of LHRH-MNPs and their systemic response, experiments lasting one month are needed. Histopathology is also needed to investigate the potential toxicity of these nanoparticles on different organs, such as lungs, livers and kidneys.

5. Conclusions

In this work, we have presented LHRH-MNPs and demonstrated their ability in tumor-specific imaging contrast enhancement in vivo. LHRH-MNPs act as T2 contrast agents both in vitro and in vivo. Compared to nontarget MNPs, LHRH peptides significantly facilitated the specific uptake of LHRH-MNPs to tumor site with enhanced attenuation, highlighting the potential of LHRH-MNPs in the long-term MRI monitoring of TNBC tumors overexpressing LHRH receptors. Hence, we conclude that LHRH-MNPs can be used as targeting contrast agents in the diagnosis and detection of TNBC tumors.

Author Contributions

Conceptualization, J.H. and W.S.; methodology, J.H., J.O., K.M., E.Y., D.A., and W.S.; software, E.Y. and D.A.; validation, J.H. and W.S.; formal analysis, J.H.; investigation, K.M.; resources, E.Y. and D.A.; data curation, D.A.; writing—original draft preparation, J.H.; writing—review and editing, J.H., J.O., K.M., E.Y., D.A., and W.S.; visualization, J.H.; supervision, W.S.; project administration, W.S.; funding acquisition, W.S. All authors have read and agreed to the published version of the manuscript.

Funding

This research was funded by Princeton University’s Old School Fund (Grant No. 25105-B0635-FA572) and the World Bank African Centers of Excellence (PAMI Grant No. P126974).

Acknowledgments

The authors acknowledge Xue Zhou and Adekunle Adeyeye (National University of Singapore) for VSM measurements. The authors are also grateful to Princeton University, Rutgers University, and Worcester Polytechnic Institute for their technical support.

Conflicts of Interest

The authors declare no conflict of interest.

References

  1. Foulkes, W.D.; Smith, I.E.; Reis-Filho, J.S. Triple-Negative Breast Cancer. N. Engl. J. Med. 2010, 363, 1938–1948. [Google Scholar] [CrossRef] [Green Version]
  2. Kumar, P.; Aggarwal, R. An overview of triple-negative breast cancer. Arch. Gynecol. Obstet. 2016, 293, 247–269. [Google Scholar] [CrossRef]
  3. Shapiro, C.L.; Recht, A. Side Effects of Adjuvant Treatment of Breast Cancer. N. Engl. J. Med. 2001, 344, 1997–2008. [Google Scholar] [CrossRef]
  4. Broet, P.; Scholl, S.M.; de la Rochefordiere, A.; Fourquet, A.; Moreau, T.; De Rycke, Y.; Asselain, B.; Pouillart, P. Short and long-term effects on survival in breast cancer patients treated by primary chemotherapy: An updated analysis of a randomized trial. Breast Cancer Res. Treat. 1999, 58, 151–156. [Google Scholar] [CrossRef]
  5. Anders, C.; Carey, L.A. Understanding and treating triple-negative breast cancer. Oncology 2008, 22, 1233–1243. [Google Scholar]
  6. Tanja, O.; Snjezana, F.; Erika, M.; Barbara, M.; Simona, B. Triple negative breast cancer–prognostic factors and survival. Radiol. Oncol. 2011, 45, 46–52. [Google Scholar] [CrossRef] [Green Version]
  7. De Laurentiis, M.; Cianniello, D.; Caputo, R.; Stanzione, B.; Arpino, G.; Cinieri, S.; Lorusso, V.; De Placido, S. Treatment of triple negative breast cancer (TNBC): Current options and future perspectives. Cancer Treat. Rev. 2010, 36, S80–S86. [Google Scholar] [CrossRef]
  8. Kassam, F.; Enright, K.; Dent, R.; Dranitsaris, G.; Myers, J.; Flynn, C.; Fralick, M.; Kumar, R.; Clemons, M. Survival Outcomes for Patients with Metastatic Triple-Negative Breast Cancer: Implications for Clinical Practice and Trial Design. Clin. Breast Cancer 2009, 9, 29–33. [Google Scholar] [CrossRef] [PubMed]
  9. Boisserie-Lacroix, M.; Mac Grogan, G.; Debled, M.; Ferron, S.; Asad-Syed, M.; Brouste, V.; Mathoulin-Pelissier, S.; Hurtevent-Labrot, G. Radiological features of triple-negative breast cancers (73 cases). Diagn. Interv. Imaging 2012, 93, 183–190. [Google Scholar] [CrossRef] [PubMed]
  10. Du, H.-Y.; Lin, B.-R.; Huang, D.-P. Ultrasonographic findings of triple-negative breast cancer. Int. J. Clin. Exp. Med. 2015, 8, 10040–10043. [Google Scholar] [PubMed]
  11. Hu, J.; Zhou, Y.; Obayemi, J.D.; Du, J.; Soboyejo, W.O. An investigation of the viscoelastic properties and the actin cytoskeletal structure of triple negative breast cancer cells. J. Mech. Behav. Biomed. Mater. 2018, 86, 1–13. [Google Scholar] [CrossRef]
  12. Fischer, U.; Kopka, L.; Grabbe, E. Breast Carcinoma: Effect of Preoperative Contrast-enhanced MR Imaging on the Therapeutic Approach. Radiology 1999, 213, 881–888. [Google Scholar] [CrossRef]
  13. Esserman, L.; Hylton, N.; Yassa, L.; Barclay, J.; Frankel, S.; Sickles, E. Utility of Magnetic Resonance Imaging in the Management of Breast Cancer: Evidence for Improved Preoperative Staging. J. Clin. Oncol. 1999, 17, 110. [Google Scholar] [CrossRef] [PubMed]
  14. Stephen, Z.R.; Kievit, F.M.; Zhang, M. Magnetite nanoparticles for medical MR imaging. Mater. Today 2011, 14, 330–338. [Google Scholar] [CrossRef]
  15. Edelman, R.R.; Hesselink, J.R.; Zlatkin, M.B.; Vrues, J.V. Clinical Magnetic Resonance Imaging; Elsevier Health Sciences: London, UK, 2005; p. 3824. [Google Scholar]
  16. Sun, S.-N.; Wei, C.; Zhu, Z.-Z.; Hou, Y.-L.; Venkatraman, S.S.; Xu, Z.-C. Magnetic iron oxide nanoparticles: Synthesis and surface coating techniques for biomedical applications. Chin. Phys. B 2014, 23, 37503. [Google Scholar] [CrossRef]
  17. Revia, R.A.; Zhang, M. Magnetite nanoparticles for cancer diagnosis, treatment, and treatment monitoring: Recent advances. Mater. Today 2016, 19, 157–168. [Google Scholar] [CrossRef]
  18. Bao, Y.; Sherwood, J.A.; Sun, Z. Magnetic iron oxide nanoparticles as T1 contrast agents for magnetic resonance imaging. J. Mater. Chem. C 2018, 6, 1280–1290. [Google Scholar] [CrossRef]
  19. Zhang, C.; Yan, Y.; Zou, Q.; Chen, J.; Li, C. Superparamagnetic iron oxide nanoparticles for MR imaging of pancreatic cancer: Potential for early diagnosis through targeted strategies. Asia Pac. J. Clin. Oncol. 2016, 12, 13–21. [Google Scholar] [CrossRef] [Green Version]
  20. Peng, X.-H.; Qian, X.; Mao, H.; Wang, A.Y.; Chen, Z.G.; Nie, S.; Shin, D.M. Targeted magnetic iron oxide nanoparticles for tumor imaging and therapy. Int. J. Nanomed. 2008, 3, 311–321. [Google Scholar] [CrossRef] [Green Version]
  21. Kwok, C.W.; Treeck, O.; Buchholz, S.; Seitz, S.; Ortmann, O.; Engel, J.B. Receptors for luteinizing hormone-releasing hormone (GnRH) as therapeutic targets in triple negative breast cancers (TNBC). Target. Oncol. 2015, 10, 365–373. [Google Scholar] [CrossRef]
  22. Huerta-Reyes, M.; Maya-Núñez, G.; Pérez-Solis, M.A.; López-Muñoz, E.; Guillén, N.; Olivo-Marin, J.-C.; Aguilar-Rojas, A. Treatment of Breast Cancer With Gonadotropin-Releasing Hormone Analogs. Front. Oncol. 2019, 9. [Google Scholar] [CrossRef] [PubMed] [Green Version]
  23. Obayemi, J.D.; Salifu, A.A.; Eluu, S.C.; Uzonwanne, V.O.; Jusu, S.M.; Nwazojie, C.C.; Onyekanne, C.E.; Ojelabi, O.; Payne, L.; Moore, C.M.; et al. LHRH-Conjugated Drugs as Targeted Therapeutic Agents for the Specific Targeting and Localized Treatment of Triple Negative Breast Cancer. Sci. Rep. 2020, 10, 8212. [Google Scholar] [CrossRef] [PubMed]
  24. Meng, J.; Fan, J.; Galiana, G.; Branca, R.T.; Clasen, P.L.; Ma, S.; Zhou, J.; Leuschner, C.; Kumar, C.S.S.R.; Hormes, J.; et al. LHRH-functionalized superparamagnetic iron oxide nanoparticles for breast cancer targeting and contrast enhancement in MRI. Mater. Sci. Eng. C-Biomim. Supramol. Syst. 2009, 29, 1467–1479. [Google Scholar] [CrossRef]
  25. Hu, J.; Obayemi, J.D.; Malatesta, K.; Kosmrlj, A.; Soboyejo, W.O. Enhanced cellular uptake of LHRH-conjugated PEG-coated magnetite nanoparticles for specific targeting of triple negative breast cancer cells. Mater. Sci. Eng. C Mater. Biol. Appl. 2018, 88, 32–45. [Google Scholar] [CrossRef]
  26. Hu, J.; Youssefian, S.; Obayemi, J.; Malatesta, K.; Rahbar, N.; Soboyejo, W. Investigation of adhesive interactions in the specific targeting of Triptorelin-conjugated PEG-coated magnetite nanoparticles to breast cancer cells. Acta Biomater. 2018, 71, 363–378. [Google Scholar] [CrossRef]
  27. Obayemi, J.D.; Hu, J.; Uzonwanne, V.O.; Odusanya, O.S.; Malatesta, K.; Anuku, N.; Soboyejo, W.O. Adhesion of ligand-conjugated biosynthesized magnetite nanoparticles to triple negative breast cancer cells. J. Mech. Behav. Biomed. Mater. 2017, 68, 276–286. [Google Scholar] [CrossRef]
  28. Issa, B.; Obaidat, I.M.; Albiss, B.A.; Haik, Y. Magnetic Nanoparticles: Surface Effects and Properties Related to Biomedicine Applications. Int. J. Mol. Sci. 2013, 14, 21266–21305. [Google Scholar] [CrossRef] [Green Version]
  29. Phinikaridou, A.; Qiao, Y.; Giordano, N.; Hamilton, J.A. Detection of thrombus size and protein content by ex vivo magnetization transfer and diffusion weighted MRI. J. Cardiovasc. Magn. Reson. 2012, 14, 45. [Google Scholar] [CrossRef] [Green Version]
  30. Maubon, A.J.; Ferru, J.-M.; Berger, V.; Soulage, M.C.; DeGraef, M.; Aubas, P.; Coupeau, P.; Dumont, E.; Rouanet, J.-P. Effect of Field Strength on MR Images: Comparison of the Same Subject at 0.5, 1.0, and 1.5 T. Radiographics 1999, 19, 1057–1067. [Google Scholar] [CrossRef]
  31. Mukhopadhyay, P.; Sarkar, K.; Bhattacharya, S.; Mishra, R.; Kundu, P.P. Efficient oral insulin delivery by dendronized chitosan: In vitro and in vivo studies. RSC Adv. 2014, 4, 43890–43902. [Google Scholar] [CrossRef]
  32. Sun, C.; Du, K.; Fang, C.; Bhattarai, N.; Veiseh, O.; Kievit, F.; Stephen, Z.; Lee, D.; Ellenbogen, R.G.; Ratner, B.; et al. PEG-Mediated Synthesis of Highly Dispersive Multifunctional Superparamagnetic Nanoparticles: Their Physicochemical Properties and Function In Vivo. ACS Nano 2010, 4, 2402–2410. [Google Scholar] [CrossRef] [PubMed] [Green Version]
  33. Sutirman, Z.A.; Sanagi, M.M.; Abd Karim, K.J.; Wan Ibrahim, W.A. Preparation of methacrylamide-functionalized crosslinked chitosan by free radical polymerization for the removal of lead ions. Carbohydr. Polym. 2016, 151, 1091–1099. [Google Scholar] [CrossRef] [PubMed]
  34. Rochelle, M.C.; Udo, S. The Iron Oxides: Structure, Properties, Reactions, Occurences and Uses, 2nd ed.; Wiley-VCH Verlag GmbH & Co. KgaA: Boschstrabe, Germany, 2003. [Google Scholar]
  35. Adolphi, N.L.; Butler, K.S.; Lovato, D.M.; Tessier, T.E.; Trujillo, J.E.; Hathaway, H.J.; Fegan, D.L.; Monson, T.C.; Stevens, T.E.; Huber, D.L.; et al. Imaging of Her2-targeted magnetic nanoparticles for breast cancer detection: Comparison of SQUID-detected magnetic relaxometry and MRI. Contrast Media Mol. Imaging 2012, 7, 308–319. [Google Scholar] [CrossRef] [PubMed]
  36. Yu, M.; Zheng, J. Clearance Pathways and Tumor Targeting of Imaging Nanoparticles. ACS Nano 2015, 9, 6655–6674. [Google Scholar] [CrossRef] [Green Version]
  37. Arami, H.; Khandhar, A.; Liggitt, D.; Krishnan, K.M. In vivo delivery, pharmacokinetics, biodistribution and toxicity of iron oxide nanoparticles. ChSRv 2015, 44, 8576–8607. [Google Scholar] [CrossRef]
  38. Feng, Q.; Liu, Y.; Huang, J.; Chen, K.; Huang, J.; Xiao, K. Uptake, distribution, clearance, and toxicity of iron oxide nanoparticles with different sizes and coatings. Sci. Rep. 2018, 8, 2082. [Google Scholar] [CrossRef]
  39. Hobson, N.J.; Weng, X.; Siow, B.; Veiga, C.; Ashford, M.; Thanh, N.T.K.; Schätzlein, A.G.; Uchegbu, I.F. Clustering superparamagnetic iron oxide nanoparticles produces organ-targeted high-contrast magnetic resonance images. Nanomedicine 2019, 14, 1135–1152. [Google Scholar] [CrossRef]
  40. Li, J.; He, Y.; Sun, W.; Luo, Y.; Cai, H.; Pan, Y.; Shen, M.; Xia, J.; Shi, X. Hyaluronic acid-modified hydrothermally synthesized iron oxide nanoparticles for targeted tumor MR imaging. Biomaterials 2014, 35, 3666–3677. [Google Scholar] [CrossRef]
  41. Gustafson, H.H.; Holt-Casper, D.; Grainger, D.W.; Ghandehari, H. Nanoparticle uptake: The phagocyte problem. Nano Today 2015, 10, 487–510. [Google Scholar] [CrossRef] [Green Version]
  42. Gründker, C.; Emons, G. The Role of Gonadotropin-Releasing Hormone in Cancer Cell Proliferation and Metastasis. Front. Endocrinol. 2017, 8. [Google Scholar] [CrossRef]
  43. Nagy, A.; Schally, A.V. Targeting of Cytotoxic Luteinizing Hormone-Releasing Hormone Analogs to Breast, Ovarian, Endometrial, and Prostate Cancers1. Biol. Reprod. 2005, 73, 851–859. [Google Scholar] [CrossRef] [PubMed] [Green Version]
  44. Xiaoning, L.; Oleh, T.; Olena, T.; Canan, S.; Tamara, M. LHRH-Targeted Drug Delivery Systems for Cancer Therapy. Mini-Rev. Med. Chem. 2017, 17, 258–267. [Google Scholar] [CrossRef]
  45. Leuschner, C.; Kumar, C.S.S.R.; Hansel, W.; Soboyejo, W.; Zhou, J.; Hormes, J. LHRH-conjugated magnetic iron oxide nanoparticles for detection of breast cancer metastases. Breast Cancer Res. Treat. 2006, 99, 163–176. [Google Scholar] [CrossRef] [PubMed]
  46. Dharap, S.S.; Wang, Y.; Chandna, P.; Khandare, J.J.; Qiu, B.; Gunaseelan, S.; Sinko, P.J.; Stein, S.; Farmanfarmaian, A.; Minko, T. Tumor-specific targeting of an anticancer drug delivery system by LHRH peptide. Proc. Natl. Acad. Sci. USA 2005, 102, 12962–12967. [Google Scholar] [CrossRef] [PubMed] [Green Version]
  47. Leuschner, C.; Kumar, C.S.S.R.; Hansel, W.; Hormes, J. Targeting Breast Cancer Cells and Their Metastases Through Luteinizing Hormone Releasing Hormone (LHRH) Receptors Using Magnetic Nanoparticles. J. Biom. Nanotechnol. 2005, 1, 229–233. [Google Scholar] [CrossRef]
Figure 1. (A) Conjugation process of LHRH-MNPs. LHRH peptides were conjugated to the surfaces of MNPs via glutaraldehyde crosslinking chemistry to generate LHRH-MNPs. (B) Fourier-transform infrared spectroscopy (FTIR) spectra of MNPs, glutaraldehyde activated MNPs and LHRH-MNPs, showing successful conjugation. (C) Hydrodynamic diameter distribution of MNPs and LHRH-MNPs, as measured by dynamic light scanning (DLS). (D) Transmission electron microscopy (TEM) micrographs of MNPs and LHRH-MNPs. Scale bars are 100 µm. [25].
Applsci 10 05175 g001
Figure 2. Magnetic hysteresis curves of MNPs and LHRH-MNPs with (A) full view with applied field ranging from -5 kOe to 5 kOe. (B) Zoom of the hysteresis curves with applied field of ± 0.2 kOe, showing the coercivity of nanoparticles.
Applsci 10 05175 g002
Figure 3. (A) UV-Vis spectra of MNPs at different concentrations, showing peak absorbance around 480 nm. (B) Absorbance versus concentration calibration curve for MNPs, with correlation coefficient (r2) of 0.99.
Applsci 10 05175 g003
Figure 4. (A) In vitro T1- and T2- weighted images of MNPs and LHRH-MNPs in DI water at various iron concentrations. DI water was used as control. Dotted white circles outline the locations of nanoparticle solutions. (B) SNR of MNPs in T1-weighted MRI scans. (C) SNR of MNPs in T2-weighted MRI scans. (D) SNR of LHRH-MNPs in T1-weighted MRI scans. (E) SNR of LHRH-MNPs in T2-weighted MRI scans.
Applsci 10 05175 g004
Figure 5. In vivo T1-weighted MRI scans of LHRH-MNPs into non-tumor-bearing nude mice (no tumors), showing darkening effect. (A) Image slice depth highlighting liver (l), heart (h) and spleen (s). (B) Image slice depth highlighting kidney (k).
Applsci 10 05175 g005
Figure 6. In vivo T2-weighted MRI scans of LHRH-MNPs injected into non-tumor-bearing nude mice (no tumors), showing a darkening effect. (A) Image slice depth highlighting the liver (l). (B) Image slice depth highlighting the kidney (k), liver (l), spleen (s) and major blood vessels (v).
Applsci 10 05175 g006
Figure 7. Tumor volume growth profile up to 28 d post tumor implantation as measured by MRI.
Applsci 10 05175 g007
Figure 8. T2-weighted MR images of nude mice bearing xenograft breast tumors 4-weeks post tumor induction before and after intratumoral injection of (A) MNPs or (B) LHRH-MNPs. Tumor sites in mice are identified by yellow dotted circles, and the darkened areas within the tumors are highlighted with yellow arrows. The same animal was scanned before, immediately after, 2 h post, 24 h post and 2 weeks post nanoparticle injection. (C) CNR of tumors treated with MNPs or LHRH-MNPs. (D) Relative contrast of tumors treated with MNPs or LHRH-MNPs.
Applsci 10 05175 g008
Figure 9. T2-weighted MR images of nude mice bearing breast tumor 4-week post tumor implantation before and after intravenous injection using (A) MNPs or (B) LHRH-MNPs. Tumor sites in mice are identified by yellow dotted rectangles, and the darkened areas within the tumors are highlighted with yellow arrows in zoomed-in images focusing on tumor sites. The same animal was scanned before, 2 h post and 24 h following nanoparticle injection. (C) CNR of MNPs and LHRH-MNPs treated tumors. (D) Relative contrast of MNPs and LHRH-MNPs treated tumors. ns: not significant; * p < 0.05; **** and ####, p < 0.0001.
Applsci 10 05175 g009
Figure 10. Immunohistochemistry staining of excised breast tumor tissue 4-weeks post tumor induction, showing expressed LHRH receptors (green). Cell nuclei were labeled by DAPI (blue).
Applsci 10 05175 g010
Table 1. MR scanning parameters for T1- and T2- weighted imaging.
ParameterT1 GRET2 FSE
Echo Time (TE) [ms]3.880
Repetition Time (TR) [ms]15.44593.7
Field of View (FOV) [mm]100150
Flip Angle [°]15180
Matrix Size256 × 256256 × 256
Number of Slices2424
Thickness [mm]1.31.3

