Development and Effect Analysis of UVB-LED General Lighting to Support Vitamin D Synthesis

1
Smart Natural Space Research Center, Kongju National University, Cheonan-city, Chungcheongnam-do 31080, Korea
2
Department of Computer Science & Engineering, Kongju National Uiniversity, Cheonan-city, Chungcheongnam-do 31080, Korea
*
Author to whom correspondence should be addressed.
Appl. Sci. 2020, 10(3), 889; https://doi.org/10.3390/app10030889
Submission received: 29 November 2019
/
Revised: 23 January 2020
/
Accepted: 27 January 2020
/
Published: 29 January 2020
(This article belongs to the Special Issue Optical Devices and Systems for Biomedical Applications)
Abstract
:Ultraviolet rays from sunlight are involved in vitamin D synthesis, which is essential in maintaining health. Most in vivo vitamin D synthesis occurs via exposure to sunlight, whereas a small portion is obtained through diet. Therefore, appropriate exposure to sunlight is recommended to satisfy vitamin D requirement. However, vitamin D deficiency still poses a serious issue to numerous people. To resolve this problem, artificial lighting has been studied to provide rays of UV light with characteristics similar to that of sunlight. The present study introduced vitamin D synthesis stimulating UVB-LED light via the general diffusion lighting type to indoor dwellers. However, despite the strides of advancement made in this type of lighting, studies on UVB with relation to vitamin D synthesis are limited. This study aimed to suggest UVB-LED lighting for indoor dwellers and confirm the effectiveness of vitamin D stimulation through animal testing. For this, a UVB-LED providing safe UVB dosage was developed based on the photobiological safety (IEC 62471) of lighting. Next, a comparison study of the suggested lighting and general lighting was executed in an isolated system. The study continued for two weeks and the vitamin D levels within the animal test subject (Rat, Wistar, male) were measured. At this time, the lighting was turned on for 06:00~22:00 considering the sunrise timing and average lighting time for modern people, and blood was collected from the caudal veins of the rats and analyzed for the amount of 25-hydroxyvitamin D [25(OH)D]. Analysis results showed that the amount of 25-hydroxyvitamin D [25(OH)D] in blood was higher, on average, by 6.8% (0.97 ng/mL) and 7.3% (0.9 ng/ml) in rats reared under UVB-LED lighting on the seventh and fourteenth experimental days, respectively, than those under general lighting. It was, therefore, confirmed that vitamin D synthesis in the human body can be supported by the proposed lighting in this study.
1. Introduction
Recently, interest in the effect of natural sunlight on the human body has increased. Ultraviolet (UV) light is an electromagnetic ray that carries a wavelength shorter than visible light, and consists of 6–7% of the solar radiation that reaches the Earth’s surface [1]. UV light is divided into UVA (315–400 nm), UVB (280–315 nm), and UVC (200–280 nm) [2]. Ninety-five percent of UVC and UVB is absorbed by the ozone layer present in the stratosphere. Five percent of UVB and 95% of UVA penetrate the ozone layer and reach bodies on the Earth’s surface [3,4]. Typically, UV light from sunlight is known to be harmful to the skin and eye, and overexposure should be avoided [5,6]. Conversely, several researchers have cautioned against a deficit in UV light exposure, which may result in rickets, osteomalacia, and other musculoskeletal diseases as well as vascular diseases such as diabetes, high blood pressure, and myocardial infarction [7,8,9]. In addition, a certain wavelength of UV light including UVB is essential for stimulating vitamin D synthesis and is, therefore, suggested as useful in maintaining good mental health [10,11,12]. As awareness regarding the positive aspects of UV light from sunlight increases, appropriate exposure to sunlight is being recommended to maintain and improve health. A portable UV light–measuring device has been developed to ascertain the level of UV light exposure outdoors [13]. In addition, government agencies and meteorological agencies in some countries provide local UV intensity information [14,15] and have suggested adequate exposure time to specific areas of concern for vitamin D deficiency [16]. Furthermore, lighting-related studies investigating the appropriate UV light dosage for people who cannot go outside due to health or work issues are being actively conducted. UV lighting devices have surpassed the existing treatment-purpose lighting to ones that can control the amount of UV light through UVB-LED, so that it can be applied to day-to-day indoor activities within the safe range of UV light exposure [17]. Moreover, the introduction of portable UV light-measuring devices and smartphone applications to UVE-LED systems support the meeting of individual UV light dosage requirements [18]. Clinical trials to test the correlation between UVB and in vivo vitamin B synthesis have been implemented [19], and an experiment related to the treatment of psoriasis using medical UV light has been reported [20]. However, the experiments thus far have only been tested on small parts of the human body or on animals (mice), and have not been able to prove that UVB-LED light exposure for a given duration supports vitamin D synthesis within a closed system lacking outside light.
This study aimed to recommend UVB-LED lighting for indoor dwellers, which was supported by evidence from animal testing. Four UVB-LED light sources (UVB 100 mW, L company) were used at a distance of 1.5 m at 10.67 mW/m2 to develop general indoor lighting. Photobiological safety (IEC 62471) was followed to ensure the safety of the suggested lighting. A closed system was developed where outside light was blocked from entering and the lights were installed at 1.5 m in accordance with the normal architecture of general lighting in a household. Clinical experiments were performed to measure the vitamin D levels. At this time, since the amount of vitamin D in the body was rapidly changed due to outdoor activities even after exposure to sunlight for a short time [21], there was difficulty in forcing the subjected person to stay indoors for a long duration (about three weeks) in the clinical study. Therefore, the rat was chosen as a long-term test subject. Since rats have fur covering the majority of their body, the UVB irradiance was adjusted to 26 mW/m2. The experimental group (G1) and control group (G2) were observed for two weeks. The experiment start date, the seventh day, and the fourteenth day each had three scheduled blood draws (02:00, 06:00, and 23:00 h) and were tested and compared for differences in vitamin D level to check the effectiveness of the proposed lighting.
2. UVB-LED General Lighting
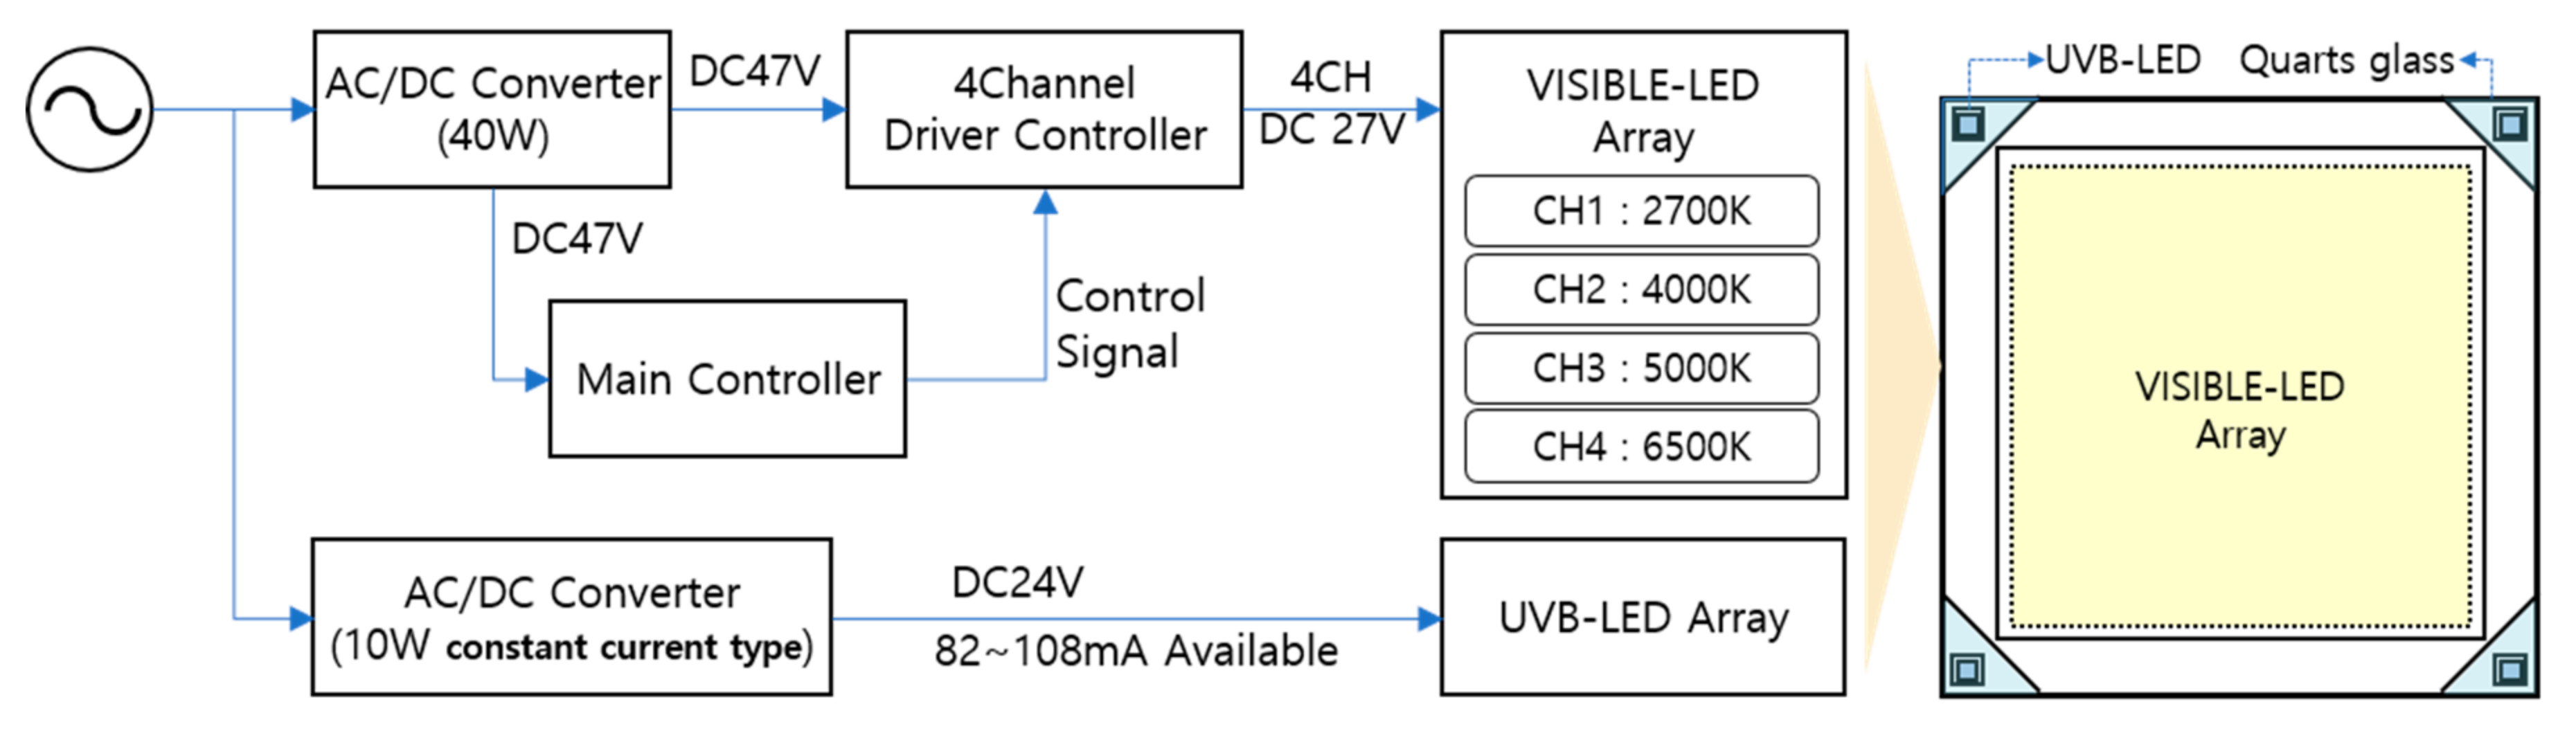
This study recommended UVB-LED indoor lighting for indoor dwellers for vitamin D synthesis. For this, the test lighting combined the abilities of 500 lux VISIBLE-LED and UVB-LED. To power the VISIBLE-LED and UVB-LED, a power converter and resistor were installed together, as shown in Figure 1.
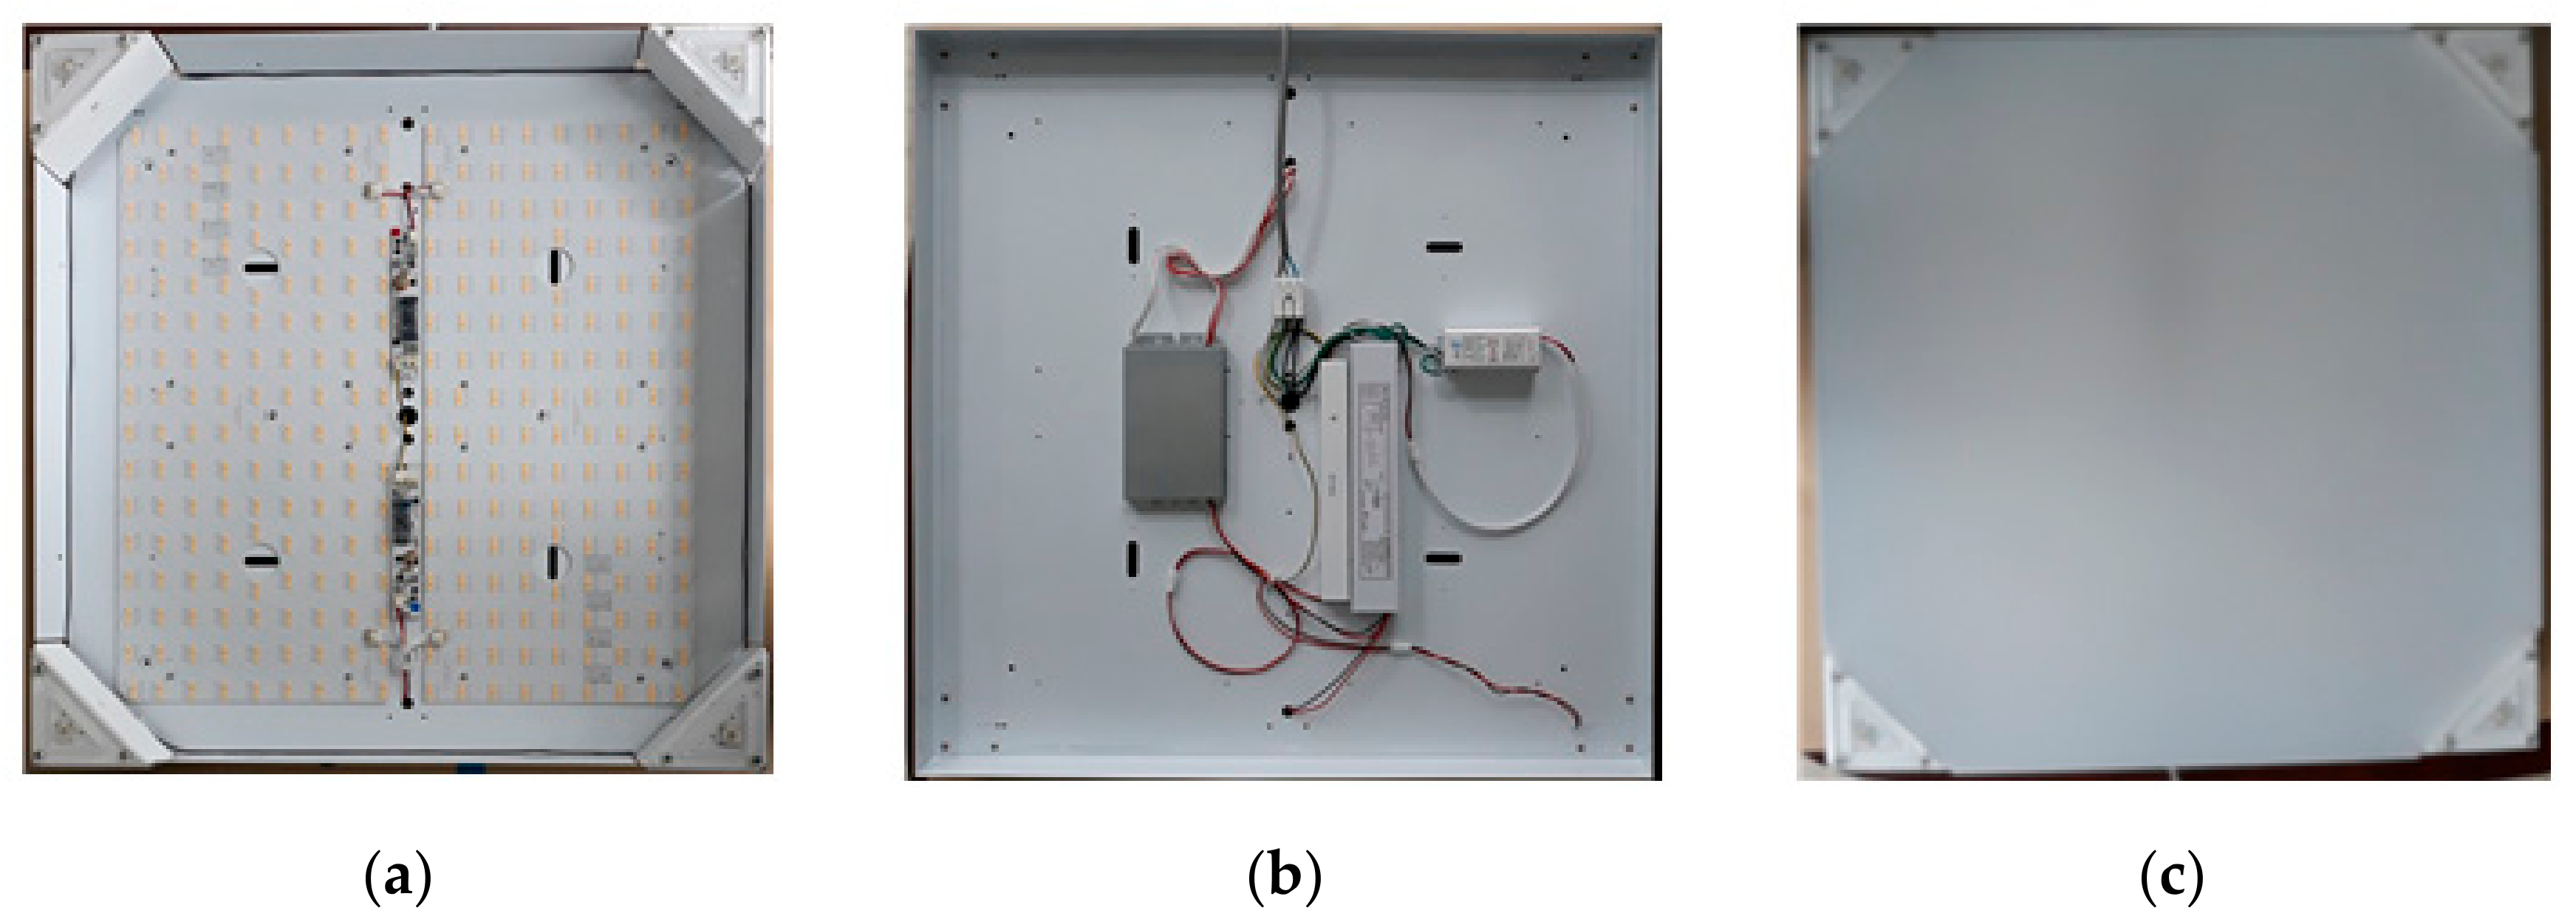
The VISIBLE-LED array in Figure 1 used four types of VISIBLE-LED light sources (2700 K, 4000 K, 5000 K, and 6500 K, Samsung LED, Korea). The UVB-LED array had a 100 mW ability using UVB-LED light sources (6060 100 mW, 1in1 Flat UVB-LED PKG, LG Innotek, Korea). To power each LED array module, 40 W and 10 W constant current AC/DC converters were used, and a drive control system and main controller were installed to control the VISIBLE-LED array. Figure 2 shows the anterior and posterior sides of the UVB-LED general lighting from Figure 1.
The center of Figure 2a shows the anterior-interior of the VISIBLE-LED modules and the corners show the UVB-LED modules; (b) shows the posterior with the AC/DC converter type 2, main controller, and 4CH controller; and (c) shows the diffuser attached to the VISIBLE-LED module and the quartz crystal allowing the UVB to penetrate. Particularly, in (c), since an ordinary diffuser or quartz crystal could not be used for the UVB wavelength, a quartz crystal that allowed 99% of the UVB wavelength was used [22]. Additionally, an 82 mA power source was used on the UVB-LED module.
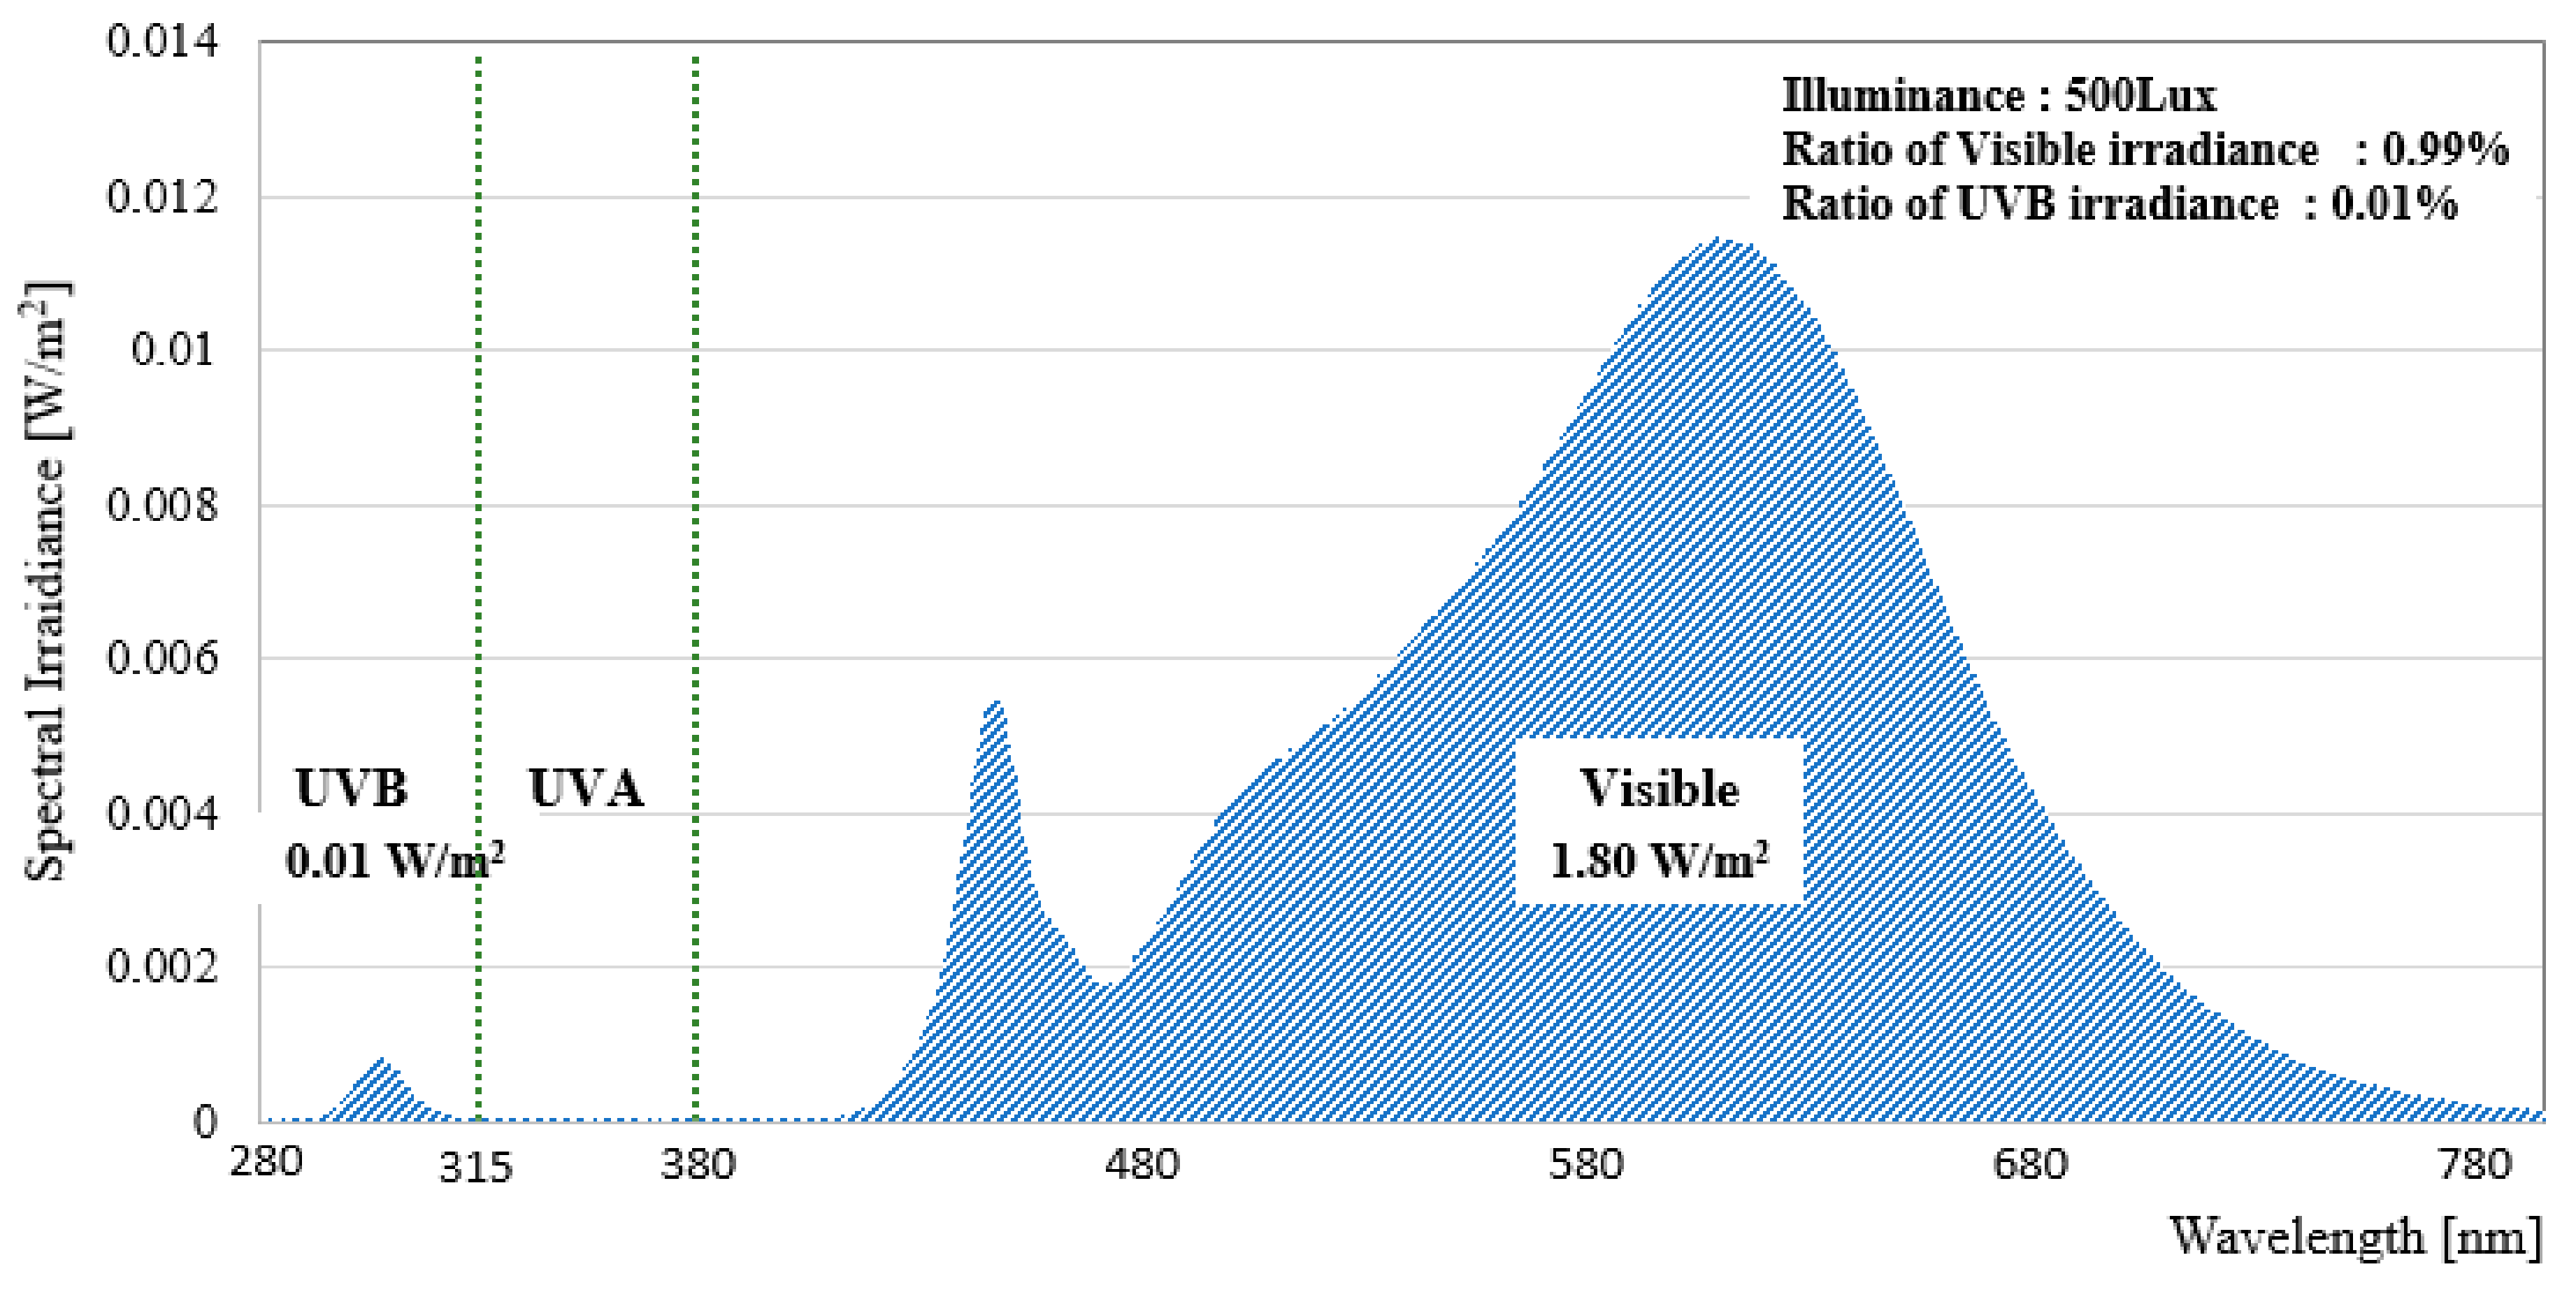
To check the properties of the proposed UVB-LED general lighting, a spectral radiometer (CAS 140CT, Instrument Systems, Germany) was used to execute the experiment in a completely closed system of a lighting cabinet. At this time, the proposed lighting was installed on the vertical top of the spectral radiometer, and the distance from the spectral radiometer was 2.4 m and 2.8 m at the average ceiling height of domestic apartments and general offices, respectively. The height of the lighting was maintained at 150 cm considering normal adults sitting on a chair. Here, the recommended lighting was installed perpendicularly above the spectral radiometer at a distance of 150 cm. Figure 3 shows the results of the photonic effectiveness of the proposed lighting.
Figure 3 shows the spectral irradiance analysis results of the proposed lighting. The illuminance was 500 lux, and each irradiance’s proportion was 99% at the visible spectrum (380–800 nm), 1% at the UVB spectrum (280–315 nm), and no significant presence for the other wavelengths including UVA was noted. In addition, the illuminance was 500 lux and the intensity of the visible spectrum was 1.80 W/m2 and UVB was 0.01 W/m2, and supported the ability to provide the indoor general lighting illuminance as well as the UVB dosage. In addition, to check the optical characteristics of the lighting irradiated to the indoor space when the proposed lighting was applied, the amounts of UVB light from the work plane, which were vertical (0 degrees), 15 degrees, 30 degrees, and 45 degrees from the bottom of the lighting, and the vertical distance from the illumination surface of about 1.5 m, were investigated. The results are shown in Table 1.
From Table 1, it was confirmed that a similar level (within ±20%) of illuminance and UVB light could be provided within 15 degrees when the proposed lighting was applied. Moreover, a photobiological safety evaluation for the UVB-LED showed an AUV (Actinic UV hazard Radiation) and NUV (Near UV hazard Radiation) within the UV light wavelength category [23]. Here, Equations (1) and (2) were used. Equation (1) calculated the AUV, and used weighting function (α), as suggested in the table of weighting functions according to the wavelength in IEC 62471 [24].
Table 2 shows the results from applying Equations (1) and (2) on the analysis data of lighting property. AUV (Actinic UV hazard radiation) at 1 mW/m2 and NUV (Near UV hazard radiation) at 1.075 mW/m2 were included in the photobiologically safe exempt category (AUV <= 0.001 W/m2, NUV <= 10 W/m2).
3. Methods: Animal Testing to Confirm Vitamin D Synthesis
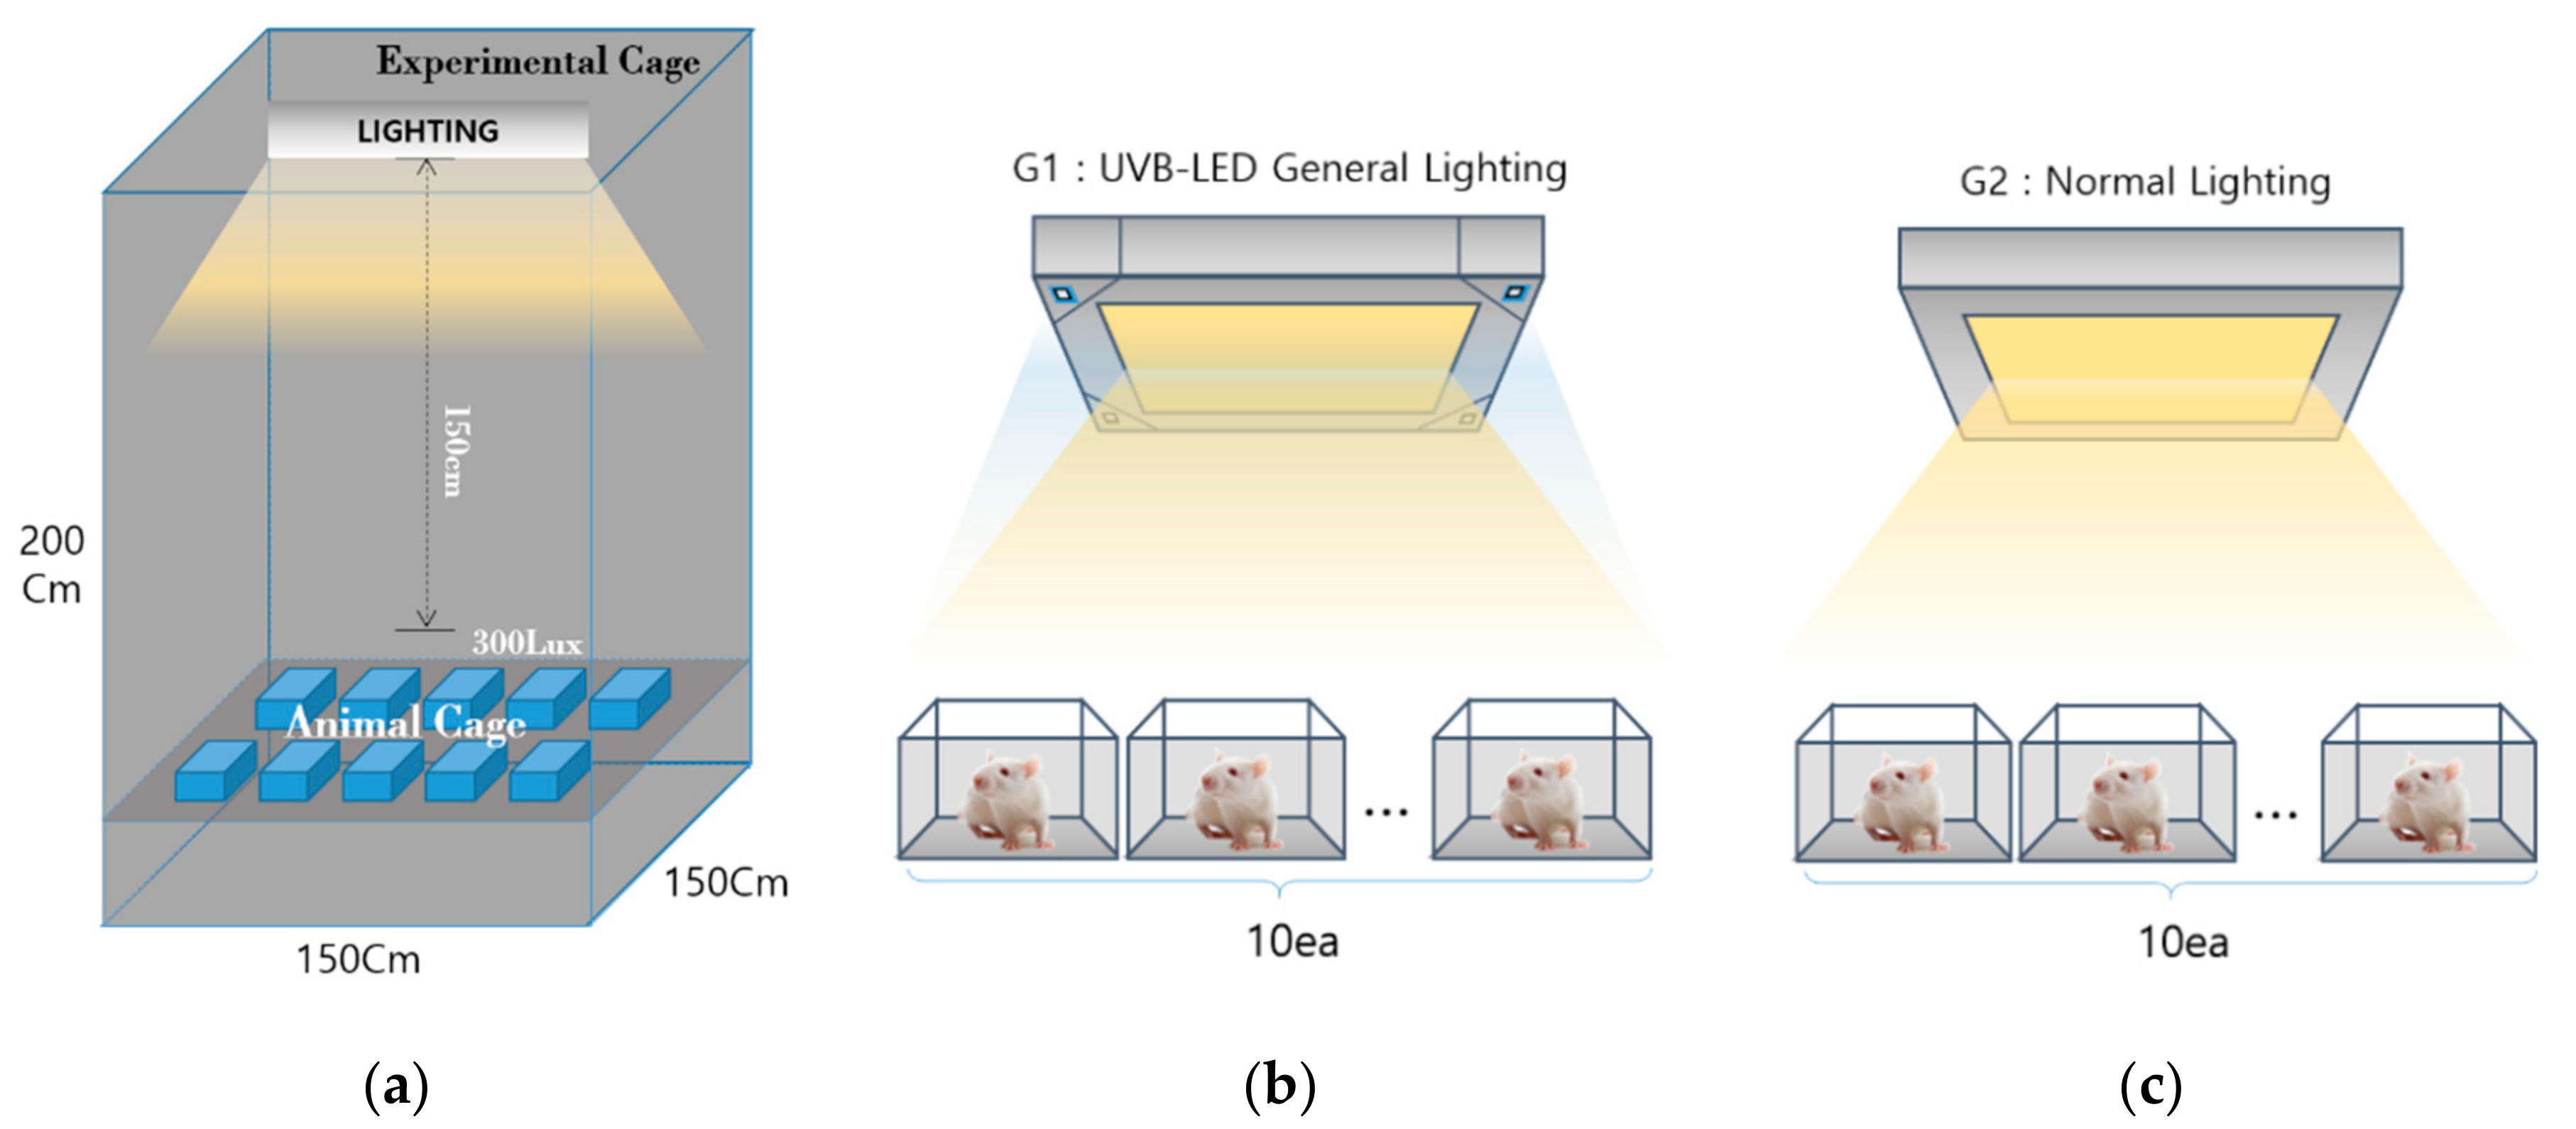
The effect of the test UVB-LED general lighting on vitamin D synthesis at a given duration of light exposure was confirmed using animal testing. The experiment was performed at the nonclinical CRO Institution (KNOTUS, Jeonbuk, Korea). All procedures were approved by the KNOTUS IACUC (Institutional Animal Care and Use Committees)’s animal testing ethics committee (KNOTUS Co. Ltd.’s animal testing ethics committee) (Approval no.: KNOTUS IACUC 18-KE389). Two cages with dimensions of 150 × 150 × 200 cm (W × D × H) were used, which were designed to completely block light from entering. One was installed with UVB-LED general lighting (supposed lighting) and the other with normal lighting installed in the interior ceiling. The cages were situated inside the test institution at a room temperature of 23 °C ± 3°C, humidity of 55% ± 15%, and ventilation per hour of 10–20 times. Figure 4 show the animal testing environment.
The animals used in this experiment are widely used for drug efficacy and toxicity testing, and a wide range of data has been collected using Wistar rats as test subjects. Of the Wistar rats, 22 SPF, 8-week-old rats were chosen [25]. To allow the rats to acclimatize to their new environment, they were introduced to the cages seven days prior to the start of the experiment. During the seven days, 20 out of the 22 rats were chosen based on their health and consistent normal behavior. The weights of these 20 rats were measured and ranked. Next, they were categorized into either the test group or the control group so that the body weight distribution was as even as possible in random order. The G1 group was the experimental group with the UVB-LED general lighting, and the G2 group was the control group with normal lighting. However, the illuminance of the lighting applied to the two groups was adjusted to be equal to 300 lux at the bottom of the cage in order to follow the recommended standard of animal experiments. In addition, considering the general lighting exposure time of modern people, the lights were turned on for the same time from 06:00 to 22:00 every day. The UVB irradiance was set, considering the fact that the indoor users were sitting on a chair and some parts of their face, shoulder, and arm were exposed to light. However, the rats used for the animal experiment stayed on the floor at a distance of 1.5 meters from the lighting; therefore, the UVB dose to the exposed part of the animal would be reduced. The reduction rate of UVB irradiance (y), according to the distance (x), was calculated by deriving Equation (3) based on the experimental case provided in the preceding research [17].
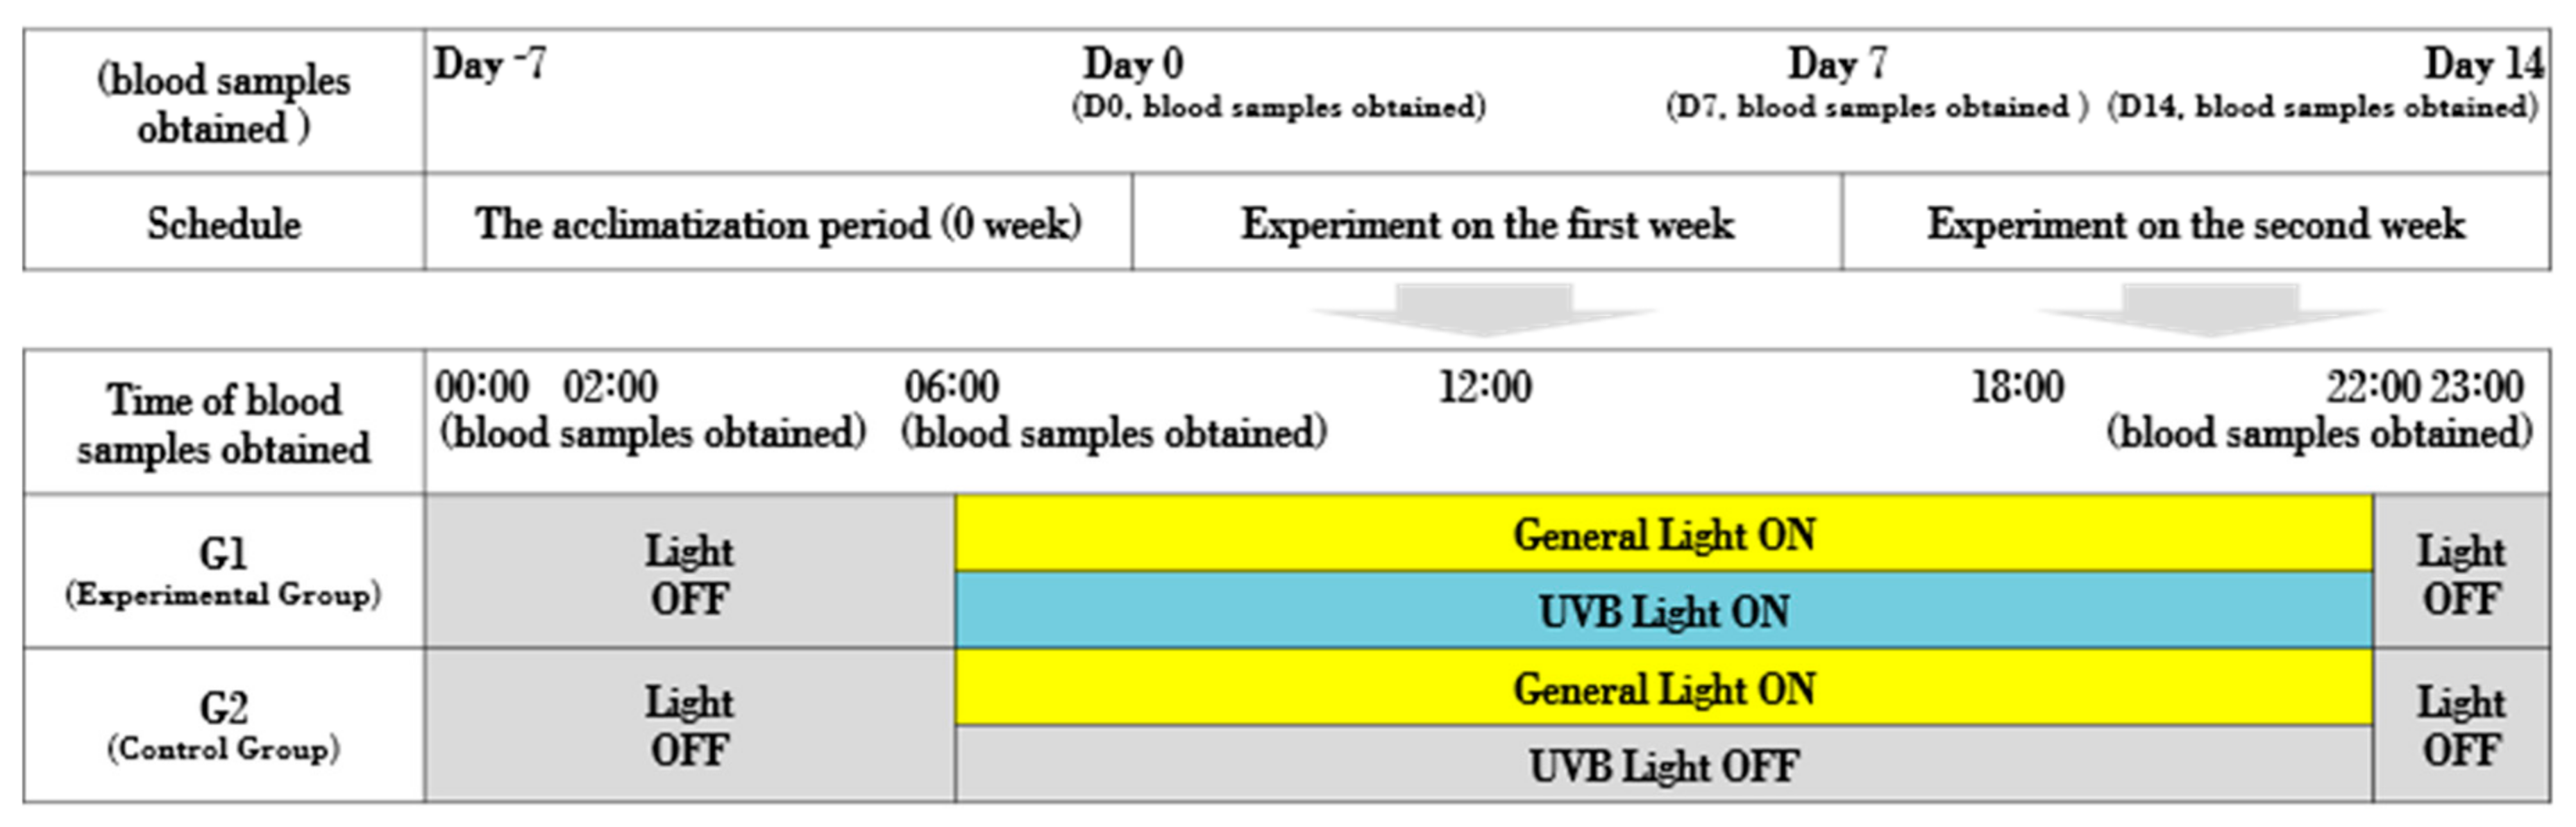
In order to supplement the shortage of UVB dose due to distance, which was calculated using Equation (3), the UVB irradiance to the animal was increased by about 1.3 times. In addition, the expected vitamin D synthesis was proportional to the exposure of the skin [26]. Therefore, we increased the intensity of UVB light by double, considering that the rat’s body was mostly covered with hair, so the skin exposure condition was set to 50% lower than that of humans. The UVB irradiance of this adjusted UVB-LED light was 26 mW/m2 and was only applied to Group G1. The experiment was carried out for a total of 21 days including seven days of acclimatization and 14 days of the main experiment. During the experiment, the optical characteristics of the lighting irradiated to each group were monitored to be the same. Figure 5 shows the entire schedule.
Figure 5 shows the lighting condition as well as the blood drawing schedule. The experiment start date, the seventh day, and the fourteenth day each had three scheduled blood draws (02:00, 06:00, and 23:00 h), and the blood vitamin D levels were analyzed.
4. Results and Analysis
Blood samples from the caudal vein were obtained to analyze the vitamin D levels in the test animals. The first blood sample measured 0.5 mL and was injected into a vacutainer tube with a clot activator. It was stored at room temperature for 15–20 min for coagulation before it was centrifuged at 3000 rpm for 10 min for separation. The separated blood was kept at a consistent −70 °C freezer before analysis. The amount of 25-hydroxyvitamin D [25(OH)D] in this serum was determined using a vitamin D assay kit (Cayman, 501050) through an enzyme-linked immunosorbent assay (ELISA). In addition, all samples were analyzed by applying the same method, according to the manual of the kit provided. The stored serum was diluted as per the analysis kit manufacturer’s instructions and then transferred to a microplate. A standard reagent curve was calculated to quantify the amount of 25(OH)D present in the serum.
The results of this experiment were analyzed using parametric multiple comparison procedures and non-parametric multiple comparison procedures under the assumption of normality. If the one-way analysis of variance (ANOVA) results were significant, Cunnett’s multiple comparison test was used to compare the before and after values. If the Kruskal–Wallis’ H-test analysis results were significant, Dunn’s multiple comparison test was used. Prism 5.03 (GraphPad Software Inc., San Diego, CA, USA) was used for statistical analysis. A p-value less than 0.05 was determined to be statistically significant. Table 3, Table 4 and Table 5 each show the rat serum 25(OH)D analysis at D0 (start date), D7 (7th day), and D14 (14th day).
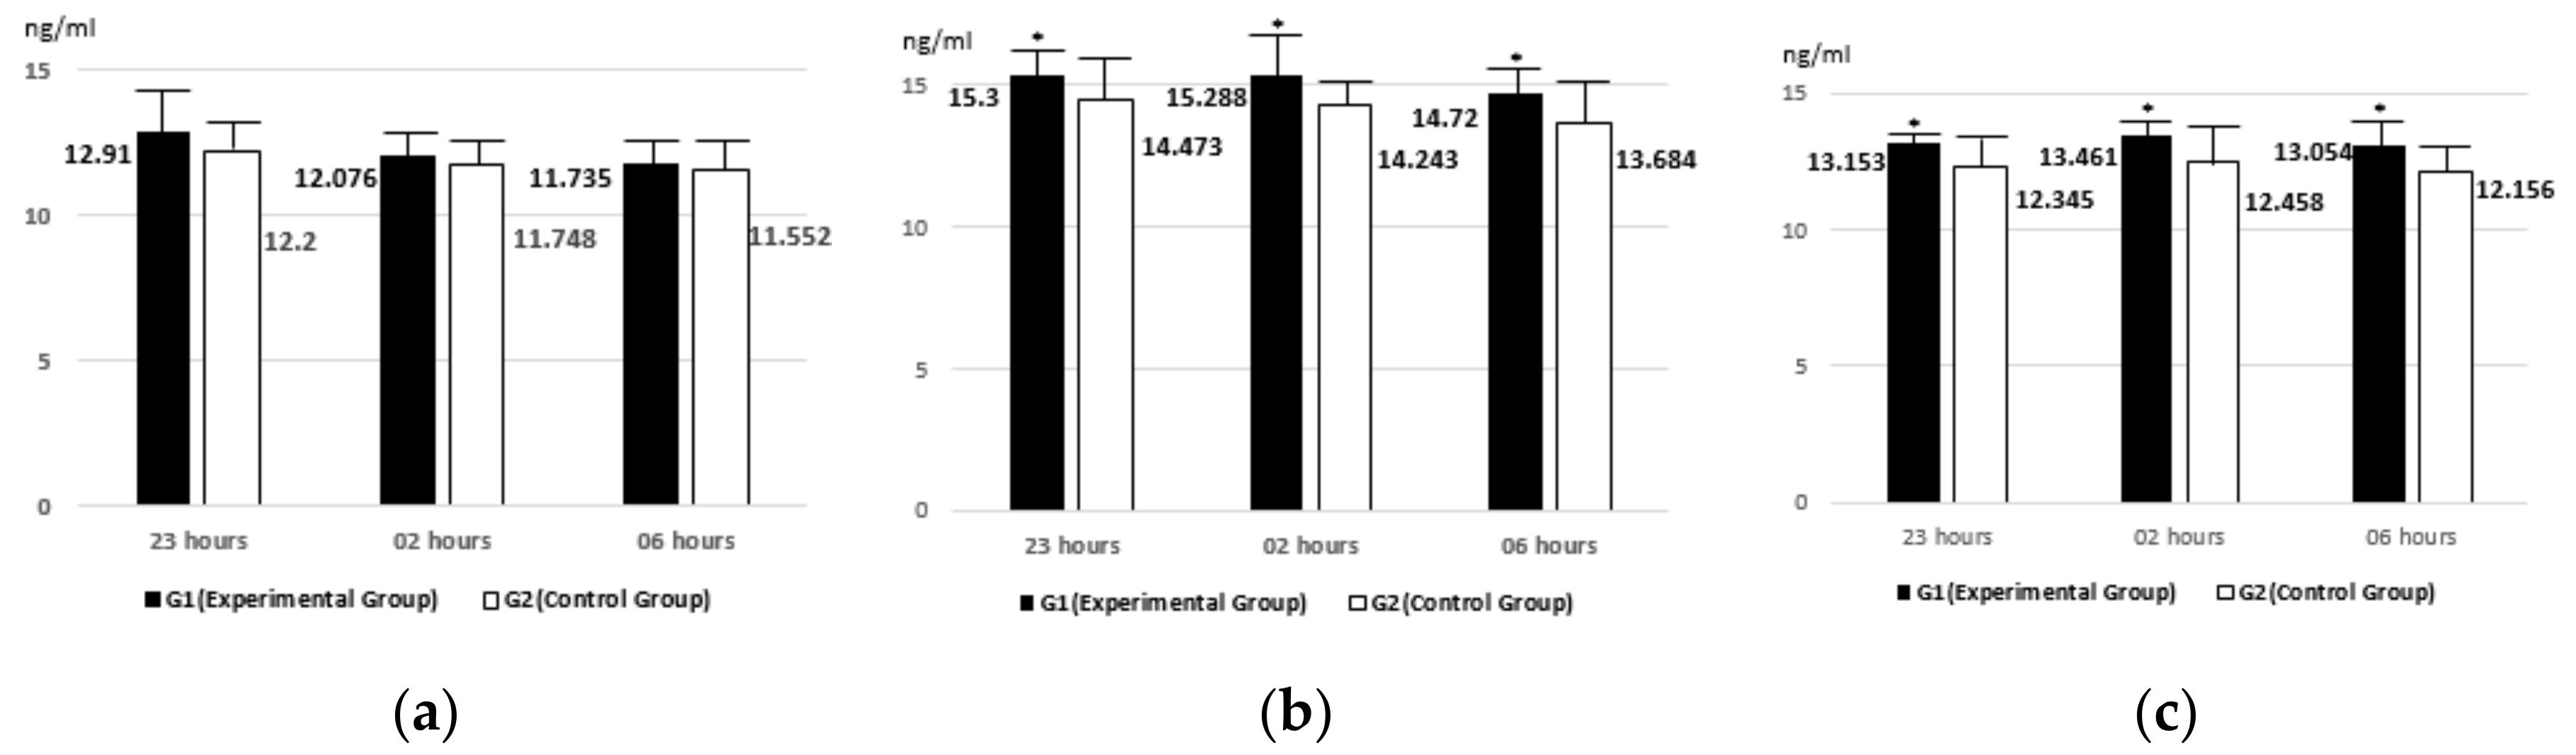
The pre-experiment (D0) 25(OH)D level analysis as shown in Table 3 showed that G1 (test group) and G2 (control group) had 12.17 ng/mL and 11.85 ng/mL, respectively. The 25(OH)D level was higher in the G1 group despite being in an identical lighting environment for the acclimatization period (one week). However, the difference was insignificant at 0.32 ng/mL. In Table 4, the analysis from the seventh day showed that G1 (test) group had a 25(OH)D level of 15.10 ng/mL and G2 (control) group had a level of 14.13 ng/mL with an increase of 6.8% (0.97 ng/mL) in the rats exposed to the test lighting. Additionally, the fourteenth day analysis results in Table 5 showed that the G1 group had 13.22 ng/mL and the G2 group had 12.32 ng/mL, with the G1 group showing 7.3% (0.9 ng/mL) higher vitamin D levels. In addition, the results showing the change in the 25(OH)D content of each animal at the time of blood collection are shown in Table 6 and visualized as shown in Figure 6.
The 25(OH)D changes in the blood samples obtained from each animal at the designated time intervals are shown in Figure 6.
Figure 6a shows the 25(OH)D content of the experimental and control groups at 23:00, 2:00, and 6:00 h at differences of 0.71, 0.328, and 0.183 ng/mL, respectively. However, the results of Day 7 showed 0.827 ng/mL at 23:00 h, 1.045 ng/mL at 2:00 h, and 1.036 ng/mL at 6:00 h, resulting in a larger difference than that on the start date. Moreover, the results on Day 14 showed differences of 0.808 ng/mL at 23:00 h, 1.003 ng/mL at 2:00 h, and 0.898 ng/mL at 6:00 h. From these results, we confirmed that the test group (G1) had a higher 25(OH)D synthesis than the control group (G2) when kept under the test lighting. It was found that UVB-LED general light, which safely provides UVB light indoors, could increase the amount of vitamin D synthesis in an animal’s body.
5. Conclusions and Future Research
This study recommends UVB-LED general lighting for indoor dwellers to support vitamin D synthesis. To confirm the efficacy of this recommendation, rats were used for the experimental tests. UVB-LED general lighting with 500 lux and over illuminance and safe UVB light radiation levels were developed. This UVB-LED light was installed with a power converter, drive control panel, and main controller to adjust the visible ray. The UVB-LED module was controlled by a 10 W constant current type AC/DC converter where the power could be adjusted between 82 and 108 mA. Furthermore, 100 mW UVB-LED light bulbs (L company) were installed in each of the four corners of the apparatus. A quartz crystal with the ability to penetrate 99% of UVB wavelength was used as a cover. Next, the UVB-LED lighting module was equipped with UVB-LED general lighting with up to 82 mA of power. The safety of the UV light source was checked against the photobiological safety standard (IEC62471), and it was shown to be within the safest exempt level (AUV <= 0.001 W/m2, NUV <= 10 W/m2). Animal testing to confirm the difference between the UVB-LED general lighting (proposed lighting) and normal lighting was performed. The rat was chosen as an appropriate test subject and a test light-proofed apparatus was prepared. The proposed lighting was investigated in the G1 (experimental) and normal lighting in the G2 (control) groups, and each group consisted of 10 rats. The illuminance of the bottom of the cage was maintained at 300 lux and was provided with a 7-day acclimatization period. The experiment was performed for 14 days after the above-mentioned step. At 23:00, 02:00, and 06:00 h, 0.5 mL of blood samples were obtained from the caudal vein on both the 7th and 14th days. The blood samples were then separated through centrifugation and a vitamin D analysis kit (Cayman, 501050) was used. The analysis results showed that both the G1 and G2 groups had an insignificant difference of 0.32 on the first day. However, on the seventh day, the G1 group showed 25(OH)D levels at 15.10, and was 6.8% (0.97 ng/mL) higher than that of G2. Additionally, on the fourteenth day, the G1 group showed a 25(OH)D content of 13.22, which was 7.3% (0.9 ng/mL) higher than that of the G2 group. On the basis of the comparison analysis by time interval, Days 7 and 14 both showed that the G1 group had higher 25(OH)D levels. Through the present study, it was confirmed that UVB-LED general light, which can safely provide UVB light indoors, could increase the amount of vitamin D synthesis in an animal’s body.
In the future, research on a lighting control method that provides different amounts of UV light over time for optimal lighting services will be conducted. Furthermore additional animal experiments will be carried out to confirm the effectiveness of the proposed lighting. Various analysis methods (KIT) and experimental environments will be applied in the additional animal experiments. In addition, clinical studies that keep test subjects inside for a determined amount of time in light-proofed experimental setups are required to further prove the efficacy of vitamin D synthesis. Furthermore, an investigation into light systems that closely imitate not only UVB light characteristics, but also the hourly color–temperature and wavelength of natural light is planned.
Author Contributions
Writing of the original draft, S.-T.O. Conceptualization and supervision, J.-H.L. All authors have read and agreed to the published version of the manuscript.
Funding
This work was supported by the National Research Foundation of Korea (NRF) grant funded by the Korean Government (MSIP) (No. 2017R1A2B2005601). This work was supported by the Priority Research Centers Program through the National Research Foundation of Korea (NRF) funded by the Ministry of Education (2019R1A6A1A03032988).
Conflicts of Interest
The authors declare no conflicts of interest.
References
- Ministry of Health and Welfare. Korean Health Statistics 2015: Korea National Health and Nutrition Examination Survey VI (KNHANES); Ministry of Health and Welfare: Sejong, Korea, 2014.
- Rass, K.; Reichrath, J. UV damage and DNA repair in malignant melanoma and nonmelanoma skin cancer. In Sunlight, Vitamin D and Skin Cancer; Springer: New York, NY, USA, 2008; pp. 162–178. [Google Scholar]
- McKenzie, R.L.; Björn, L.O.; Bais, A.; Ilyasd, M. Changes in biologically active ultraviolet radiation reaching the Earth’s surface. Photochem. Photobiol. Sci. 2003, 2, 5–15. [Google Scholar] [CrossRef] [PubMed] [Green Version]
- Wu, J.; Liu, B.; Ren, Z.; Ni, M.; Li, C.; Gong, Y.; Qin, W.; Huang, Y.; Sun, C.Q.; Liu, X. CuS/RGO hybrid photocatalyst for full solar spectrum photoreduction from UV/Vis to Near-Infrared light. J. Colloid Interface Sci. 2017, 517, 80–85. [Google Scholar] [CrossRef] [PubMed]
- Biniek, K.; Levi, K.; Dauskardt, R.H. Solar UV radiation reduces the barrier function of human skin. Proc. Natl. Acad. Sci. USA 2012, 109, 17111–17116. [Google Scholar] [CrossRef] [PubMed] [Green Version]
- Cho, H.K.; Kwon, H.J.; Choi, C.Y. Increase of the Surface Erythemal Ultraviolet-B Radiation by the Ozone Layer Depletion. Asia Pac. J. Atmos. Sci. 1998, 34, 272–281. [Google Scholar]
- Scragg, R.; Rahman, J.; Thornley, S. Association of sun and UV exposure with blood pressure and cardiovascular disease: A systematic review. J. Steroid Biochem. Mol. Boil. 2019, 187, 68–75. [Google Scholar] [CrossRef] [PubMed]
- Engelsen, O. The Relationship between Ultraviolet Radiation Exposure and Vitamin D Status. Nutrients 2010, 2, 482–495. [Google Scholar] [CrossRef] [PubMed] [Green Version]
- Shin, M.-Y.; Kwun, I.-S. Vitamin D: Hormone-like nutrient. J. Nutr. Health 2016, 49, 1. [Google Scholar] [CrossRef]
- Anglin, R.E.S.; Samaan, Z.; Walter, S.D.; McDonald, S.D. Vitamin D deficiency and depression in adults: Systematic review and meta-analysis. Br. J. Psychiatry 2013, 202, 100–107. [Google Scholar] [CrossRef] [PubMed]
- Chung, H.Y. Osteoporosis Diagnosis and Treatment 2007. J. Korean Endocr. Soc. 2008, 23, 76. [Google Scholar] [CrossRef]
- Brustad, M.; Edvardsen, K.; Wilsgaard, T.; Engelsen, O.; Aksnes, L.; Lund, E. Seasonality of UV-radiation and vitamin D status at 69 degrees north. Photochem. Photobiol. Sci. 2007, 6, 903. [Google Scholar] [CrossRef] [PubMed]
- Park, D.-H.; Oh, S.-T.; Lim, J.-H. Development of a UV Index Sensor-Based Portable Measurement Device with the EUVB Ratio of Natural Light. Sensors 2019, 19, 754. [Google Scholar] [CrossRef] [PubMed] [Green Version]
- UV Radiation Monitoring: UV Index and UV Dose. Available online: http://www.temis.nl/uvradiation/info/uvindex.html (accessed on 24 December 2018).
- Korea Meteorological Administration. Available online: https://www.weather.go.kr/weather/lifenindustry/life_jisu.jsp (accessed on 17 January 2020).
- Serrano, M.-A.; Cañada, J.; Moreno, J.C.; Gurrea, G. Solar ultraviolet doses and vitamin D in a northern mid-latitude. Sci. Total. Environ. 2017, 574, 744–750. [Google Scholar] [CrossRef] [PubMed]
- Oh, S.-T.; Park, D.-H.; Lim, J.-H. Designing Safe General LED Lighting that Provides the UVB Benefits of Sunlight. Appl. Sci. 2019, 9, 826. [Google Scholar] [CrossRef] [Green Version]
- Holick, M.F.; Binkley, N.C.; Bischoff-Ferrari, H.A.; Gordon, C.M.; Hanley, D.A.; Heaney, R.P.; Murad, M.H.; Weaver, C.M. Evaluation, Treatment, and Prevention of Vitamin D Deficiency: An Endocrine Society Clinical Practice Guideline. J. Clin. Endocrinol. Metab. 2011, 96, 1911–1930. [Google Scholar] [CrossRef] [PubMed] [Green Version]
- Cheng, Y.K.; Cheng, K.W.E. General Study for using LED to replace traditional lighting devices. In Proceedings of the 2nd International Conference on Power Electronics Systems and Applications, IEEE, Hong Kong, China, 12–14 November 2006; pp. 173–177. [Google Scholar] [CrossRef] [Green Version]
- Schmidt, D.A.; Mulkerin, D.; Boehm, D.R.; Ellersieck, M.R.; Lu, Z.; Campbell, M.; Chen, T.C.; Holick, M.F. Quantifying the vitamin D3 synthesizing potential of UVB lamps at specific distances over time. Zoo Boil. 2010, 29, 741–752. [Google Scholar] [CrossRef] [PubMed]
- Webb, A.R.; Kift, R.; Berry, J.L.; Rhodes, L.E. The Vitamin D Debate: Translating Controlled Experiments into Reality for Human Sun Exposure Times. Photochem. Photobiol. 2011, 87, 741–745. [Google Scholar] [CrossRef] [PubMed]
- Maeng, J.; Yoon, K.; Choi, S.; Kim, H. The Effect of Sintering Temperature on the Synthesis of Quartz glass by Fumed Silica Sintering. J. Korean Powder Met. Inst. 2013, 20, 134–137. [Google Scholar] [CrossRef]
- International Electrotechnical Commission. Photobiological Safety of Lamps and Lamp Systems; IEC: Geneva, Switzerland, 2006. [Google Scholar]
- Hong, Y.P. A Study on the Evaluation Criteria of Photobiological Safety for LED Applications. Master’s Thesis, Gyeongsang National University, Jinju, Korea, 2017. [Google Scholar]
- Park, J.-Y.; Kim, J.-Y.; Jang, S.-H.; Kim, H.-J.; Lee, S.-J.; Park, S.-C. Biological activities and acute oral toxicity of citronella and lemongrass oil. Korean J. Veter. Res. 2015, 55, 13–20. [Google Scholar] [CrossRef] [Green Version]
- Godar, D.E.; Pope, S.J.; Grant, W.B.; Holick, M.F. Solar UV Doses of Young Americans and Vitamin D3 Production. Environ. Health Perspect. 2011, 120, 139–143. [Google Scholar] [CrossRef] [PubMed] [Green Version]
Figure 1.
UVB-LED general lighting design.

Figure 2.
UVB-LED General Lighting. (a) Anterior-interior. (b) Posterior-converter and drive control system. (c) Anterior-diffuser applied.
Figure 2.
UVB-LED General Lighting. (a) Anterior-interior. (b) Posterior-converter and drive control system. (c) Anterior-diffuser applied.

Figure 3.
Spectral irradiance and light properties of UVB-LED general lighting.

Figure 4.
Animal testing environment. (a) Cages for animal testing. (b) Test group G1: UVB-LED general lighting. (c) Test group G2: normal lighting.
Figure 4.
Animal testing environment. (a) Cages for animal testing. (b) Test group G1: UVB-LED general lighting. (c) Test group G2: normal lighting.

Figure 5.
Animal experiment schedule.

Figure 6.
25(OH)D content progress by designated times. (a) Day 0; (b) Day 7; (c) Day 14.


Table 1.
Experiment to check the uniformity of lighting.
| Unit | Vertical Angle/Horizontal Distance from Lighting | ||||
|---|---|---|---|---|---|
| 0°/0 cm | 15°/40 cm | 30°/80 cm | 45°/150 cm | ||
| Illuminance | lux | 521 | 466 | 289 | 122 |
| UVB irradiance | W/m2 | 0.013 | 0.011 | 0.007 | 0.003 |
Table 2.
IEC 62471, UV light spectrum toxicity category and results.
| Toxicity Category | Unit | Results | IEC 62471 Category | ||
|---|---|---|---|---|---|
| Exempt | Risk Group 1 | Risk Group 2 | |||
| Actinic UV hazard Radiation (AUV) | W/m2 | 0.001 | 0.001 | 0.003 | 0.03 |
| Near UV hazard Radiation (NUV) | W/m2 | 1.075 | 10 | 33 | 100 |
Table 3.
Test animal serum 25(OH)D analysis results (D0, unit: ng/mL).
| D0 | 23 Hours | 2 Hours | 6 Hours | Average | ||||
|---|---|---|---|---|---|---|---|---|
| G1 | G2 | G1 | G2 | G1 | G2 | G1 | G2 | |
| 1 | 12.91 | 12.20 | 12.55 | 12.50 | 11.92 | 10.72 | 12.46 | 11.81 |
| 2 | 12.808 | 12.013 | 11.124 | 13.183 | 10.917 | 13.634 | 11.62 | 12.94 |
| 3 | 13.634 | 12.156 | 12.966 | 11.919 | 12.400 | 11.379 | 13.00 | 11.82 |
| 4 | 14.679 | 11.780 | 13.074 | 11.599 | 12.808 | 11.466 | 13.52 | 11.62 |
| 5 | 10.484 | 14.466 | 12.301 | 10.877 | 11.423 | 11.293 | 11.40 | 12.21 |
| 6 | 12.53 | 11.82 | 11.78 | 11.74 | 11.45 | 10.28 | 11.92 | 11.28 |
| 7 | 12.719 | 12.037 | 10.450 | 12.624 | 10.484 | 13.363 | 11.22 | 12.67 |
| 8 | 12.912 | 13.698 | 12.258 | 11.453 | 12.258 | 11.179 | 12.48 | 12.11 |
| 9 | 14.235 | 11.493 | 12.393 | 11.064 | 12.624 | 11.374 | 13.08 | 11.31 |
| 10 | 9.983 | 10.951 | 11.865 | 10.519 | 11.064 | 10.841 | 10.97 | 10.77 |
| Mean | 12.690 | 12.262 | 12.076 | 11.748 | 11.735 | 11.552 | 12.17 | 11.85 |
| S.D. | 1.474 | 1.042 | 0.808 | 0.835 | 0.785 | 1.091 | 1.02 | 0.99 |
Table 4.
Test animal serum 25(OH)D analysis results (D7, unit: ng/mL).
| D7 | 23 Hours | 2 Hours | 6 Hours | Average | ||||
|---|---|---|---|---|---|---|---|---|
| G1 | G2 | G1 | G1 | G1 | G2 | G1 | G2 | |
| 1 | 15.49 | 14.46 | 14.57 | 13.96 | 15.49 | 13.59 | 15.18 | 14.00 |
| 2 | 15.252 | 16.976 | 17.186 | 14.199 | 14.357 | 15.857 | 15.60 | 15.68 |
| 3 | 14.794 | 14.357 | 15.689 | 14.043 | 14.794 | 13.992 | 15.09 | 14.13 |
| 4 | 16.567 | 13.890 | 15.135 | 15.429 | 15.489 | 13.397 | 15.73 | 14.24 |
| 5 | 15.857 | 14.095 | 16.161 | 14.357 | 14.411 | 12.619 | 15.48 | 13.69 |
| 6 | 14.81 | 13.66 | 14.02 | 14.41 | 15.39 | 13.09 | 14.74 | 13.72 |
| 7 | 14.961 | 16.359 | 16.726 | 13.793 | 13.978 | 15.857 | 15.22 | 15.34 |
| 8 | 14.214 | 13.839 | 13.136 | 13.480 | 14.310 | 13.992 | 13.89 | 13.77 |
| 9 | 15.947 | 13.393 | 14.756 | 14.961 | 14.961 | 13.397 | 15.22 | 13.92 |
| 10 | 15.118 | 13.703 | 15.488 | 13.793 | 14.024 | 12.619 | 14.88 | 13.37 |
| Mean | 15.300 | 14.473 | 15.288 | 14.243 | 14.720 | 13.684 | 15.10 | 14.13 |
| S.D. | 0.683 | 1.208 | 1.233 | 0.584 | 0.589 | 1.161 | 0.84 | 0.98 |
Table 5.
Test animal serum 25(OH)D analysis results (D14, unit: ng/mL).
| D14 | 23 Hours | 2 Hours | 6 Hours | Average | ||||
|---|---|---|---|---|---|---|---|---|
| G1 | G2 | G1 | G2 | G1 | G2 | G1 | G2 | |
| 1 | 13.25 | 13.05 | 13.71 | 14.14 | 14.42 | 12.22 | 13.79 | 13.14 |
| 2 | 12.861 | 12.359 | 13.655 | 13.359 | 13.760 | 13.449 | 13.43 | 13.06 |
| 3 | 13.551 | 12.813 | 13.449 | 12.535 | 12.838 | 11.592 | 13.28 | 12.31 |
| 4 | 13.399 | 12.400 | 12.445 | 12.355 | 13.551 | 12.050 | 13.13 | 12.27 |
| 5 | 13.004 | 10.972 | 14.027 | 10.716 | 12.267 | 13.150 | 13.10 | 11.61 |
| 6 | 12.83 | 12.71 | 13.55 | 13.41 | 13.74 | 11.79 | 13.37 | 12.64 |
| 7 | 12.749 | 13.938 | 13.142 | 13.696 | 13.009 | 12.878 | 12.97 | 13.50 |
| 8 | 13.554 | 12.215 | 13.053 | 11.828 | 12.041 | 11.007 | 12.88 | 11.68 |
| 9 | 13.368 | 12.375 | 13.980 | 12.295 | 13.053 | 11.282 | 13.47 | 11.98 |
| 10 | 12.965 | 10.614 | 13.601 | 10.242 | 11.865 | 12.136 | 12.81 | 11.00 |
| Mean | 13.153 | 12.345 | 13.461 | 12.458 | 13.054 | 12.156 | 13.22 | 12.32 |
| S.D. | 0.306 | 0.960 | 0.473 | 1.268 | 0.829 | 0.798 | 0.54 | 1.01 |
Table 6.
Summary of animal experiments (unit: ng/mL).
| 0 Day | 7 Days | 14 Days | |||||||
|---|---|---|---|---|---|---|---|---|---|
| 23 Hours | 2 Hours | 6 Hours | 23 Hours | 2 Hours | 6 Hours | 23 Hours | 2 Hours | 6 Hours | |
| G1 | 12.69 ± 1.47 | 12.07 ± 0.80 | 11.73 ± 0.78 | 15.30 ± 0.68* | 15.28 ± 1.23* | 14.72 ± 0.58* | 13.15 ± 0.30* | 13.46 ± 0.47* | 13.05 ± 0.82* |
| G2 | 12.26 ± 1.04 | 11.74 ± 0.83 | 11.55 ± 1.09 | 14.47 ± 1.20 | 14.24 ± 0.58 | 13.68 ± 1.16 | 12.34 ± 0.96 | 12.45 ± 1.26 | 12.15 ± 0.79 |
Data are expressed as Mean ± S.D. * A significant difference at the p < 0.05 level compared to G2 (normal light).
© 2020 by the authors. Licensee MDPI, Basel, Switzerland. This article is an open access article distributed under the terms and conditions of the Creative Commons Attribution (CC BY) license (http://creativecommons.org/licenses/by/4.0/).
Share and Cite
MDPI and ACS Style
Oh, S.-T.; Lim, J.-H. Development and Effect Analysis of UVB-LED General Lighting to Support Vitamin D Synthesis. Appl. Sci. 2020, 10, 889. https://doi.org/10.3390/app10030889
AMA Style
Oh S-T, Lim J-H. Development and Effect Analysis of UVB-LED General Lighting to Support Vitamin D Synthesis. Applied Sciences. 2020; 10(3):889. https://doi.org/10.3390/app10030889
Chicago/Turabian StyleOh, Seung-Taek, and Jae-Hyun Lim. 2020. "Development and Effect Analysis of UVB-LED General Lighting to Support Vitamin D Synthesis" Applied Sciences 10, no. 3: 889. https://doi.org/10.3390/app10030889
Note that from the first issue of 2016, this journal uses article numbers instead of page numbers. See further details here.